
Design of Grid-Connected Solar PV Power Plant in Riyadh Using PVsyst


Abstract
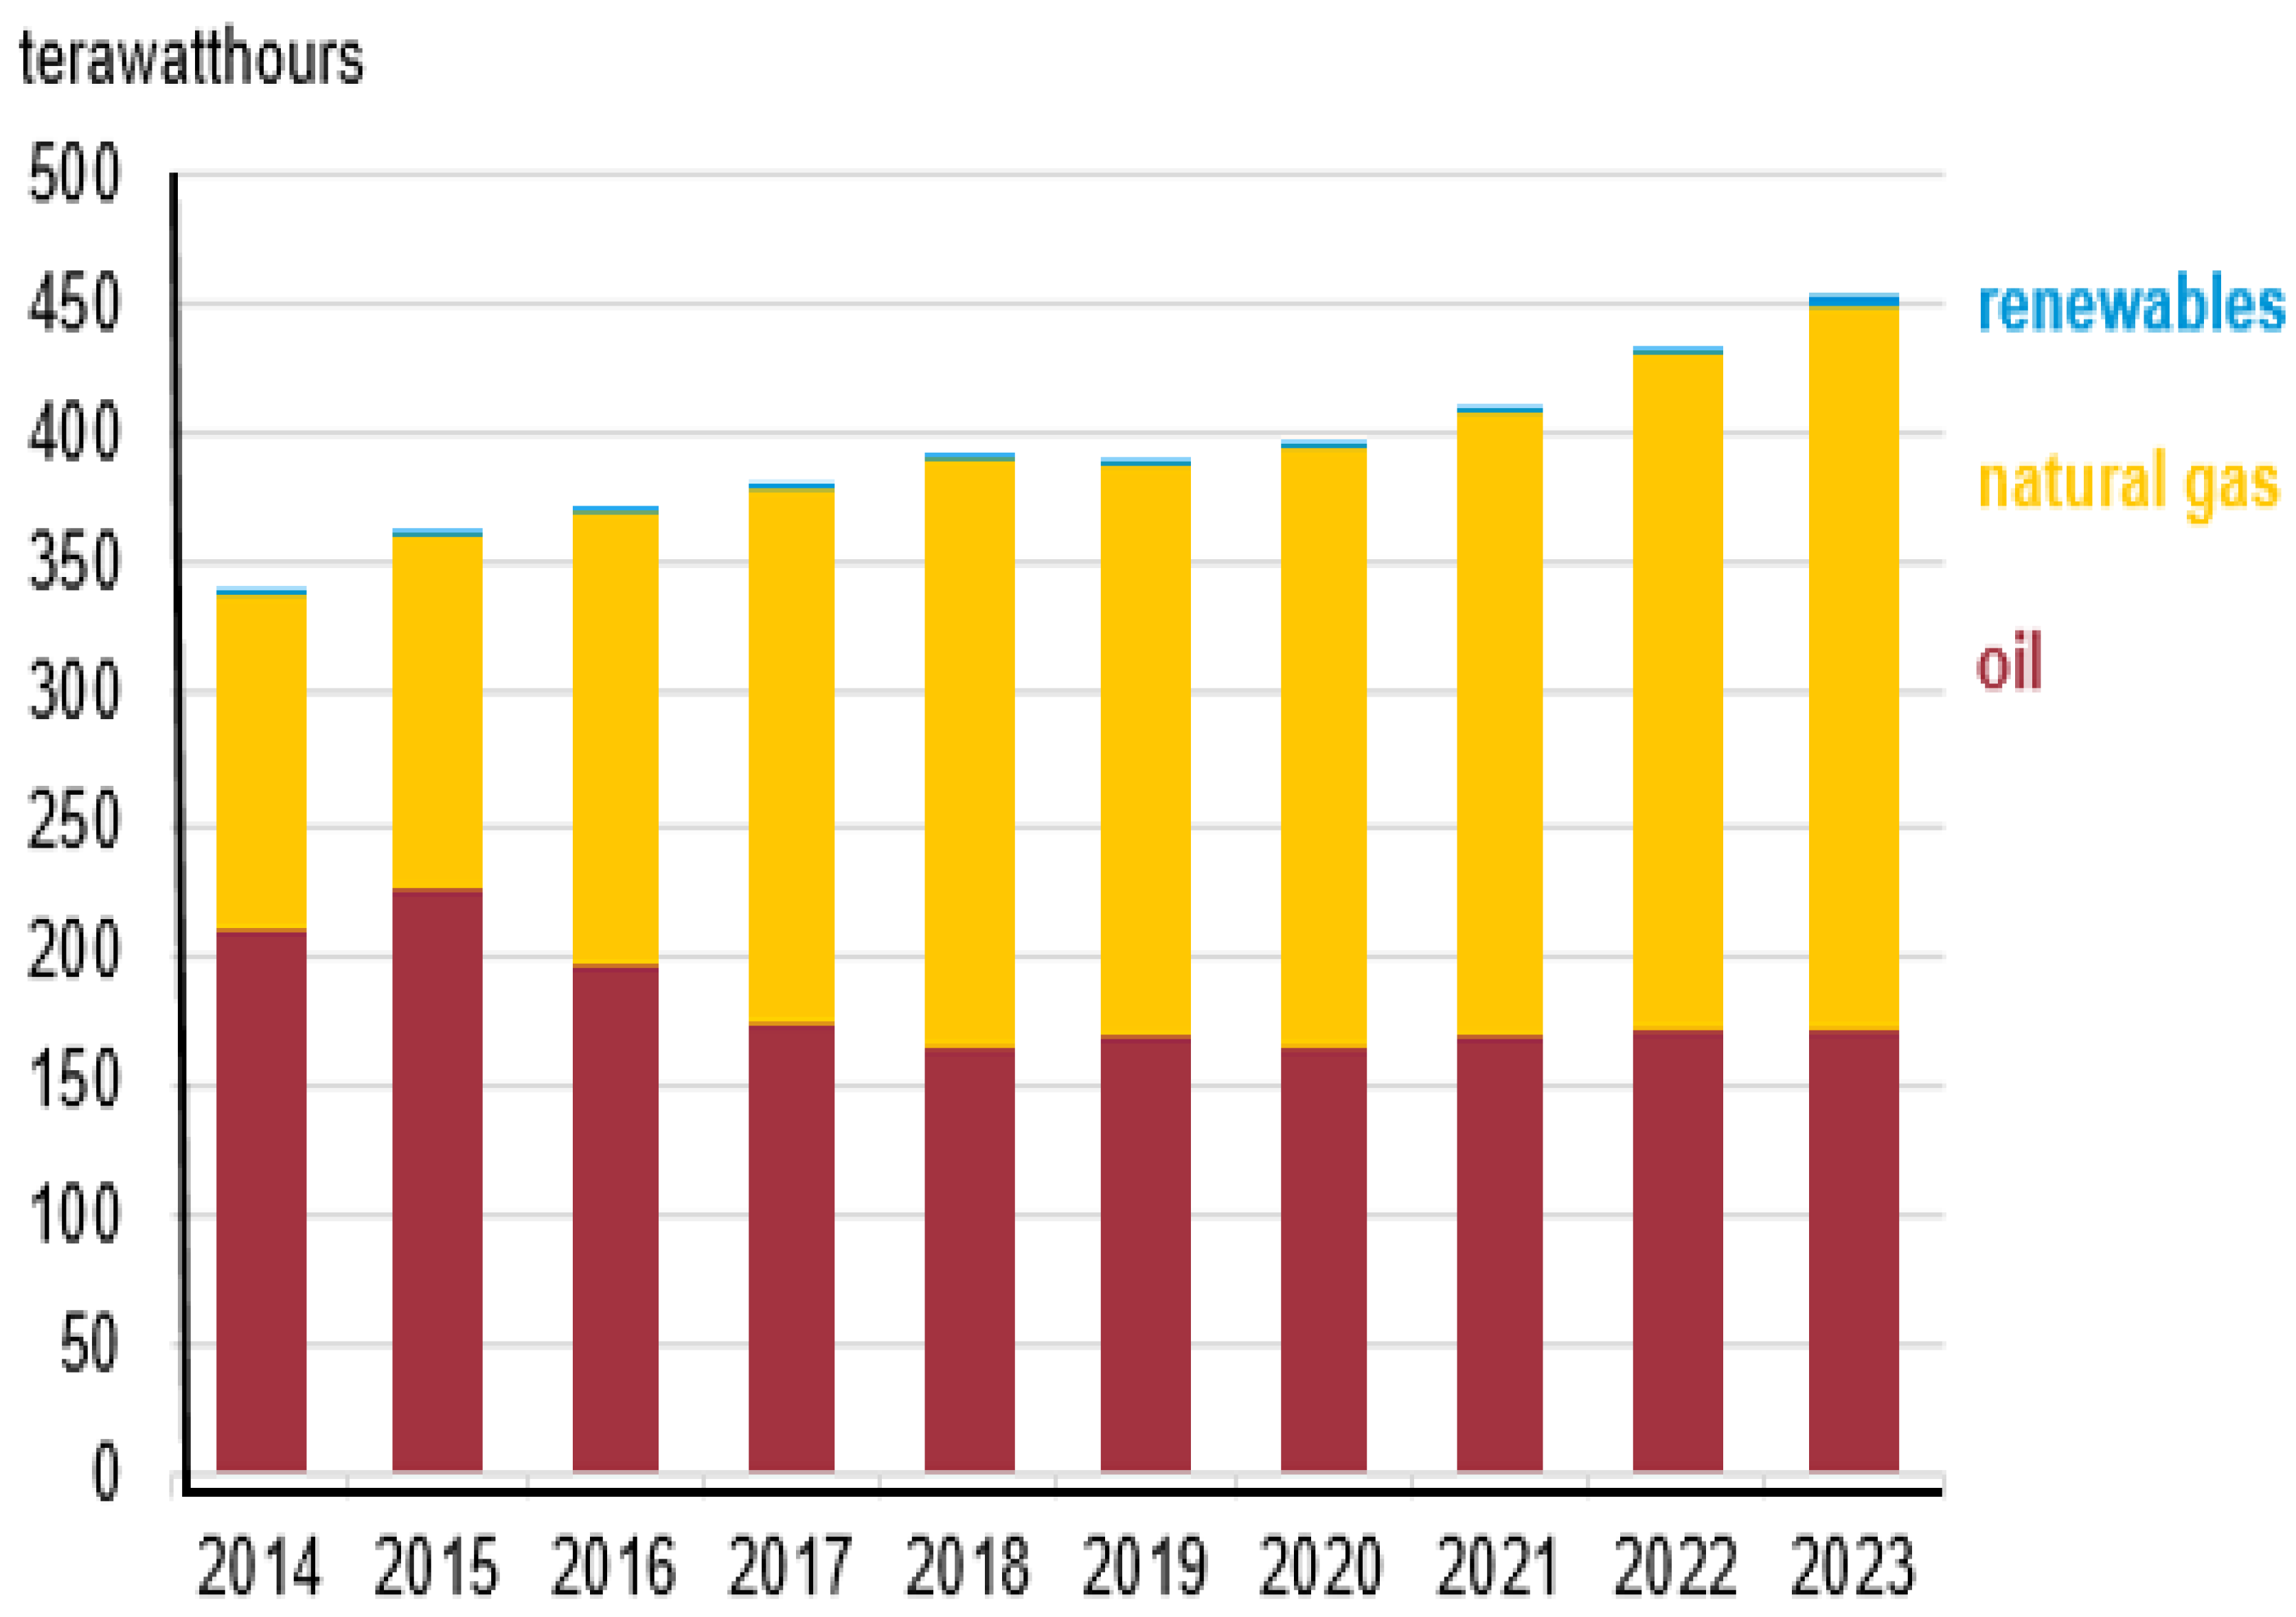
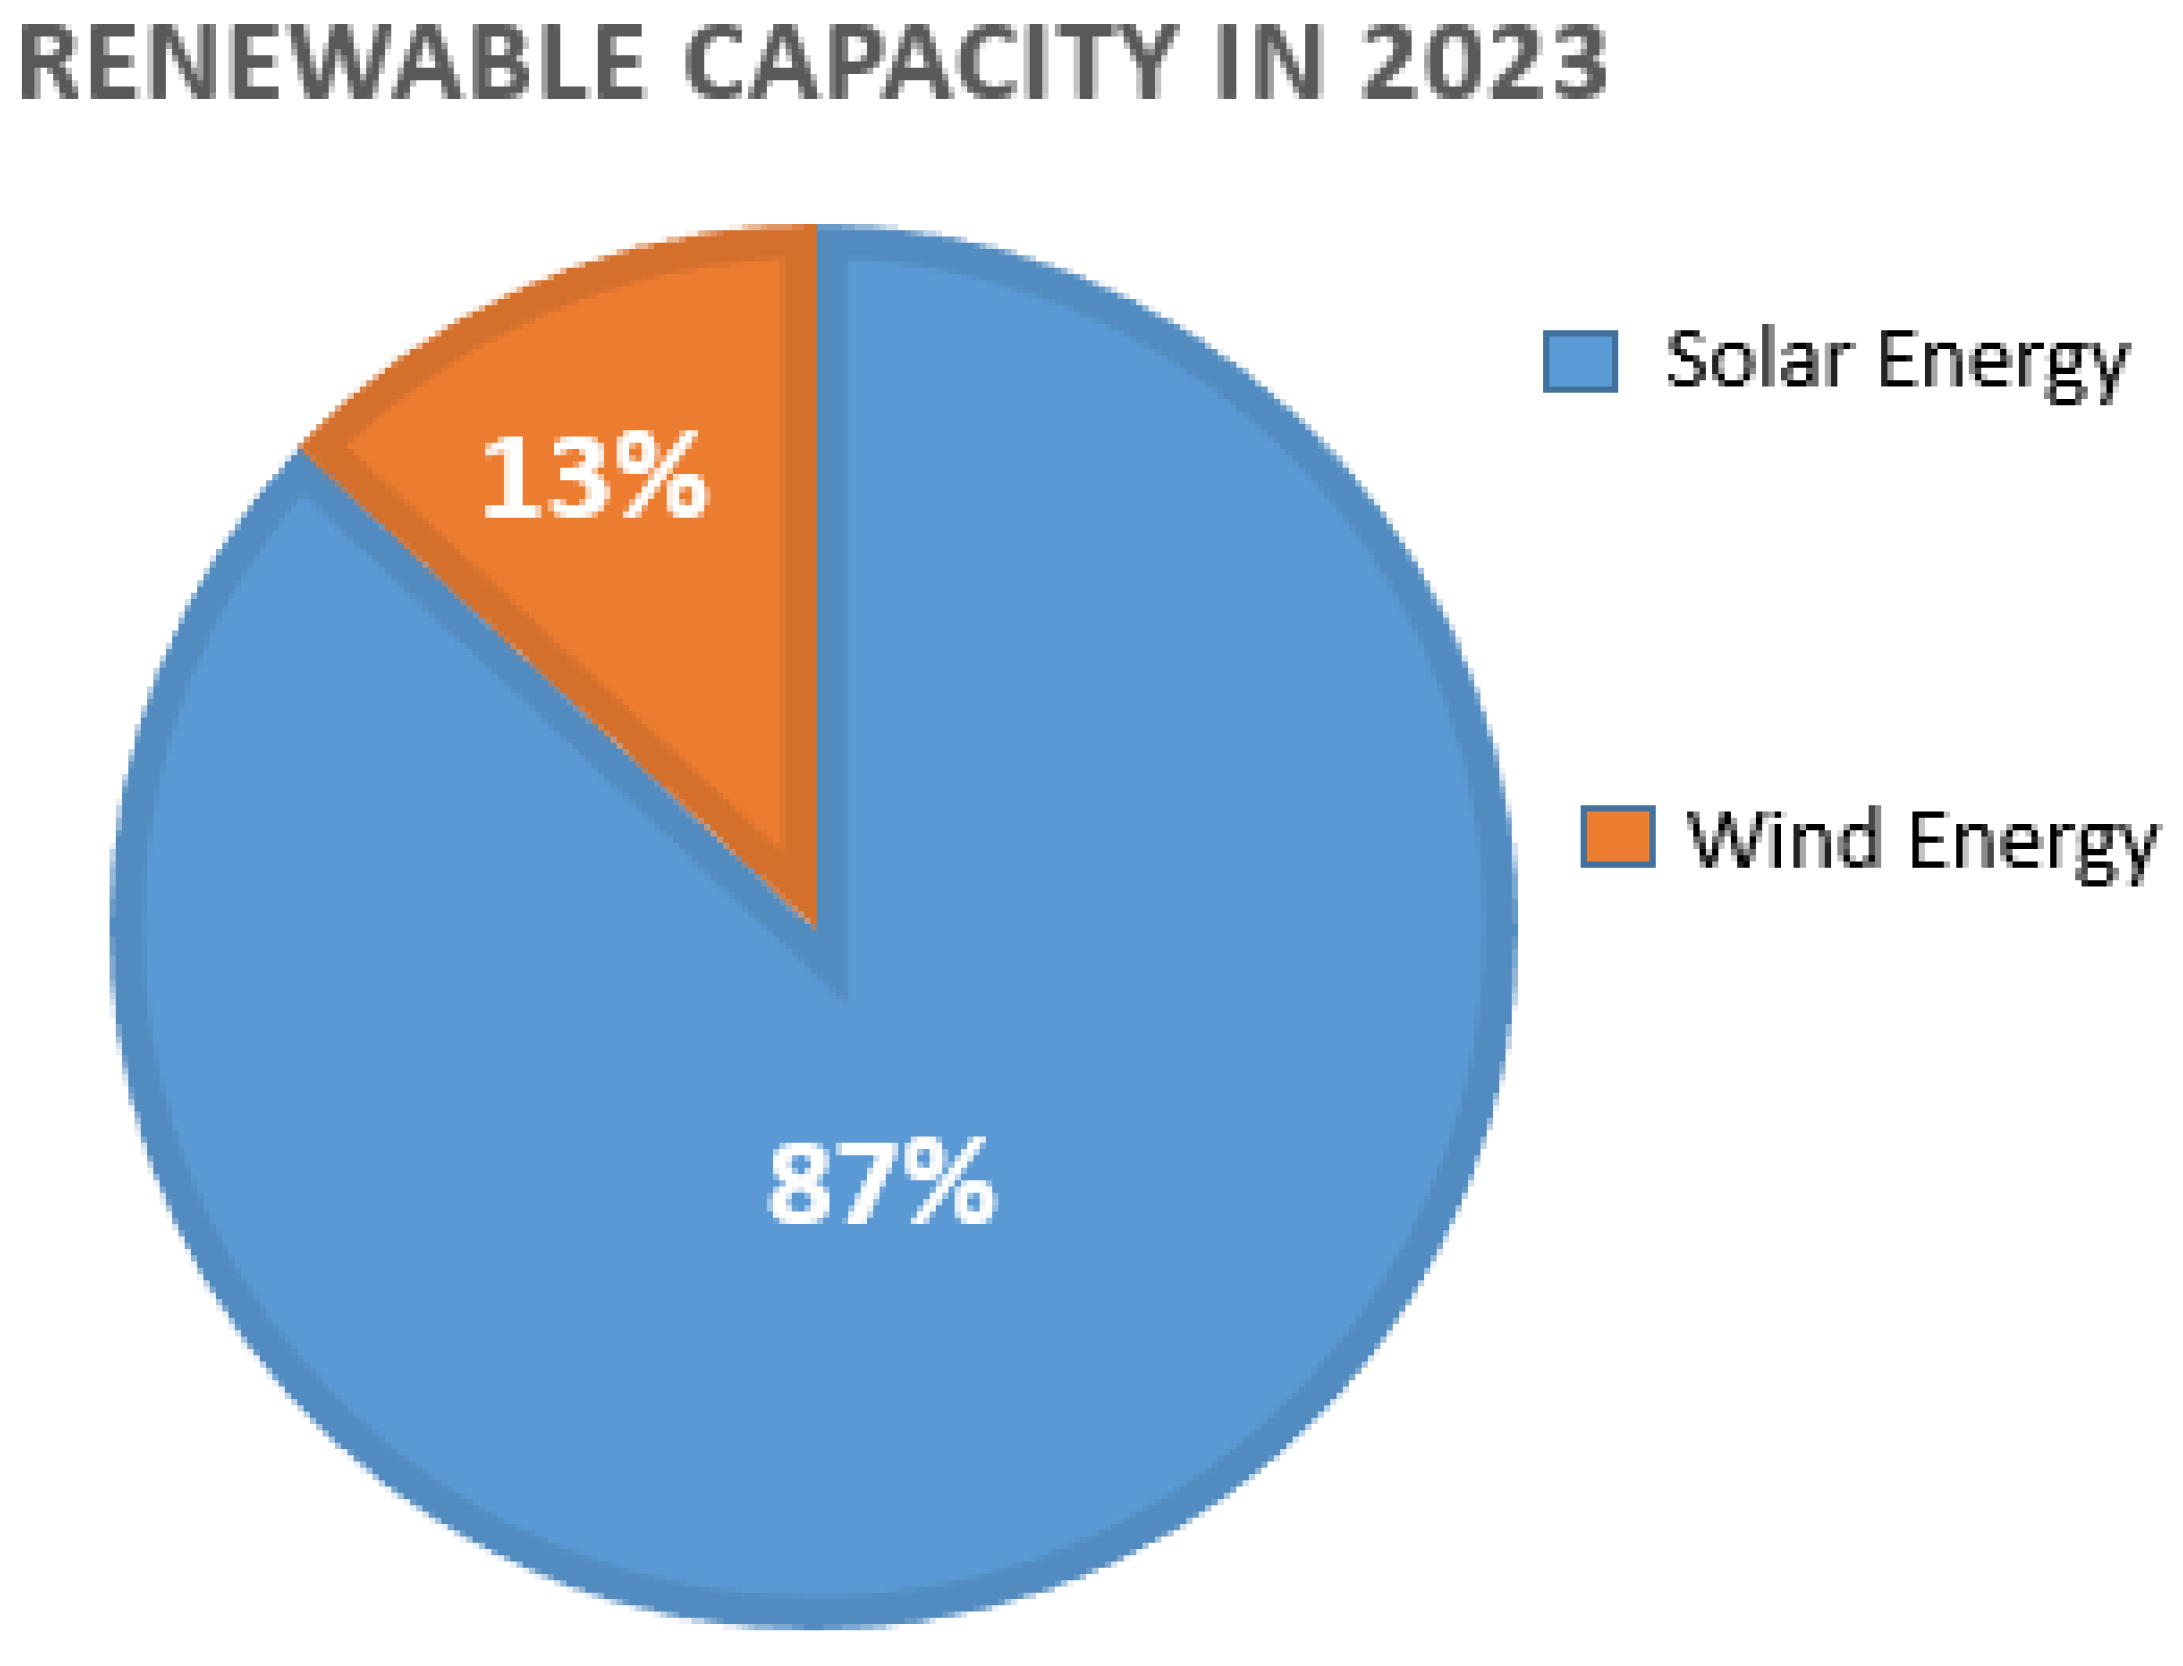
1. Introduction
2. Methodology
3. Design of the System
3.1. Selection of PV Modules
3.2. Inverter
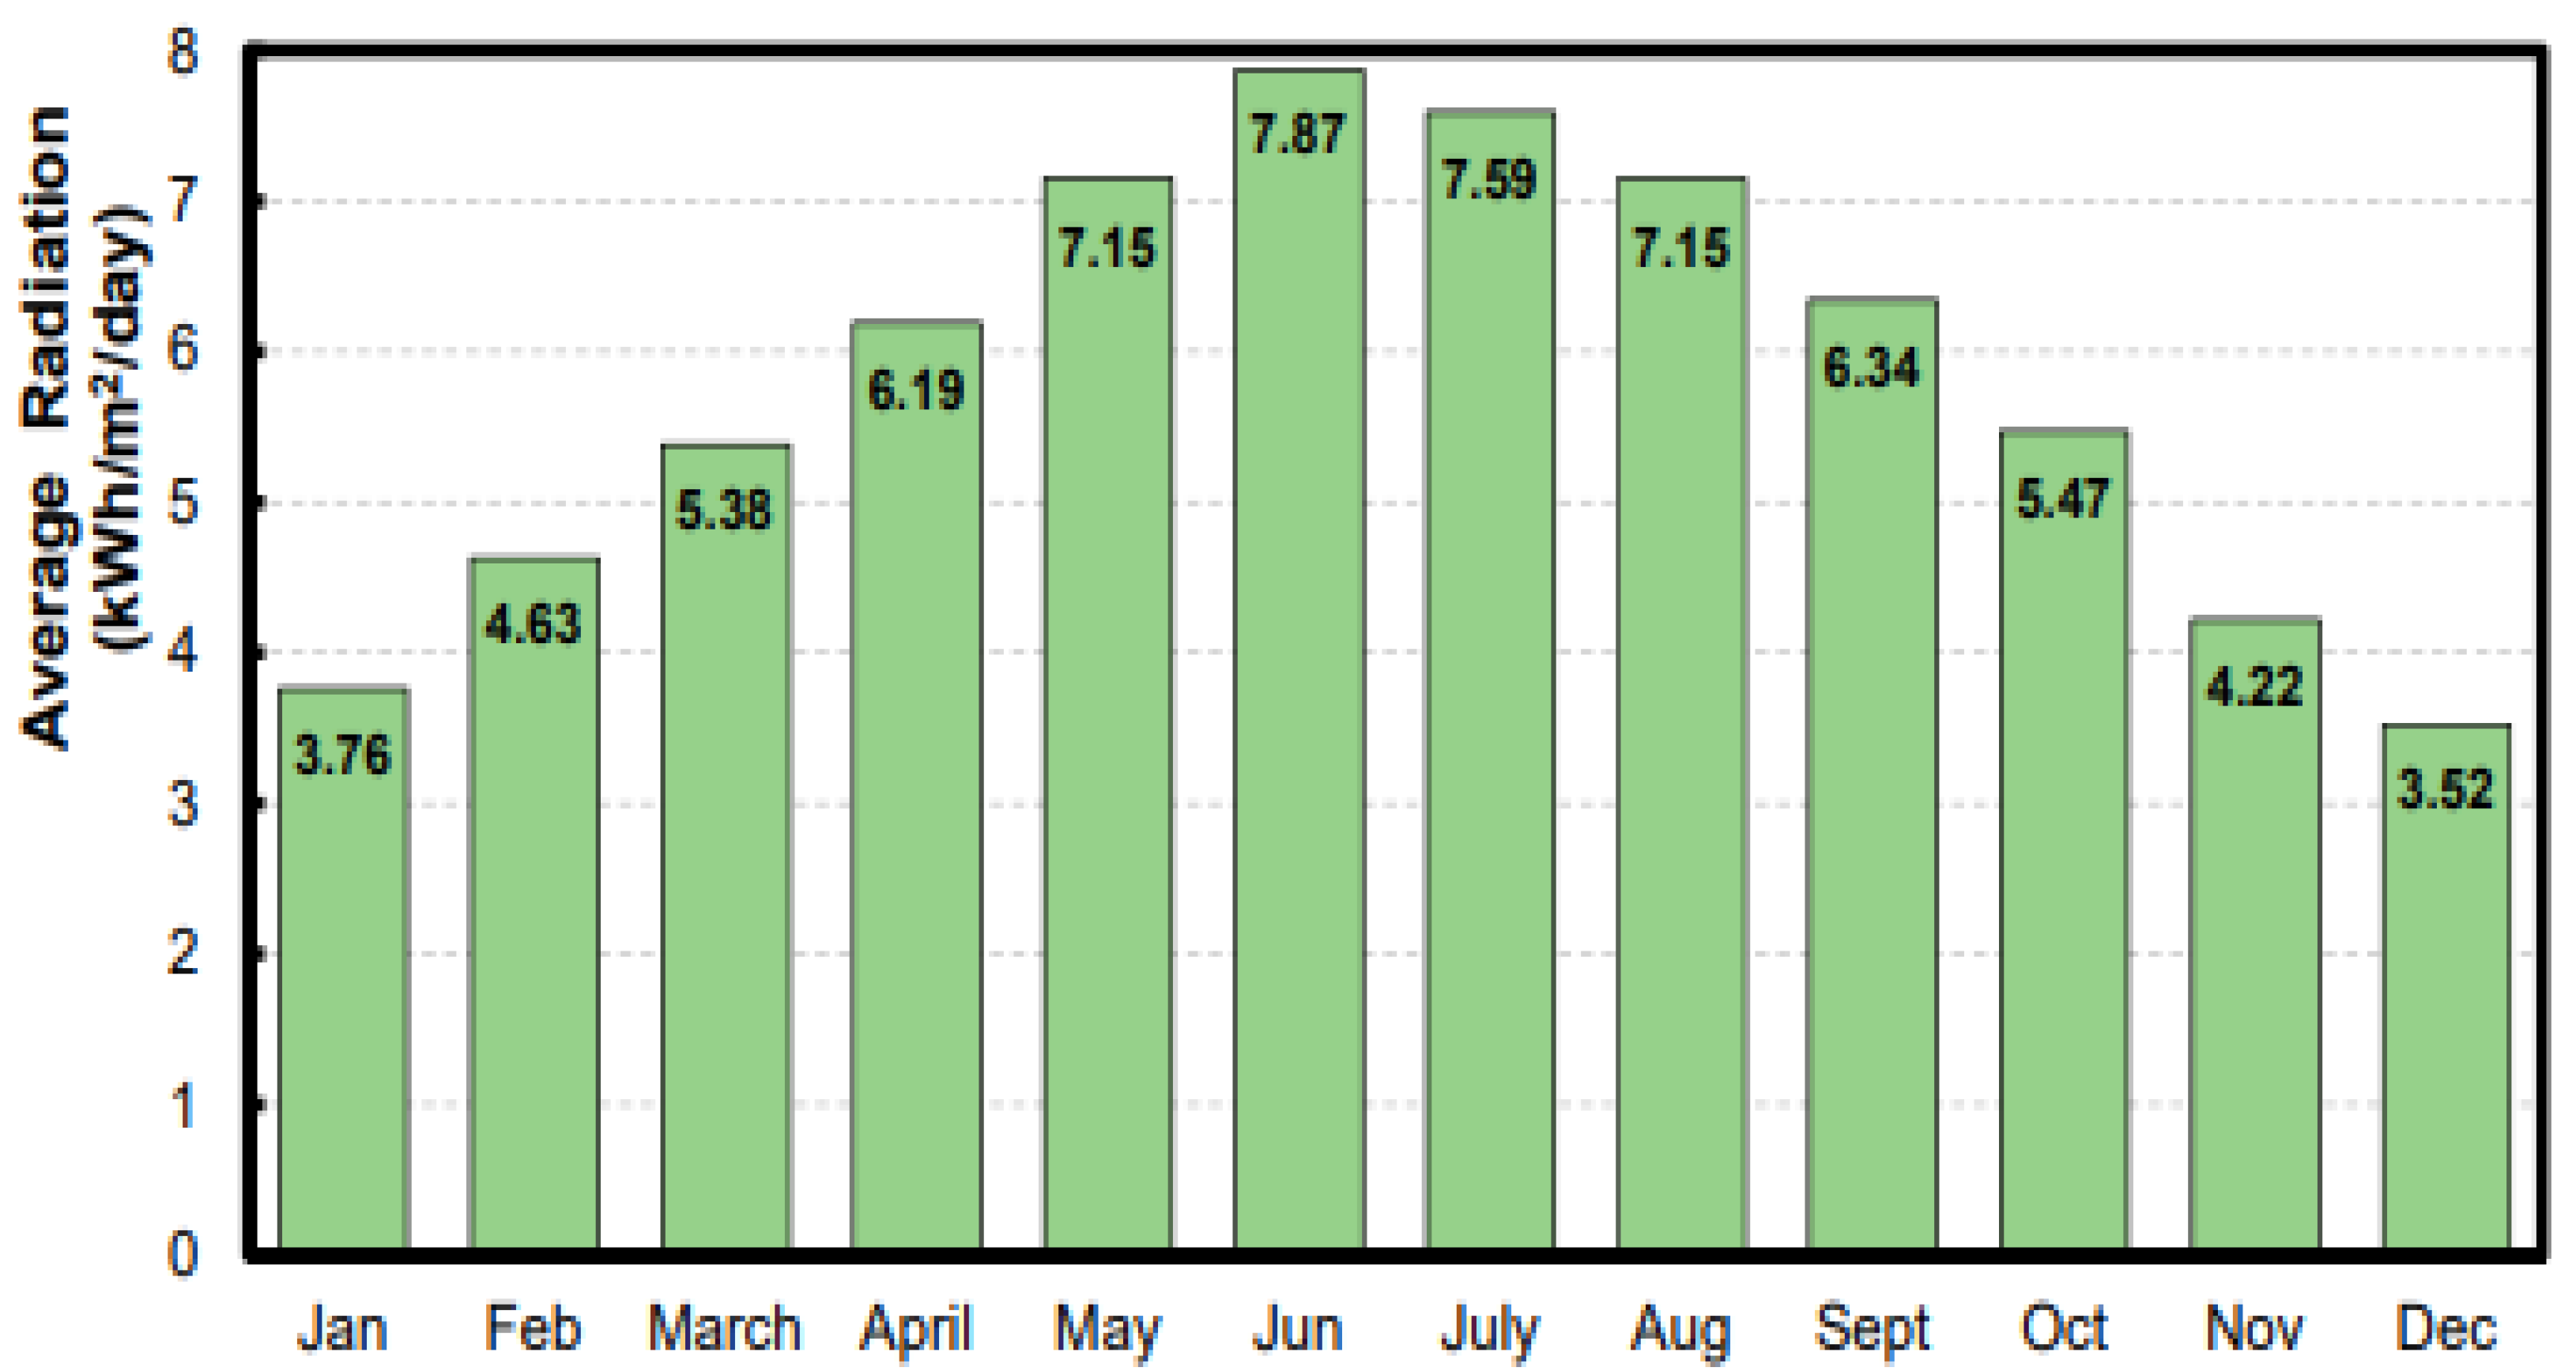
3.3. Solar Radiation
3.4. Geographical Location
4. Results and Discussion
4.1. Energy Production
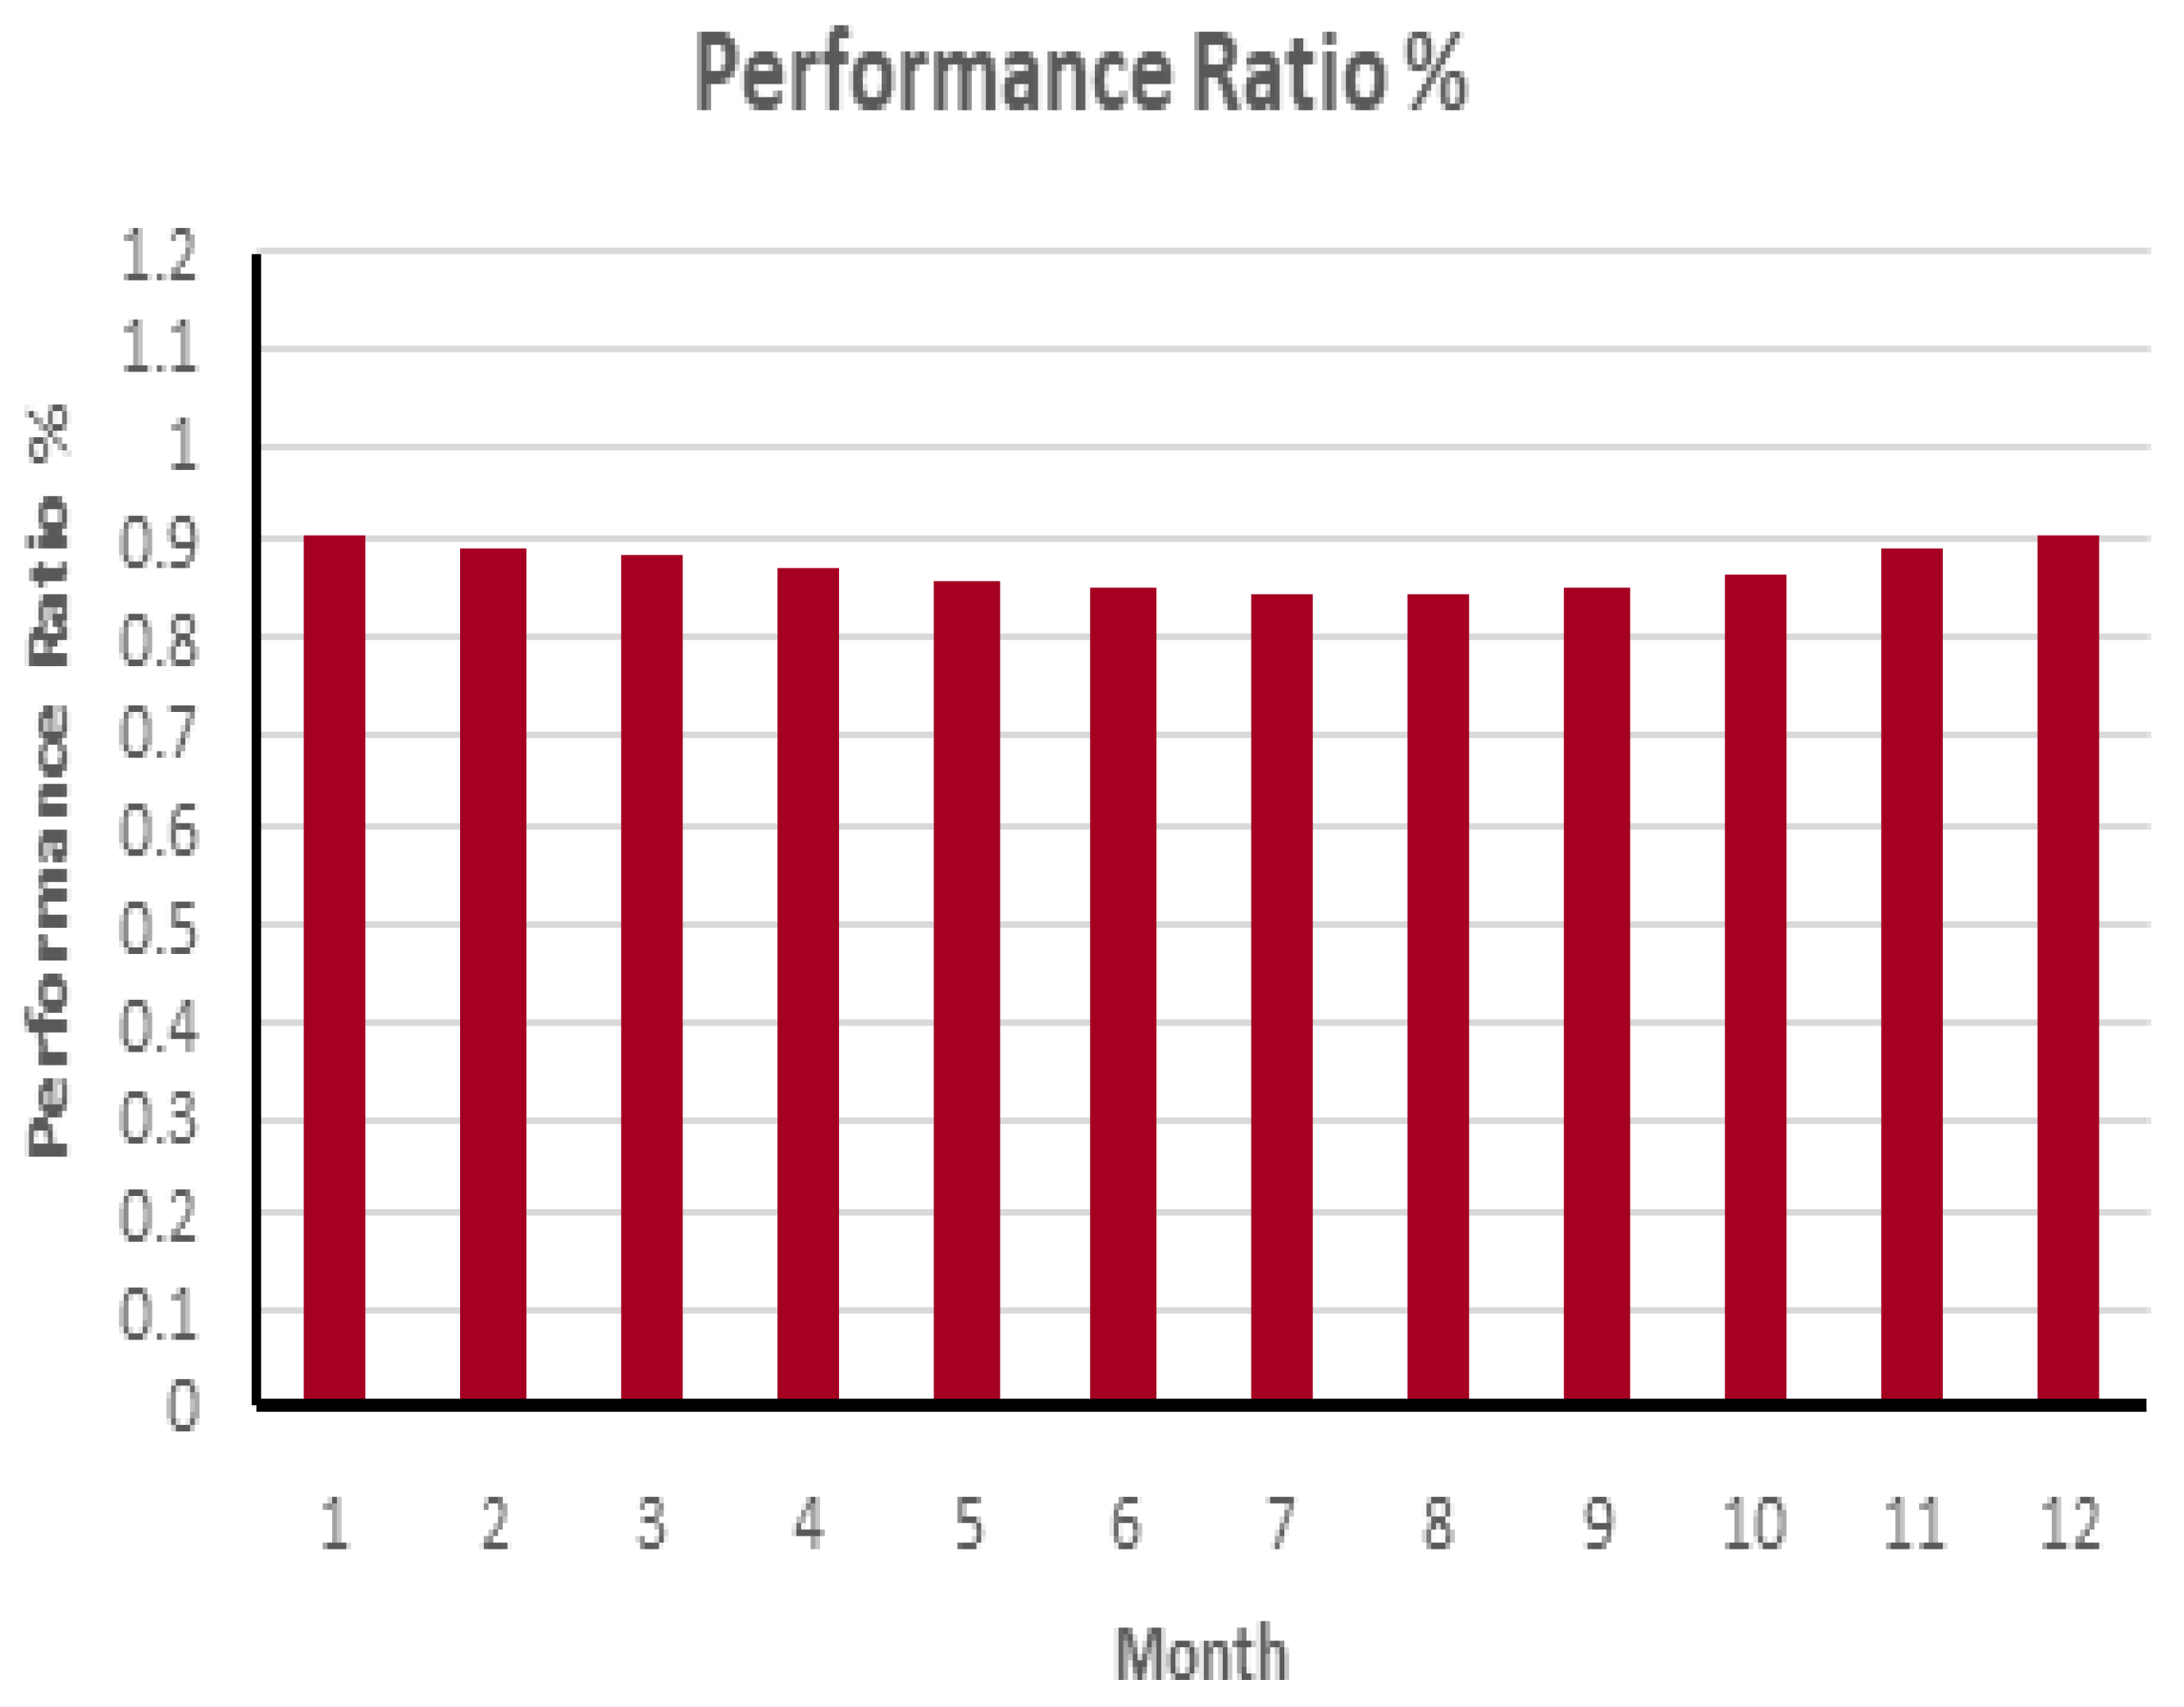
4.2. Performance Analysis
4.3. Loss Diagram
5. Conclusions
Author Contributions
Funding
Data Availability Statement
Acknowledgments
Conflicts of Interest
References
- Meinhardt, M.; Cramer, G. Past, present and future of grid connected photovoltaic- and hybrid-power-systems. In Proceedings of the IEEE 2000 Power Engineering Society Summer Meeting (Cat. No.00CH37134), Seattle, WA, USA, 16–20 July 2020; pp. 1283–1288. [Google Scholar]
- Nasreddine, A.; Sid-Ahmed, Z.; Mohamed, K.; Samir, H. Grid-Connected Photovoltaic System. In Proceedings of the 1st International Conference on Renewable Energy and Energy Conversion, Oran, Algeria, 11–13 November 2019; Springer: Berlin/Heidelberg, Germany, 2019. [Google Scholar]
- Deodhe, P.N.; Bankar, D. Design of a Grid Connected PV System and Effect of Various Parameters on Energy Generation. I-Manag. J. Power Syst. Eng. 2018, 6, 41–48. [Google Scholar]
- Rahman, H.A.; Nor, K.M.; Hassan, M.Y.; Thanakodi, S.; Majid, M.S.; Hussin, F. Modeling and Simulation of Grid Connected Photovoltaic System for Malaysian Climate Using Matlab/Simulink. In Proceedings of the 2010 IEEE International Conference on Power and Energy (PECon2010), Kuala Lumpur, Malaysia, 29 November–1 December 2010. [Google Scholar]
- Rasel, S.I.; Ali, R.N.; Chowdhury, M.S.U.; Hasan, M.M. Design & simulation of grid connected Photovoltaic system using Simulink. In Proceedings of the International Conference on Advances in Electrical Engineering (ICAEE), Dhaka, Bangladesh, 17–19 December 2015; pp. 17–19. [Google Scholar]
- Benaissa, O.M.; Hadjeri, S.; Zidi, S.A.; Benaissa, O.M. Modeling and Simulation of Grid Connected PV Generation System Using Matlab/Simulink. Int. J. Power Electron. Drive Syst. 2017, 8, 392–401. [Google Scholar]
- Nurunnabi, M.; Roy, N.K. Grid connected hybrid power system design using HOMER. In Proceedings of the International Conference on Advances in Electrical Engineering (ICAEE), Dhaka, Bangladesh, 17–19 December 2015. [Google Scholar]
- Kassim, M.P.M.; Al-Obaidi, K.M.; Munaaim, M.A.C. Feasibility Study on Solar Power Plant Utility Grid under Malaysia Feed-in Tariff. Am. J. Eng. Appl. Sci. 2015, 8, 210–222. [Google Scholar] [CrossRef]
- Syam, F.A.; El-Sebah, M.I.A.; Sakkoury, K.S.; Sweelem, E.A. Operation of biogas-solar-diesel hybrid renewable energy system with minimum reserved energy. Indones. J. Electr. Eng. Comput. Sci. 2022, 28, 1203–1213. [Google Scholar] [CrossRef]
- Channi, H.K.; Giri, N.C.; Sandhu, R.; El-Sebah, M.I.A.; Syam, F.A. Potential and Economic Feasibility Analysis of Solar-Biomass-based Hybrid System for Rural Electrification. Bull. Electr. Eng. Inform. 2024, 13, 3383–3840. [Google Scholar] [CrossRef]
- Belmahdi, B.; El Bouardi, A. Solar potential assessment using PVSYST software in the Northern Zone of Morocco. Procedia Manuf. 2020, 46, 738–745. [Google Scholar] [CrossRef]
- Alnoosani, A.; Oreijah, M.; Alhazmi, M.; Samkari, Y.; Faqeha, H. Design of 100MW Solar PV on-Grid Connected Power Plant Using (PVsyst) in Umm Al-Qura University. Int. J. Sci. Res. (IJSR) 2019, 8, 356–363. [Google Scholar]
- Miah, M.A.; Rahman, S.R.; Kabir, R. Techno-economic assessment of net energy metering implementation for rooftop solar PV in a commercial building in Bangladesh. In Proceedings of the IEEE 2020 4th International Conference on Green Energy and Applications (ICGEA), Singapore, 7–9 March 2020; pp. 95–99. [Google Scholar]
- Endiz, M.S.; Coşgun, A.E. Assessing the potential of solar power generation in Turkey: A PESTLE analysis and comparative study of promising regions using PVsyst software. Sol. Energy 2023, 266, 112153. [Google Scholar] [CrossRef]
- Moe, K.M.; Thar, H.A.; Aung, H.M.; Win, Y.Y. Analysis of energy production design from grid-connected 40 MW large PV power plant. Teknomekanik 2023, 6, 1–11. [Google Scholar] [CrossRef]
- Kader, K.A.; Rahman, F.; Nahid, I.; Abedin, Z. Design and Analysis of an On-Grid Solar System Using PVsyst Software for Commercial Application. Int. J. Sci. Eng. Res. 2021, 12, 316–322. [Google Scholar]
- Jagadale, P.R.; Choudhari, A.B.; Jadhav, S.S. Design and Simulation of Grid Connected Solar Si-Poly Photovoltaic Plant using PVsyst for Pune, India Location. Renew. Energy Res. Appl. 2022, 3, 41–49. [Google Scholar]
- Sharma, R.; Goel, S. Performance analysis of a 11.2 kWp roof top grid-connected PV system in Eastern India. Energy Rep. 2017, 3, 76–84. [Google Scholar] [CrossRef]
- Islam, S.; Islam, F.; Habib, A. Feasibility Analysis and Simulation of the Solar Photovoltaic Rooftop System Using PVsyst Software. Int. J. Educ. Manag. Eng. 2022, 12, 21–32. [Google Scholar] [CrossRef]
- Farghally, H.; Sweelem, E.A.; El-Sebah, M.I.A.; Syam, F.A. Agricultural Grid Connected Photovoltaic System Design and Simulation in Egypt by using PVSYST Software. WSEAS Trans. Circuits Syst. 2022, 21, 306–3015. [Google Scholar] [CrossRef]
- International Renewable Energy Agency. Energy Profile Saudi Arabia; International Renewable Energy Agency (IRENA): Masdar City, United Arab Emirates, 2024. [Google Scholar]
- Islam, M.T.; Ali, A. Sustainable green energy transition in Saudi Arabia: Characterizing policy framework, interrelations and future research directions. Next Energy 2024, 5, 100161. [Google Scholar] [CrossRef]
- Yadav, R.; Gautam, A.; Pradeepa, P. Design, Performance and Economic evaluation of a 4kW Grid-interactive Solar PV Rooftop in Odisha using Pvsyst. Int. Acad. Publ. House 2023, 31, 98–107. [Google Scholar] [CrossRef]
- Benda, V.; Cerna, L. A Note on Limits and Trends in PV Cells and Modules. Appl. Sci. 2022, 12, 33–63. [Google Scholar] [CrossRef]
- Vilas, V.; Mahesh, B.M. A Comparative Analysis and Performance of Polycrystalline and Monocrystalline PV Module. Int. J. Eng. Res. Technol. 2018, 6, 1–6. [Google Scholar]
- Kumar, R.; Rajoria, C.; Sharma, A.; Suhag, S. Design and simulation of standalone solar PV system using PVsyst Software: A case study. Mater. Today Proc. 2020, 46, 5322–5532. [Google Scholar] [CrossRef]
- Elshurafa, A.M.; Muhsen, A.R. The Upper Limit of Distributed Solar PV Capacity in Riyadh: A GIS-Assisted Study. Sustainability 2019, 11, 4301. [Google Scholar] [CrossRef]
- Zell, E.; Gasim, S.; Wilcox, S.; Katamoura, S.; Stoffel, T.; Shibli, H.; Engel-Cox, J.; Al Subie, M. Assessment of solar radiation resources in Saudi Arabia. Sol. Energy 2015, 119, 422–438. [Google Scholar] [CrossRef]
- Ahmed, O.A.; Habeeb, W.H.; Mahmood, D.Y.; Jalal, K.A.; Sayed, H.K. Design and Performance Analysis of 250 kW Grid-Connected Photovoltaic System in Iraqi Environment Using PVsyst Software. Indones. J. Electr. Eng. Inform. (IJEEI) 2019, 7, 415–421. [Google Scholar]


| Specification | Parameters | ||
|---|---|---|---|
| Module | JKM 255PP-60-V | JKM330M-60H-TV | JKM580N-72HL4-BDV |
| Rated power | 255 W | 330 W | 580 Wp |
| Short-circuit current | 8.92 | 10.25 | 14.37 A |
| Open-circuit voltage | 38 | 40.39 | 51.47 V |
| Maximum voltage | 30.8 | 33.24 | 42.59 V |
| Maximum current | 8.28 | 9.93 | 13.62 A |
| Efficiency | 15.58% | 19.29% | 22.46% |
| No. of modules | 1,568,630 | 1,212,123 | 689,650 modules |
| No. of Strings | 44,818 | 36,731 | 26,525 Strings |
| Dimensions | 1650 × 992 × 40 mm | 1704 × 1008 × 35 mm | 2278 × 1134 × 30 mm |
| Specification | Input | Specification | Output |
|---|---|---|---|
| Max. Input Voltage | 1500 V | Nominal AC Active Power | 275 kW |
| Number of MPPT | 6 | Nominal AC Active Power | 330 kVA |
| Max. Current per MPPT | 65 A | Max. AC Active Power (cosφ = 1) | 330 kW |
| Max. Short Circuit Current per MPPT | 115 A | Nominal Output Voltage | 800 V |
| Max. PV Inputs per MPPT | 4/5/5/4/5/5 | Rated AC Grid Frequency | 50 Hz/60 Hz |
| Start Voltage | 550 V | Nominal Output Current | 198.5 A |
| MPPT Operating Voltage Range | 550–1500 V | Max. Output Current | 240.3 A |
| Nominal Input Voltage | 1080 V | Adjustable Power Factor Range | 0.8 Lag–0.8 Lead |
| PV Module | 580 W | 330 W | 255 W |
|---|---|---|---|
| Array nominal energy (MWh) | 961,799.5 | 950,827.7 | 942,341 |
| Electricity generated (MWh) | 872,166.5 | 837,454.6 | 820,180.3 |
| Electricity to the grid (MWh) | 858,548 | 822,747.4 | 806,786.6 |
| Yr kWh/m2/day | Lc kWh/kWp/day | Ya kWh/kWp/day | Ls kWh/kWp/day | Yf kWh/kWp/day | Lcr Ratio | Lsr Ratio | PR Ratio | |
|---|---|---|---|---|---|---|---|---|
| January | 6.90 | 0.55 | 6.35 | 0.09 | 6.26 | 0.080 | 0.013 | 0.907 |
| February | 6.92 | 0.64 | 6.28 | 0.09 | 6.18 | 0.093 | 0.013 | 0.894 |
| March | 7.07 | 0.74 | 6.33 | 0.10 | 6.24 | 0.104 | 0.014 | 0.882 |
| April | 7.06 | 0.82 | 6.24 | 0.10 | 6.14 | 0.116 | 0.013 | 0.870 |
| May | 6.34 | 0.82 | 5.51 | 0.09 | 5.43 | 0.130 | 0.013 | 0.857 |
| June | 6.62 | 0.90 | 5.72 | 0.09 | 5.63 | 0.136 | 0.014 | 0.850 |
| July | 6.47 | 0.91 | 5.56 | 0.09 | 5.47 | 0.140 | 0.013 | 0.847 |
| August | 6.52 | 0.92 | 5.60 | 0.09 | 5.51 | 0.141 | 0.013 | 0.845 |
| September | 6.91 | 0.94 | 5.97 | 0.09 | 5.88 | 0.135 | 0.014 | 0.851 |
| October | 6.95 | 0.85 | 6.10 | 0.09 | 6.01 | 0.122 | 0.014 | 0.864 |
| November | 6.56 | 0.62 | 5.93 | 0.09 | 5.84 | 0.095 | 0.013 | 0.891 |
| December | 6.63 | 0.55 | 6.08 | 0.09 | 5.99 | 0.082 | 0.013 | 0.904 |
| Year | 6.74 | 0.77 | 5.97 | 0.09 | 5.88 | 0.115 | 0.013 | 0.872 |
| GlobHor kWh/m2 | DiffHor kWh/m2 | T_Amb °C | GlobInc kWh/m2 | GlobEff kWh/m | EArray kWh | E_Grid kWh | PR Ratio | |
|---|---|---|---|---|---|---|---|---|
| January | 147.1 | 25.97 | 14.72 | 213.9 | 209.2 | 78,737,094 | 77,611,333 | 0.907 |
| February | 153.2 | 50.18 | 18.06 | 193.7 | 189.4 | 70,301,716 | 69,269,864 | 0.894 |
| March | 194.8 | 62.75 | 22.87 | 219.1 | 214.1 | 78,512,137 | 77,326,017 | 0.882 |
| April | 212.1 | 76.05 | 27.70 | 211.8 | 206.7 | 74,881,637 | 73,738,271 | 0.870 |
| May | 216.5 | 88.31 | 34.20 | 196.5 | 191.6 | 68,381,624 | 67,326,190 | 0.857 |
| June | 227.8 | 90.84 | 36.28 | 198.7 | 193.7 | 68,619,344 | 67,537,257 | 0.850 |
| July | 226.1 | 85.98 | 37.86 | 200.4 | 195.3 | 68,939,645 | 67,862,665 | 0.847 |
| August | 210.8 | 85.78 | 38.01 | 202.2 | 197.3 | 69,451,800 | 68,365,633 | 0.845 |
| September | 192.6 | 60.96 | 34.14 | 207.3 | 202.5 | 71,686,322 | 70,566,093 | 0.851 |
| October | 175.4 | 46.83 | 29.52 | 215.6 | 210.7 | 75,670,029 | 74,505,277 | 0.864 |
| November | 141.8 | 34.91 | 21.32 | 196.7 | 192.3 | 71,162,693 | 70,108,422 | 0.891 |
| December | 136.9 | 26.58 | 16.57 | 205.5 | 201.0 | 75,418,358 | 74,331,135 | 0.904 |
| Year | 2235.2 | 735.14 | 27.66 | 2461.3 | 2403.9 | 871,762,400 | 858,548,156 | 0.872 |
Disclaimer/Publisher’s Note: The statements, opinions and data contained in all publications are solely those of the individual author(s) and contributor(s) and not of MDPI and/or the editor(s). MDPI and/or the editor(s) disclaim responsibility for any injury to people or property resulting from any ideas, methods, instructions or products referred to in the content. |
© 2024 by the authors. Licensee MDPI, Basel, Switzerland. This article is an open access article distributed under the terms and conditions of the Creative Commons Attribution (CC BY) license (https://creativecommons.org/licenses/by/4.0/).
Share and Cite
Alkahtani, M.M.; Kamari, N.A.M.; Zainuri, M.A.A.M.; Syam, F.A. Design of Grid-Connected Solar PV Power Plant in Riyadh Using PVsyst. Energies 2024, 17, 6229. https://doi.org/10.3390/en17246229
Alkahtani MM, Kamari NAM, Zainuri MAAM, Syam FA. Design of Grid-Connected Solar PV Power Plant in Riyadh Using PVsyst. Energies. 2024; 17(24):6229. https://doi.org/10.3390/en17246229
Chicago/Turabian StyleAlkahtani, Mubarak M., Nor A. M. Kamari, Muhammad A. A. M. Zainuri, and Fathy A. Syam. 2024. "Design of Grid-Connected Solar PV Power Plant in Riyadh Using PVsyst" Energies 17, no. 24: 6229. https://doi.org/10.3390/en17246229
APA StyleAlkahtani, M. M., Kamari, N. A. M., Zainuri, M. A. A. M., & Syam, F. A. (2024). Design of Grid-Connected Solar PV Power Plant in Riyadh Using PVsyst. Energies, 17(24), 6229. https://doi.org/10.3390/en17246229