Article

Biopolymer Production in a Full-Scale Activated Sludge Wastewater Treatment Plant: Seasonal Changes and Promising Bacterial Producers

by
Agnieszka Cydzik-Kwiatkowska
1,*,
Sławomir Ciesielski
1,
Maciej Florczyk
1,
Sylwia Pasieczna-Patkowska
2,
Małgorzata Komorowska-Kaufman
3,
Weronika Pomian
4,
Kinga Jóźwiak
4 and
Piotr Oleskowicz-Popiel
3
1
Faculty of Geoengineering, University of Warmia and Mazury in Olsztyn, Sloneczna 45G, 10-709 Olsztyn, Poland
2
Faculty of Chemistry, Maria Curie-Skłodowska University, pl. Marii Curie-Skłodowskiej 3/425, 20-400 Lublin, Poland
3
Faculty of Environmental Engineering and Energy, Poznan University of Technology, Berdychowo 4, 60-965 Poznan, Poland
4
AQUANET S.A., Dolna Wilda 126, 61-492 Poznan, Poland
*
Author to whom correspondence should be addressed.
Energies 2024, 17(24), 6231; https://doi.org/10.3390/en17246231
Submission received: 8 November 2024 / Revised: 2 December 2024 / Accepted: 6 December 2024 / Published: 11 December 2024

Abstract

:
Wastewater treatment plants (WWTPs) offer the possibility of recovering valuable substances produced by microorganisms, such as extracellular polymeric substances (EPSs). This study aimed to investigate the generation and properties of biopolymers and microbial communities of activated sludge from a large, full-scale WWTP. EPS composition in the activated sludge changed mostly during the transition period from winter to spring. Higher temperatures favored higher protein (PN) concentrations and a higher PN/PSs (polysaccharides) ratio in tightly-bound EPS, stimulating bacterial aggregation. In the sludge, filamentous Microthrix sp. were abundant (~6%) but the settling properties of the sludge improved with increasing PN content in the bound EPS fraction. The content of alginate (ALE)-like polymers averaged 55–60 mg/g Mixed Liquor Suspended Solids, and ALE content in sludge and characteristics were stable during the year. The abundance of Nitrospira sp. and the marine group NS9 in activated sludge correlated with the ALE content in the biomass, pointing to the importance of biopolymer production for nitrogen-transforming microorganisms. The most common EPS-producer was, Candidatus Competibacter (3–4%). The abundance of the Roseiflexaceae family significantly increased in summer, as did the abundance of Trichoccus sp. and Flavobacterium sp. in winter. The study shows that seasonal temperature fluctuations do not significantly affect the production of polymers, especially alginate, which favors commercial ALE recovery. The non-uniform composition of ALE-like polymers shows the possibility of their use in areas that do not require a specific polymer composition, e.g., as environmentally friendly coating materials or sorbents. The study contributes to biopolymer recovery and valorization of activated sludge.

1. Introduction

Different types of biomass can be used in the biological part of a wastewater treatment plant (WWTP). A distinction is made between systems with activated sludge and systems with immobilized biomass in the form of biofilm or aerobic granular sludge. Immobilized biomass produces more biopolymers than activated sludge [1]; however, activated sludge is still the most widely used technology, especially in very large plants, for which it is worthwhile to design pathways to recover different bioproducts from the sludge [2]. WWTPs produce a constant stream of excess sludge, and resource recovery from this stream can significantly reduce waste generation, energy consumption, and greenhouse gas emissions.
Microorganisms are capable of producing extracellular polymeric substances (EPSs), the main function of which is to protect cells and support the formation of three-dimensional microbial structures. EPSs are formed by active secretion, cell lysis, or adsorption of polymers from the environment [3]. The main components of EPSs are polysaccharides (PSs) and proteins (PNs), but nucleic acids, lipids, and humic substances are also present in EPSs [4,5]. EPSs extracted from wastewater treatment plants are non-toxic and biodegradable. They have properties that make them useful as chemical agents for cation exchange or sorption; as coatings for seeds, metal surfaces, or paper; as structural agents in fertilizer pellets or fire-resistant boards; or as immobilizing agents for pollutant-degrading bacteria, among other applications [6]. Recovered biopolymers can also be used in WWTPs to support flocculation or improve methanogenesis.
The literature usually distinguishes three types of EPSs: soluble (SOL-EPS), loosely bound (LB-EPS), and tightly bound (TB-EPS). Each EPS fraction in the biomass represents a microenvironment that promotes the growth of species producing EPS components with a function important to the surrounding cells [7,8]. SOL-EPSs are present in bulk liquid and are responsible for the first step of biofilm formation, which is related to surface conditioning. LB-EPSs allow microcolonies to bind together and form flocs. The presence of large amounts of LB-EPS, however, may lead to a deterioration of cell adhesion and weaken the aggregate structure [9]. TB-EPSs are present on the cell walls of microorganisms and help cells adhere to each other and form microcolonies [10].
Alginate-like exopolymers (ALEs) are the main component of EPSs and create a gel matrix supporting microbial aggregation. ALE can be separated into three component blocks: GG (poly-guluronate), GM (poly-guluronate/mannuronate), and MM (poly-mannuronate). Gel-forming properties of ALEs are similar to pure alginate [11], but their viscosity and gel strength are lower than those of commercial alginate. ALEs have a wider range of potential applications than crude EPS; thus, successful extraction of ALE from waste sludge can mean the recovery of materials with higher value [12]. Although the composition of ALE in activated sludge flocs and aerobic granules is similar [9], most ALE extractions and purifications are performed with aerobic granules [13], as they have a higher ALE content than activated sludge (up to 25% of the mass of granules). Many studies on the synthesis of ALE in wastewater systems use synthetic influents that do not accurately reflect the applicability of the system in practice [14].
Microorganisms in wastewater treatment systems commonly produce EPSs. A study by Shahnavaz et al. [15] found that, out of 74 bacteria isolated from activated sludge, over 30% were EPS producers; the bacteria that produced the most EPS belonged to the genera Bacillus, Pseudomonas, and Klebsiella. Nohua et al. [16] isolated eight EPS-producing bacterial strains from sewage sludge from a municipal WWTP. EPS production by the different strains varied greatly, and the largest amounts of EPS were produced by Cloacibacterium normannese (11.8 ± 1.2 g/L). In a full-scale system with aerobic granular sludge, Thauera sp. and other Rhodcyclales-related bacteria, such as Sphigmonadales, Xanthomonadaceae, and Rhizobiales, were the predominant EPS producers [17]. A study by Paulo et al. [18] concerning the treatment of canned fish effluents with different levels of organic matter, nutrients, and salts showed that most bacteria in the biomass were EPS producers (mostly Thauera sp. and Paracoccus sp.) and indicated that the high microbial diversity of these producers ensured the maintenance of the bacterial groups responsible for nutrient removal.
The production and composition of the EPS in the biomass in a wastewater treatment system depend on operational conditions, such as the concentration of DO, reactor shear forces, hydraulic retention time (HRT), organic loading rate, sludge retention time, and wastewater chemistry (e.g., ionic strength, divalent cation concentration, or presence of toxic substances [6]). Studies with pure cultures have found that the temperature for optimal EPS production ranges widely. For example, the optimal temperature for growth-associated EPS production in a batch culture of Cupriavidus pauculus KPS 201 fed with sodium gluconate as the sole carbon source was 25 °C [19]. In Streptococcus thermophilus cultures with an initial pH of 4.08, a maximum of 406 mg/L EPS was produced in 10% reconstituted skim milk at 37 °C after 24 h of fermentation. At a higher temperature of 42 °C, EPS production decreased [20]. The temperature can also affect the composition of EPSs. Lactobacillus paracasei strains exhibited changes in EPS production as a function of growth temperature, as evidenced by the appearance of a high molecular weight fraction and an increase in the total amount of EPS produced at lower temperatures [21]. Hydrolysis of EPS-associated poly-P in phosphate-accumulating microorganisms was increased by higher temperatures [22].
Less is known about the effects of temperature on EPS production in mixed microbial consortia in large-scale plants. Tseng et al. [23] reported over a year’s worth of investigations into EPS content in biomass in activated sludge systems with full nitrification/denitrification and internal recirculation, as well as systems with partial nitrification/denitrification and no recirculation. The first system with recirculation had uniform EPS concentrations within the treatment line, while in the system without internal recirculation, EPS content in sludge decreased along the treatment line. EPS production appeared to be process-dependent but not temperature-dependent; however, it must be stressed that the temperature range during the investigation period was narrow (22–28 °C). On the other hand, analysis of activated sludge from a full-scale membrane bioreactor (MBRs) treating municipal wastewater indicated that the amount of EPS bound to sludge flocs varied seasonally from as low as 17 mg/g MLSS (Mixed Liquor Suspended Solids) in summer up to 51 mg/g MLSS in winter, which was associated with an increased occurrence of filamentous bacteria in the colder season [24,25].
In the studies of full-scale WWTPs using activated sludge that were mentioned above, only the total EPS was analyzed, but not ALE itself. Analysis of ALE in WWTPs has been conducted in aerobic granular systems, which are less popular than activated sludge systems. A study by Cydzik-Kwiatkowska et al. [25] conducted in a full-scale WWTP with aerobic granular sludge indicated that the content of alginate-like polymers (ALEs) averaged 90 mg/g MLSS throughout the year. The ALE recovered from granules had a small surface area and a lamellar structure with crystalline outgrowths, and its maximum Cd2+ adsorption capacity was 29.5 mg/g MLSS, which was similar to that of commercial ALE. Thus, the recovered ALE turned out to be an attractive sorbent for removing heavy metals from the environment. In a study conducted in a pilot municipal wastewater treatment plant using aerobic granular sludge, up to 160 ± 4 mg ALE/g VSS was extracted. The ALE contained a high percentage of polyguluronic acid blocks, which supported the formation of rigid, non-deformable gels in a CaCl2 solution [26]. Currently, ALE recovery from granular sludge is conducted at full scale in the Netherlands with production expected to surpass 85,000 tons by 2030 [27,28]. Thus, recycling a high-value-added product like ALE not only constitutes an attractive solution for the disposal of sludge from wastewater plants but even leads to a change in the way the role of these plants is perceived.
The structure of microbial communities in WWTP is determined in large part by temperature fluctuations. Variation partitioning analysis conducted by Fan et al. [28] showed that in a WWTP with activated sludge, intermittent and transient genera were mostly strongly affected by water quality indexes (13.4% of total variance) and temperature (9.2% of total variance), which changed from 13 to 26 °C throughout the year. A study by Liu et al. [29] investigated the microbial composition of activated sludge in a WWTP for 10 months, during which the wastewater temperature ranged from 15 to 30 °C. Changes in the composition of the activated sludge microbiome were associated with WWTP operational parameters, such as temperature, BOD, NH4+-N, and TN, and based on an analysis of the bacterial community, the efficiency of WWTP operation in terms of effluent BOD, SS, and TN could be predicted. However, although there are studies of ALE in activated sludge, they mostly focus on the characteristics of the polymer and its potential applications. To the authors’ knowledge, there is no published research on the effect of temperature on the long-term recovery of ALE. This is an important knowledge gap because, to develop technologies for the recovery of biopolymers from sewage sludge in large-scale plants, we need to acquire a comprehensive understanding of the effects of seasonal changes in wastewater treatment plants on the amount and properties of the polymers that the microorganisms produce.
Therefore, the aim of the present study was to examine the production of polymers in activated sludge in a WWTP throughout the year. The physical and chemical properties of the recovered biopolymers were also evaluated and potential applications of these polymers were discussed. Molecular analysis of the activated sludge bacterial community was performed to identify EPS producers and microorganisms susceptible to temperature changes. The novelty of this study lies in the fact that it is not limited to an analysis of EPS, but it also describes the possibilities of recovering ALE from activated sludge, and, at the same time, it uses a holistic approach, including both a study of polymer production and the microbiological basis of the process, as well as the properties of the biopolymers, with a view to further applications. Moreover, in contrast to previous studies, this research involved the type of system that is most commonly used in large WWTPs, i.e., an integrated WWTP system with enhanced P, N, and C removal followed by gravity separation.

2. Materials and Methods

2.1. Sample Collection and WWTP Operation

The samples were collected from a full-scale WWTP in Poznań, Polska (52.4493° N, 16.9826° E) treating municipal wastewater. The treatment capacity in the investigated period averaged 3 million m3/month. The composition of wastewater was as follows: 1322.2 ± 132.3 mg COD/L, 607.4 ± 79.1 mg BOD5/L, 632.6 ± 117.2 mg TSS/L, 112.6 ± 10.5 mg Ntot/L, 63.6 ± 7.4 mg N-NH4/L, 16.3 ± 2.5 mg Ptot/L. The technical system of the WWTP consists of a mechanical and a biological part and ensures efficient C, P, and N removal. In the biological part, 6 biological treatment lines are operated in parallel. In each treatment line, wastewater is first fed into the anaerobic chamber and then into the aerobic chamber. In the aerobic chambers, the oxygen content is kept between 0.8 and 2.2 mg/L. The oxygen concentration was regulated depending on the ammonia content in the bioreactor. In the studied period, the OLR in biological reactors was at a level of 0.11–0.13 kg COD/(kg MLSS·d) (0.05–0.06 kg BOD5/(kg MLSS·d)). The sludge concentration and sludge retention time were at a level of 3–4 g MLSS/L and 16–20 days, respectively. The measurements of influent and effluent composition in WWTP (TSS, COD, Ntot, Ptot) as well as biomass characteristics, including Sludge Volumetric Index (SVI), were performed by the internal laboratory of the plant operator, AQUANET S.A., according to [30].
Activated sludge samples (4 L) were collected in about 2-month intervals from three identically operated aerobic chambers in the period from June 2021 to May 2022. In summary, seven samplings were performed from three reactors (21 separate sludge samples). The activated sludge samples were named Jun 21, Jul 21, Oct 21, Dec 21, Feb 22, Mar 22, and May 22 to reflect the month and year of sampling. In some downstream analyses, samples were further grouped by meteorological season, including autumn (Oct 21), summer (Jun 21, Jul 21), spring (Mar 22, May 22), and winter (Dec 21, Feb 22). After sampling, activated sludge was placed at 4 °C and immediately transported to the laboratory. The samples for molecular analysis were stored at −20 °C for further analysis, and EPS isolation was conducted immediately.

2.2. EPS Isolation and Polymer Characteristics

From activated sludge, SOL-, LB-, and TB-EPS were isolated [4,31]. SOL-EPS was separated by centrifuging 50 mL of well-mixed sludge sample directly after the collection of samples from the WWTP. Centrifugation was conducted at 4 °C for 15 min at 12,000× g (Mini Spin Micro Centrifuge, Eppendorf, Chiyoda, Tokyo). The supernatant containing SOL fraction was collected and stored at −20 °C until further analyses. To isolate the LB fraction of EPS, 50 mL of 1× PBS was added to the tube containing the pellet remaining after SOL-EPS isolation. The tube was then vortexed thoroughly (60 Hertz frequency; ZX3, Velp Scientifica) for 4 min and centrifuged at 4 °C for 15 min at 12,000× g (Eppendorf). The supernatant containing the LB fraction was collected and stored at −20 °C until further analyses. Again, 50 mL of 1× PBS was added to the tube containing centrifuged biomass from the LB-EPS isolation. The tube was placed in a container filled with ice to protect EPS from degradation from the excessive heat that could build up during homogenization. Homogenization was conducted for 4 min using IKA Ultra Thurrax (IKA, Staufen, Germany) at the lowest available speed (9500 rpm). The homogenized sample was transferred to the beaker containing 30 g of pre-washed ion exchange beads (Dowex, Merk, Darmstadt, Germany). The beaker was placed in a container with ice and isolated using aluminum foil. The sample was stirred with a magnetic stirrer bar at a constant mixing speed (500 rpm) for 4 h (IKA C-MAG HS 7). After incubation, the sample was centrifuged at 4 °C for 15 min at 12,000× g (Eppendorf). The supernatant containing the TB-EPS fraction was collected and stored at −20 °C until further analyses. The total quantity of extracted EPS was measured as total organic carbon (TOC)—the sum of dissolved (DOC) and particulate (POC) organic carbon—with an Elementary High TOC (Shimadzu TOC-L, Tokyo, Japan). In samples from each EPS fraction PN and PS were measured [4]. The number of PNs was estimated by the Lowry method reading the absorbance against a standard curve of a bovine serum albumin solution. The total PS content was estimated by the anthrone method, by measuring the absorbance against a glucose standard curve.
To isolate ALE, the modified method described previously by Lin et al. [32,33] was used. Briefly, 2 g of biomass was homogenized for 4 min at 13,500 rpm (IKA Ultra Thurrax). Next, the homogenized sample was incubated in a water bath at 70 °C for 1 h in 100 mL of 0.2 M Na2CO3. After extraction, the sample was centrifuged at 4 °C for 20 min 12,000× g (Eppendorf). After centrifugation, the pH of the collected supernatant was adjusted to 2 using 1 M HCl. The sample was centrifuged as previously. Next, the collected precipitate was dissolved in 0.1 M NaOH using a vortex shaker (60 Hertz frequency; ZX3, Velp Scientifica, Usmate Velate, Italy). Finally, cold EtOH was added to the sample (80% vol/vol) and the sample was centrifuged at 4 °C for 20 min at 12,000× g (Eppendorf). The precipitate was frozen at −20 °C and freeze-dried. ALE recovered from the previous step was fractionated based on the methodology described by [33]. Freeze-dried ALE (250 mg) was dissolved in 25 mL of water and heated at reflux with 0.75 mL of 3.0 M HCl for 20 min. After cooling, the solution was centrifuged for 15 min at 3000× g (Eppendorf). The supernatant was neutralized with 1.0 M NaOH. The precipitate resulting from pouring neutralized supernatant from the previous step over 100 mL of EtOH was dissolved in distilled water and freeze-dried (Fraction 1). The precipitate from the first step was once again heated at reflux with 0.3 M HCl for 2 h. After cooling and centrifugation, the supernatant was neutralized and poured over 100 mL of EtOH; the obtained precipitate was dissolved in distilled water and freeze-dried (Fraction 2). Fraction 3 was obtained by first neutralizing the precipitate with 1.0 M NaOH and then decreasing pH to 2.85 with the addition of 1.0 M HCl. The obtained precipitate was dissolved in distilled water and freeze-dried. Based on the weight of each fraction after freeze-drying, the ratio between fractions was determined. According to Haug et al. [34], Fraction 1 of HCl-hydrolyzed sodium alginate is mainly composed of heteropolymeric blocks (MG), fraction soluble at pH 2.85 is enriched in polymannuronic acid (MM, Fraction 2), and finally Fraction 3 is enriched in polyguluronic acid (GG). To confirm that the extracted compounds were alginate chains, chemical identification was performed according to the FAO/WHO [35]. Additionally, UV–visible spectroscopy was applied to compare pure sodium alginate (Sigma-Aldrich, St. Louis, MO, USA) with ALE extracted from waste-activated sludge.

2.3. Microbiological Analysis

DNA was extracted with FastDNA Spin kit for soil (MP Biomedicals, Thomas Irvine, CA, USA). Samples were thawed at room temperature, and then 200 mg of semi-dry biomass obtained by short centrifugation was re-suspended in a bead solution. Bead beating was performed at maximum speed in a Uniequip device (Uniequip, Planegg, Germany) for 5 min [36]. All extraction conditions were conducted in duplicates. The quality of the extracted DNA was evaluated with agarose gel electrophoresis, and DNA concentration was measured fluorometrically with Quant-iT BR DNA Assay (Thermo Fisher Scientific, Waltham, MA, USA).
The taxonomic composition of the analyzed samples was determined by sequencing the V3–V4 hypervariable regions of the 16S rRNA gene. High-throughput Illumina sequencing was performed with 341F (5′-CCT ACG GGN GGC WGC AG-3′) and 785R (5′-GAC TAC HVG GGT ATC TAA TCC-3′) primers [37] and Q5 Hot Start High-Fidelity 2X Master Mix following the manufacturer’s manual. The sequencing reaction was performed on a MiSeq sequencer with a MiSeq Reagent Kit v3 (Illumina, San Diego, CA, USA), applying pair-end technology with a read length of 300 base pairs. Raw demultiplexed reads were trimmed to remove adapters and primers using the Cutadapt [38] implemented in the QIIME2 software package [39], and quality filtered using the DADA2 plugin [40]. Amplicon sequence variants (ASVs) were determined using the denoise-paired method. The resulting ASV tables were filtered to exclude non-bacterial, mitochondrial, chloroplast, ASVs without a phylum assignment, and contaminant ASVs. Different taxonomic levels were assigned to the ASVs using the plugin feature-classifier [41] against the Silva (138 release) 16S rRNA reference database [42]. Alpha diversity metrics (observed ASVs, Margalef, Shannon, Simpson, and Chao1) were calculated using scikit-bio Python package (0.5.8). Linear discriminant analysis (LDA) effect size (LEfSe) was used to identify biologically and statistically significant differences in the relative abundance of ASVs [43].

2.4. FT-IR

Fourier transform infrared attenuated total reflectance (FT-IR/ATR) spectra were recorded in the 4000–400 cm−1 range, resolution 4 cm−1, at room temperature using Nicolet 6700 spectrometer and Meridian Diamond ATR accessory (Harrick, Pleasantville, NY, USA) to identify the functional groups associated with the isolated EPS fractions and ALE. For the analysis, a mixture of polymers isolated from activated sludge from 3 reactors was taken. Such mixtures were prepared from samples taken in all four seasons. Samples were directly applied onto the diamond crystal, and close contact was made with the surface by a pressure tower. Interferograms of 512 scans were averaged for each spectrum. Dry potassium bromide (48 h, 105 °C) was used as a reference material to collect ATR spectra. All ATR spectra were corrected for water vapor and carbon dioxide and ATR correction was applied. No smoothing functions were used. All spectral measurements were performed at least in triplicate.

2.5. Statistics

The differences in the content of PN, PS, TOC, DOC, and POC in EPS fractions, as well as an amount of recovered ALE, were compared using either log-transformed data in one-way ANOVA followed by Tukey’s HSD test or one-way Kruskal–Wallis H tests followed by Dunn’s z-test with Bonferroni correction. For that purpose, SciPy (1.11.4) from Python package was used. Pearson correlation was computed using ‘cor’ R function (4.3.2) and visualized using ‘corrplot’ library (0.92) with hierarchical clustering order. To construct a 2D PCA graph, scikit-learn (0.24.1) and matplotplib (3.3.2) from Python packages were used. Briefly, the data were standardized with scikit-learn StandardScaler, transformed into two dimensions, and plotted as a scatterplot. To further enhance the readability of the graph, the plot was manually edited in GIMP (2.10.32); i.e., corresponding data points were joined using straight lines of the same color. Values of p and p-adjusted < 0.05 were considered significant.

3. Results

3.1. Technological Results

The effect of temperature in the biological reactors on the EPS quantity and composition as well as the microbial structure of the activated sludge was investigated. The highest average temperature was measured in July 2021 and the lowest in February 2022 (Supplementary Materials, Figure S1), but the difference between the average temperatures in these months was only 7.5 °C, which is lower than in other Polish WWTPs in similar geographical locations [44]. The small amplitude of temperature changes in the investigated WWTP can be explained by a constant flow of high volumes of wastewater (100,000 m3/d), which reduces the risk of sudden temperature changes and stabilizes the environmental conditions in the reactors.
The investigations at the plant lasted one year, during which the operation of the treatment plant was monitored by the laboratory located at the treatment plant, the investigations were carried out daily, and no disturbances in the operation of the treatment plant were reported during the investigation period that would have led to significant changes in the operation of the reactors. In the present study, data from the week before the samples were taken for the tests were presented providing a clear representation of the general trends and values observed for the main pollutant indicators throughout the study year. The operation of the WWTP ensured that pollutant concentrations in the effluent were low (Figure 1). The efficiency of COD removal was 96.4 ± 0.6%; the efficiencies of BOD5, TSS, and ammonium nitrogen removal were 99%; and that of Ntot removal was 93.0 ± 0.8%. The obtained treatment efficiencies ensured the very high quality of the treated wastewater fulfilling the legal requirements regarding the discharged wastewater for the investigated plant through the whole investigation period. The Ptot removal efficiency averaged 97.0 ± 1.9%, but in December 2021, the Ptot concentration in the treated wastewater increased to nearly 0.8 mg/L (Figure 1d) and the removal efficiency decreased to about 93%. In the colder seasons (winter and spring), TSS concentrations in the effluent were nearly two times higher than in the summer months (Figure 1b). In the investigated period, concentrations of ammonium nitrogen and BOD5 in the effluent were below 2.3 and 6 mg/L.
The SVI in the reactors was relatively high (over 200 mL/g MLSS) and indicated that the biomass was overgrown with filamentous microorganisms, which was also confirmed by the results of molecular studies. Lower SRT favors increased EPS production [24]; however, in this study, there were no significant differences between SRT in the investigated bioreactors; SRT varied from 16 to 20 d, with the lowest values in the spring of 2022 (Figure 1f). The biomass concentration (X) in the reactors averaged 3.5 g MLSS/L, except on December 21, when it increased to nearly 4.5 g MLSS/L (Figure 1g). Increased concentrations of MLSS in cold seasons compensated for the lower activity of microorganisms inhabiting the biomass in low temperatures. Volatile suspended solids make up about 75–79% of MLSS, which is typically observed in municipal WWTPs. The content of ALE in the activated sludge was 55–60 mg/g MLSS. However, it dropped to about 40 mg/g MLSS in the samples collected at the hottest time (Jul 21) (Figure 1h). The content of ALE in biological reactors depends on the type of biomass used. A much higher content is observed in immobilized biomass such as aerobic granular sludge, in which ALE can make up as much as 20–30% of the biomass, depending on the operational parameters of the process [13,45]. For activated sludge, it was reported that ALE can be extracted in an amount corresponding to 9–19% of VSS [46]. However, the number and size of WWTPs operated with activated sludge technology show that it still makes economic sense to extract biopolymers from waste-activated sludge, even if their content is lower than in other types of biomass.
PNs are the main component of EPS, and the positively charged amino groups in PN neutralize the negative charges of uronic acid, PS, carboxylic acid in DNA, and phosphate groups [47]. As a result, the presence of PN alters the surface properties of the sludge and promotes cohesion between aggregates to create a dense, stable structure in the activated-sludge flocs [48]. Analysis of SOL-EPS indicates that levels of PN were highest in the transition period from spring to summer, with a peak on May 22 (15.90 mg/g MLSS), while PSs were nearly absent at this time (maximum of 2.84 mg/g MLSS on Jul 21) (Figure 2). The average PN/PS ratio for this fraction was 17.9. In LB-EPS, the concentrations of PS and PN were relatively stable and more balanced, with an average PN/PS ratio of about 1.4. In the LB fraction, levels of PN were significantly higher on Jun 21, Jul 21, and Dec 21 (8.14, 8.15, 9.56 mg/g MLSS) than on Feb 22 (4.10 mg/g MLSS) (Tukey’s HSD test, p = 0.01, 0.014 and 0.002, respectively. The PS level in LB-EPS tended to be about 7 mg/g MLSS, except for a drop to 2.09 mg/g MLSS on Jun 21 (Figure 2).
Each EPS fraction in the aerobic granular sludge is characterized by different microenvironmental conditions, and TB-EPS is crucial for maintaining stable conditions in the biomass to ensure the growth of sensitive bacterial species [8]. In the present study, higher temperatures favored high PN concentrations in TB-EPS and thus supported more efficient biomass aggregation [48]. In warmer months, PN varied between about 20 and 40 mg/g MLSS (22 May and 21 December, respectively) while on Feb 22 and Mar 22, when temperatures were around 15 °C, PN concentrations in TB-EPS were lower than 15 mg/g MLSS; all of these comparisons were statistically significant (p < 0.05, Tukey’s HSD test). The concentration of PS in TB-EPS followed the same trend as that of LB-TBS: for most of the year, it varied between 6.43 and 9.90 mg/g MLSS, but on Jun 21, it dropped below 4 mg/g MLSS. The PS concentration differed significantly between Jun 21 and Dec 21 (p = 0.018, Dunn’s z-test with a Bonferroni correction) and between Jun 21 and Feb 22 (p = 0.037, Dunn’s z-test with a Bonferroni correction).
The average PN/PS ratio of TB-EPS was 3.8, which was much higher than that of LB-EPS. The values of this ratio were higher in warmer months, contributing to increased AGS hydrophobicity, improved cell protection, and better communication between microorganisms [49,50].
Using the concentrations of PS and PN in EPS fractions as well as TOC, DOC, and POC in these fractions, a principal component analysis (PCA) was performed (Supplementary Materials, Figure S2). This indicated that the composition of polymers in activated sludge changed mostly during the transition period from winter to spring, probably as a result of metabolic adjustment to temperature changes [25]. In cold environments, bacteria produce EPS as a survival strategy because the presence of EPS significantly reduces cell lysis [51].
In Figure 3, the correlations between the PS content in LB- and TB-EPS or between ASVs and the Chao1 index appeared as expected. However, there are also some other less-expected dependencies. In this study, the high SVI was strongly negatively correlated with PSs in LB-EPS (Figure 3), indicating that the presence of PSs in the outer zone of the flocs supported agglomeration and good biomass settling, thus ensuring a low SVI. LB-EPSs cover the outer part of the flocs and directly influence agglomeration via the chemical groups on their surface. Our results indicate that the presence of PSs loosely associated with the biomass is crucial for the coalescence of flocs into larger agglomerates and effective sedimentation. As the temperature increased, the quality of the wastewater improved considerably in terms of TSS concentration (Figure 3). The temperature has a positive effect on the settleability of the sludge, as the viscosity changes [52]. In addition, at higher temperatures, protozoa, such as sedentary ciliates, are also more common in biomass, which contributes to the clarification of wastewater from small, suspended solids. The content of PN in SOL-EPS was correlated with an increase in the Margalef index. An increase in the SRT was associated with a decrease in PN in SOL-EPS, which can be explained by the fact that soluble PNs are consumed under low organic loadings, which is a characteristic of systems operated with a long SRT. In nitrification/denitrification systems, total inorganic nitrogen concentration from primary effluent was demonstrated to have a significant and direct relationship with EPS protein and overall EPS production [23]. Our study shows that the higher PN concentrations in the EPS fraction bound to biomass were correlated with lower total nitrogen concentrations in the treated wastewater. It can be assumed that the availability of PN on the floc surface promoted higher efficiency of total nitrogen removal by microorganisms, probably by stimulating denitrification. Previous studies suggest that PN-like substances excreted by microorganisms contribute to total nitrogen removal [53]. EPS contains many redox mediators and the presence of EPS in biomass increases the activity of the electron transport system and key enzymes related to glycolysis and yield of nicotinamide adenine dinucleotide, which increases the denitrification rate [54].

3.2. Analysis of Sludge Bacterial Community

The bacterial community of activated sludge was analyzed using 16S rRNA sequences. The average number of reads in a single sample was 80,538 (ranging from 73,863 to 84,760), and the Good’s coverage values were above 99.26%. ASV numbers ranged from 3174.00 to 3389.00, and the average number of ASVs was 3281.00. The indices of alpha diversity and the percentage abundance of particular phyla and classes are shown in detail in the Supplementary Materials (Figure S3 and Figure S4, respectively). At the phylum level, bacteria belonging to Proteobacteria (25.92% ± 2.36), Bacteroidota (16.42% ± 1.65), Actinobacteriota (15.75% ± 2.53), and Chloroflexi (14.04% ± 3.07) were most common. Less abundant were Patescibacteria (7.75% ± 2.00), Myxococcota (4.98% ± 0.82), Acidobacteriota (2.57% ± 0.82), Verrucomicrobiota (2.38% ± 0.28), and Planctomycetota (2.13% ± 0.61). Bacteria from the other phyla accounted for less than 2% of all bacteria. The bacterial structure indicated that, in activated sludge, not only EPS-producers (e.g., β-Proteobacteria [55]) but also microbes that degrade EPS and soluble microbial products, such as Chloroflexi [56] or Bacteroidota [57], were present.
Generally, the most abundant microorganism in activated sludge was filamentous Candidatus Microthrix (6.25% ± 3.10) (Figure 4). The high abundance of Microthrix sp. explains the fact that the SVI (Figure 1e) was above the values observed in most WWTPs—clear wastewater of good quality is normally produced with an SVI of 100 to 200 mL/g MLSS. Excessive growth of filamentous microorganisms leading to a high SVI is dangerous for the operation of biological reactors and can lead to sludge foaming and hinder biomass separation in secondary clarifiers. Sludge bulking is also unfavorable for EPS production [58]. During sludge bulking, the EPS content in sludge gradually decreased from 210.23 mg/g volatile suspended solids (VSS) to 131.34 mg/g VSS and the PN/PS ratio of EPS decreased. Changes in the amount and composition of EPS hindered bacterial aggregation and resulted in a loose floc structure and poor settling performance. On the other hand, in this study, Candidatus Competibacter was abundant (3–4%) in the activated sludge throughout the year (Figure 4). This glycogen-accumulating organism can efficiently produce EPS and thus supports bacterial aggregation. Analysis of representative genomes of Ca. Competibacter revealed their functional potential for EPS production—the more than 40 annotated functional gene categories illustrated the complexity of EPS metabolic networks from monomer processing to assembly, export, and epimerizations [59] Since lowering the SRT is one of the most efficient means to reduce filament abundance, shortening the SRT in the presented WWTP should be considered to improve biopolymer production and content in activated sludge. Other common genera in activated sludge were uncultured species from Caldilineaceae and Saprospiraceae (4.52 ± 0.63 and 4.49% ± 1.11, respectively). Uncultured bacteria from Chitinophagales (3.16% ± 1.16) and Saccharimonadales (2.79% ± 1.01) were also relatively common. Bacteria from other genera were less common (<2.0% of all bacteria).
The linear discriminant analysis effect size (LEfse) method was used to compare the abundance of specific bacterial taxa in samples collected during periods with different temperatures (Supplementary Material Figure S5). For this reason, samples from Jun 21, Jul 21, and Oct 22, when the temperature in the biological reactors was above 20 °C, were joined together to create a summer group. Similarly, samples from Dec 21, Feb 21, and Mar 22, when the temperature in the reactors was below 17 °C, were combined to create a winter group. LEfSe indicated that three bacterial ASVs significantly contributed to differences in the activated sludge bacterial community depending on the temperature. A reduced abundance of uncultured bacteria from the Roseiflexaceae family was a discriminative feature identified in the summer group. The Roseiflexaceae family contains thermophilic phototrophic bacteria isolated from terrestrial hot springs [60], and Roseiflexus sp. are filamentous bacteria with optimal growth at temperatures between 45 and 55 °C. Increased abundance of Trichoccus sp. and Flavobacterium sp. were two discriminative features identified in the winter group. Most Flavobacterium sp. are psychrotolerant rather than psychrophilic and grow well at 4 °C [61]. They have a marked preference for low salinity, cool to cold environments, and are commonly isolated from polar lakes and rivers, lakes, and soils in other cold environments. Similarly, analysis of the physiology of Trichococcus sp. Pikuta and Hoover [62] have shown that their growth is optimal at 20–30 °C, but some species (e.g., T. collinsii or T. patagoniensis) can survive at −5 °C. Analysis of the genomes of Trichococcus sp. revealed the presence of genes encoding functions related to tolerance and genes encoding for cold shock domains [63].
In our study, the 50 ASVs with the highest abundance were included in a principal component analysis (PCA) along with technological parameters. The PCA score plot and loadings derived from the PCA analysis are shown in Supplementary Material Figure S6, in which ASVs belonging to the same phylum are indicated with the same color. The first two principal components explain about 47% of the variance. Although the points were distributed quite evenly over the entire area, two clusters could be distinguished. The first one consists of SRT with the following ASVs: 3 (Caldilineaceae_uncultured), 12 (Actinobacteria_PeM15), 19 (Anaerolineae_a4b), 23 (Anaerolineaceae_unclutured), 25 (Chloroflexi_OLB14), 30 (Defluviicoccus), 34 (Burkholderiales_SC-I-84), 42 (Nocardioides), 45 (Planctomycetota_M190), and 50 (CL500-29 marine group from Ilumatobacteraceae). The second cluster connects ALE content in activated sludge with the abundance of two ASVs—26 (Nitrospira) and 27 (NS9 marine group). Most nitrifying bacteria do not produce enough EPS and can barely achieve self-immobilization. The sensitivity of nitrifiers to environmental conditions means that ALE/EPS are crucial for these microbes because these substances protect them, contributing to their adaptation and the long-term stability of nitrogen removal processes in activated sludge. Microorganisms belonging to both Nitrospira sp. and NS9 marine groups that were identified in our study can effectively produce EPS [64,65]. The correlation between their abundance and production of ALE supports the importance of those nitrogen-converting microorganisms for biopolymer generation.

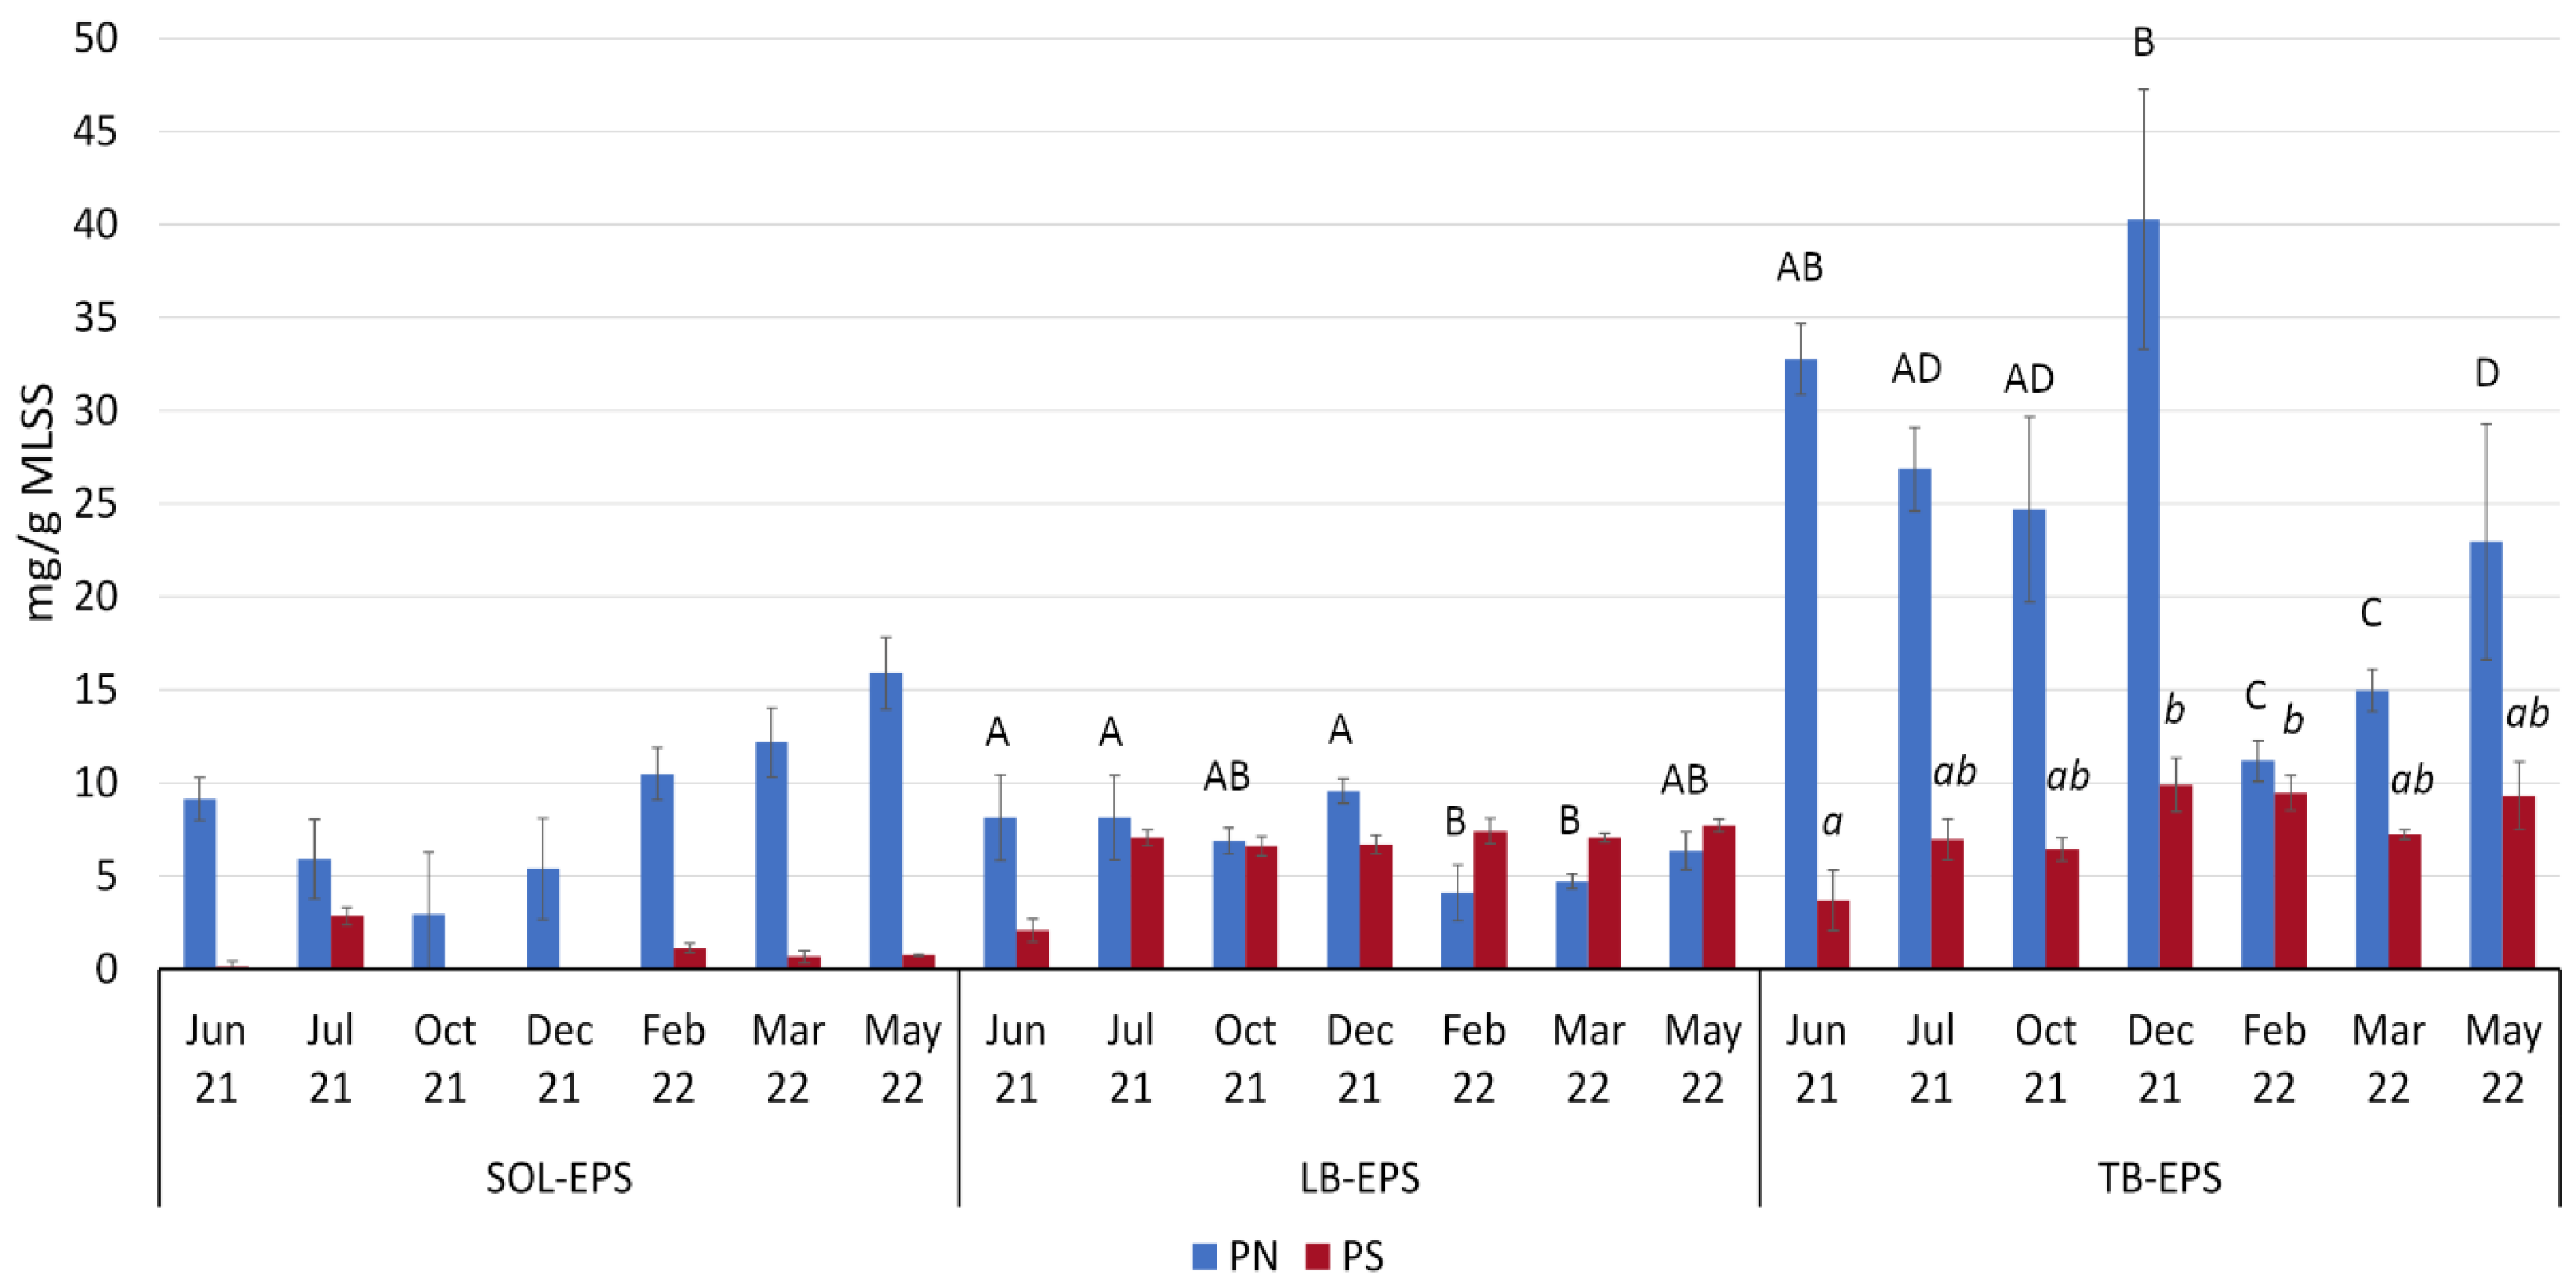
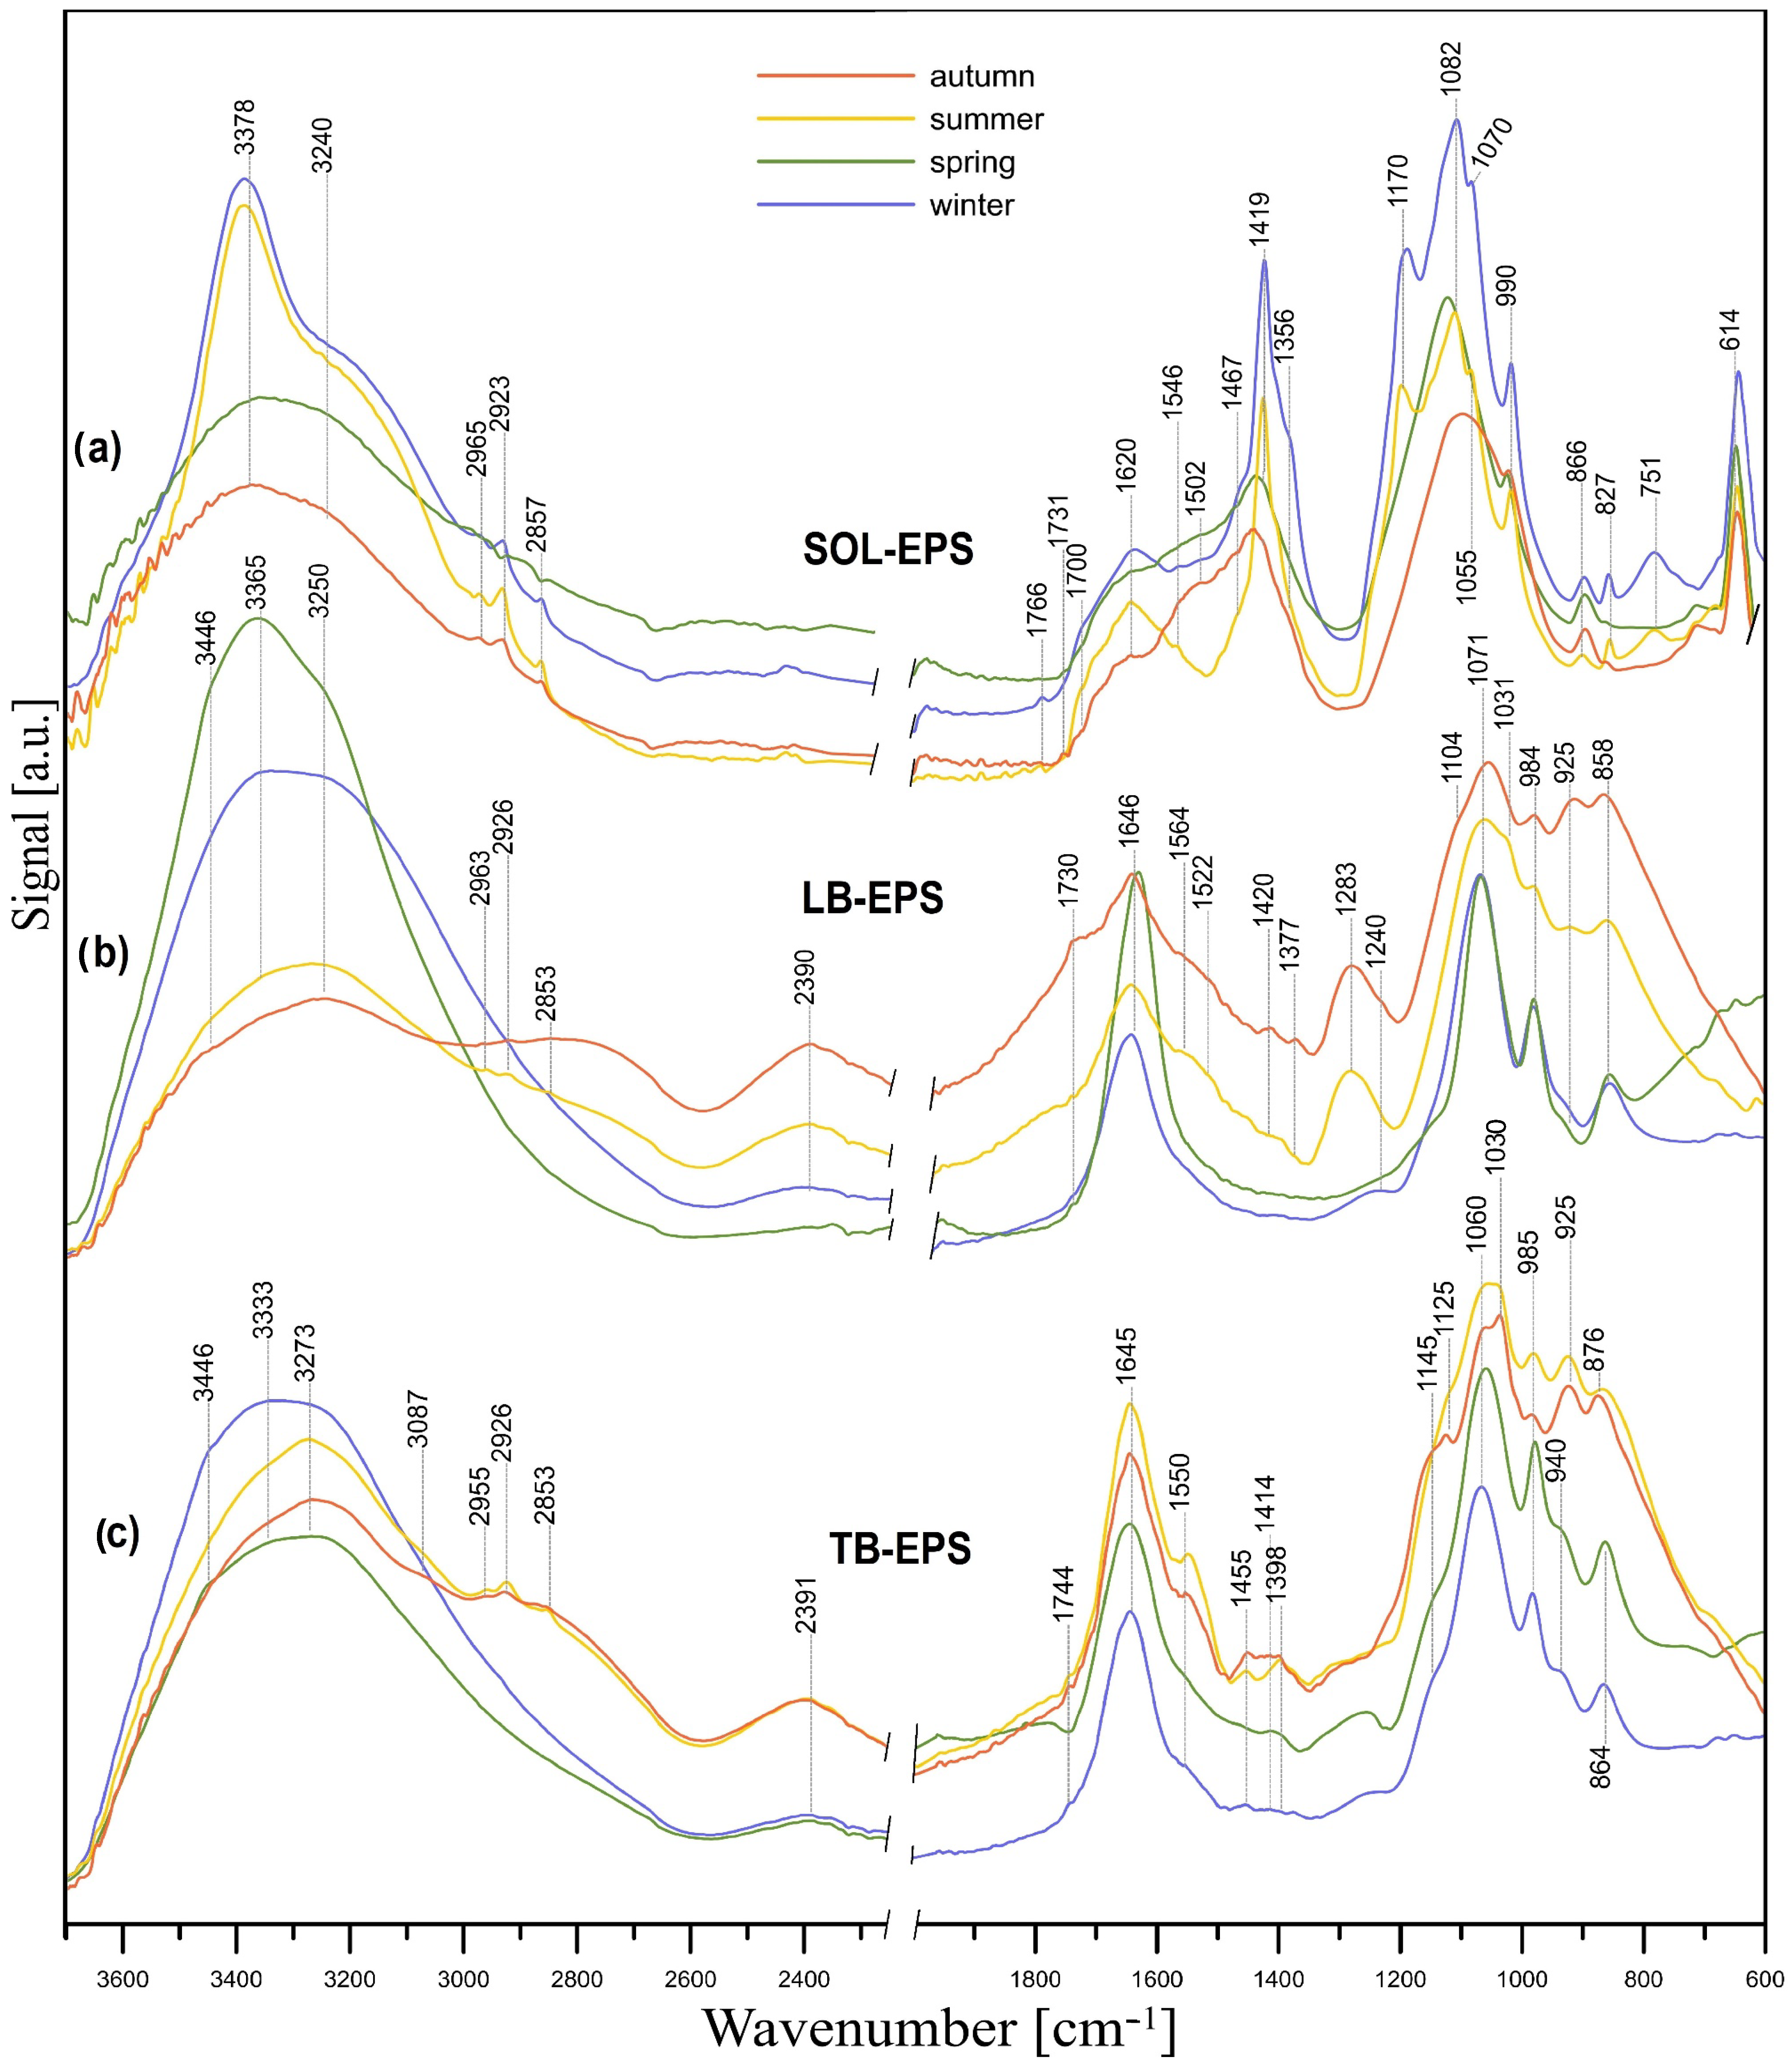
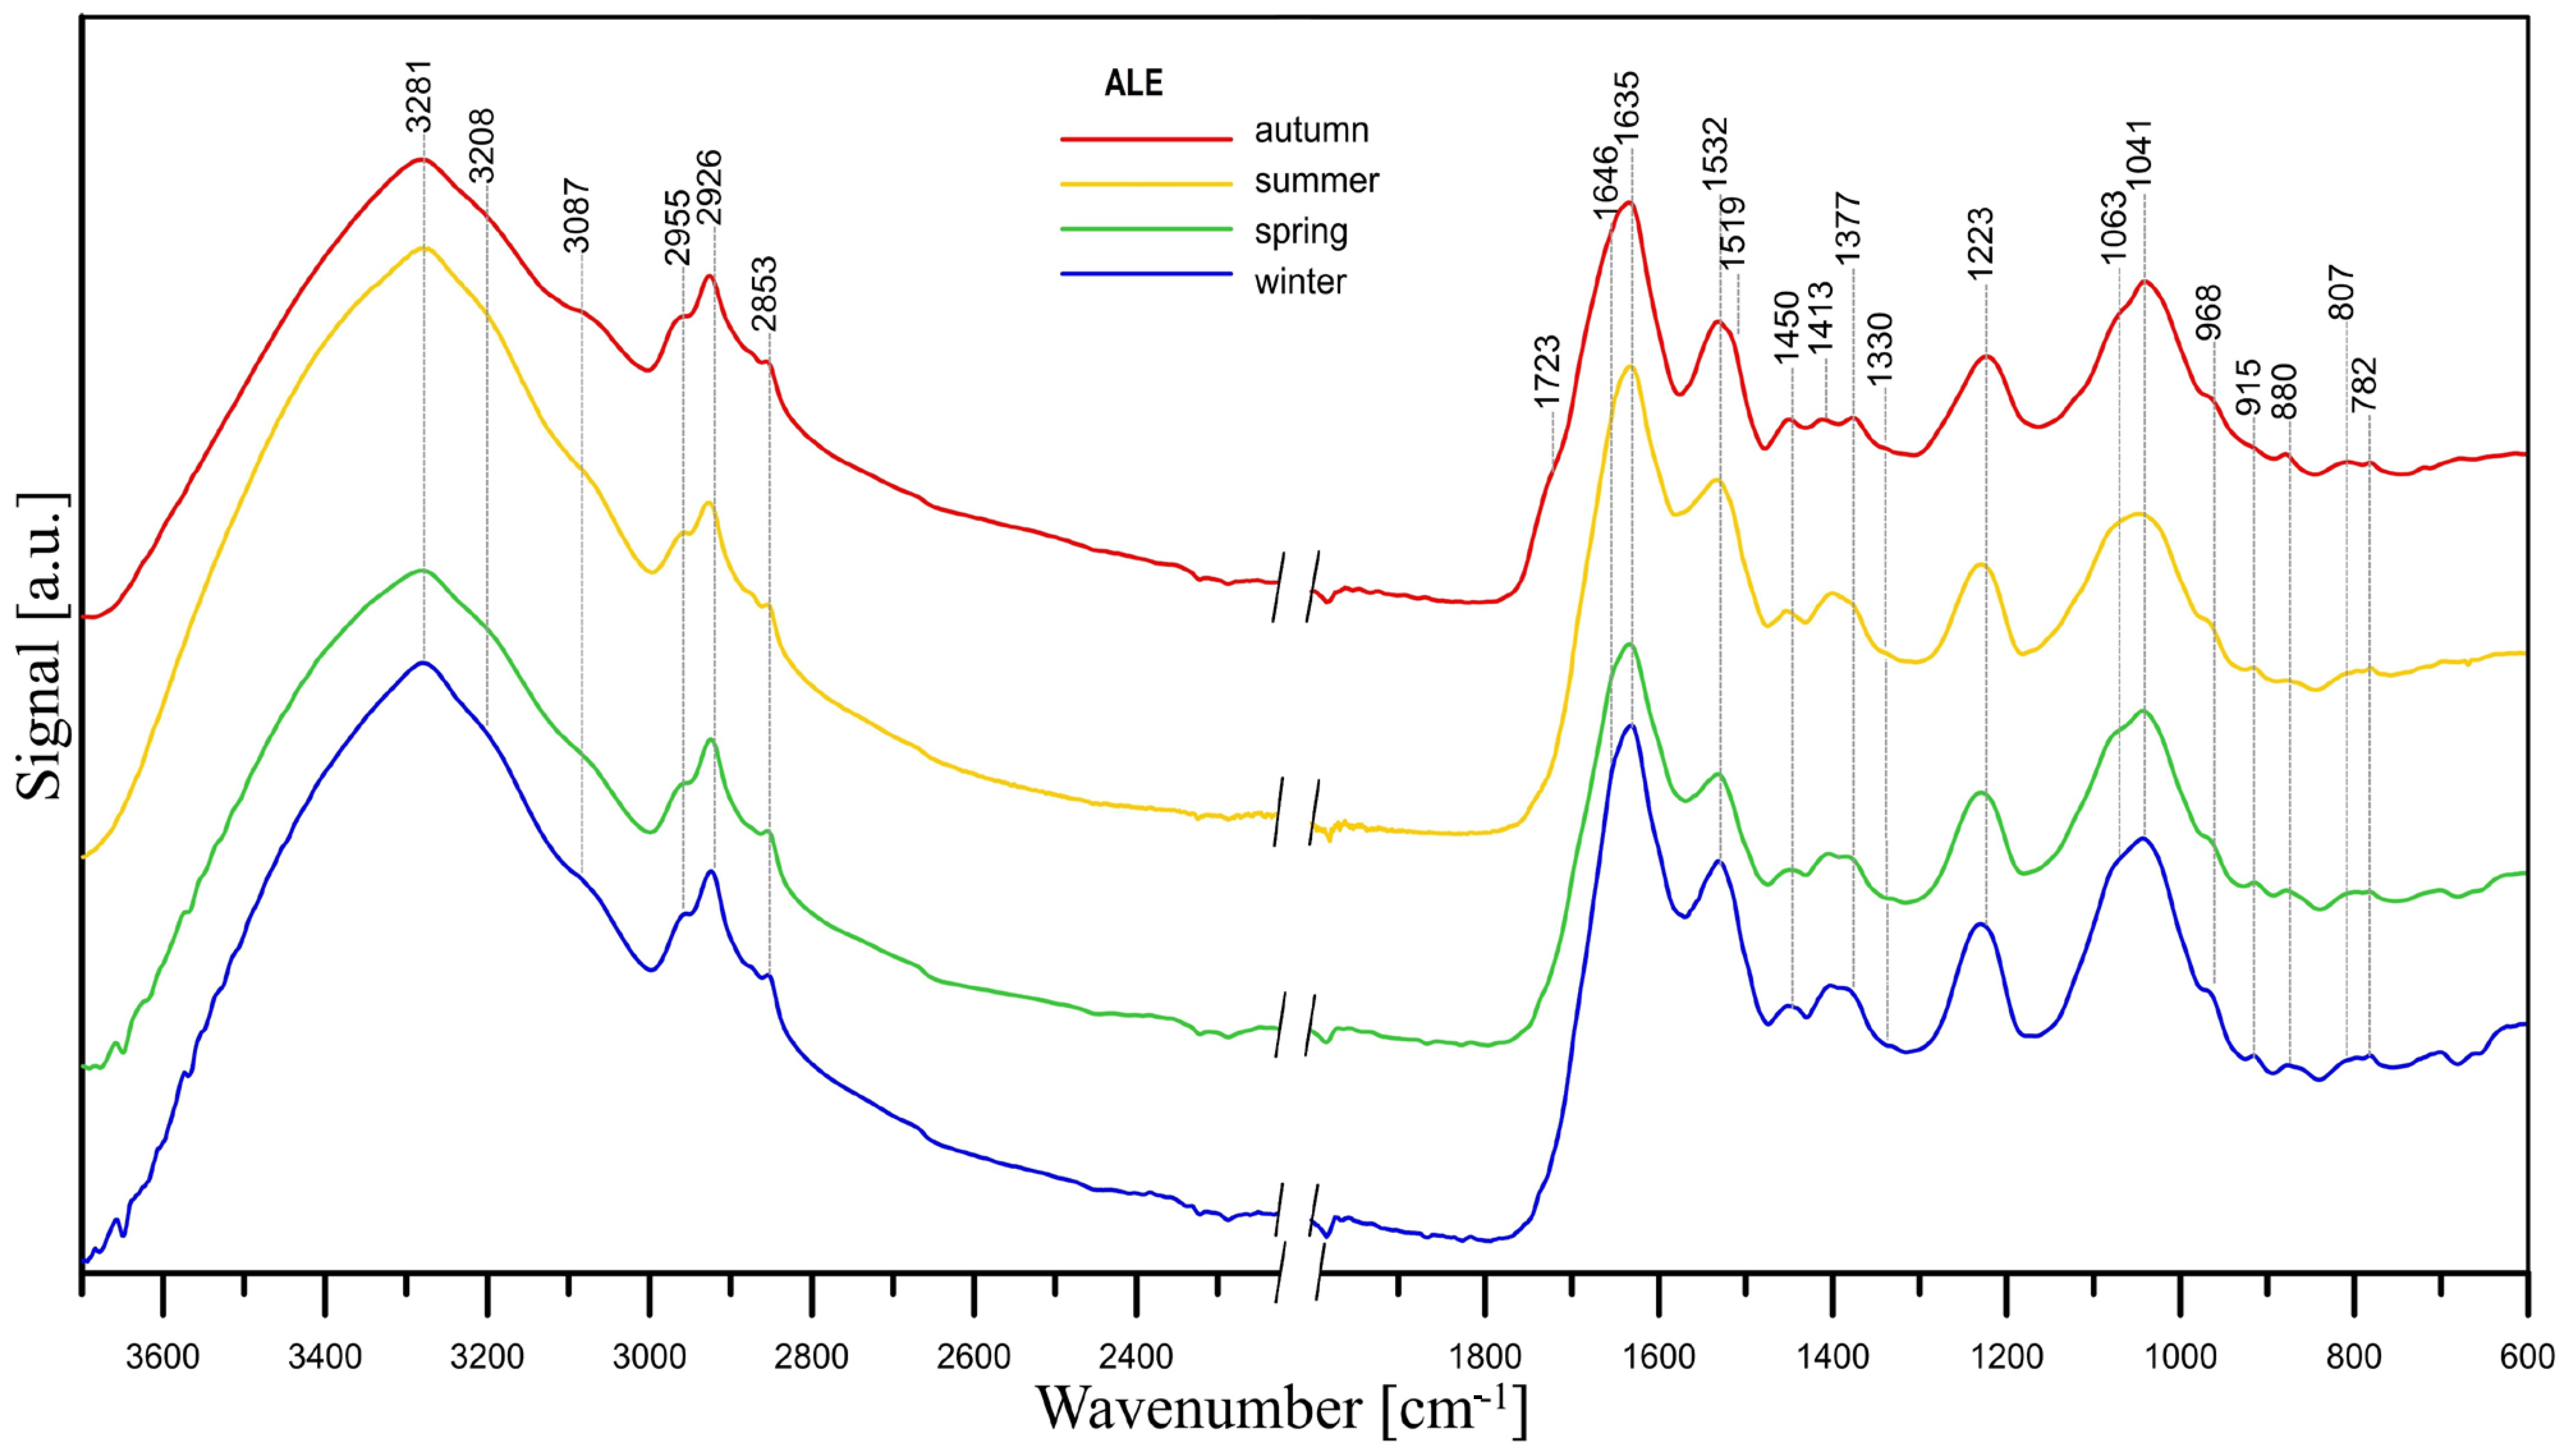
3.3. Biopolymer Characteristics

The FT-IR/ATR analysis of SOL-, LB-, and TB-EPS revealed that all the spectra contained bands typical of PSs, PNs, and lipids, the amounts of which vary depending on the season. Figure 5a presents the FT-IR/ATR spectra of SOL-EPSs that were acquired during four seasons (winter, spring, summer, and autumn). The content of PSs was lowest in spring and autumn, as shown by lower intensity or lack of the bands within 1200–900 cm−1 (C-O, C–O–C, and C–OH stretching in PSs [66]) and within 900–700 cm−1 (characteristic for pyranose and furanose rings as well as α- and β-glycosidic bonds in PSs [67]) in relation to the spectra of SOL-EPSs acquired during winter and summer. SOL-EPSs contained more lipids in summer and winter than in spring and autumn when PNs were more abundant. Evidence for this conclusion is provided by the higher intensity of the bands within 2965–2857 cm−1 and at 1419 cm−1 (C-H in hydrocarbon chains in lipids), the presence of the bands at 1170 and 990 cm−1 (P=O stretching and P–O–C antisymmetric stretch in phospholipids, respectively). Evidence of a larger amount of protein in SOL-EPSs obtained in spring and autumn is the amide II band at ~1500 cm−1 (N-H deformation and C-N stretching vibration in PN). Other results indicating the presence of PSs, PNs, and lipids are given in the Supplementary Materials.
The FT-IR spectra of LB-EPS are presented in Figure 5b. LB-EPSs obtained in summer and autumn contained more lipids, phospholipids, and PN than those obtained in winter and spring, which consisted mainly of PSs. In the spectra of LB-EPSs obtained in summer and autumn, vibrations of the C-H groups characteristic for lipids (2963–2853, 1420–1377 cm−1) are visible, which in turn are practically absent in the other two spectra. The same applies to the bands of C=O groups in lipids and PNs (1730, 925 cm−1), amide stretching in PNs (1562 cm−1, 1522 cm−1, 1283 cm−1), and P=O groups vibrations in phospholipids (2390, 1240, 984, 925 cm−1).
A similar situation occurs in the case of TB-EPS (Figure 5c), although the bands indicating the presence of PN (amide II band at 1550 cm−1) are much more pronounced and intense than in the case of the SOL- and LB-EPS samples. These bands corresponding to PN have higher intensity in the TB-EPS spectra obtained in summer and autumn, indicating a greater amount of these compounds at those times. A more detailed discussion of the results presented in Figure 5 can be found in the Supplementary Materials [66,67,68,69,70,71,72,73].
The gelling properties of ALE extracted from activated sludge were confirmed by a dropwise addition of ALE solution to CaCl2 solution (Figure S7a, Supplementary Materials). The extracted ALE showed an extra peak in absorbance at ~270 nm wavelength in comparison with chemically pure ALE, indicating that it was not uniform; i.e., it contained a mixture of chemically variable ALE or impurities such as humic substances (Figure S7b, Supplementary Materials). The FT-IR/ATR spectra of ALE extracted from activated sludge reveal the presence of PS and PN (Figure 6). As can be seen, the band positions and intensities are similar across seasons, which suggests that there are no significant changes in the chemical composition of ALE during the year. There might be a slight difference in the proportion of guluronic and mannuronic acid residues depending on the season, as suggested by the intensity of the guluronic acid bands (968, 915 cm−1) and mannuronic acid bands (880, 810 cm−1) [71]. Additionally, the spectrum of the ALE obtained in autumn is slightly different from the other ALE spectra: the weak band at ~3087 cm−1 (C-H vibration in vinyl =CH2 group and/or N-H stretching vibration) has the highest intensity, as do the bands at ~1413 cm−1 (C-OH) and 1723 cm−1 (COOH). The proportions between the guluronic and mannuronic acid bands in the autumn ALE spectrum are also different compared to the spectra of ALE obtained in other seasons. Namely, the mannuronic acid bands (880, 810 cm−1) are slightly more intense than the guluronic acid bands (968, 915 cm−1). Moreover, the shoulder at ~1723 cm−1, which is characteristic of C=O symmetric stretching in carboxylic acids and/or esters, is most clearly visible in the autumn spectrum. A more detailed description of the individual bands in the spectra presented in Figure 6 can be found in the Supplementary Materials [26,66,71,72,74,75,76,77,78,79,80,81].
Slight changes in ALE composition in terms of guluronic and mannuronic acid residues were confirmed by ALE fractionation (Figure 7). Our results showed that autumn ALE had a slightly higher proportion of MM blocks (6% by weight) compared to other seasons (4% in winter and spring, 5% in summer). There were minimal differences in the content of MG blocks in the ALE autumn, spring, and winter samples (44 to 45%), and only the summer sample had a lower percentage of MG blocks (41%). This sample had also the highest percentage of GG blocks (54%). Previous studies reported that ALE composition differs depending on the substrate used for isolation, the geographical location, and also the season [82]. The smaller differences in ALE composition between seasons observed in this study can be explained by the stability of the treatment process, the operational parameters, and the low amplitude of changes in wastewater temperature during the year in the large WWTP. According to Zhang et al. [83], the stiffness of ALE is determined by its content of GG blocks, and its gel-forming ability is determined by its content of MG blocks. The main component of the ALE obtained in this study was GG blocks (up to 54%), followed by MG blocks. Thus, it can be concluded that the ALE in this study had good gel-forming capability and mechanical properties [84]. A comparison of the UV–Vis spectra of pure alginate and sludge-derived ALE showed that the recovered ALE contained impurities, probably humic acids, which were responsible for the brownish color of the extracts. Such impurities have different active groups in their structure and are not problematic if the ALE is to be used as a sorbent, for example. The current trend in the use of ALE is to improve its mechanical and biological properties, e.g., by strengthening the structure or by adding biological additives for additional antimicrobial properties [85]. The physicochemical properties of ALE can also be improved by grafting with polyethyleneimine. This procedure increases ALE adsorption capacity as a result of an increment in the specific surface area and an increase in the number of active binding sites for heavy metal adsorption [86]. The ALE derived from activated sludge in this study appears to have balanced properties, with the added benefit of a widely available source and a relatively low cost of recovery, which could offset the cost of enhancements when delivering customized ALE.

4. Conclusions

EPS recovery from activated sludge can serve as part of a comprehensive strategy for utilizing wastewater in a circular economy. This study is the first to investigate the recovery and characteristics of biopolymers from activated sludge during the seasonal operation of a full-scale WWTP. It shed light on the relationship between seasonal temperature variations and the bacterial community of activated sludge in a large full-scale WWTP. The results indicate that ALE, which is the most promising biopolymer that can be recovered from AS, has stable physico-chemical properties throughout the year and comprises about 6% of the biomass. The size of this share means that full-scale recovery of ALE shows promise, considering the large quantities of waste-activated sludge produced around the world every day. The most pronounced changes in total EPS amount and composition were observed in the transition from winter to spring. Higher temperatures resulted in increased PN concentration and a higher PN/PS ratio in TB-EPS, which facilitated bacterial aggregation and influenced sludge settleability. The abundance of microorganisms belonging to Nitrospira sp. and the NS9 marine group in the biomass correlated with ALE content, suggesting the importance of this biopolymer for nitrogen-converting microorganisms.

Supplementary Materials

The following supporting information can be downloaded at: https://www.mdpi.com/article/10.3390/en17246231/s1, Figure S1: Changes in temperature in biological reactors during the study period (average of 3 reactors, n = 6000). Figure S2: Principal component analysis based on the content of PN, PS, TOC, DOC, and POC in three EPS fractions (SOL, LB, TB) and temperature. Figure S3: Alpha diversity metrics: a) total ASVs, b) Shannon index, c) Simpson index, d) Chao1 index, e) Margalef index of activated sludge samples obtained during the year. The color of each bar corresponds to the color used in Figure 5 of the manuscript. Figure S4: Bar chart of the abundance of a) phyla and b) classes in the analyzed samples at each sampling time. Only classes with a mean abundance of more than 1% are shown. The group of other bacteria corresponds to the sum of the unrecognized reads and the classes with low abundance. Figure S5: Linear discriminant analysis (LDA) effect size (LEfSe) results showing differences in abundance between summer (>20 °C) and winter (<17 °C) samples. Figure S6: Principal component analysis of the fifty most abundant ASVs grouped into ten phyla represented as dots (Actinobacteriota (orange), Chloroflexi (blue), Bacteroidota (green), Proteobacteria (yellow), Patescibacteria (navy), Myxococcota (red), Gemmatimonadota (pink), Nitrospira (dark gray), Firmicutes (light gray), Acidobacteriota (khaki), Planctomycetota (violet)) and the technological parameters and wastewater quality indices obtained from six time-points (black triangles: Temp.—temperature, SVI—sludge volumetric index, OLR COD—COD loading rate, SRT—sludge retention time, N—total nitrogen in the effluent, COD—COD in the effluent, PN—total PN content in EPS, PS—total PS content in EPS, ALE—content of alginate in activated sludge, NH4—ammonium in the effluent, BOD5—BOD5 in the effluent, P—total phosphorus in the effluent, X—concentration of activated sludge in the reactors). Figure S7: Characteristics of recovered ALE: a) gelling properties confirmed by a dropwise addition of ALE solution to CaCl2 solution, b) UV–visible spectroscopy results of pure sodium alginate (Sigma-Aldrich) and ALE extracted from waste-activated sludge.

Author Contributions

Conceptualization: A.C.-K., P.O.-P. and S.C.; data curation: M.F., A.C.-K., S.P.-P., W.P. and K.J.; formal analysis: M.F. and A.C.-K.; funding acquisition: P.O.-P., S.C. and A.C.-K.; investigation: M.F., A.C.-K., S.C. and S.P.-P.; methodology: A.C.-K., M.F., S.C. and S.P.-P.; resources: A.C.-K., S.C., S.P.-P. and M.K.-K.; software: M.F.; supervision: A.C.-K. and P.O.-P.; validation: M.F., A.C.-K. and S.C.; visualization: M.F., A.C.-K. and S.P.-P.; roles/Writing—original draft: A.C.-K., S.C. and M.F.; writing—review & editing: P.O.-P., S.P.-P. and M.K.-K. All authors have read and agreed to the published version of the manuscript.

Funding

The study was financed by Norway Grants 2014–2021 operated by the National Centre for Research and Development (Poland) under the project “Integrated system for SImultaneous Recovery of Energy, organics and Nutrients and generation of valuable products from municipal wastewater”, (POLNOR 2019, NOR/POLNOR/SIREN/0069/2019).

Data Availability Statement

The raw sequencing data generated during the current study are available in the SRA repository, under BioProject PRJNA1083778 [https://www.ncbi.nlm.nih.gov/bioproject/?term=PRJNA1083778 (accessed on 5 December 2024), National Library of Medicine, Bethesda, USA]. Other data are available from authors on request.

Conflicts of Interest

Authors Weronika Pomian and Kinga Jóźwiak were employed by the company AQUANET S.A. The remaining authors declare that the research was conducted in the absence of any commercial or financial relationships that could be construed as a potential conflict of interest.

References

  1. Schambeck, C.M.; Girbal-Neuhauser, E.; Böni, L.; Fischer, P.; Bessière, Y.; Paul, E.; da Costa, R.H.R.; Derlon, N. Chemical and Physical Properties of Alginate-like Exopolymers of Aerobic Granules and Flocs Produced from Different Wastewaters. Bioresour. Technol. 2020, 312, 123632. [Google Scholar] [CrossRef] [PubMed]
  2. Van Der Hoek, J.P.; De Fooij, H.; Struker, A. Wastewater as a Resource: Strategies to Recover Resources from Amsterdam’s Wastewater. Resour. Conserv. Recycl. 2016, 113, 53–64. [Google Scholar] [CrossRef]
  3. Adav, S.S.; Lee, D.-J. Extraction of Extracellular Polymeric Substances from Aerobic Granule with Compact Interior Structure. J. Hazard. Mater. 2008, 154, 1120–1126. [Google Scholar] [CrossRef] [PubMed]
  4. Rusanowska, P.; Cydzik-Kwiatkowska, A.; Świątczak, P.; Wojnowska-Baryła, I. Changes in Extracellular Polymeric Substances (EPS) Content and Composition in Aerobic Granule Size-Fractions during Reactor Cycles at Different Organic Loads. Bioresour. Technol. 2019, 272, 188–193. [Google Scholar] [CrossRef] [PubMed]
  5. Shen, R.; Sheng, G.-P.; Yu, H.-Q. Determination of Main Components in the Extracellular Polymeric Substances Extracted from Activated Sludge Using a Spectral Probing Method. Colloids Surf. B Biointerfaces 2012, 94, 151–156. [Google Scholar] [CrossRef]
  6. Cydzik-Kwiatkowska, A. Biopolymers in Aerobic Granular Sludge—Their Role in Wastewater Treatment and Possibilities of Re-Use in Line with Circular Economy. Energies 2021, 14, 7219. [Google Scholar] [CrossRef]
  7. Jachimowicz, P.; Jo, Y.J.; Cydzik-Kwiatkowska, A. Polyethylene Microplastics Increase Extracellular Polymeric Substances Production in Aerobic Granular Sludge. Sci. Total Environ. 2022, 851, 158208. [Google Scholar] [CrossRef]
  8. Rusanowska, P.; Cydzik-Kwiatkowska, A.; Wojnowska-Baryła, I. Microbial Origin of Excreted DNA in Particular Fractions of Extracellular Polymers (EPS) in Aerobic Granules. Water Air Soil. Pollut. 2019, 230, 203. [Google Scholar] [CrossRef]
  9. Li, X.Y.; Yang, S.F. Influence of Loosely Bound Extracellular Polymeric Substances (EPS) on the Flocculation, Sedimentation and Dewaterability of Activated Sludge. Water Res. 2007, 41, 1022–1030. [Google Scholar] [CrossRef]
  10. Nielsen, P.H.; Jahn, A. Extraction of EPS. In Microbial Extracellular Polymeric Substances; Springer: Berlin/Heidelberg, Germany, 1999; pp. 49–72. [Google Scholar]
  11. Cheng, M.; Shi, C.; Zhao, B.H.; Zhang, N.; Shen, Q.Y.; Hao, L.T.; Wang, X.Y. Recycling Alginate-like Extracellular Polymers (ALE) from Municipal Sludge: Value-Added Products and External Impact. Chem. Eng. J. 2024, 493, 152593. [Google Scholar] [CrossRef]
  12. Zeng, R.G.; Shi, C.; Hao, L.T.; Huang, A.; Yuan, T.; Zhang, N. A Review of Alginate-like Extracellular Polymers from Excess Sludge: Extraction, Characterization, and Potential Application. J. Water Process Eng. 2023, 56, 104346. [Google Scholar] [CrossRef]
  13. Chen, X.; Wang, J.; Wang, Q.; Yuan, T.; Lei, Z.; Zhang, Z.; Shimizu, K.; Lee, D.-J. Simultaneous Recovery of Phosphorus and Alginate-like Exopolysaccharides from Two Types of Aerobic Granular Sludge. Bioresour. Technol. 2022, 346, 126411. [Google Scholar] [CrossRef] [PubMed]
  14. Zahra, S.A.; Abdullah, N.; Iwamoto, K.; Yuzir, A.; Mohamad, S.E. Alginate-like Exopolysaccharides in Aerobic Granular Sludge: A Review. Mater. Today Proc. 2022, 65, 3046–3053. [Google Scholar] [CrossRef]
  15. Shahnavaz, B.; Maroof, S.; Karrabi, M.; Mashreghi, M. Characterization and Molecular Identification of Extracellular Polymeric Substance (EPS) Producing Bacteria from Activated Sludge. J. Cell Mol. Res. 2015, 7, 86–93. [Google Scholar]
  16. Nohua, K.; Yan, S.; Tyagi, R.D.; Surampalli, R.Y. EPS Producing Microorganisms from Municipal Wastewater Activated Sludge. J. Pet. Environ. Biotechnol. 2015, 7, 1000255. [Google Scholar]
  17. Cydzik-Kwiatkowska, A. Bacterial Structure of Aerobic Granules Is Determined by Aeration Mode and Nitrogen Load in the Reactor Cycle. Bioresour. Technol. 2015, 181, 312–320. [Google Scholar] [CrossRef]
  18. Paulo, A.M.S.; Amorim, C.L.; Costa, J.; Mesquita, D.P.; Ferreira, E.C.; Castro, P.M.L. Long-Term Stability of a Non-Adapted Aerobic Granular Sludge Process Treating Fish Canning Wastewater Associated to EPS Producers in the Core Microbiome. Sci. Total Environ. 2021, 756, 144007. [Google Scholar] [CrossRef]
  19. Pal, A.; Paul, A.K. Optimization of Cultural Conditions for Production of Extracellular Polymeric Substances (EPS) by Serpentine Rhizobacterium Cupriavidus pauculus KPS 201. J. Polym. 2013, 2013, 1–7. [Google Scholar] [CrossRef]
  20. Zisu, B.; Shah, N.P. Effects of PH, Temperature, Supplementation with Whey Protein Concentrate, and Adjunct Cultures on the Production of Exopolysaccharides by Streptococcus thermophilus 1275. J. Dairy Sci. 2003, 86, 3405–3415. [Google Scholar] [CrossRef]
  21. Bengoa, A.A.; Llamas, M.G.; Iraporda, C.; Dueñas, M.T.; Abraham, A.G.; Garrote, G.L. Impact of Growth Temperature on Exopolysaccharide Production and Probiotic Properties of Lactobacillus paracasei Strains Isolated from Kefir Grains. Food Microbiol. 2018, 69, 212–218. [Google Scholar] [CrossRef]
  22. Zeng, F.; Jin, W.; Zhao, Q. Temperature Effect on Extracellular Polymeric Substances (EPS) and Phosphorus Accumulating Organisms (PAOs) for Phosphorus Release of Anaerobic Sludge. RSC Adv. 2019, 9, 2162–2171. [Google Scholar] [CrossRef]
  23. Tseng, L.Y.; Gori, R.; Rosso, D. Effects of Activated Sludge Process Conditions on the Production of Extracellular Polymeric Substances: Results of Yearlong Monitoring in a Warm Climate. Environ. Eng. Sci. 2015, 32, 582–592. [Google Scholar] [CrossRef]
  24. Al-Halbouni, D.; Traber, J.; Lyko, S.; Wintgens, T.; Melin, T.; Tacke, D.; Janot, A.; Dott, W.; Hollender, J. Correlation of EPS Content in Activated Sludge at Different Sludge Retention Times with Membrane Fouling Phenomena. Water Res. 2008, 42, 1475–1488. [Google Scholar] [CrossRef] [PubMed]
  25. Cydzik-Kwiatkowska, A.; Gusiatin, M.Z.; Zielińska, M.; Wojnowska-Baryła, I.; Kulikowska, D.; Bernat, K. Alginate-like Polymers from Full-Scale Aerobic Granular Sludge: Content, Recovery, Characterization, and Application for Cadmium Adsorption. Sci. Rep. 2022, 12, 22260. [Google Scholar] [CrossRef] [PubMed]
  26. Lin, Y.; de Kreuk, M.; van Loosdrecht, M.C.M.; Adin, A. Characterization of Alginate-like Exopolysaccharides Isolated from Aerobic Granular Sludge in Pilot-Plant. Water Res. 2010, 44, 3355–3364. [Google Scholar] [CrossRef] [PubMed]
  27. van Leeuwen, K.; de Vries, E.; Koop, S.; Roest, K. The Energy & Raw Materials Factory: Role and Potential Contribution to the Circular Economy of the Netherlands. Environ. Manag. 2018, 61, 786–795. [Google Scholar] [CrossRef]
  28. Fan, X.-Y.; Gao, J.-F.; Pan, K.-L.; Li, D.-C.; Dai, H.-H. Temporal Dynamics of Bacterial Communities and Predicted Nitrogen Metabolism Genes in a Full-Scale Wastewater Treatment Plant. RSC Adv. 2017, 7, 56317–56327. [Google Scholar] [CrossRef]
  29. Liu, T.; Liu, S.; Zheng, M.; Chen, Q.; Ni, J. Performance Assessment of Full-Scale Wastewater Treatment Plants Based on Seasonal Variability of Microbial Communities via High-Throughput Sequencing. PLoS ONE 2016, 11, e0152998. [Google Scholar] [CrossRef]
  30. Greenberg, A.; Clesceri, L.; Eaton, A. (Eds.) Apha Standard Methods for the Examination of Water And Wastewater, 18th ed.; American Public Health Association American Water Works Association Water Environment Federation: Washington, DC, USA, 1992. [Google Scholar]
  31. Pellicer-Nàcher, C.; Domingo-Félez, C.; Mutlu, A.G.; Smets, B.F. Critical Assessment of Extracellular Polymeric Substances Extraction Methods from Mixed Culture Biomass. Water Res. 2013, 47, 5564–5574. [Google Scholar] [CrossRef]
  32. Lin, Y.M.; Wang, L.; Chi, Z.M.; Liu, X.Y. Bacterial Alginate Role in Aerobic Granular Bio-particles Formation and Settleability Improvement. Sep. Sci. Technol. 2008, 43, 1642–1652. [Google Scholar] [CrossRef]
  33. Leal, D.; Matsuhiro, B.; Rossi, M.; Caruso, F. FT-IR Spectra of Alginic Acid Block Fractions in Three Species of Brown Seaweeds. Carbohydr. Res. 2008, 343, 308–316. [Google Scholar] [CrossRef] [PubMed]
  34. Haug, A.; Larsen, B.; Smidsrød, O. Uronic Acid Sequence in Alginate from Different Sources. Carbohydr. Res. 1974, 32, 217–225. [Google Scholar] [CrossRef]
  35. FAO/WHO. Compendium of Food Additive Specifications. Addendum 5. (FAO Food and Nutrition Paper-52 add. 5) Joint FAO/WHO Expert Committee on Food Additives, 49th ed.; FAO: Rome, Italy, 1997. [Google Scholar]
  36. Florczyk, M.; Cydzik-Kwiatkowska, A.; Ziembinska-Buczynska, A.; Ciesielski, S. Comparison of Three DNA Extraction Kits for Assessment of Bacterial Diversity in Activated Sludge, Biofilm, and Anaerobic Digestate. Appl. Sci. 2022, 12, 9797. [Google Scholar] [CrossRef]
  37. Klindworth, A.; Pruesse, E.; Schweer, T.; Peplies, J.; Quast, C.; Horn, M.; Glöckner, F.O. Evaluation of General 16S Ribosomal RNA Gene PCR Primers for Classical and Next-Generation Sequencing-Based Diversity Studies. Nucleic Acids Res. 2013, 41, e1. [Google Scholar] [CrossRef]
  38. Martin, M. Cutadapt Removes Adapter Sequences from High-Throughput Sequencing Reads. EMBnet J. 2011, 17, 10. [Google Scholar] [CrossRef]
  39. Bolyen, E.; Rideout, J.R.; Dillon, M.R.; Bokulich, N.A.; Abnet, C.C.; Al-Ghalith, G.A.; Alexander, H.; Alm, E.J.; Arumugam, M.; Asnicar, F.; et al. Reproducible, Interactive, Scalable and Extensible Microbiome Data Science Using QIIME 2. Nat. Biotechnol. 2019, 37, 852–857. [Google Scholar] [CrossRef]
  40. Callahan, B.J.; McMurdie, P.J.; Rosen, M.J.; Han, A.W.; Johnson, A.J.A.; Holmes, S.P. DADA2: High-Resolution Sample Inference from Illumina Amplicon Data. Nat. Methods 2016, 13, 581–583. [Google Scholar] [CrossRef]
  41. Bokulich, N.A.; Kaehler, B.D.; Rideout, J.R.; Dillon, M.; Bolyen, E.; Knight, R.; Huttley, G.A.; Gregory Caporaso, J. Optimizing Taxonomic Classification of Marker-Gene Amplicon Sequences with QIIME 2’s Q2-Feature-Classifier Plugin. Microbiome 2018, 6, 90. [Google Scholar] [CrossRef]
  42. Quast, C.; Pruesse, E.; Yilmaz, P.; Gerken, J.; Schweer, T.; Yarza, P.; Peplies, J.; Glöckner, F.O. The SILVA Ribosomal RNA Gene Database Project: Improved Data Processing and Web-Based Tools. Nucleic Acids Res. 2012, 41, D590–D596. [Google Scholar] [CrossRef]
  43. Segata, N.; Izard, J.; Waldron, L.; Gevers, D.; Miropolsky, L.; Garrett, W.S.; Huttenhower, C. Metagenomic Biomarker Discovery and Explanation. Genome Biol. 2011, 12, R60. [Google Scholar] [CrossRef]
  44. Świątczak, P.; Cydzik-Kwiatkowska, A. Performance and Microbial Characteristics of Biomass in a Full-Scale Aerobic Granular Sludge Wastewater Treatment Plant. Environ. Sci. Pollut. Res. 2018, 25, 1655–1669. [Google Scholar] [CrossRef] [PubMed]
  45. Hao, X.; Li, H.; Yuan, T.; Wu, Y. Recovering and Potentially Applying of Alginate like Extracellular Polymers from Anaerobic Digested Sludge. Sci. Total Environ. 2023, 898, 165549. [Google Scholar] [CrossRef]
  46. Shi, C.; Zeng, R.-G.; Hao, L.-T.; Hao, X.-D.; Li, J. Extracting Compositional Blocks of Alginate-like Extracellular Polymers (ALE) from Conventional Activated Sludge (CAS). Sci. Total Environ. 2023, 867, 161371. [Google Scholar] [CrossRef] [PubMed]
  47. Di Martino, P. Extracellular Polymeric Substances, a Key Element in Understanding Biofilm Phenotype. AIMS Microbiol. 2018, 4, 274–288. [Google Scholar] [CrossRef]
  48. Guo, X.; Wang, X.; Liu, J. Composition Analysis of Fractions of Extracellular Polymeric Substances from an Activated Sludge Culture and Identification of Dominant Forces Affecting Microbial Aggregation. Sci. Rep. 2016, 6, 28391. [Google Scholar] [CrossRef] [PubMed]
  49. Xiong, W.; Wang, S.; Zhou, N.; Chen, Y.; Su, H. Granulation Enhancement and Microbial Community Shift of Tylosin-Tolerant Aerobic Granular Sludge on the Treatment of Tylosin Wastewater. Bioresour. Technol. 2020, 318, 124041. [Google Scholar] [CrossRef]
  50. Zhang, D.; Li, W.; Hou, C.; Shen, J.; Jiang, X.; Sun, X.; Li, J.; Han, W.; Wang, L.; Liu, X. Aerobic Granulation Accelerated by Biochar for the Treatment of Refractory Wastewater. Chem. Eng. J. 2017, 314, 88–97. [Google Scholar] [CrossRef]
  51. Ali, P.; Shah, A.A.; Hasan, F.; Hertkorn, N.; Gonsior, M.; Sajjad, W.; Chen, F. A Glacier Bacterium Produces High Yield of Cryoprotective Exopolysaccharide. Front. Microbiol. 2020, 10, 3096. [Google Scholar] [CrossRef]
  52. Dick, R.I.; Vesilind, P.A. The Sludge Volume Index: What Is It? J. Water Pollut. Control Fed. 1969, 41, 1285–1291. [Google Scholar]
  53. Jiang, F.; Qi, Y.; Shi, X. Effect of Liquid Carbon Sources on Nitrate Removal, Characteristics of Soluble Microbial Products and Microbial Community in Denitrification Biofilters. J. Clean. Prod. 2022, 339, 130776. [Google Scholar] [CrossRef]
  54. Wang, X.; Chen, T.; Gao, C.; Xie, Y.; Zhang, A. Effect of Extracellular Polymeric Substances Removal and Re-Addition on the Denitrification Performance of Activated Sludge: Carbon Source Metabolism, Electron Transfer and Enzyme Activity. J. Environ. Chem. Eng. 2022, 10, 108069. [Google Scholar] [CrossRef]
  55. Bomfeti, C.A.; Florentino, L.A.; Guimarães, A.P.; Cardoso, P.G.; Guerreiro, M.C.; Moreira, F.M.d.S. Exopolysaccharides Produced by the Symbiotic Nitrogen-Fixing Bacteria of Leguminosae. Rev. Bras. Ciênc. Solo 2011, 35, 657–671. [Google Scholar] [CrossRef]
  56. Liu, J.; Liang, X.; Yang, C.; Yu, S.; Guo, H. Tracing Membrane Biofouling to the Microbial Community Structure and Its Metabolic Products: An Investigation on the Three-Stage MBR Combined with Worm Reactor Process. Bioresour. Technol. 2019, 278, 165–174. [Google Scholar] [CrossRef] [PubMed]
  57. Nguyen, T.T.H.; Vuong, T.Q.; Han, H.L.; Li, Z.; Lee, Y.-J.; Ko, J.; Nedashkovskaya, O.I.; Kim, S.-G. Three Marine Species of the Genus Fulvivirga, Rich Sources of Carbohydrate-Active Enzymes Degrading Alginate, Chitin, Laminarin, Starch, and Xylan. Sci. Rep. 2023, 13, 6301. [Google Scholar] [CrossRef] [PubMed]
  58. Li, W.-M.; Liao, X.-W.; Guo, J.-S.; Zhang, Y.-X.; Chen, Y.-P.; Fang, F.; Yan, P. New Insights into Filamentous Sludge Bulking: The Potential Role of Extracellular Polymeric Substances in Sludge Bulking in the Activated Sludge Process. Chemosphere 2020, 248, 126012. [Google Scholar] [CrossRef] [PubMed]
  59. Guimarães, L.B.; Gubser, N.R.; Lin, Y.; Zlópasa, J.; Felz, S.; Tomás Martínez, S.; Weissbrodt, D.G. Production of Extracellular Polymeric Substances in Granular Sludge under Selection for Accumulibacter and Competibacter. bioRxiv 2023, 1–45. [Google Scholar]
  60. Gupta, R.S.; Chander, P.; George, S. Phylogenetic Framework and Molecular Signatures for the Class Chloroflexi and Its Different Clades; Proposal for Division of the Class Chloroflexi Class. Nov. into the Suborder Chloroflexineae Subord. Nov., Consisting of the Emended Family Oscillochloridaceae and the Family Chloroflexaceae Fam. Nov., and the Suborder Roseiflexineae Subord. Nov., Containing the Family Roseiflexaceae Fam. Nov. Antonie Leeuwenhoek 2013, 103, 99–119. [Google Scholar] [CrossRef]
  61. Bernardet, J.-F.; Bowman, J.P. The Genus Flavobacterium. In The Prokaryotes; Springer: New York, NY, USA, 2006; pp. 481–531. [Google Scholar]
  62. Pikuta, E.V.; Hoover, R.B. The Genus Trichococcus. In Lactic Acid Bacteria; Wiley: Hoboken, NJ, USA, 2014; pp. 135–145. [Google Scholar]
  63. Strepis, N.; Naranjo, H.D.; Meier-Kolthoff, J.; Göker, M.; Shapiro, N.; Kyrpides, N.; Klenk, H.-P.; Schaap, P.J.; Stams, A.J.M.; Sousa, D.Z. Genome-Guided Analysis Allows the Identification of Novel Physiological Traits in Trichococcus Species. BMC Genom. 2020, 21, 24. [Google Scholar] [CrossRef]
  64. Zhu, X.; Lee, L.W.; Song, G.; Zhang, X.; Gao, Y.; Yang, G.; Luo, S.; Huang, X. Deciphering Mono/Multivalent Draw Solute-Induced Microbial Ecology and Membrane Fouling in Anaerobic Osmotic Membrane Bioreactor. Water Res. 2022, 209, 117869. [Google Scholar] [CrossRef]
  65. Shao, Y.; Zhang, H.; Buchanan, I.; Mohammed, A.; Liu, Y. Comparison of Extracellular Polymeric Substance (EPS) in Nitrification and Nitritation Bioreactors. Int. Biodeterior. Biodegrad. 2019, 143, 104713. [Google Scholar] [CrossRef]
  66. Socrates, G. Infrared and Raman Characteristic Group Frequencies: Tables and Charts, 3rd ed.; John Wiley&Sons, Ltd.: Chichester, UK, 2004. [Google Scholar]
  67. Ciempiel, W.; Czemierska, M.; Szymańska-Chargot, M.; Zdunek, A.; Wiącek, D.; Jarosz-Wilkołazka, A.; Krzemińska, I. Soluble Extracellular Polymeric Substances Produced by Parachlorella kessleri and Chlorella vulgaris: Biochemical Characterization and Assessment of Their Cadmium and Lead Sorption Abilities. Molecules 2022, 27, 7153. [Google Scholar] [CrossRef] [PubMed]
  68. Ramesh, A.; Lee, D.-J.; Hong, S.G. Soluble microbial products (SMP) and soluble extracellular polymeric substances (EPS) from wastewater sludge. Appl. Microbiol. Biotechnol. 2006, 73, 219–225. [Google Scholar] [CrossRef] [PubMed]
  69. Ami, D.; Lavatelli, F.; Rognoni, P.; Palladini, G.; Raimondi, S.; Giorgetti, S.; Monti, L.; Doglia, S.M.; Natalello, A.; Merlini, G. In situ characterization of protein aggregates in human tissues affected by light chain amyloidosis: A FTIR microspectroscopy study. Sci. Rep. 2016, 6, 29096. [Google Scholar] [CrossRef]
  70. Liang, Z.; Li, W.; Yang, S.; Du, P. Extraction and structural characteristics of extracellular polymeric substances (EPS), pellets in autotrophic nitrifying biofilm and activated sludge. Chemosphere 2010, 81, 626–632. [Google Scholar] [CrossRef] [PubMed]
  71. Sakugawa, K.; Ikeda, A.; Takemura, A.; Ono, H. Simplified Method for Estimation of Composition of Alginates by FTIR. J. Appl. Polym. Sci. 2004, 93, 1372–1377. [Google Scholar] [CrossRef]
  72. Sam, S.B.; Dulekgurgen, E. Characterization of exopolysaccharides from floccular and aerobic granular activated sludge as alginate-like-exoPS. Desalination Water Treat. 2016, 57, 2534–2545. [Google Scholar] [CrossRef]
  73. Oliveira, A.S.; Amorim, C.L.; Ramos, M.A.; Mesquita, D.P.; Inocêncio, P.; Ferreira, E.C.; Van Loosdrecht, M.; Castro, P.M. Variability in the composition of extracellular polymeric substances from a full-scale aerobic granular sludge reactor treating urban wastewater. J. Environ. Chem. Eng. 2020, 8, 104156. [Google Scholar] [CrossRef]
  74. Breitenbach, R.; Silbernagl, D.; Toepel, J.; Sturm, H.; Broughton, W.J.; Sassaki, G.L.; Gorbushina, A.A. Corrosive extracellular polysaccharides of the rock-inhabiting model fungus Knufia petricola. Extremophiles 2018, 22, 165–175. [Google Scholar] [CrossRef] [PubMed]
  75. Mecozzi, M.; Pietrantonio, E. Carbohydrates proteins and lipids in fulvic and humic acids of sediments and its relationships with mucilaginous aggregates in the Italian seas. Mar. Chem. 2006, 101, 27–39. [Google Scholar] [CrossRef]
  76. Daemi, H.; Barikani, M. Synthesis and characterization of calcium alginate nanoparticles, sodium homopolymannuronate salt and its calcium nanoparticles. Sci. Iran. 2012, 19, 2023–2028. [Google Scholar] [CrossRef]
  77. Liu, W.; Zhang, J.; Jin, Y.; Zhao, X.; Cai, Z. Adsorption of Pb(II), Cd(II) and Zn(II) by extracellular polymeric substances extracted from aerobic granular sludge: Efficiency of protein. J. Environ. Chem. Eng. 2015, 3, 1223–1232. [Google Scholar] [CrossRef]
  78. Kavita, K.; Mishra, A.; Jha, B. Isolation and physico-chemical characterisation of extracellular polymeric substances produced by the marine bacterium Vibrio parahaemolyticus. Biofouling 2011, 27, 309–317. [Google Scholar] [CrossRef] [PubMed]
  79. Clarke, A.D.; Huang, H.; Grün, I.U.; Ellersieck, M. Measurement of Total Sodium Alginate in Restructured Fish Products Using Fourier Transform Infrared Spectroscopy. EC Nutr. 2017, 11, 33–45. [Google Scholar]
  80. Belattmania, Z.; Kaidi, S.; El Atouani, S.; Katif, C.; Bentiss, F.; Jama, C.; Reani, A.; Sabour, B.; Vasconcelos, V. Isolation and FTIR-ATR and 1H NMR Characterization of Alginates from the Main Alginophyte Species of the Atlantic Coast of Morocco. Molecules 2020, 25, 4335. [Google Scholar] [CrossRef] [PubMed]
  81. Fenoradosoa, T.A.; Ali, G.; Delattre, C.; Laroche, C.; Petit, E.; Wadouachi, A.; Michaud, P. Extraction and characterization of an alginate from the brown seaweed Sargassum turbinarioides Grunow. J. Appl. Phycol. 2010, 22, 131–137. [Google Scholar] [CrossRef]
  82. Abka-khajouei, R.; Tounsi, L.; Shahabi, N.; Patel, A.K.; Abdelkafi, S.; Michaud, P. Structures, Properties and Applications of Alginates. Mar. Drugs 2022, 20, 364. [Google Scholar] [CrossRef]
  83. Zhang, H.; Cheng, J.; Ao, Q. Preparation of Alginate-Based Biomaterials and Their Applications in Biomedicine. Mar. Drugs 2021, 19, 264. [Google Scholar] [CrossRef]
  84. Lin, Y.M.; Sharma, P.K.; van Loosdrecht, M.C.M. The Chemical and Mechanical Differences between Alginate-like Exopolysaccharides Isolated from Aerobic Flocculent Sludge and Aerobic Granular Sludge. Water Res. 2013, 47, 57–65. [Google Scholar] [CrossRef]
  85. Hurtado, A.; Aljabali, A.A.A.; Mishra, V.; Tambuwala, M.M.; Serrano-Aroca, Á. Alginate: Enhancement Strategies for Advanced Applications. Int. J. Mol. Sci. 2022, 23, 4486. [Google Scholar] [CrossRef]
  86. Shi, C.; Zeng, R.-G.; Yuan, S.-C.; Zhang, L.; Wang, X.-Y.; Hao, L.-T.; Hao, X.-D.; Zhang, N.; Wu, Y.-Y. Preparing a Heavy-Metal Adsorbent Based on Alginate-like Extracellular Polymers from Conventional Activated Sludge via Polyethyleneimine Grafting. Sustain. Chem. Pharm. 2024, 38, 101472. [Google Scholar] [CrossRef]
Figure 1. Changes in concentrations of pollutant indicators in the WWTP effluent (mean of 2 or 3 measurements during the week preceding the biomass sampling): (a) COD—chemical oxygen demand, (b) TSS—total suspended solids, (c) Ntot—total nitrogen, (d) Ptot—total phosphorus and changes in (e) sludge volume index (SVI), (f) sludge retention time (SRT), (g) biomass concentration (X), and (h) ALE-like polymers content in activated sludge in the three investigated aeration tanks (n = 3) during the experimental period.
Energies 17 06231 g001
Figure 2. Content of PS and PN in the different fractions of EPS isolated from biomass from the experimental reactors (n = 3). For all samples with the same letter, the difference between the means is not statistically significant. If two samples have different letters, they are significantly different. Significant differences between samples can only be interpreted within a particular EPS fraction (uppercase Roman letters: differences between PN; lowercase italics: differences between PS). For details, including the statistical test used and the exact p-value for each comparison, please refer to the text. SOL-EPS group has not shown any significant differences.
Energies 17 06231 g002
Figure 3. Pearson correlation between EPS content (PN and PS in SOL-, LB-, and TB-EPS), ASVs, alpha diversity metrics (Shannon, Margalef, Simpson, and Chao1 indexes), and the technological parameters and wastewater quality indices obtained from six time-points (Temperature, SVI—sludge volumetric index, COD.eff—COD in the effluent, SRT—sludge retention time, TSS.eff.—total suspended solids in the effluent, N.tot.eff.—total nitrogen in the effluent, BOD5.eff.—BOD5 in the effluent, P.tot.eff.—total phosphorus in the effluent, X—concentration of activated sludge in the reactors in mg MLSS/L). The color gradient indicates Pearson’s correlation coefficient ranging from red (negative correlation) to blue (positive correlation). Only results with statistical significance (p < 0.05) are shown.
Energies 17 06231 g003
Figure 4. Bubble plot showing the relative abundance of the 50 ASVs with the highest abundance at each sampling time. The size of the bubble indicates the relative abundance (%) of each ASV.
Energies 17 06231 g004
Figure 5. FT-IR/ATR spectra of SOL-EPS (a), LB-EPS (b), and TB-EPS (c).
Energies 17 06231 g005
Figure 6. FT-IR/ATR spectra of ALE extracted from activated sludge.
Energies 17 06231 g006
Figure 7. Results of fractionation of ALE extracted from activated sludge.
Energies 17 06231 g007
Disclaimer/Publisher’s Note: The statements, opinions and data contained in all publications are solely those of the individual author(s) and contributor(s) and not of MDPI and/or the editor(s). MDPI and/or the editor(s) disclaim responsibility for any injury to people or property resulting from any ideas, methods, instructions or products referred to in the content.

