1. Introduction
The analysis of wave propagation is associated with the need to examine the influence of the structure itself and building materials [
1,
2,
3]. The analysis of fields requires discussing the effects related to multiple reflections, refractions, interference, and attenuation of waves caused by the geometry and complexity of the structure. The factors listed above are the subject of many research works aimed at determining the field distribution [
2,
3,
4,
5]. The phenomena listed are the direct result of wave distribution in structures made of non-ideal dielectrics or complex elements containing holes, such as bricks. They are particularly visible in the case of low-range wireless networks. Both periodic structures and singular elements with specific material properties (e.g., reinforcement, brick with holes) cause the resistance of the wireless transmission channel to be subject to interference, signal delays, and signal loss. Some factors are random in nature, related to changes in wave propagation conditions.
In the literature, walls made of basic building materials are analyzed, which are often treated as uniform homogeneous structures. Despite the diverse composition and properties of individual components, the particle sizes, including aggregate, meet the conditions of quasi-stationarity. The dimensions of the model remain relatively large compared to unordered components, e.g., concrete [
6]. The second reason for homogenizing the properties of a given material is related to the limited possibilities of mapping a complex structure due to the capabilities of a computer or software. For the reasons given, the analyzed walls are described in the form of homogeneous plates of different sizes, the properties of which are uniform, isotropic, and expressed by three parameters:
εr,
μr, and
σ [
7,
8,
9]. Few publications contain an analysis of different variants of the composition of the building material [
10,
11]. A comparison of two types of concrete samples with different porosity of the structure was presented in [
11]. The analysis of concrete taking into account the relative water content expressed by the water/cement (w/c) weight ratio is included in [
10].
Modern construction technology is mainly based on ceramic materials and layered wall construction, depending on the material used and the function of the entire structure. Single-family units contain single-layer and multi-layer walls consisting mainly of ceramic elements, i.e., bricks and hollow blocks [
12]. They are made mainly of clay, lime, sand, or other mineral substances. Mechanical durability and resistance to weather conditions are obtained in the process of drying and firing (or evaporation). Depending on the materials used, these bricks can be used to build walls, pillars, columns, and foundations or as a filling material for ceilings. The division of finished elements is based on their geometric properties, degree of firing, and materials used [
12,
13,
14,
15].
An important issue is the proper selection of material parameters for the analyzed building structures. Based on the available literature, significant discrepancies in the values of electrical parameters of the analyzed materials can be observed, resulting from, e.g., homogenization of parameters when analyzing different building materials and assuming a constant conductivity value without taking into account the absorption coefficient of the material [
16,
17]. The authors in [
18] proved that the same trends of the dielectric constant (
εr) dependence on frequency (
f) could not be applied to building materials. By analyzing a solid brick wall, they proved that
εr decreases with increasing frequency. At the same time, in the case of plaster, the dielectric constant increases. A similar situation occurs in the case of electrical conductivity (
σ), where it is impossible to assume uniform dependencies for all materials. For example, the conductivity range of clay is significantly wide (
σ = 0.00278 ÷ 0.244 S/m) [
19].
A review of publications and a discussion on the impact of various factors on the electrical parameters of building materials are presented in [
20]. According to the article, the authors observed that it is practically impossible to know the exact values of the parameters for all environments. They stated that measurements should be made for specific model variants, taking into account the frequency or conditions of the surrounding environment, which affect the composition of the material. Many publications do not take into account the above factors and assume arbitrary values.
Building structures are created on the basis of basic building materials, the internal structure of which, its complexity and the variability of material parameters have an impact on the building and electrical properties. The building technologies used depend on the given country [
21]. Due to the specificity of the building technology used, among others, in England or the USA, the literature presents an analysis of concrete elements with hollows (i.e., with air holes) [
22,
23]. The authors in [
23] investigated the use of ultra-wideband radar for detection through a wall composed of two homogeneous layers of concrete separated by the air gap. The aim was to investigate the effect of the air gap on the level of the radar signal power reflected from the target. The study of the effect of walls with a periodic structure on the quality of transmission and reflection of the given signal is presented in publications [
23,
24,
25,
26].
In single-family houses, single- and multi-layer walls are used, mainly composed of various types of bricks, silicate blocks, or cellular concrete. In recent years, the most commonly used technology is masonry. Walls, depending on the materials used and the function they are to perform (e.g., partition wall, load-bearing wall, protective wall), can also be multi-layered. However, this type of building material is less frequently analyzed because it mainly concerns Europe. In paper [
27], the results of measurements and simulations performed in Ansys HFSS were described, where the object was a 50 cm thick brick wall made of 25 × 50 cm Porotherm bricks. The analysis concerned the effectiveness of electromagnetic field shielding in the high-frequency range of 0.9–5 GHz.
The authors in [
21] presented a study on the integration of frequency-selective surfaces (FSS) in some building construction systems. Penetration losses were assessed for different materials commonly used in southern Europe in the frequency range from 800 MHz to 10 GHz. The objects of the analysis were three types of walls. Each of them was composed of bricks with hollows of thicknesses: 11 cm (with 8 square hollows); 15 cm (with 12 square hollows); and 20 cm (with 16 square hollows). The study also included the introduction of FSS into the wall for different samples of multi-layer walls. For this purpose, a simulation model was developed.
Due to electromagnetic phenomena, the way of describing the material structure is of great importance. In selected publications, the dimensions of the analyzed models are random, not occurring in construction technology [
26,
27]. The review of the source materials shows that the issues discussed in this work constitute an important, still-explored issue. Most studies focus on the analysis of the impact of the arrangement of walls and other construction elements on the propagation of electromagnetic waves [
28,
29,
30]. The following issues are considered to a lesser extent:
complex structure and structure of wall materials;
modeling walls with dimensions consistent with construction techniques;
diversity of building materials used (i.e., types of bricks).
Wireless communication technologies consist of solutions that are differentiated in terms of frequency or range of operation. From the point of view of modeling electromagnetic phenomena in these systems, the direct, relative measure of the size of the analyzed model should be the size of the linear dimensions of the system in relation to the length of the propagating electromagnetic wave. The choice of the calculation method is largely dictated by the relative size of the model and the resulting approximations in the representation of physical phenomena. The problem is the contradiction between increasing the size of the model while maintaining the expected precision of the representation of the material structure and the accuracy of modeling real systems. The contradictions of the indicated factors are emphasized when striving to analyze increasingly larger systems. The factor related to the numerical cost of calculations also becomes important.
The use of numerical modeling algorithms enables the determination of electromagnetic field distributions in small and large-scale systems. Despite the inevitable approximations in the constructed models and calculation errors, the use of numerical methods allows for obtaining qualitative and quantitative assessment of the building systems under consideration [
31,
32,
33]. The necessary approximations introduced during model construction and the level of errors introduced during calculations are the main factors determining the choice of the calculation algorithm. The use of analytical methods leads to obtaining solutions that are fully based on the mathematical model and burdened with the smallest error.
An example of the application of the FDTD method to the problems of modeling fields in building structures is the article [
34]. In the publication, a periodic one- and two-dimensional model of a concrete wall was considered, taking into account the diversity of the structure, with special emphasis on reinforcing bars. The phenomena occurring at a frequency in the range of ⟨0.5, 2⟩ GHz were analyzed. In the article [
35], a comparison of the results obtained by the FDTD method and the values obtained by measurements was presented. The analysis concerned one level of a seven-story office building consisting of several rooms modeled with consideration of different types of building materials. It was shown that in order to obtain results consistent with the calculated measurements, it is necessary to create large FDTD (3D) models, the construction of which requires a large amount of RAM and a long computation time. In this case, it was necessary to use only homogeneous materials without taking into account, e.g., hollow bricks. Also in the publication [
11], the authors confirmed the compliance of the results obtained by the FDTD method with the values obtained using measurements. The authors performed an analysis of a concrete slab depending on its roughness.
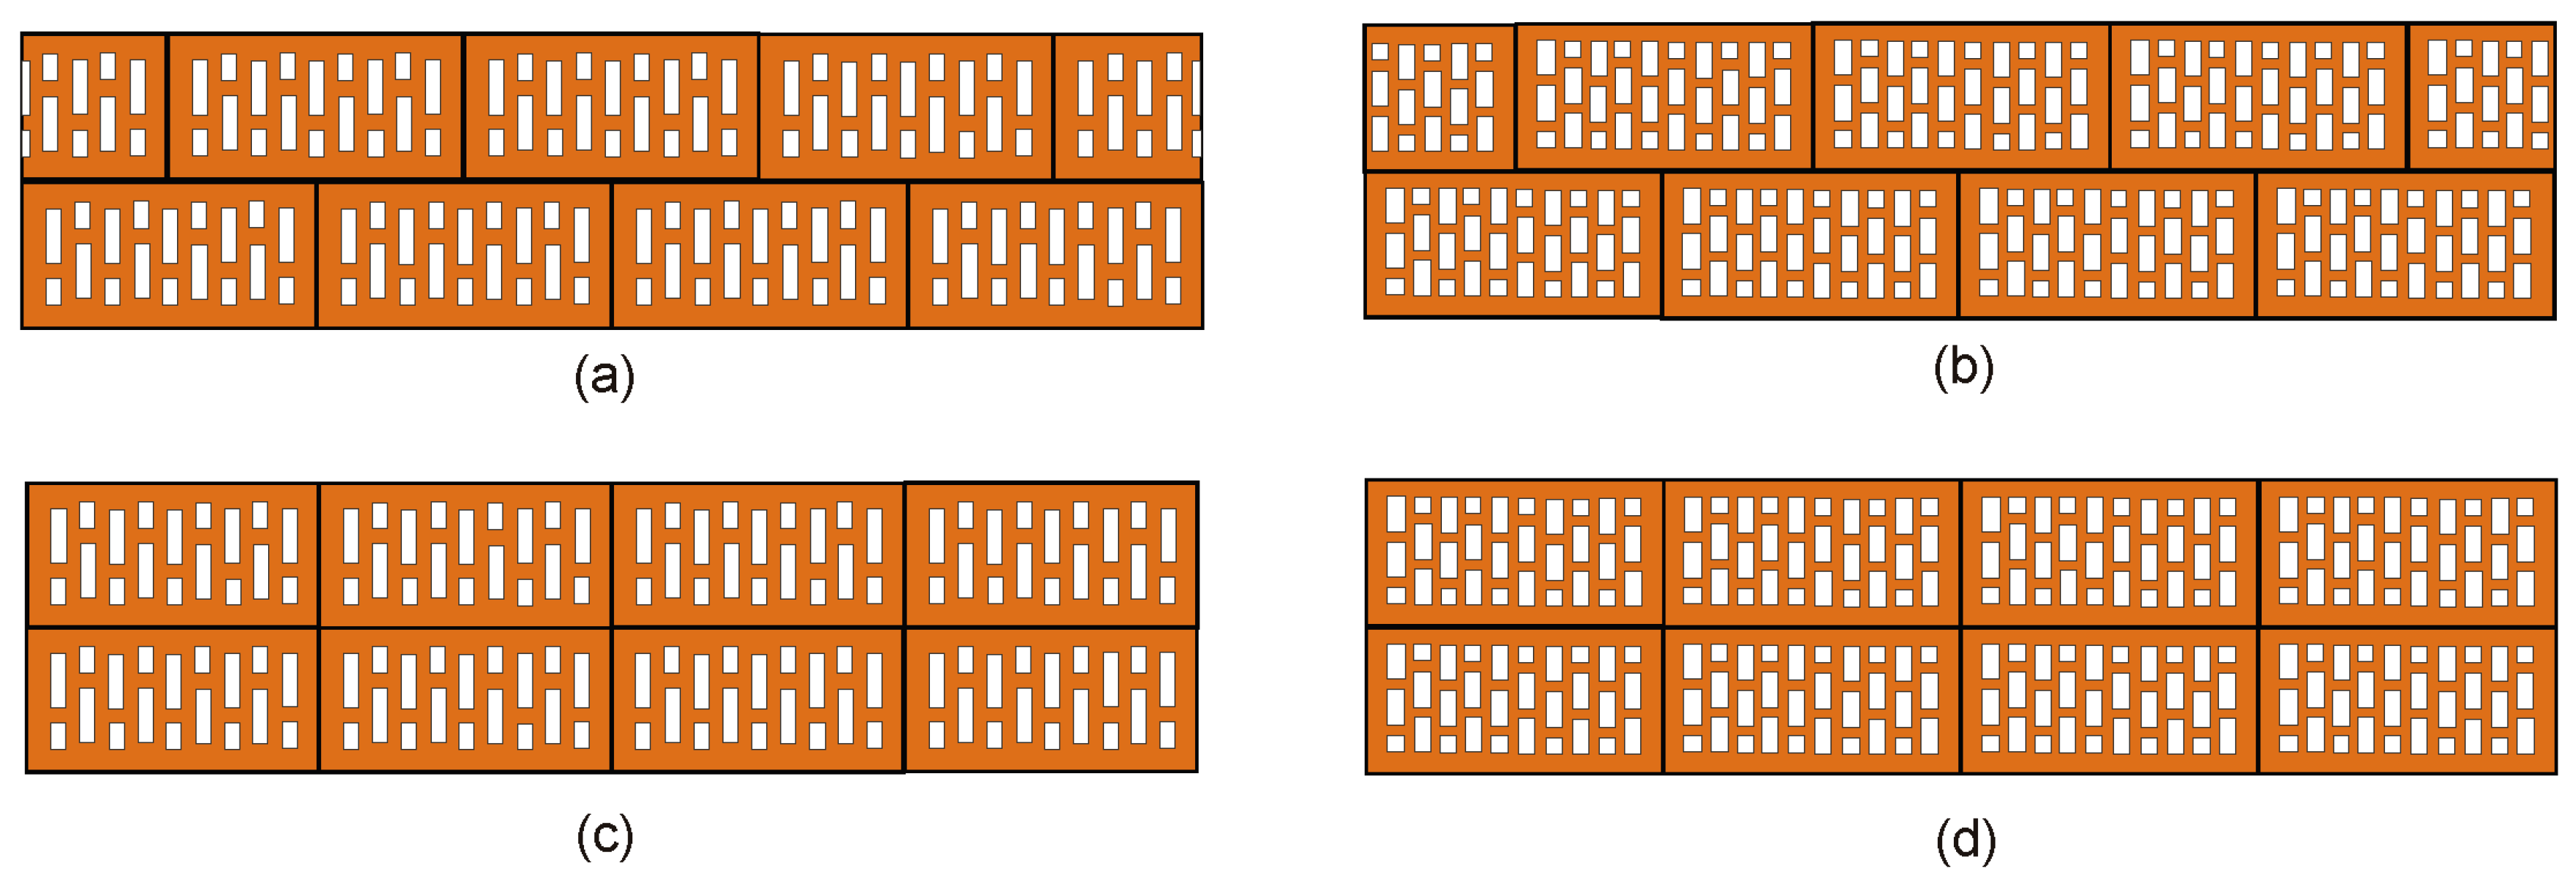
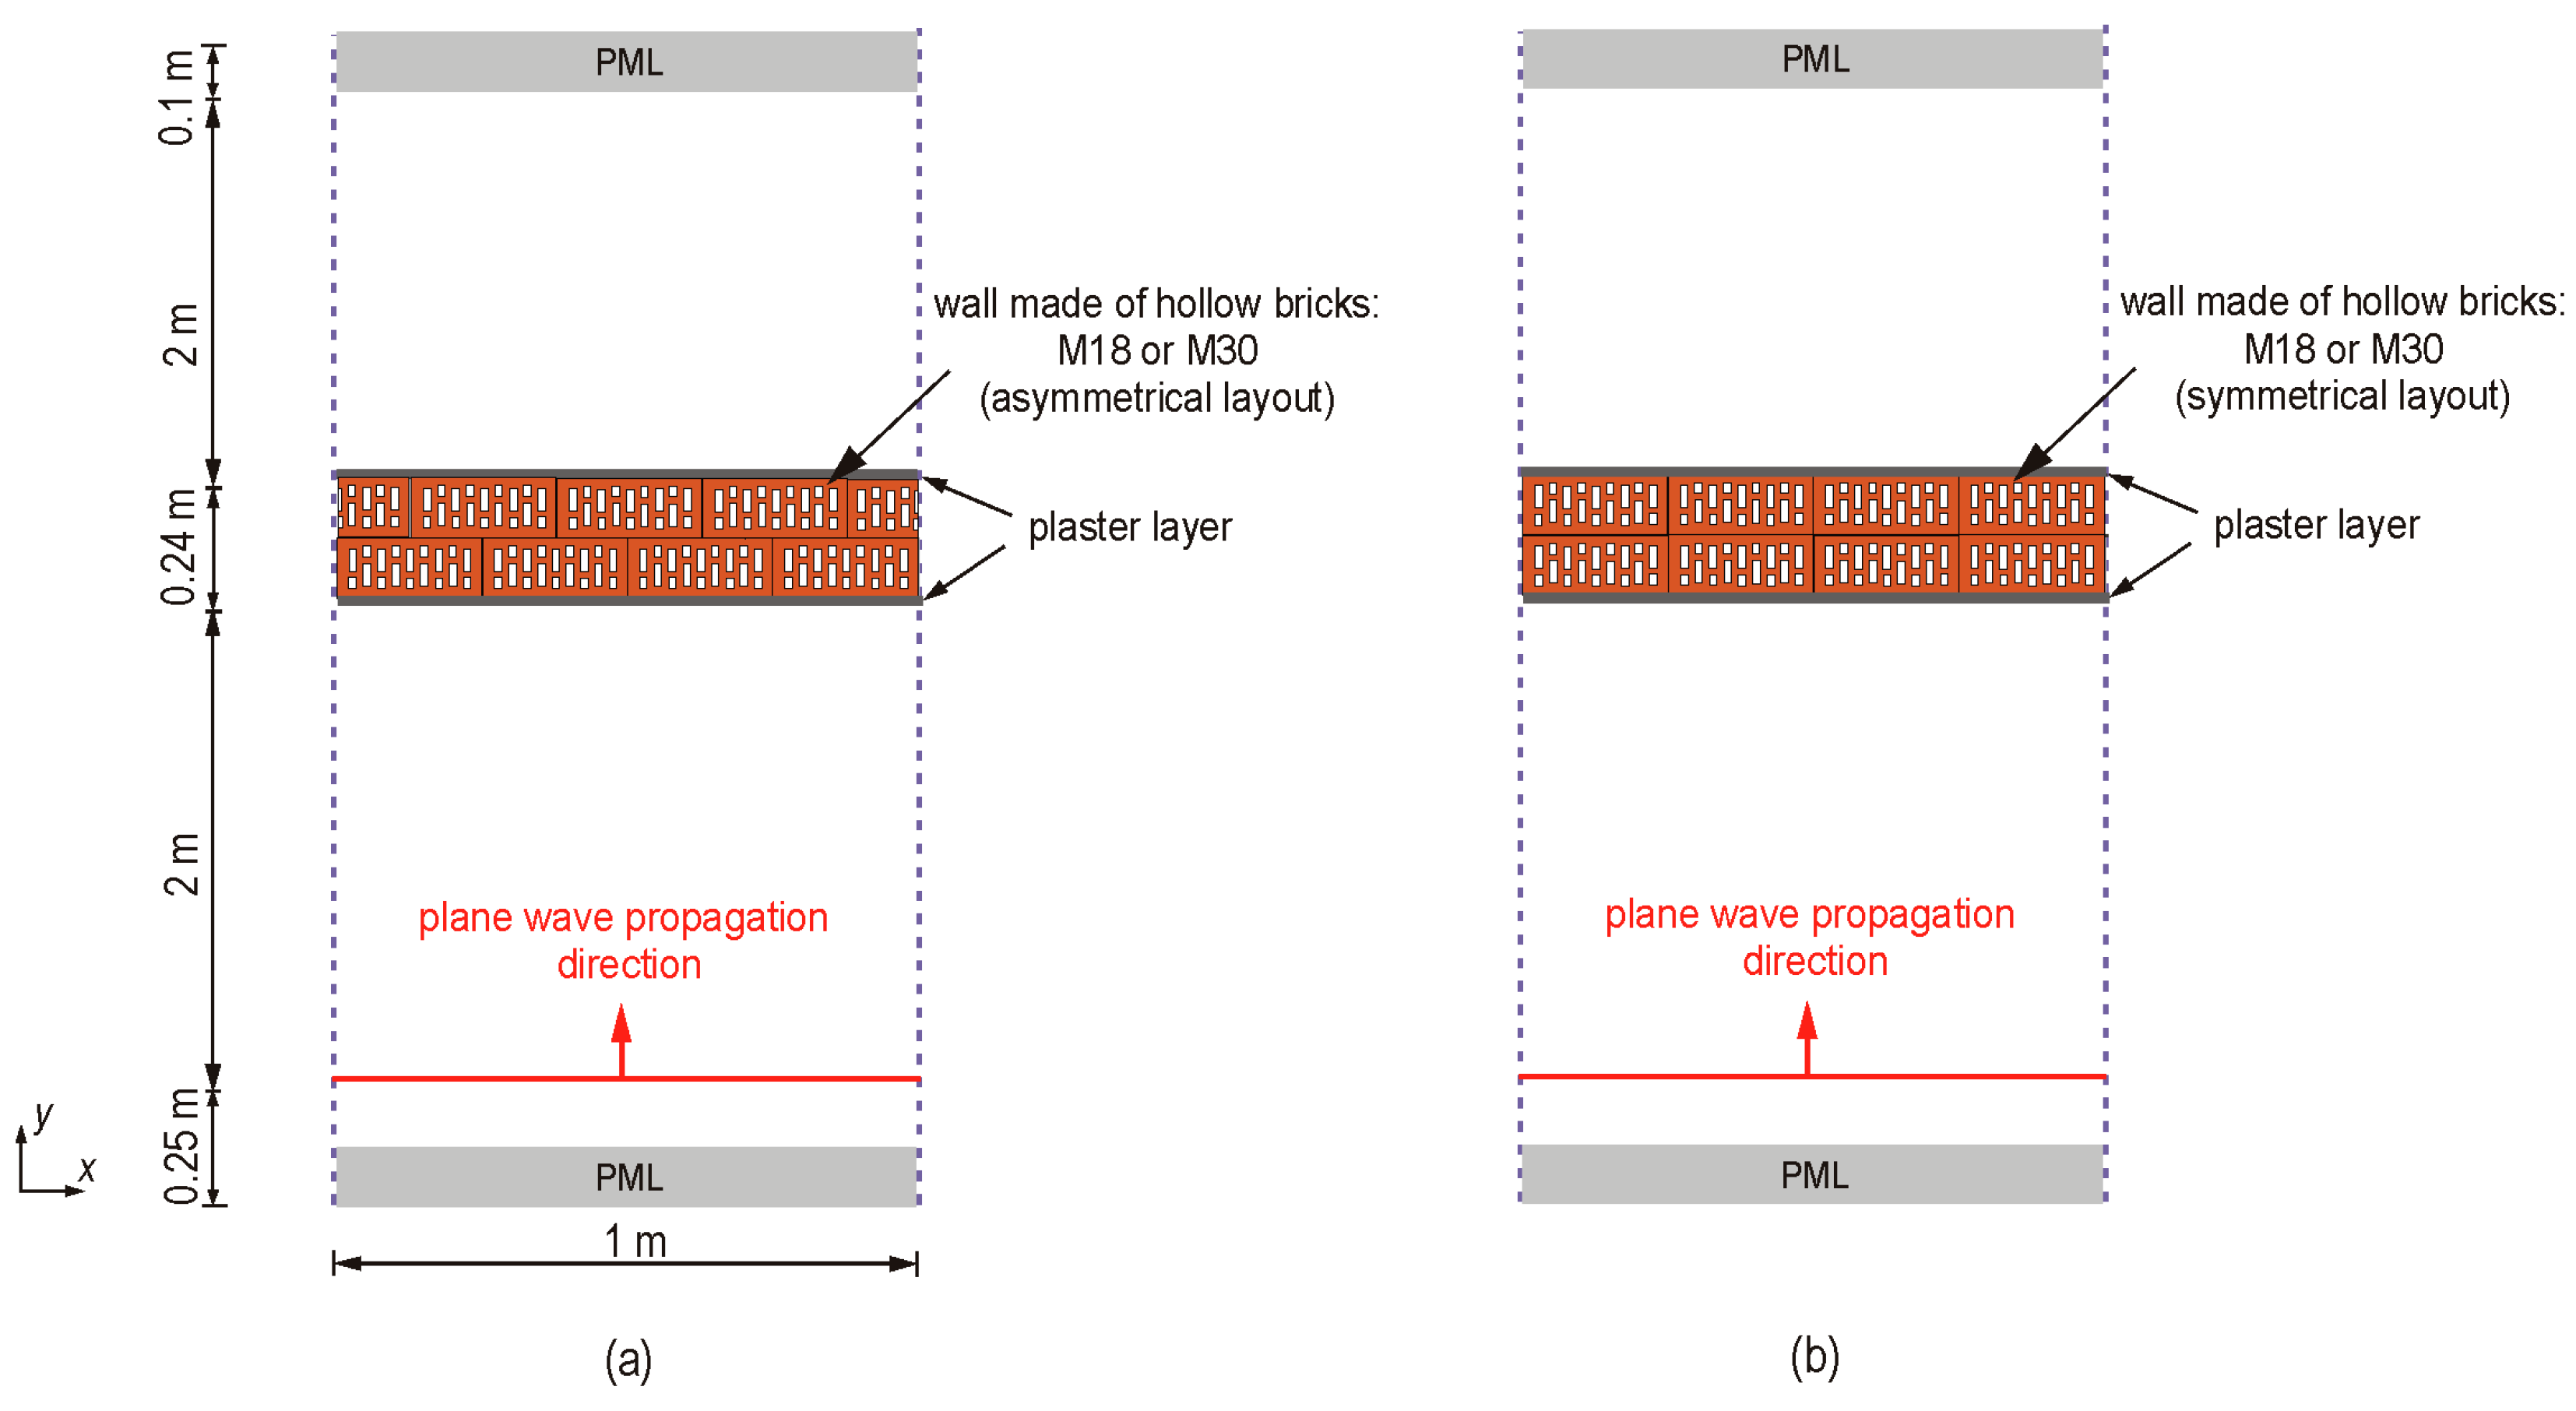
The aim of this article is to analyze the impact of two types of bricks used in Europe on the electric field. The difference between the bricks concerns the number of holes (18 and 30). The subject of the analysis were two-layer walls. The impact of the arrangement of bricks relative to each other on wave propagation was discussed. A symmetrical and asymmetrical arrangement was considered. The analysis was multivariate because the impact of the width of the holes in the considered bricks on the electric field was also checked. In connection with the review of the literature on the applied electrical parameters, it was decided to analyze the material under consideration, taking into account the variable value of conductivity (σ = 0 ÷ 0.2 S/m). The calculations were performed for a plane wave at the frequency used for local networks (2.4 GHz) using the FDTD method. In order to verify the adopted numerical assumptions, the results obtained analytically and numerically were compared on the example of a wall made of solid brick. On selected examples of walls made of hollow bricks, the results obtained using the FDTD method were compared with the results obtained using finite element methods (FEM). The article also examined the effect of a thin layer of plaster applied on both surfaces of the wall on the variation of the electric field.
Section 2 presents a description of the building materials used for analysis, such as plaster and brick. The ranges of the electrical parameters of these materials are also presented.
Section 3 presents the analyzed wall variants, taking into account two types of bricks with hollows, the variability of the hollow width, and their mutual arrangement. The geometry of the model used for multivariate analysis, as well as parameters related to numerical modeling, are also described.
Section 4 contains the results of the analysis of different variants of walls made of the considered bricks. The characteristics show the effect of the variability of the number and width of hollows and their arrangement relative to each other on the values of the electric field intensity.
2. Building Materials
In the literature, walls made of basic building materials are analyzed, which are often treated as uniform, homogeneous structures. Despite the diverse composition and properties of individual components, the sizes of particles, e.g., aggregates, meet the conditions of quasi-stationarity. The dimensions of the model remain relatively large compared to the disordered components (such as clinker bricks). However, the homogenization of the properties of a given material is associated with limited possibilities of mapping a complex structure due to the capabilities of the computer or software.
Very often in the literature, the analyzed walls are described as homogeneous plates of various sizes, whose properties are homogeneous, isotropic, and expressed by three parameters: relative electric permittivity (εr), relative magnetic permeability (μr) and electrical conductivity (σ). Building structures are created based on basic building materials, the internal structure of which, its complexity and variability of material parameters affect the building and electrical properties. The materials discussed below are characterized by a complex structure, which consists of materials with different properties.
The most commonly used technology is brick masonry. Loads are transferred by reinforced concrete ceilings, which allow for any shaping of the space inside the building. The main building material is ceramics (e.g., bricks, hollow bricks, blocks). Walls, depending on the materials used and the function they are to perform (e.g., partition wall, load bearing, protective, screening), can also be multi-layered. This also affects the adoption of appropriate assumptions regarding the selection of the calculation method.
2.1. Properties of Bricks
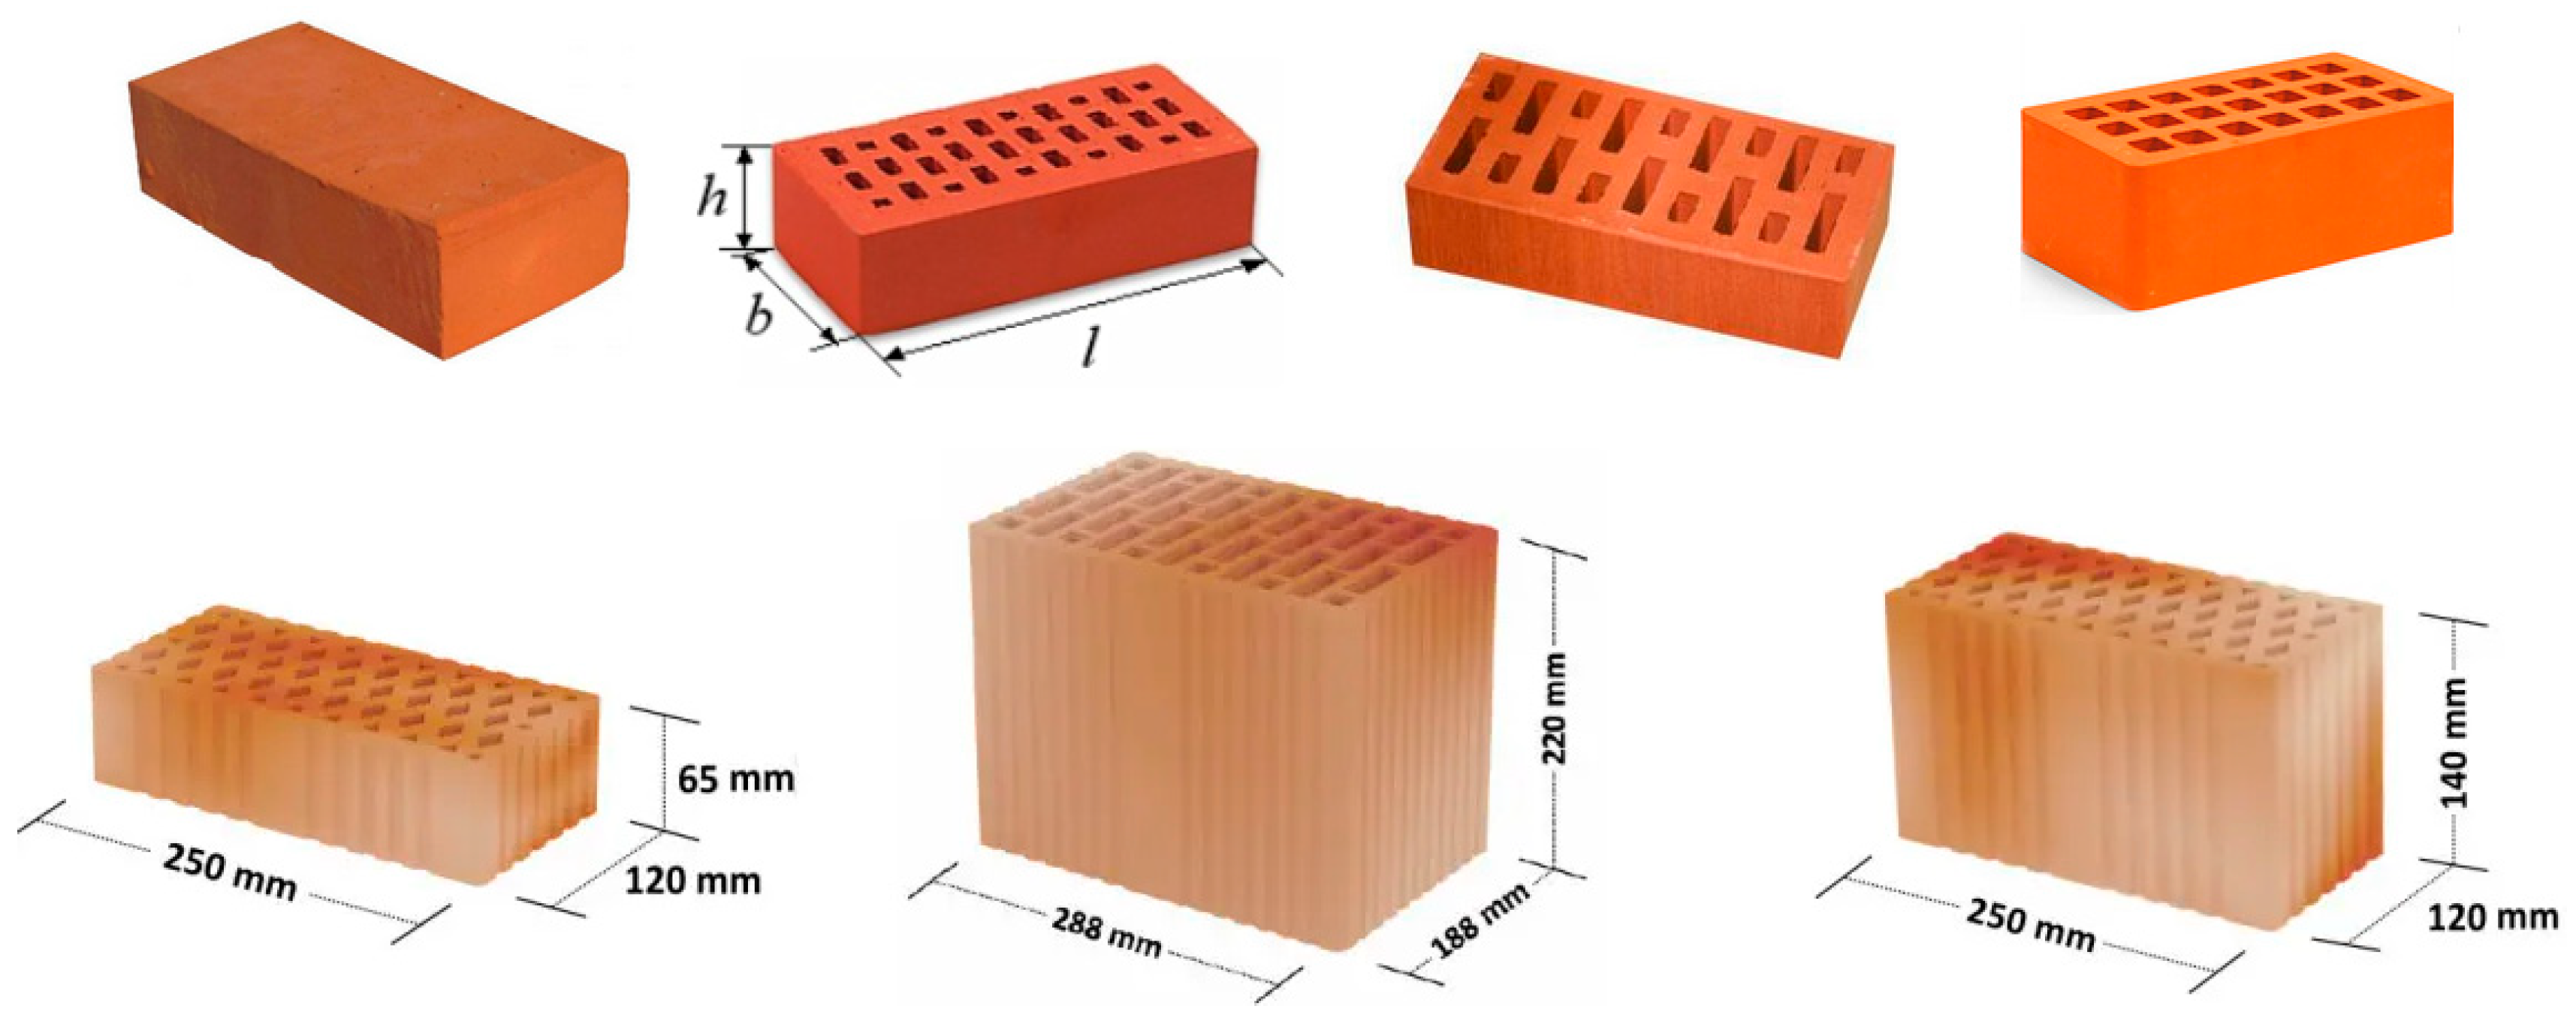
Solid brick is the oldest building material produced by man. Brick is the most natural, healthiest, and widely used building material. Lime-sand products are mainly made of basic ingredients: lime, sand, and water. Construction ceramics are characterized by high volumetric density resulting from the small amount of free space in the material. Bricks are made of clay or other clay raw materials with the addition of sand and then dried and fired at high temperatures. Brick dimensions are very diverse but based on the ratio of height (
h) to width (
b) and length (
l) of 1:2:4 (
Figure 1) [
13,
15]. Solid bricks produced in Poland have standard dimensions of 25 × 12 × 6.5 cm. In the case of German products, the standard dimensions are 24 × 11.5 × 7.1 cm. In the case of hand-formed bricks, it should be remembered that dimensions could be quite different. The water absorption of solid bricks ranges from 5% to 22%. The humidity of the bricks affects the value of conductivity.
In numerical modeling, it is time consuming to model all the hollows in the bricks. For this reason, authors of other publications most often model a homogeneous plate and assign it the values of the electrical parameters of the bricks (
Table 1). Depending on the frequency, in the available literature one can find the value of the relative permittivity in the range of 2.82–19, while the conductivity takes values from 0.00278 to 0.244 S/m.
The analysis of the electrical properties of bricks (with a thickness of
d = 0.105 m) showed that
εr decreases with increasing frequency. In the case of plaster (0.01 m), the
εr values increase. It was found that bricks could be described as an isotropic material. In the selected publications, the dimensions of the analyzed models are random, not occurring in construction technology [
36].
2.2. Plaster Properties
Plaster is a layer of mortar or gypsum used to cover the surface of walls, ceilings or columns, both inside and outside the building. The purpose of plastering is to protect the surface from atmospheric factors and to give the building elements an aesthetic appearance [
40]. Plasters are also used as a base layer for elements requiring a smooth substrate. The standard maximum thickness of the plaster layer is 25 mm. The minimum value is 10 mm inside the building. Due to the binder used in construction technologies, the following plasters are distinguished: cement, lime, cement-lime, and gypsum. When considering electrical issues, the authors omit the indicated classification in the available literature. The values of electrical parameters of plasters are given in
Table 2.
4. Wall Variant Analysis Results
The FDTD method used for calculations allows obtaining instantaneous values of the electric field. In order to obtain the maximum values of the observed Ez component it was necessary to additionally formulate and develop an algorithm written in C++. The algorithm searched for any number of files that contained instantaneous values of the electric field component. Then, in a new file, it saved the maximum values from these files. These files were saved at regular intervals to track the phenomenon of wave propagation over one wavelength. The files were saved after reaching a steady state.
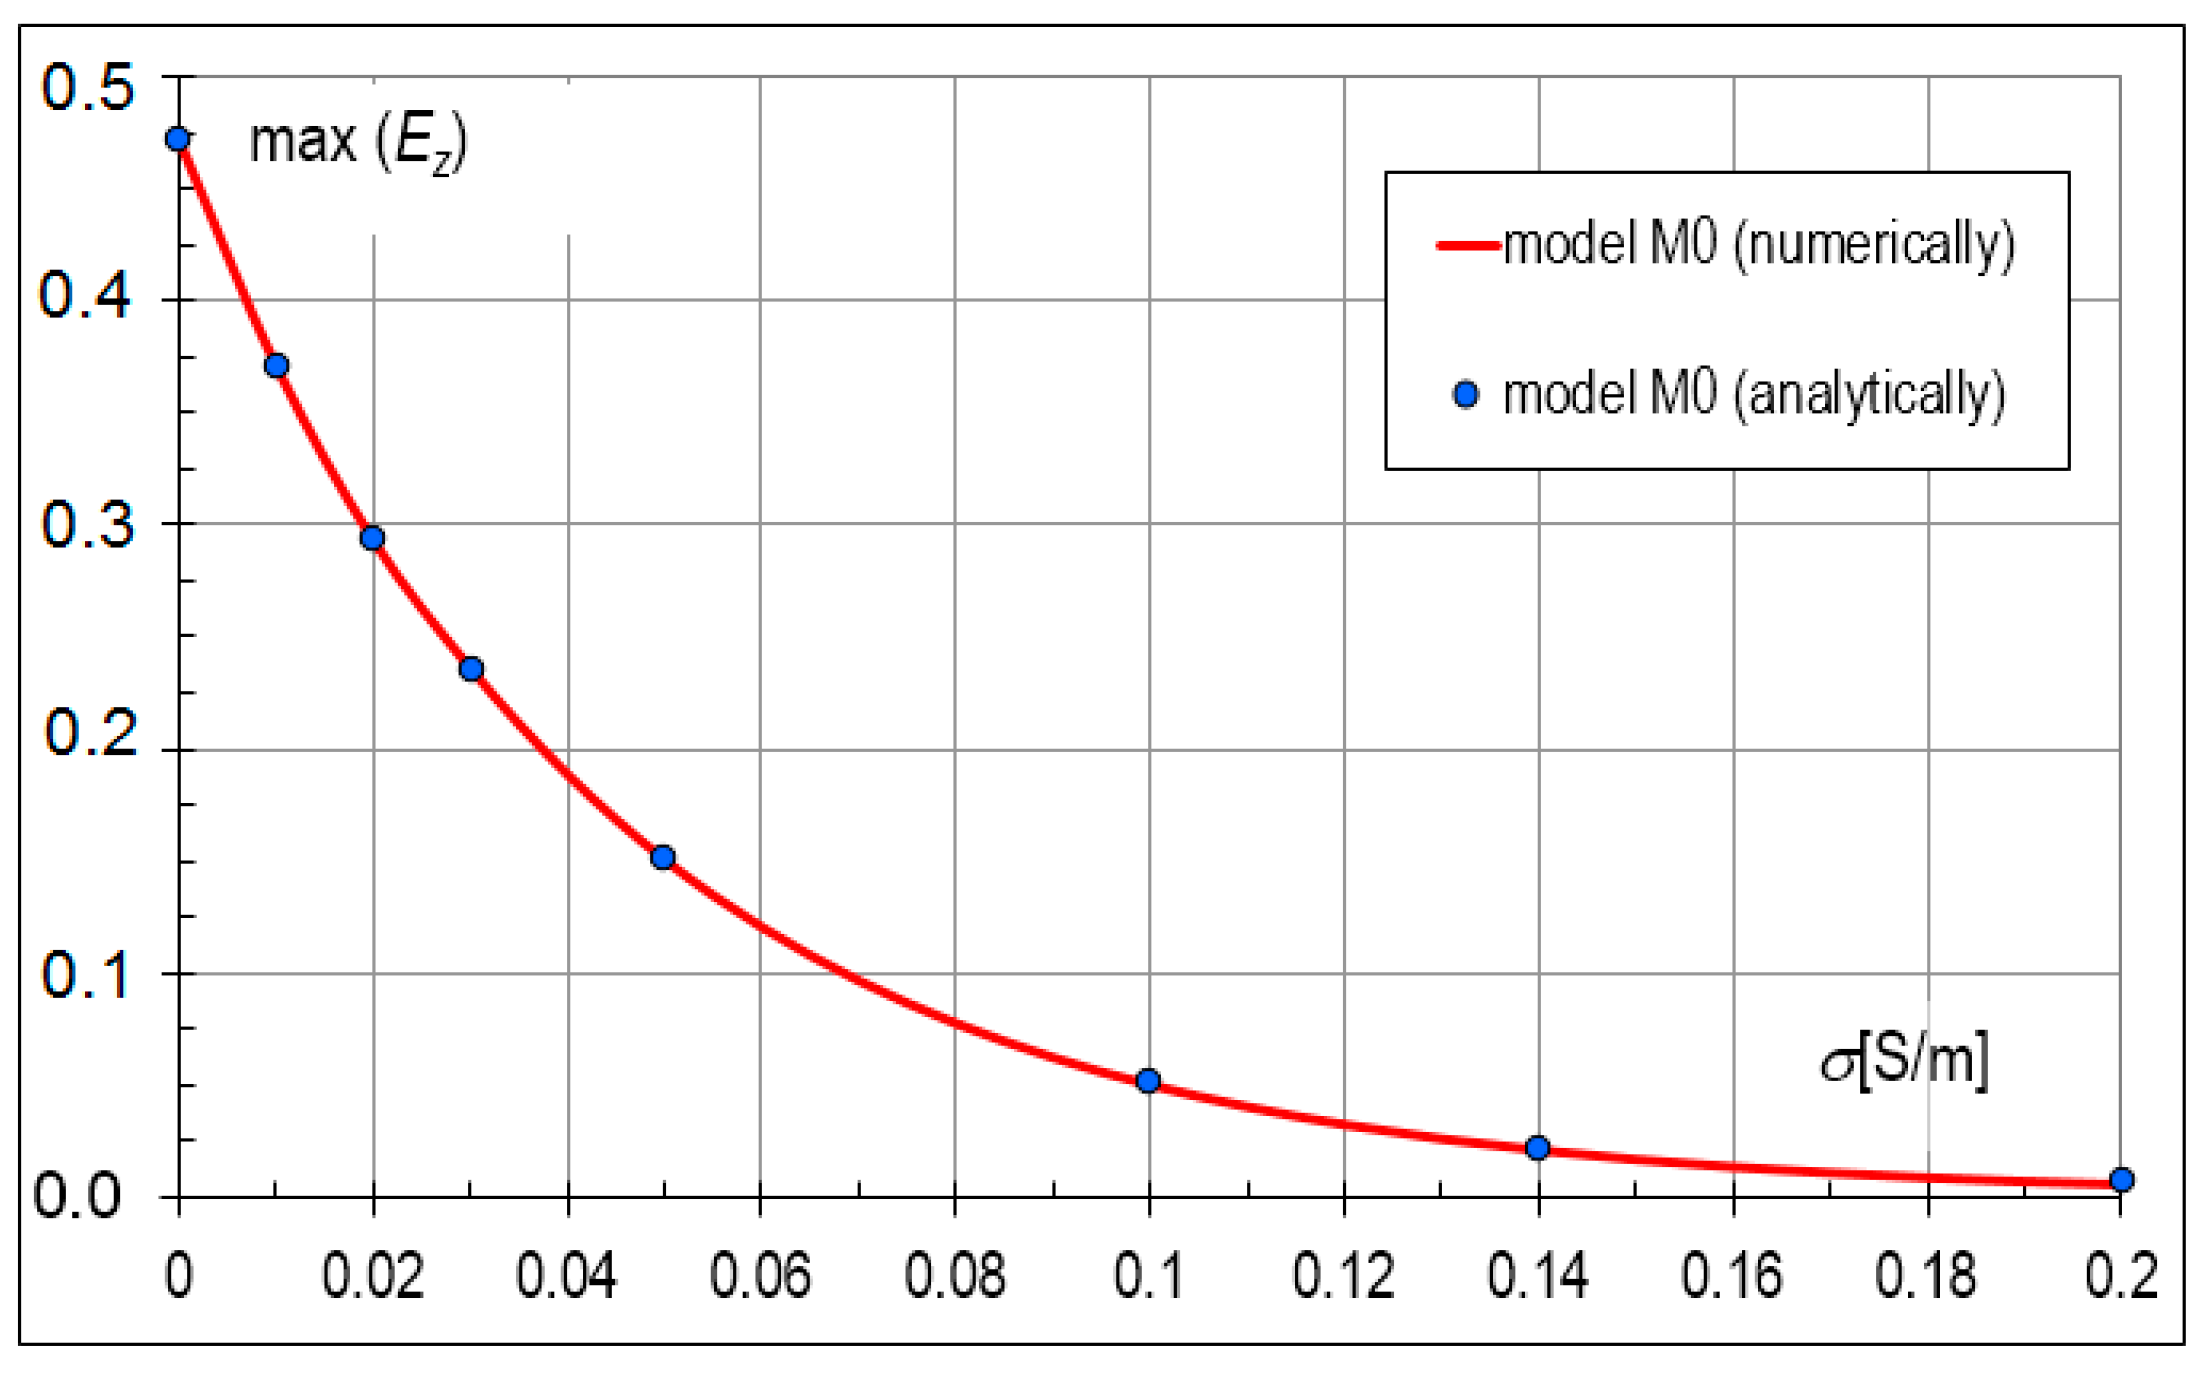
Before starting the multivariate analysis, tests were carried out to verify the correctness of the adopted assumptions. First, the calculation results were verified for the model of a wall made of solid brick M0 (
ro = 0 m). For this purpose, an algorithm was developed to determine analytical values based on formulas for a plane wave incident perpendicularly on the boundary of two media [
46]. The written function with different conductivity values was run in Matlab R2009b [
47]. The analytical results were compared with the results obtained using the FDTD method to verify the correctness of the numerical assumptions (including the PML layer and the periodicity of the system). The tests showed that adopting smaller differential grid sizes significantly reduced the error value, which is a sufficient criterion for accuracy. Assuming a cell size of Δ = 0.5 mm, the error value between the analytical and numerical methods did not exceed 1% (
Table 4). There were 118 cells per adopted wavelength (
Table 5).
Figure 6 shows a comparison of analytically obtained results (marked as dots) with numerically obtained results (line) for the M0 model. The numerical results were obtained using the FDTD method, at Δ = 0.5 mm. Based on the convergence of results, it can be assumed that the adopted numerical conditions allow for obtaining correct results.
4.1. Qualitative Evaluation of Field Distributions in Hollow Brick Systems
Calculations of hollow brick systems indicate local field changes due to wave propagation in a material with a complex structure.
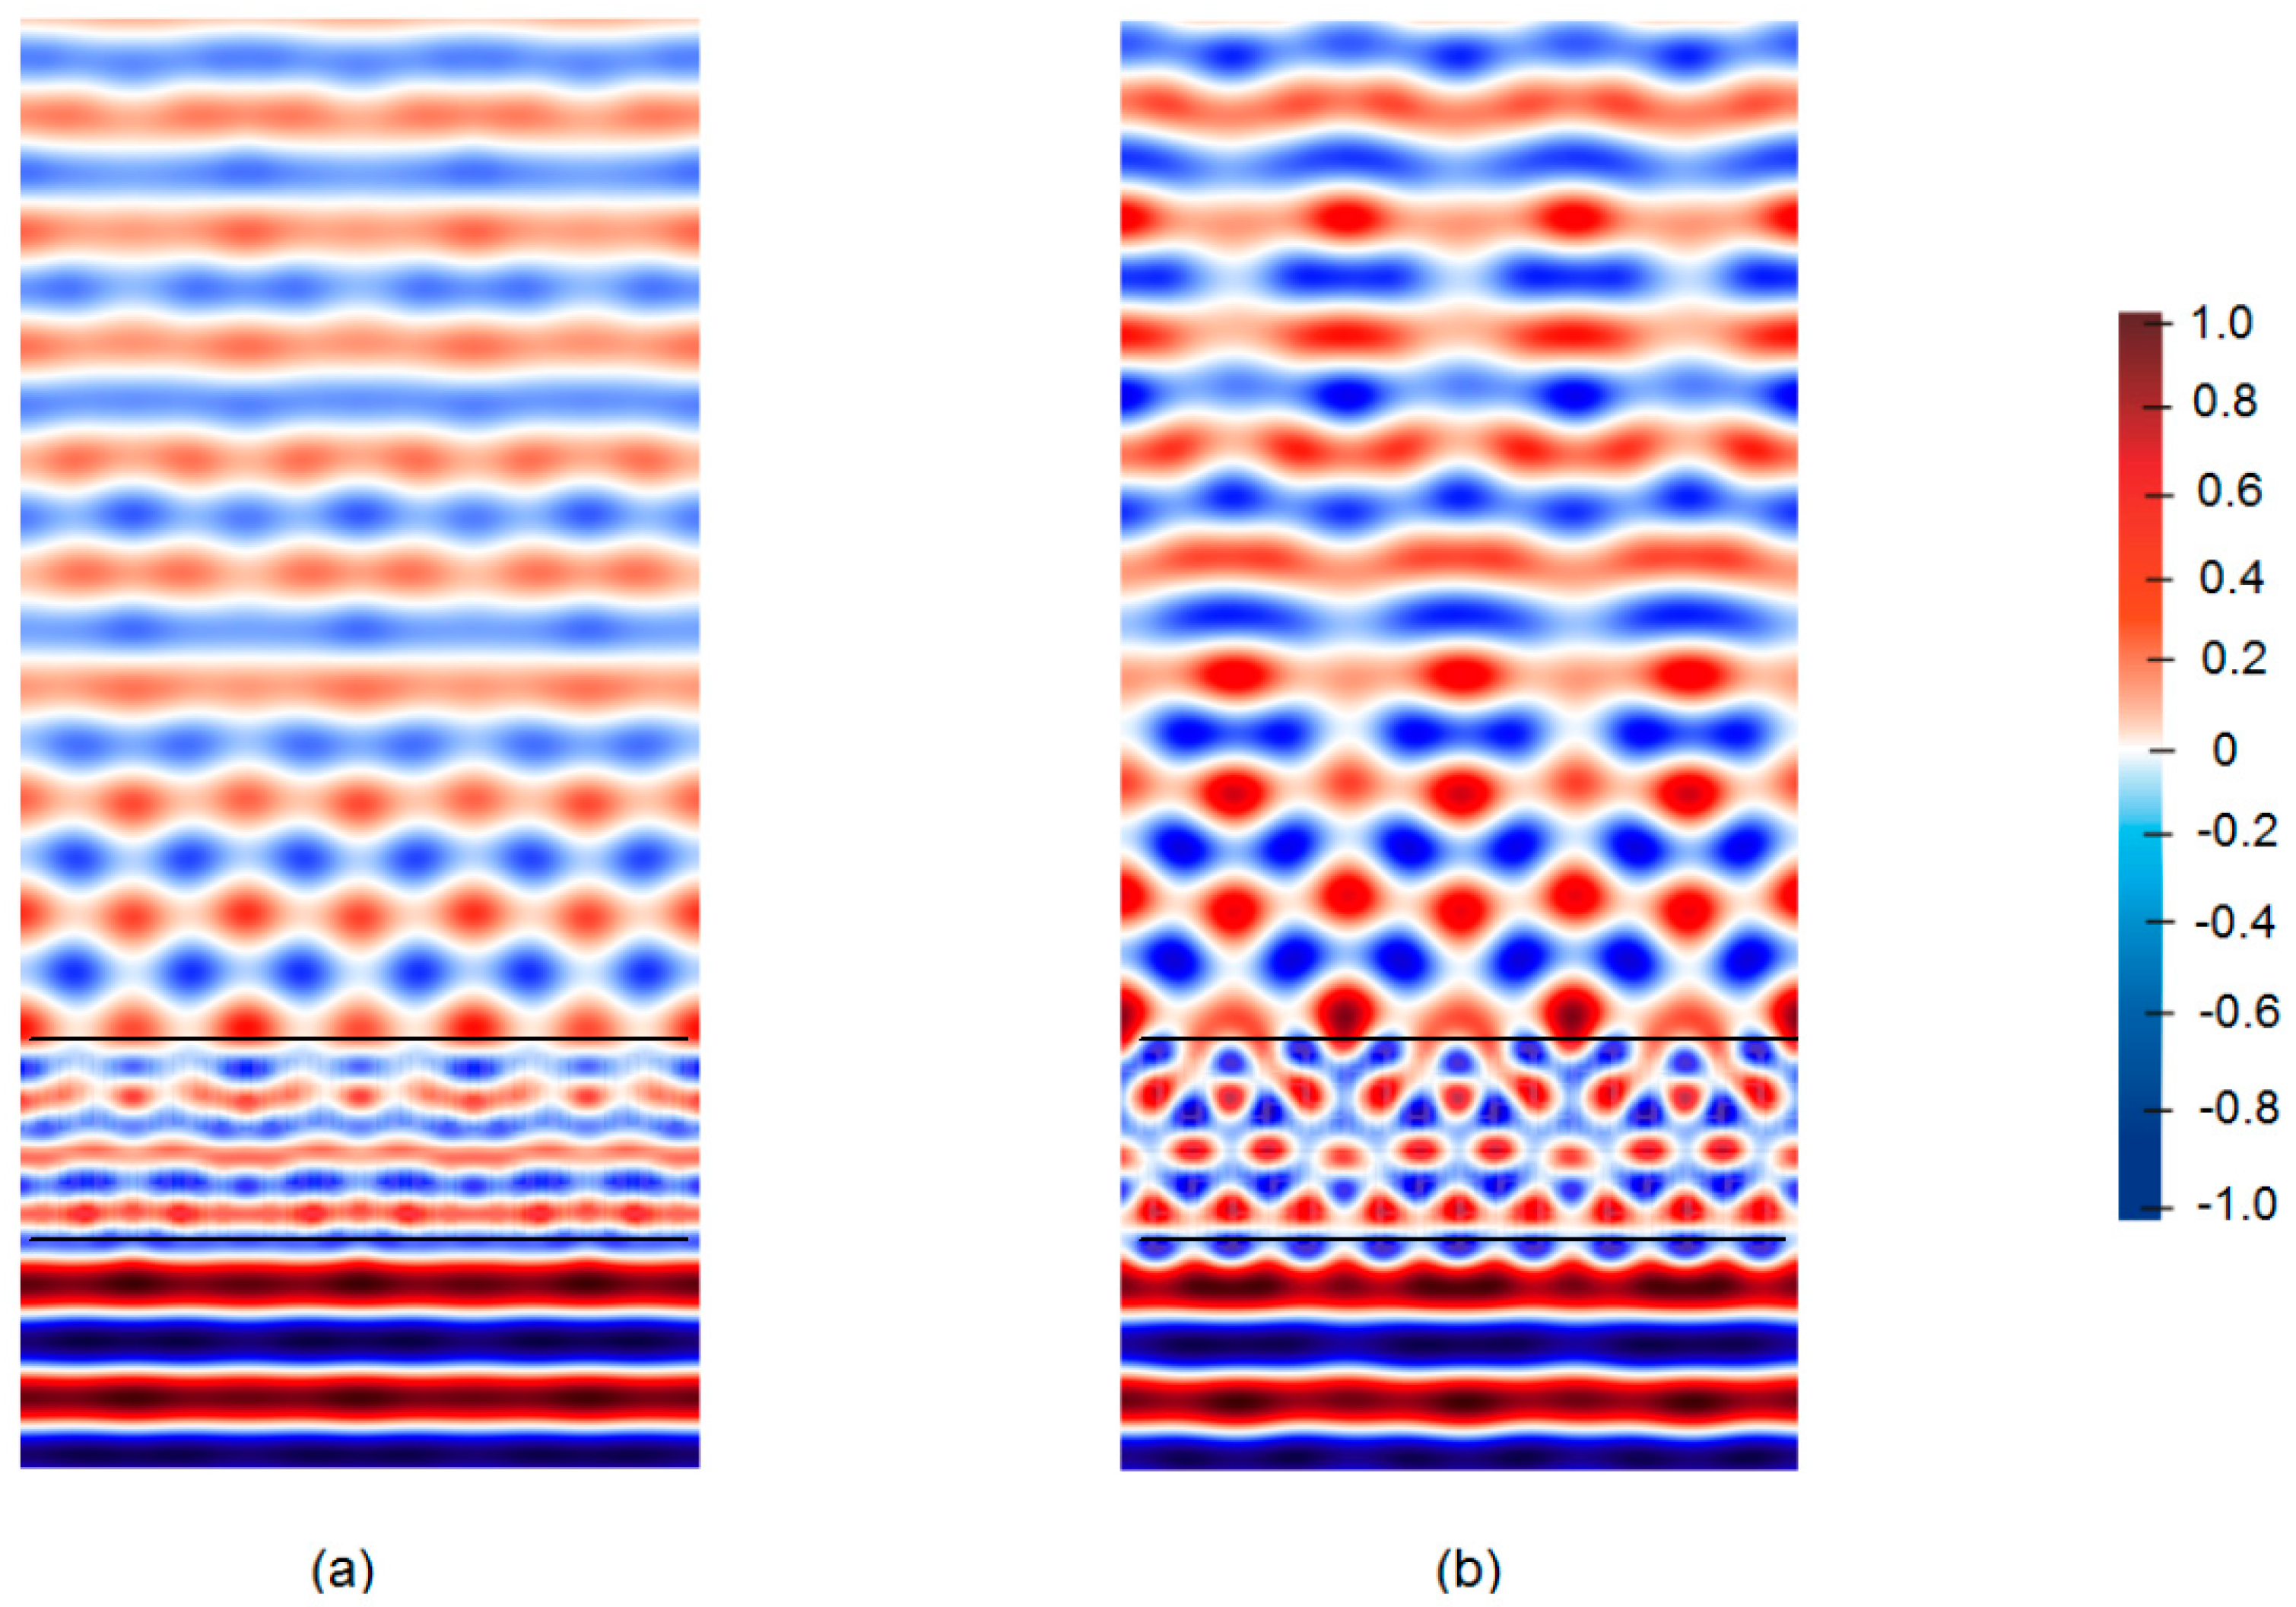
Figure 7 shows an example of the
Ez component distribution for the same, selected moment after reaching the steady state. The presented distribution was obtained assuming typical hollow dimensions:
ro = 0.011 m in the M18a model and
ro = 0.015 m in the M30a model.
In the area behind the wall, a decrease in the electric field intensity is noticeable, resulting from the loss of the ceramic mass (σ = 0.01 S/m). The propagation of the electromagnetic wave in the brick area is complex. The porosity of the brick affects the appearance of multiple reflections at the air-ceramic mass boundary. The number and size of the hollows in the brick result in a change in the field image in the area close to the wall. The local change in the wave speed when passing through subsequent areas of the brick is reflected in the field distributions and the occurrence of interference. Due to the large number of hollows and boundary surfaces, the indicated effect is particularly visible when assessing the phenomena occurring behind a wall made of brick with 30 hollows. The range of field changes in this case takes on greater values. The effects of wave reflections from the wall, causing the formation of momentary minima and maxima, are particularly visible at a distance of 0.7 m in front of the wall.
The analyzed differences in field values can be explained in macroscopic terms by taking into account the share of ceramic mass in the brick. The difference in Vc between the two analyzed types of bricks was 16.38%. A higher Vc value causes less wave front distortion in the area behind the wall. This results from a greater resultant homogeneity of the material. However, due to attenuation, it negatively affects the maximum field values. In the M18a model, the field values are higher by about 12% than the values obtained for M30a. The macroscopic description does not take into account local inhomogeneities in the field distribution and wave phase shifts.
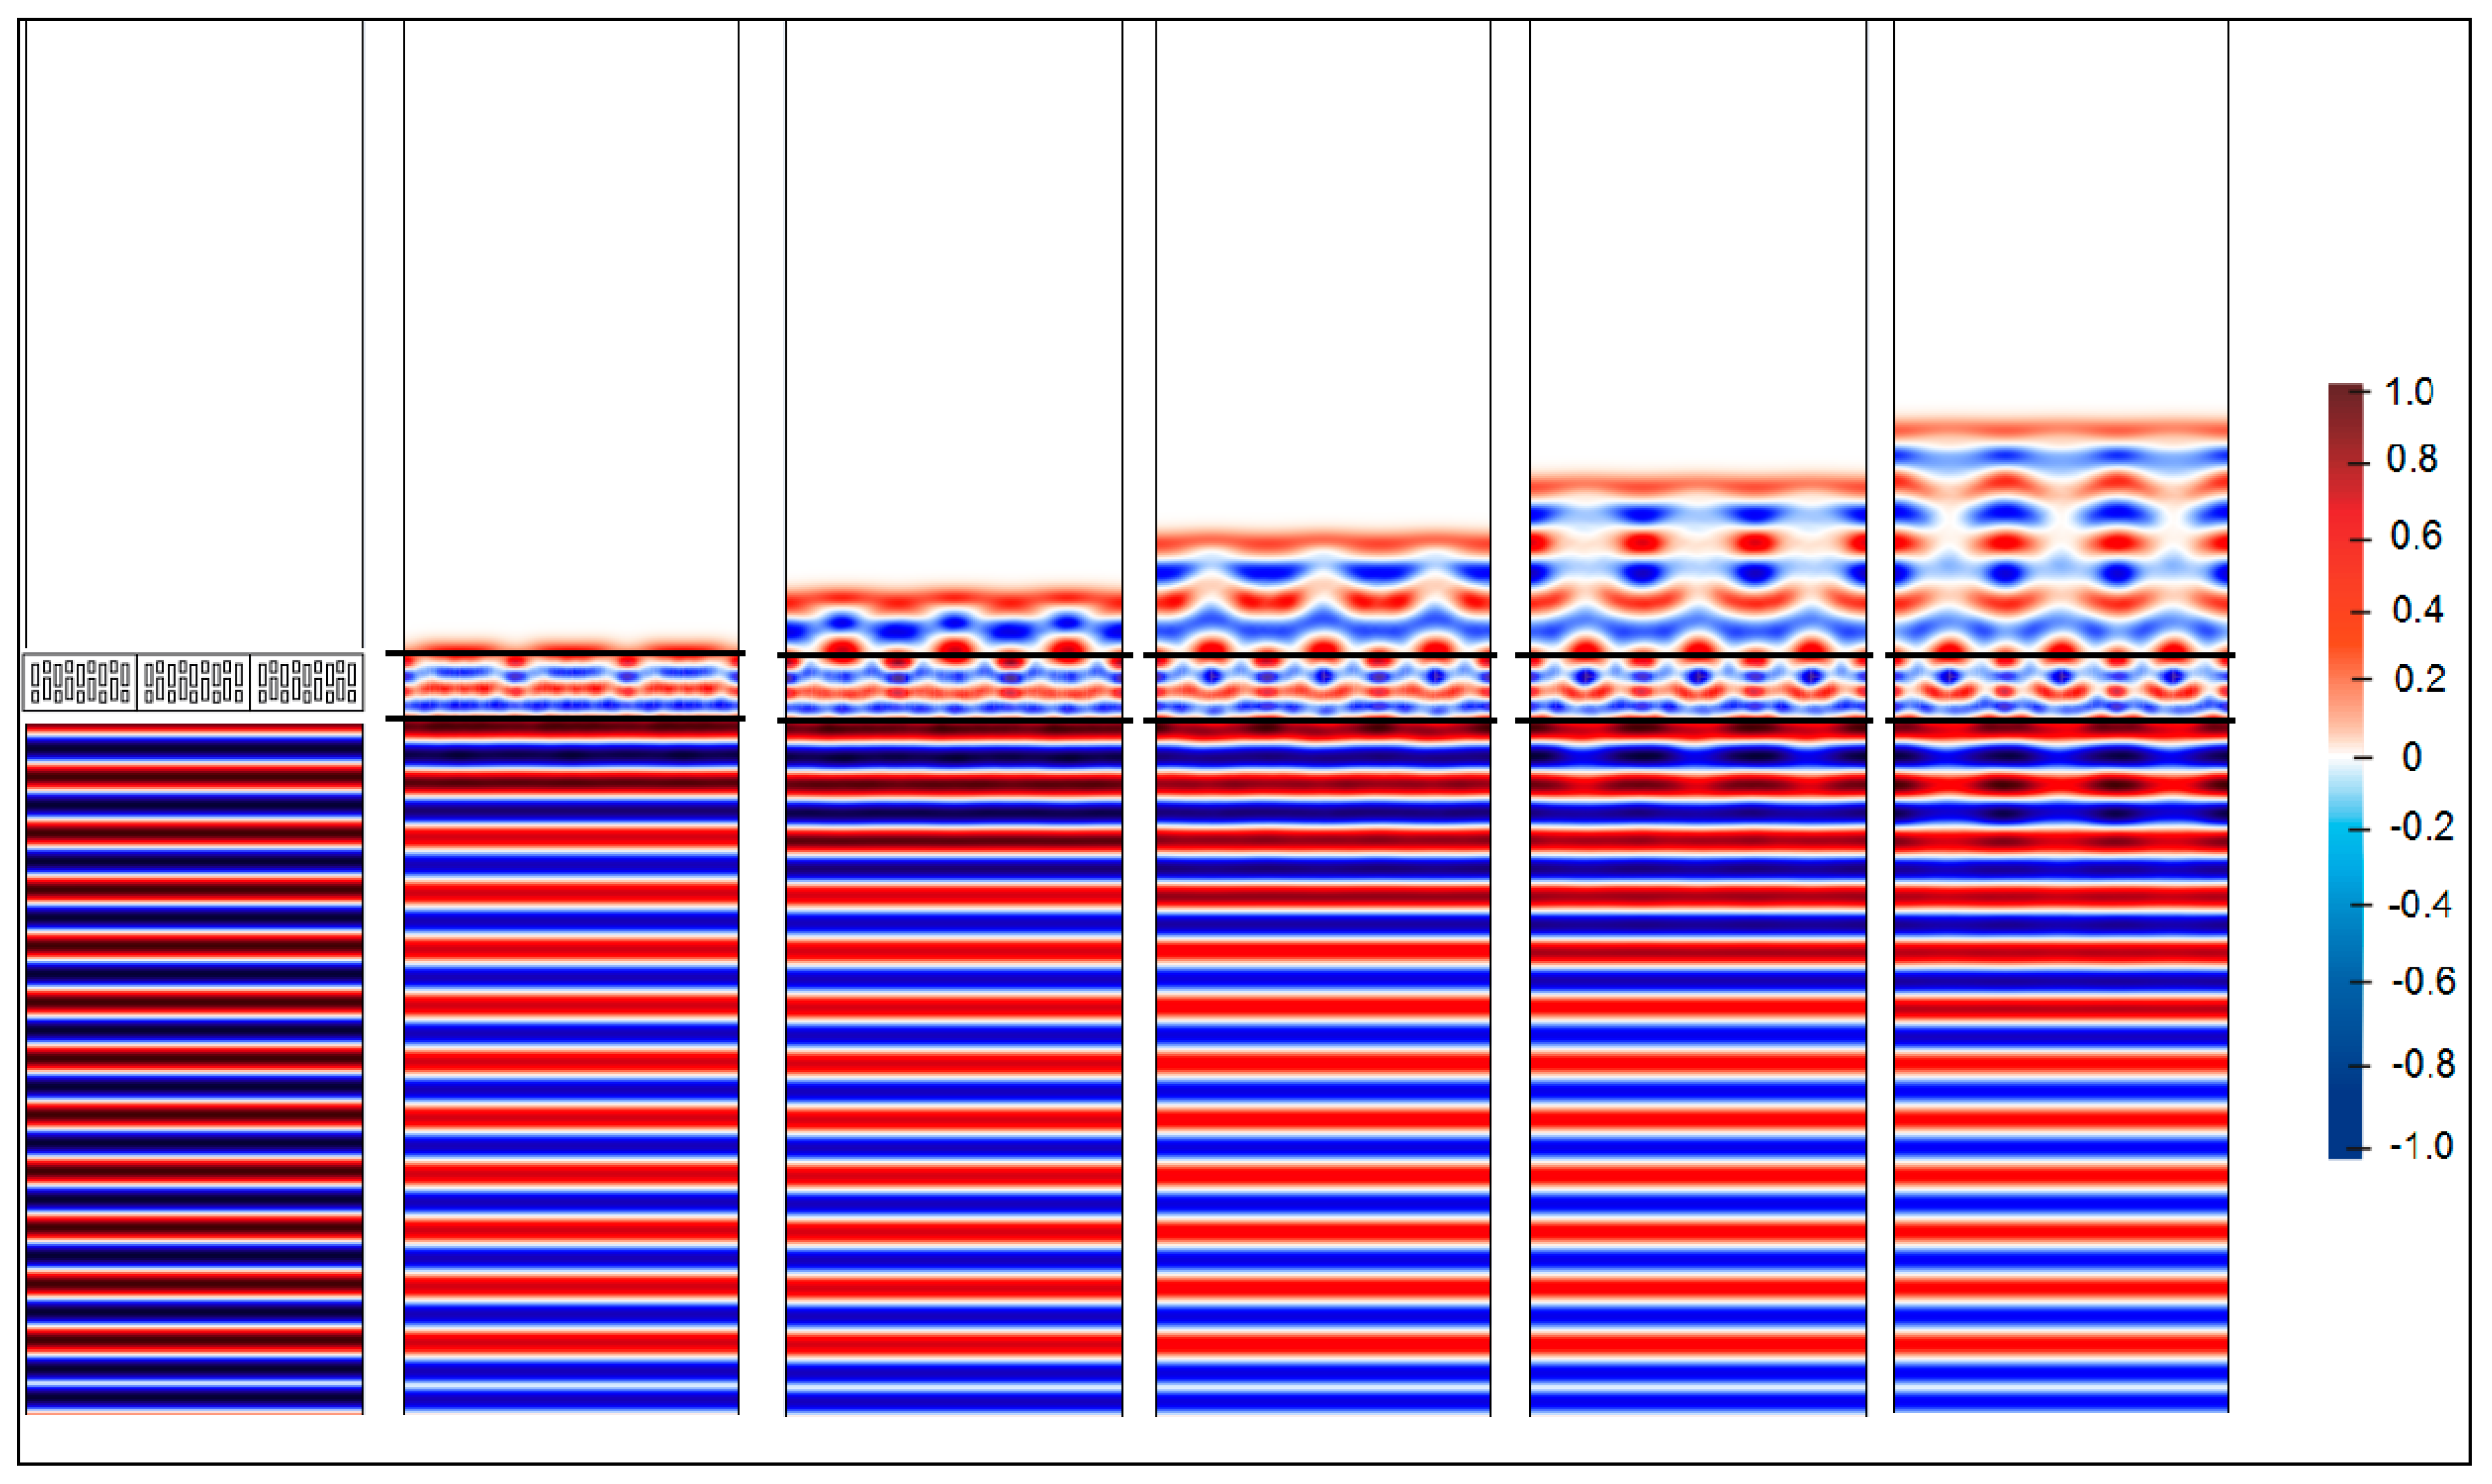
In order to better observe the propagation of the EM wave through a complex area,
Figure 8 presents the instantaneous field distributions. In order to make the changes in the wave front more visible, the figure shows the entire area with a single-layer wall made of bricks with 18 hollows. As can be seen, the above conclusions are also visible in
Figure 7, where one can observe the increase in the value, in front of the wall, due to reflections from the wall. The reflected EM wave causes, among other things, the superposition of waves, which results in momentary strengthening or weakening of the electric field.
4.2. The Influence of Conductivity and Structure Inside Bricks
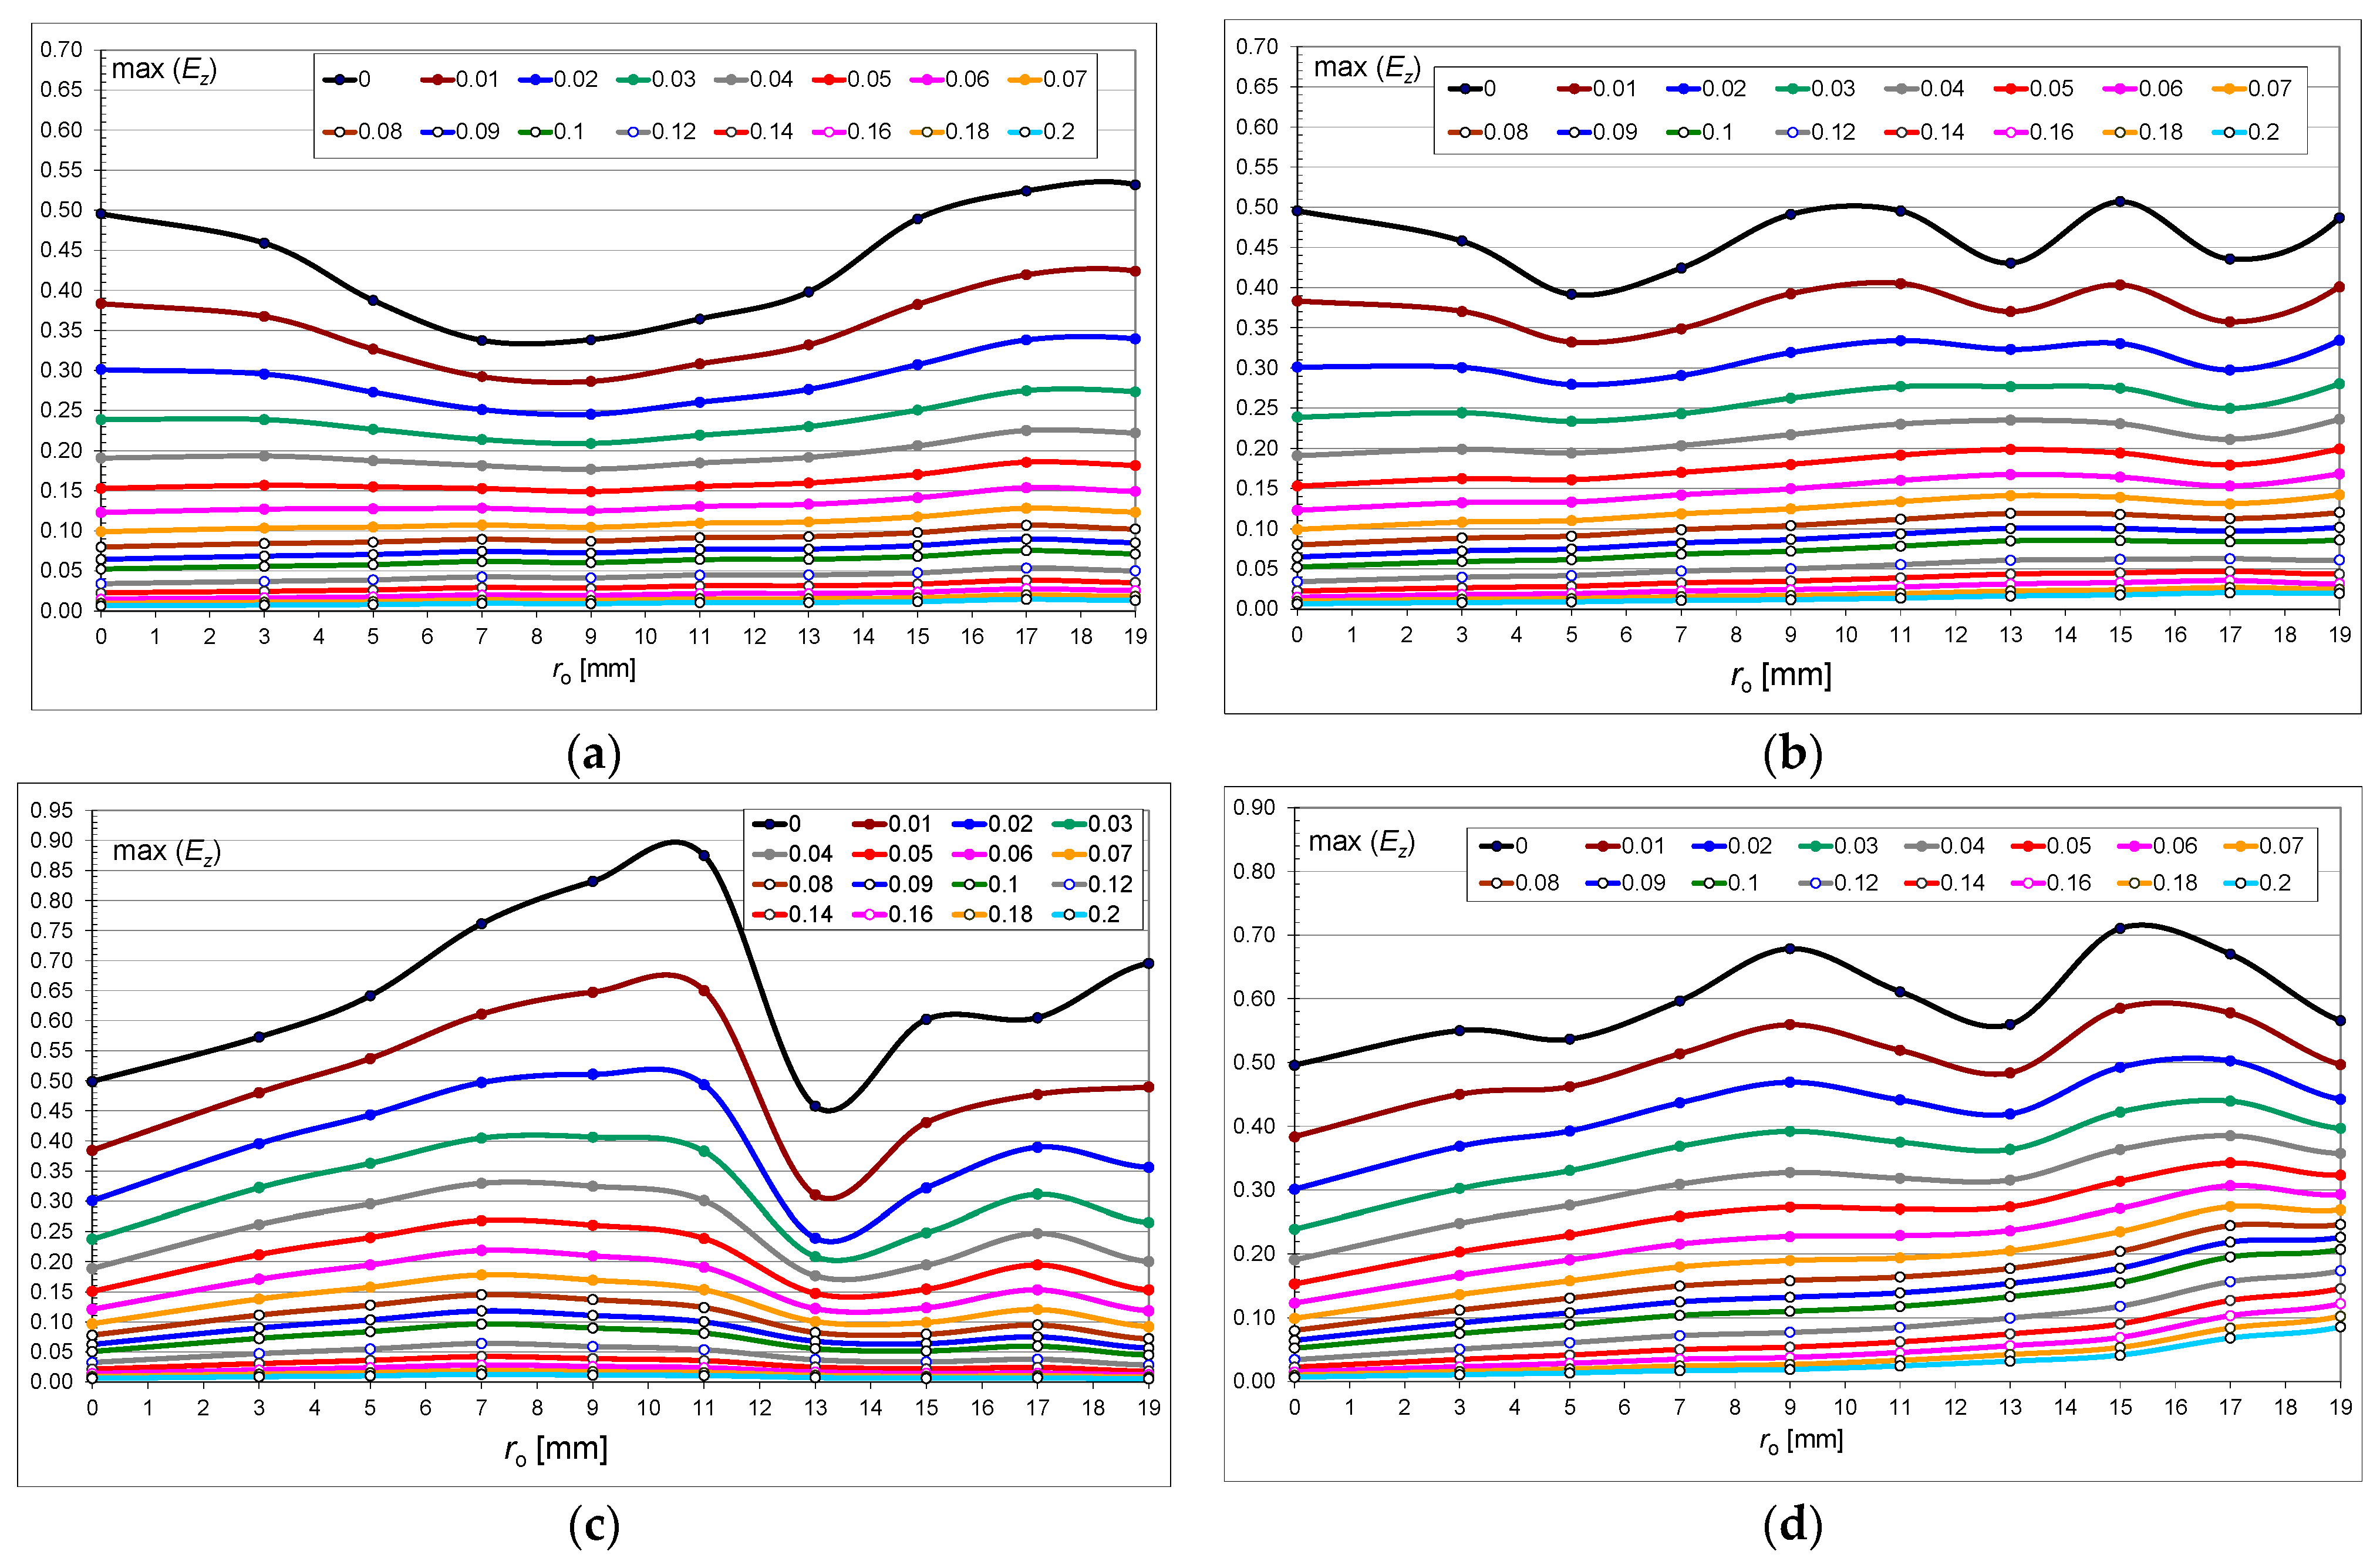
Figure 9 shows the changes in the maximum relative value of the
Ez component depending on the brick conductivity value and the size of the hollows (
ro) for the asymmetric (M18a, M30a) and symmetric (M18s, M30s) wall. Comparing the asymmetric and symmetric models with 18 hollows, it can be seen that a clear decrease in the value occurs in both models at
ro ∈ {0.005; 0.011} m. However, when the hollow size is above 0.011 m, the electric field values increase. However, at these values of the hollow size in the symmetric model, they are higher by about 38% for
ro = 0.017 m.
When comparing the models with bricks with 30 hollows (M30a, M30s), three momentary decreases in the electric field value can be observed in both models (ro = 0.005 m; ro = 0.013 m; ro = 0.017 m). Similarly, to the comparison for the models with 18 hollows, the field intensity values are higher for the symmetric model (M30s). The largest difference of about 44% is for ro = 0.013 m. A decrease in the field value (about 20%) was also observed in the M30a model in the case of a low-loss material (σ ∈ 〈0; 0.05〉 S/m) at ro ∈ {0.005; 0.017} m. The observed effects should be associated with the complexity of field phenomena during wave propagation in a porous material.
Based on the course of characteristics from
Figure 9a,b, it can be stated that the differences between the graphs illustrating the field values at different hollow widths in the M30a model are on average twice as large as for the M18a model. For example, for
σ = 0.1 S/m and M18 bricks, the value of the observed component for
ro = 0.015 m is higher by about 5% than in the same model for
ro = 0.011 m, while in the second variant of bricks (M30), considering the same case, the difference is about 10%. Considerable material lossiness causes the characteristics to have a course similar to the variants with a homogeneous lossy material. Increasing the size of the gaps (air area) at the expense of the dissipative dielectric reduces the resultant wave attenuation. The characteristics for both bricks with 18 and 30 hollows have a monotonic course.
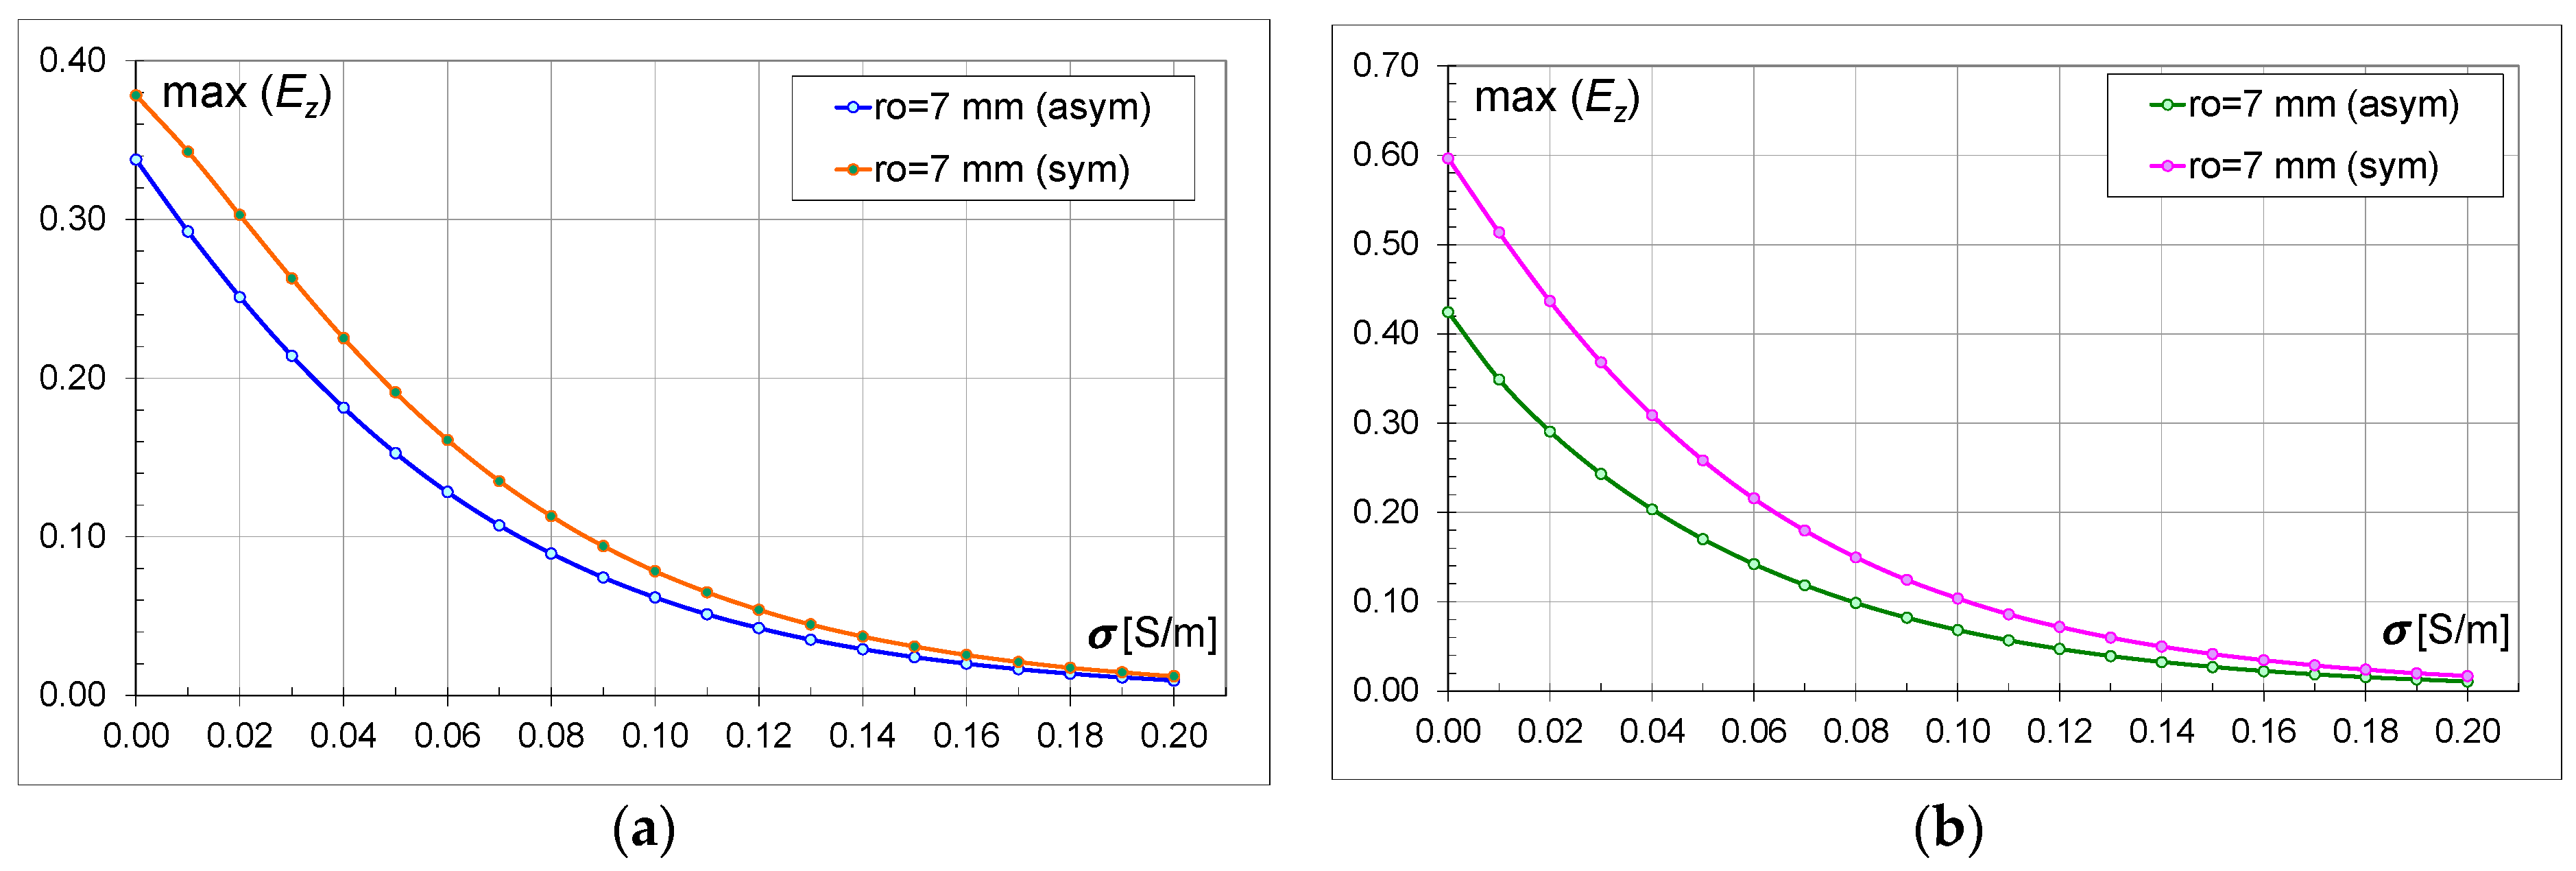
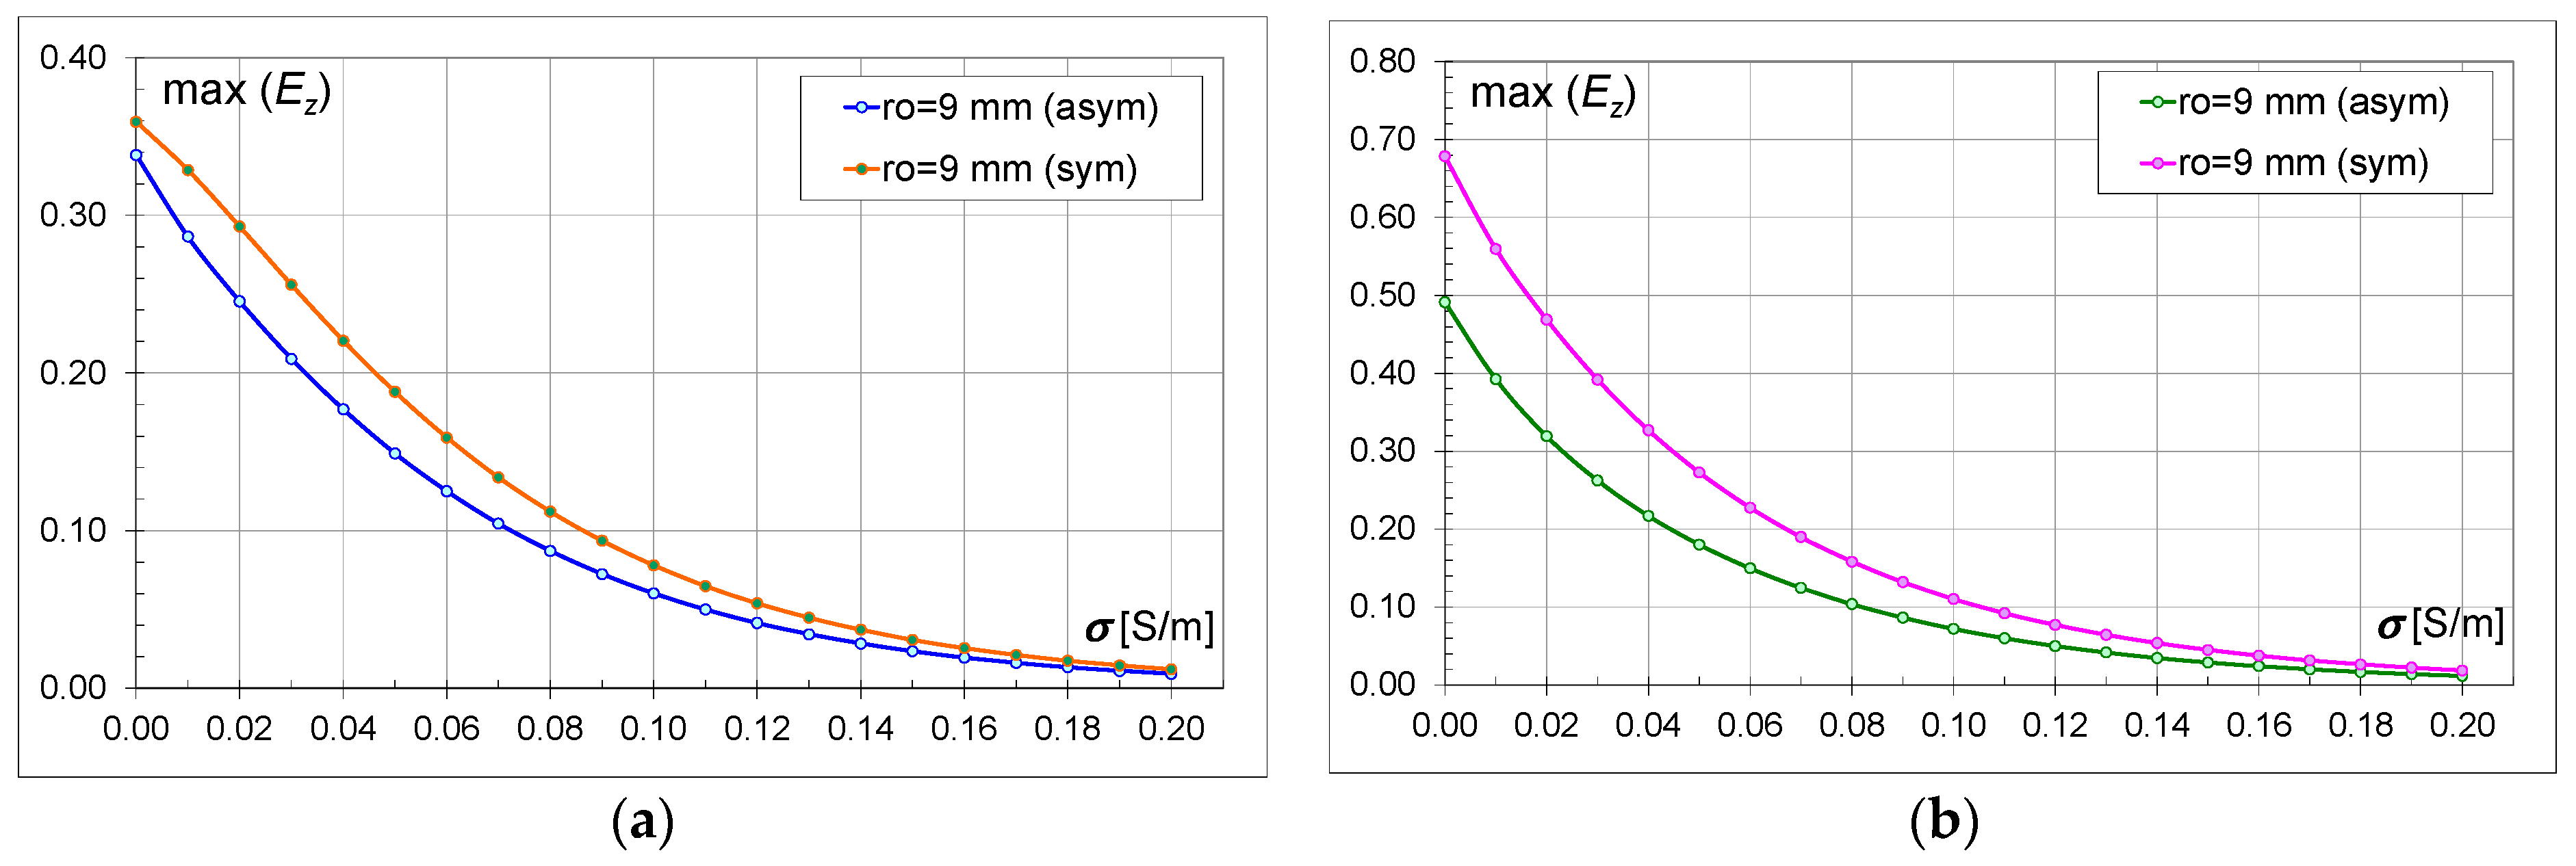
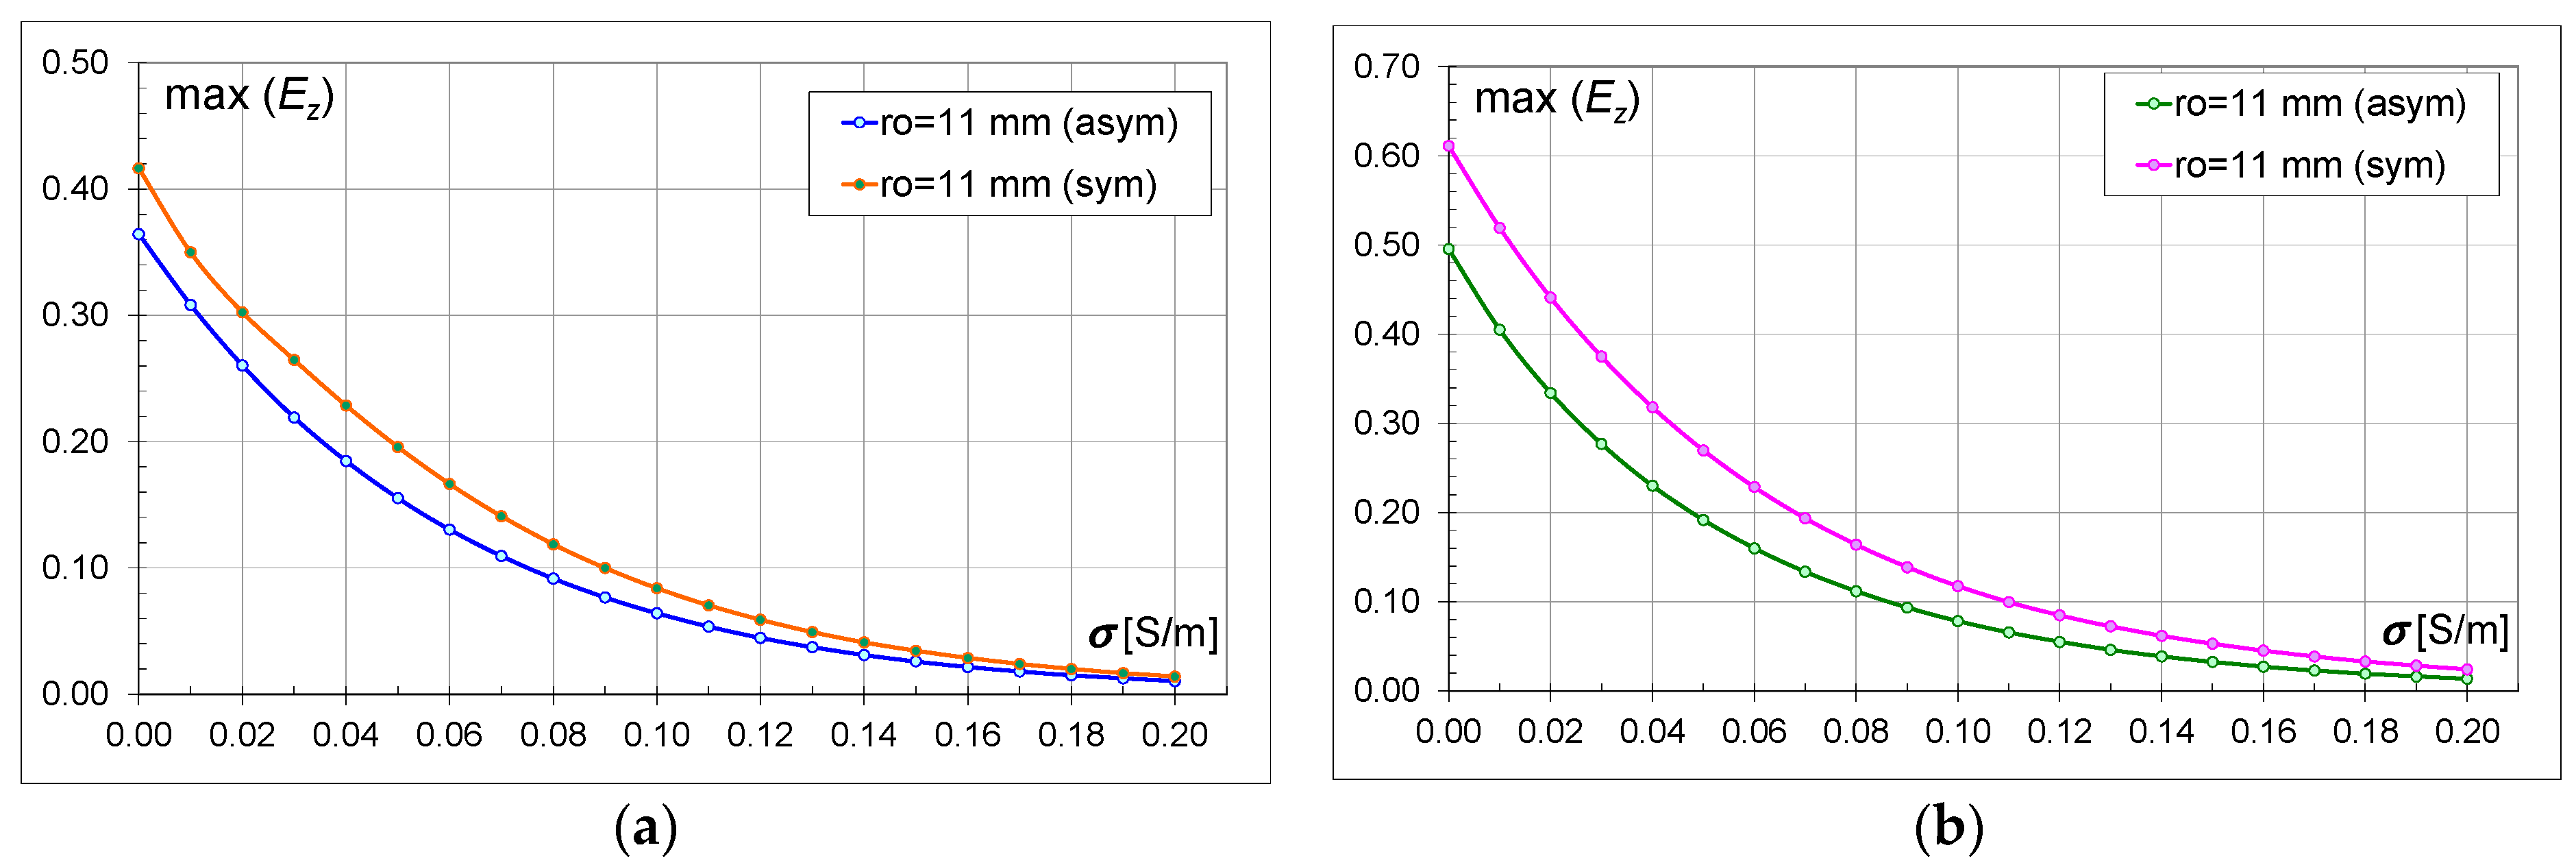
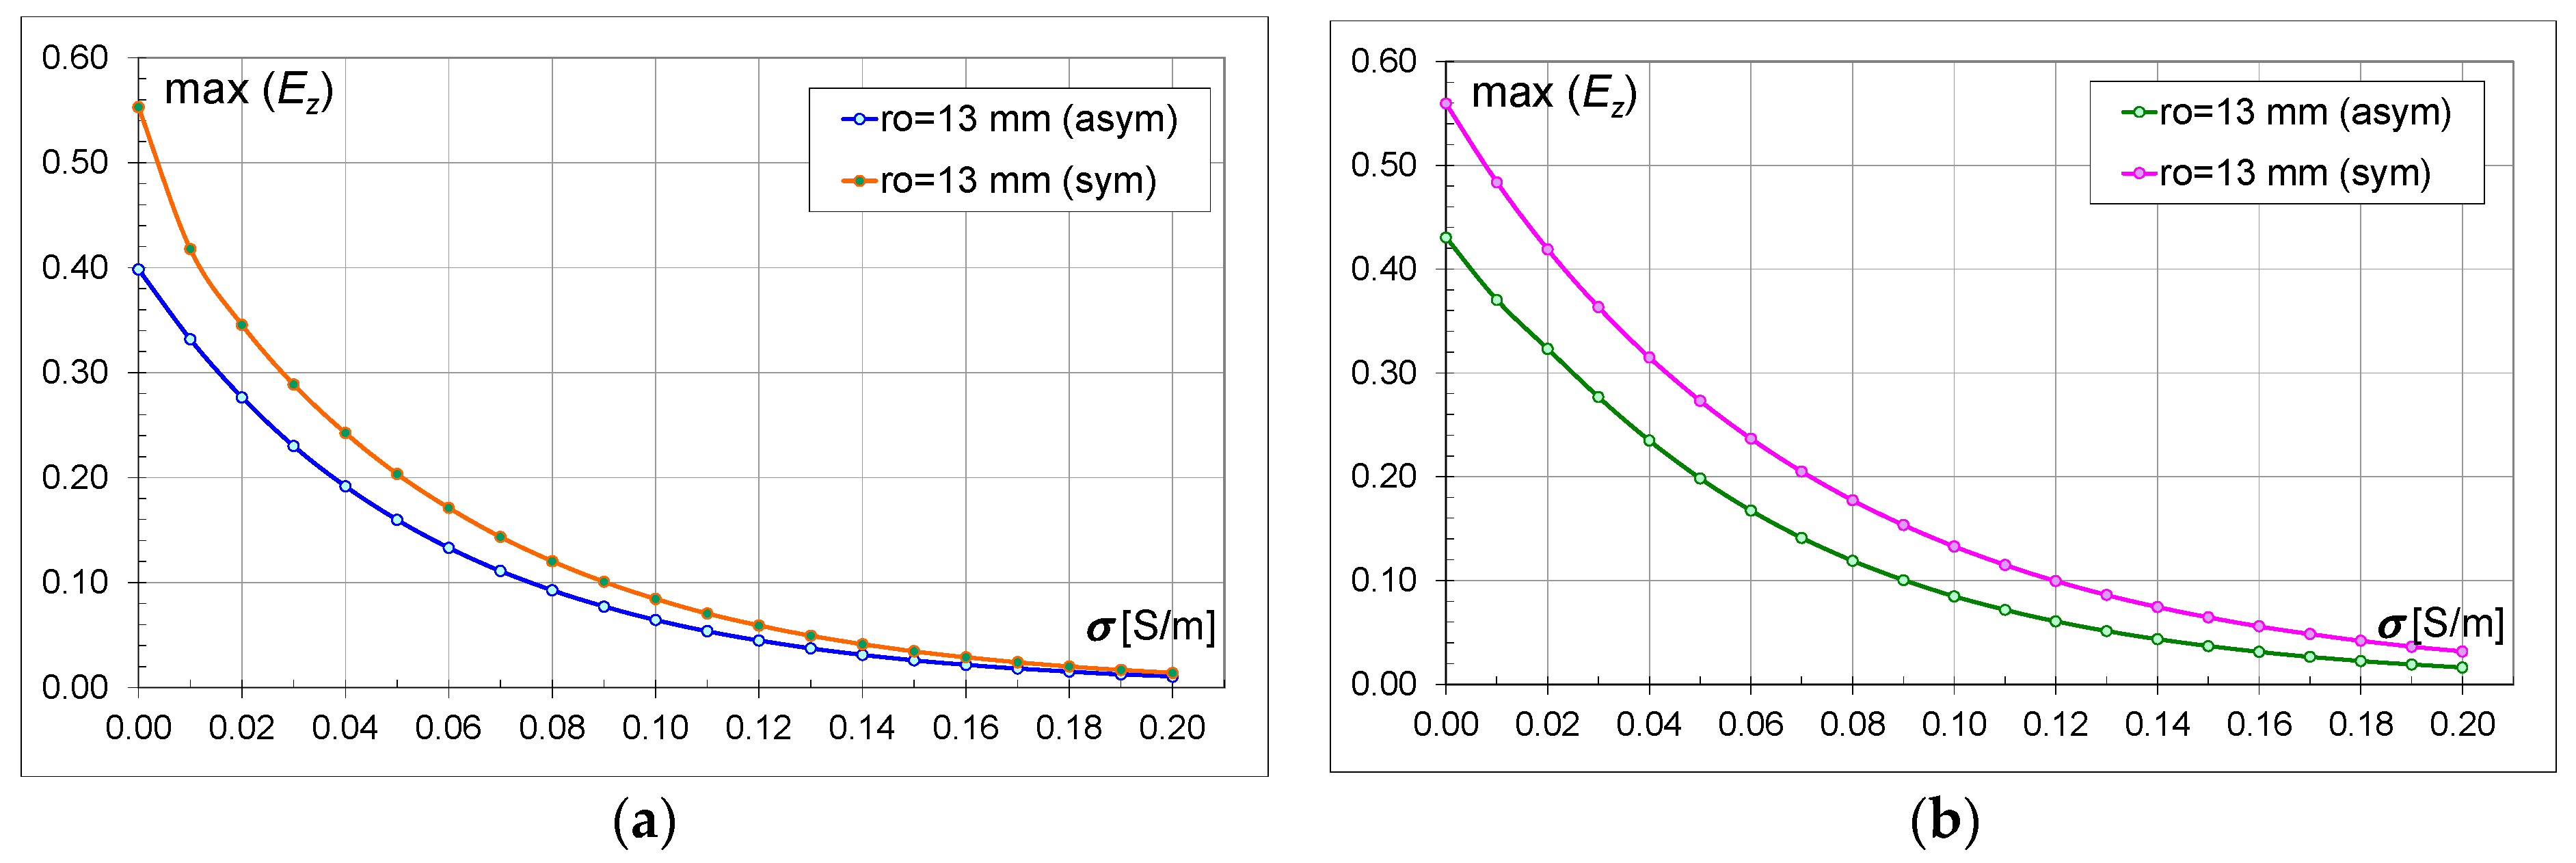
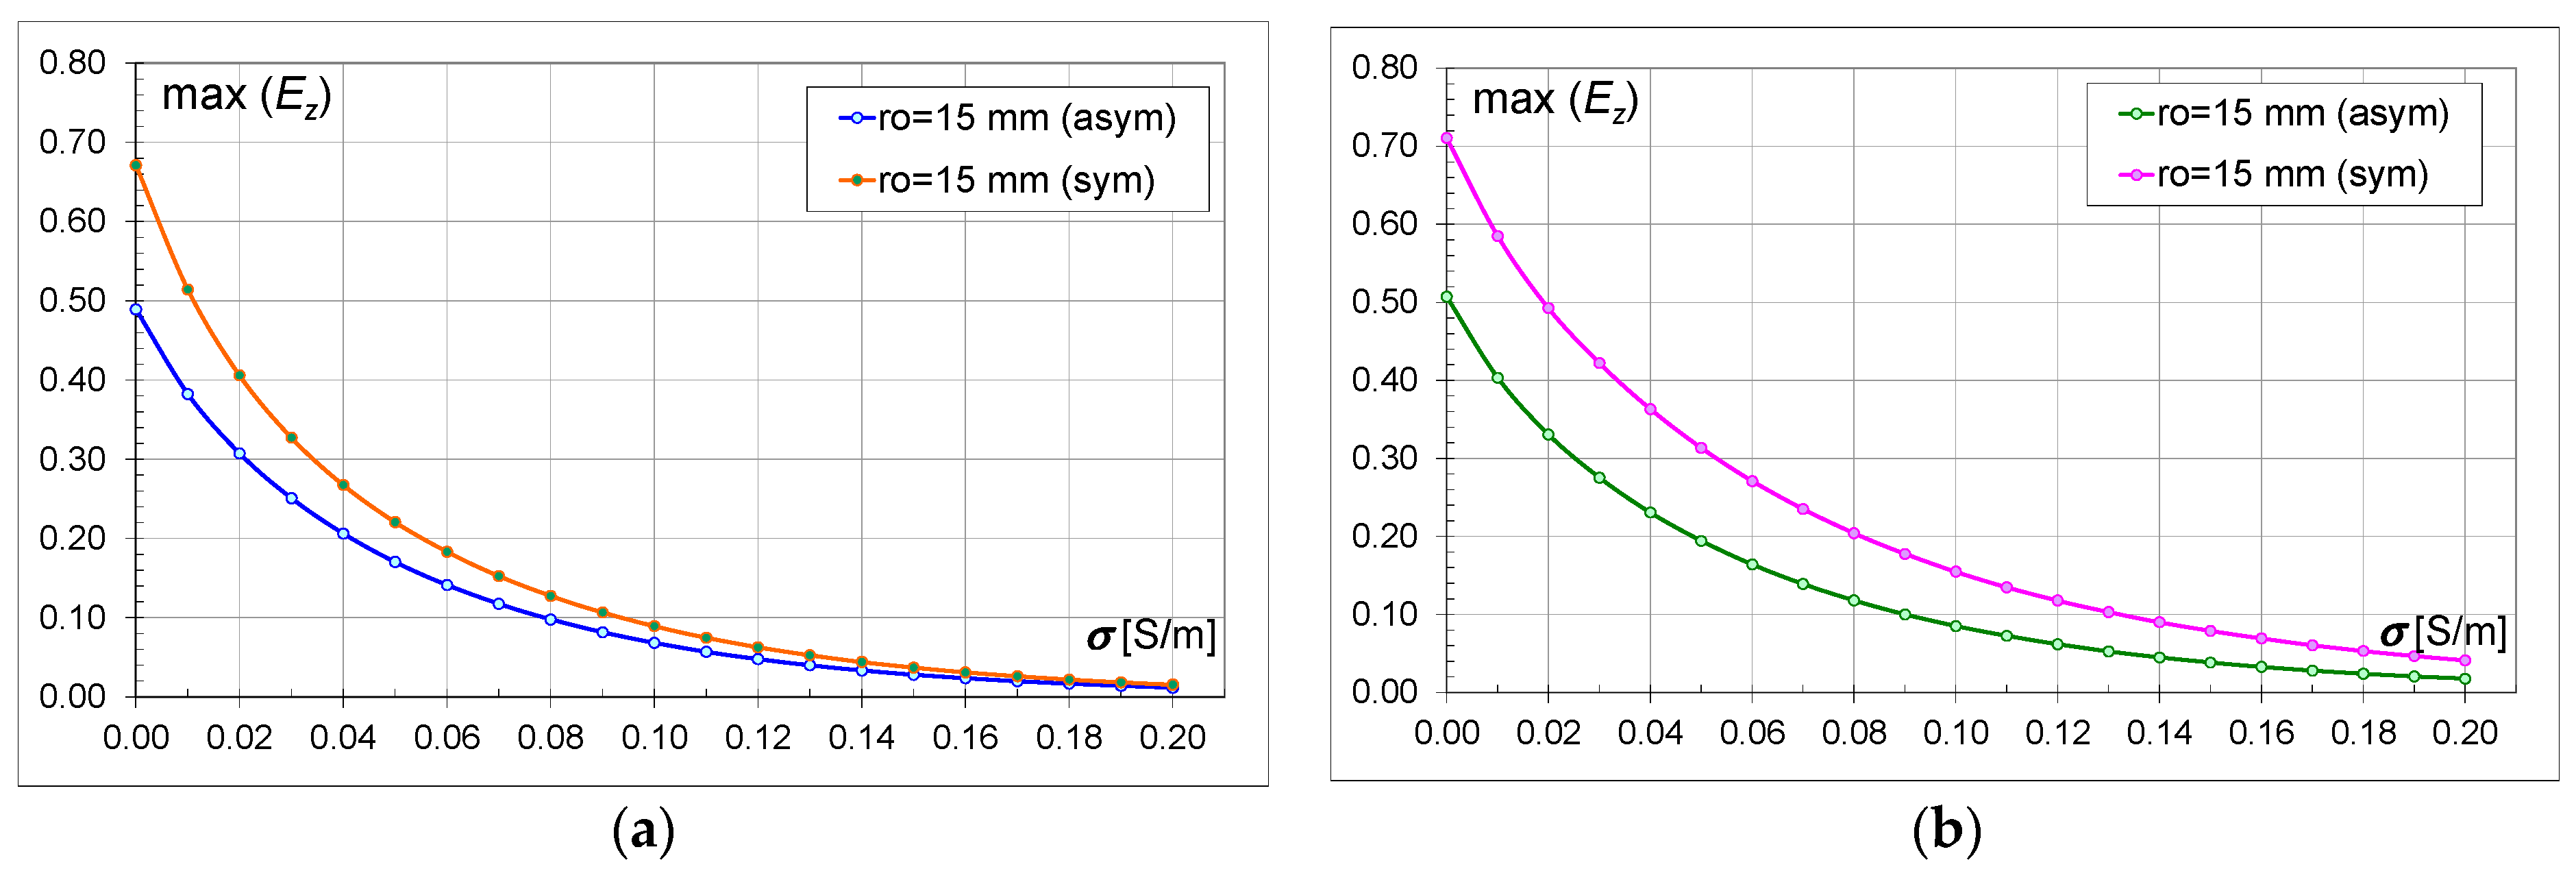
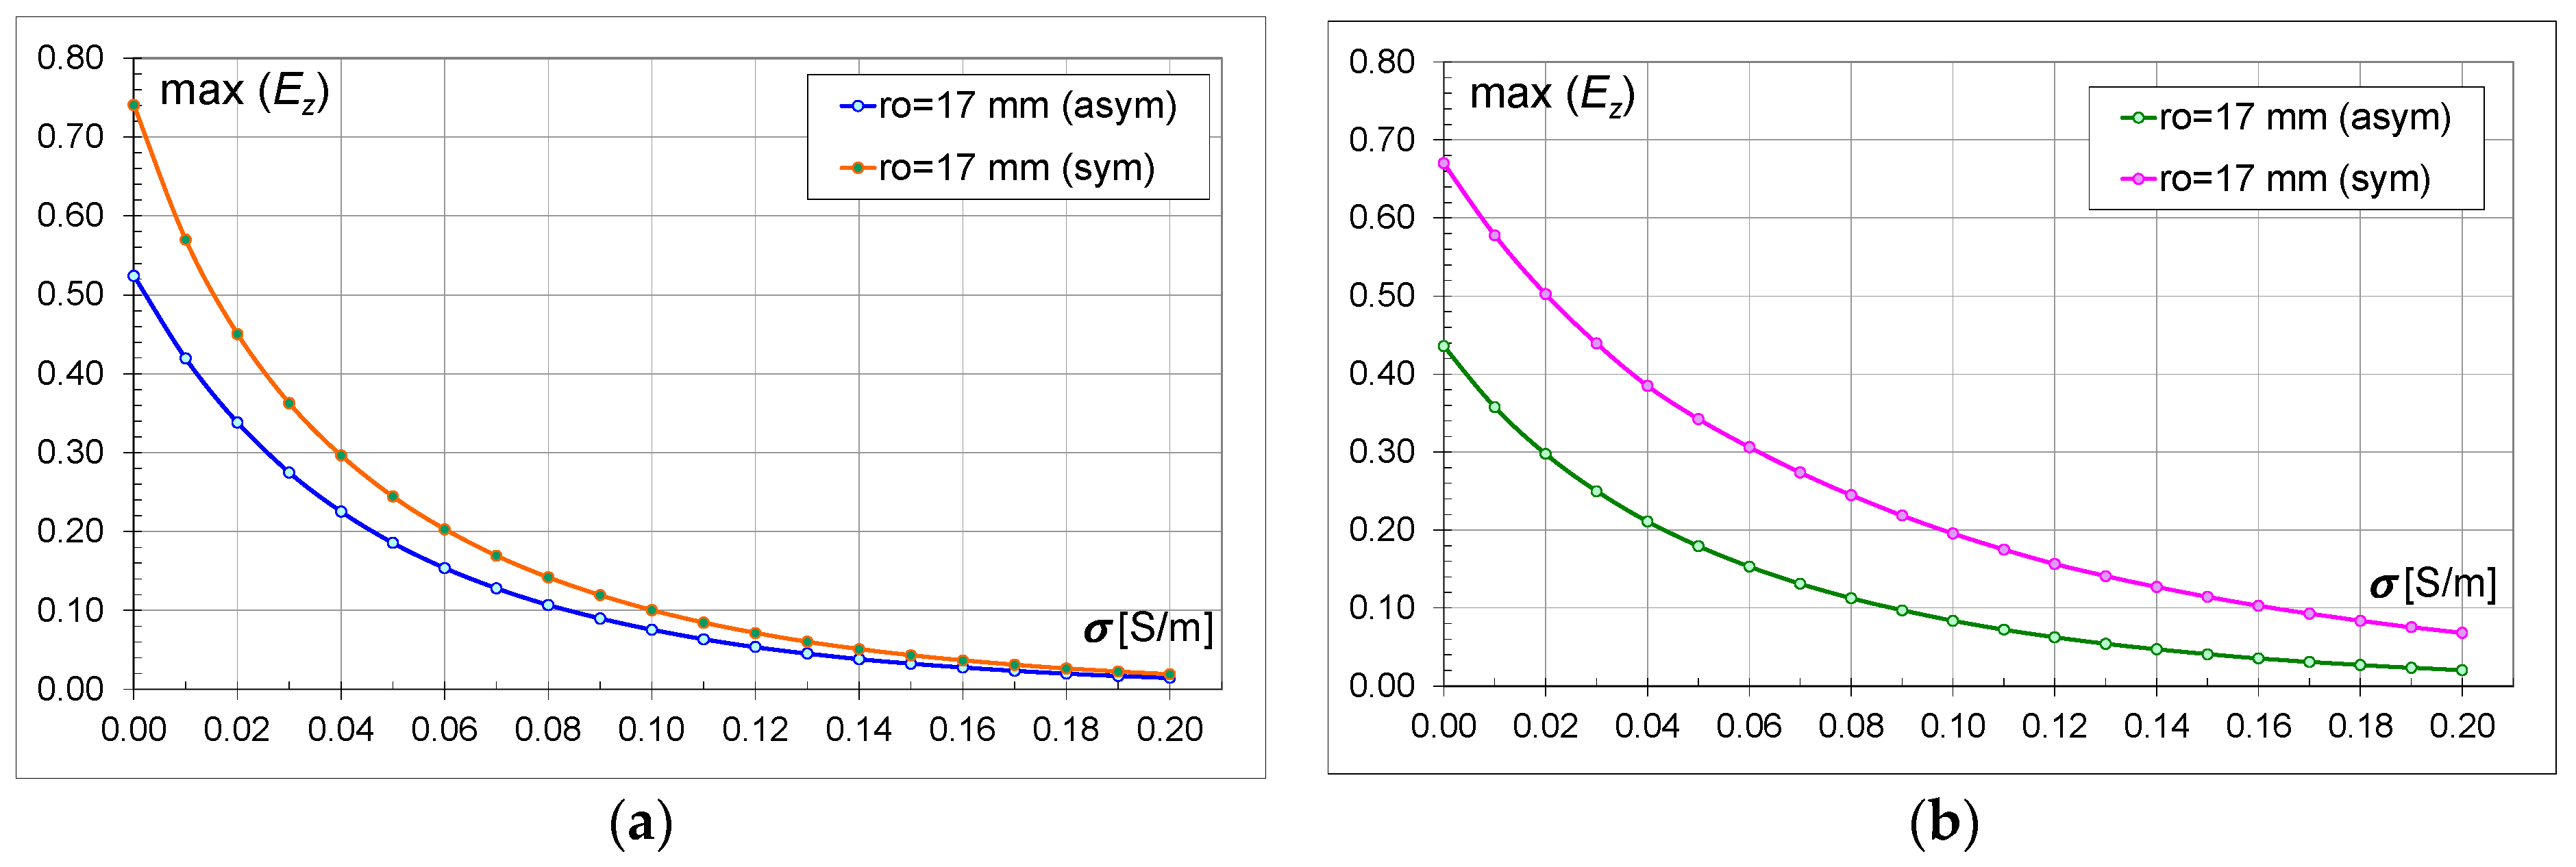
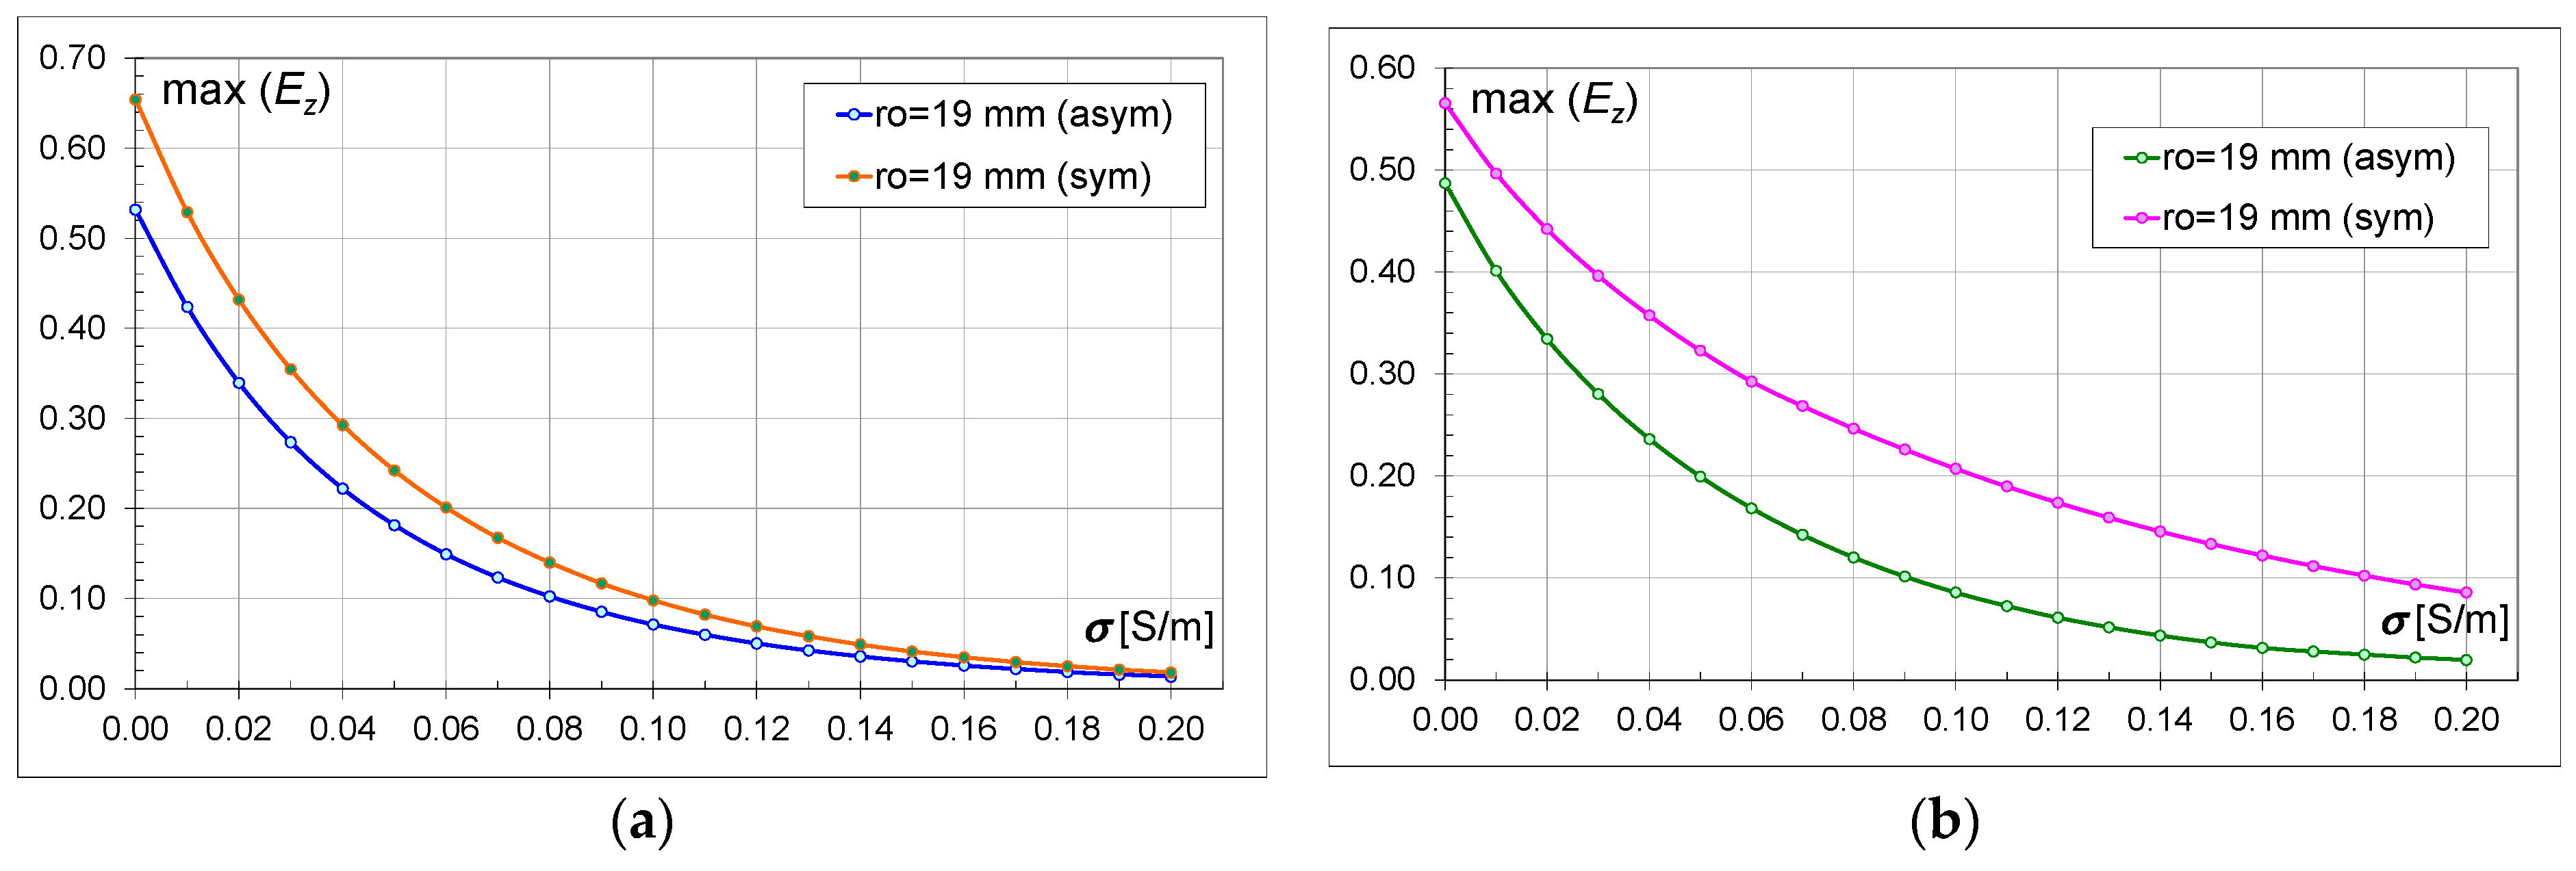
4.3. Comparison of Asymmetric and Symmetric Models
Figure 10,
Figure 11,
Figure 12,
Figure 13,
Figure 14,
Figure 15,
Figure 16,
Figure 17 and
Figure 18 show the characteristics of the field intensity variation depending on the conductivity and the size of the holes. The max(
Ez) values for the asymmetric and symmetric models within the same type of bricks are compared. For example,
Figure 10a shows the characteristics for
ro = 0.003 m for M18a and M18s. On the graphs, regardless of the type of brick, the size of the hole, and the conductivity, higher values of the field intensity can be clearly observed for the symmetric models (M18s and M30s). Greater differences between the field values occur for the models with bricks containing 30 hollows (M30) than for the models with 18 hollows (M18). When comparing the M18 and M30 models, it can be observed that the higher field strength values are for the models with 30 hollows (
Figure 10b,
Figure 11b,
Figure 12b,
Figure 13b,
Figure 14b,
Figure 15b,
Figure 16b,
Figure 17b and
Figure 18b). This is an expected effect because this type of brick contains more surface area for hollows, as indicated in
Table 3.
Regardless of the brick model and the size of the hollows, the electric field values decrease with the increase in conductivity (
Figure 10,
Figure 11,
Figure 12,
Figure 13,
Figure 14,
Figure 15,
Figure 16,
Figure 17 and
Figure 18). For the models with a smaller number of hollows (M18), at conductivity above 0.16 S/m, the field strength values are similar for both models (M18a, M18s) (
Figure 10a,
Figure 11a,
Figure 12a,
Figure 13a,
Figure 14a,
Figure 15a,
Figure 16a,
Figure 17a and
Figure 18a). However, when analyzing a larger number of hollows (M30), the max(
Ez) values are similar only at
σ = 0.2 S/m only for small values of the hollow size (
ro ∈ {0.003; 0.005; 0.007; 0.009} m).
Table 6 contains values defining the percentage difference between the asymmetric and symmetric models at the commonly used conductivity value for bricks, i.e., 0.01 S/m. It should be noted that the values for the symmetric models (M18s, M30s) are higher by this percentage than for the asymmetric ones. For models with a smaller number of hollows (M18), the greatest difference between the field intensity values in the asymmetric and symmetric models occurs for larger hollow sizes. For models with a larger number of hollows (M30), the differences are not less than 22%, and the greatest difference between the asymmetric and symmetric models occurs for
ro = 0.017 m.
The observed effects should be associated with the complexity of field phenomena during wave propagation in a porous material. The significant lossiness of the material causes the characteristics to have a course similar to the variants with a homogeneous lossy material (M0). Increasing the size of the hollows (air area) at the expense of the dissipative dielectric lowers the resultant wave attenuation. The characteristics then have a monotonic course (
Figure 9).
While passing through different areas of the bricks, local changes in wave velocity cause the appearance of momentary field images that can increase the Ez values. Based on the numerical analysis performed and the results obtained, it can be stated that the phenomena occurring during wave propagation are of an unpredictable nature, which, especially at low conductivity values, strengthen or weaken the field values.
Additionally, it was checked what effect the added plaster layers on the walls have on the field intensity values. On both sides of the wall, plaster layers of 0.005 m thickness were modeled. The multivariate calculations performed showed that the additional homogeneous dielectric layer does not cause significant reductions in the max(Ez) value. On average, the reduction in the field value is about 3%, and to some extent, the most important is the precise analysis of wall models with hollows, the inhomogeneities of which cause momentary signal loss and amplification.
Table 7,
Table 8 and
Table 9 show the maximum
Ez values for all models. The values are for the three most commonly used conductivities: 0.01 S/m, 0.04 S/m and 0.01 S/m. From the data it can be seen that for
σ = 0.01 S/m with increasing
ro the field values increase more in the models with fewer hollows (M18a, M18s) in the range
ro ∈ {0.0009; 0.017} m. In the models with 30 hollows, the increase is visible in the range
ro ∈ {0.003; 0.009} m.
When comparing the field values at
σ = 0.04 S/m, one main conclusion can be drawn. With the increase in
ro, the field values increase in both symmetric models (M18s, M30s).
Table 9 presents the values for
σ = 0.1 S/m. As can be seen, a 10-fold increase in conductivity causes a decrease in the field intensity by 90% on average. It was only noticed that with the increase in
ro, the max(
Ez) values increase more significantly for the symmetric model with a larger number of hollows (M30s). On the other hand, for the remaining models, changes in the hollow size have little effect on the max(
Ez) values.
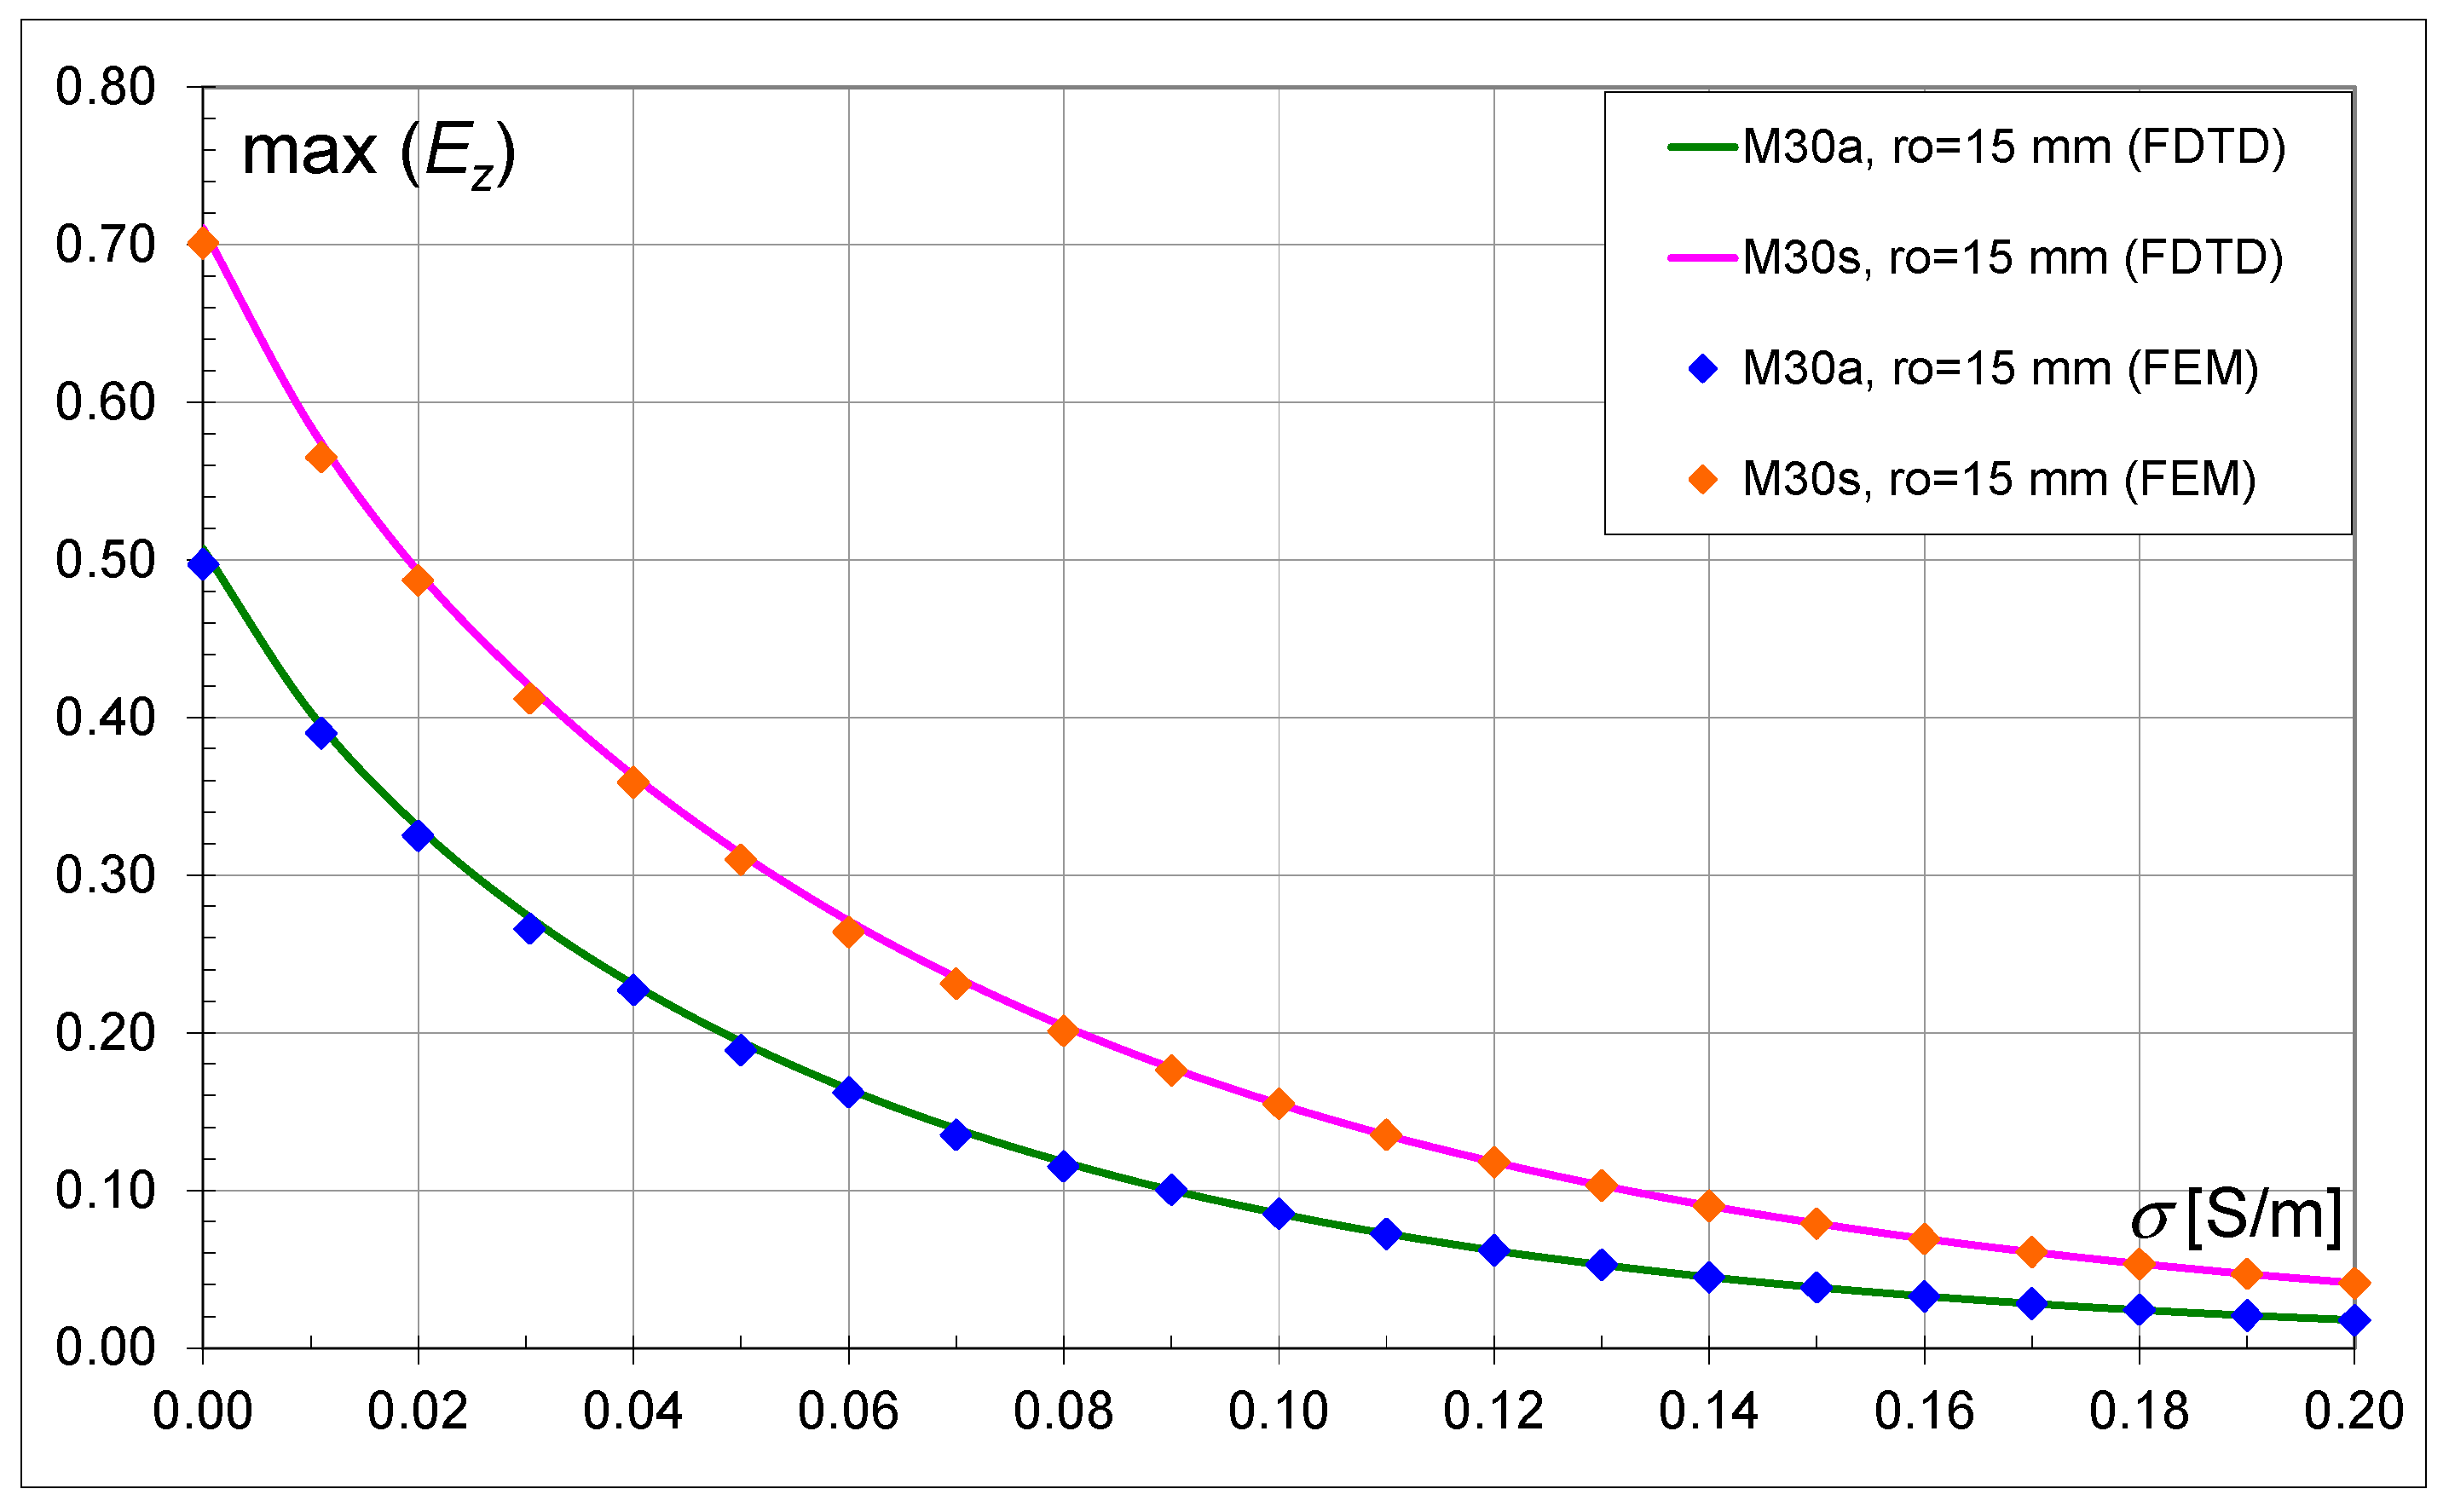
4.4. Comparison of Results Obtained Using FDTD and FEM Methods
To evaluate the results obtained above (
Figure 10,
Figure 11,
Figure 12,
Figure 13,
Figure 14,
Figure 15,
Figure 16,
Figure 17 and
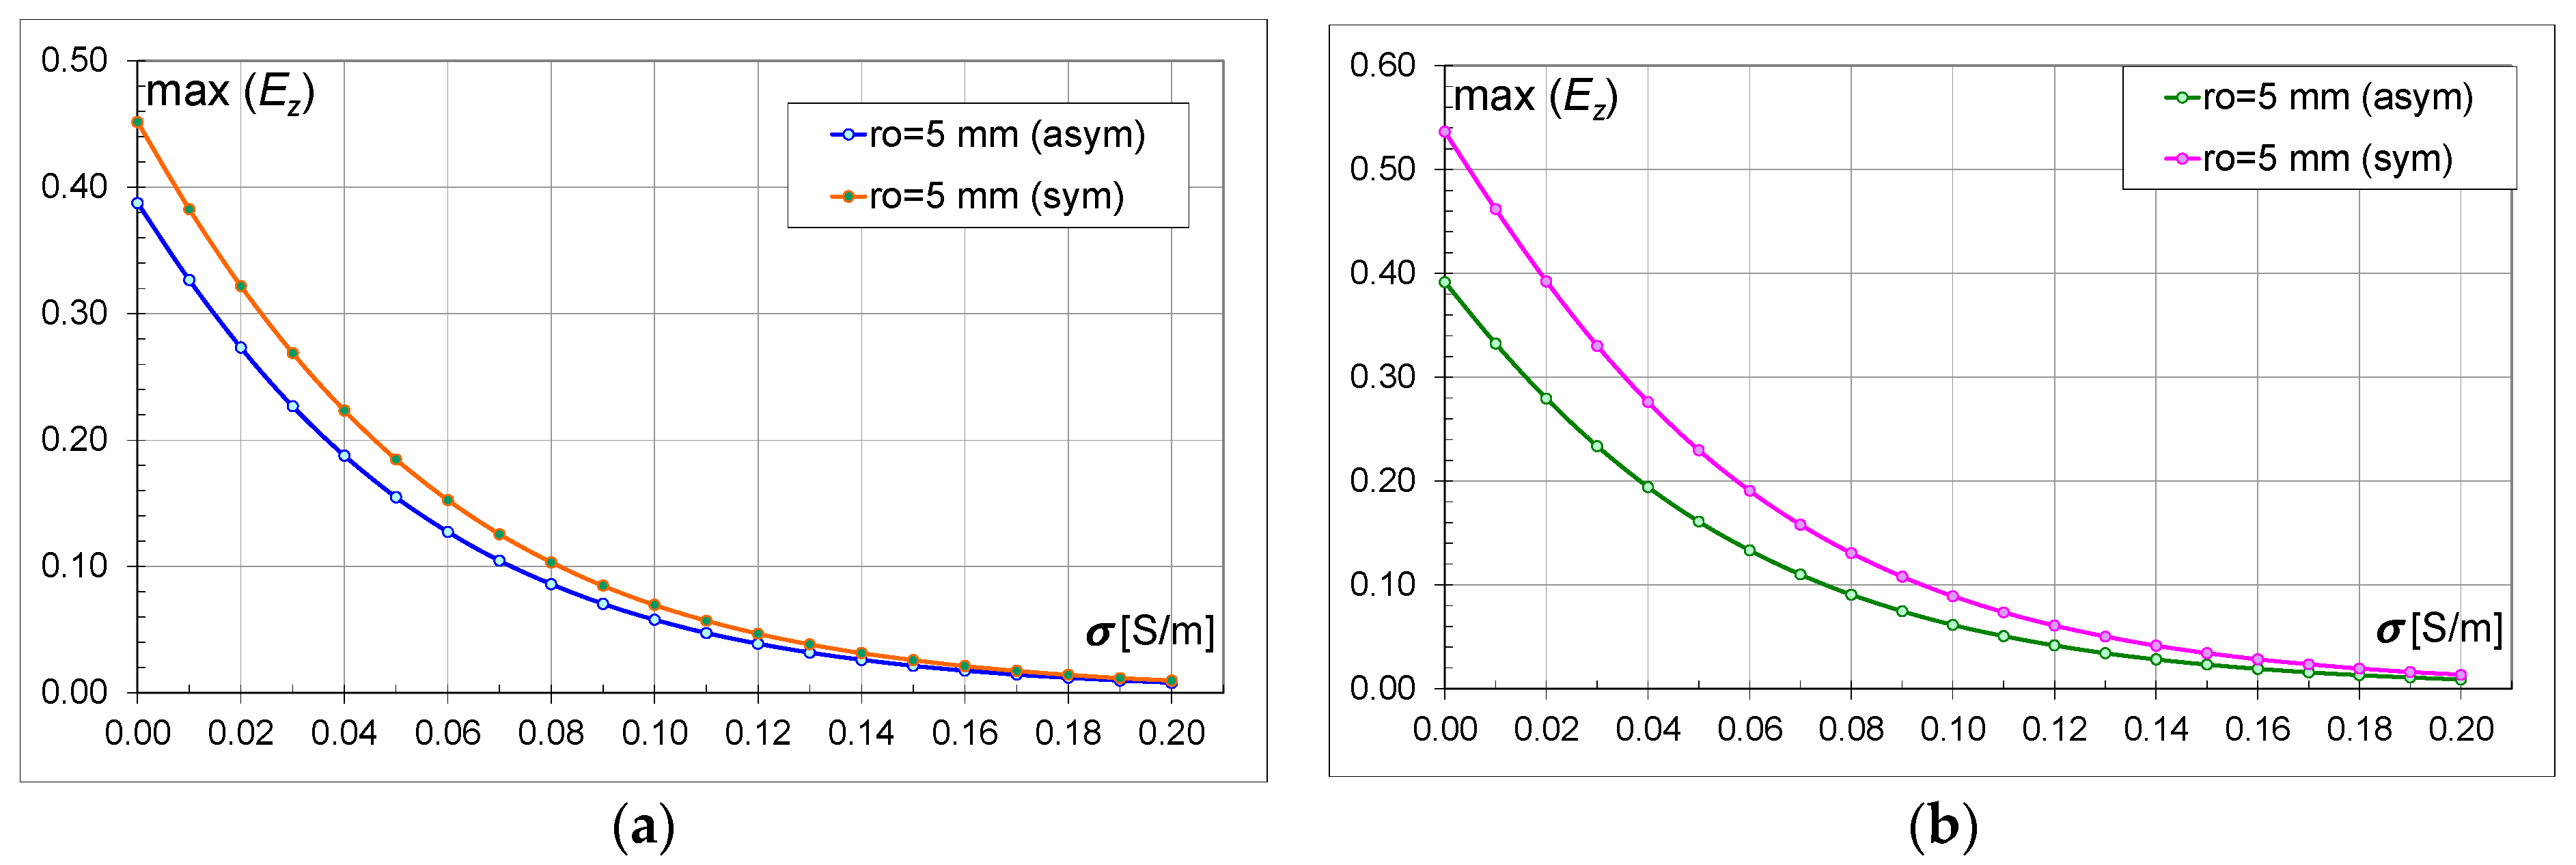
Figure 18), it was decided to verify the results using the FEM method. For this purpose, the commercial software Comsol Multiphisic 4.3b was used. In this program, two models of systems with walls consisting of 30 hollows were made with standard hollow dimensions for this type of brick (
ro = 0.015 m). The difference was in the brick arrangement: asymmetric (M30a) and symmetric (M30s). The model area and geometry remained unchanged.
Figure 19 presents a comparison of the analysis results. As can be seen, the differences are small and mainly in the range of low conductivity values. The differences may result, among others, from the specificity of a given method and the type of the adopted mesh. In the FDTD method, the mesh was unchanged in the entire area, while in FEM it was possible to densify the mesh.
5. Conclusions
The paper presents a multivariate analysis of the structure of walls made of two types of hollow bricks (with 18 and 30 hollows). The FDTD method was used for calculations, which is useful for the analysis of non-homogeneous and complex building materials. The proper selection of parameters and conditions in the numerical models allows for a qualitative assessment of the system. The presented results aimed to determine the influence:
the size of the hollows inside the bricks;
the number of hollows (18 or 30);
the mutual arrangement of the bricks (symmetrical and asymmetrical arrangement);
the electrical conductivity of the bricks on the value of the field intensity.
The obtained results indicate that symmetrical systems allow for obtaining higher field values, regardless of the number of holes, their size, or conductivity. The differences are greater at low conductivity values and for models with a greater number of holes; the field values are higher by an average of 20–30%. The difference in the share of ceramic mass in the brick of the order of 16% causes that in the symmetrical system the field intensity is about 40% higher than in the asymmetric system.
Reducing the percentage of ceramic mass in the brick leads to an increase in the field intensity. The reason is the decrease in the thickness of the dielectric layer. However, the observed changes in the field intensity value depend largely on multiple reflections at the boundary of the ceramic mass and air and the size of the holes. With a 10-fold increase in conductivity, only an increase in the field value is noticeable in the symmetrical model with a larger number of holes. On the other hand, for the frequently used value of conductivity (0.01 S/m), a clear increase in the field intensity is in the symmetrical model but with a smaller number of holes. A 10-fold increase in the conductivity value causes a decrease in the field intensity by an average of 85%.
The increase in material lossiness causes the wave attenuation phenomenon to play a dominant role when the wave passes through the dielectric. The porosity of the medium in electromagnetic terms results in waves experiencing multiple reflections and deflections with relatively small attenuation. Numerous minima and maxima appear. The same effects will be observed in the case of different types of hollow blocks, which have more hollows and whose locations are varied.
The presented graphs indicate complex wave phenomena that occur during wave propagation through an electrically porous material. In the case of macroscopic analysis of buildings, it would be worth considering homogenization so that there would be no need to model the hollows. Such an approach is imposed by limitations resulting from the computational capabilities of computers in numerical modeling of complex structures. Then it would be possible to increase the mesh resolution and partially eliminate limitations related to the size of the discretizing mesh and the size of the numerically processed problem. However, the problem related to the capabilities of computing units could be solved by using parallel programming. Further research will be related to this, as well as the analysis of more complex cases, taking into account multi-layers and reinforcement, which significantly affects the quality of data transmission and causes major problems with wireless communication. The aim of further research is to collect many results of analyses of building materials with a complex structure and to describe as precisely as possible the tips for installers of wireless networks, including those using routers.


