1. Introduction
Climate change, global warming, and rising fuel costs are critical challenges that humanity faces today [
1]. Recent research has highlighted the importance of exploring renewable energy sources to address these issues [
2]. The volatility of fuel prices continues to place a financial strain on consumers, highlighting the urgent need for effective solutions—a need that is increasingly being acknowledged by vehicle manufacturers. Reducing pollution is essential not only for preserving the environment but also for aiding consumers in managing their fuel expenses. The pressing necessity of reducing greenhouse gas emissions is further emphasized by the concerning rise in CO
2 levels, coupled with the impacts of global warming, which have become more evident, and the demand for more efficient vehicles, as demonstrated in [
3]. Through the modeling, simulation, and reporting of Hybrid Electric Vehicles (HEVs), the aim is to highlight the potential for significant reductions in both emissions and fuel costs when compared to traditional Internal Combustion Engine (ICE) vehicles.
The HEV has been in existence for decades. In [
4], the invention of the HEV dated back to the 1800s, but due to technological limitations the idea only became a reality when the first mass-production HEV was produced in the 1990s, the Toyota Prius. Since then, other manufacturers have been developing HEVs in the hope of achieving an ‘eco-friendlier’ vehicle. Today, vehicle manufacturers such as Ford and GWM are also producing HEVs with varying chassis, such as the sedan and pickup trucks.
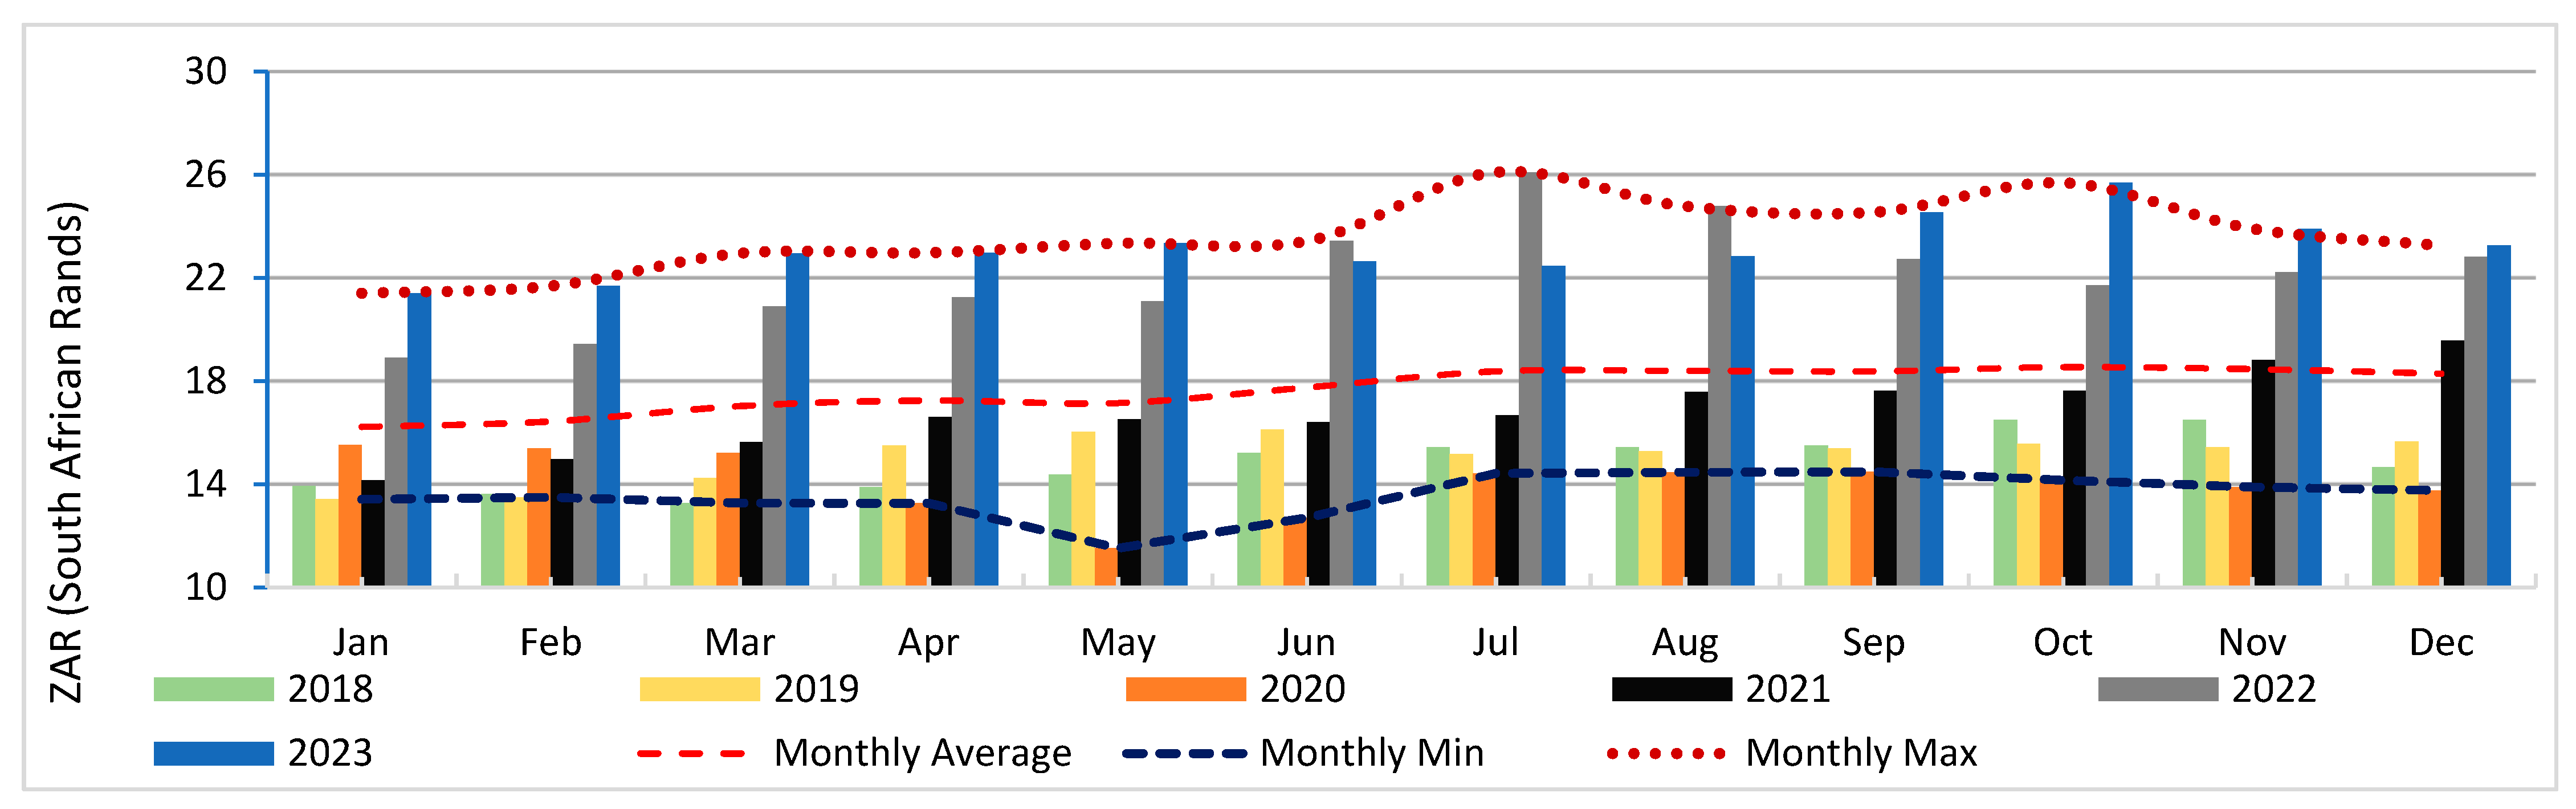
One of the key points of consideration of HEVs is the fuel cost reductions that they offer. Considering the price of fuel in South Africa, in October 2023, the official fuel price (the South African price of fuel in the coastal provinces) rose to ZAR 25.22 per liter of petrol, close to the maximum of ZAR 25.66 experienced in 2022 [
5].
Figure 1 highlights the trend in fuel prices from 2018 to 2023, with 2022 showing the highest fuel prices in years. These fluctuations emphasize the urgent need for more fuel-efficient vehicles, to assist with and mitigate the impact of fuel price fluctuations. During months when the prices are lower, consumers can save on fuel costs and utilize these savings to offset the expenses during the months when the fuel hikes are the largest. HEVs can offer a suitable supplement, as fluctuations in fuel costs are limited due to their lower fuel consumption in addition to lower emissions produced per trip [
6].
In South Africa, fuel prices are regulated by the South African Petroleum Industry Association (SAPIA), which regulates the amount of tax added to the fuel cost, together with retail costs, distribution, storage costs, and the exchange rate between the South African Rand (ZAR) and the United States Dollar (USD) [
7]. Some of these costs can be controlled by the government but others are set by global fuel prices. Therefore, having control of how much fuel is used can greatly reduce the burden of unwanted expenses.
HEVs promise reduced emissions and lower fuel expenses; however, they face several adoption challenges. Key concerns include their higher initial cost, complex systems requiring intricate maintenance, limited electric-only range for long journeys, increased vehicle size, weight, and expenses associated with servicing and battery replacement. Moreover, the pace of consumer transition to hybrids significantly affects their market uptake. Overcoming these challenges is vital for the widespread acceptance of HEVs. In the South African context, where power infrastructure problems may pose significant obstacles, non-plug-in HEVs may be a more appealing option to consumers. Disparities in import taxes further complicate cost considerations.
Therefore, it is important to address these concerns to promote the widespread acceptance and adoption of HEVs. In [
8], the research indicated that traditional ICE vehicles are subject to an average import tax of approximately 18%, while electric vehicles and HEVs face a higher import tax rate of 25%. This disparity in import tax rates can significantly impact the overall cost of HEVs compared to conventional vehicles.
ADVISOR 2003-00-r0116 simulations were carried out on the Sports Utility Vehicle (SUV) chassis non-plug-in HEV. The advantages of using ADVISOR include the use of industry-standard drive cycles, equipment, and vehicle models [
9]. Utilizing these real world models and scenarios, the simulations can provide further insight [
2] into vehicle performance, fuel consumption, and emissions testing.
The main contributions of this paper are summarized as follows:
The study utilizes software simulation tools such as MATLAB® version R2023a Update 5 (9.14.0.2337262), Simulink version 10.7 (R2023a) and the Advanced Vehicle Simulator (ADVISOR) version 2003-00-r0116 to model and simulate HEVs, thereby showcasing a methodology for assessing fuel cost savings and emissions reduction potential.
Comparisons are drawn between the Series and Parallel HEV configurations, providing valuable insights into their performance regarding fuel savings and emissions reduction.
An examination of various battery configurations is conducted to evaluate their effect on energy utilization.
Fuel cost comparisons are investigated between ICEs and HEVs.
Finally, the impact of engine capacity in HEVs is given, providing insights into the effect of different configurations on overall system performance.
The organization of this article is as follows:
Section 2 provides a review of the South African fuel costs, the various types of HEV configurations, battery types, and models, and the life cycle analysis of HEVs.
Section 3 focuses on the design of the simulation and the methodologies of the different configurations.
Section 4 provides the results and discussion.
Section 5 concludes the study.
2. Review of HEV Technology
2.1. Analysis of Electric and Hybrid Electric Vehicle Systems
Full electric vehicles, typically, are not equipped with an ICE but rather powered by electric motors coupled to the vehicle’s drivetrain with on-board battery banks, fulfilling the necessary energy requirements [
10]. A key drawback of this system is its limited range, which is dependent on the battery’s capacity. While larger battery packs can extend the range, they also add weight to the vehicle. Additionally, these vehicles typically lack an on-board charging unit and cannot be charged while in operation, unlike HEVs. Although technologies such as regenerative braking offer some energy recuperation, they provide minimal recharging and are insufficient to significantly restore full battery charge [
11]. In contrast, a plug-in HEV utilizes both an ICE and an electric drivetrain, combining the benefits of electric propulsion with the range and flexibility of the ICE. Another benefit of this approach is that the vehicle is equipped with an external charging adapter to charge the electrical system [
10,
12].
This configuration allows the driver to choose between three modes: electric-only, ICE-only, or a combination of both. If the battery is depleted, the vehicle can switch to ICE-only mode and continue its journey. The electric mode is ideal for shorter trips, reducing fuel consumption in stop-and-go traffic, while the ICE is more efficient for highway driving. The achievable range with electric power is determined by the installed battery’s capacity. The primary distinction between a plug-in HEV and a non-plug-in HEV is that the latter includes a power generation unit connected to the ICE to produce energy and recharge the batteries of the electrical system [
13]. This means that the ICE will replenish the battery. Once fully charged, it can operate on battery power to conserve fuel and decrease emissions.
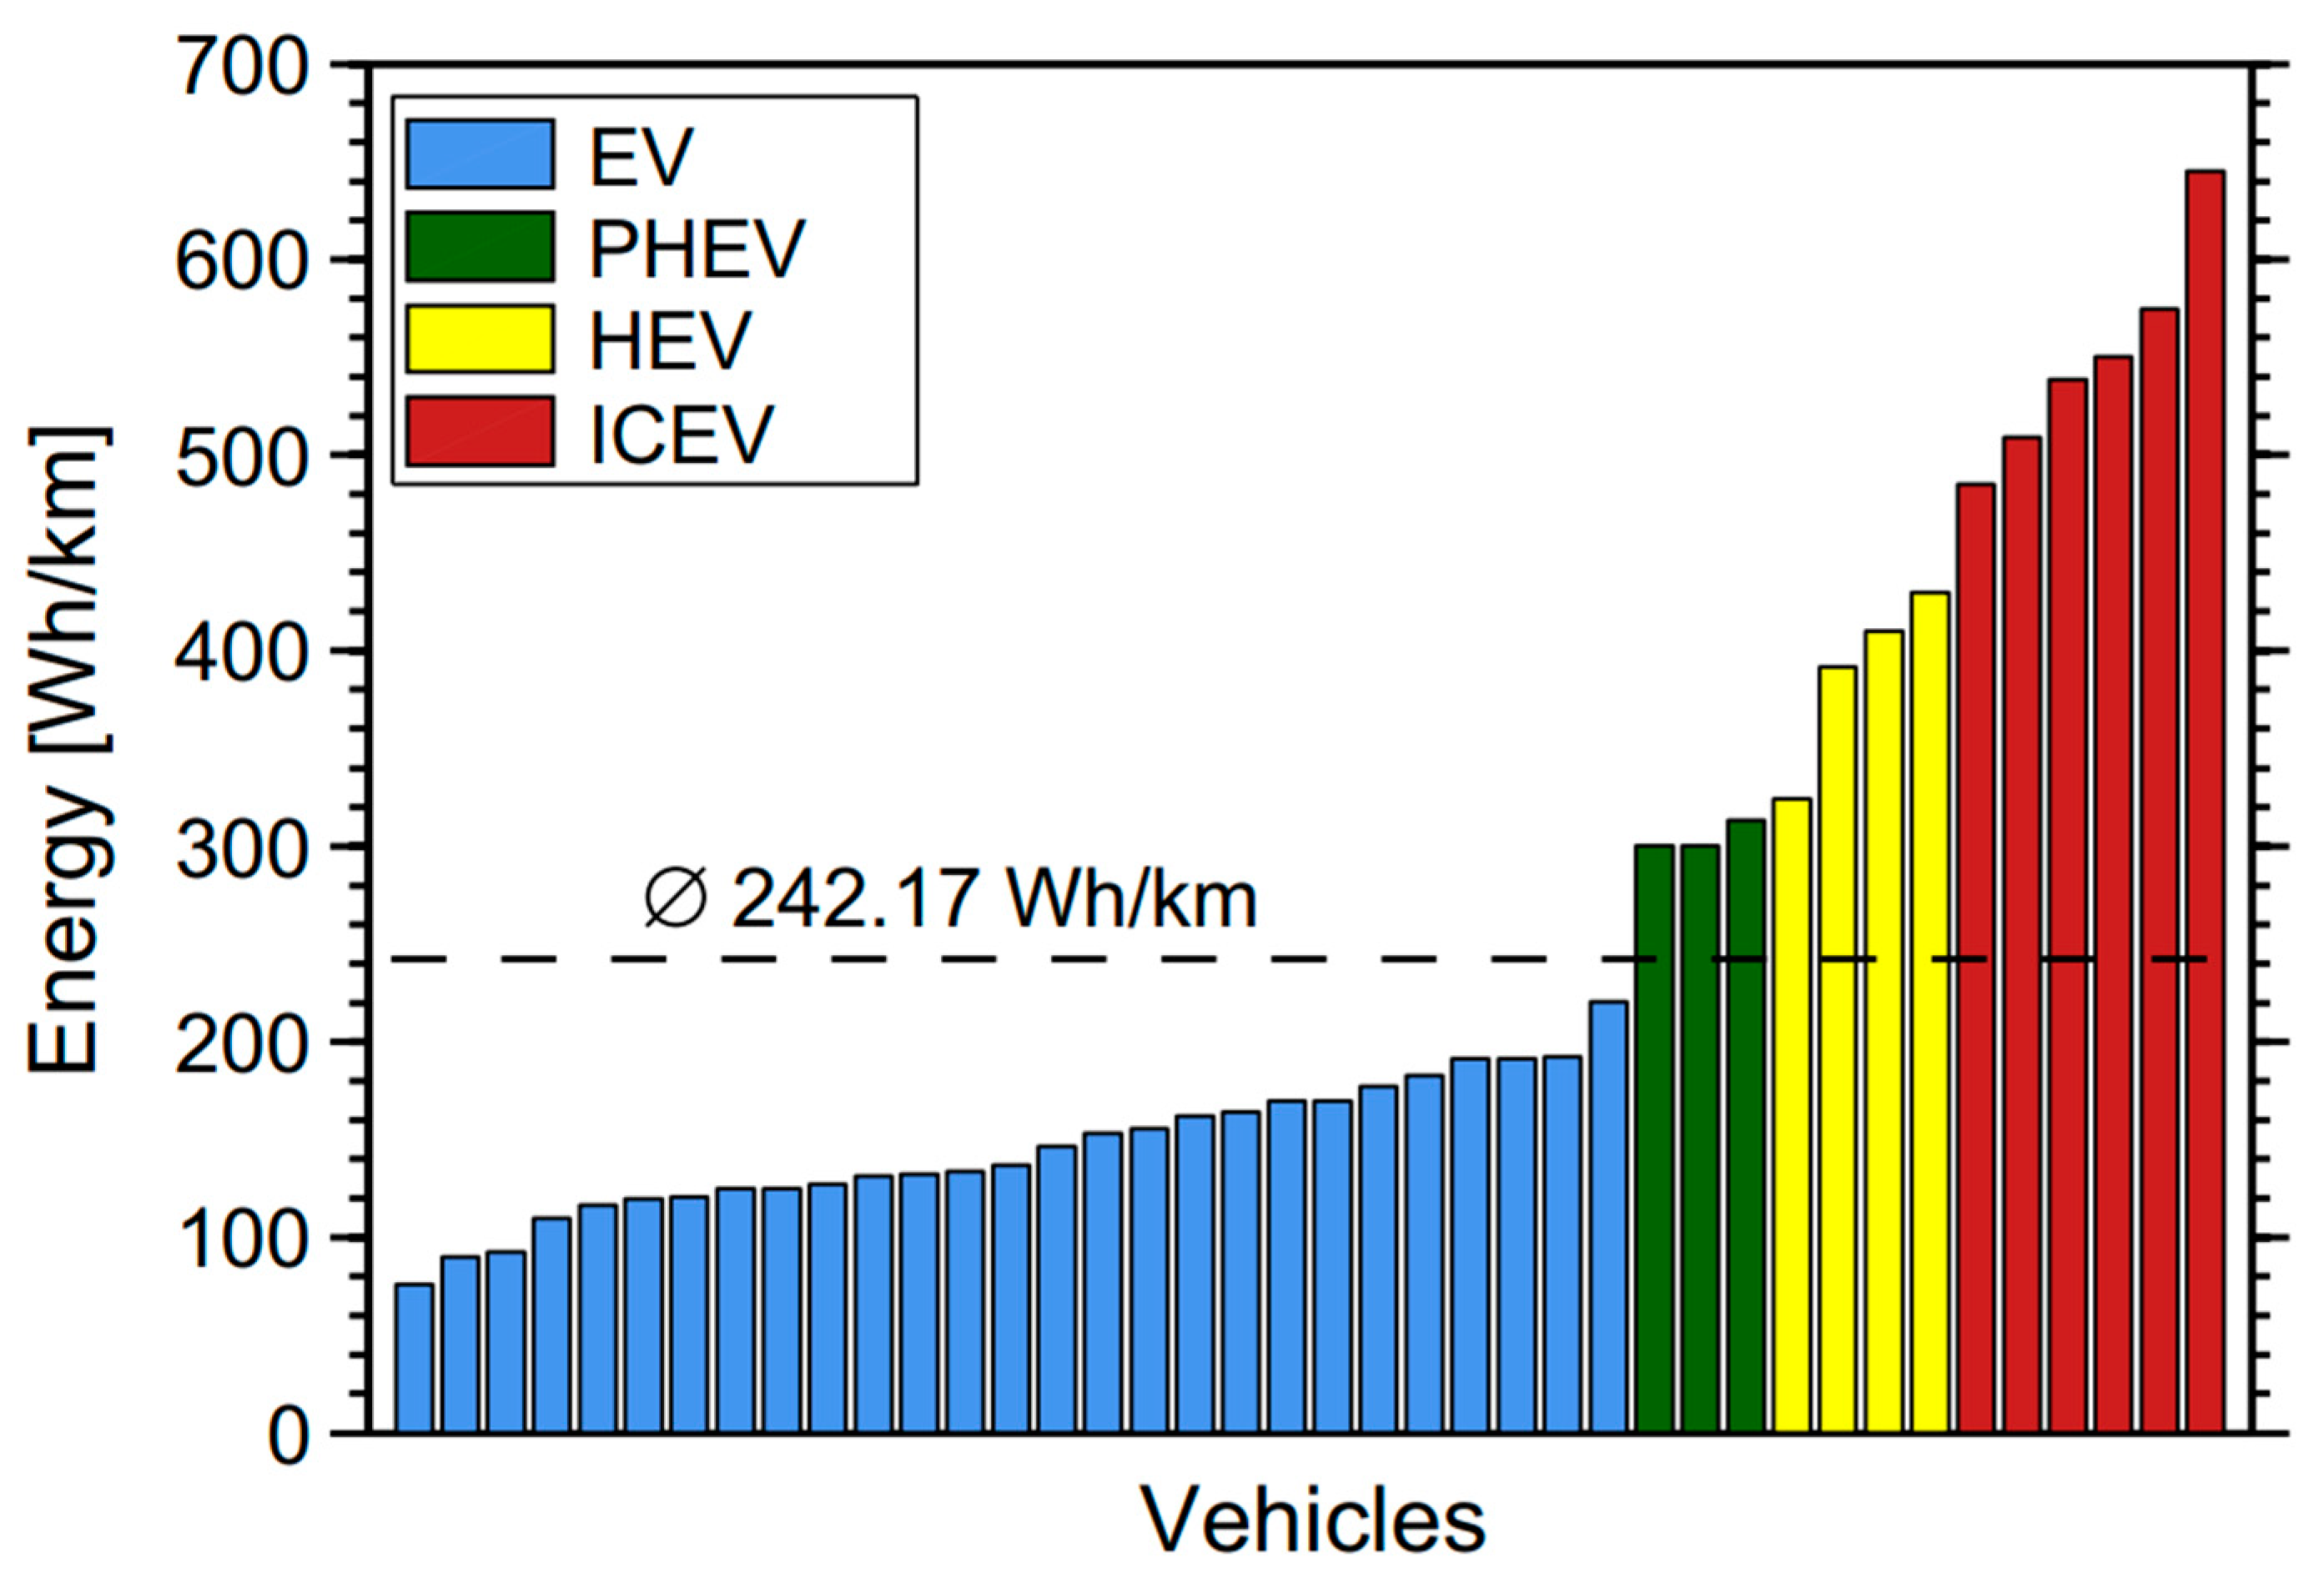
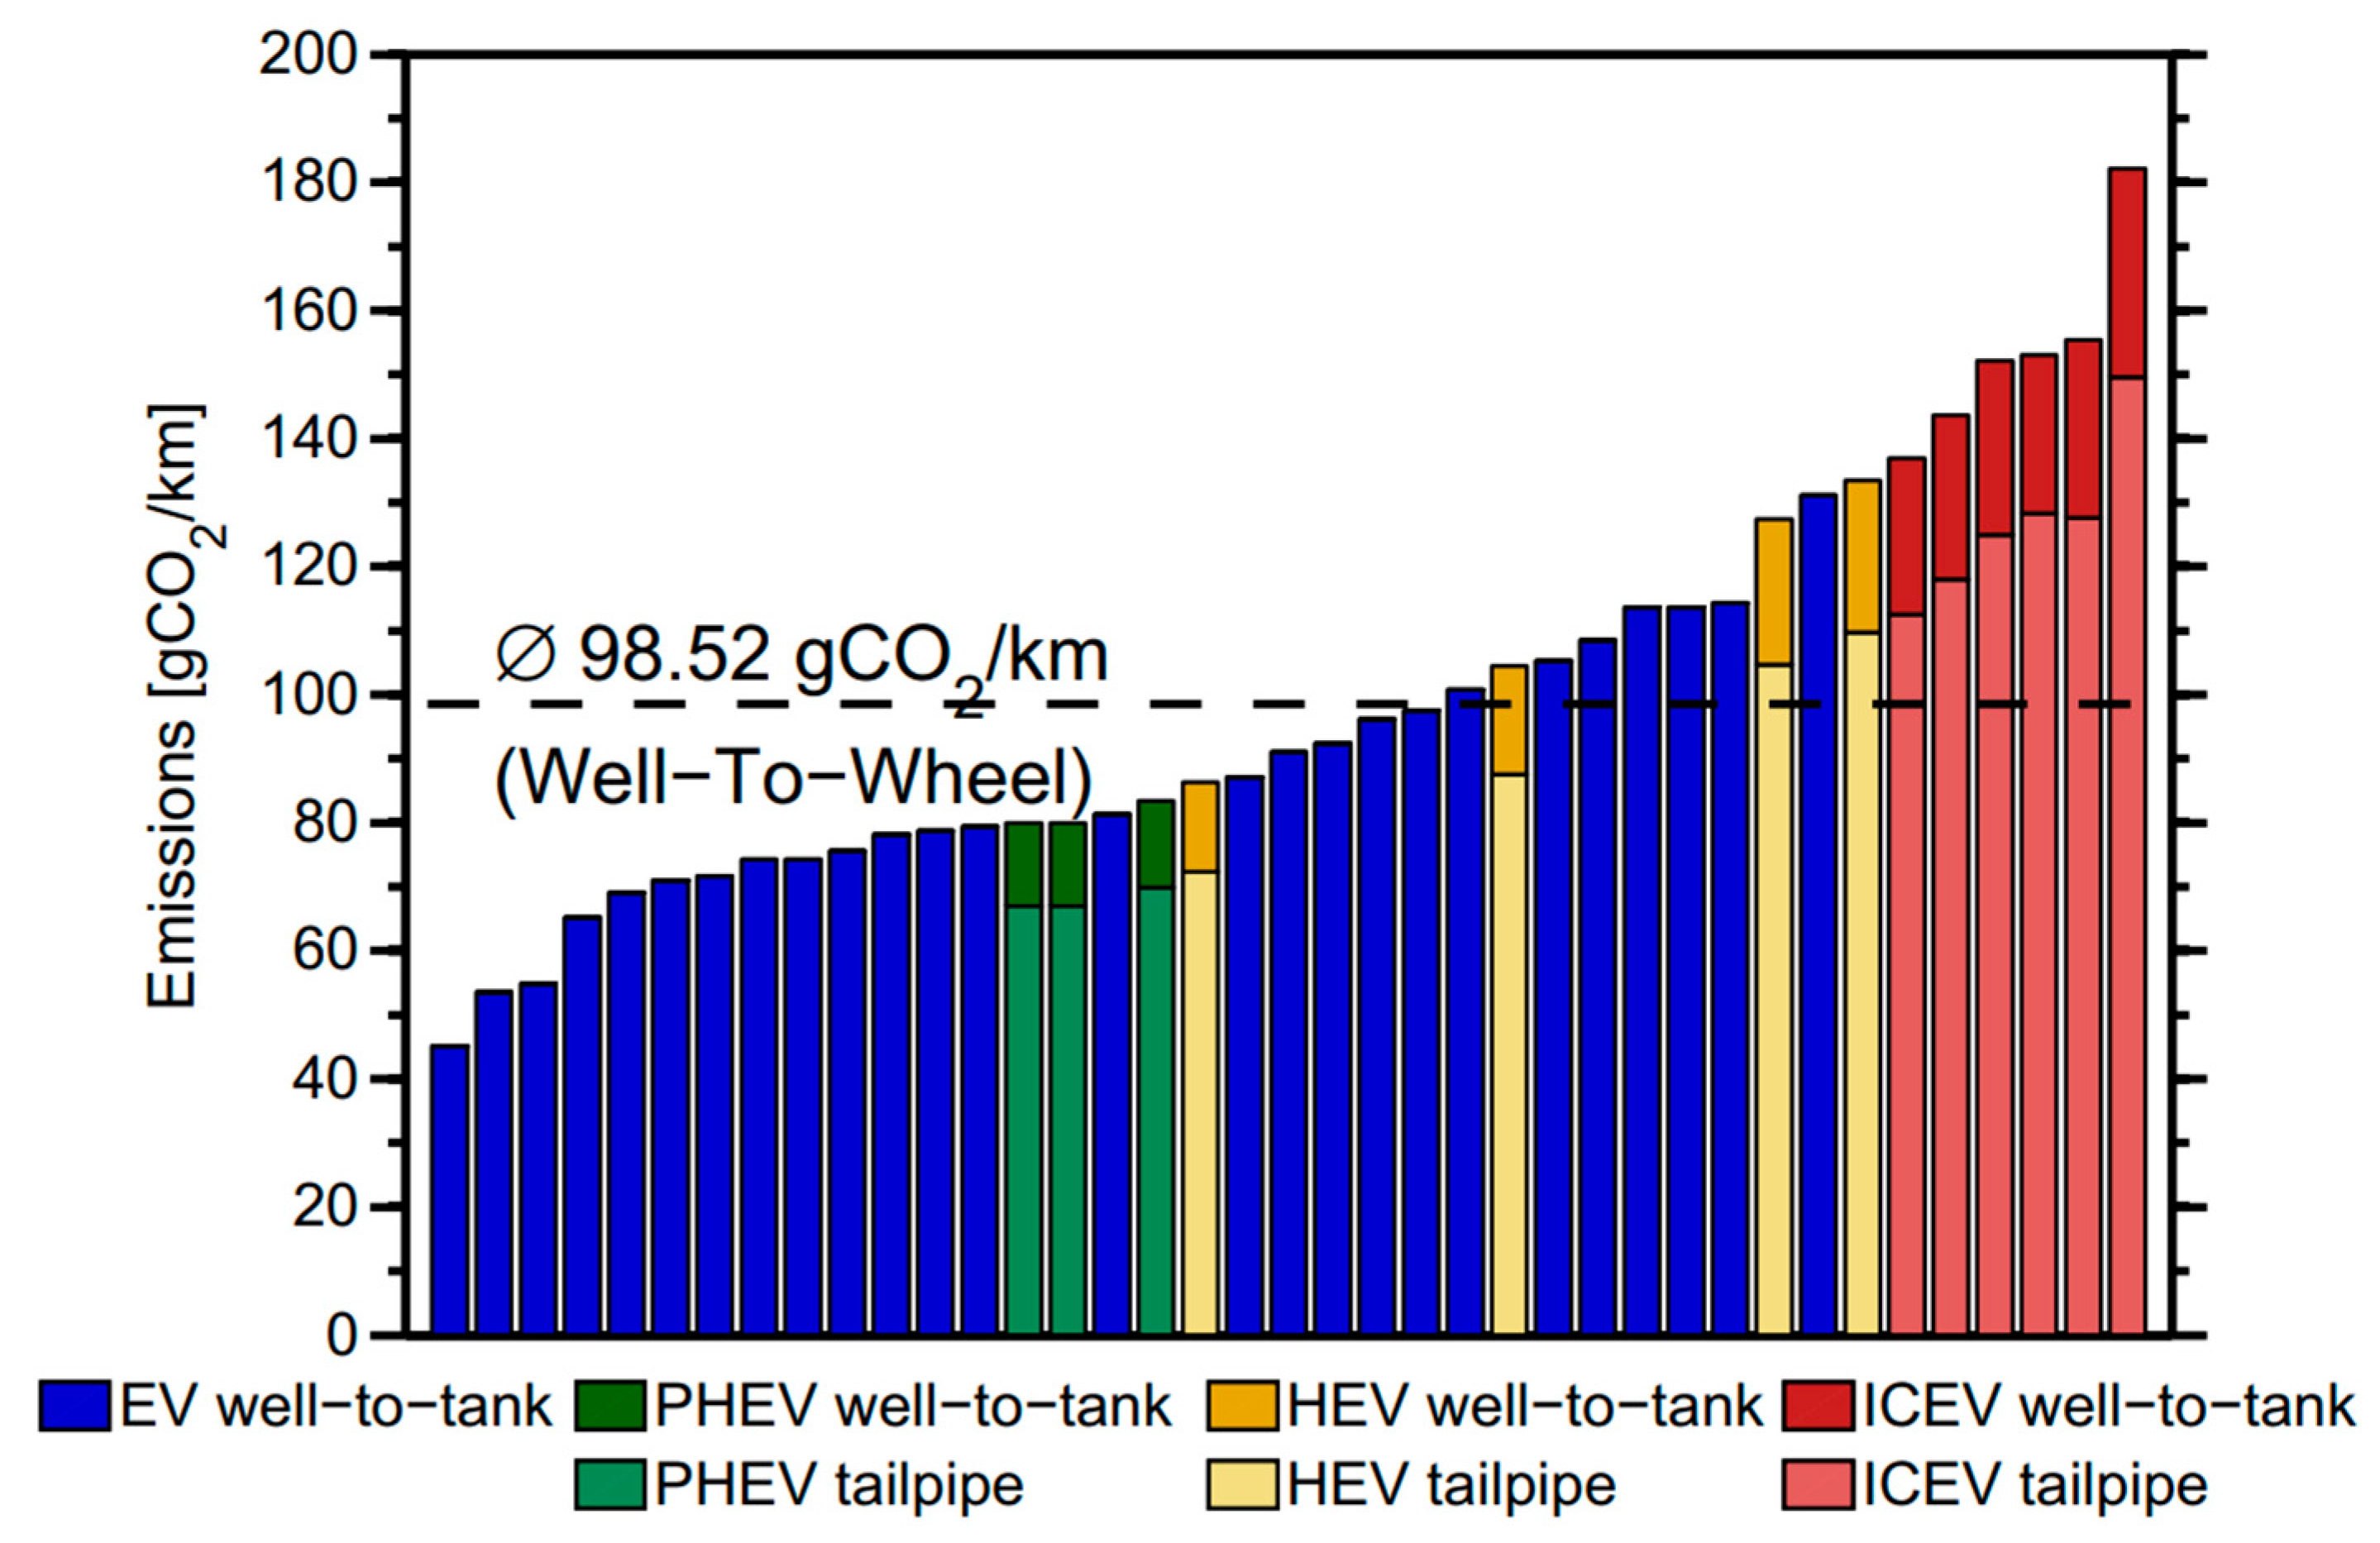
In the detailed analysis conducted by [
14], the emissions and energy consumption of various vehicle types were evaluated using a well-to-wheel approach, which considers both upstream (well-to-tank) and downstream (tank-to-wheel) phases. Referring to
Figure 2, electric vehicles (EVs), shown in blue, have the lowest emissions as they lack tailpipe emissions. Plug-in Hybrid Electric Vehicles (PHEVs), represented in green, show higher emissions due to a combination of ICE use and electric power, while Hybrid Electric Vehicles (HEVs), marked in yellow, have even higher emissions as their ICE is used more frequently. Internal Combustion Engine Vehicles (ICEVs), in red, have the highest emissions. Referring to
Figure 3, the energy requirements for the various power trains have been highlighted, where EVs again show superior efficiency due to electric drivetrains. PHEVs consume slightly more energy because of ICE use, while HEVs and ICEVs have progressively higher consumption, reflecting the inefficiency of fuel combustion.
A case study conducted by [
15] demonstrated the potential for customers to purchase PHEVs and EVs; however, due to limited infrastructure, electrical supply concerns, and high purchase prices, adoption rates remain low. The South African government will need to implement policies to boost EV adoption. Consequently, non-plug-in HEVs will be studied more closely.
2.2. Hybrid Factor of a Hybrid Electric Vehicle
In [
14], four types of Hybrid Electric Vehicles (HEVs) are identified: Micro Hybrid, Mild Hybrid, Full Hybrid, and Plug-in Hybrid. These classifications are based on the electric motor’s contribution to the vehicle’s drivetrain, with greater power indicating higher hybridization.
Micro Hybrids: Feature idle stop/start functionality, shutting off the engine when stationary and restarting as needed. They also utilize regenerative braking for energy recovery and charge the battery using excess energy while driving.
Mild Hybrids: Build on Micro Hybrids by adding electric torque assistance during acceleration, enhancing performance and efficiency. They share the energy recuperation and in-motion battery charging features of Micro Hybrids.
Full Hybrids: Allow for electric-only driving over a limited range, reducing reliance on the ICE. They also include energy recuperation and battery charging while driving.
Plug-in Hybrids: Offer all Full Hybrid features with the added ability to charge the battery from an external source, such as an outlet or charging station, thereby extending their electric range and improving fuel efficiency.
This progression from Micro to Plug-in Hybrids illustrates increasing levels of efficiency and functionality, with Plug-in Hybrids offering the most flexibility.
2.3. The Series HEV and Parallel HEV Configurations
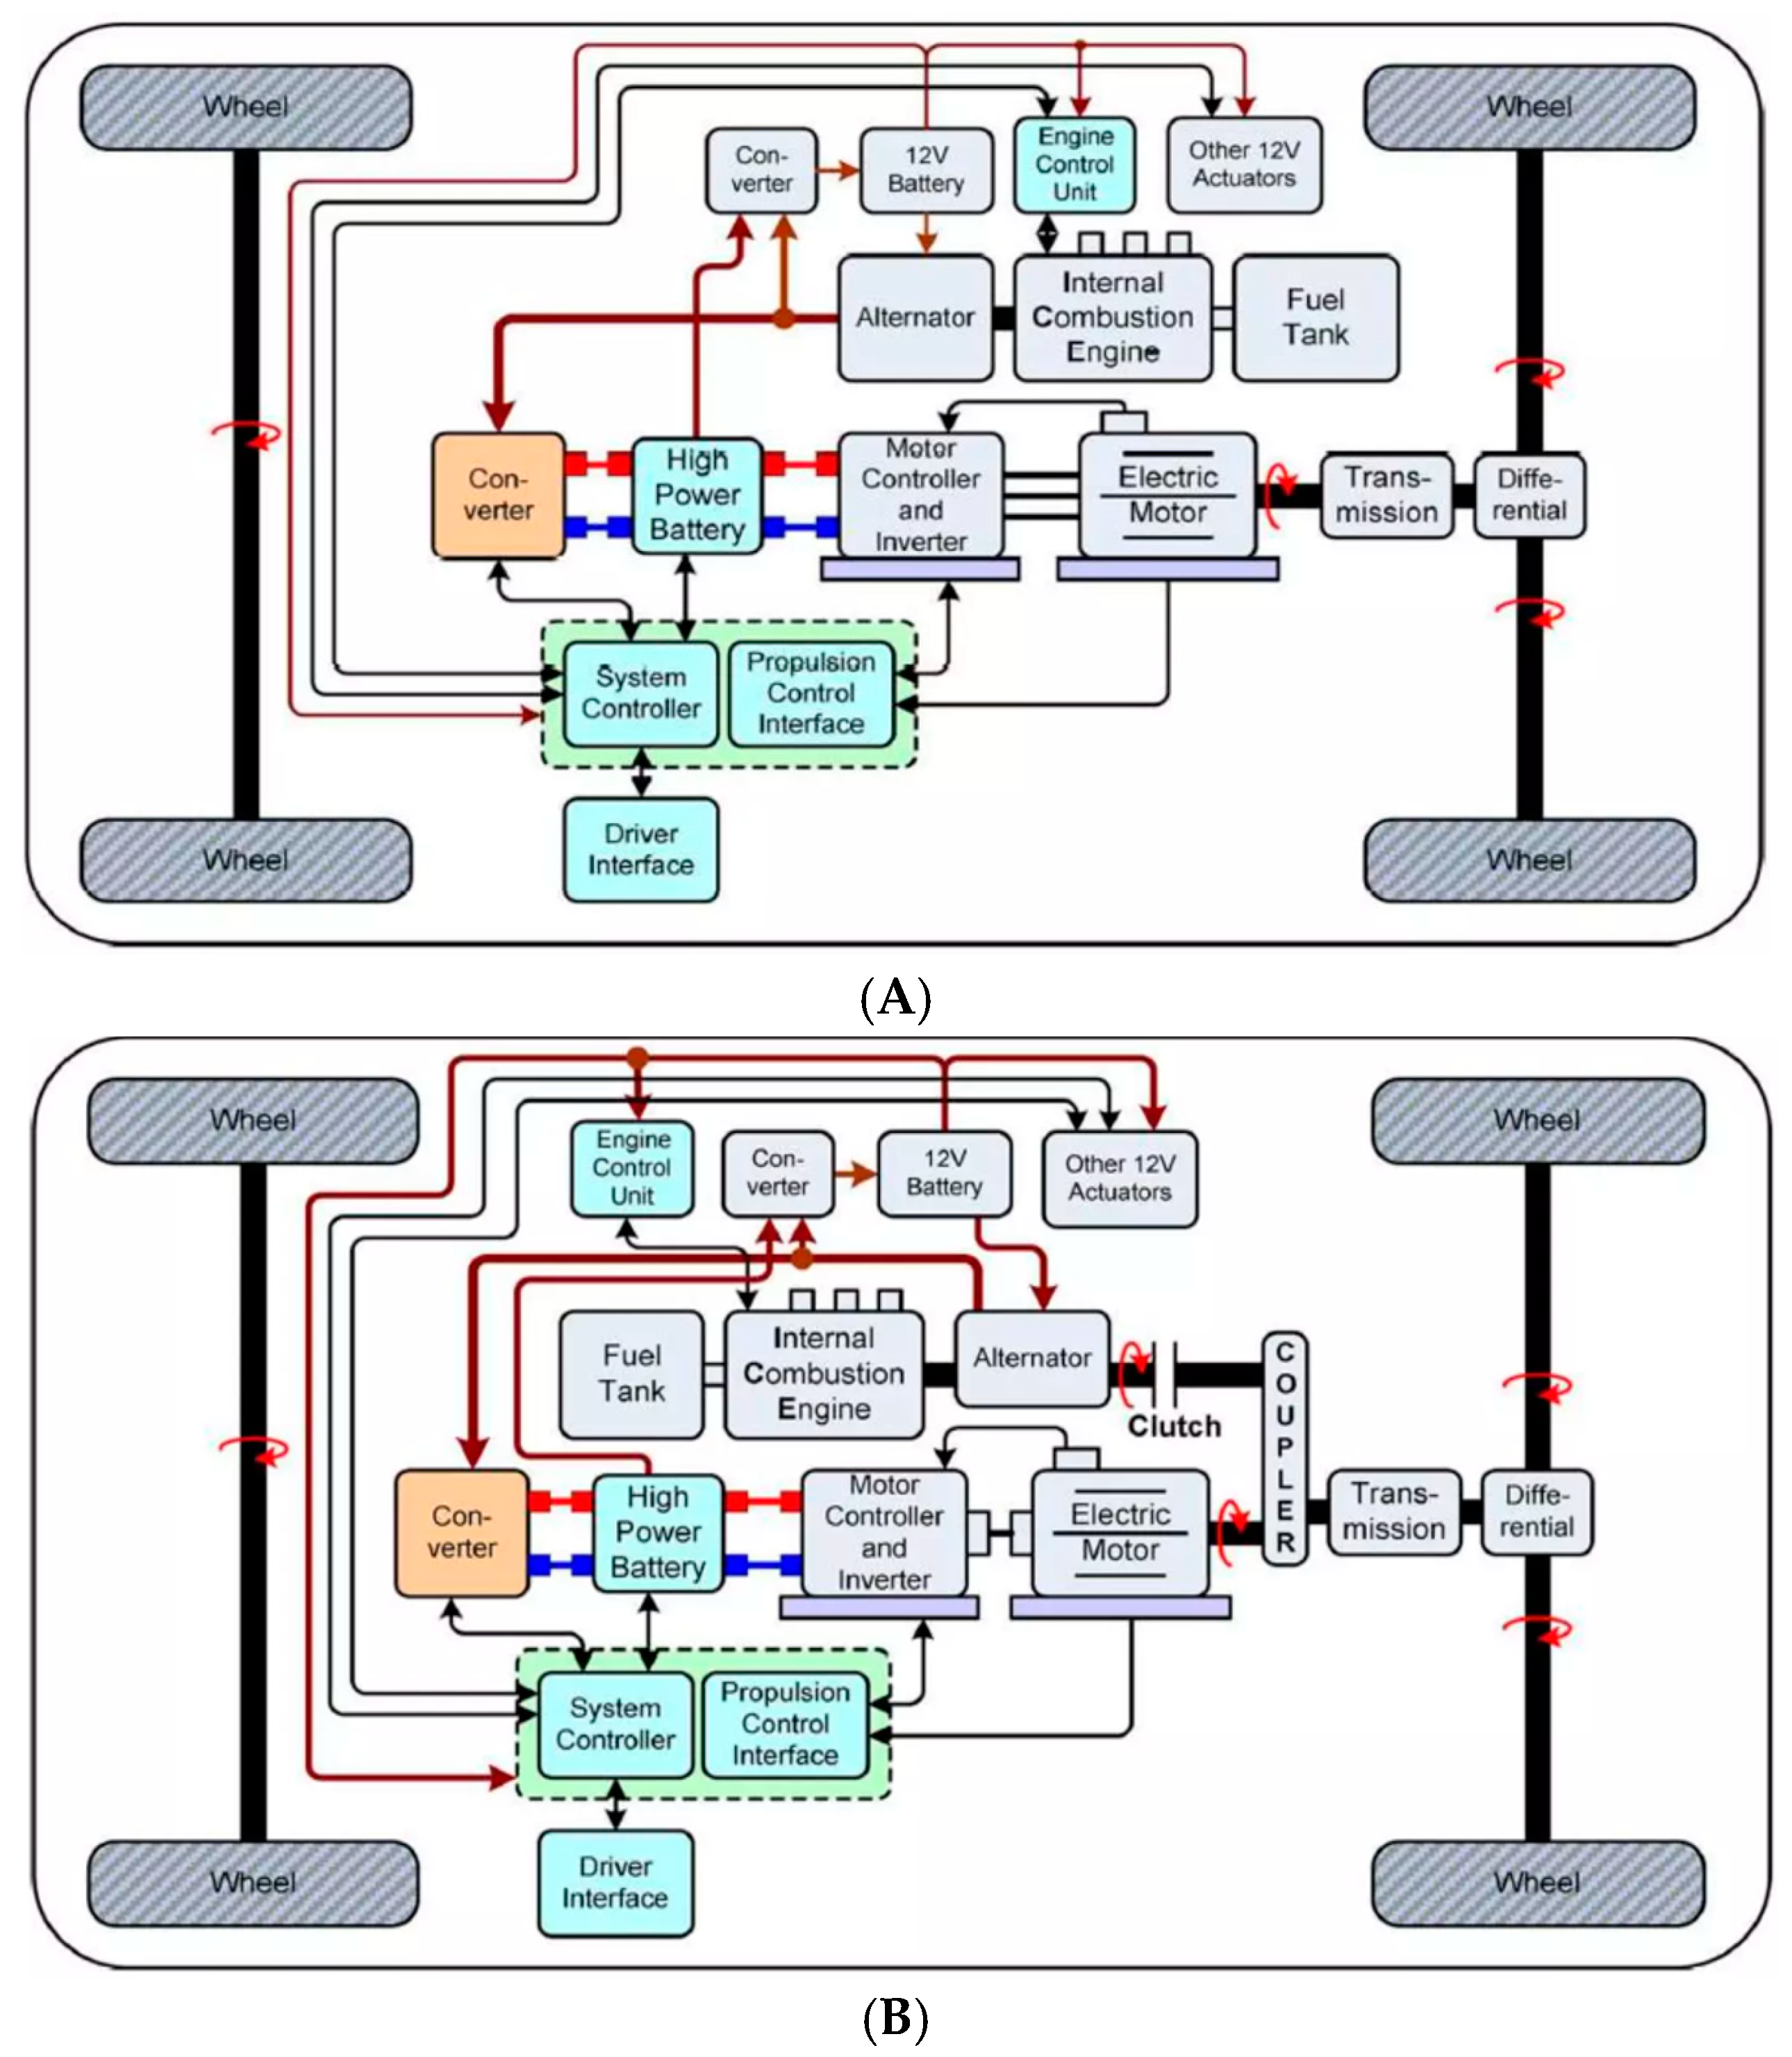
Based on the study in [
16], there are several differentiating factors between the Series and Parallel HEVs. These are typically based on how power is delivered to the drivetrain as illustrated in
Figure 4. In the Series HEV configuration, the ICE provides the mechanical power for the generating unit, which produces the electricity used to charge the vehicle’s battery bank. The stored electrical energy is then used to power the Electrical Motor (EM) that is mechanically coupled to the drivetrain of the vehicle. In contrast, in the Parallel HEV, both the ICE and EM are coupled to the vehicle’s drivetrain, separated by a coupling unit. Based on the state of the coupling unit, power can be derived from either the ICE, EM, or a combination of both.
In Series mode, the ICE supplies the electrical power needed to charge the battery, while the EM provides the final drive output to the vehicle’s drivetrain. Once the battery is fully charged, the ICE can be turned off, allowing the vehicle to operate solely on battery power until the State of Charge (SoC) drops below the minimum level, triggering the ICE to start up and recharge the system. One advantage of this system is its silent operation during start/stop conditions (such as in traffic) as the vehicle runs on battery power alone. If the ICE is required, the system automatically engages it to recharge the battery. However, during highway driving, the system may be less efficient as the ICE may need to periodically start to maintain the battery’s SoC at the desired level [
11].
In the Parallel HEV configuration, the ICE and the EM both power the vehicle. Depending on the conditions, both the ICE and the EM can be used together to provide a higher output power, or they can be switched between each other. This means for city driving at lower speeds, the EM will be performing the propulsion, and the ICE can be either switched off completely or used to generate the electricity required to charge the battery bank. Consequently, for higher speeds the vehicle can work in Hybrid mode (ICE and EM) or ICE only, thus allowing for a more efficient method of utilizing both systems [
11].
In summary, the parallel setup enables both the ICE and the EM to power the transmission independently or simultaneously, advantageously for higher speeds and highway driving. Furthermore, its simple design architecture lowers the manufacturing costs. In contrast, the Series configuration uses the ICE solely as a generator to charge batteries, excelling in stop-and-go city driving due to the EM’s immediate torque characteristic. Research indicates the Parallel system often incurs lower costs as it utilizes existing components, while the Series system separates the ICE from propulsion, solely focusing on charging.
2.4. Energy Storage Systems
2.4.1. The RC Battery Model
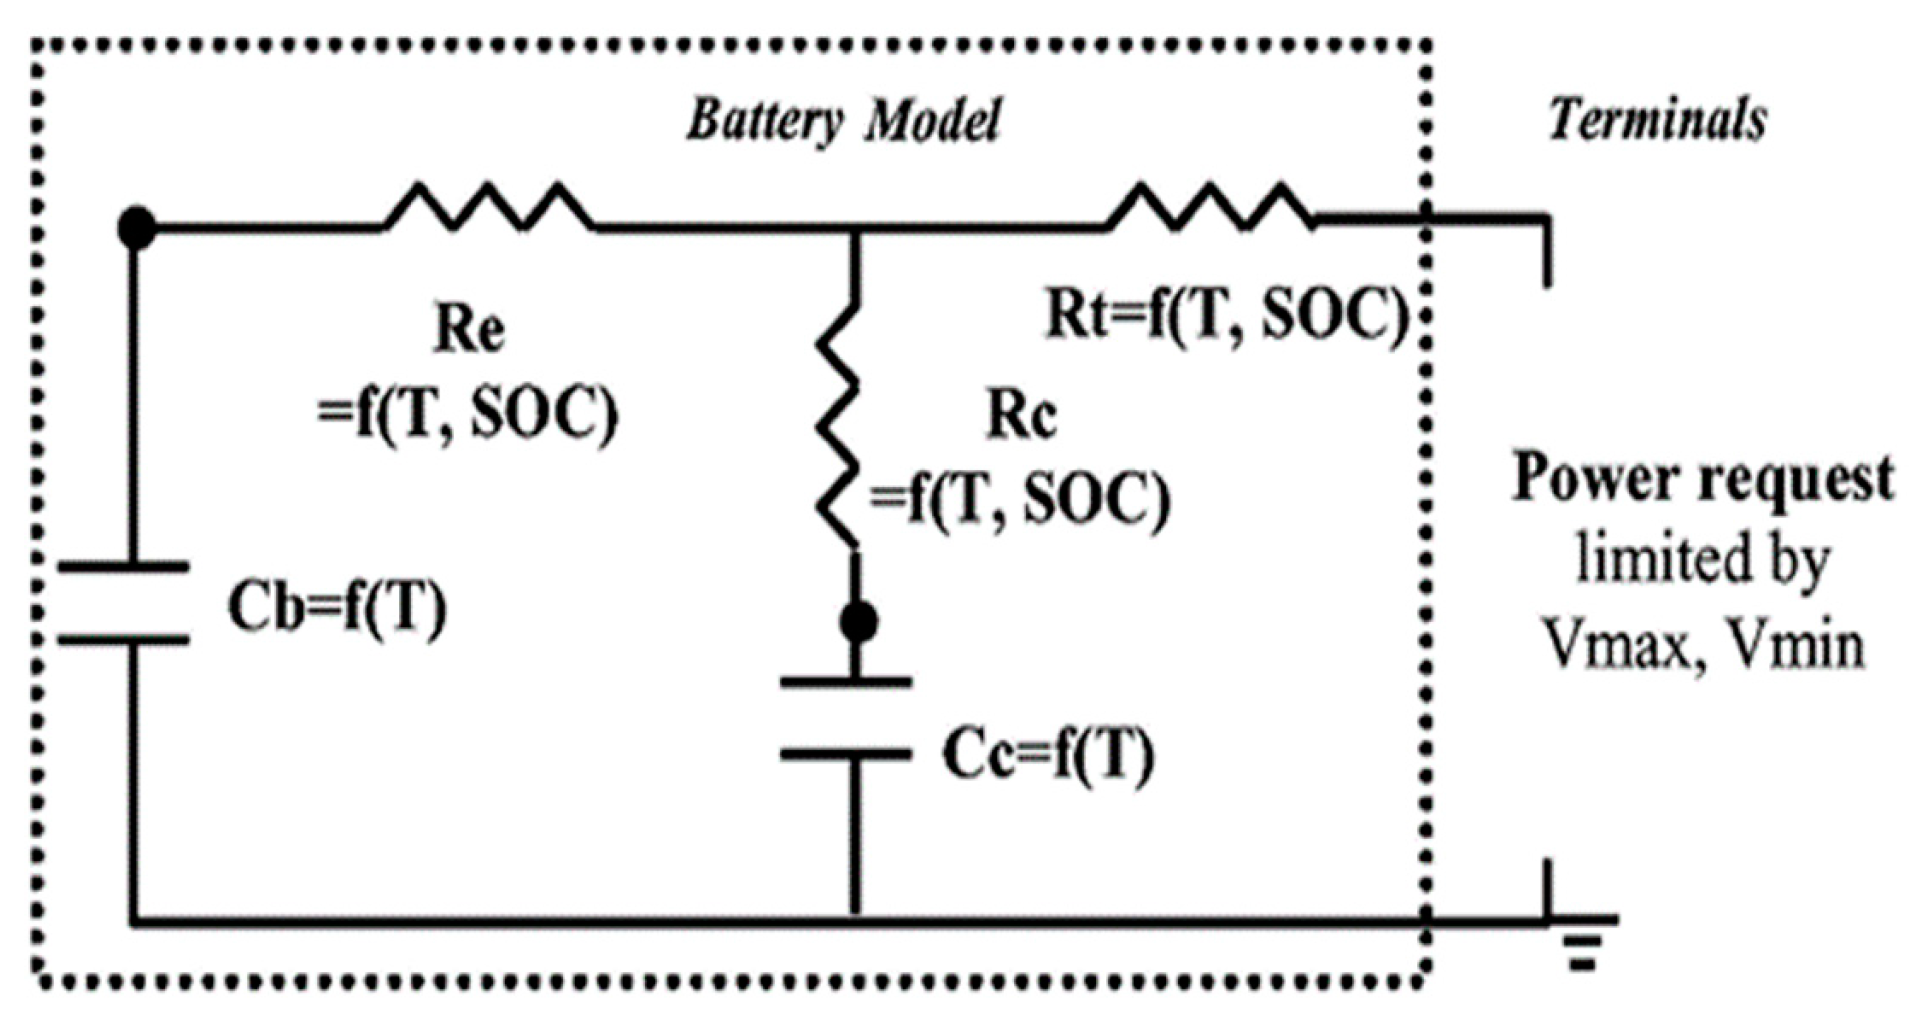
The SoC of the Resistor–Capacitor (RC) battery model has been previously defined by Johnson [
17], whereby the SoC of the battery can be characterized as a function of an RC network. In
Figure 5: RC battery model capacitors C
c and C
b are coupled with resistors R
e, R
c, and R
t, with C
c representing the battery source. C
b is a smaller capacitor which represents the surface effects of the larger C
c capacitor. R
c and R
e are functions of SoC and temperature (T). Equation (1) defines the SoC for the RC model with Equations (1)–(5) further defining the SoC of C
b and C
c, respectively.
where
The battery model as developed by the NREL (National Renewable Energy Laboratory) [
17] incorporates a charge reservoir and an equivalent circuit whose parameters rely on the reservoir’s remaining charge. The circuit monitors the battery pack as an ideal open circuit voltage source aligned with an internal resistance. Certain constraints are imposed on the battery, such as a minimum voltage limit and assumed constant storage capacity. The Coulombic efficiency significantly impacts the recharge after discharge. Moreover, a maximum battery voltage limits the recharge capacity. The RC model has a 1% accuracy based on 100 s drive cycles over 15 iterations, while other configurations lacked characterization due to limited information in the literature.
2.4.2. The RINT Battery Model
In [
17], the Internal Resistance (RINT) battery model has been previously defined whereby the model contains a voltage source coupled with an internal resistor as seen in
Figure 6. Equation (6) refers to the SoC of the battery model when charging. The formula calculates the remaining charge as a percentage of the total battery’s capacity, where
represents the battery’s maximum capacity,
is the amount of charge consumed, and
accounts for energy losses during the charging and discharging processes. The SoC is determined by the difference between the full capacity and the energy used (adjusted for efficiency), divided by the total capacity. This provides a clear indication of how much energy remains in the battery relative to its full capacity. Referring to Equation (7),
represents the current (in amperes) over time, while
accounts for the efficiency losses during the charging or discharging process. By integrating the product of the current and the Coulombic efficiency over time, we calculate the total charge consumed. This integral gives a more precise estimation of the actual charge used, considering real-world losses in the battery system.
By considering the current and Coulombic efficiency losses during charging, the SoC for the RINT model can be calculated as
where the
can be defined by
for the discharge condition, A > 0, and for the charge, A < 0.
The RINT model predictions have a 3% accuracy based on 100 s drive cycles over 15 iterations. It is important to note that other battery technologies are currently being researched and developed, such as the Neural Network Battery Model and the fundamental Lead Acid Battery Model to name a few. However, these will not be considered in this study.
2.5. Environmental and Health Impacts of Fossil Fuel Combustion
Burning fossil fuels has significant environmental consequences, including the increase in global CO
2 levels. The combustion of these fuels releases harmful gases and pollutants into the atmosphere, contributing to global warming, ozone layer damage, and other harmful secondary effects. Among these pollutants, Carbon Dioxide (CO
2) is a primary greenhouse gas driving climate change, produced during fuel combustion and released from vehicle exhausts. Carbon Monoxide (CO), another harmful gas, is emitted through incomplete combustion, posing risks to human health and contributing to localized climate change [
18,
19]. A study by [
3] detailed emissions by source, with a specific focus on the transportation sector. While projections indicate a significant reduction in toxic emissions by 2045, the HEV only accounts for a small portion of total emissions. This highlights the importance of transitioning towards HEVs, despite their current minor contribution to overall emissions.
Burning fossil fuels generates a host of harmful by-products, releasing a significant amount of pollutants into the atmosphere, highlighted in [
20]. These pollutants far exceed the natural absorption capacity of the environment, leading to widespread environmental and health concerns. Chemicals such as Chlorofluorocarbons (CFCs) and Hydrochlorofluorocarbons (HCFCs) contribute to climate change and ozone layer depletion, while fine particulates like PM10 and PM2.5 negatively impact human respiratory systems. Lead (Pb) and Methane (CH4) pose serious threats to the environment, while Sulfur Oxides (SOx) irritate the lungs and contribute to acid rain, causing adverse effects on human health and ecological systems. These effects are further detailed in studies conducted by the United States Environmental Protection Agency (EPA) in their synthesis report [
21].
A key feature of the ADVISOR software is that it reports on the levels of Nitric Oxide (NO), Carbon Monoxide (CO), and Hydrocarbons (HC), which are available through the simulation terminal. One of the metrics provided by the simulation includes the Engine Out Emissions (EOE) in a unit step time. Equation (8) highlights the EOE, where
EOE represents the emissions generated directly by the engine during a specific time interval or step.
The Fully Hot Engine Out Emissions (FHEOE) represents the emissions produced by the engine when it has reached its optimal operating temperature.
The Engine Temperature Emissions (ETE) correction factor is used to adjust the emissions based on the engine’s temperature conditions.
It is important to note that ADVISOR disregards the vehicle’s engine temperature by default; therefore, the temperature is normalized prior to computation. Equation (9) provides the normalized engine temperature.
where
is the engine coolant thermostat setpoint temperature. This is typically set to 95 °C with a tolerance of ±5 °C. Once the normalized temperature has been determined, HC, NO, and CO values can then be calculated as
As noted in [
22], there are various forms of fuels that could be used in an HEV. Some examples of these are Liquid Petroleum Gas (LPG), General Petrol, and Natural Gas amongst others. Each type of fuel will have a corresponding emission factor, as represented in
Table 1. These emission factors provide further analysis into the overall emissions released from the combustion cycle of a vehicle’s engine.
Lastly, to determine a vehicle’s emissions factor, the fuel economy and distance traveled are considered and can be generically derived using the emissions factor of the fuel type used as per Equation (13) [
22].
2.6. Environmental Impact of HEV Manufacturing
Hybrid vehicles have gained significant popularity due to their lower fuel consumption and reduced emissions during operation, positioning them as potential solutions to environmental challenges such as climate change and energy security. However, concerns have been raised regarding the environmental impact of their manufacturing process, raising questions about the true environmental benefits of hybrids and the influence of marketing on public perception. To address these concerns, studies conducted by the U.S. Department of Energy’s Argonne National Laboratory assess the overall environmental impact of hybrid cars and analyze their life cycle emissions [
23] by considering both the production and operational phases. The findings shed light on the energy requirements and emissions associated with hybrid production, particularly in relation to conventional cars.
The study revealed that hybrid vehicles require more energy to manufacture compared to conventional cars, resulting in higher greenhouse gas emissions and the increased utilization of fossil fuels during the production phase. Notably, the production of hybrid batteries, which demands significant energy inputs, contributes to elevated emission levels of SO
x. These findings emphasize the importance of considering the environmental impact of hybrid manufacturing processes. Despite the higher energy consumption and emissions during the production phase, the study [
24] demonstrated that the environmental benefits of driving a hybrid car outweigh the initial manufacturing impact. Over the lifespan of a hybrid vehicle, including both the production and operational phases, hybrids emit significantly fewer greenhouse gases and consume less energy compared to conventional cars. This can be attributed to their improved fuel efficiency and reduced emissions during operation, effectively offsetting the higher energy input and emissions during production. Furthermore, the study acknowledged the emergence of plug-in HEVs, which offer the potential for zero-emission driving when charged from an electrical source. However, it is crucial to consider the environmental impact of the electricity source used for charging. If the electricity primarily originates from coal-generated power plants, there is a risk of increased greenhouse gas emissions compared to conventional hybrids. This highlights the importance of promoting the use of clean and renewable energy sources for powering plug-in HEVs [
25].
2.7. Life Cycle Assessment and Longevity of Lithium-Ion and Ni-MH Battery Packs in HEVs
Battery packs are a critical component of HEVs, as they store energy to power the EM and propel the vehicle forward [
26]. The dimensions of the battery pack depend on the hybrid factor, which designers and manufacturers consider when selecting the appropriate size for the HEV [
27]. A study conducted by [
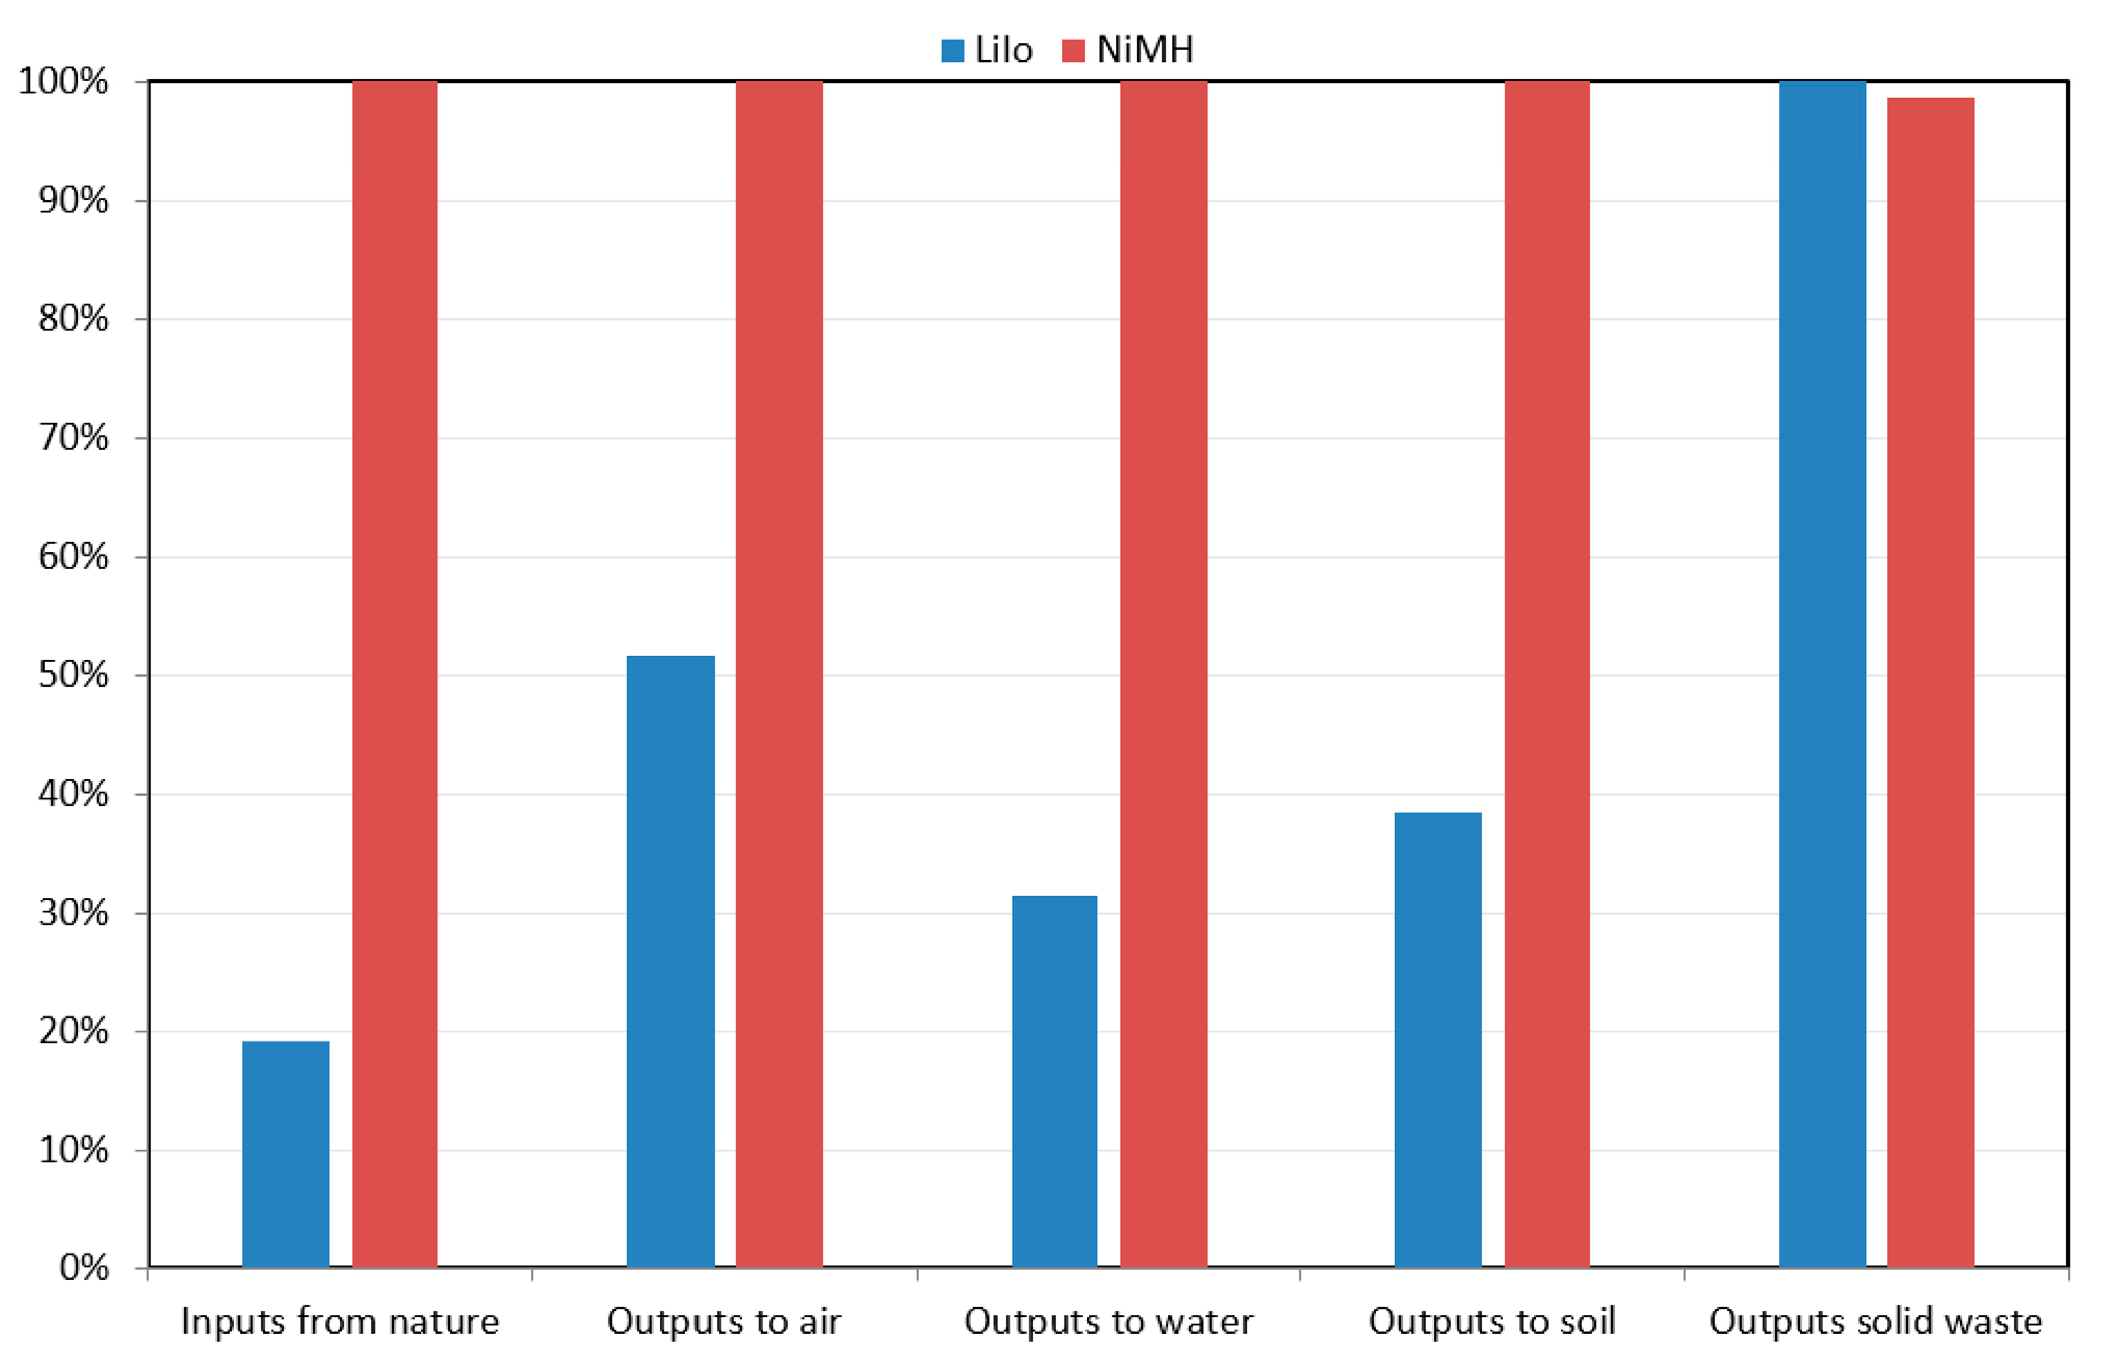
28] assessed the environmental impact of Lithium-ion and Ni-MH batteries using life cycle assessments (LCA). This analysis considered the chemical makeup of the batteries and emissions associated with manufacturing, usage, and disposal. The results indicated that Lithium-ion batteries generally have lower environmental impacts than Ni-MH batteries, particularly in terms of greenhouse gas emissions and fossil fuel usage. Referring to
Figure 7, Li-ion batteries have lower environmental impacts in terms of raw material inputs, emissions to air, and outputs to water compared to NiMH batteries, which show significantly higher percentages across all categories. The largest discrepancies are seen in outputs to air and solid waste, where NiMH batteries exhibit close to 90% or higher of contributions, whereas Li-ion batteries are less than 40% in each respective category.
Similarly,
Figure 8 illustrates the environmental burdens of both batteries across impact categories such as eutrophication, acidification, and global warming potential. NiMH batteries have a notably higher global warming impact at 100%, whereas Li-ion batteries account for less than 40%. Additionally, the Li-ion battery exhibits superior performance in terms of ozone layer depletion and human toxicity impacts, with the NiMH battery contributing substantially more to these areas. However, NiMH batteries perform marginally better in categories such as photochemical oxidation and terrestrial ecotoxicity. Research by [
29] focused on Ni-MH batteries in Series HEVs, revealing that these battery packs have a usable lifespan of approximately 10 years or 150,000 cycles before requiring replacement. Similarly, studies conducted by [
30,
31], examined Lithium-ion battery packs and found comparable lifespans of ±10 years, provided the batteries remain within the expected voltage range and the HEV is used within manufacturer specifications. It is important to note that these trends represent estimated lifespans and are contingent upon proper maintenance and the usage of the batteries within specified parameters.
2.8. Comparative Life Cycle Assessment Between the ICEVs, BEVs, and HEVs
The research presented in [
32] offers a comprehensive examination of an LCA with comparisons between Internal Combustion Engine Vehicles (ICEVs), Hybrid Electric Vehicles (HEVs), and Battery Electric Vehicles (BEVs) across three distinct stages. These include production, usage, and end of life stages.
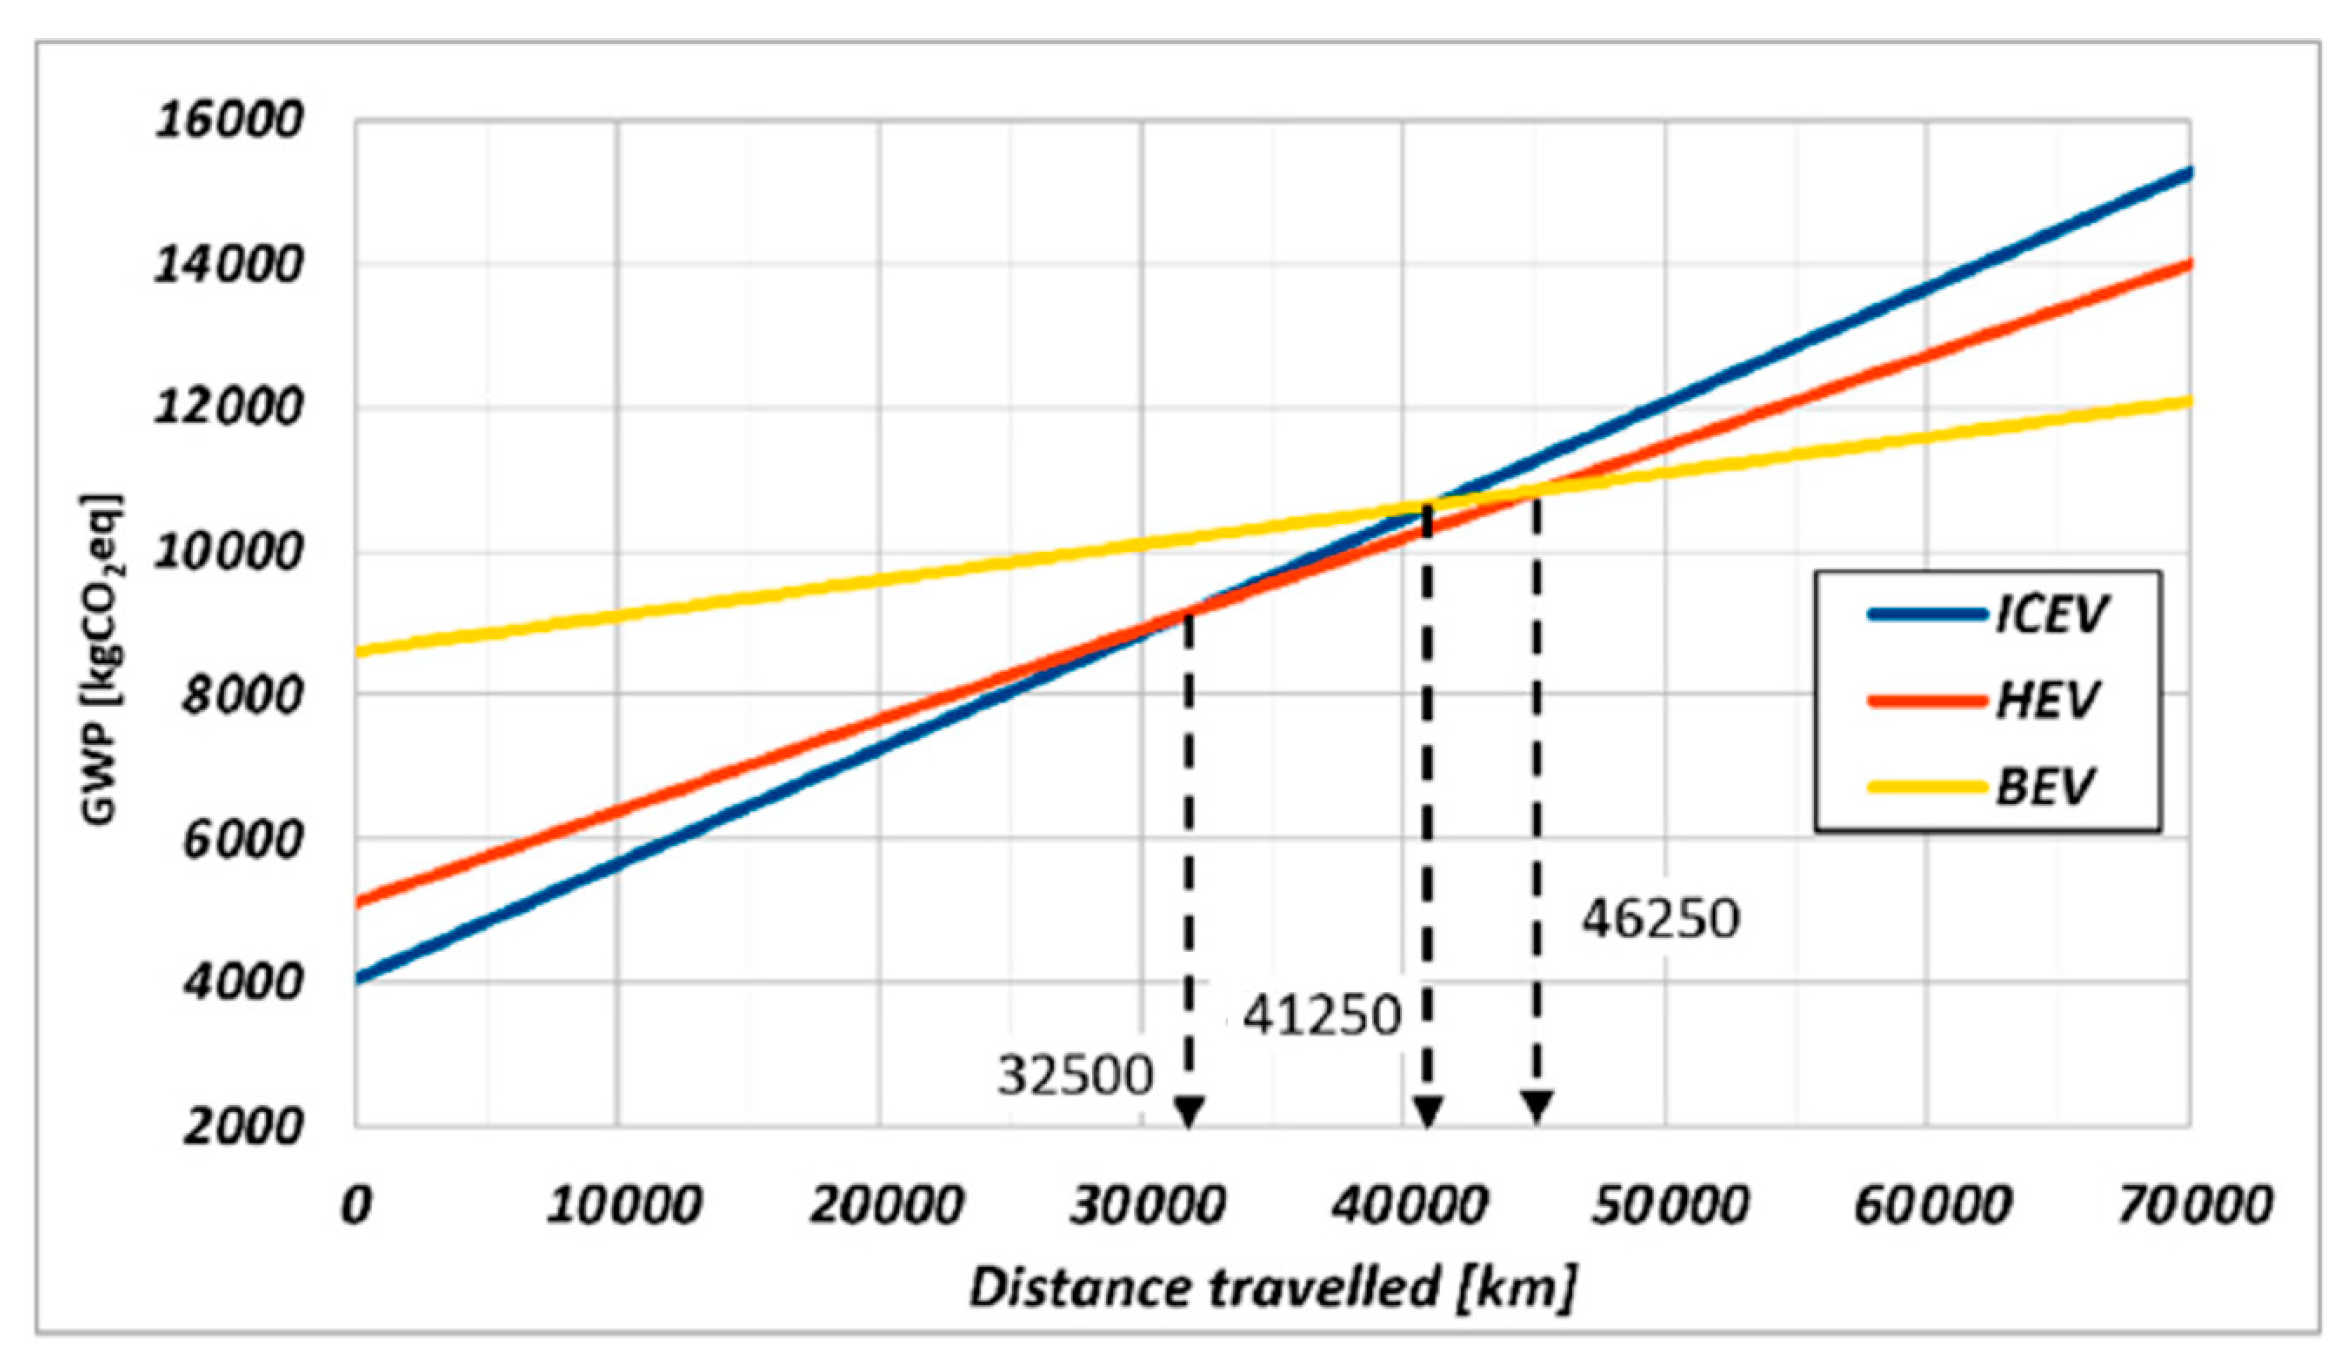
The findings reveal notable disparities in global warming potential (GWP) across these stages. During the initial production phase, ICEVs exhibit significantly lower GWP levels compared to HEVs and BEVs, with respective results of 4054 KgCO2eq/Kg, 5117 KgCO2eq/Kg, and 8607 KgCO2eq/Kg recorded within the first 25,000 km of travel. This translates to a 20.77% increase for HEVs and a 47.1% increase for BEVs in terms of the GWP, attributed to the additional battery electric components in the HEV and BEV vehicle types.
Despite the substantial emissions associated with the production phase, the GWP for both HEVs and BEVs demonstrates promise over the vehicles’ lifespans, diminishing as mileage accumulates. Notably, ICEVs and HEVs outperform BEVs in GWP between the 40,000 km and 50,000 km marks, as highlighted in
Figure 9, mainly due to battery electric components requiring maintenance, replacement, and/or servicing. As the vehicle reaches end of life, the potential for higher GWP in BEVs becomes apparent, but the HEVs still fall within an acceptable range, as the batteries in the HEVs are much smaller in comparison with the BEV, therefore reducing the impact on the environment during production and replacement. The HEV consistently exhibits a global warming impact between 85.5 and 88.5% of the ICEV’s impact, with a slightly higher production phase impact offset by lower emissions during usage. In contrast, the BEV’s impact varies significantly based on electricity mix and mileage, ranging from 33 to 44% of the ICEV’s impact when operated in Norway. However, with the average European electricity mix or operation in Poland, BEV emissions surpass those of ICEVs, emphasizing the critical role of electricity sources in BEV environmental performance. Additionally, battery replacement at 160,000 km significantly increases the BEV production phase impact.
The LCA comparison between ICEVs, BEVs, and HEVs highlights significant environmental disparities, particularly during the production and disposal phases. BEVs, relying on Lithium-ion batteries, exhibit substantially higher environmental impacts during production, including energy-intensive manufacturing processes, particulate emissions, and resource depletion. While the impact during the disposal phase is not explicitly quantified, it can be inferred that BEVs may face challenges related to battery recycling or disposal.
In contrast, HEVs emerge as a favorable alternative, boasting a balanced environmental profile with lower impacts across various categories compared to both ICEVs and BEVs. HEVs exhibit reduced production and disposal impacts relative to BEVs, indicating their potential as a sustainable transportation solution. This assessment emphasizes the importance of considering the entire lifecycle environmental impacts of vehicles when evaluating their environmental sustainability.
2.9. An Overview of the Advanced Vehicle Simulator (ADVISOR)
The National Renewable Energy Laboratory (NREL) first developed the ADVISOR program in 1994, aiming to assist the US Department of Energy and vehicle manufacturers such as General Motors, Daimler Chrysler, and Ford in developing HEVs by characterizing their performance, fuel economy, and emissions testing [
9], with the first public release of the software in 1998. According to [
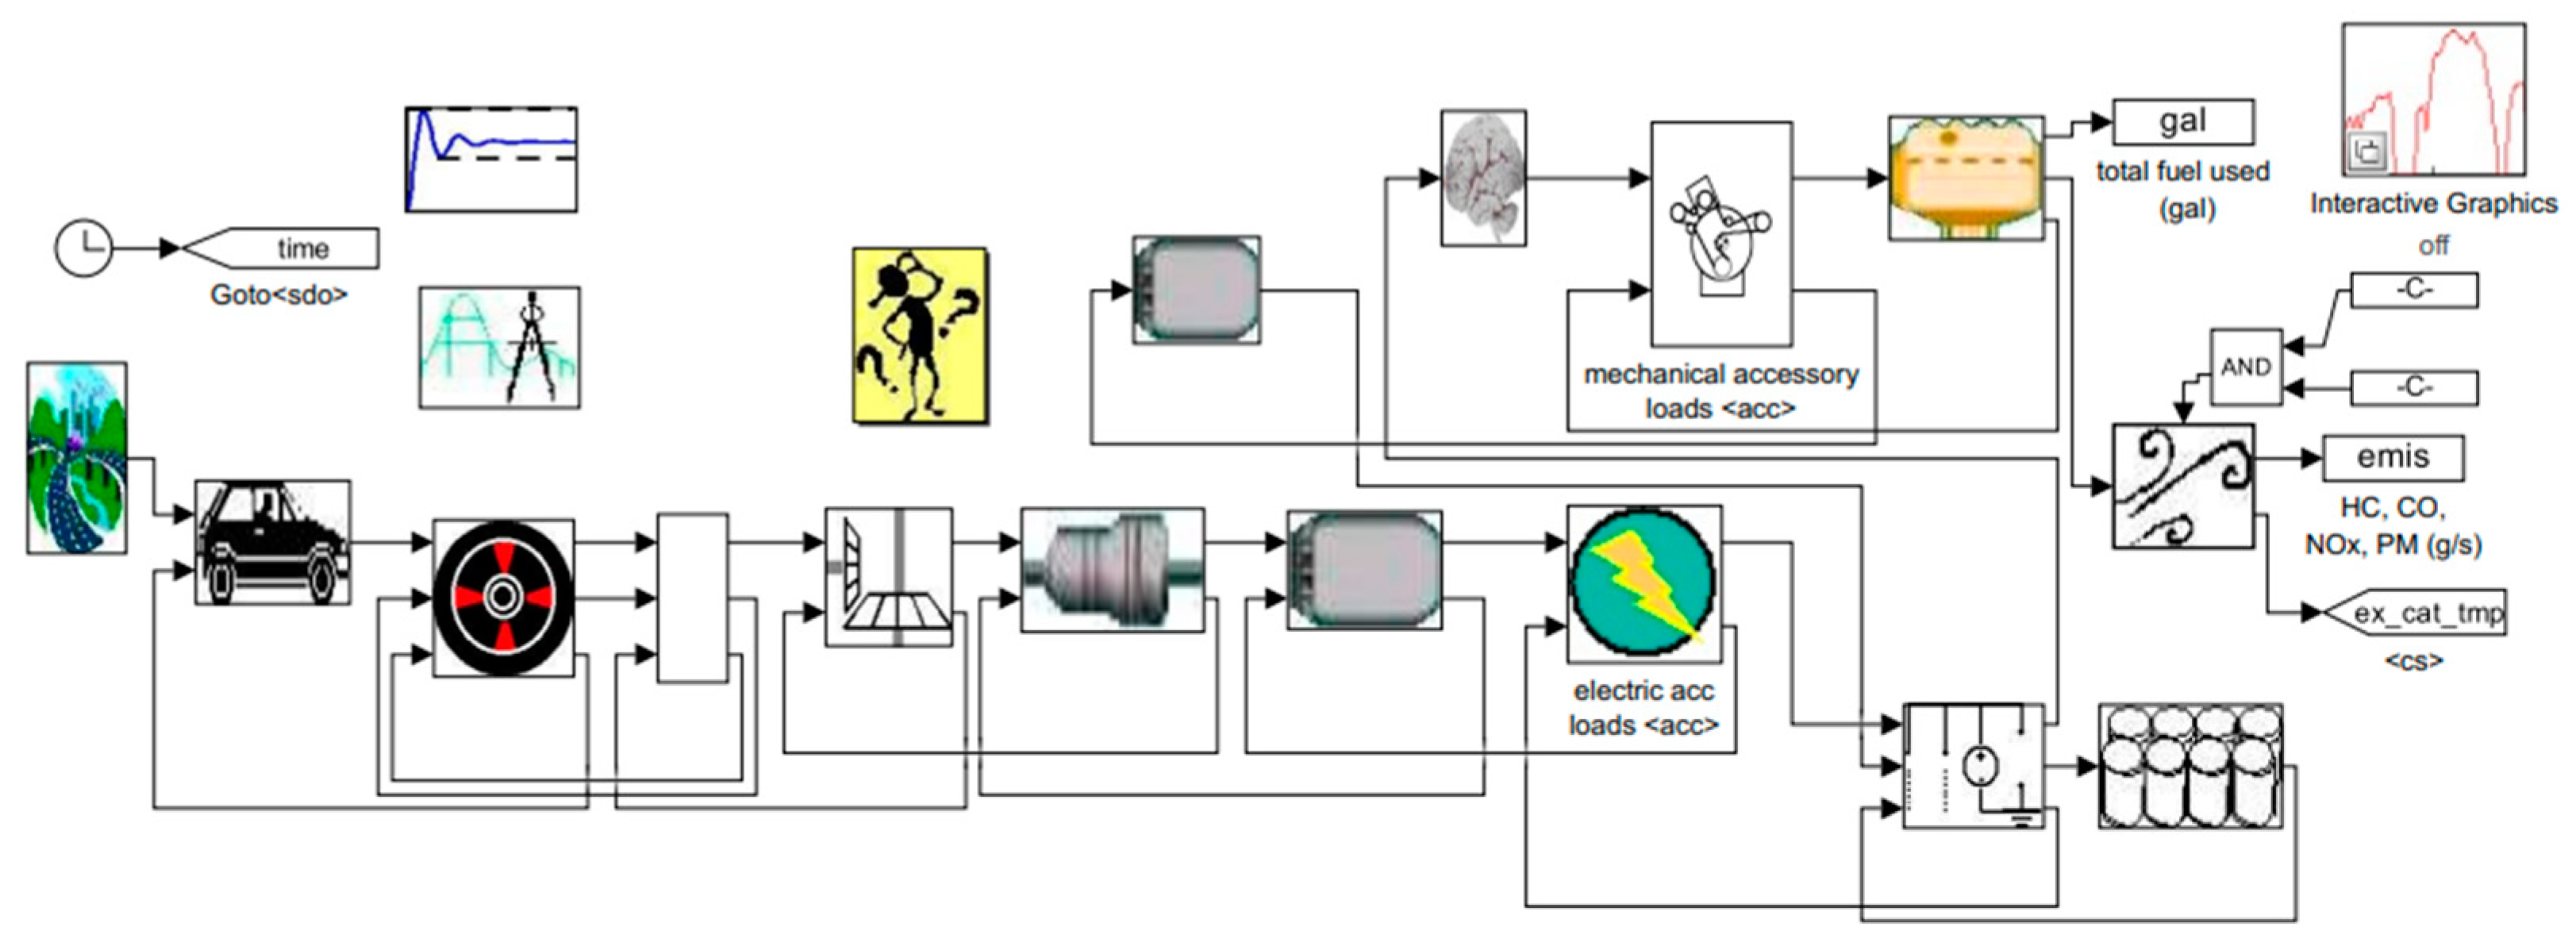
9], initial product adoption showed significant interest, with members of industry, academia, and government officials utilizing the software to gain insights into HEV technology. ADVISOR utilizes MATLAB
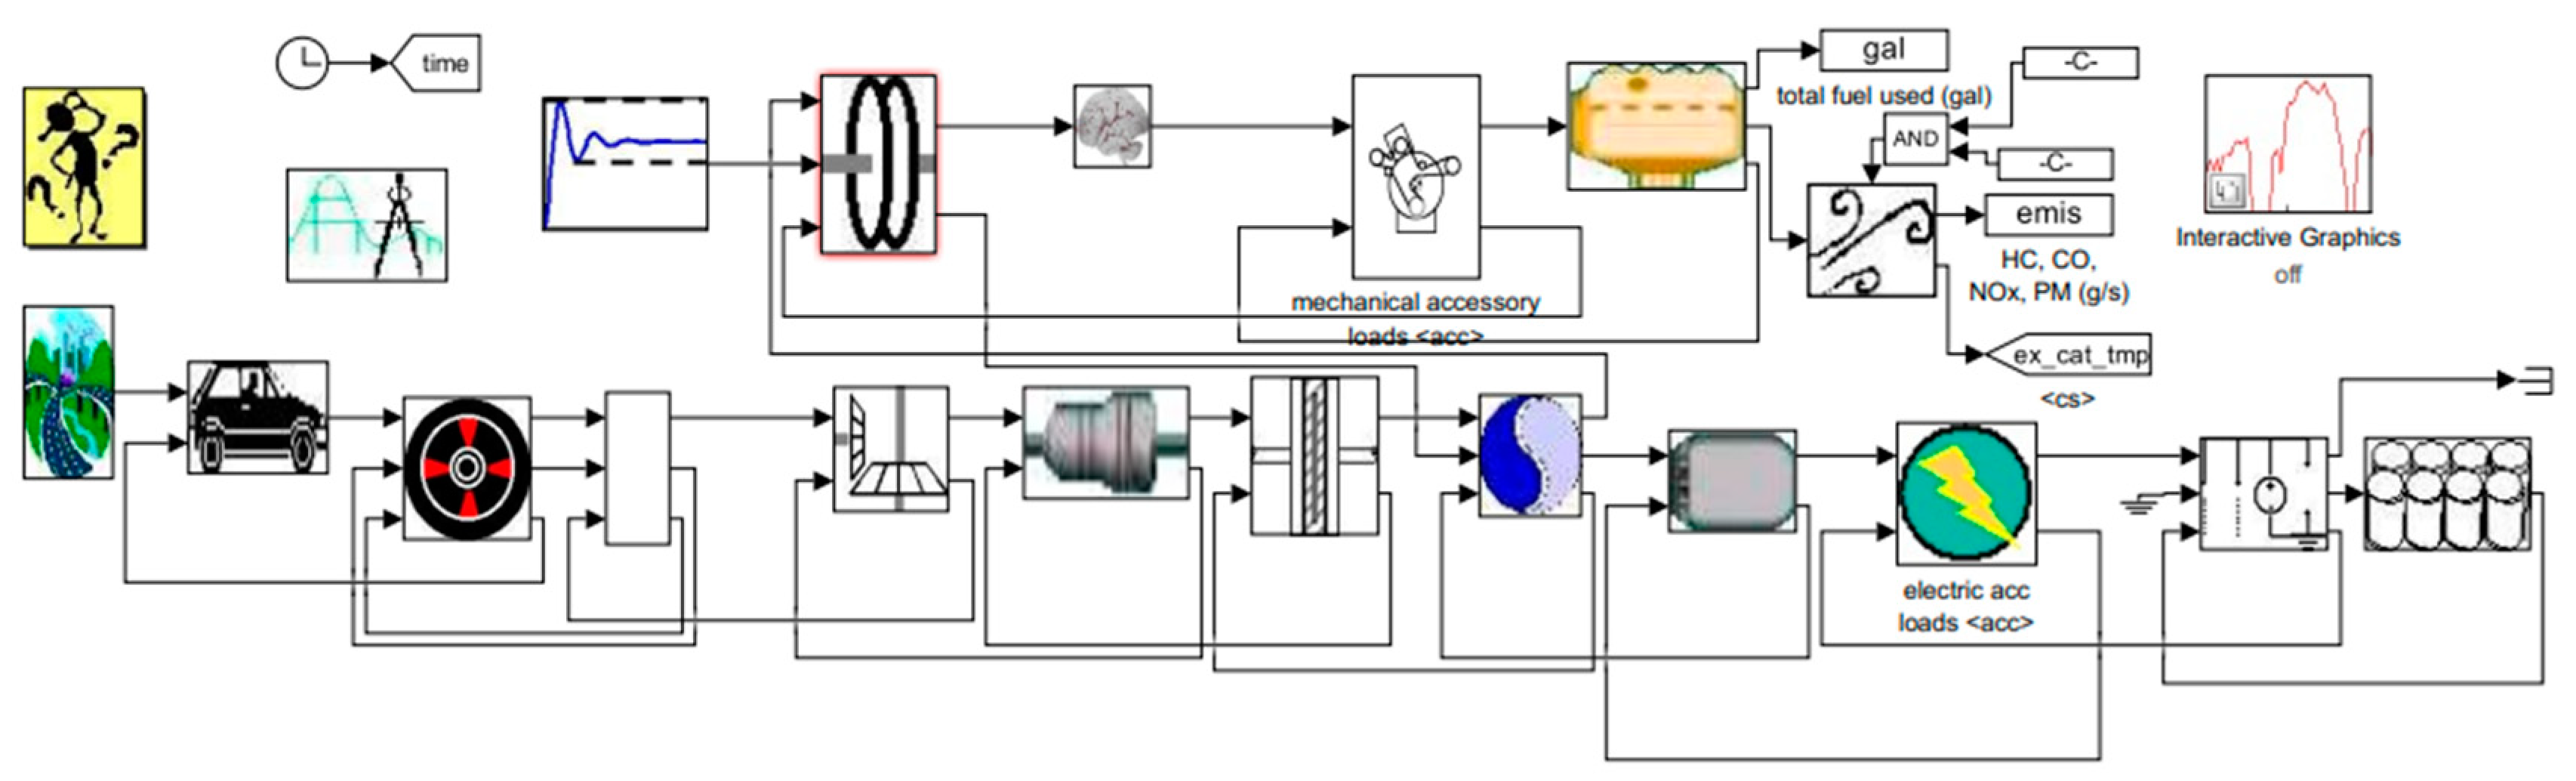
® for its mathematical calculations while employing Simulink for the graphical representation of complex block diagrams. This allows users the ability to utilize existing models and adjust the model parameters to suit their case scenarios while making use of existing and standard test cycles for simulation purposes and finally to obtain meaningful data for reporting.
In the research presented by [
33], ADVISOR utilizes a hybrid ‘backward/forward’ approach for simulation by default. In the ‘forward’ method, the software operator models input throttle and braking to compute torque and energy use throughout the drivetrain, progressing from the engine to the wheels. Used alone, this method suits hardware development but is slow in computation. In the ‘backward’ approach, the process starts with the desired vehicle velocity, computing the force required to reach the vehicle’s speed from speed data setpoints. The software then progresses backward from the tire/road interface to the energy source, facilitating rapid calculations. However, it lacks throttle and brake information. By combining both approaches, ADVISOR maximizes the utility of advanced battery and component models while ensuring swift simulation. This two-fold approach enables effective analysis vital for preliminary design and control system studies.
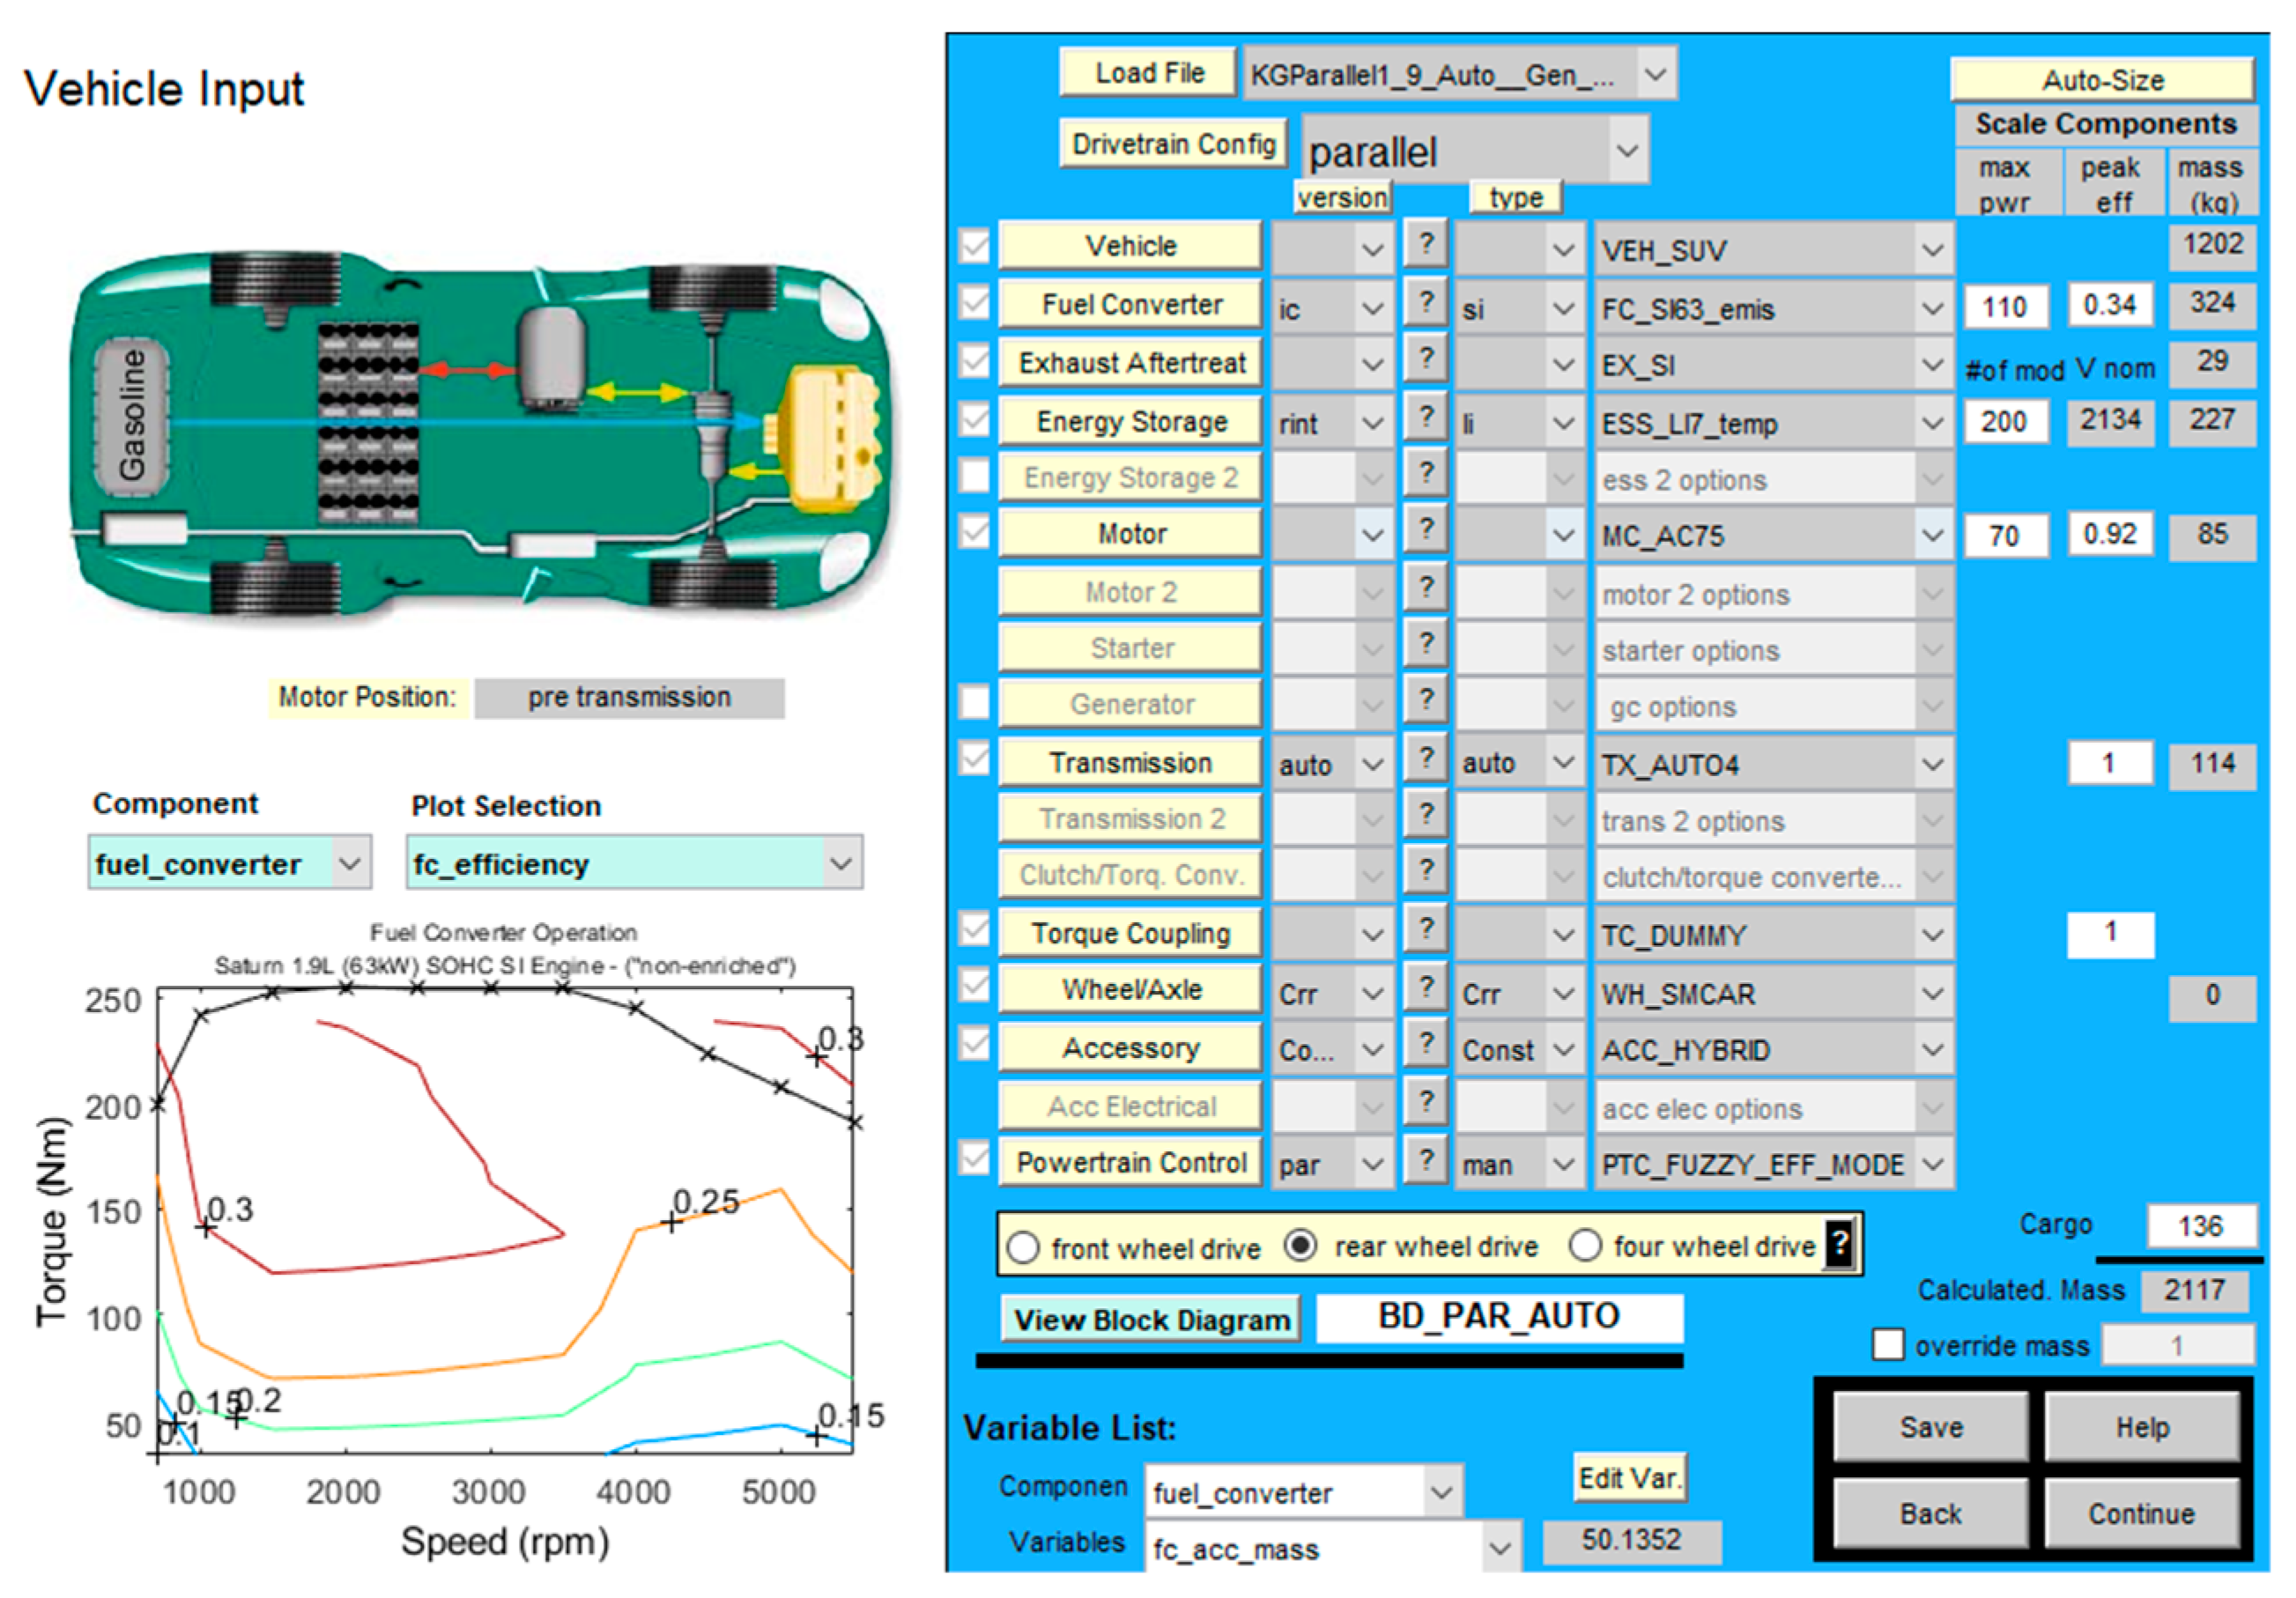
For the adjustment of simulation parameters, ADVISOR provides a simple but concise Graphical User Interface (GUI) to facilitate the adjustments. The GUI offers a useful menu of drop-down boxes for pre-existing models and custom vehicle models, drivetrain configuration, vehicle body characteristics such as mass, body type, and payload mass, wheel and axle configuration, and many other detailed characteristics. This level of customization allows users to configure vehicles as per their requirements without the need for an expert understanding of MATLAB® and Simulink software to design such tests and models, aiding in the rapid development of vehicle simulation tests and analysis.
Once the configuration is completed, the simulation setup would then need to be configured. The simulation setup screen offers many parameters that can then be fine-tuned to gather results. Users have the option of choosing a simple simulation from existing driving cycle routines, an option for running multiple driving cycles, or an option for making use of a custom drive cycle using the ‘Trip Builder’ functionality. The software also offers the option to perform acceleration and ‘Gradeability’ tests, providing further results for vehicle performance and time measures for the distance traveled. Some of the key features that ADVISOR contains are:
Simple Graphical User Interface;
Ideal for solutions that are time-sensitive;
Highly customizable for applications that require specifics to be tested;
Robust and modular.
Once the simulation is initiated, MATLAB® and Simulink are used to compute various input parameters to provide results based on the simulation.
4. Results and Discussion
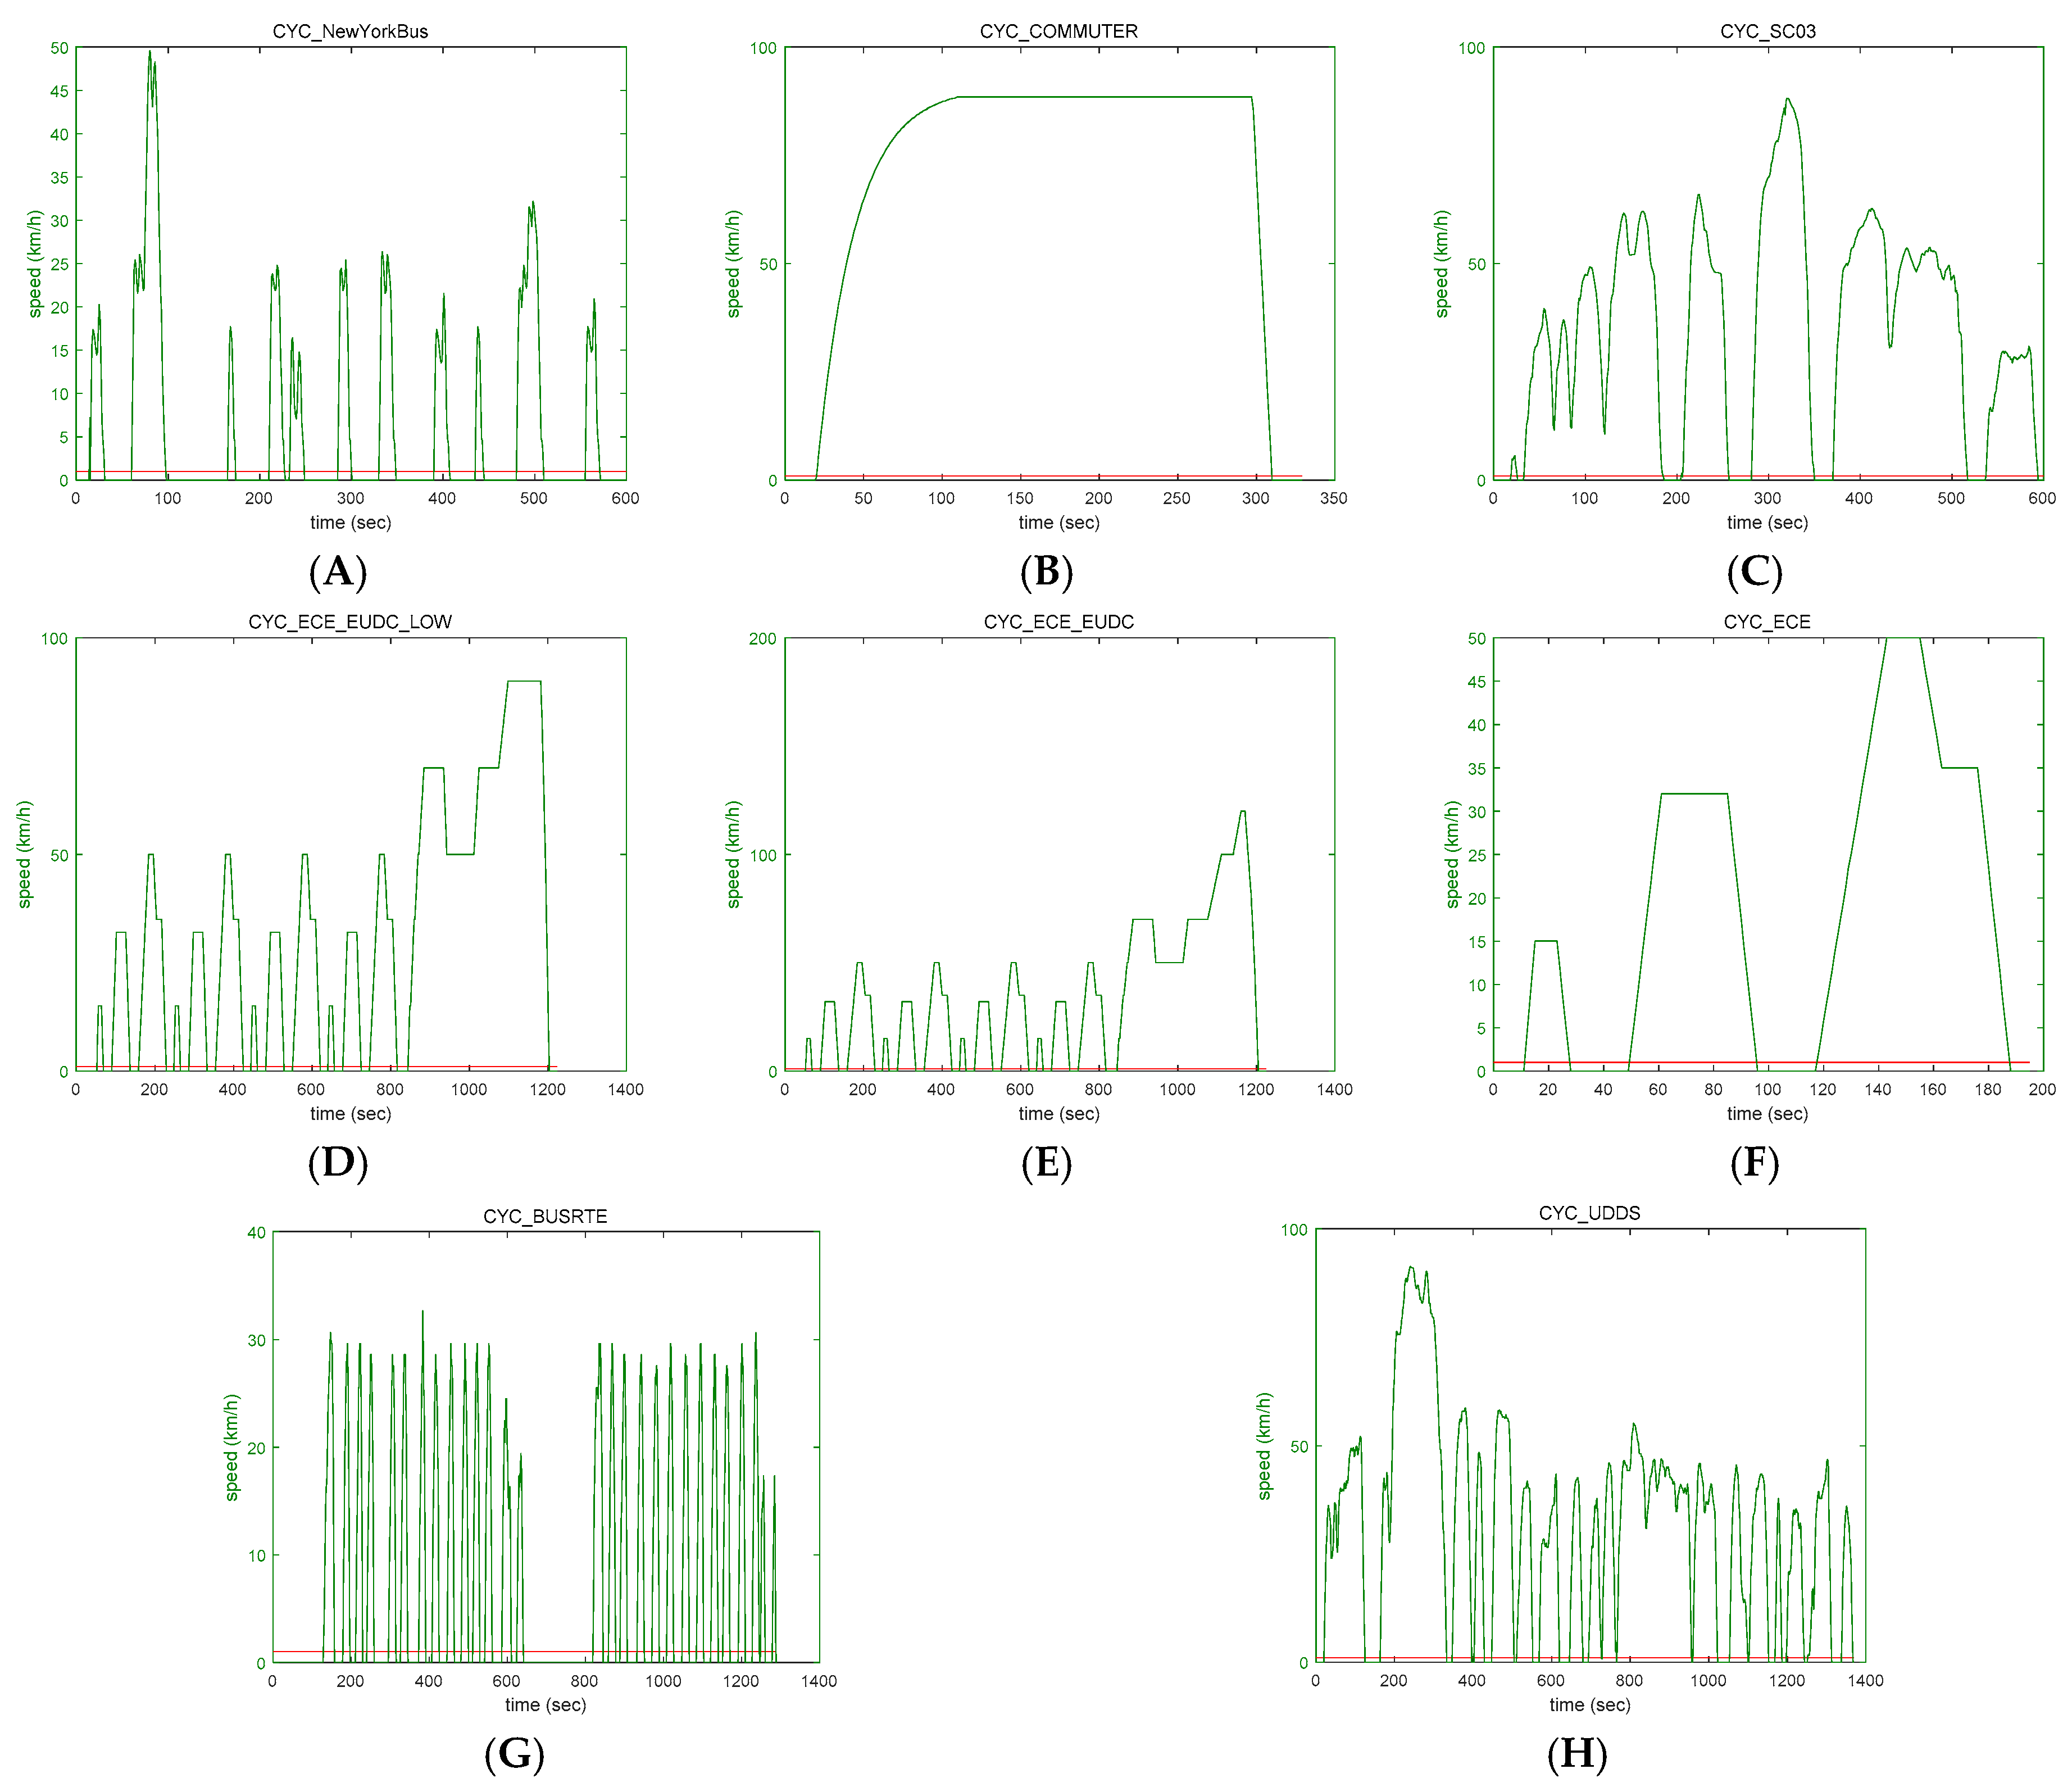
The simulation results presented cover rapid acceleration, deacceleration, and varying speeds in the standardized drive cycles previously described.
4.1. Internal Combustion Engine Vehicle (ICEV)
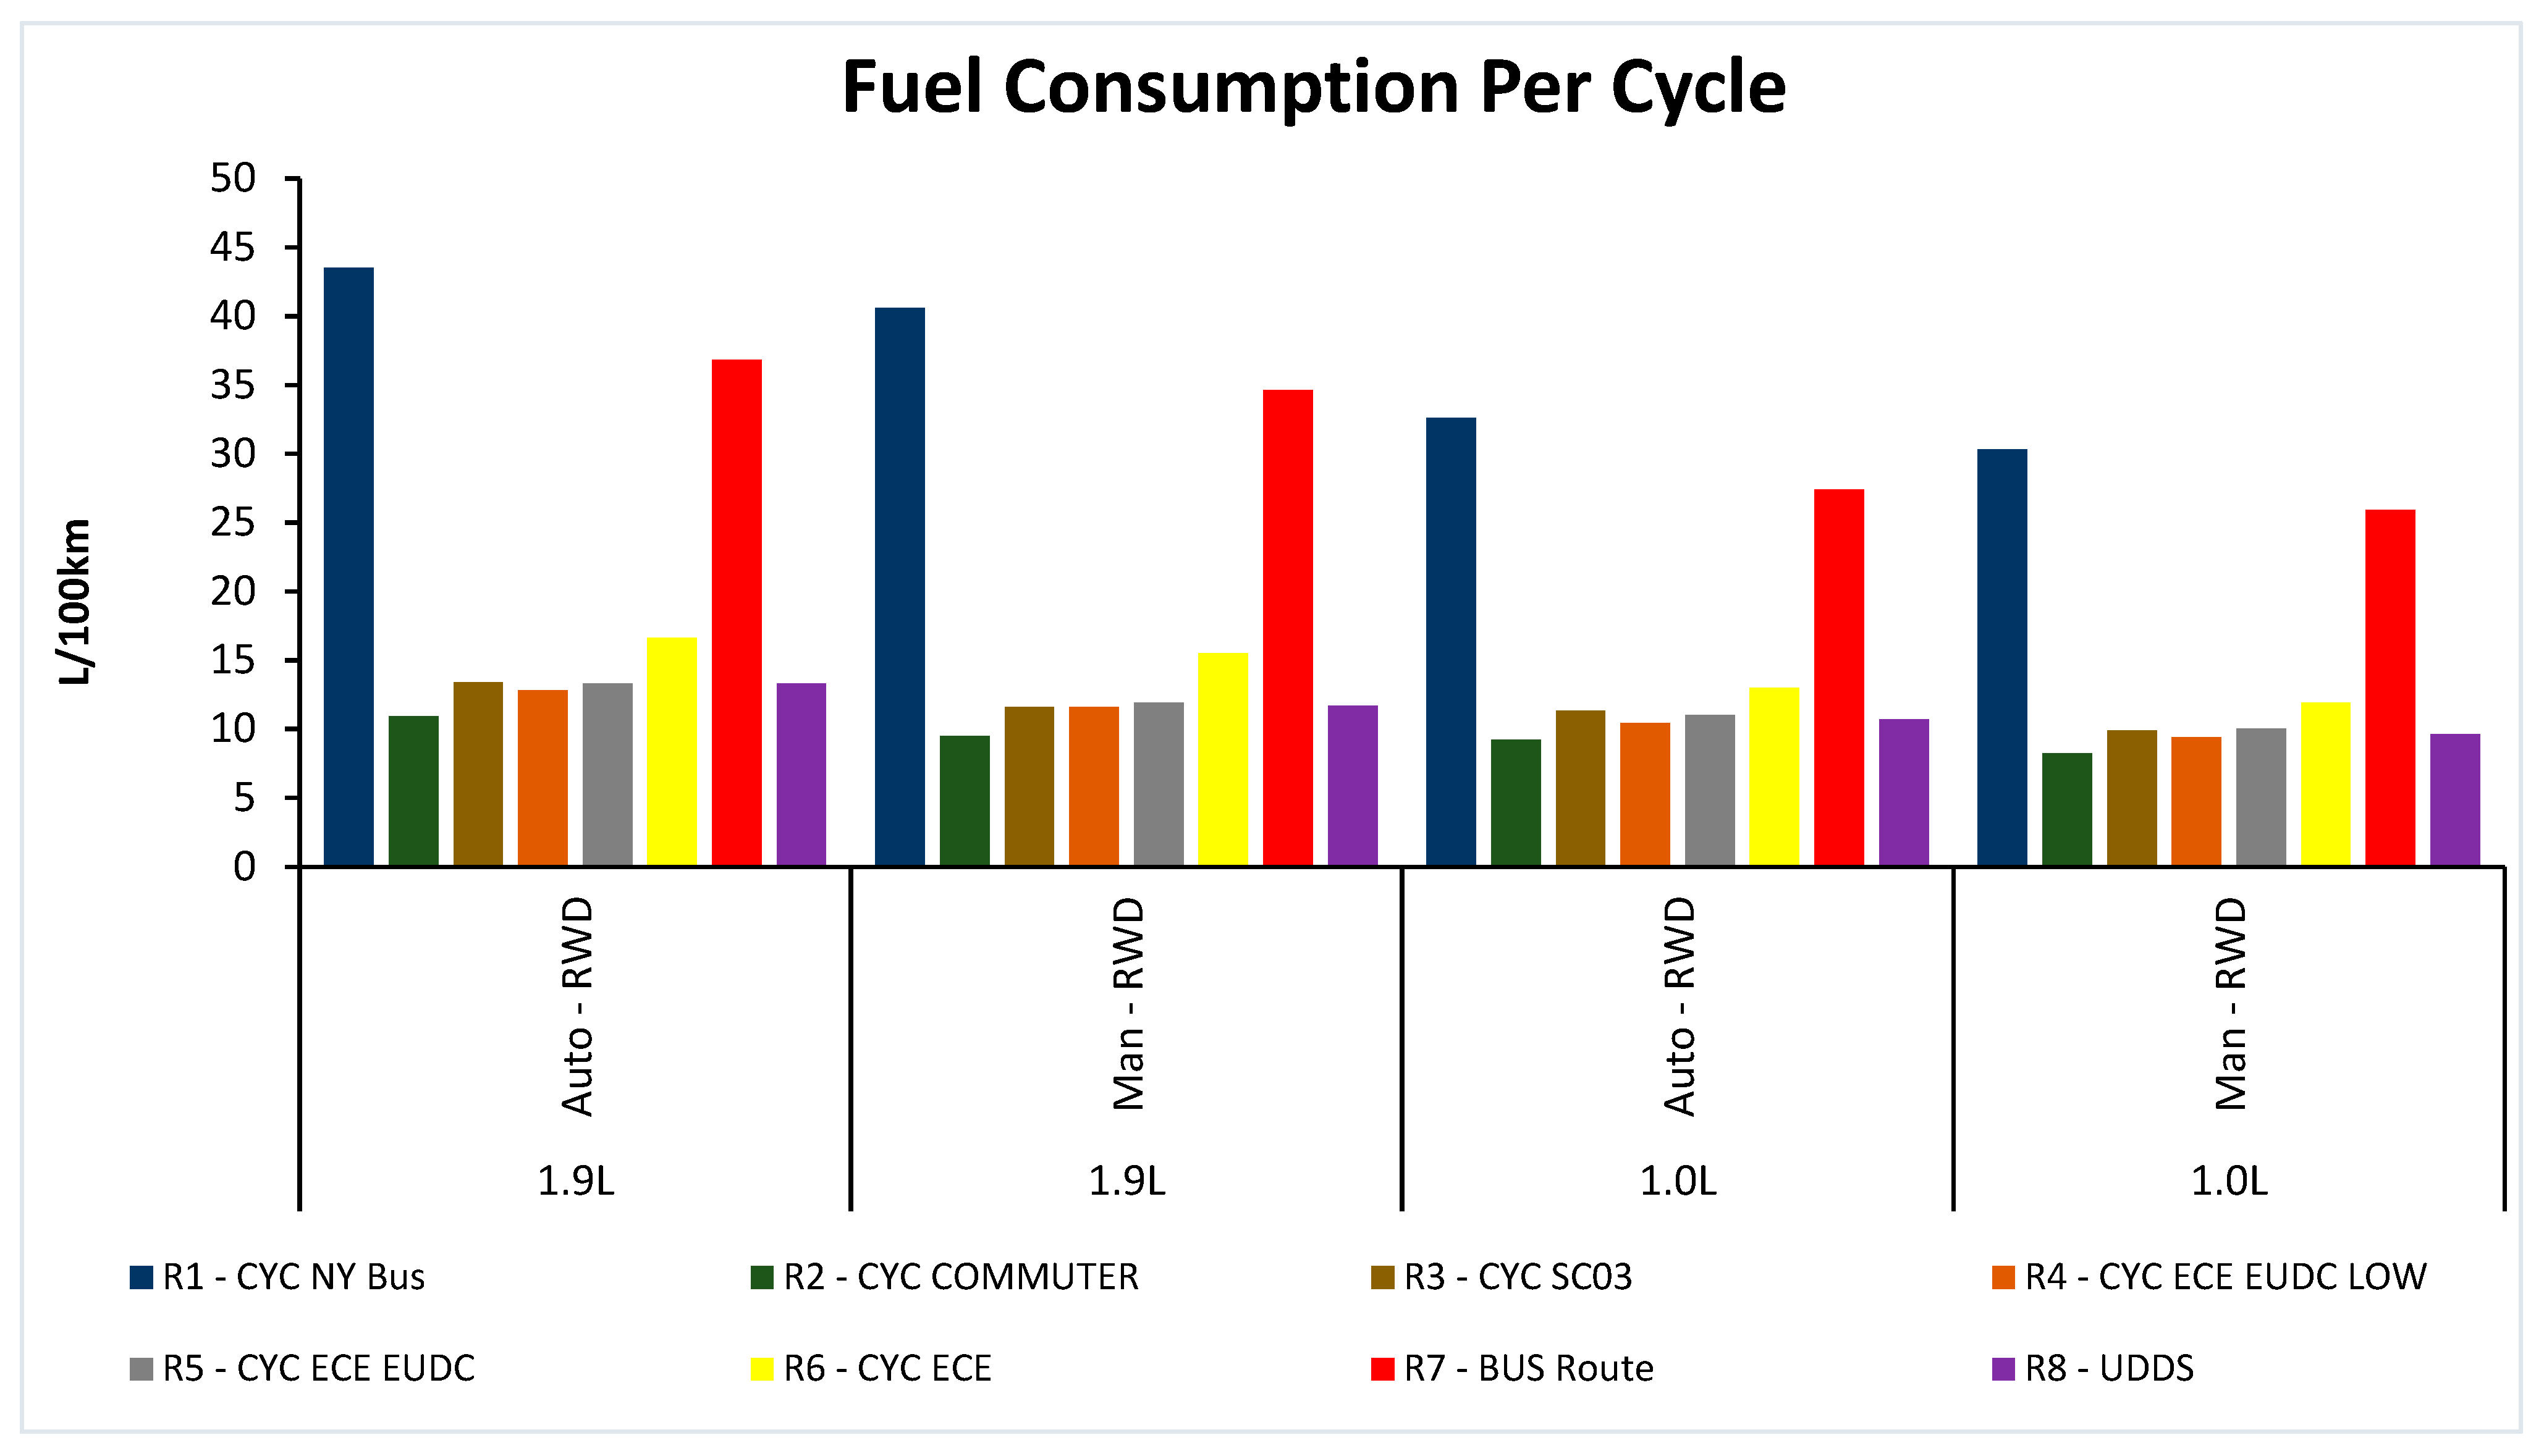
Figure 15 illustrates the various drive cycles and their respective outcomes for the ICEV. Notably, the NY Bus Cycle demonstrated the highest fuel consumption due to its inherent characteristics. Among the engine and transmission combinations tested, the 1.9 L Automatic variant recorded the highest fuel consumption at 44 L per 100 km, whereas the 1.0 L Manual counterpart exhibited the most efficient fuel usage, registering 30.3 L per 100 km. These findings highlight the impact of driving dynamics on fuel efficiency, particularly during instances of rapid acceleration and deceleration.
Moreover, the Commuter Cycle (resembling highway conditions) reveals intriguing trends. Under this scenario, the 1.0 L Manual transmission stands out with its commendable fuel economy of 8.1 L per 100 km. Overall, the results suggest that smaller engines tend to exhibit superior fuel efficiency compared to their larger counterparts, with manual transmissions offering better fuel economy than automatic transmissions. In
Figure 16, the emission results follow a similar trend to the fuel consumption results, further expanding on the condition that more fuel burnt during combustion will lead to higher levels of pollution released from the process. The 1.9 L Automatic transmission exhibits HC at 0.575 g per kilometer, CM at 2.246 g per kilometer, and NO at 0.303 g per kilometer whilst the 1.0 L Manual transmission has the lowest emissions with the HC at 0.378, CM at 1.466 g per kilometer, and NO at 0.22 g per kilometer, respectively. It is worth noting that the results indicate that the manual transmission outperformed the automatic transmission-equipped vehicles.
4.2. Series Hybrid Electric Vehicle
The results of the simulation highlight multiple iterations, involving adjustments in both the number of modules utilized and the types of battery models available. This was undertaken to identify the most fuel-efficient system. The number of modules ranged from 50 to 200, increasing in increments of 50. This variation allowed for valuable insights into the relationship between the number of modules and fuel consumption. Specifically, it elucidated the minimum number of modules required to achieve a reduction in fuel consumption and identified the threshold beyond which additional modules provided diminishing returns.
Figure 17 and
Figure 18 highlight the results of the simulation. Referring to
Figure 17, the average fuel consumption figures for the 1.9 L and the 1.0 L engines have been highlighted to represent the average fuel consumption between the different driving cycles. The lowest recorded fuel consumption was that of the 1.0 L NiMH 200 Modules RINT Battery Model—6.65 L/100 km—while the highest fuel consumption was that of the 1.9 L Lithium 100 Modules RC Battery Model at 15.76 L/100 km. The CAP configuration returned a zero output, and hence produced results that were unable to be recorded. City driving represented by ‘stop-and-go’ cycles in the New York Bus Routine indicates that the Series HEV outperforms the ICE in fuel consumption, as with other driving cycles.
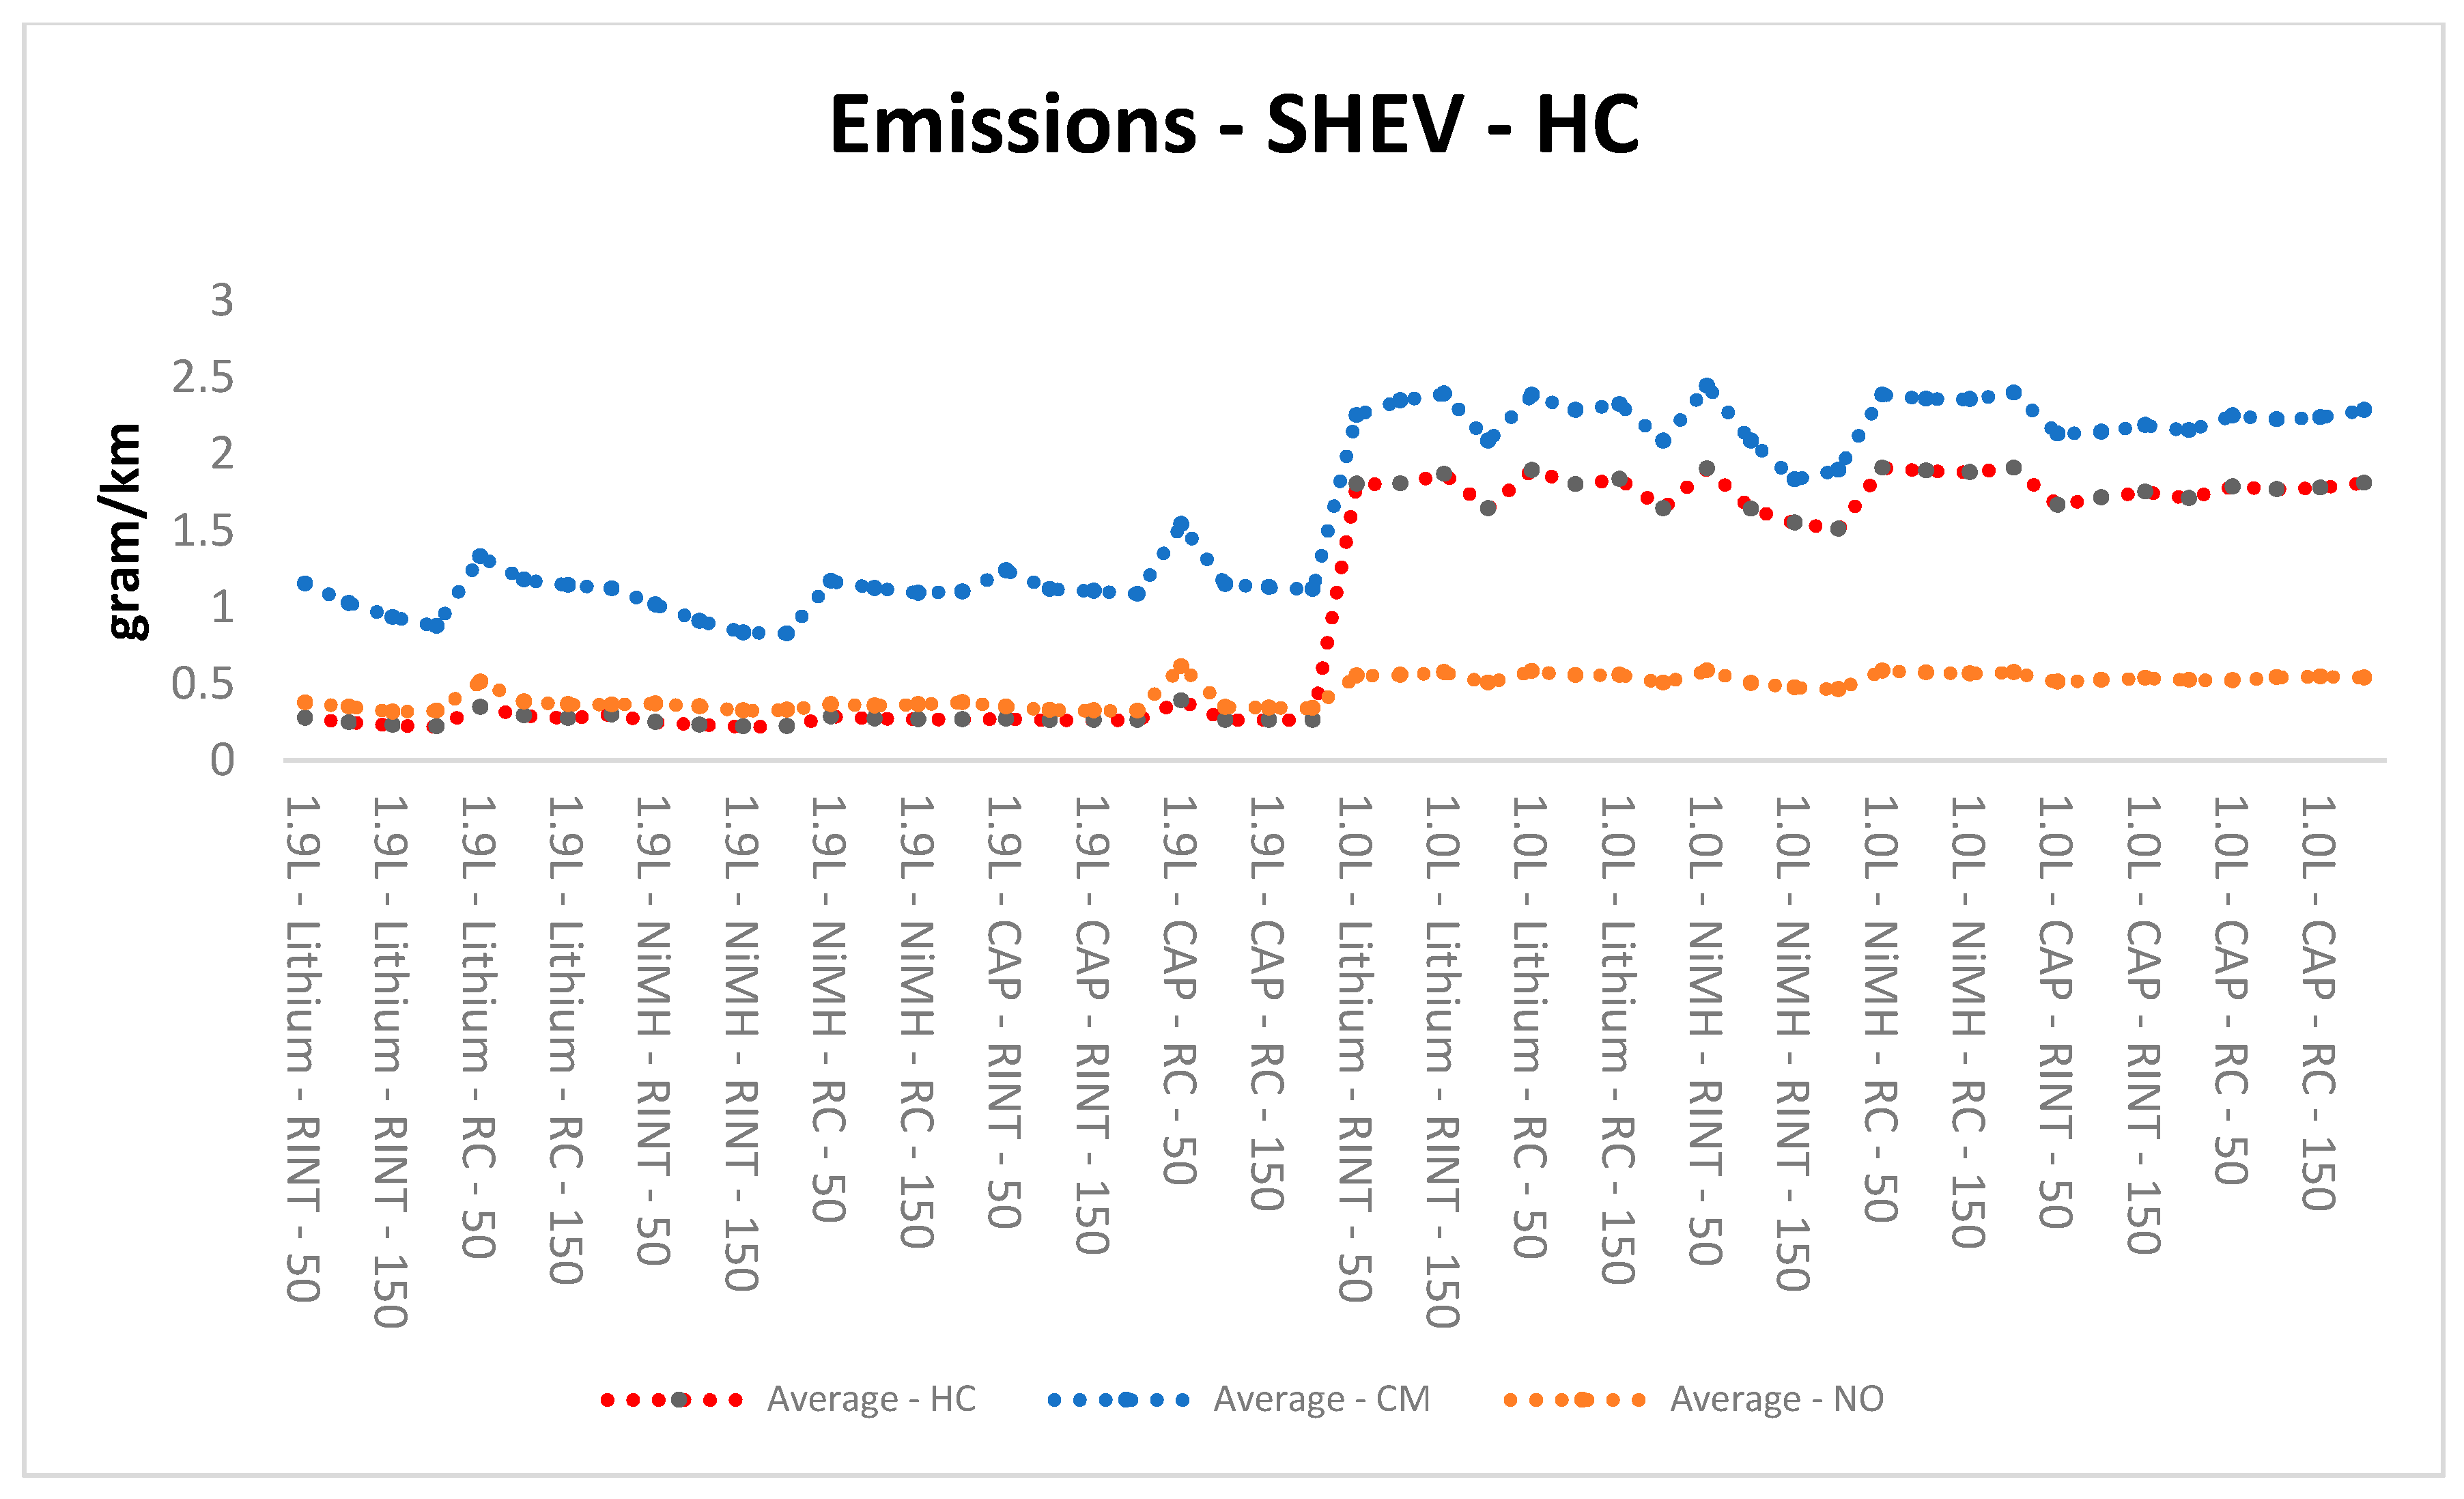
In
Figure 18, the average emissions of the 1.9 L and the 1.0 L engines have been highlighted. In contrast to the fuel consumption averages, the emissions averages highlight a different scale as the 1.9 L engine emits lower emissions per km compared to the 1.0 L engine. As mentioned previously, the 1.0 L engine has been designed for fuel efficiency and operates at a relative engine speed. Therefore, to maintain the SoC of the battery system, since the SHEV configuration has the ICE as the generating unit and the EM as the propulsion unit, the 1.0 L engine ran for longer periods compared to the 1.9 L engine to maintain the SoC, thus contributing to higher levels of emissions produced. The 1.9 L Lithium 200 Modules RINT Battery Model produced the lowest overall emissions with HC, CM, and NO of 0.220, 0.877, and 0.324 g/km, respectively, while the 1.0 L Lithium 50 Modules RINT Battery Model produced HC, CM, and NO of 1.904, 2.444, and 0.587 g/km, respectively. The number of modules used in the system becomes unimportant above 100 modules as the results begin to level out after 100 modules, thus reducing vehicle weight with fewer numbers of modules. Finally, overall emissions can still depend on many other factors, such as engine configuration, the charging system used, and other controls, which can be further explored to refine the models.
4.3. Parallel Hybrid Electric Vehicle
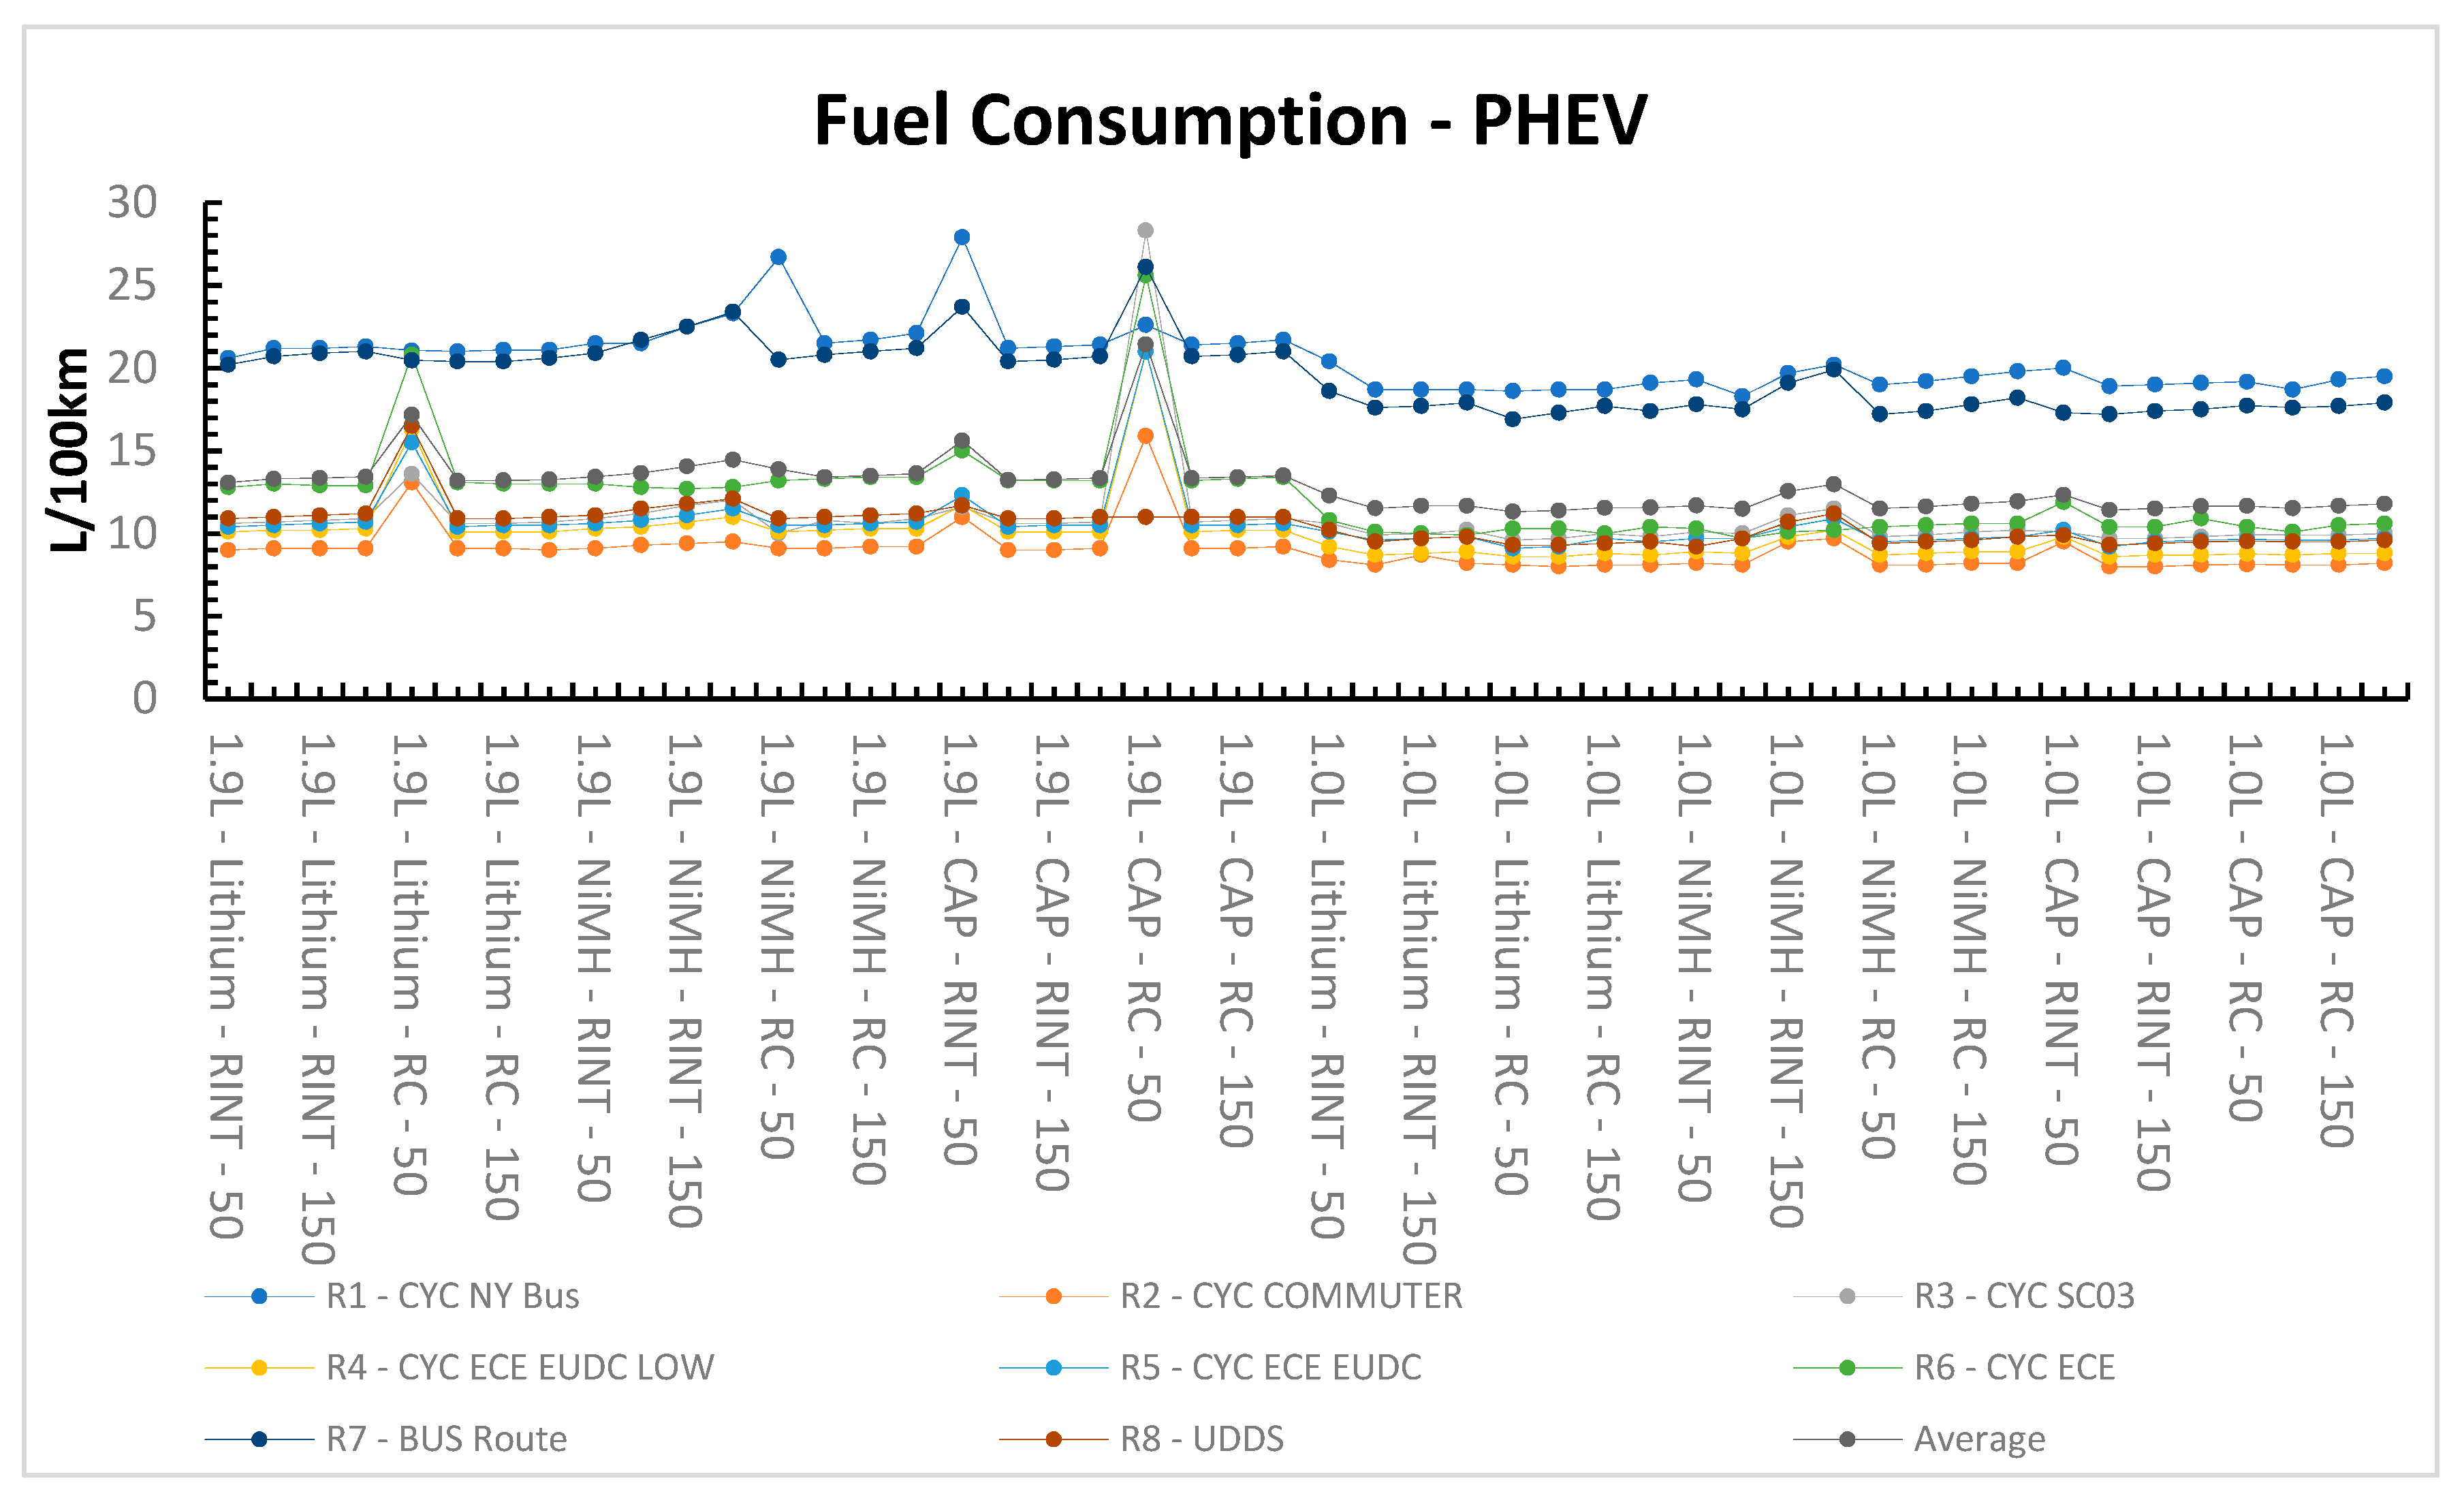
As with the series configuration, the simulation was conducted over multiple iterations and adjustments in the number of modules were performed to gain further insights into fuel efficiency versus the number of modules and their benefits. In
Figure 19, each driving cycle is averaged and visualized to represent the average fuel consumption between driving cycles. The lowest recorded fuel consumption was for the 1.0 L CAP 200 Modules RINT Battery Model—10.313 L per 100 km—while the highest fuel consumption was for the 1.9 L CAP 50 Modules RC Battery Model at 20.063 L per 100 km. Differentiating between SHEVs and PHEVs from the CAP configuration resulted in an exclusion of the 1.9 L CAP 50 Modules RC Battery Model since it did not record a value from the UDDS driving cycle. Constant acceleration and deacceleration while driving, represented by ‘stop-and-go’ cycles in the New York Bus Routine, shows that the PHEV marginally outperforms the ICE in fuel consumption. The Parallel configuration offers more stability in fuel consumption with a fewer number of modules needed to achieve these figures, as seen by the remaining driving cycles. This can be beneficial as the reduction in modules reduces the overall carbon footprint of the vehicle with smaller battery packs and reduced vehicle weight.
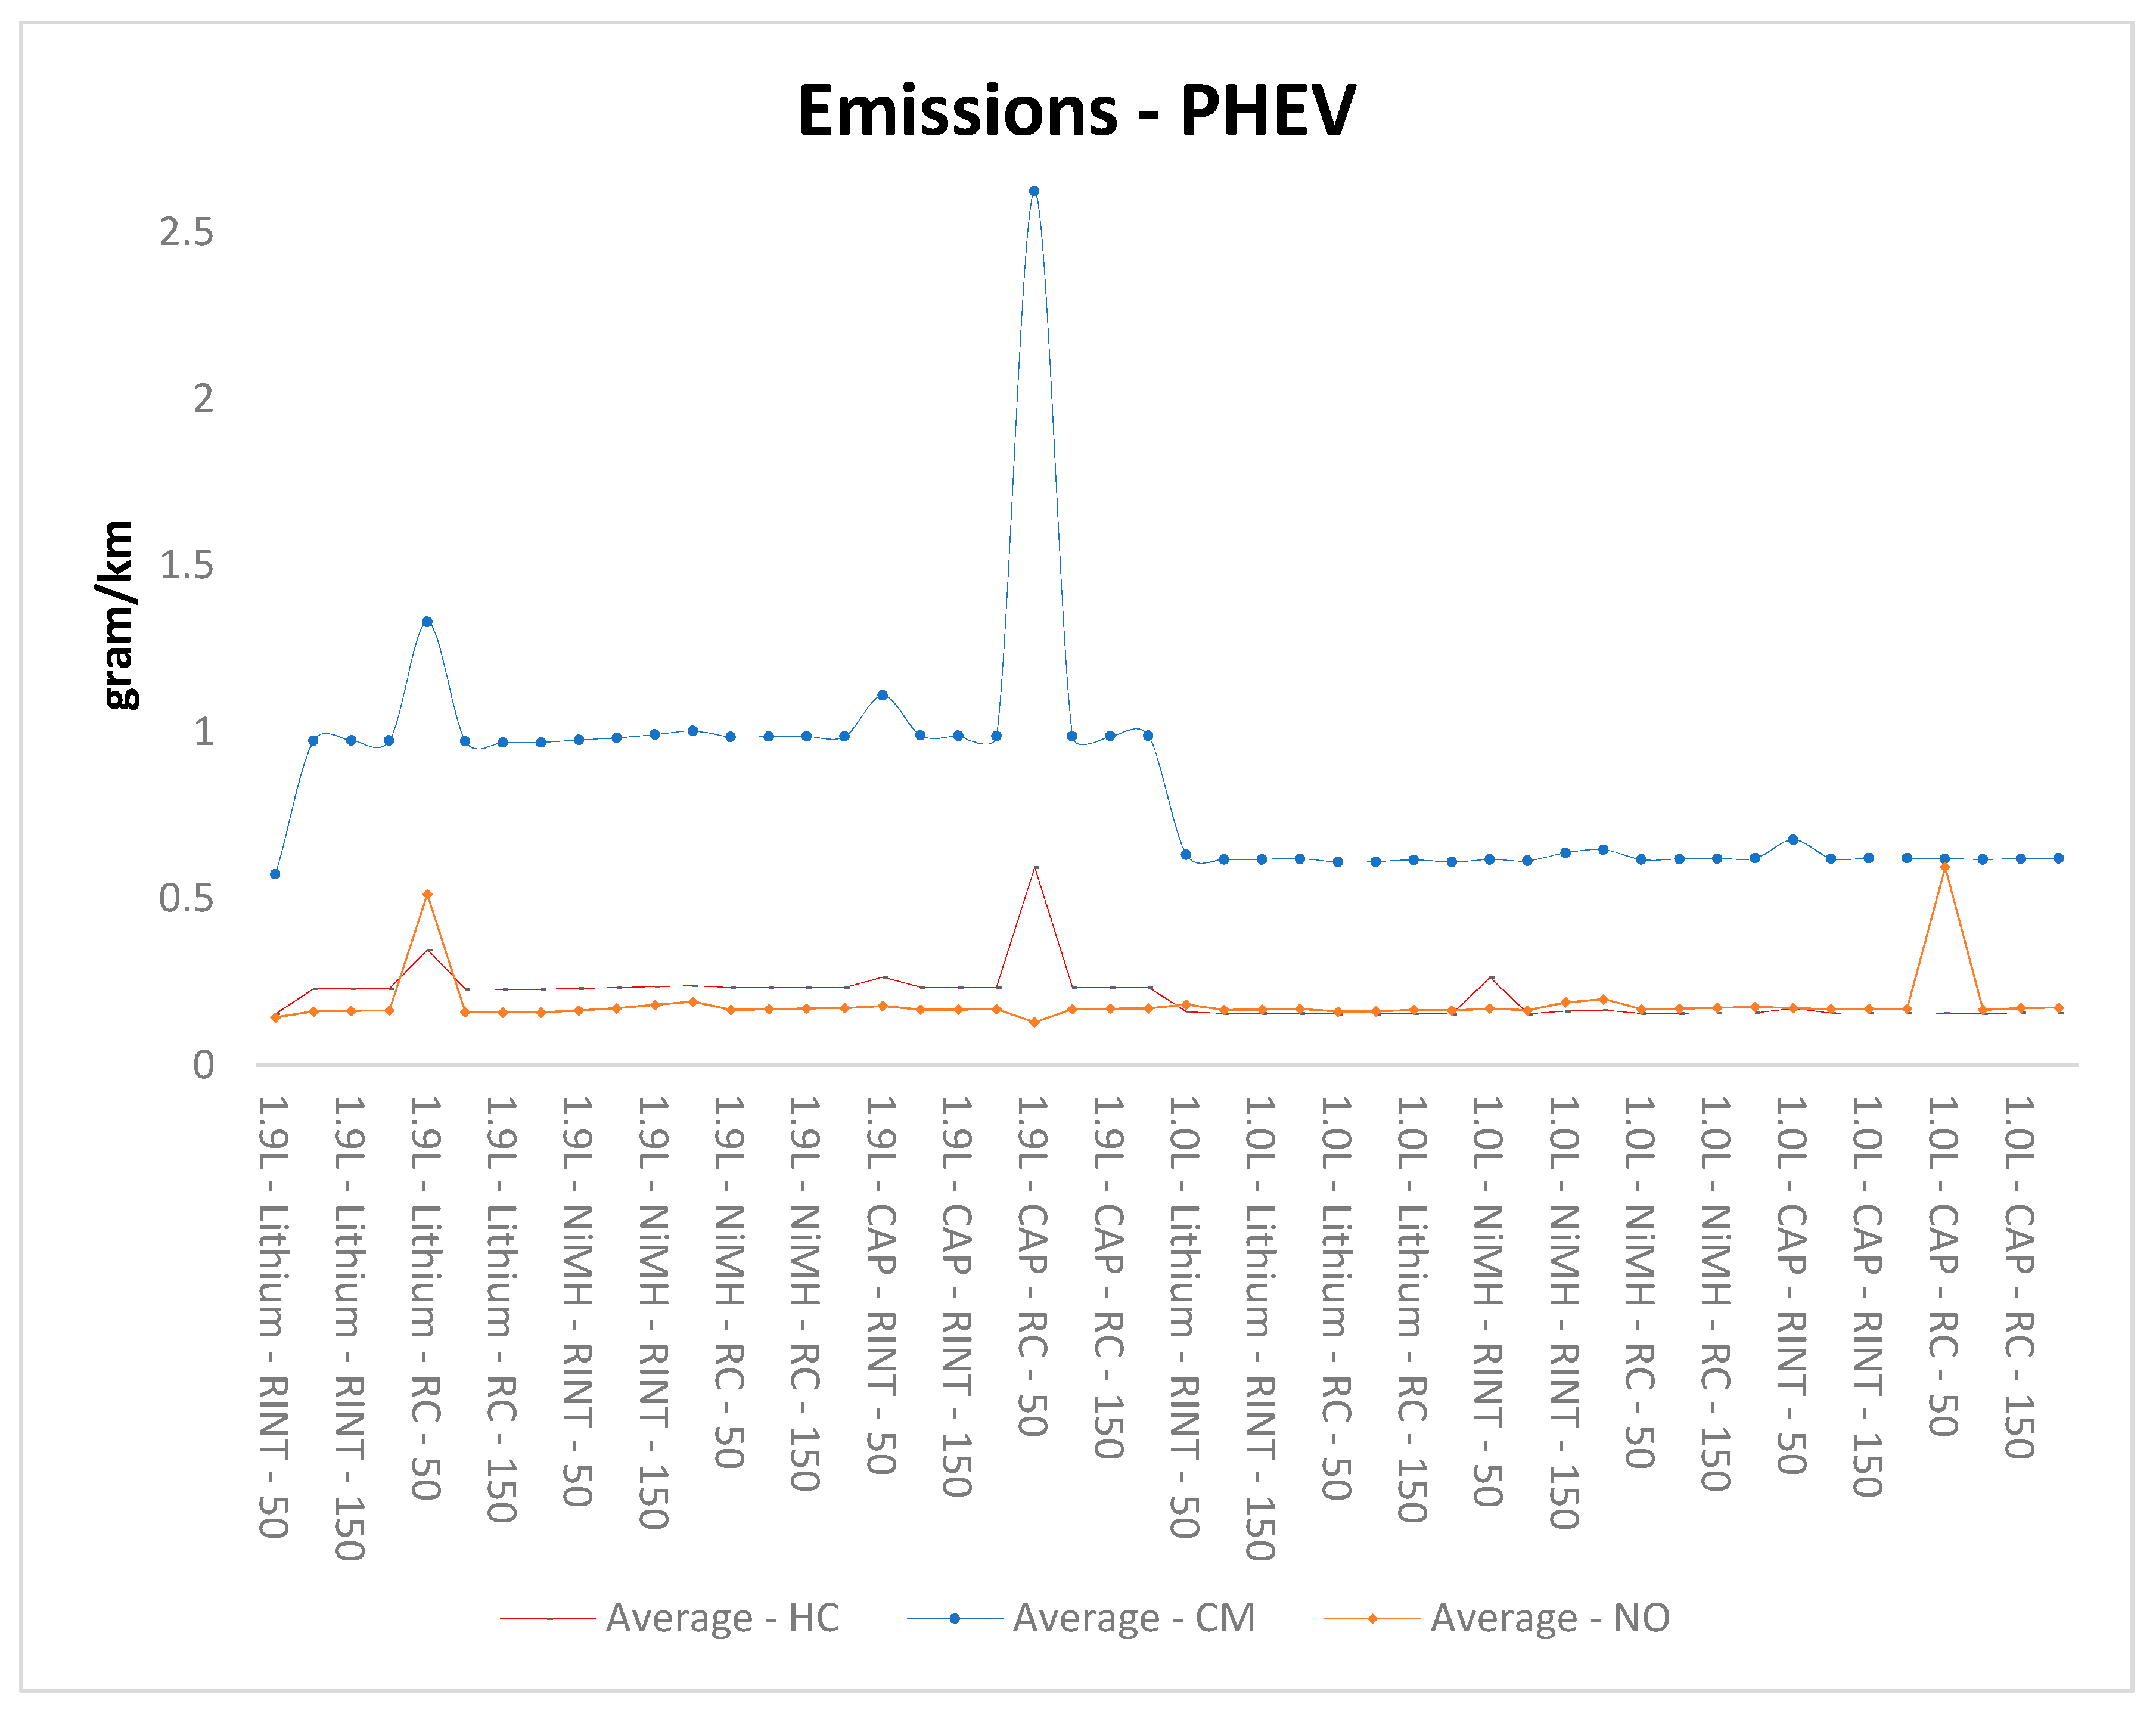
In
Figure 20, the average PHEV emissions have been highlighted. In contrast to the fuel consumption averages seen in the SHEV (
Figure 17), the emissions averages highlight a different scale as the 1.0 L engine emits lower emissions per km compared to the 1.9 L engine. Since the ICE and EM work in conjunction, the output can be modulated to improve the power available versus the power required to propel the vehicle, providing lower emissions. The 1.0 L Lithium 150 Modules RC Battery Model produced the lowest overall emissions with HC, CM, and NO of 0.156, 0.617, and 0.166 g/km, respectively, while the 1.9 L CAP 50 Modules RC Battery Model produced HC, CM, and NO of 0.595, 2.623, and 0.129 g/km, respectively, with lower emissions as compared to the SHEV. The number of modules used in the system becomes insignificant above 50 modules as the results begin to level. However, overall emissions can still depend on many factors, such as the engine configuration and the charging system, which can be further explored to refine the models. In conclusion, the simulation results suggest that while Series HEV configurations tend to offer better fuel economy on average, Parallel configurations exhibit more stability in fuel consumption with fewer modules needed, potentially reducing the vehicle’s carbon footprint.
4.4. Summary of Results
Utilizing Equations (14) and (15), along with the minimum and maximum fuel cost data extracted from
Figure 1,
Table 5 is given to show the fuel cost comparison. Equation (14) calculates the average fuel consumption of a drive cycle as
by summing the driving cycle data, while Equation (15) multiplies this average fuel consumption to determine the average fuel cost per 100 km.
In
Table 5, a clear differentiation in fuel costs is observed, highlighting the variance between the maximum and minimum calculated fuel costs. The SHEV and PHEV demonstrate strong resilience to fuel cost variations. In contrast, ICE-powered vehicles exhibit significant effects from fuel price fluctuations. For the 1.9 L engine category, the ICE manual variant has the lowest cost difference at ZAR 130.77, while the SHEV and PHEV variants show even lower differences at ZAR 84.24 and ZAR 87.57, respectively. For the 1.0 L engine, the ICE manual variant again has the lowest difference at ZAR 102.48, compared to the SHEV and PHEV variants, which have differences of ZAR 47.88 and ZAR 74.25, respectively (fuel costs associated with inland fuel stations for 95 unleaded petrol). This analysis underscores the greater stability of hybrid vehicles in fuel cost variability, particularly the SHEVs, which show the least variation in fuel costs across different price scenarios.
Based on the comparison between the three types of vehicles—the Parallel Hybrid Electric Vehicle (HEV), Series HEV (SHEV), and the traditional Internal Combustion Engine (ICE)—several significant conclusions can be drawn. Both HEV configurations consistently demonstrate enhanced fuel economy and lower emissions in comparison to the conventional ICE vehicle. The Parallel HEV (PHEV) and Series HEV (SHEV) present promising improvements in fuel efficiency, displaying notably reduced average fuel consumption and emissions such as Hydrocarbons (HC), Carbon Monoxide (CO), and Nitrogen Oxide (NO). These findings indicate the potential of HEVs to offer a more environmentally friendly and cost-effective alternative to traditional ICE vehicles.
When comparing the two types of HEVs, the results suggest variations in performance. The Parallel HEV generally showcases marginally improved results in terms of fuel efficiency and emissions reduction compared to the Series HEV. The Parallel configuration indicates more favorable outcomes in specific performance metrics, such as fuel consumption for distance traveled, emissions content, and speed parameters. The PHEV configuration offers improved outcomes in various parameters, showcasing lower fuel consumption and emissions, indicating its potential for better performance than the Series HEV.
Finally, both types of HEVs, particularly the Parallel HEVs, display a clear advantage over the traditional ICE in terms of fuel economy and significant emissions reduction. The Parallel HEV configuration generally tends to offer slightly better outcomes than the Series HEV. Within the HEV category, the PHEV configuration demonstrates notably enhanced results. These findings underline the potential of HEVs, particularly the Parallel Hybrid variants, as a more efficient and environmentally friendly alternative to conventional ICE vehicles.
5. Conclusions
HEVs significantly improve fuel efficiency and reduce vehicle emissions compared to traditional ICE vehicles. Levels of Hydrocarbons (HC), Carbon Monoxide (CO), Nitric Oxide (NO), and particulate matter expelled during driving cycles are substantially lower in HEVs than in ICE vehicles. The simulation results demonstrate that HEVs significantly enhance fuel efficiency and reduce emissions compared to traditional ICE vehicles. For instance, the 1.9 L Automatic ICE variant exhibited the highest fuel consumption at 44 L per 100 km, while the 1.0 L Manual ICE variant was the most efficient at 30.3 L per 100 km. Comparatively, the lowest fuel consumption among HEVs was achieved by the Series HEV with a 1.0 L NiMH battery and 200 modules at 6.65 L per 100 km. Emission levels followed a similar trend, with the 1.9 L Automatic ICE showing higher emissions (HC: 0.575 g/km, CM: 2.246 g/km, NO: 0.303 g/km) compared to the 1.0 L Manual ICE (HC: 0.378 g/km, CM: 1.466 g/km, NO: 0.22 g/km). HEVs displayed lower emissions, with the Series HEV 1.9 L Lithium 200 Modules model producing the lowest emissions overall (HC: 0.220 g/km, CM: 0.877 g/km, NO: 0.324 g/km). Between the HEV configurations, the Parallel HEV generally demonstrated better fuel efficiency and lower emissions than the Series HEV. The Parallel HEV with a 1.0 L Lithium 150 Modules RC Battery Model recorded the lowest emissions (HC: 0.156 g/km, CM: 0.617 g/km, NO: 0.166 g/km), highlighting its superior performance. Additionally, the Parallel configuration required fewer battery modules to achieve optimal performance, thus reducing vehicle weight and overall carbon footprint.
In conclusion, this research enhances the body of knowledge by conducting a comprehensive performance evaluation of various EV configurations, providing valuable insights for EV users and manufacturers. This understanding is essential for improving EV performance, thereby fostering higher adoption rates both in South Africa and globally.
Future research should explore the integration of Series–Parallel HEV configurations to leverage the benefits of both systems. Additionally, advancements in battery technology, such as Lithium–Sulfur or solid-state batteries, should be considered to enhance energy density and lifespan. Expanding studies to include various vehicle types beyond SUVs and conducting comprehensive life cycle assessments will further our understanding of HEV benefits and sustainability.


