Article

Methodology for Testing Selected Parameters of Low-Current Vacuum Electric Arc

by
Michał Lech
1,*,
Paweł Węgierek
1,
Czesław Kozak
1 and
Przemysław Pachulski
2
1
Department of Electrical Devices and High Voltage Technology, Faculty of Electrical Engineering and Computer Science, Lublin University of Technology, Nadbystrzycka 38A, 20-618 Lublin, Poland
2
Eaton Electric Sp. z o.o., Galaktyczna 30, 80-299 Gdansk, Poland
*
Author to whom correspondence should be addressed.
Energies 2024, 17(20), 5101; https://doi.org/10.3390/en17205101
Submission received: 2 August 2024 / Revised: 6 October 2024 / Accepted: 9 October 2024 / Published: 14 October 2024
(This article belongs to the Special Issue Thermo-Mechanical and Electrical Measurements for Energy Systems)

Abstract

:
This article presents the author’s methodology for testing selected parameters of a low-current vacuum arc, implemented using an innovative test stand based on a vacuum discharge chamber with a contact system mounted inside. In order to verify the validity of the adopted research methodology, as well as the correctness of the operation of the developed laboratory bench, measurements and calculations were made, among other things, of the energy and burning time of the vacuum arc, depending on selected factors, such as pressure and the delay time of the contact opening, calculated from the “passage through zero” of the sinusoid of the current flowing through the system. The tests were performed at 230 V and a current of 5 A for two pressure values: p1 = 1.00 × 10⁵ Pa (atmospheric pressure) and p2 = 4.00 × 10⁻³ Pa (high vacuum environment). It was found that the vacuum insulation technique allows a significant reduction in the value of the arc energy and the burning time of the arc. It was also observed that in the case of a high vacuum environment, the ignition of the vacuum arc occurs after a time equal to about 3 ms from the “passage through zero” of the current flowing through the system. Below this value, the phenomenon did not occur. The results obtained provide an opportunity for the design and manufacturing of vacuum switchgear, where there is the prospect of reducing the negative effects associated with the arc burning process in the contact gap.

1. Introduction

The electric arc has been defined in many different ways so far. One definition is that it is a spontaneous discharge in a gas, occurring when certain values of voltage and current are exceeded, which depend on the electrode material [1]. These values are summarized in Table 1.
The formation of the arcing phenomenon can occur as a result of electrical breakdown, the melting and vaporization of the fusible element, the separation of the switch contacts, or the bridging of the gap by the arc plasma.
The properties of the arc plasma determine the features between its components in space. A plasma analysis can be carried out on a microscopic and macroscopic scale [2,3,4,5]. In a vacuum environment, the current carriers are electrons and positive metal ions, originating from metal pairs. Their sources are the so-called cathode spots, i.e., selected spots located on the surface of the cathode. Unlike an electric arc occurring in high-pressure environments, in a vacuum arc, the contribution of ionized gas molecules is negligible. As the average contact gap in medium-voltage vacuum interrupters is about 10 mm, for pressures in the range of 10−2 ÷ 10−5 Pa, the average free path of the particles is definitely larger than this distance [6]. In this case, even with a few cathode spots, the movement of current carriers in the vacuum arc plasma occurring in the vacuum interrupter mounted in the switching apparatus can be considered collisionless. The electric arc occurring under such conditions is called a diffusive vacuum arc.
Figure 1 shows the voltage distribution for a high-pressure arc and a vacuum arc. According to the figure below, the arc discharge is divided into three zones [2]: the cathode zone (I + II), the near-anode zone (IV + V) and the arc column (III). In the case of the cathode zone, it is possible to distinguish between the cathode space charge zone (I), which is the positive charge stored in the immediate vicinity of the cathode, and the cathode plasma zone (II). Similarly, in the vicinity of the anode, we can distinguish a zone of near-cathode negative space charge (V) and a zone of near-anode plasma (IV).
In the case of a high-pressure arc, its properties strongly depend on the arc length. In a short arc, the voltage mainly consists of the pre-electrode voltage drop, while in a short arc, the main component is the voltage drop across the arc column.
The largest voltage drop in a vacuum diffusion arc occurs in the cathode spot region. In the vicinity of the cathode, a characteristic increase in the positive potential can also be seen due to the rapid exit of electrons from this zone, which in turn results in an excess of positive charge. The lack of collisions between particles is directly related to the lack of energy loss and, consequently, the low voltage drops further down the contact gap.
The negative space charge at the anode is neutralized by positive ions reaching the anode, so the voltage drop at the anode has a relatively insignificant value. The total value of the voltage drop in a diffusion vacuum arc is mainly composed of the anode voltage drop. Compared with a high-pressure arc, the extension of a diffusion vacuum arc will not significantly affect its total voltage drop.
When the vacuum arc current increases, its voltage drop also increases. This is related to the increased concentration of charges and the frequency of their collisions. In this situation, the vacuum arc to some extent takes on the characteristics of a high-pressure arc (Figure 2).
The ions, which lose a significant part of their initial kinetic energy through collisions, are decelerated by an electric field directed opposite to their motion and do not reach the anode in such large numbers as in the case of a diffusion arc. Near the anode, a layer of negative space charge is formed, which is associated with the electrons that have reached that location. Consequently, there is a near-anode voltage drop and an increase in the energy supplied to the anode. Moreover, due to the high-current arc and the interaction of electrodynamic forces between current carriers moving in the same direction, the arc column becomes constricted. The result of this phenomenon can be, among other things, the heating of the anode surface. With this type of arc, called a constricted or concentrated vacuum arc, the anode also becomes a source of metal vapors, which are emitted through the anode spots.
In summary, the characteristic feature of a vacuum switching arc is the dependence of the electrode phenomena and the phenomena in the arc column on the value of the arc current. Accordingly, two types of vacuum arcs can be distinguished: diffusion arcs and constricted (concentrated) arcs. When comparing high-pressure arcs and vacuum arcs with each other, the following features should be taken into account:
  • the source and type of current carriers;
  • concentration and free path of molecules;
  • arc voltage;
  • the dependence of the form of the discharge on the value of the arc current;
  • thermodynamic equilibrium.
In a vacuum arc, the electric charge carriers are metal pairs coming from either the cathode or the anode. As a result of the very low probability of particle collisions in a vacuum, it is assumed that there is no volumetric ionization of the gas. In contrast to this situation, in a high-pressure arc, ionized gas molecules are the main source of current carriers.
The concentration and free path of particles in a vacuum arc and a high-pressure arc differ significantly. Due to the much higher concentration of particles in the high-pressure arc, the free path is much smaller. Analyzing the values of voltage drops in the vacuum arc, it should be noted that, compared to the high-pressure arc, the voltage drop of the vacuum arc is practically not dependent on the arc length and has a constant value of about 20–25 V. For higher values of the vacuum arc current, these values may change. In a high-pressure arc, the voltage drop values are significantly affected by the arc length. It should also be added that the vacuum arc is characterized by different forms depending on the value of its current. In the case of a high-pressure arc, such regularities do not occur.
Analyzing the current development trends of the research work described in this article, three main research trends on this topic have been identified:
  • analysis of vacuum interrupter contact surfaces during the arc burning process [7,8];
  • studies of the parameters of the electric arc to reduce the negative effects of this phenomenon [9,10];
  • analysis of late breakdowns occurring after current interruption in vacuum interrupters [11].
Much of the literature in recent years deals with the analysis of contact surfaces, mainly with axial magnetic fields, but also with measurements of arc parameters to estimate the life of vacuum interrupters [12,13,14,15,16,17,18,19,20,21,22,23,24,25,26]. Recent research is also related to the application of vacuum switches in HVDC networks [27,28].
Speaking of arc discharges, at this point it is also necessary to highlight the work of groups led by M. Benilov, whose works mainly concerned the modeling of arc plasma at atmospheric pressure [29,30,31], high pressure [32,33] and low pressure [34,35,36,37]. In turn, the works of M. Baeva and A. Saifutdinov presented experimental and theoretical studies of arc processes in a switching apparatus [38,39], as well as in argon-filled chambers [40,41,42]. An interesting paper is that of [43], in which the author described the features of the transition from a glow discharge to an arc discharge, obtaining the classical relationship between voltage and current density, and analyzed the distributions of the different heating mechanisms of the cathode and anode surfaces and their dependence on the discharge current density.
Based on the analysis of a number of literature items published in recent years, it should be concluded that the research topic undertaken by the authors of this paper is in line with current research trends and it is reasonable to conduct research in this area.

2. Test Stand and Research Object

The test stand used in the research described in this article is based on a so-called demountable vacuum chamber, the main component of which is a discharge chamber with a contact system mounted inside, as shown in Figure 3 [6,44,45]. The structure of the discharge chamber was designed to allow free access to its interior, for example, to change the type of contacts mounted. The bench makes it possible to measure arc parameters during switching operations (open–close). This requires an electromagnetic actuator located on a moving platform, which is controlled via a dedicated controller. The contact opening time is about 35 ms, while the contact gap in the open state of the discharge chamber is 9 mm. Accordingly, the speed of contact opening during testing was about 0.26 m/s, taking into account the time of the mechanical system that is part of the bench. Based on the measurements carried out, the repeatability of the results obtained was observed.
The test object in the described laboratory bench is a contact system terminated by overlays made of W70Cu30 material. Figure 4 shows a photo of the contact pad surface taken with an optical microscope, while Figure 5 shows photos taken with an electron microscope.
Analyzing the presented optical microscope images, it should be noted that the surface of the test object consists of copper (Cu) grains with sizes in the range of 20–30 µm, distributed in a matrix of tungsten (W). The wavelength mapping of the surface with M tungsten and K copper lines confirmed that we are dealing with copper grains surrounded by tungsten, with irregular shapes. For both the optical and electron microscope, the magnification value was the same, so the shape is qualitatively similar for both microscopes.
In order to study the parameters of the arc as a function of the pressure inside the discharge chamber, a vacuum set-up was used, consisting of two pumps: an oil-immersed, rotary pre-pump and a turbomolecular pump with magnetic impeller suspension, together with an integrated controller. Pressure measurement is carried out using two vacuum gauges connected to a pressure regulator, allowing the measured values to be read in real time. The vacuum set has been connected to the discharge chamber by a special pumping channel made of insulating material, thus ensuring the safe operation of the sensitive vacuum apparatus.
A necessary component of the laboratory bench described above is a delay time generator, cooperating with the “zero crossing” detector, designed to introduce a fixed delay time between the input trigger signal and the output signals. This generator was designed and manufactured to trigger the opening of contacts in the discharge chamber after a certain preset time from the “passage through zero” of the sinusoidal current flowing through the contact system under test. Delay times are set in the range from 0.01 to 99.99 ms. The system allows for the selection of one of three triggering modes: rising edge triggering, falling edge triggering, and both of the previously mentioned edges.
The following apparatus was used to record and measure switching parameters related to arc phenomena occurring in the discharge chamber:
  • Oscilloscope with a set of measuring probes, which makes it possible to measure the current and voltage of the electric arc burning between contacts during switching operations;
  • a system based on a photodiode with a wavelength in the 420–675 nm range and a viewing angle of 100°, which was designed and then fabricated to record the burning time of an electric arc between contacts. A schematic of the electronic circuit allowing the signal to be read from the photodiode is shown in Figure 6, while the electrical parameters of the circuit components are shown in Table 2.
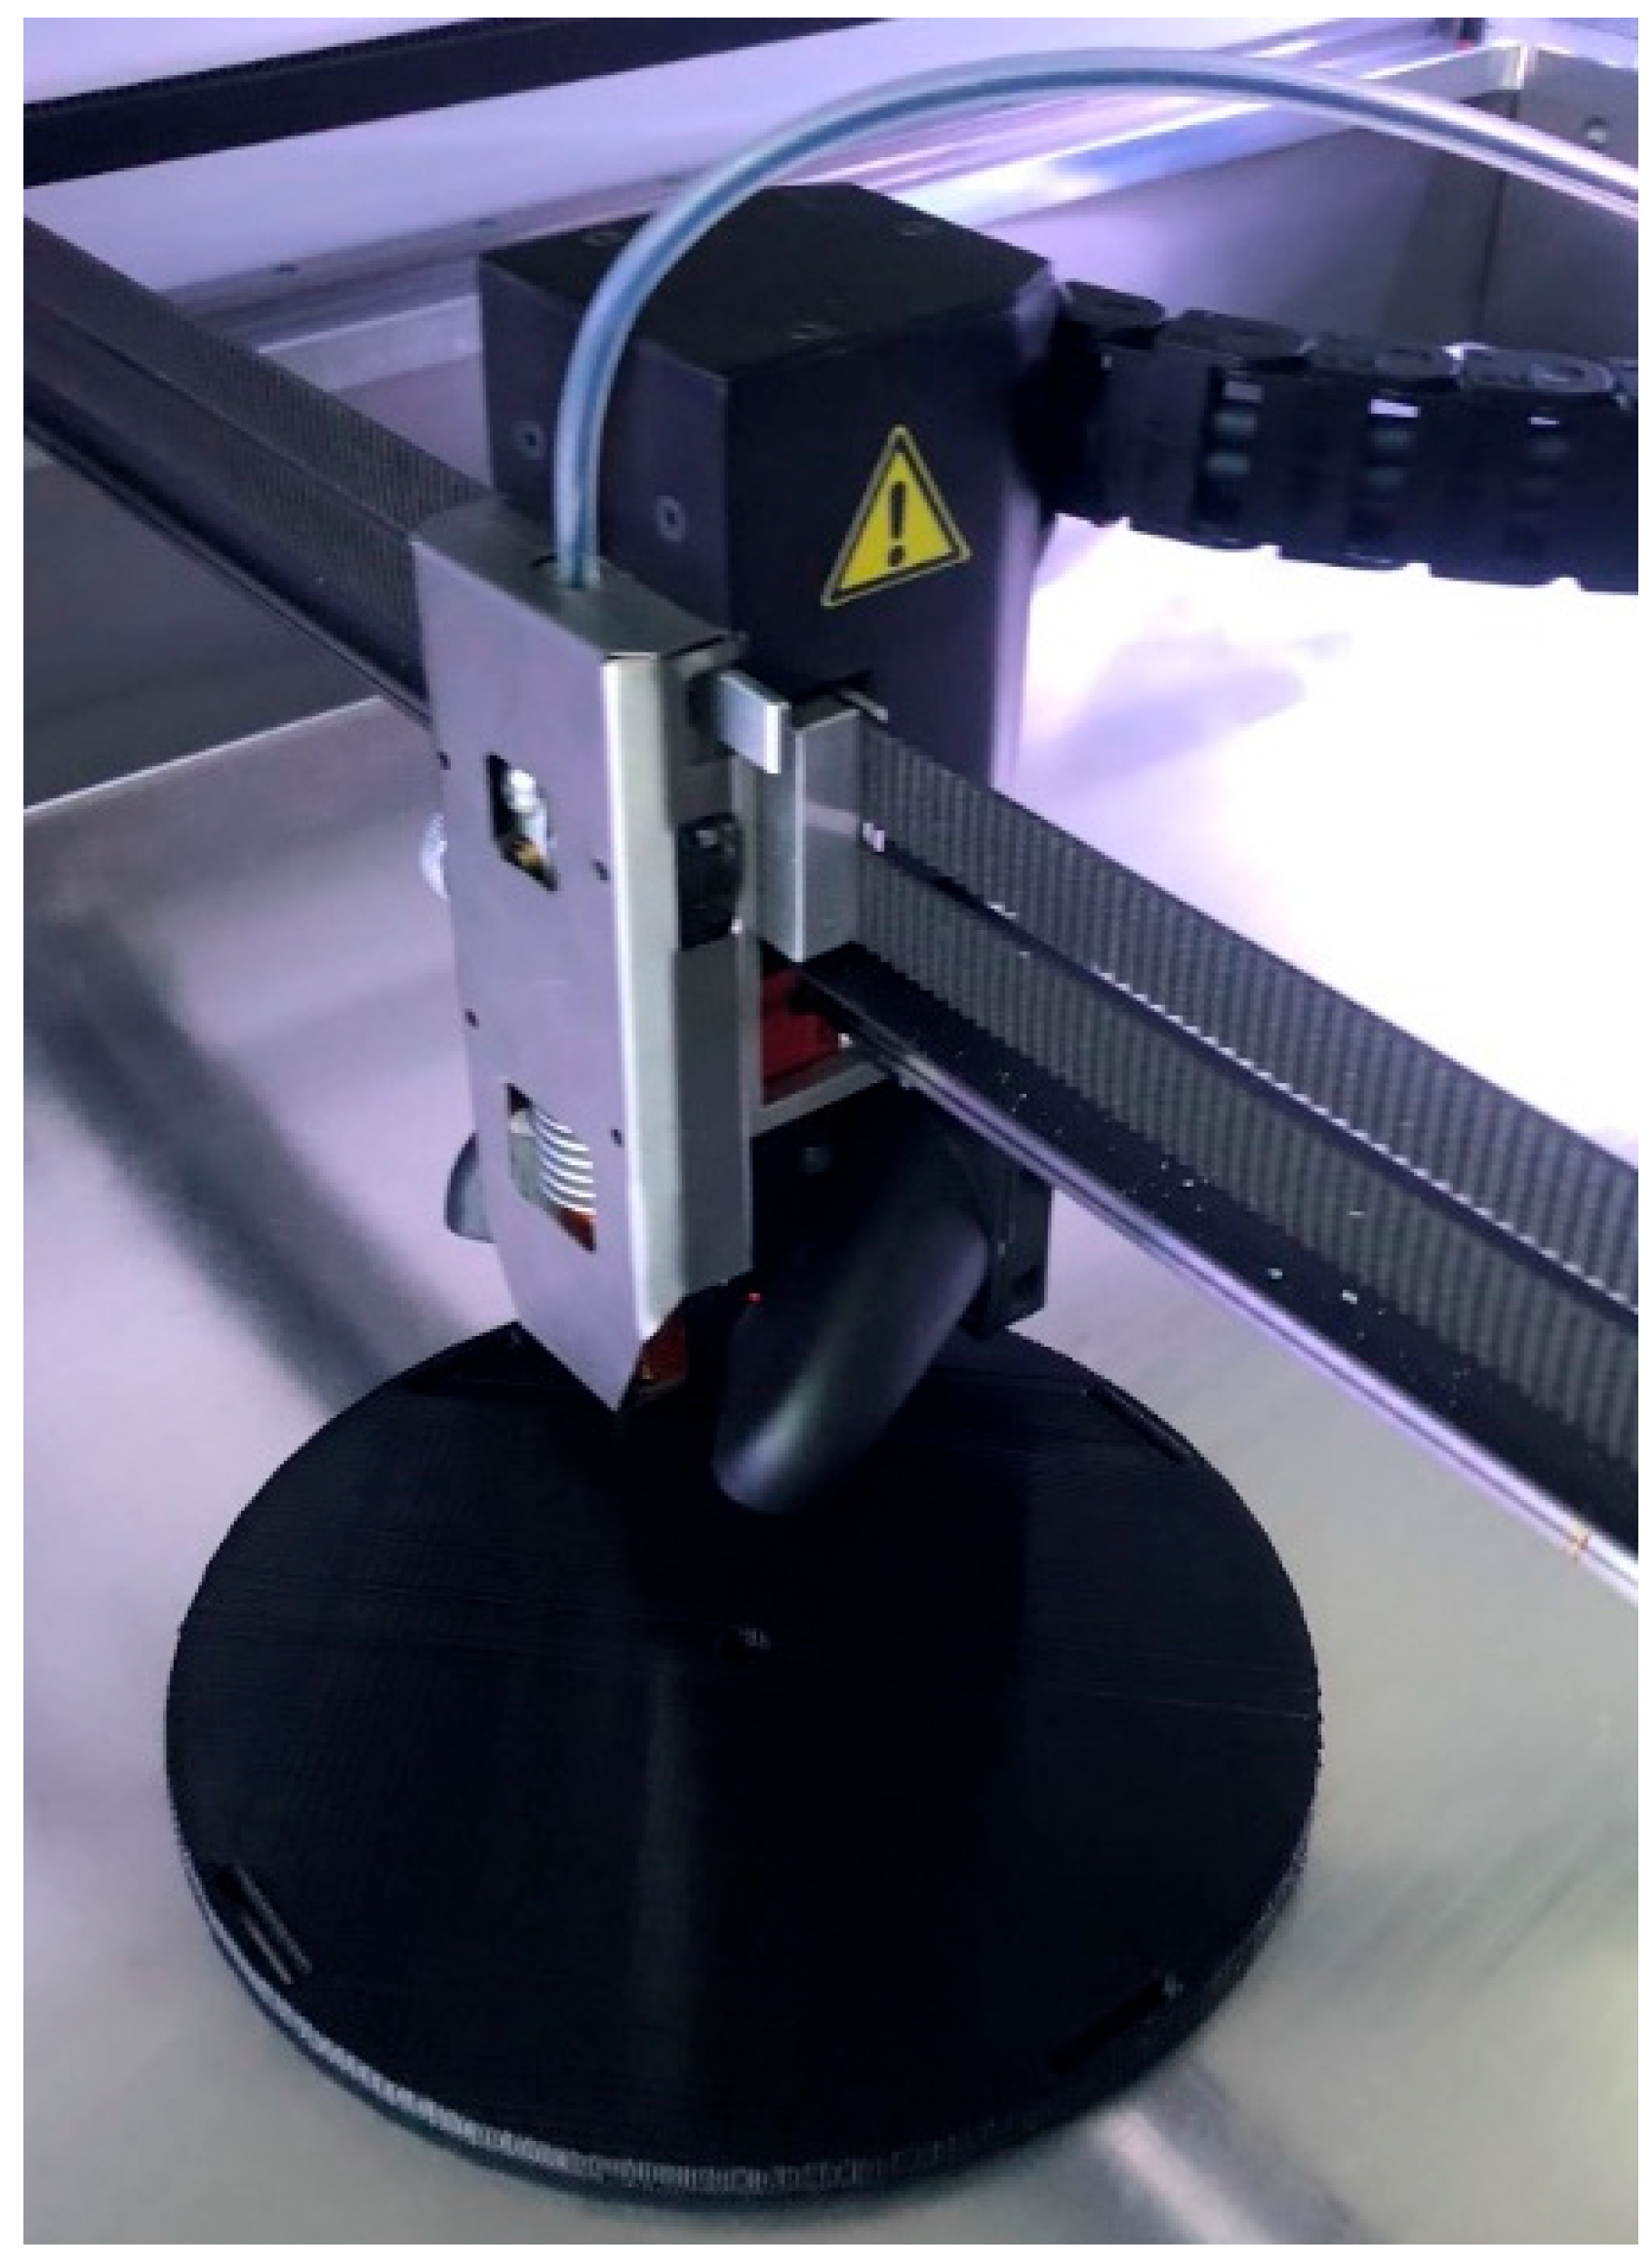
In order to mount the photodiode in the bench, a holder was designed and fabricated using 3D printing to hold the photodiode in place of the sight glass. Figure 7 shows the printing process for this component.
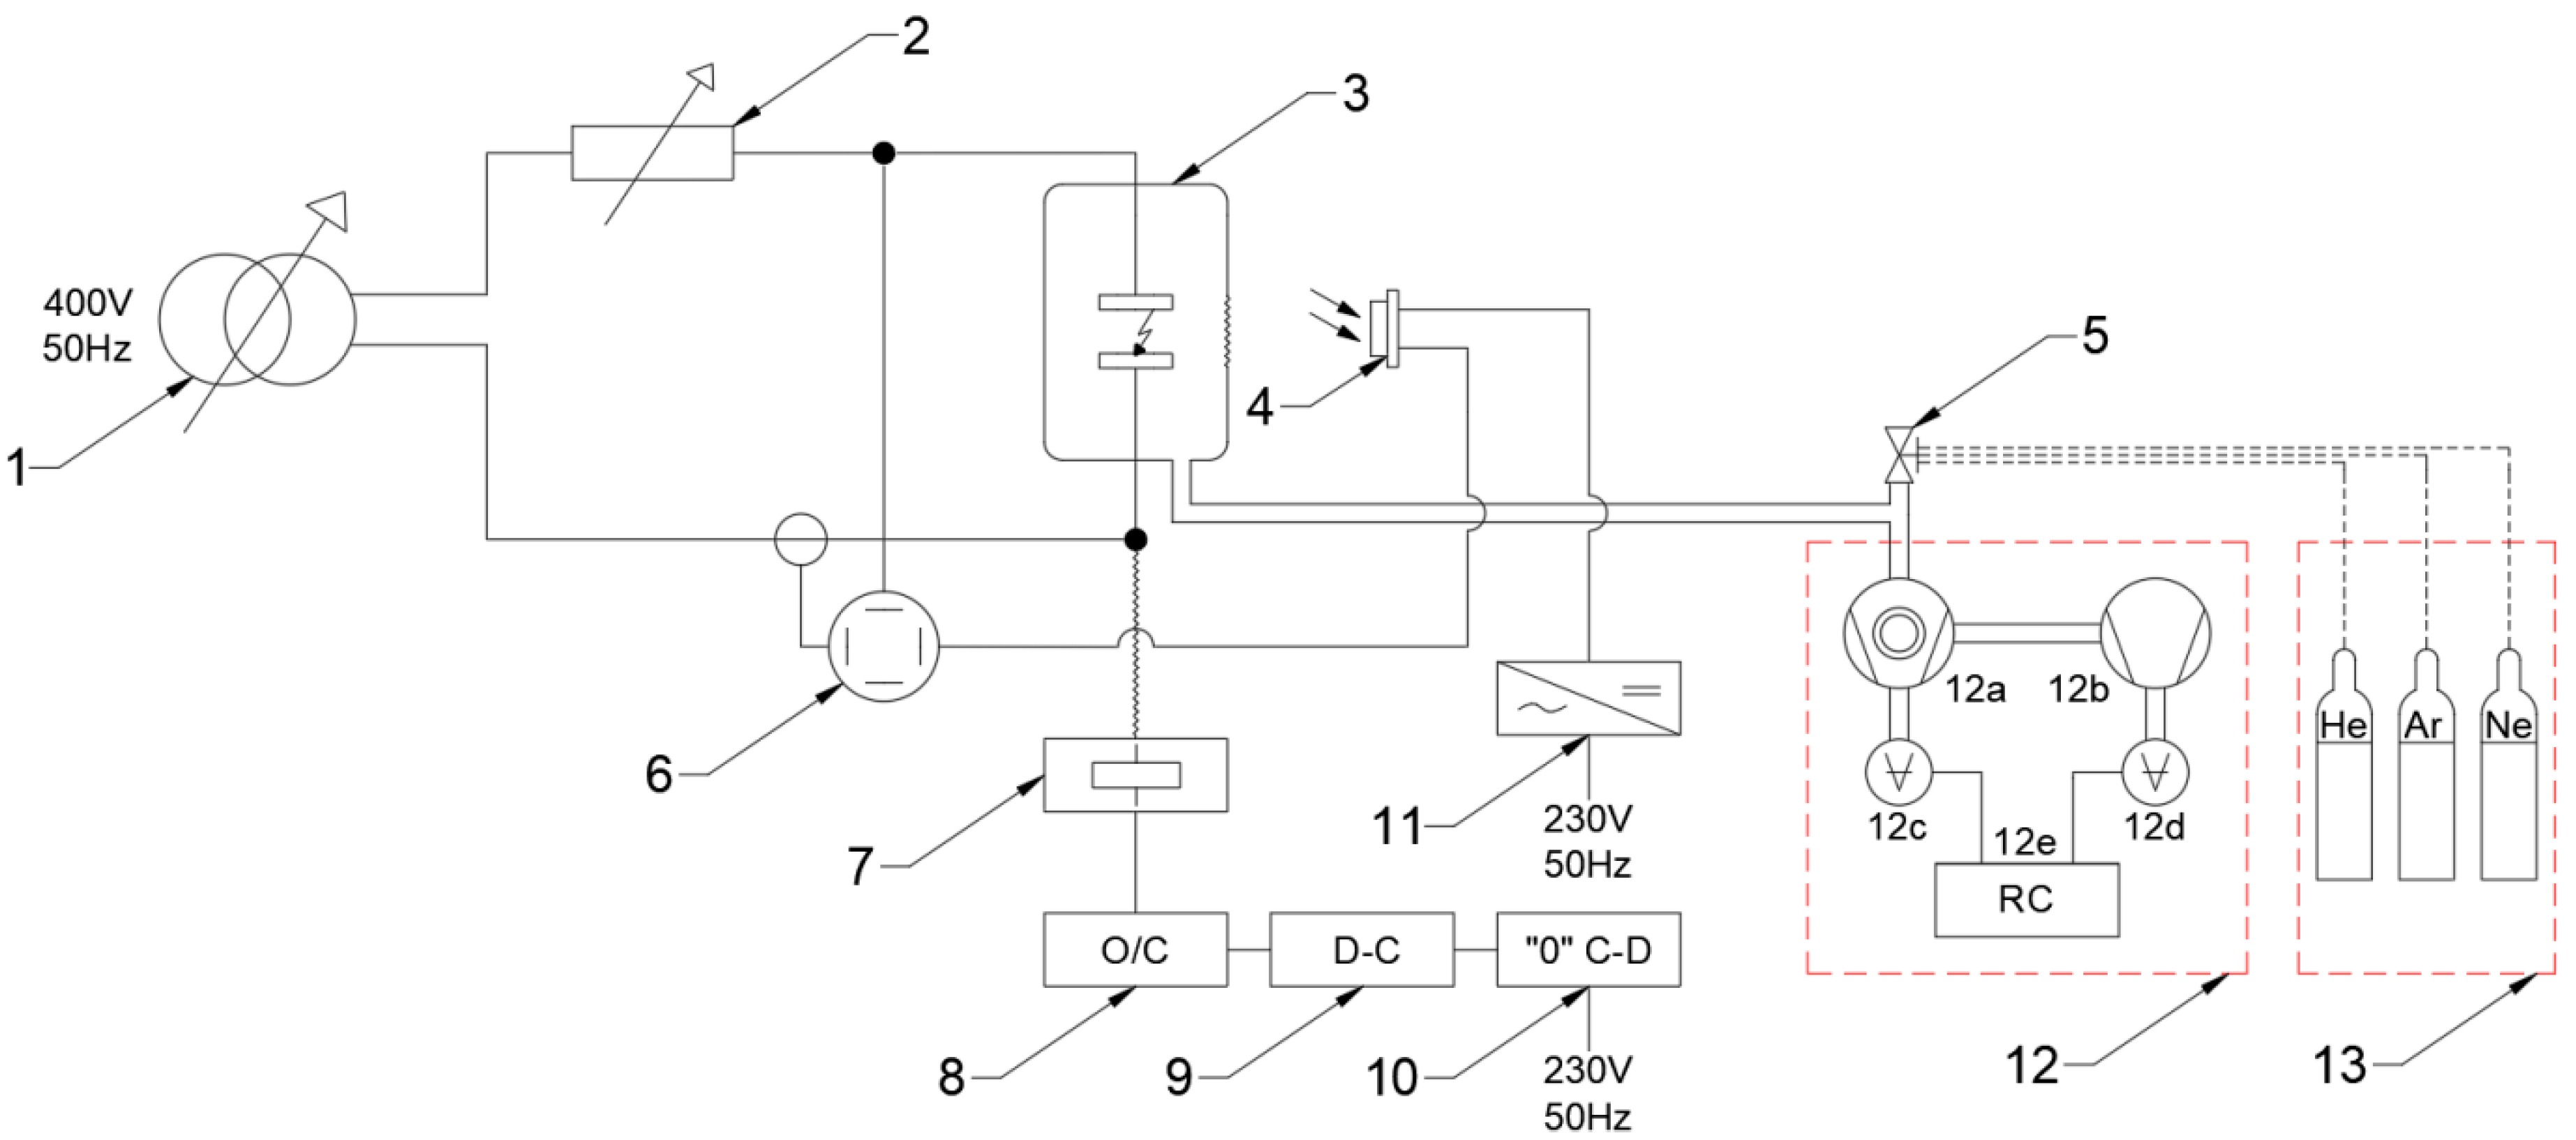
For parameter tests related to switching operations, the power supply system consists of a single-phase autotransformer that directly supplies the discharge chamber under testing. The system’s load, in turn, is an electronic load with a rated power of 3.6 kW, with a voltage regulation range from 50 V to 350 V, a long-term current of up to 36 A, and a peak current of up to 108 A. A schematic of the laboratory bench used in the tests described in this article is shown in Figure 8, while Figure 9 and Figure 10 show an actual view of the complete laboratory bench.

3. Research Methodology

The laboratory work carried out consisted of measurements and calculations of selected parameters of the electric arc, depending on the pressure inside the discharge chamber and the contact opening delay time. The following were measured and calculated:
  • arc energy Ea;
  • arc burning time ta.
The first step in this type of research was to connect the test system according to the schematic shown in Figure 8. Next, the test object—a dedicated contact system—was mounted inside the discharge chamber. Subsequently, the vacuum set-up was activated in order to obtain the appropriate pressure value inside the discharge chamber. Then, using a regulated autotransformer and an electronic load balancer, the power and load parameters of the system were determined, primarily the current, voltage, and the nature of the load. Using a delay timer, the delay time of the opening of the chamber contacts td, calculated from the “passage through zero” of the sinusoid of the current flowing through the contact system, was determined. Carrying out the measurement process consisted of performing the operation of opening the contacts in the chamber and recording the parameters of the electric arc burning between the contacts.
With the support of an oscilloscope, the quantities were measured, allowing for calculations, using the appropriate mathematical functions, of the value of the energy of the electric arc. To calculate it, the following mathematical relationship was used:
E a = t 1 t 2 U a · I a   d t  
where Ea—arc energy, Ua—arc voltage, Ia—current flowing through the contacts of the vacuum chamber, t1—arc ignition time, and t2—arc extinction time.
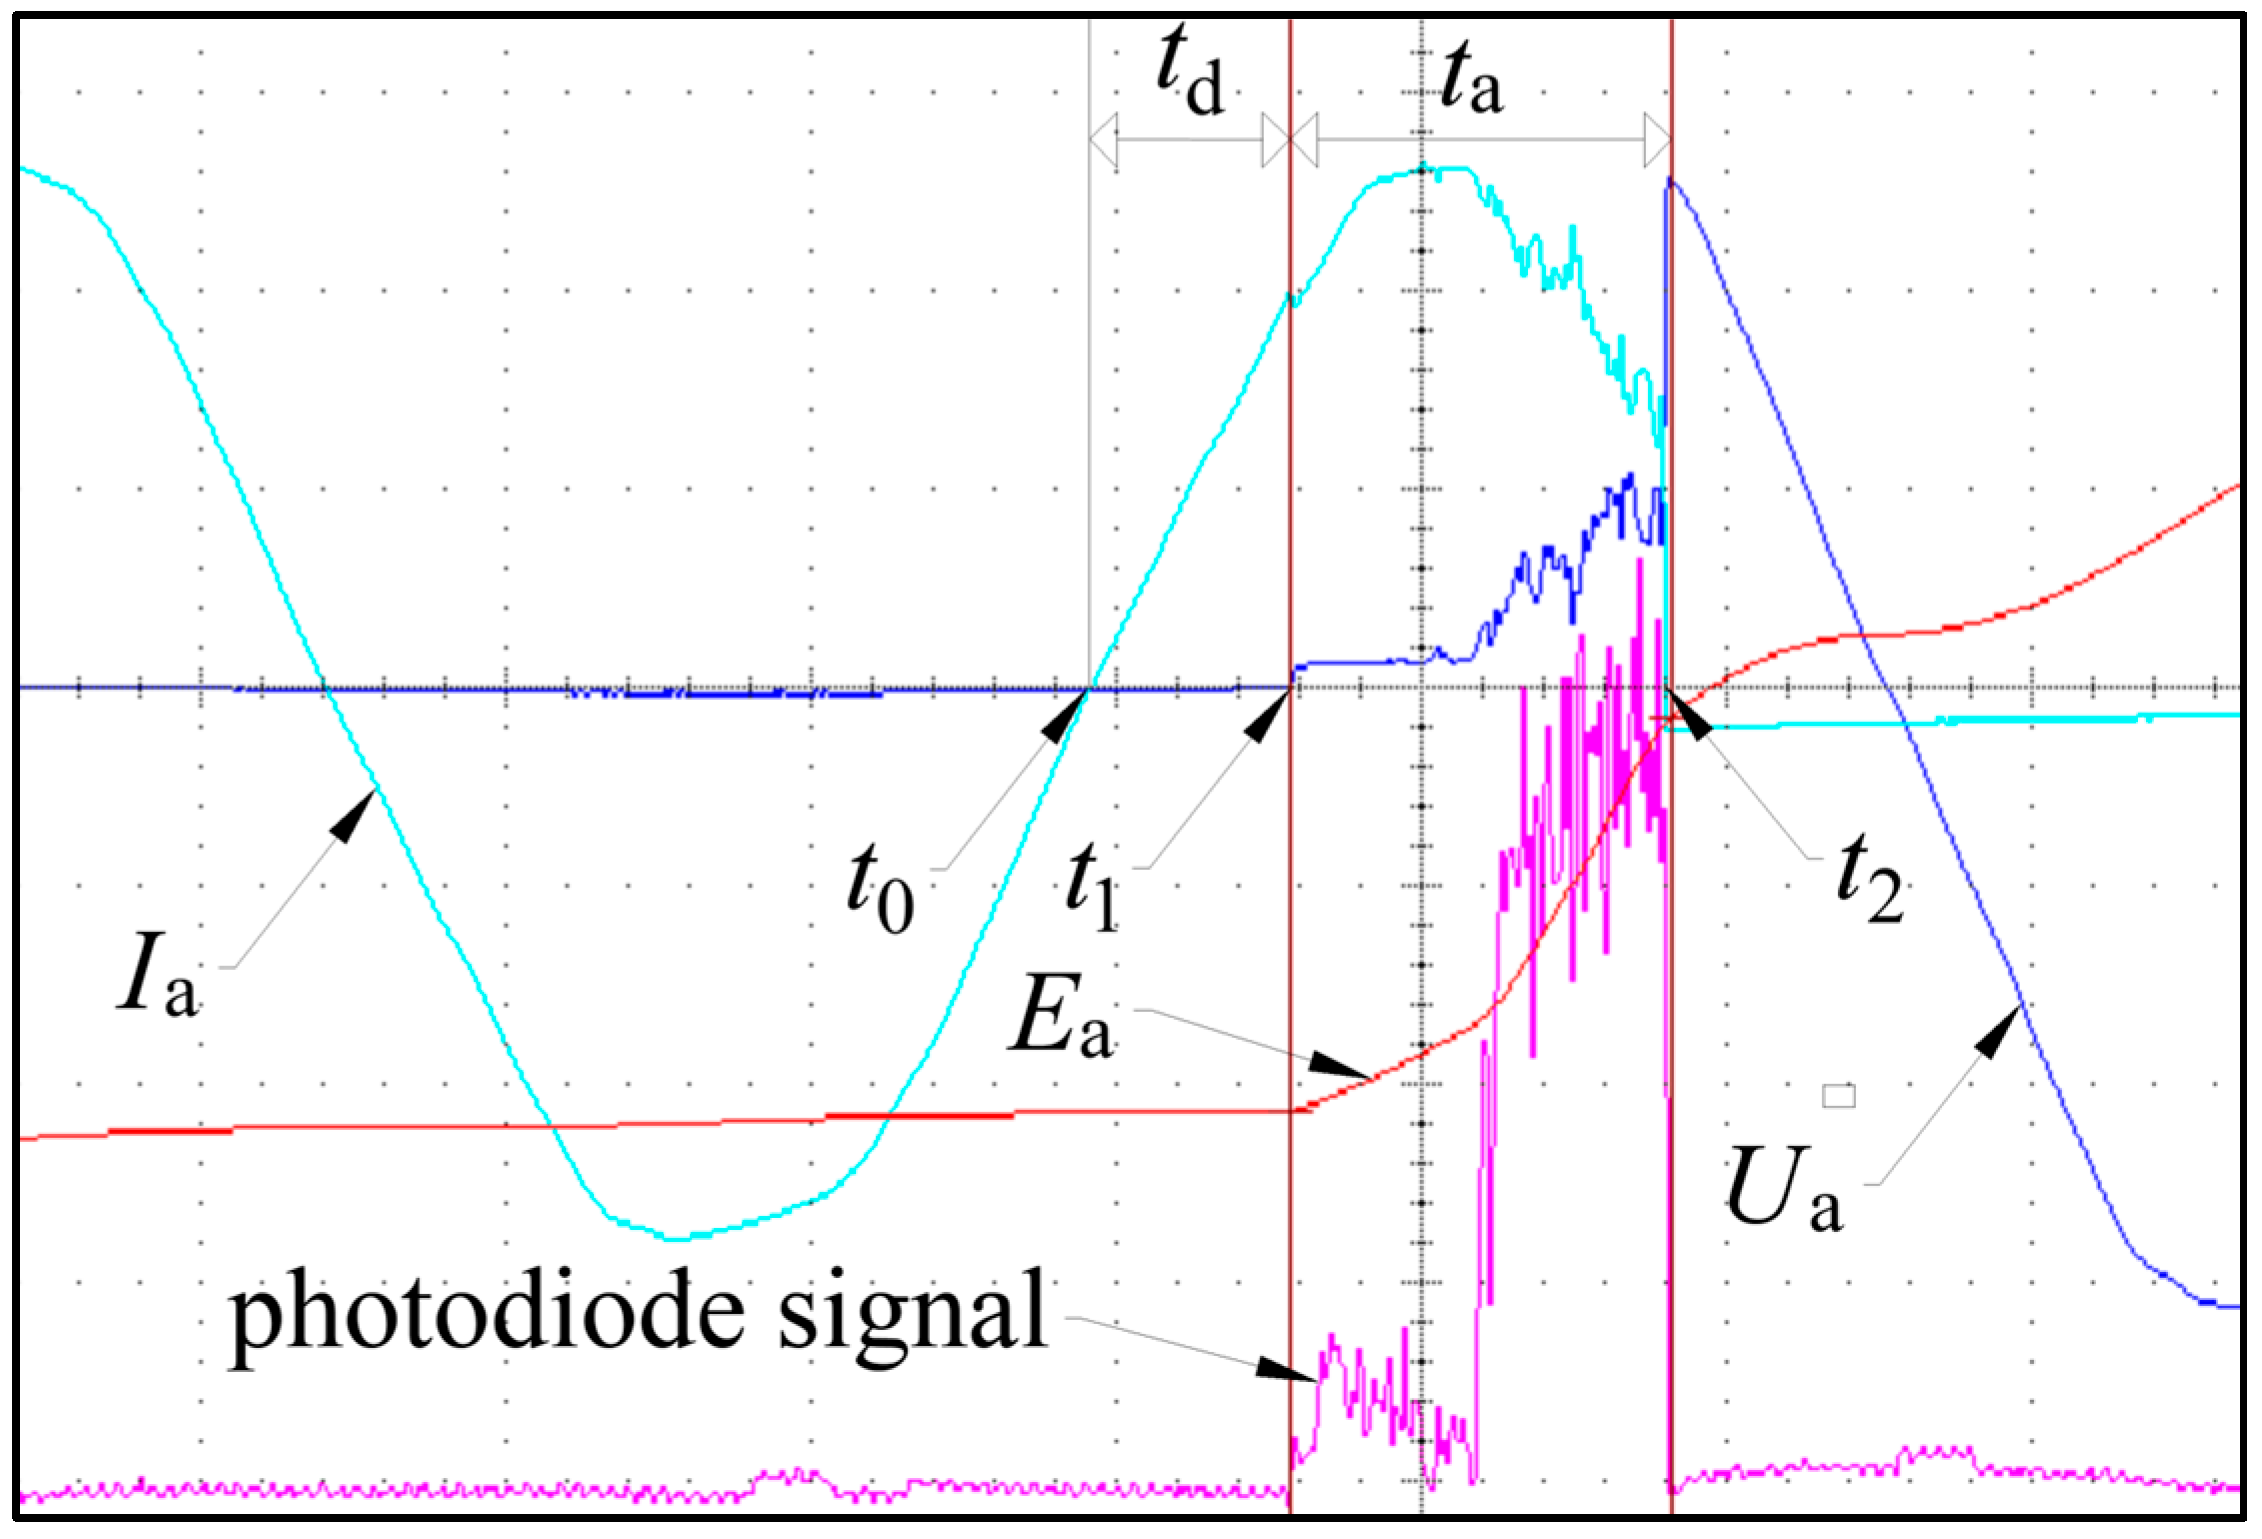
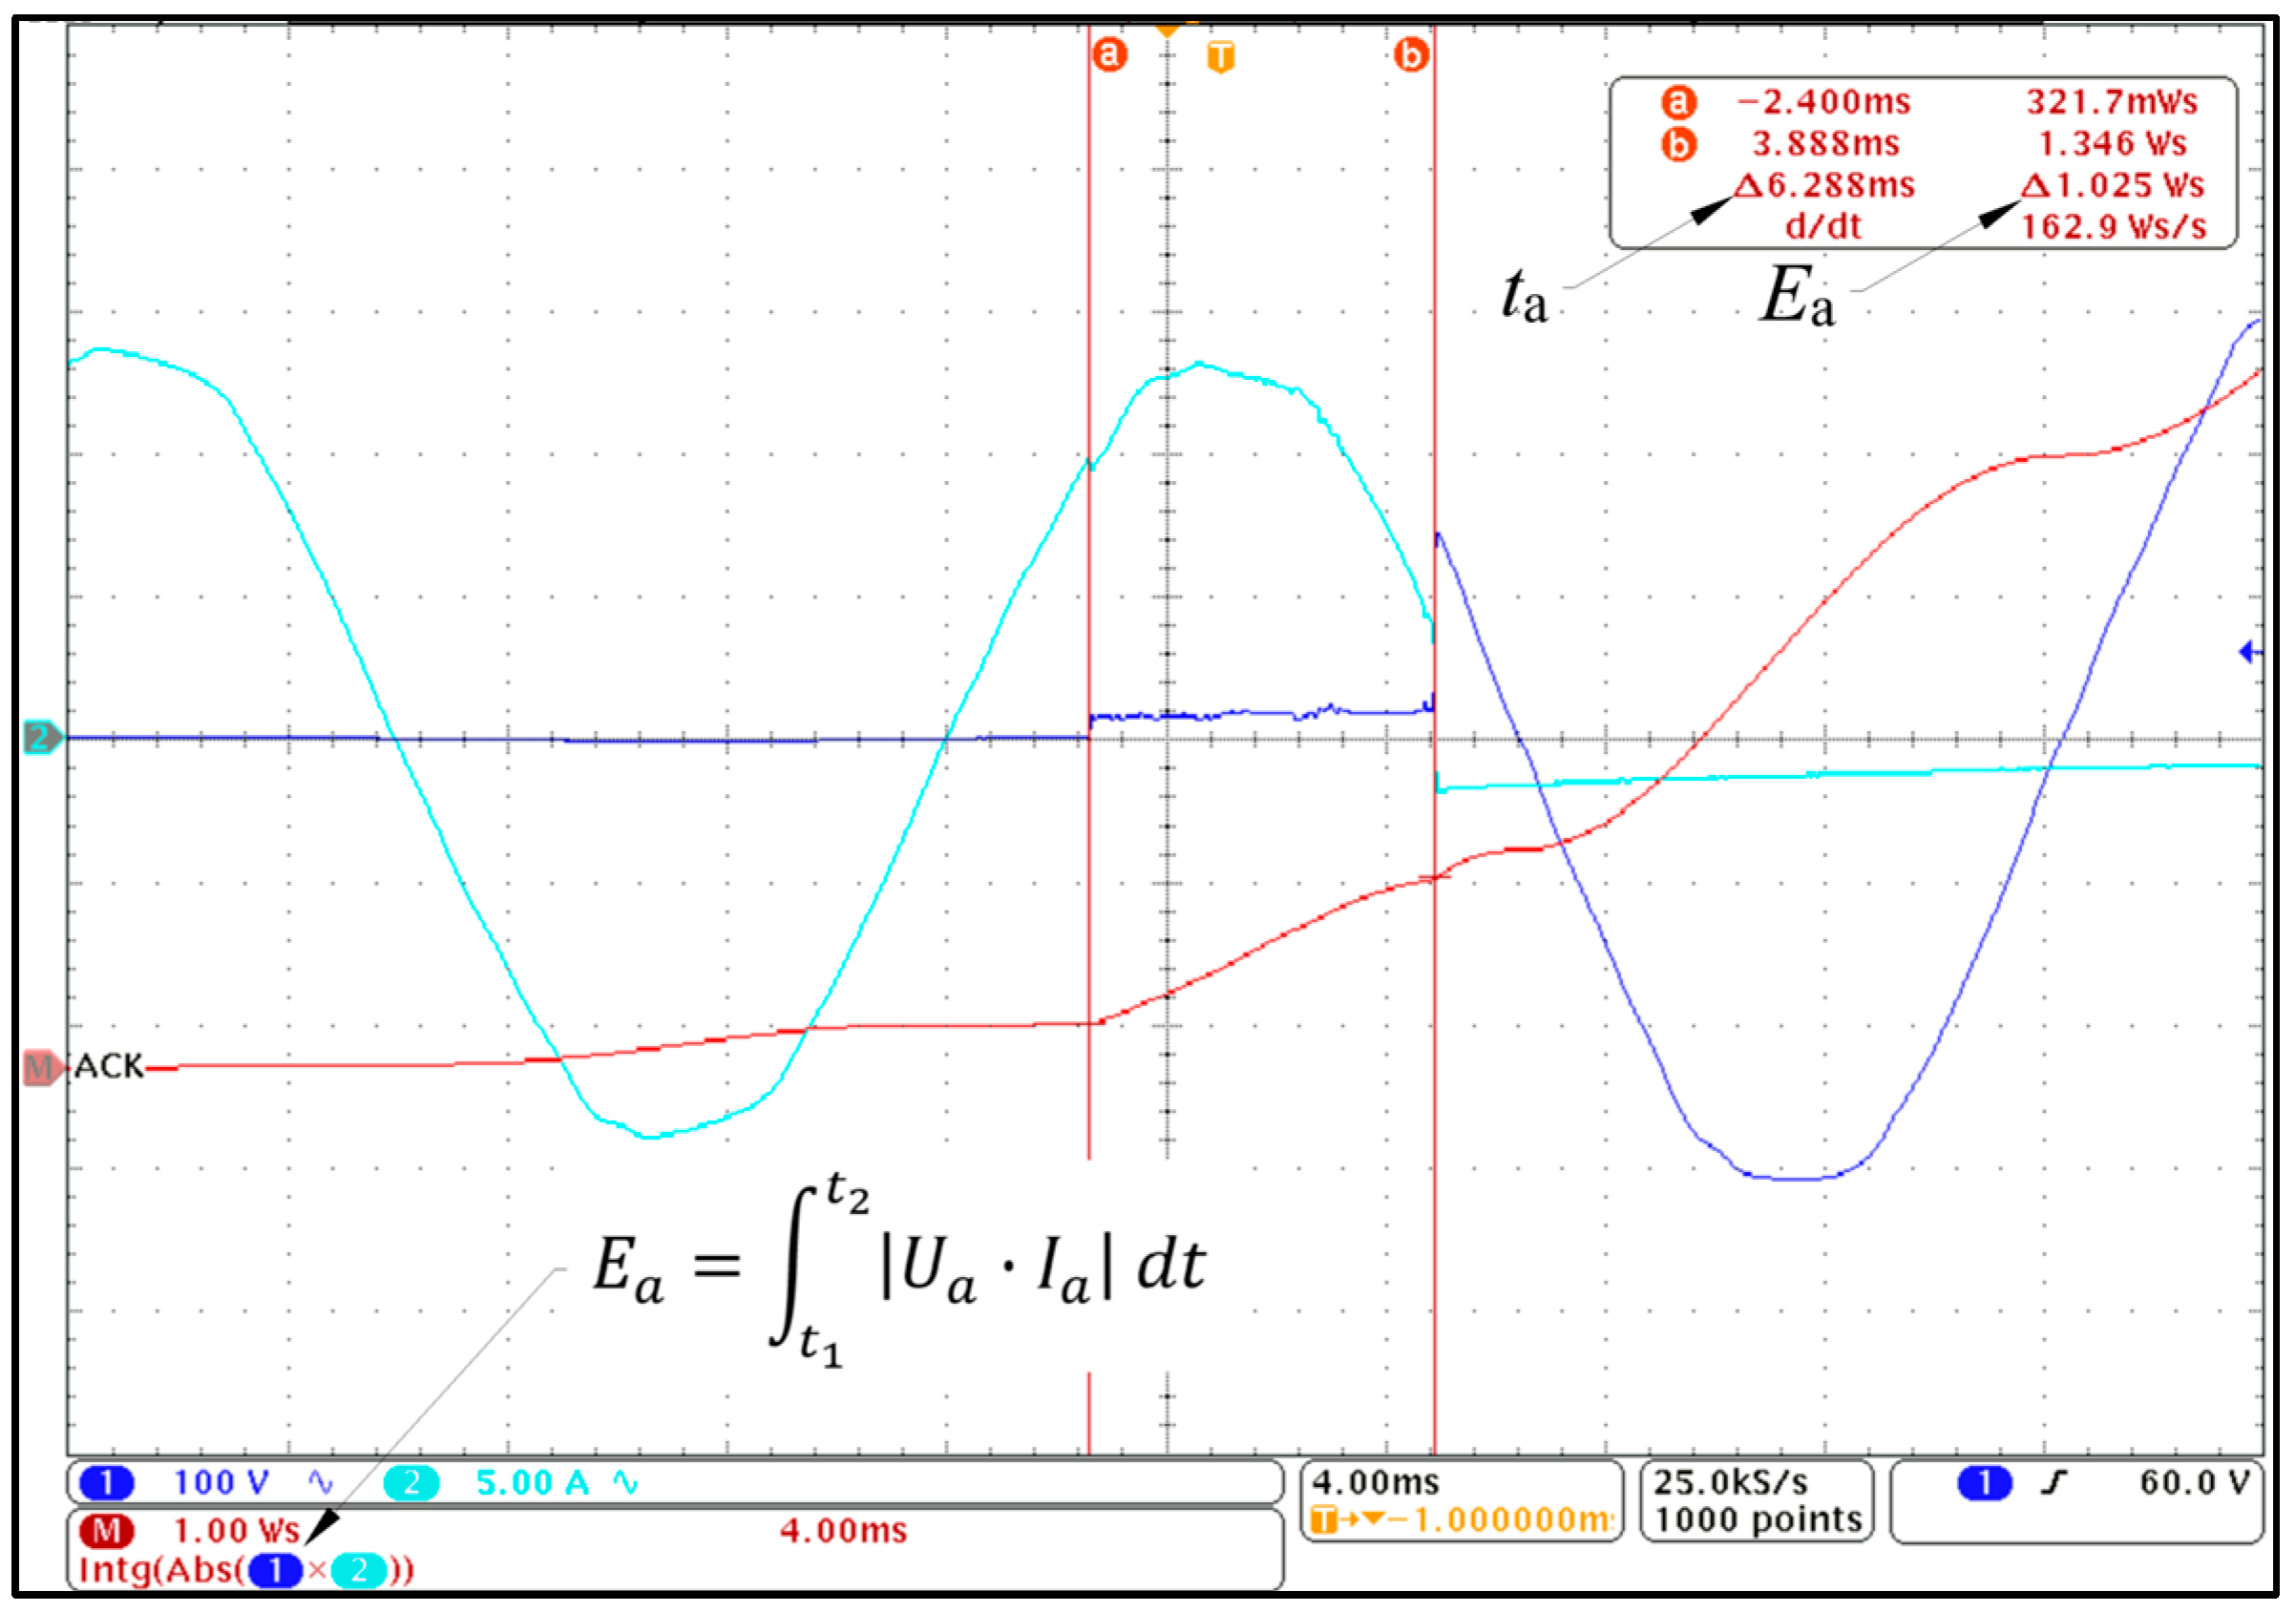
Figure 11 shows an example of the characteristics of the arc burning process obtained during laboratory tests, recorded using an oscilloscope, with all the necessary parameters highlighted. In turn, Figure 12 shows a screenshot of the oscilloscope screen, where the mathematical formula entered into the system can be seen, along with the result of the calculated value of the electric arc energy and the measured value of the arc burning time using the photodiode.

4. The Effect of the Delay in the Ignition Time of a Vacuum Electric Arc on Its Parameters

In order to verify the correct operation of the laboratory bench and to confirm the validity of the adopted test methodology, the energy Ea and arc burning time ta were measured for different values of the contact opening delay time td in the vacuum chamber, calculated from the “passage through zero” of the sinusoid of the current flowing through the contact system of the discharge chamber.
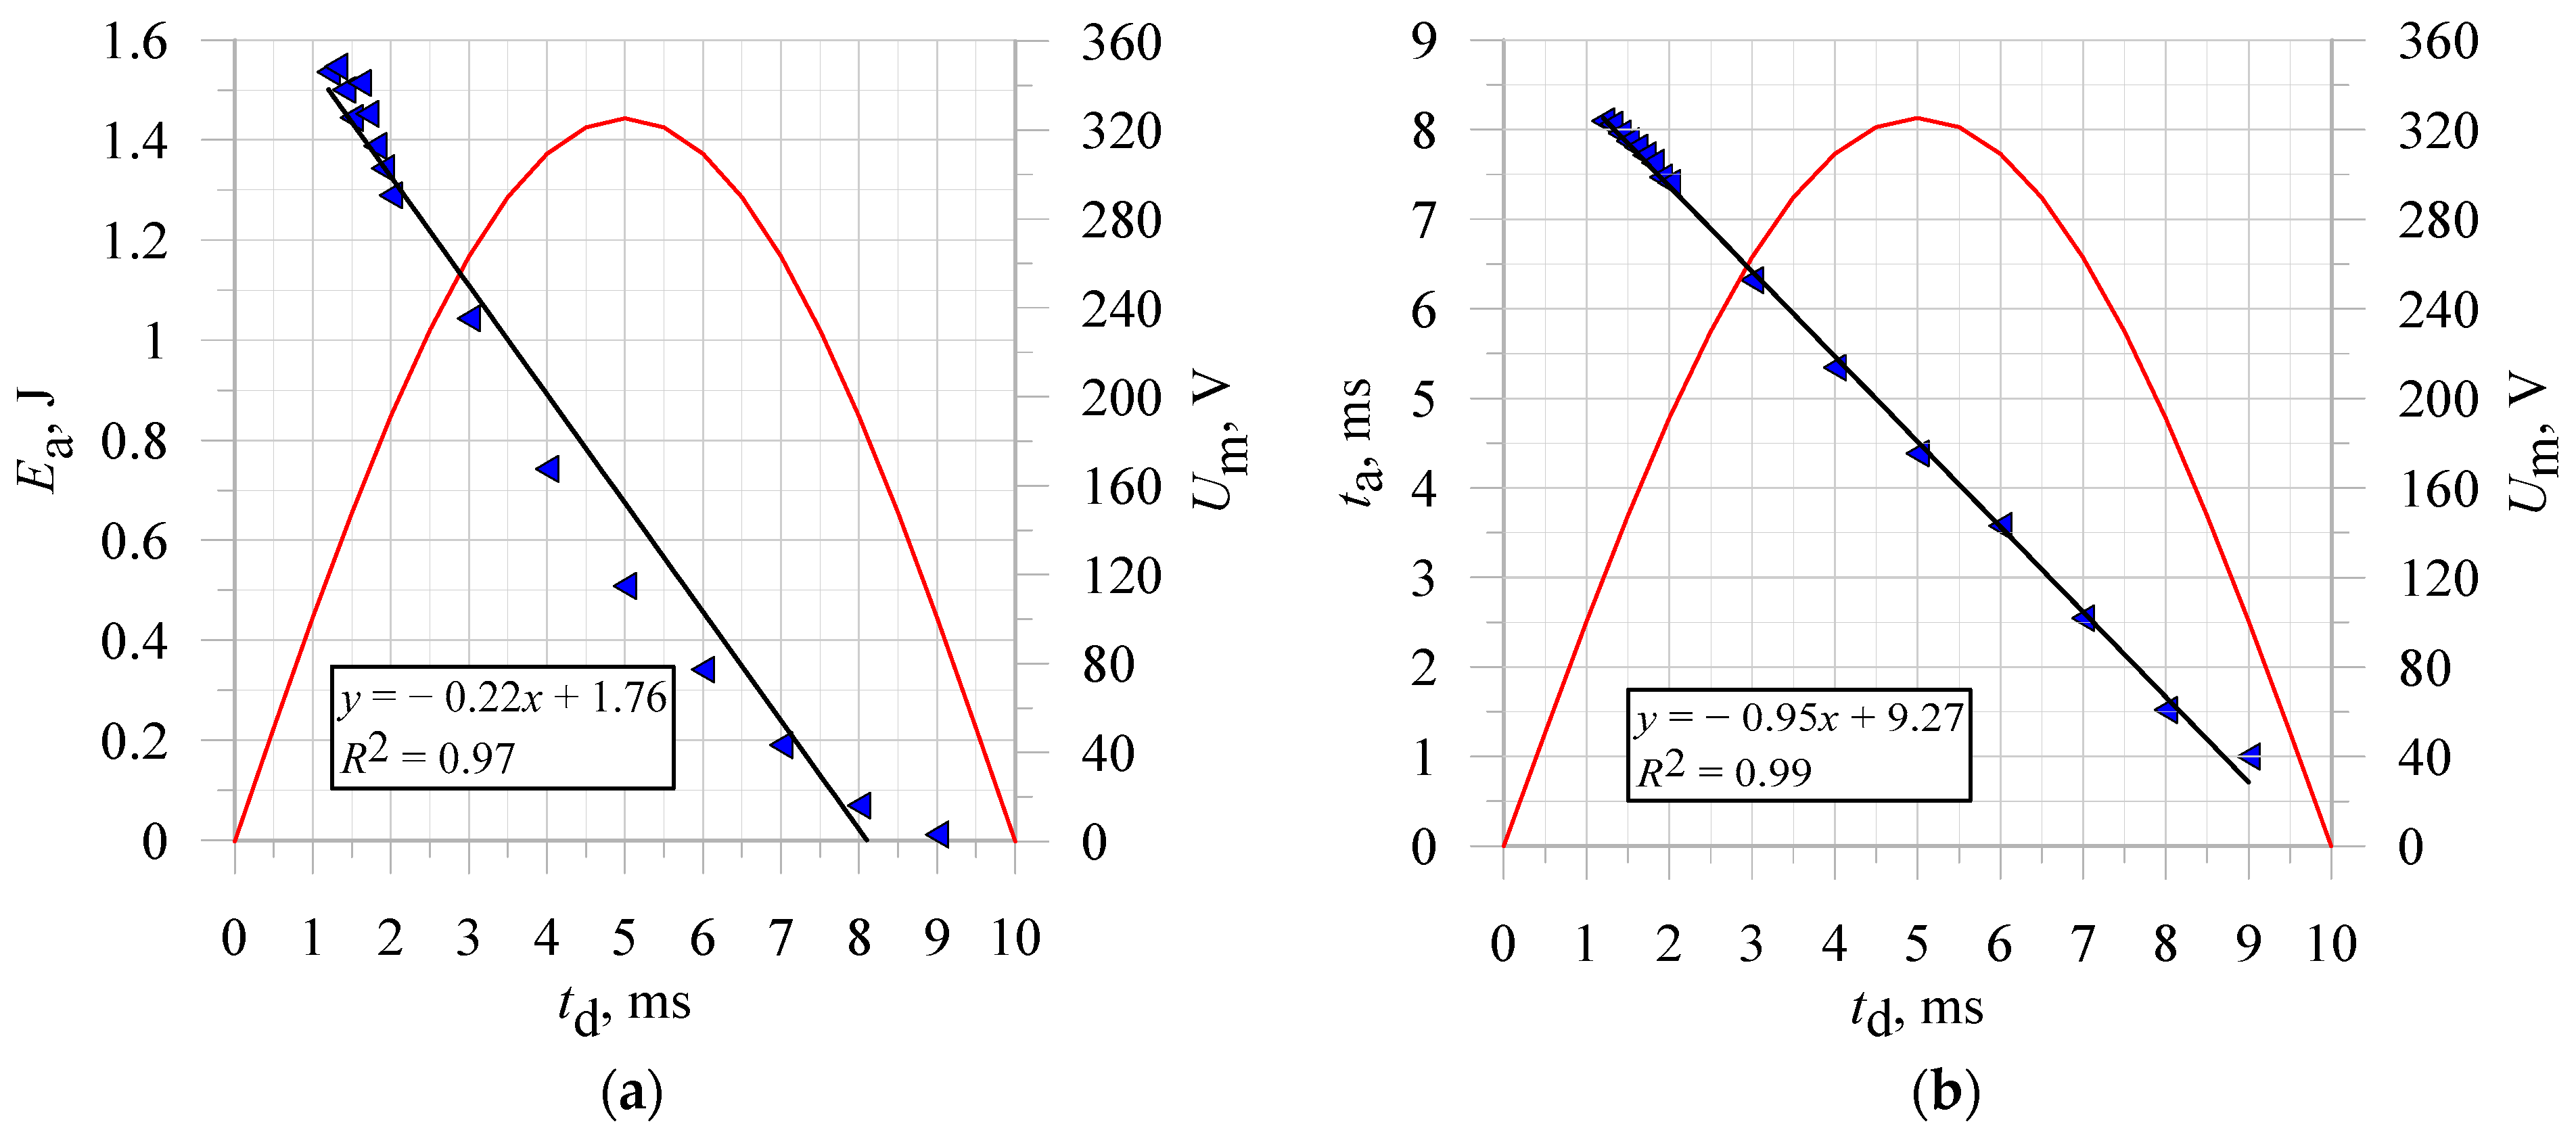
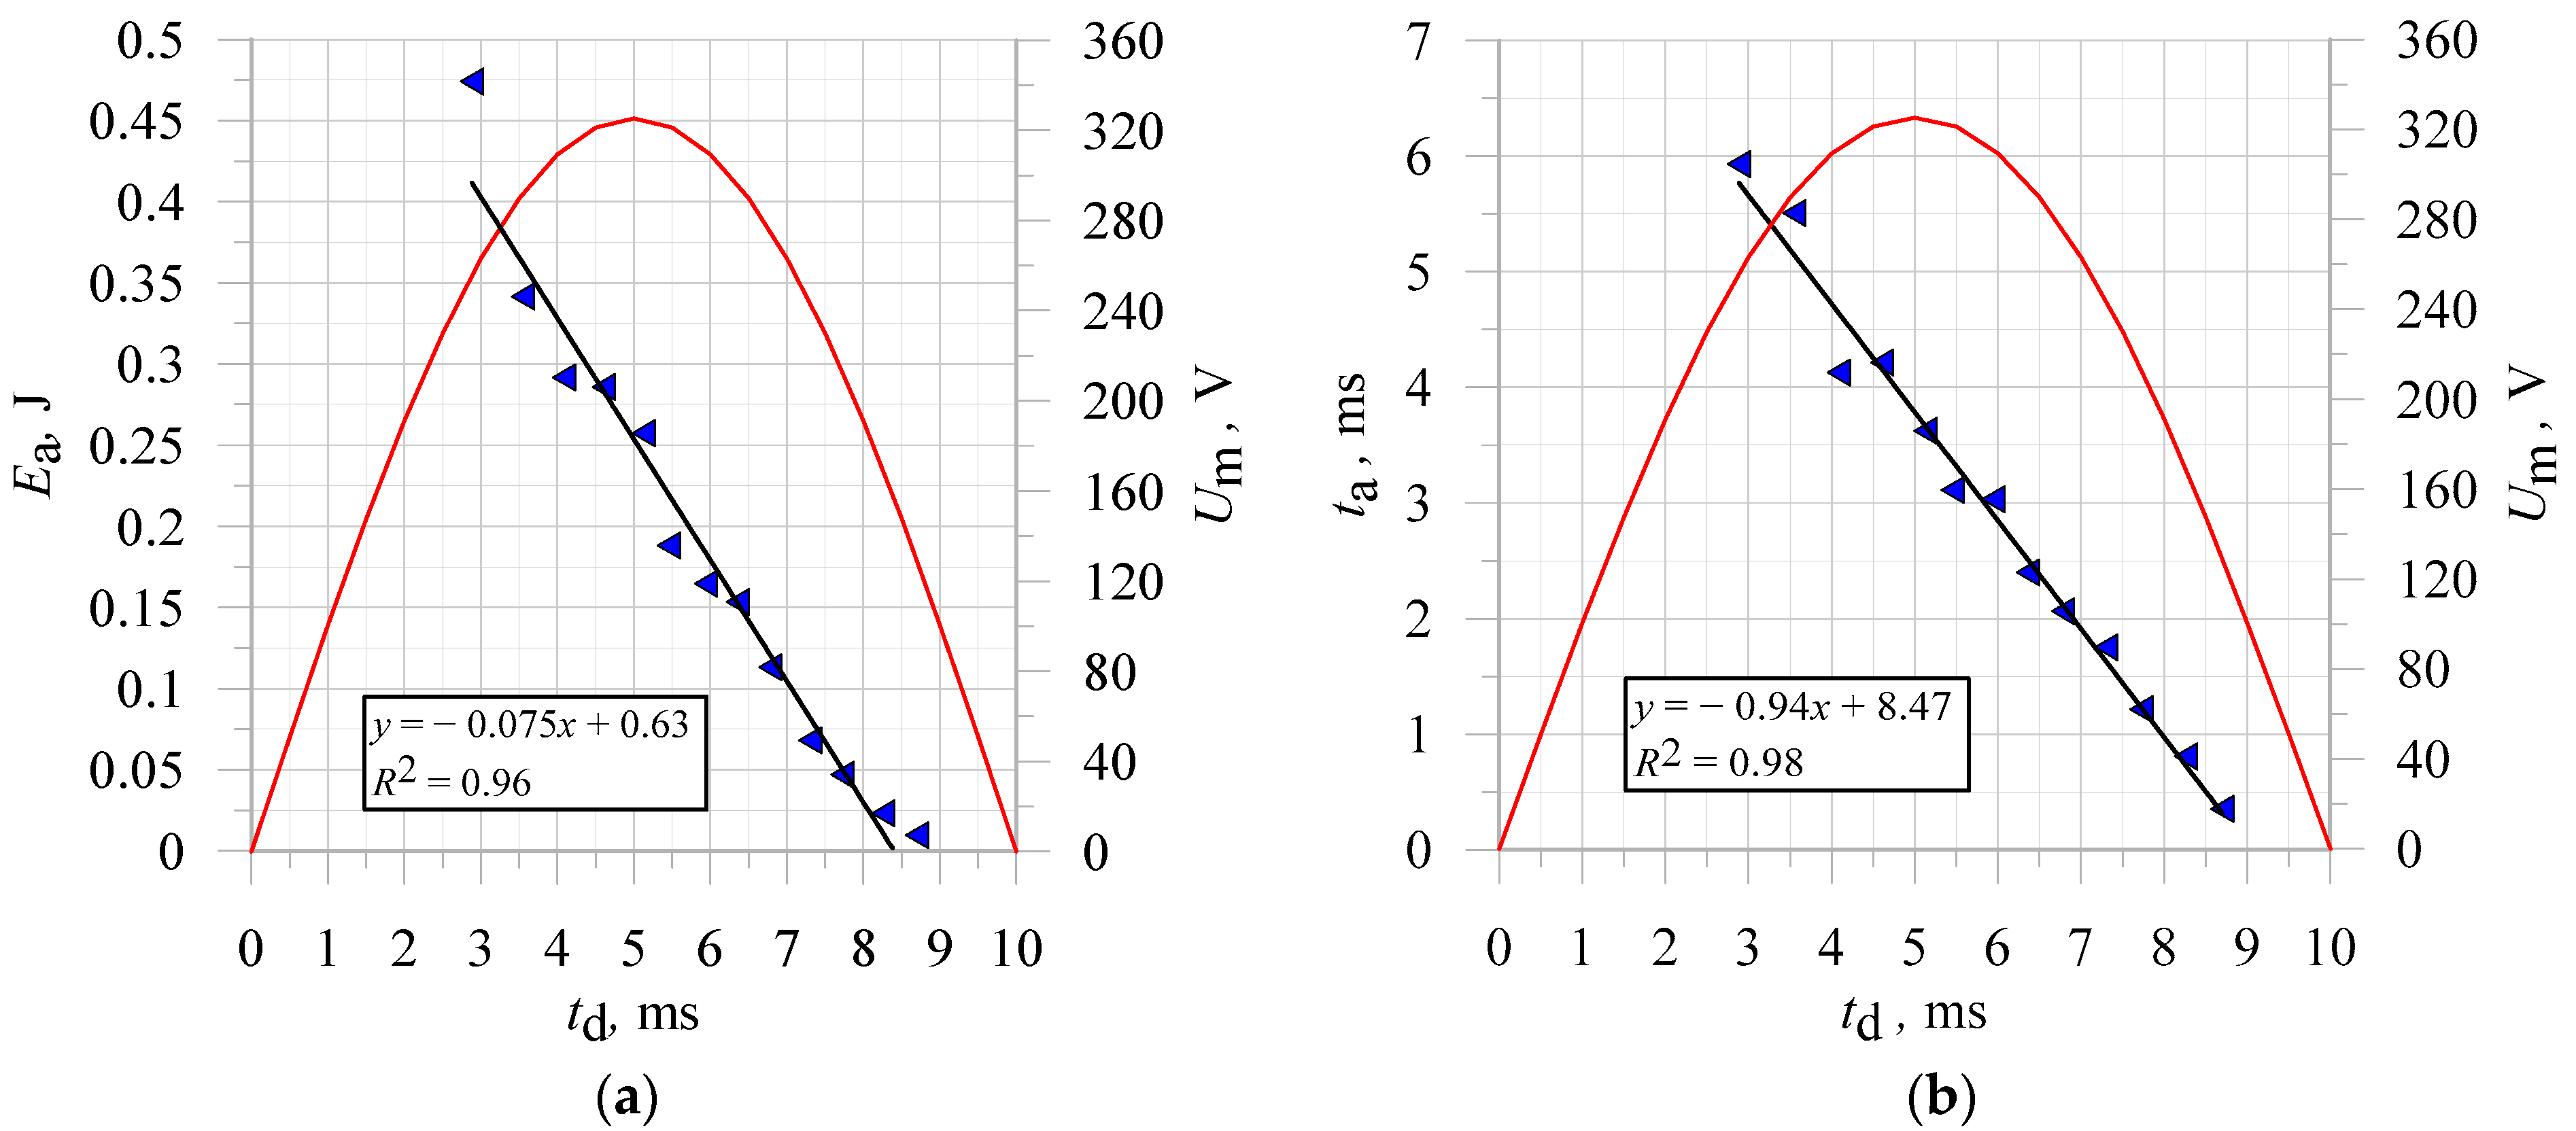
The values of arc energy and burning time were measured for two values of pressure in the discharge chamber: p1 = 1.00 × 10⁵ Pa (atmospheric pressure) and p2 = 4.0 × 10⁻³ Pa (high vacuum environment). A current flow of 5 A rms was forced in the system at a nominal voltage of 230 V and a resistive load. Figure 13a,b show the dependence of arc energy Ea and arc burning time ta as a function of the delay time of opening contacts in the chamber td for atmospheric pressure. Figure 14a,b show analogous characteristics for a high vacuum environment.
Analyzing the above characteristics, it was observed that for atmospheric pressure, the arc ignited after a time td equal to about 1.20 ms from the passage of the current sinusoid through zero. The maximum arc energy at this time was about 1.55 J, while the burning time of this arc was about 8 ms. With increasing delay time td, the vacuum arc energy and burning time decrease. In the case of a high vacuum environment inside the discharge chamber, the ignition of the vacuum arc began to occur with a longer delay time, equal to about 3 ms. The arc energy value in this case was about 0.50 J, and the burning time td was about 6 ms. For a time td less than 3 ms, the phenomenon of arc ignition did not occur. A summary of the maximum values of the arc energy Ea and its burning time ta are summarized in Table 3.
Figure 15a,b show the dependence of the vacuum arc energy Ea as a function of its burning time ta, for atmospheric pressure as well as the high vacuum environment, respectively. Based on these characteristics, it should be concluded that as the burning time of the vacuum arc increases, the value of its energy increases in a linear manner.

5. Conclusions

This paper presents the author’s methodology for testing the parameters of a vacuum arc depending on selected parameters, such as pressure, or the delay time of opening the contact system in the discharge chamber. An innovative laboratory station is described that allows for the full recording and analysis of arc processes in a dedicated vacuum discharge chamber.
In order to confirm the validity of the adopted research methodology, as well as the correctness of the operation of the laboratory bench, the effect of pressure and contact opening delay time in the discharge chamber on the values of energy and burning time of the vacuum electric arc was studied. The tests were carried out for a supply voltage of 230 V and a current of 5 A. The findings are as follows:
  • the maximum arc energy for atmospheric pressure (p1 = 1.00 × 10⁵ Pa) was about 1.55 J, and its burning time was about 8 ms;
  • the maximum arc energy for the high vacuum environment (p2 = 4.00 × 10⁻³ Pa) was about 0.50 J, and its burning time was about 6 ms;
  • for atmospheric pressure, the arc ignites after a delay time of about 1.2 ms from the passage of the current sine wave through zero, and as it increases, the arc energy and burning time decrease;
  • for a high vacuum environment, arc ignition occurs after a time equal to about 3 ms, and as it increases, the arc energy and burning time also decrease.
Based on the laboratory tests carried out and the analysis of the results obtained, it should be concluded that the use of vacuum technology as an insulating medium in switching apparatus allows for a reduction in the energy of the electric arc and a shortening of the time of its burning. The effect of this can be to reduce the degradation of contact surfaces, thereby extending the service life of the vacuum switching apparatus. Moreover, the development of a system that triggers the opening of contacts in vacuum switchgear within 0 to 3 ms after “passing through zero” of the current waveform flowing in the system would make it possible to eliminate the phenomenon of arcing during switching operations.
It should also be noted that research on the effect of the contact opening delay time in vacuum interrupters on their switching performance provides an opportunity to reduce the negative effects associated with switching over-voltages. As we know, medium-voltage vacuum circuit breakers, due to the rapid increase in return strength, are characterized by the ability to switch off circuits before the natural passage of current through zero [46]. This is directly related to the formation of switching over-voltages with significant maximum values and high steepness of rise. The propensity of these over-voltages is characterized primarily by the truncation current. Phenomena of this type occur primarily when switching off circuits of an inductive nature, that is, those in which, for example, transformers, reactors, or electrical machines are installed. The condition for the occurrence of the phenomena of forced current cutoff and return voltage escalation is the appearance of the re-ignition of the arc between the contacts of the vacuum interrupter during the opening of the contacts or during their recoil when closing them. The development of a circuit that would allow circuits to be switched off as soon as the current sinusoid in the system “passes through zero” could reduce the negative effects associated with switching over-voltages in the vacuum switching apparatus.
The authors of the above work also proved that the developed research methodology, which was realized with the use of the described test stand, is valid and allows for comprehensively conducting research on the arc parameters of vacuum interrupters used in modern medium-voltage switching equipment. The authors’ further research plans are mainly related to the study of arc parameters during circuit switching under short-circuit conditions, the analysis of vacuum arc phenomena using optical spectroscopy, and the study of new insulating gas mixtures, including electro-negative gases.

Author Contributions

Conceptualization, M.L. and P.W.; methodology, M.L. and C.K.; software, C.K. and P.P.; validation, M.L. and C.K.; writing—original draft preparation, M.L.; writing—review and editing, M.L. and P.W.; visualization, M.L.; supervision, P.W. All authors have read and agreed to the published version of the manuscript.

Funding

This work has been financed by the National Centre for Research and Development under the LIDER program. Grant Agreement No. LIDER14/0129/2023.

Data Availability Statement

The original contributions presented in the study are included in the article; further inquiries can be directed to the corresponding author.

Conflicts of Interest

Author Przemysław Pachulski was employed by the Eaton Electric Sp. z o.o. The remaining authors declare that the research was conducted in the absence of any commercial or financial relationships that could be construed as a potential conflict of interest.

References

  1. Maksymiuk, J. Aparaty Elektryczne; Wydawnictwa Naukowo-Techniczne: Warszawa, Poland, 1992. [Google Scholar]
  2. Klajn, A. Właściwości Dyfuzyjnego Wyładowania Łukowego w Próżni w Warunkach Wymuszonego Wyłączania Prądu; Oficyna Wydawnicza Politechniki Wrocławskiej: Wrocław, Poland, 2006. [Google Scholar]
  3. Kordus, A. Plazma: Właściwości i Zastosowania w Technice; Wydawnictwa Naukowo-Techniczne: Warszawa, Poland, 1985. [Google Scholar]
  4. Slade, P.G. The vacuum Interrupter: Theory, Design, and Application; CRC Press: Boca Raton, FL, USA, 2020. [Google Scholar]
  5. Gembarzhevskii, G.V. An Approach to Plasma Wake Studying. JMP 2015, 6, 46–57. [Google Scholar] [CrossRef]
  6. Lech, M.; Węgierek, P. Breakdown Initiation and Electrical Strength of a Vacuum Insulating System in the Environment of Selected Noble Gases at AC Voltage. Energies 2022, 15, 1154. [Google Scholar] [CrossRef]
  7. Gentsch, D.; Gorlt, K. High speed Observation of vacuum arcs between different contact diameter at TMF contact pair. In Proceedings of the 29th International Symposium on Discharges and Electrical Insulation in Vacuum (ISDEIV), Padova, Italy, 26–30 September 2021; pp. 177–180. [Google Scholar] [CrossRef]
  8. Jing, H.; Yang, J.; Pang, X.; Xiu, S. Simulation of vacuum arc cathode spot movement between transverse magnetic field contacts. AIP Adv. 2021, 11, 015324. [Google Scholar] [CrossRef]
  9. Guan, C.; Yao, X.; Zheng, J.; Zuo, X.; Li, X.; Liu, Z.; Wang, J.; Geng, Y. A Relationship Between Vacuum Arc Characteristics and Short-Circuit Current Interrupting Capability at Minimum Arcing Times. IEEE Trans. Plasma Sci. 2022, 50, 2670–2680. [Google Scholar] [CrossRef]
  10. Liu, S.; Ma, H.; Hu, F.; Liu, F.; Geng, Y.; Liu, Z.; Wang, J. Vacuum Arc Evolution Characteristics in Low-Voltage DC Current Interruption Under Composite Transverse Magnetic Fields. IEEE Trans. Plasma Sci. 2021, 49, 3927–3934. [Google Scholar] [CrossRef]
  11. Yan, W.; Wang, Z.; Cao, Z.; Li, H.; Sun, L.; Wang, J. Particle Generation, Their Behavior and Effect on Post-Arc Breakdowns After Capacitive-Current Vacuum Arc Interruption. IEEE Trans. Power Deliv. 2022, 37, 4303–4314. [Google Scholar] [CrossRef]
  12. Cao, Z.; Li, R.; Cao, B.; Yan, W.; Sun, L.; Wang, J.; Geng, Y.; Wang, Z. Hybrid plasma modeling of the interaction between the vacuum arc jet and the hot metallic particle near the current zero. Phys. Plasmas 2022, 29, 113512. [Google Scholar] [CrossRef]
  13. Ejiri, H.; Kumada, A.; Hidaka, K.; Taguchi, Y.; Inada, Y.; Yamano, Y.; Iwabuchi, H.; Kaneko, E. Late Breakdowns Caused by Microparticles After Vacuum Arc Interruption. IEEE Trans. Plasma Sci. 2019, 47, 3392–3399. [Google Scholar] [CrossRef]
  14. Gentsch, D.; Gorlt, K. Vacuum Interrupters Equipped with TMF Contacts and Contact Material Different from Each Other; a Study under Short Circuit Current Conditions and High-Speed Arc Observation During Current Interruption. In Proceedings of the 28th International Symposium on Discharges and Electrical Insulation in Vacuum (ISDEIV), Greifswald, Germany, 23–28 September 2018; pp. 595–598. [Google Scholar] [CrossRef]
  15. Hotta, K.; Inaguchi, T. Contact Welding Mechanism With Bounce Arc on Ag and Cu Contacts in Low-Voltage Switches. IEEE Trans. Compon. Packag. Manufact. Technol. 2017, 7, 363–370. [Google Scholar] [CrossRef]
  16. Huang, X.; Sun, T.; Wu, Y.; Yang, S.; Zhao, L.; Ning, W.; Wang, L. Study of vacuum arc plasma transport characteristics during the DC interrupting process. J. Phys. D Appl. Phys. 2022, 55, 165501. [Google Scholar] [CrossRef]
  17. Jia, S.; Shi, Z.; Wang, L. Vacuum arc under axial magnetic fields: Experimental and simulation research. J. Phys. D Appl. Phys. 2014, 47, 403001. [Google Scholar] [CrossRef]
  18. Jiang, F.; Wu, Y.; Wu, Y.; Cui, Y.; Rong, M.; Sun, H.; Long, C. Experimental investigation on the erosion behavior in high-current vacuum arcs and resulting microparticles dynamics. J. Phys. D Appl. Phys. 2021, 54, 395201. [Google Scholar] [CrossRef]
  19. Kim, B.-C.; Kim, S.T.; Ahn, K.Y.; Kim, Y.G. A study on electrical lifespan of VI by means of calculation of arc energy during arcing time in synthetic tests. In Proceedings of the 3rd International Conference on Electric Power Equipment—Switching Technology (ICEPE-ST), Busan, Republic of Korea, 25–28 October 2015; pp. 81–84. [Google Scholar] [CrossRef]
  20. Li, S.; Yamano, Y.; Geng, Y.; Liu, Z.; Wang, J.; Zhang, C. A Method to Analyze Particle Induced Vacuum Breakdown with Obvious Field Emission Current. In Proceedings of the 29th International Symposium on Discharges and Electrical Insulation in Vacuum (ISDEIV), Padova, Italy, 26–30 September 2021; pp. 42–45. [Google Scholar] [CrossRef]
  21. Liao, M.; Ge, G.; Duan, X.; Huang, Z. A novel post-arc current measuring equipment based on vacuum arc commutation and arc blow. Meas. Sci. Technol. 2017, 28, 075901. [Google Scholar] [CrossRef]
  22. Logachev, A.A.; Poluyanova, I.N.; Zabello, K.K.; Barinov, Y.A.; Shkol’nik, S.M. Cathode Surface State and Cathode Temperature Distribution After Current Zero of Different AMF-Contacts. IEEE Trans. Plasma Sci. 2019, 47, 3516–3524. [Google Scholar] [CrossRef]
  23. Shi, W.; Wang, L.; Lin, R.; Deng, J.; Jia, S. Experimental investigation of triggered vacuum arc behavior under different TMF-AMF composite contacts. In Proceedings of the 4th International Conference on Electric Power Equipment—Switching Technology (ICEPE-ST), Xi’an, China, 22–25 October 2017; pp. 125–128. [Google Scholar] [CrossRef]
  24. Wang, H.; Wang, Z.; Liu, J.; Zhou, Z.; Wang, J.; Geng, Y.; Liu, Z. Optical absorption spectroscopy of metallic (Cr) vapor in a vacuum arc. J. Phys. D Appl. Phys. 2018, 51, 035203. [Google Scholar] [CrossRef]
  25. Wang, L.; Shi, W.; Lin, R.; Wang, Y.; Ma, J.; Jia, S. Experimental Investigation of Vacuum Arc Behavior under Different Contacts in Vacuum Interrupters. In Proceedings of the 28th International Symposium on Discharges and Electrical Insulation in Vacuum (ISDEIV), Greifswald, Germany, 23–28 September 2018; pp. 223–226. [Google Scholar] [CrossRef]
  26. Wang, Z.; Yan, W.; Jiang, Y.; Li, Y.; Liu, J.; Wang, W.; Geng, Y.; Wang, J.; Liu, Z.; Sun, L. The effect and dynamic behavior of particles in high-current vacuum arc interruptions. J. Phys. D Appl. Phys. 2019, 52, 075205. [Google Scholar] [CrossRef]
  27. Slade, P.G. Criteria for the Application of Vacuum Interrupters in HVDC Circuit Breakers. In Proceedings of the 67th Holm Conference on Electrical Contacts (HLM), Tampa, FL, USA, 23–26 October 2022; pp. 1–7. [Google Scholar] [CrossRef]
  28. Slade, P.G. The Application of Vacuum Interrupters in HVDC Circuit Breakers. IEEE Trans. Plasma Sci. 2022, 50, 4675–4682. [Google Scholar] [CrossRef]
  29. Baeva, M.; Benilov, M.S.; Zhu, T.; Testrich, H.; Kewitz, T.; Foest, R. Modelling and experimental evidence of the cathode erosion in a plasma spray torch. J. Phys. D Appl. Phys. 2022, 55, 365202. [Google Scholar] [CrossRef]
  30. Santos, D.F.N.; Lisnyak, M.; Almeida, N.A.; Benilova, L.G.; Benilov, M.S. Numerical investigation of AC arc ignition on cold electrodes in atmospheric-pressure argon. J. Phys. D Appl. Phys. 2021, 54, 195202. [Google Scholar] [CrossRef]
  31. Ferreira, N.G.C.; Almeida, P.G.; Benilov, M.S.; Panarin, V.A.; Skakun, V.S.; Tarasenko, V.F.; Naidis, G.V. Computational and Experimental Study of Time-Averaged Characteristics of Positive and Negative DC Corona Discharges in Point-Plane Gaps in Atmospheric Air. IEEE Trans. Plasma Sci. 2020, 48, 4080–4088. [Google Scholar] [CrossRef]
  32. Ferreira, N.G.C.; Naidis, G.V.; Benilov, M.S. Simulation of pre-breakdown discharges in high-pressure air: II. Effect of surface protrusions. J. Phys. D Appl. Phys. 2021, 54, 255203. [Google Scholar] [CrossRef]
  33. Cunha, M.D.; Kaufmann, H.T.C.; Santos, D.F.N.; Benilov, M.S. Simulating changes in shape of thermionic cathodes during operation of high-pressure arc discharges. J. Phys. D Appl. Phys. 2019, 52, 504004. [Google Scholar] [CrossRef]
  34. Cunha, M.D.; Wenzel, N.; Almeida, P.G.C.; Hartmann, W.; Benilov, M.S.A. Simple Model of Distribution of Current Over Cathodes of Vacuum Circuit Breakers. IEEE Trans. Plasma Sci. 2019, 47, 3462–3469. [Google Scholar] [CrossRef]
  35. Benilov, M.S.; Kaufmann, H.T.C.; Hartmann, W.; Benilova, L.G. Revisiting Theoretical Description of the Retrograde Motion of Cathode Spots of Vacuum Arcs. IEEE Trans. Plasma Sci. 2019, 47, 3434–3441. [Google Scholar] [CrossRef]
  36. Cunha, M.D.; Hartmann, W.; Wenzel, N.; Benilov, M.S.; Almeida, P.G.C. Simulating Propagation of Spots over Cathodes of High-Power Vacuum Circuit Breakers. In Proceedings of the 28th International Symposium on Discharges and Electrical Insulation in Vacuum (ISDEIV), Greifswald, Germany, 23–28 September 2018; pp. 385–388. [Google Scholar] [CrossRef]
  37. Kaufmann, H.T.C.; Profatilova, I.; Popov, I.; Wuensch, W.; Benilov, M.S. Investigation of Vacuum Breakdown in Pulsed DC Systems. In Proceedings of the 29th International Symposium on Discharges and Electrical Insulation in Vacuum (ISDEIV), Padova, Italy, 26–30 September 2021; pp. 19–22. [Google Scholar] [CrossRef]
  38. Baeva, M. Reversal of the electric field and the anode fall in DC arcs in air during contact opening. J. Phys. D Appl. Phys. 2024, 57, 39LT01. [Google Scholar] [CrossRef]
  39. Baeva, M.; Boretskij, V.F.; Gonzalez, D.; Methling, R.; Murmantsev, O.; Uhrlandt, D.; Veklich, A. Unified modelling of low-current short-length arcs between copper electrodes. J. Phys. D Appl. Phys. 2021, 54, 025203. [Google Scholar] [CrossRef]
  40. Mohsni, C.; Baeva, M.; Franke, S.; Gortschakow, S.; Araoud, Z.; Charrada, K. Effect of a bidirectional coupling of an LTE arc column to a refractory cathode in atmospheric pressure argon. Phys. Plasmas 2020, 27, 073514. [Google Scholar] [CrossRef]
  41. Baeva, M.; Loffhagen, D.; Uhrlandt, D. Unified Non-equilibrium Modelling of Tungsten-Inert Gas Microarcs in Atmospheric Pressure Argon. Plasma Chem. Plasma Process. 2019, 6, 1359–1378. [Google Scholar] [CrossRef]
  42. Saifutdinov, A.I. Numerical study of various scenarios for the formation of atmospheric pressure DC discharge characteristics in argon: From glow to arc discharge. Plasma Sources Sci. Technol. 2022, 31, 094008. [Google Scholar] [CrossRef]
  43. Saifutdinov, A.I. Unified simulation of different modes in atmospheric pressure DC discharges in nitrogen. J. Appl. Phys. 2021, 129, 093302. [Google Scholar] [CrossRef]
  44. Lech, M.; Węgierek, P. Effect of selected parameters on the electrical strength of a high-voltage vacuum insulation system. Arch. Electr. Eng. 2023, 72, 597–611. [Google Scholar] [CrossRef]
  45. Lech, M. Disassemblable Vacuum Chamber as An Innovative Test Stand Designed for Research on Improving the Operational Parameters of Power Switching Apparatus. Inform. Autom. Pomiary Gospod. Ochr. Sr. 2020, 10, 66–69. [Google Scholar] [CrossRef]
  46. Florkowski, M.; Furgał, J.; Kuniewski, M.; Pająk, P. Overvoltage Impact on Internal Insulation Systems of Transformers in Electrical Networks with Vacuum Circuit Breakers. Energies 2020, 13, 6380. [Google Scholar] [CrossRef]
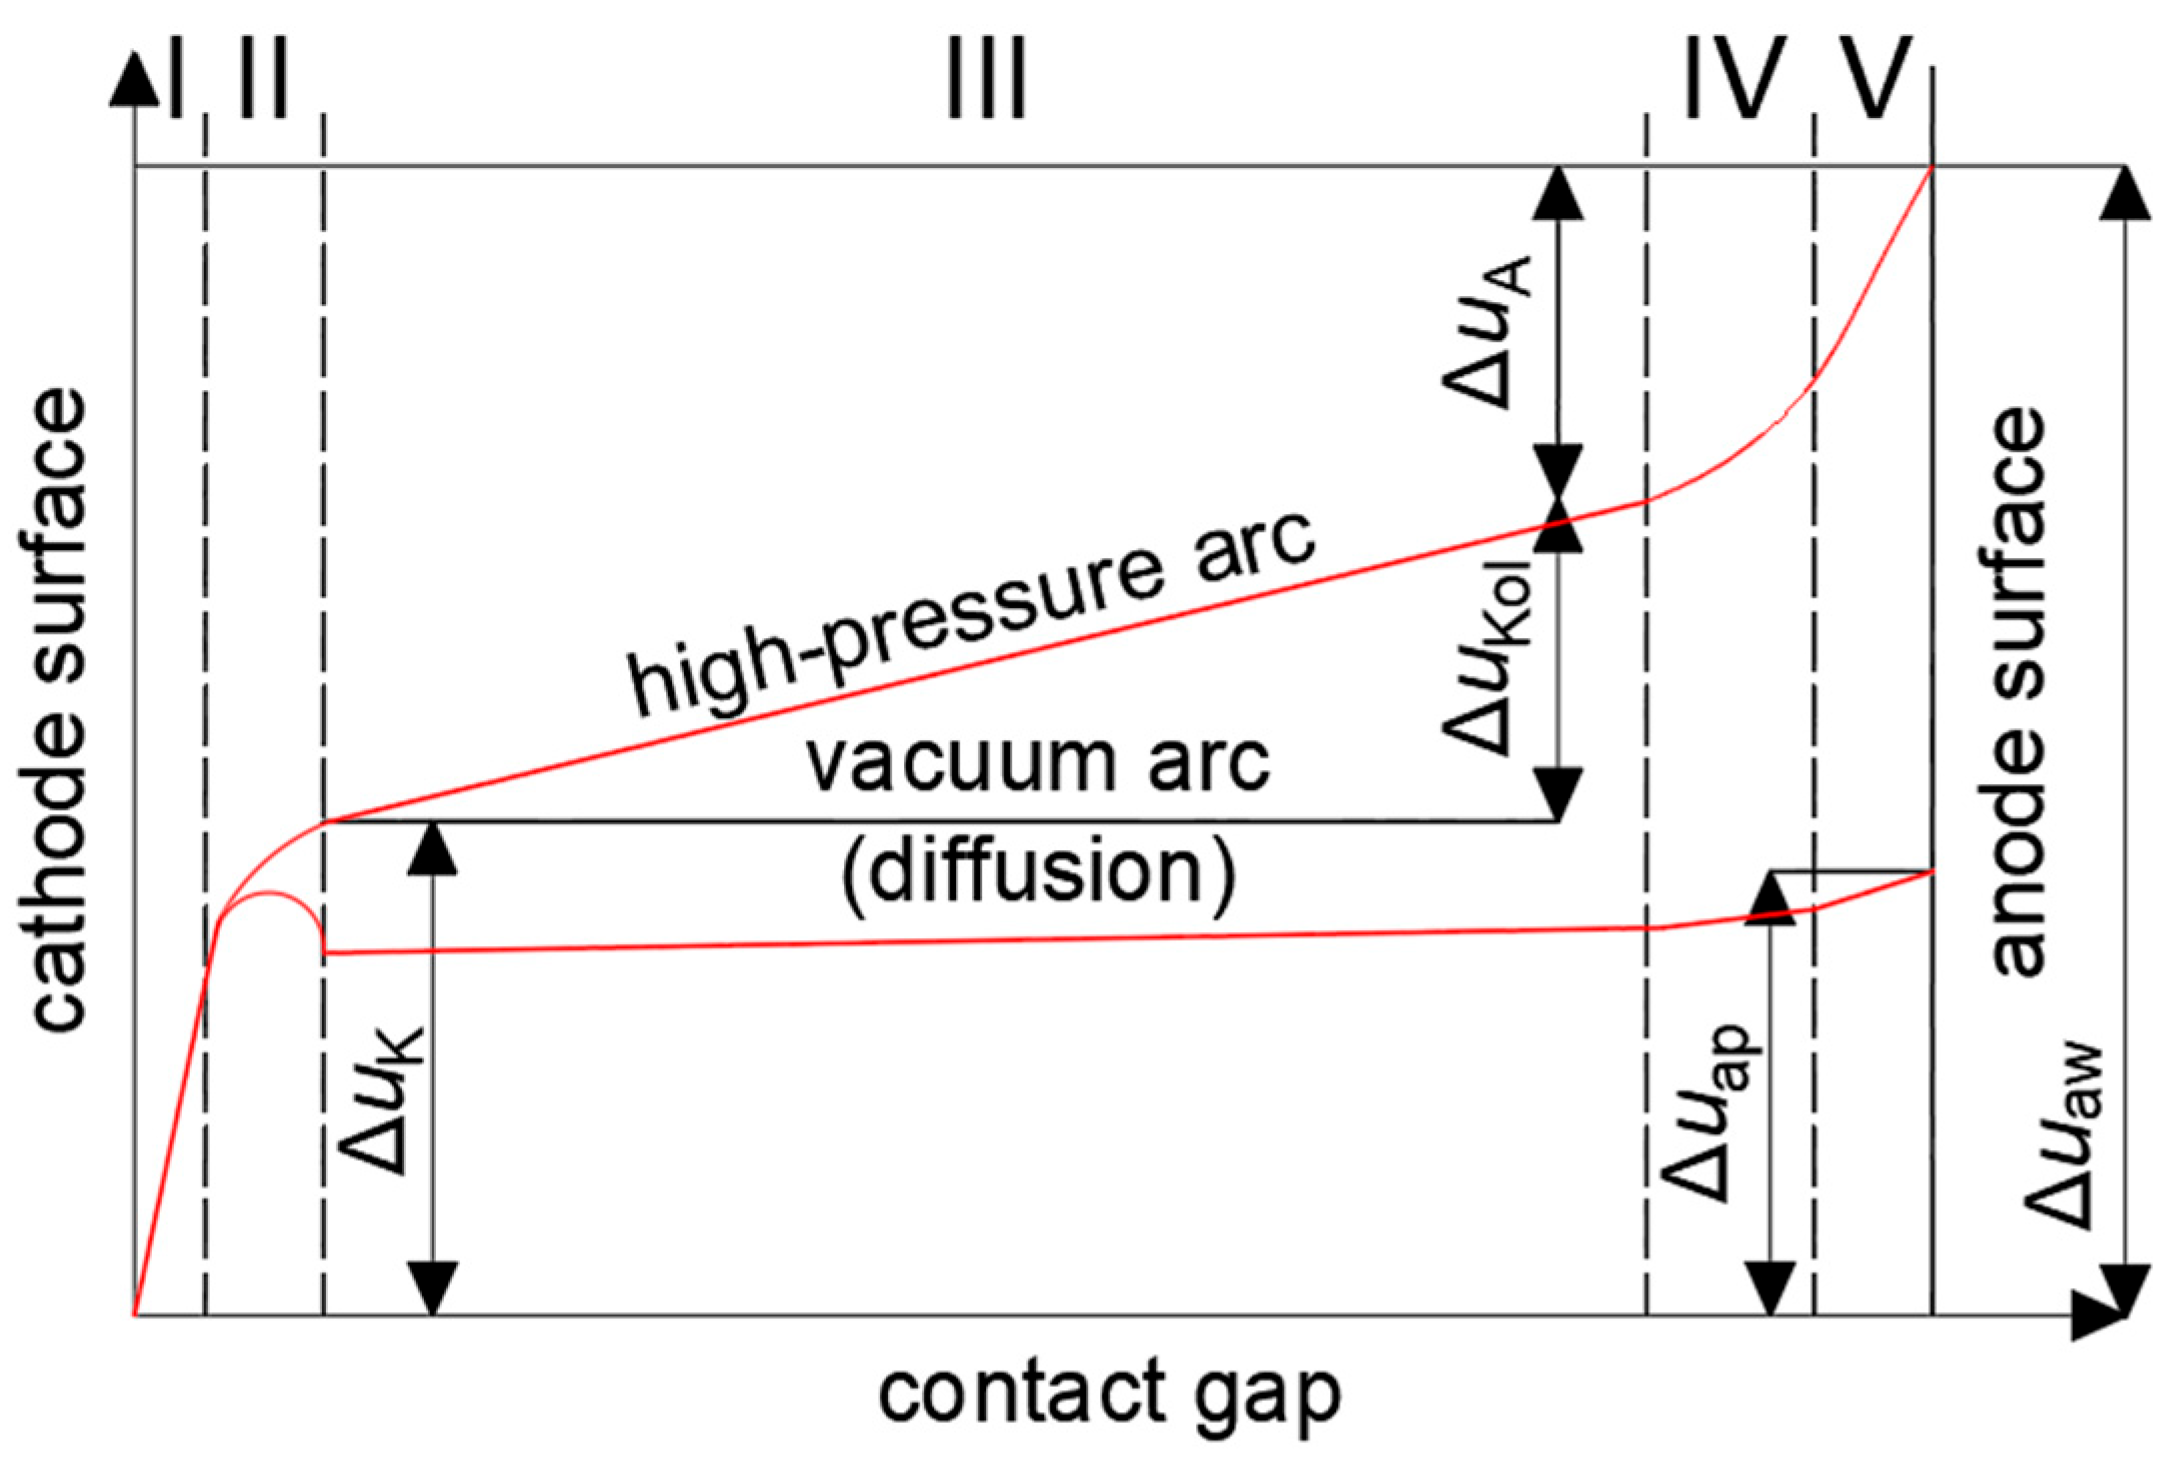
Figure 1. Voltage distribution in high-pressure arc and vacuum arc (Adapted from [2]); I—cathodic space charge zone, II—cathodic plasma zone, III—arc column, IV—near cathodic plasma zone, V—anodic space charge zone, ΔuK, ΔuKol, ΔuA—voltage drops: cathodic, at arc column, near cathodic, Δuap—total vacuum arc voltage, Δuaw—total high-pressure arc voltage.
Energies 17 05101 g001
Figure 2. Vacuum arc voltage waveforms during half-wave current switching for three selected current values (MV circuit breaker interrupter with Cu/Cr contacts) (Adapted from [2]).
Energies 17 05101 g002
Figure 3. View of the main component of the demountable vacuum chamber—the discharge chamber (a) with the contact system inside (b) (Adapted from [6,44,45]).
Energies 17 05101 g003
Figure 4. Optical microscope image of the W70Cu30 contact patch (own elaboration).
Energies 17 05101 g004
Figure 5. Electron microscope images of the W70Cu30 contact patch (own elaboration).
Energies 17 05101 g005
Figure 6. Schematic of the designed and constructed electronic circuit for reading the signal from the photodiode (own elaboration).
Energies 17 05101 g006
Figure 7. Printing process of the photodiode attachment in place of the viewing window of the demountable chamber (own elaboration).
Energies 17 05101 g007
Figure 8. Schematic of the laboratory station designed for testing switching parameters (own elaboration): 1—autotransformer, 2—electronic load, 3—vacuum chamber under test, 4—photodiode, 5—vacuum manual valve, 6—oscilloscope, 7—electromagnetic drive, 8—control panel with option to open and close contacts of the chamber, 9—delay controller, 10—”pass through 0” detector, 11—electromagnetic drive, 12—vacuum kit (a—turbomolecular vacuum pump, b—pre-pump, c, d—vacuum gauges, e—pressure regulator), 13—technical gas kit.
Energies 17 05101 g008
Figure 9. View of the laboratory station based on the so-called “demountable vacuum chamber” (own elaboration).
Energies 17 05101 g009
Figure 10. View of the laboratory station used to analyze the switching processes in the demountable chamber (own elaboration).
Energies 17 05101 g010
Figure 11. Characteristics of the arc burning process in the discharge chamber (own elaboration): td—delay time, after which the contacts opened, calculated from the “passage through zero” of the sinusoid of the current flowing through the contact system, Ea—curve of the integration operation, Ua—voltage of the electric arc, Ia—current flowing through the vacuum chamber, t1—time of ignition of the arc, t2—time of extinguishing the arc, and t0—passage through zero of the sinusoid of the current flowing through the contact system.
Energies 17 05101 g011
Figure 12. A screenshot from the oscilloscope showing the mathematical operation and its result (own elaboration).
Energies 17 05101 g012
Figure 13. Characteristics: (a) energy Ea and (b) burning time ta vacuum arc as a function of time td, for pressure p1 = 1.00 × 10⁵ Pa (own elaboration). Red curve—supply voltage Um, blue points—measured values of arc energy Ea, black straight—straight fit to measured values.
Energies 17 05101 g013
Figure 14. Characteristics: (a) energy Ea and (b) burning time ta vacuum arc as a function of time td, for pressure p2 = 4.00 × 10⁻³ Pa (own elaboration). Red curve—supply voltage Um, blue points—measured values of arc energy Ea, black straight—straight fit to measured values.
Energies 17 05101 g014
Figure 15. Characteristics of the energy of the vacuum arc Ea as a function of its burning time ta, for (a) pressure p1 = 1.00 × 10⁵ Pa, (b) pressure p2 = 4.00 × 10⁻³ Pa (own elaboration).
Energies 17 05101 g015
Table 1. Voltage and current limits, above which an arc discharge occurs (Adapted from [1]).
Electrodes MaterialLimit VoltageLimit Current
VA
Cu12–130.40
Ag120.40
Au150.30–0.40
W15–160.80–1.20
Ni140.40–0.50
Fe13–150.30–0.50
C200.01–0.02
Pt170.70–1.10
Pd15–160.80–0.90
Table 2. Parameters of electronic circuit elements intended for reading the signal from the photodiode (own elaboration).
Circuit ComponentValue
R150 kΩ
R210 kΩ
R310 kΩ
C115 pF
C210 µF
C310 µF
C4100 nF
C5100 nF
Table 3. Maximum values of measured arc parameters (own elaboration).
pEa(max), Jta(max), ms
p1 = 1.00 × 10⁵ Pa1.558.00
p2 = 4.00 × 10⁻³ Pa0.506.00
Disclaimer/Publisher’s Note: The statements, opinions and data contained in all publications are solely those of the individual author(s) and contributor(s) and not of MDPI and/or the editor(s). MDPI and/or the editor(s) disclaim responsibility for any injury to people or property resulting from any ideas, methods, instructions or products referred to in the content.