Article

Numerical Study on Heat Transfer Efficiency and Inter-Layer Stress of Microchannel Heat Sinks with Different Geometries

1
School of Materials Science and Engineering, Xi’an University of Technology, Xi’an 710048, China
2
State Key Laboratory of Eco-Hydraulics in Northwest Arid Region of China, Xi’an University of Technology, Xi’an 710048, China
3
School of Materials Science and Engineering, Shenyang University of Technology, Shenyang 110870, China
*
Author to whom correspondence should be addressed.
Energies 2024, 17(20), 5076; https://doi.org/10.3390/en17205076
Submission received: 28 August 2024 / Revised: 8 October 2024 / Accepted: 10 October 2024 / Published: 12 October 2024
(This article belongs to the Special Issue Heat Transfer and Fluid Flows for Industry Applications)

Abstract

:
As electronics become more powerful and compact, laminated microchannel heat sinks (MCHSs) are essential for handling high heat flux. This study aims to optimize the MCHS design for improved heat dissipation and structural strength. An orthogonal experiment was established with the average surface temperature of the heat source as the evaluation metric, and the optimal structure was determined through simulation. Finally, cooling uniformity, fluidity, and performance evaluation criterion (PEC) analyses were carried out on the optimal structure. It was determined that the optimal combination was the triangular cavity microchannel (MCTC), with a microchannel width of 0.5 mm, a microchannel distribution density of 60%, and the presence of surface undulation on the microchannels. The result shows that the optimal structure’s peak inter-layer stress is just 34.8% of its longitudinal tensile strength. Compared to the traditional parallel straight microchannel (MCPS), this structure boasts an 8.6 K decrease in the average surface temperature and a temperature variation along specific paths that is only 9.9% of that in traditional designs. Moreover, the optimal design cuts the velocity loss at the microchannel entrance from 75% to 59%. Thus, this research successfully develops an effective optimization strategy for MCHSs.

1. Introduction

With the development of technology and industry, the integration of various electronic components is constantly improving. A typical example is the development of microelectronic components and micromachining techniques, which, in turn, has led to a significant increase in the number of transistors contained in each generation of electronic component chips [1]. Moore’s Law states that the number of transistors in electronic component chips will continue to double almost every 2 years. This increase in transistors has boosted the processing power of electronic chips but has also exacerbated heat dissipation and power consumption issues [2]. Over the past few decades, the heat generation of electronic components has risen to very high levels [3]. In order to ensure the normal use of the chip, it is necessary to remove the heat generated by it in time [4]. Therefore, urgent solutions are needed to address the heat dissipation problem of high-heat-flux components such as electronic chips. A substantial amount of research has been conducted on thermal management components for electronics, including studies on the actual working conditions and the effects of various cooling media. Faraji et al. [5] investigated the inclined rectangular enclosure filled with Nano-enhanced Phase Change Material (NePCM), and the results indicated that the introduction of metallic nanoparticles had a positive effect on reducing the temperature of the heat source. Faraji et al. [6] further analyzed the thermal and dynamic fluid flow for various enclosure inclinations (0°, 45°, and 90°) and Rayleigh numbers (Ra = 103–106), and established a quantitative analysis of the relationship between the inclination angle and the Rayleigh number on the heat transfer efficiency. Under this background, microchannel heat sinks (MCHSs) are increasingly being adopted.
Due to the high requirements for structural precision and strength in MCHSs, chemical etching and diffusion welding processes are often used in industry for the fabrication of MCHSs. Chemical etching significantly affects the surface formation quality of the workpiece [7], and the undulation formed by etching can impact the heat transfer performance and fluidity of the MCHS. Compared to connection methods such as electron beam welding and laser welding, diffusion welding has unique advantages such as fewer fusion welding defects, a smaller heat-affected zone, and minimal thermal deformation [8,9,10]. Shevchenko et al. [11] studied the strength of welded joints of 304 stainless steel under laser action, and Djeloud et al. [12] studied the residual stress during the welding of austenitic stainless steel. Ren et al. [13] investigated the influence of surface roughness on diffusion welding by using the Gleeble 3500 thermal simulation testing machine. The result showed that small surface roughness was beneficial for the bonding process. Therefore, in the fabrication of high-precision MCHSs, the existence of surface roughness and residual stress on the machined surface has a significant impact on the overall performance and structural strength of the MCHS [14,15,16].
In addition, the extremely small channel dimensions of MCHSs can significantly enhance their cooling performance, but, at this small scale, fluid flow is affected by scale effects. Therefore, it is necessary to study the impact of traditional theories on fluid flow at small scales. Tiselj et al. [17] and Gao et al. [18] studied the flow state of fluids on the basis of the microscale, and the basic fluid dynamics and traditional heat dissipation laws were basically applicable to the microchannels with a microchannel height greater than 0.4 mm. Li et al. [19] also confirmed that the continuum hypothesis theory was applicable to MCHSs. The overall performance of the MCHS mainly depends on the following three key metrics: the heat dissipation capacity, cooling uniformity, and pressure drop [20,21,22,23]. To optimize the MCHS performance, researchers are exploring ways to improve its structure [24]. Experimental and numerical research has been conducted on the heat dissipation and fluid flow performance of MCHSs. Wu et al. [25] measured the friction factor in the trapezoidal MCHS and confirmed the results. Naphon et al. [26] investigated the effects of various factors on the performance of the MCHS through experiments. The research findings suggest that surface roughness significantly impacts the performance of the MCHS, with a higher surface area and surface roughness leading to an increased heat transfer rate. Ghasemi et al. [27] utilized the Response Surface Methodology (RSM) to study the complex multi-factorial influences of channel dimensions and nanofluids. The results indicated that reducing the channel size while maintaining a certain number of channels can improve the overall heat transfer performance. Researchers Tran et al. [28] and Hasan et al. [29] performed numerical studies on the performance of MCHSs with different cross-sectional shapes. They found that the round microchannel has the best hydraulic performance. Ma et al. [30] studied the flow heat transfer characteristics of sawtooth microchannels, and the results showed that sawtooth microchannels could improve the heat transfer performance of MCHSs while increasing the pressure drop. Haertel et al. [31] studied the cross-section shape of the microchannel and designed a branch structure through topology optimization, which improved the performance of the traditional microchannel by 7%. Zeng et al. [32] proposed a novel optimization-inspired half-wave fin pattern, achieving a 10.5% reduction in pumping power compared to conventional fin structures at a heat flux of 50 W/cm2. In view of the many factors such as the wall shape, aspect ratio, surface roughness, and many other factors, relevant scholars have carried out research on multi-objective optimization. Zou et al. [33] performed the multi-objective optimization of the heat sink to evaluate its pressure drop and temperature. Their optimized structure had a performance evaluation criterion (PEC) of up to 1.67 compared to the conventional rectangular MCHS.
As can be seen from the above, optimizing the structure of the MCHS is an important means to improve its heat dissipation capacity, but how to maintain good fluidity is a problem that needs attention. In addition, it is necessary to study the thermal stress distribution in order to ensure that the high-precision MCHS has sufficient structural strength. In this study, a laminated MCHS was designed, and the influence of different microchannel structures on the heat transfer and stress distribution of the MCHS was studied. Taking the average surface temperature of the heat source as the evaluation metric, a four-factor orthogonal experiment was established with the shape, width, distribution density, and surface undulation of the microchannel as factors. The optimal structural combination was obtained by CFD numerical simulation using ANSYS Fluent v13.0 software. Furthermore, the thermal and mechanical coupling simulation was carried out with unidirectional coupling, and the thermal stress simulation of the structure before and after optimization was carried out to proofread the structural strength of the MCHS. Finally, analyzing the cooling uniformity, fluidity, and PEC of the optimized microchannel structure is crucial for understanding how different structural designs impact the microchannel’s performance.

2. Description of MCHS

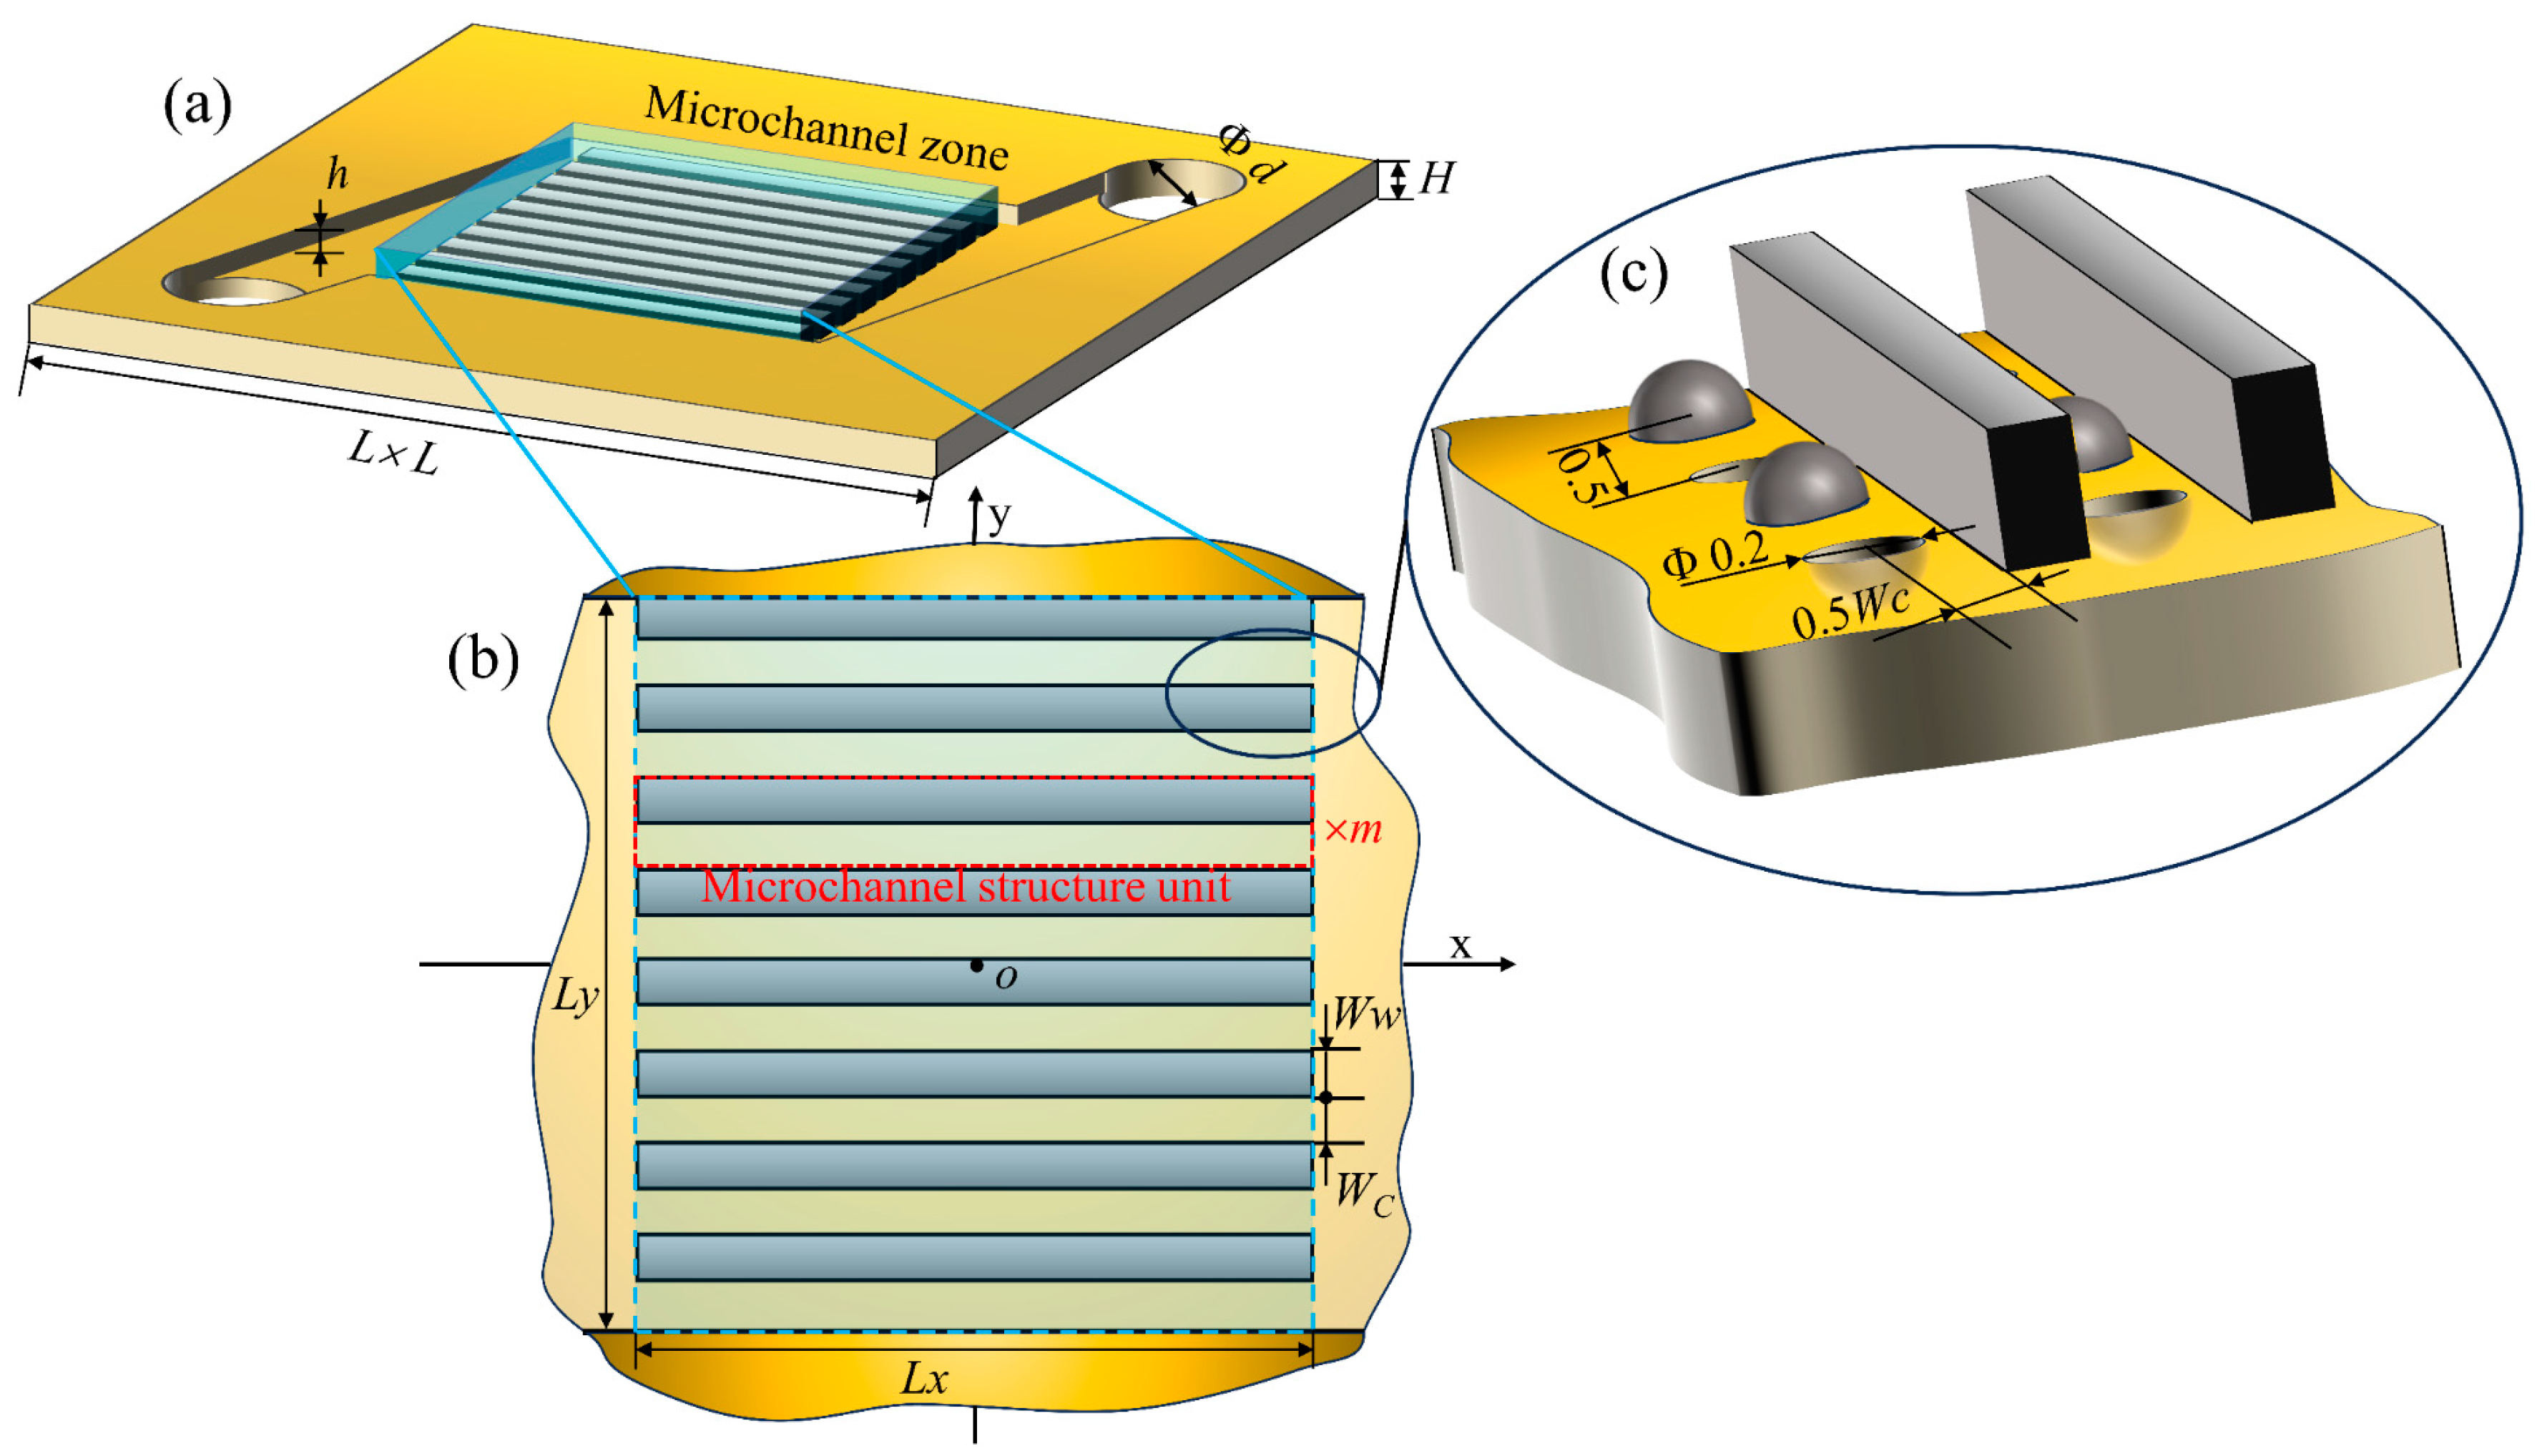
In this research, a new laminated microchannel heat sink (MCHS) was designed, as shown in Figure 1, which is composed of several 304 stainless steel metal plates of three types superimposed, namely, the upper cover, the lower cover, and the microchannel layer. The three types of metal plates were processed from the same specifications of sheet-like raw materials (side length, L = 80 mm; height, H = 2 mm). In this MCHS, high-precision microchannels were prepared in the microchannel layer by the chemical etching process, and several metal plates were superposed into a whole by the diffusion welding process. The size diagram of the microchannel layer is shown in Figure 2.
The unique feature of this design is that the three types of metal plates can be arbitrarily stacked in n layers until the desired thickness or performance requirements are achieved. This greatly saves the cost of the MCHS preparation and reduces the waste of raw materials, while reserving the possibility for subsequent customization. In order to simplify the analysis process and obtain the general conclusion, a piece of each type of thin plate was taken from the laminated structure used in this paper. Specifically, the through-hole diameter of the upper cover and the lower cover is d = 12 mm, which consistent with that of the microchannel layer, as shown in Figure 2a; the height of the fluid domain in the microchannel layer is h = 1 mm, and a microchannel zone was designed in the center of the layer, as shown in Figure 2b; the length and width of the microchannel zone are Lx = 20 mm and Ly = 40 mm, respectively, and are composed of m microchannel structural units arranged periodically; each microchannel structural unit is composed of a sidewall with a width of Ww and a microchannel with a width of Wc. In addition, in order to further explore the influence of microchannel machining roughness on the overall performance, this study designed surface undulation, as shown in Figure 2c. The microchannel is periodically arranged with protruding or concave hemispheres, wherein the diameter of the hemispheres is 0.2 mm, the distance between the spherical center is 0.5 mm, and the distance between the spherical center and the sidewall is 0.5Wc.
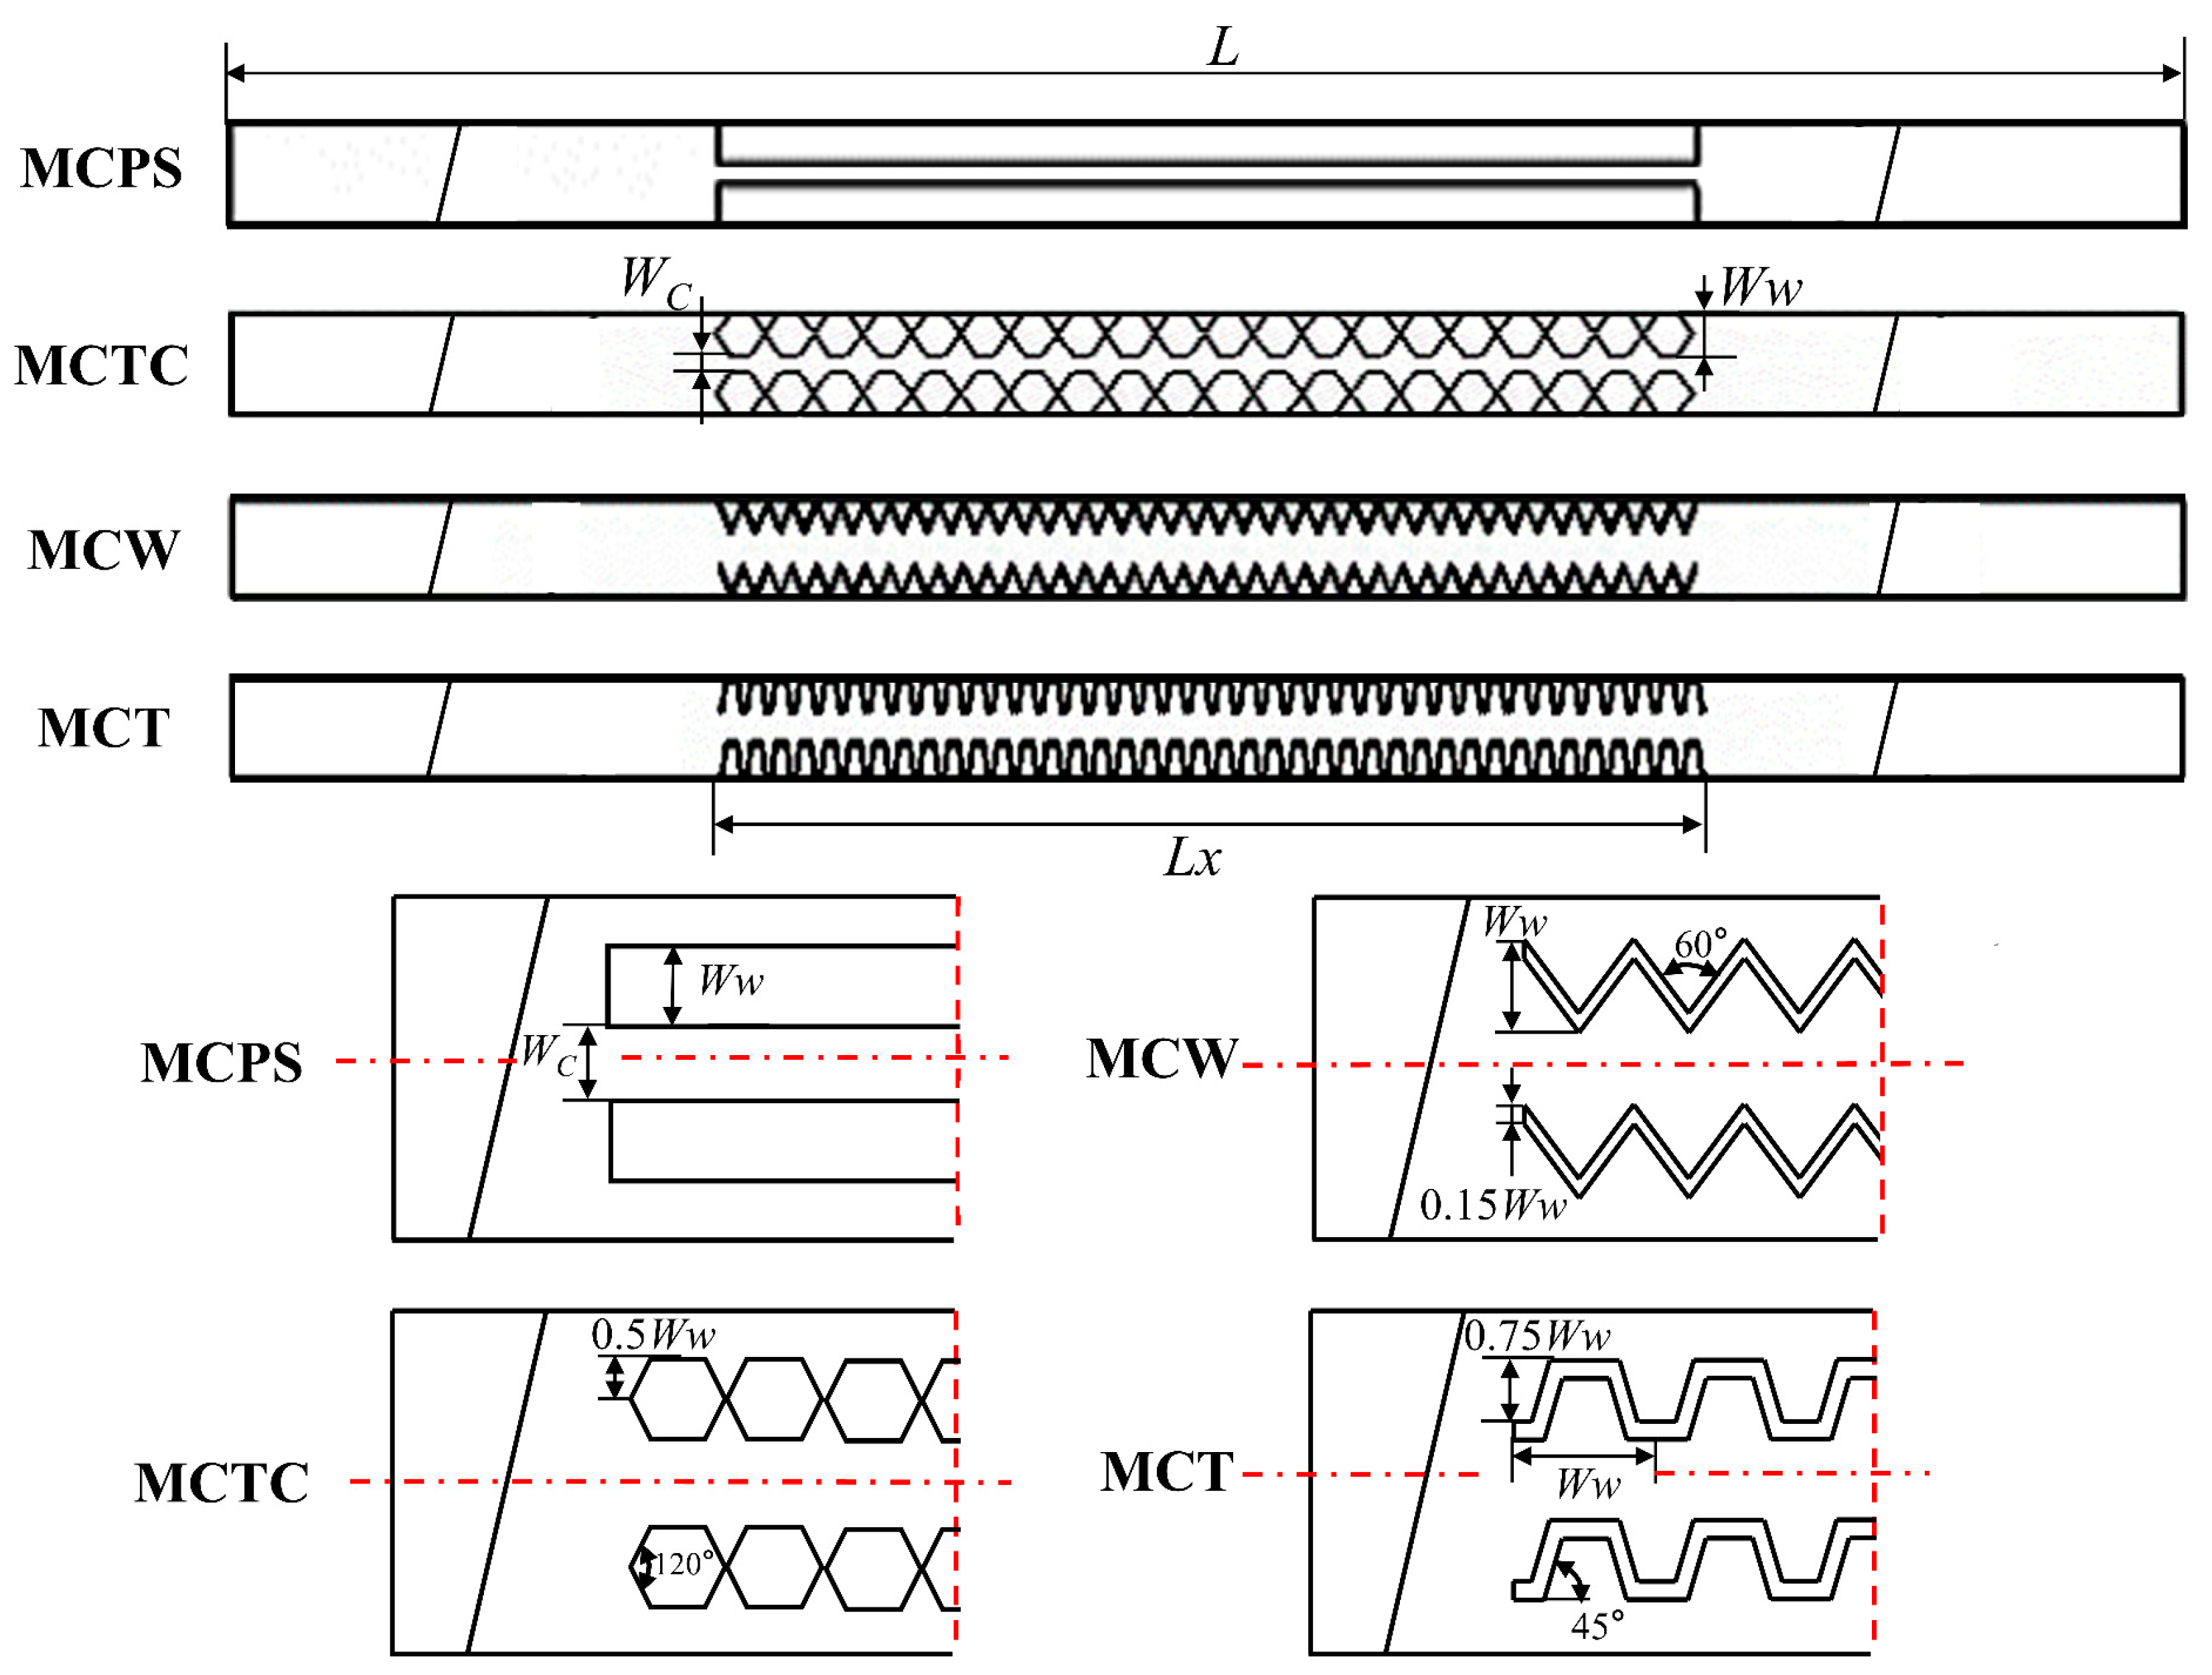
Finally, considering the difficulty of processing and the relatively mature existing design schemes, four microchannel structures were designed in this study, namely, the parallel straight microchannel (MCPS), triangular cavity microchannel (MCTC), wavy microchannel (MCW), and trapezoidal microchannel (MCT). Microchannels with different structures were compared and analyzed to explore the mechanism of their influence on the heat transfer performance and the structural strength of the MCHS. The four types of microchannel structures and their detailed parameters are shown in Figure 3. The geometric parameters described above are shown in Table 1. In this MCHS, the metal plate is 304 stainless steel and the cooling medium is deionized water. Their physical properties are listed in Table 2.

3. Numerical Model Development

In order to construct a robust numerical setting, the governing equations and convergence criteria were numerically simulated using the relevant literature. At the same time, grid partitioning needed to take into account the computational efficiency and accuracy, and match the reasonable boundary conditions with them. See Section 4.2 for the relevant models and the settings of the stress numerical calculation. In this section, the governing equations, mesh models, and numerical setup of the heat flow coupling simulation are briefly introduced.

3.1. Governing Equations

In order to explore the heat transfer and flow law of the MCHS, the following assumptions are made in this calculation model:
(1)
The flow is incompressible, laminar, and steady.
(2)
The effect of radiation heat transfer is ignored.
(3)
The physical property parameter of the material is constant.
(4)
The effects of gravity are ignored.
(5)
The effect of the viscous dissipation of the water flow is ignored (according to the criterion proposed by Xu et al. [36]).
The calculation equations for the MCHS consist of the continuity equation, Navier–Stokes equation, and energy equation [37]. For the fluid in the microchannel, the continuity equation, Navier–Stokes equation, and energy equation are shown in Equations (1), (2), and (3), respectively, while Equation (4) provides the energy equation of the solid of the MCHS [38], as follows:
V f = 0
ρ f C p f V f · T f = k f 2 T f
ρ f ( V f · V f ) = p f + μ f 2 V f
2 T s = 0

3.2. Boundary Conditions and Numerical Methods

The location of the MCHS-related boundary conditions is shown in Figure 1. For the numerical calculation in this paper, the inlet flow rate was 1.5 L/min (that is, the inlet flow rate was about 0.22 m/s and the Reynolds number was about 1600), the cooling medium (deionized water) temperature was 295 K, and heat source heat flux was 50 kW/m2.
For the inlet, a speed inlet was used, where a uniform velocity and constant temperature were adopted, as follows:
v = v i n = 0.22   m / s ,   T = T i n = 300   K
The outlet was set as the pressure outlet, and the pressure was zero. The near-wall treatment was set to the standard wall functions.
For the solid–fluid interfaces:
V = 0 ,   T = T s ,   k f T = k s T s
For the insulated walls of the heat sink:
k s T s = 0
For the top wall (heat source surface) of the heat sink:
q w = k s T s n = 50   kw / m 2
In this research, the diffusion welding process was used to connect multi-layer 304 stainless steel sheets, so the inter-layer heat transfer between the sheets is particularly considered in this paper. As shown in the shell area in Figure 1, the shell conduction in the Fluent model can be used for the inter-layer contact surface. The thickness of the shell was set to 50 μm, and the thermal conductivity of the shell was set to 80% of the 304 stainless steel. This article is based on numerical simulation using the commercial computational fluid dynamics (CFD) software ANSYS Fluent v13.0. The simulation employs the finite volume method for calculations based on the governing equations. The pressure–velocity coupling was achieved using the standard SIMPLE (Semi-Implicit Method for Pressure-Linked Equations) algorithm. The comparison between numerical values and experimental results is shown in Section 3.4.

3.3. Data Acquisition

The evaluation of the heat transfer capacity and fluidity of the MCHS mainly includes the following important indicators.
The Reynolds number (Re) can be expressed as follows:
R e = ρ f u i n D h μ f
The PEC is capable of assessing the comprehensive performance of the MCHS. It is a quantity related to the Nusselt number (Nu) and the friction factor (f). The Nusselt number is associated with the average heat transfer coefficient (hm). The calculation formulae for the aforementioned variables are as follows [39]:
h m = q w A q A w ( T w T m )
T m = T i n + T o u t 2
N u = h m D h k f
f = 2 Δ P D h ρ f u i n 2 L
P E C = ( N u / N u 0 ) ( f / f 0 ) 3
The pressure drop (ΔP) is the difference between the inlet and outlet pressures of a fluid and can be expressed as follows:
Δ P = P i n P o u t
In addition, in order to study the influence of the number of microchannels on the comprehensive performance of the MCHS, this paper defines the distribution density of microchannels α, which is calculated with the following formula, while the definitions of m, Wc, and Ly in the formula are shown in Figure 2:
α = m W c / L y

3.4. Mesh Generation and Sensitivity

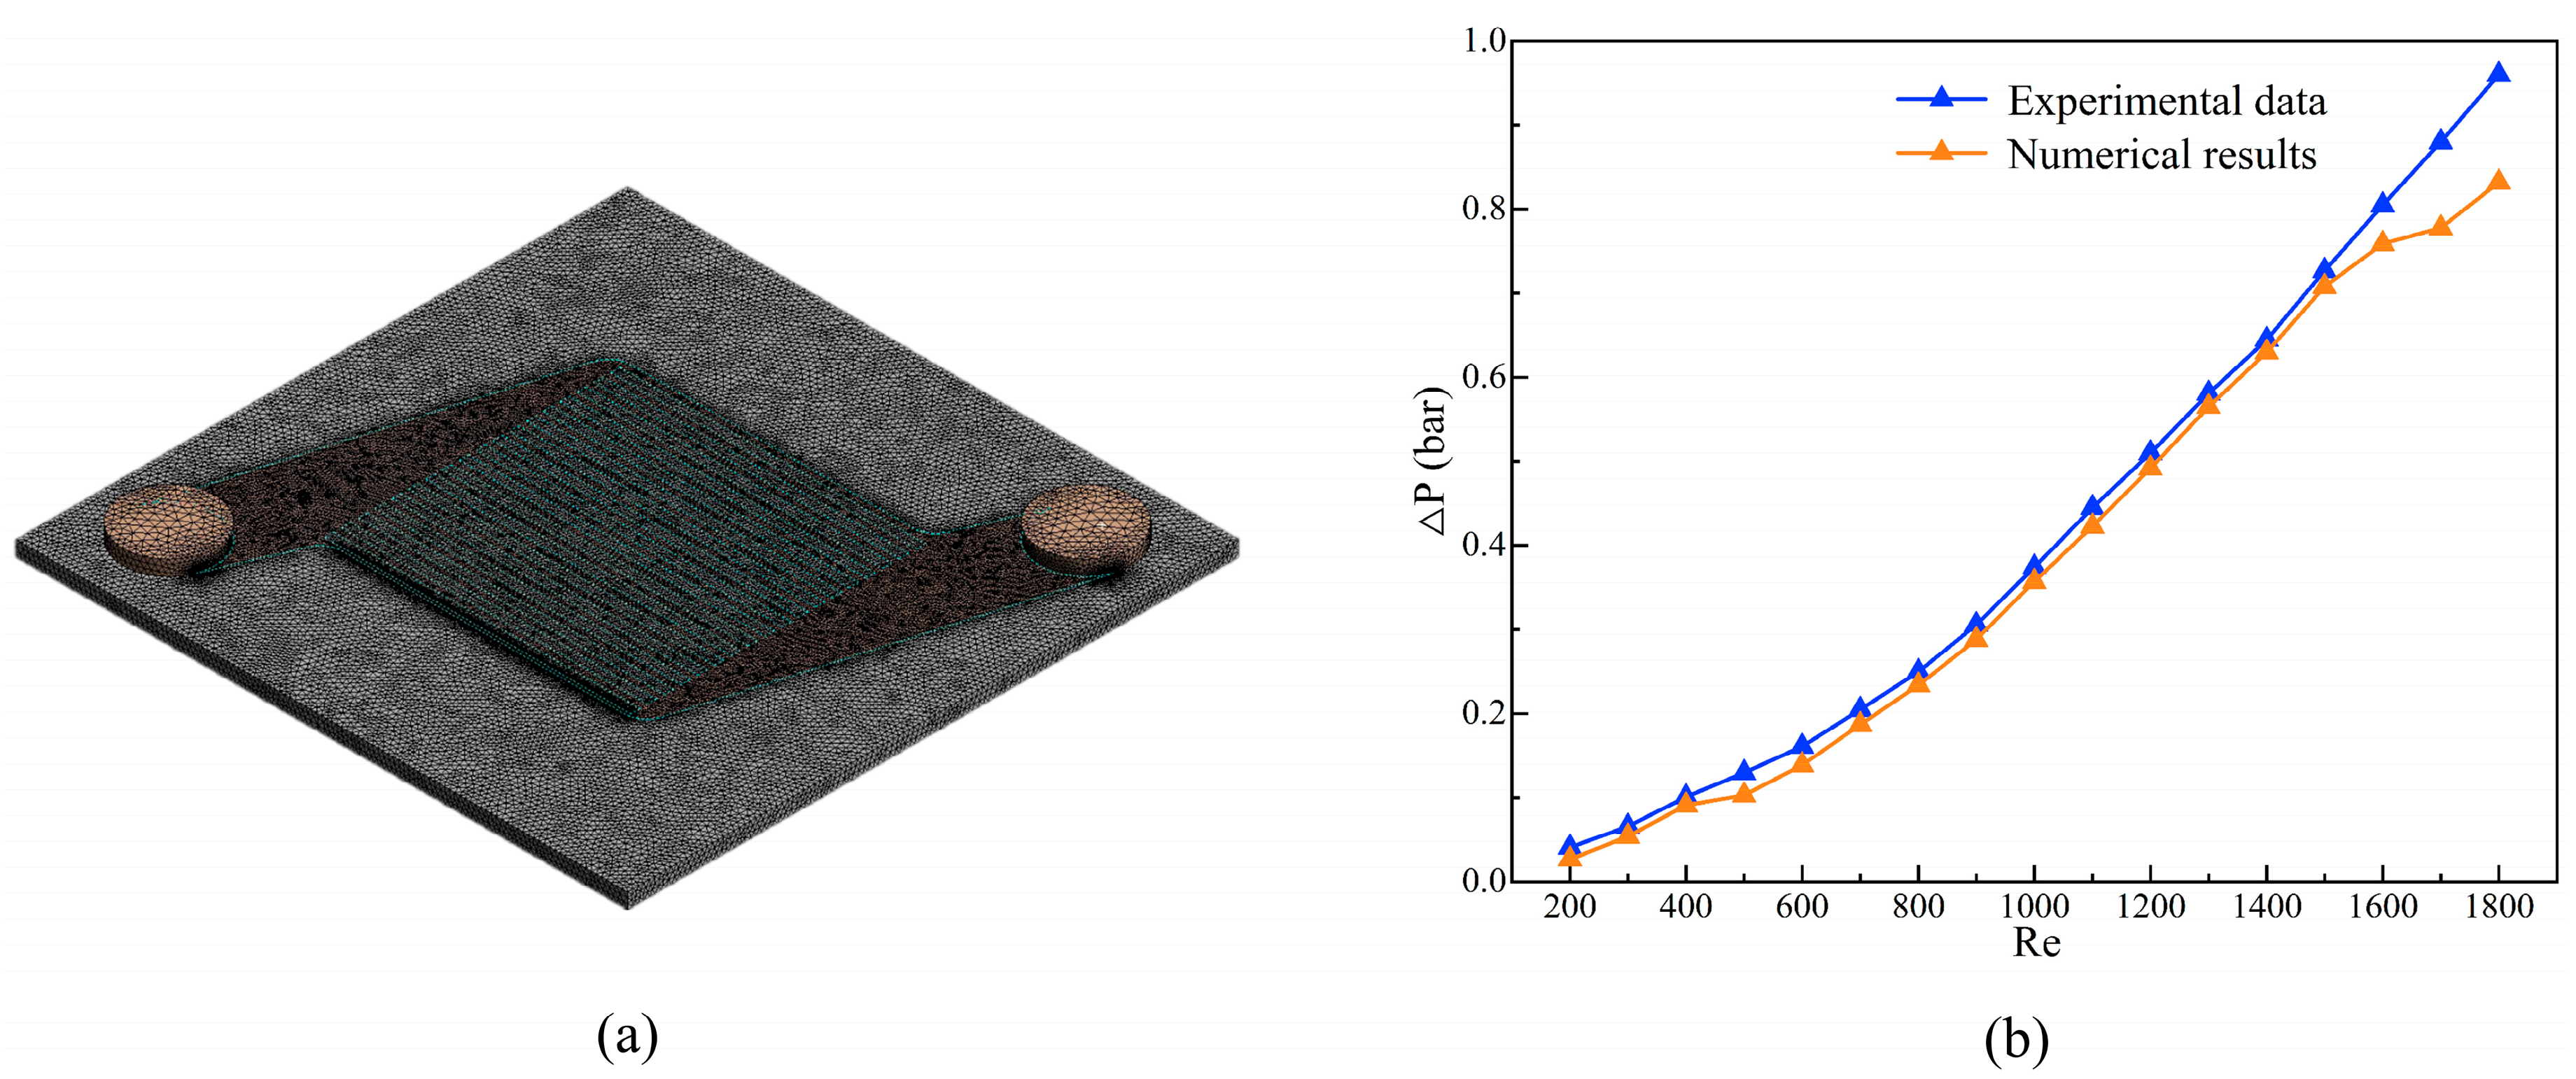
In order to balance the accuracy and efficiency of the numerical calculation, the grid independence was tested firstly. The mesh for both the fluid domain and the solid domain was generated using ANSYS v13.0 software. The boundary layer mesh was specifically used to refine the area near the wall within the fluid domain, and a typical mesh partitioning result is shown in Figure 4a. With the pressure drop selected as the evaluation metric of the preferred grid, an intensive grid independence test was conducted for all structures. Taking the MCPS structure as an example, the inlet and outlet pressure drop errors obtained by the simulation of the fluid inlet velocity of 0.3 m/s and the grid number of 0.83 million, 1.12 million, 1.34 million, and 1.87 million are 6.21%, 1.33%, and 0.62%, respectively. Therefore, considering the required accuracy and calculation cost, the number of grids was finally selected as 1.34 million for the numerical simulation. Similarly, the grid number of the other three structures was obtained. Table 3 shows detailed information for the grid number of each structure. The numerical results in this study are compared with the experimental data of Qu [40], and the pressure drop calculation formula used in Equation (15) is used as the evaluation metric. The same initial and boundary conditions were set. The final numerical results and experimental data are shown in Figure 4b, and it can be seen that the simulation and experiment have a good matching degree.

4. Results and Discussion

4.1. Structure of Optimal Heat Dissipation Capacity in Orthogonal Experiment

4.1.1. Orthogonal Experiment and Data Processing

This section mainly explores the influence of different structures on the surface average temperature of the new MCHS. In actual production activities, a high temperature will destroy the performance of the equipment, so the average surface temperature of the MCHS is an important evaluation metric to measure its performance. Because of the complex structure of the MCHS, there are many structural factors that affect its comprehensive performance. In order to ensure the reliability of the results and reduce the number of tests, the orthogonal experiment method was used in this study. The orthogonal experimental design and analysis method is often used in process optimization and analysis, and is the main method used in local factor optimization design.
Taking the average temperature of the surface of the heat source as the evaluation metric, the four-factor orthogonal experiment was established in this study. The relevant model dimensions are selected from Section 2. Four factors were selected, such as the microchannel width, microchannel shape, microchannel distribution density, and surface undulation, and the letters “A”, “B”, “C”, and “D” were used; factor A, factor B, and factor C were set at four levels, while factor D was set at two levels. A total of 16 experiments were performed using an orthogonal table at the five factors and four levels, L16 (45); finally, the L16 (4321) mixed orthogonal experimental table was established. The relationship between the factors and levels is shown in Table 4, where factor B (microchannel width) is Wc and factor C (distribution density, α) is calculated by Equation (16). The orthogonal experimental design scheme was obtained according to the orthogonal table, as shown in Table 5. In order to facilitate the subsequent analysis of the influence of the level of each factor on the evaluation metric, this study used the following methods when conducting the simulation analysis: horizontal scales corresponding to the microchannel shape, the microchannel width, the distribution density, and the surface undulation, denoted as elements such as Ai, Bi, Ci, Di, etc., where i = (1, 2, 3, 4).
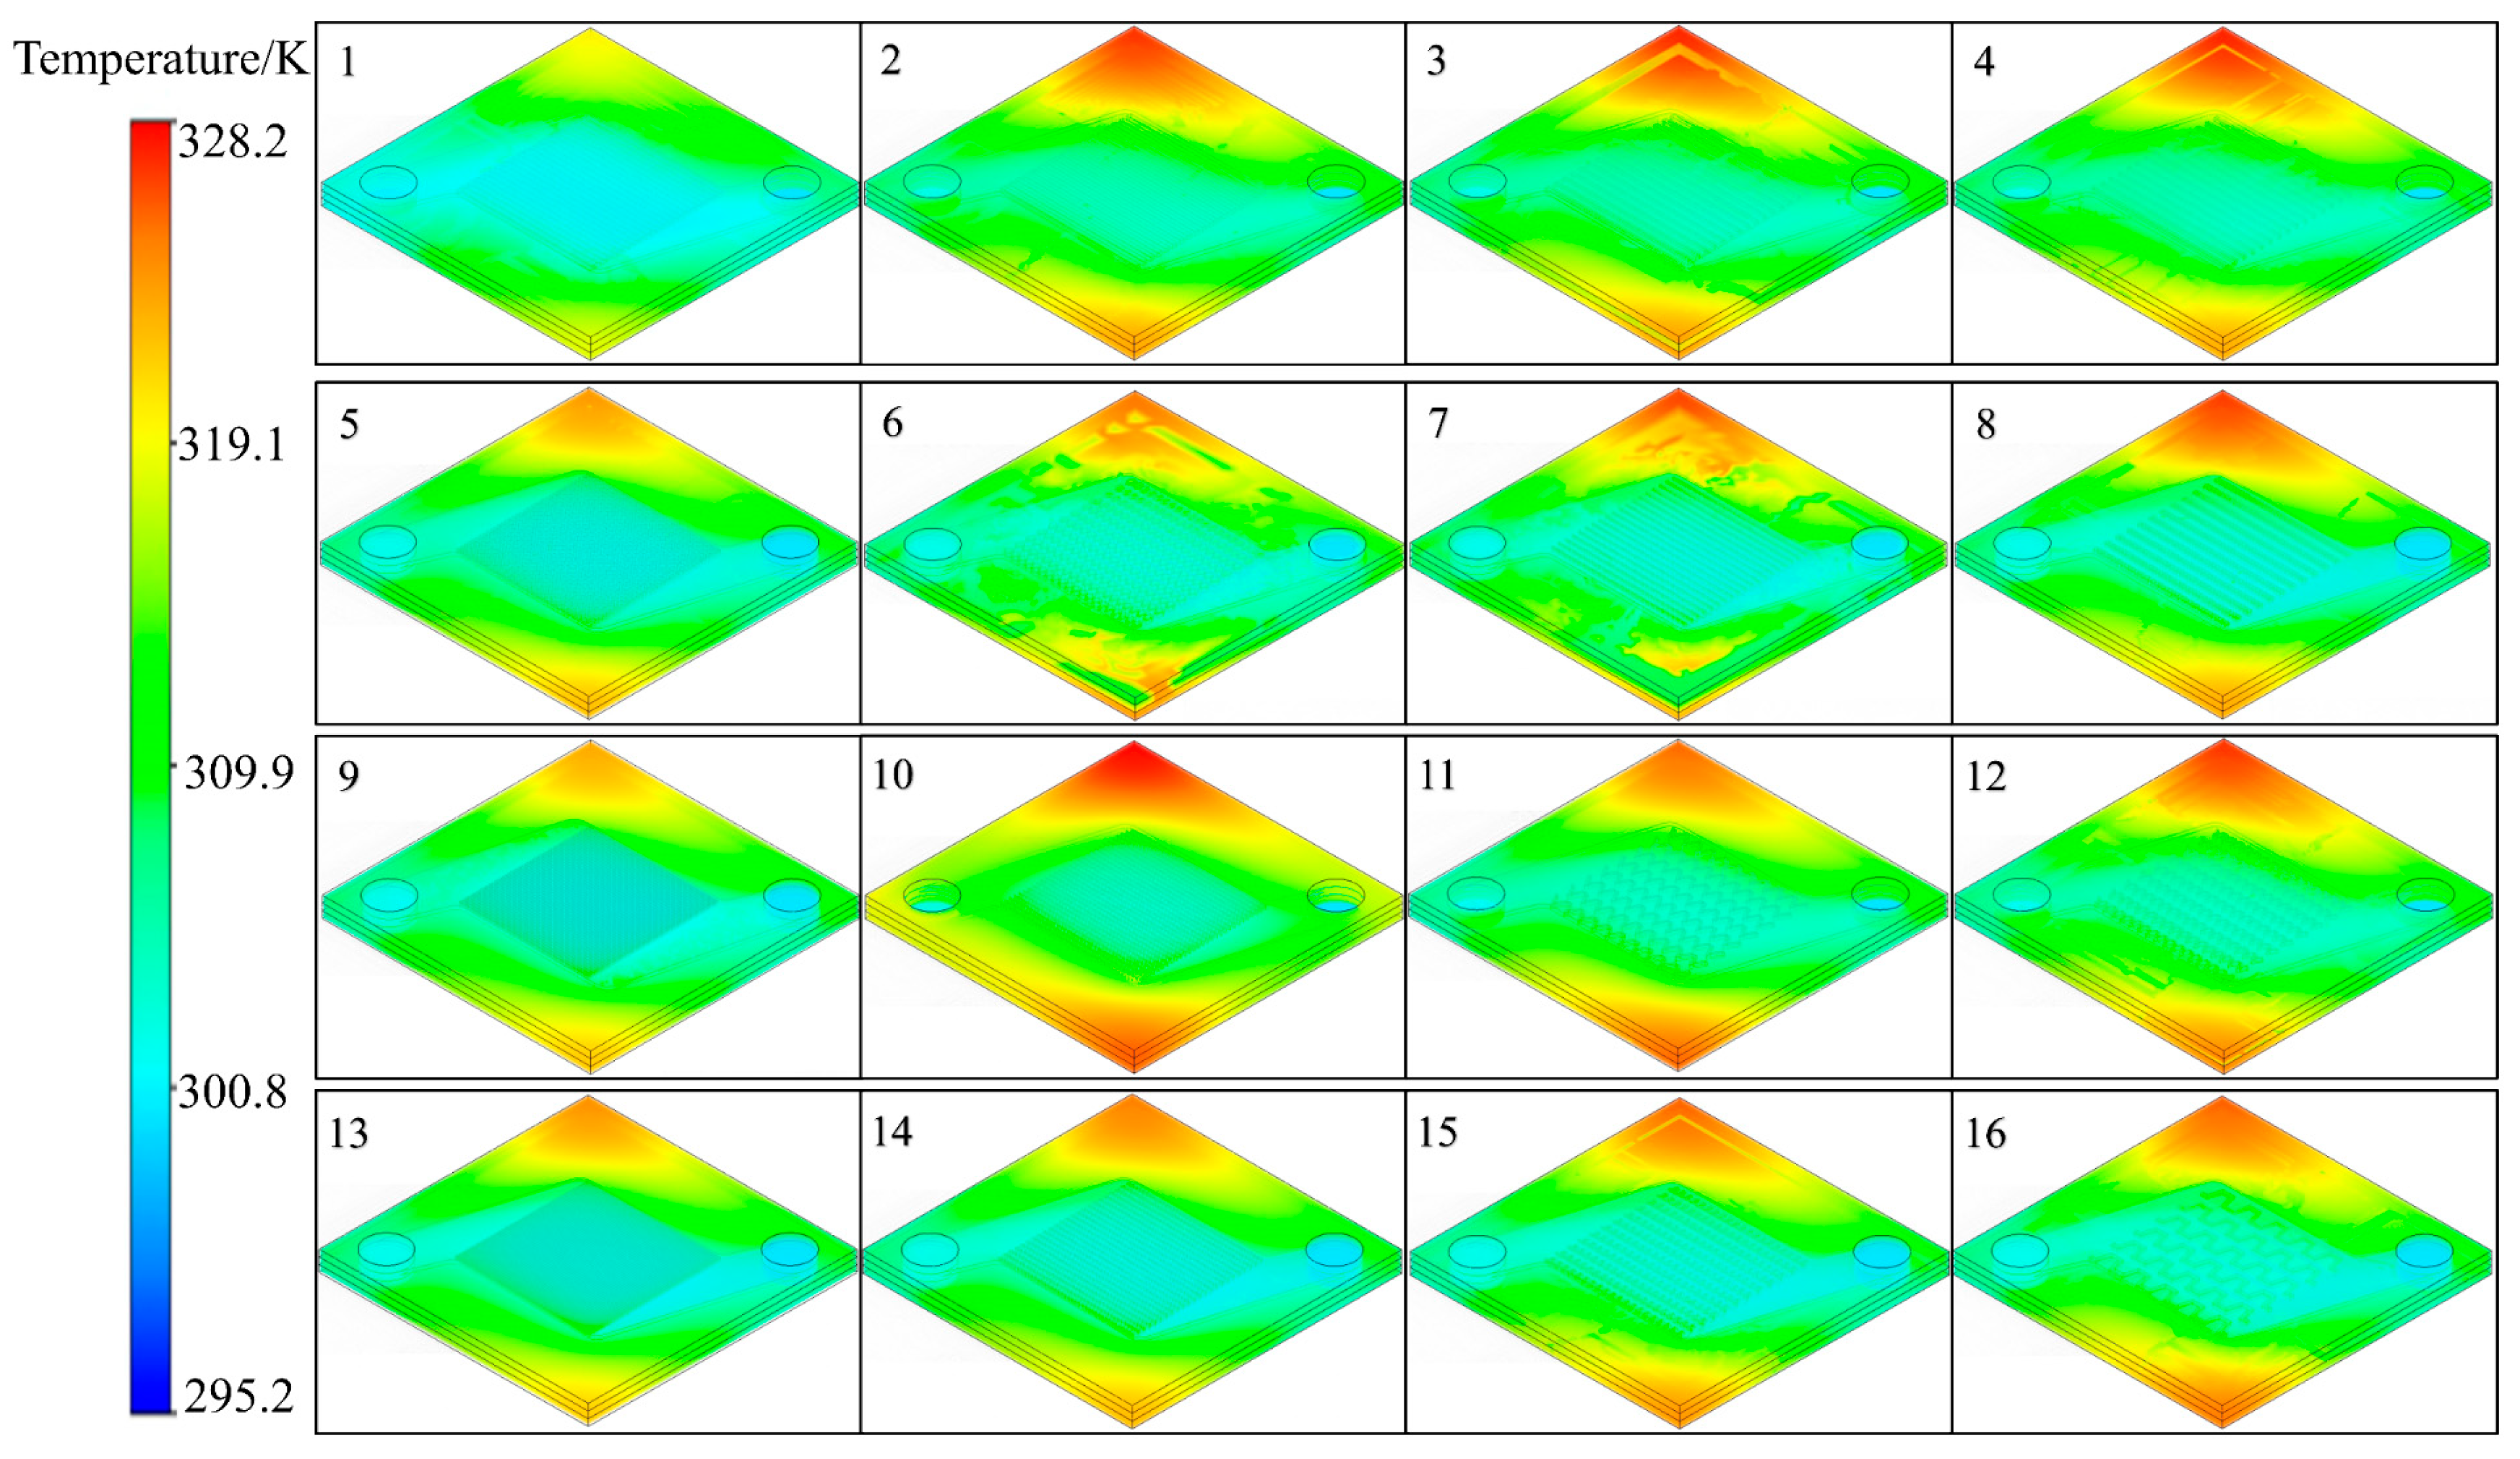
The boundary conditions in Section 3.2 were used for the numerical simulation, the average surface temperatures of the 16 groups of the orthogonal experiments are shown in Table 6, and the temperature contour obtained by the simulation is shown in Figure 5. The average surface temperature of test 14 was the lowest, which was 306.8 K. The average surface temperature of the microchannel model in test 3 was the highest at 312.5 K.
To process the data obtained from the orthogonal experiment, the A factor (microchannel shape) for one level was taken as an example, and the main formula used is as follows:
K A 1 = x 1 + x 2 + x 3 + x 4
k A 1 = ( x 1 + x 2 + x 3 + x 4 ) / 4
Kj is the sum of the average surface temperature of the heat source at the same level in a factor. Take the A-factor (microchannel shape) as an example, where j = (A1, A2, A3, A4); let xi be the value of the experimental evaluation metric (the average surface temperature of the heat source) corresponding to the factor level; kj is the average of the experimental evaluation metric at the same level in a factor. According to the above calculation method, the Kj and kj values are shown in Table 7.

4.1.2. Range Analysis

The range is denoted by the letter R, and the larger the value of R, the more obvious the influence of the factor on the evaluation metric. Range analysis can be used to determine the main and secondary order of the influence of each factor on the evaluation metric. As the mixed orthogonal experimental table is used in this study, R is corrected and calculated. The calculation formulae of range R and the corrected range R′ are shown in Equations (19) and (20), respectively, where D is the conversion coefficient; when the factor level numbers are two and four, D is 0.71 and 0.45, respectively; r is the number of repetitions of each level of the factor.
R = max ( k i ) min ( k i )
R = D R r
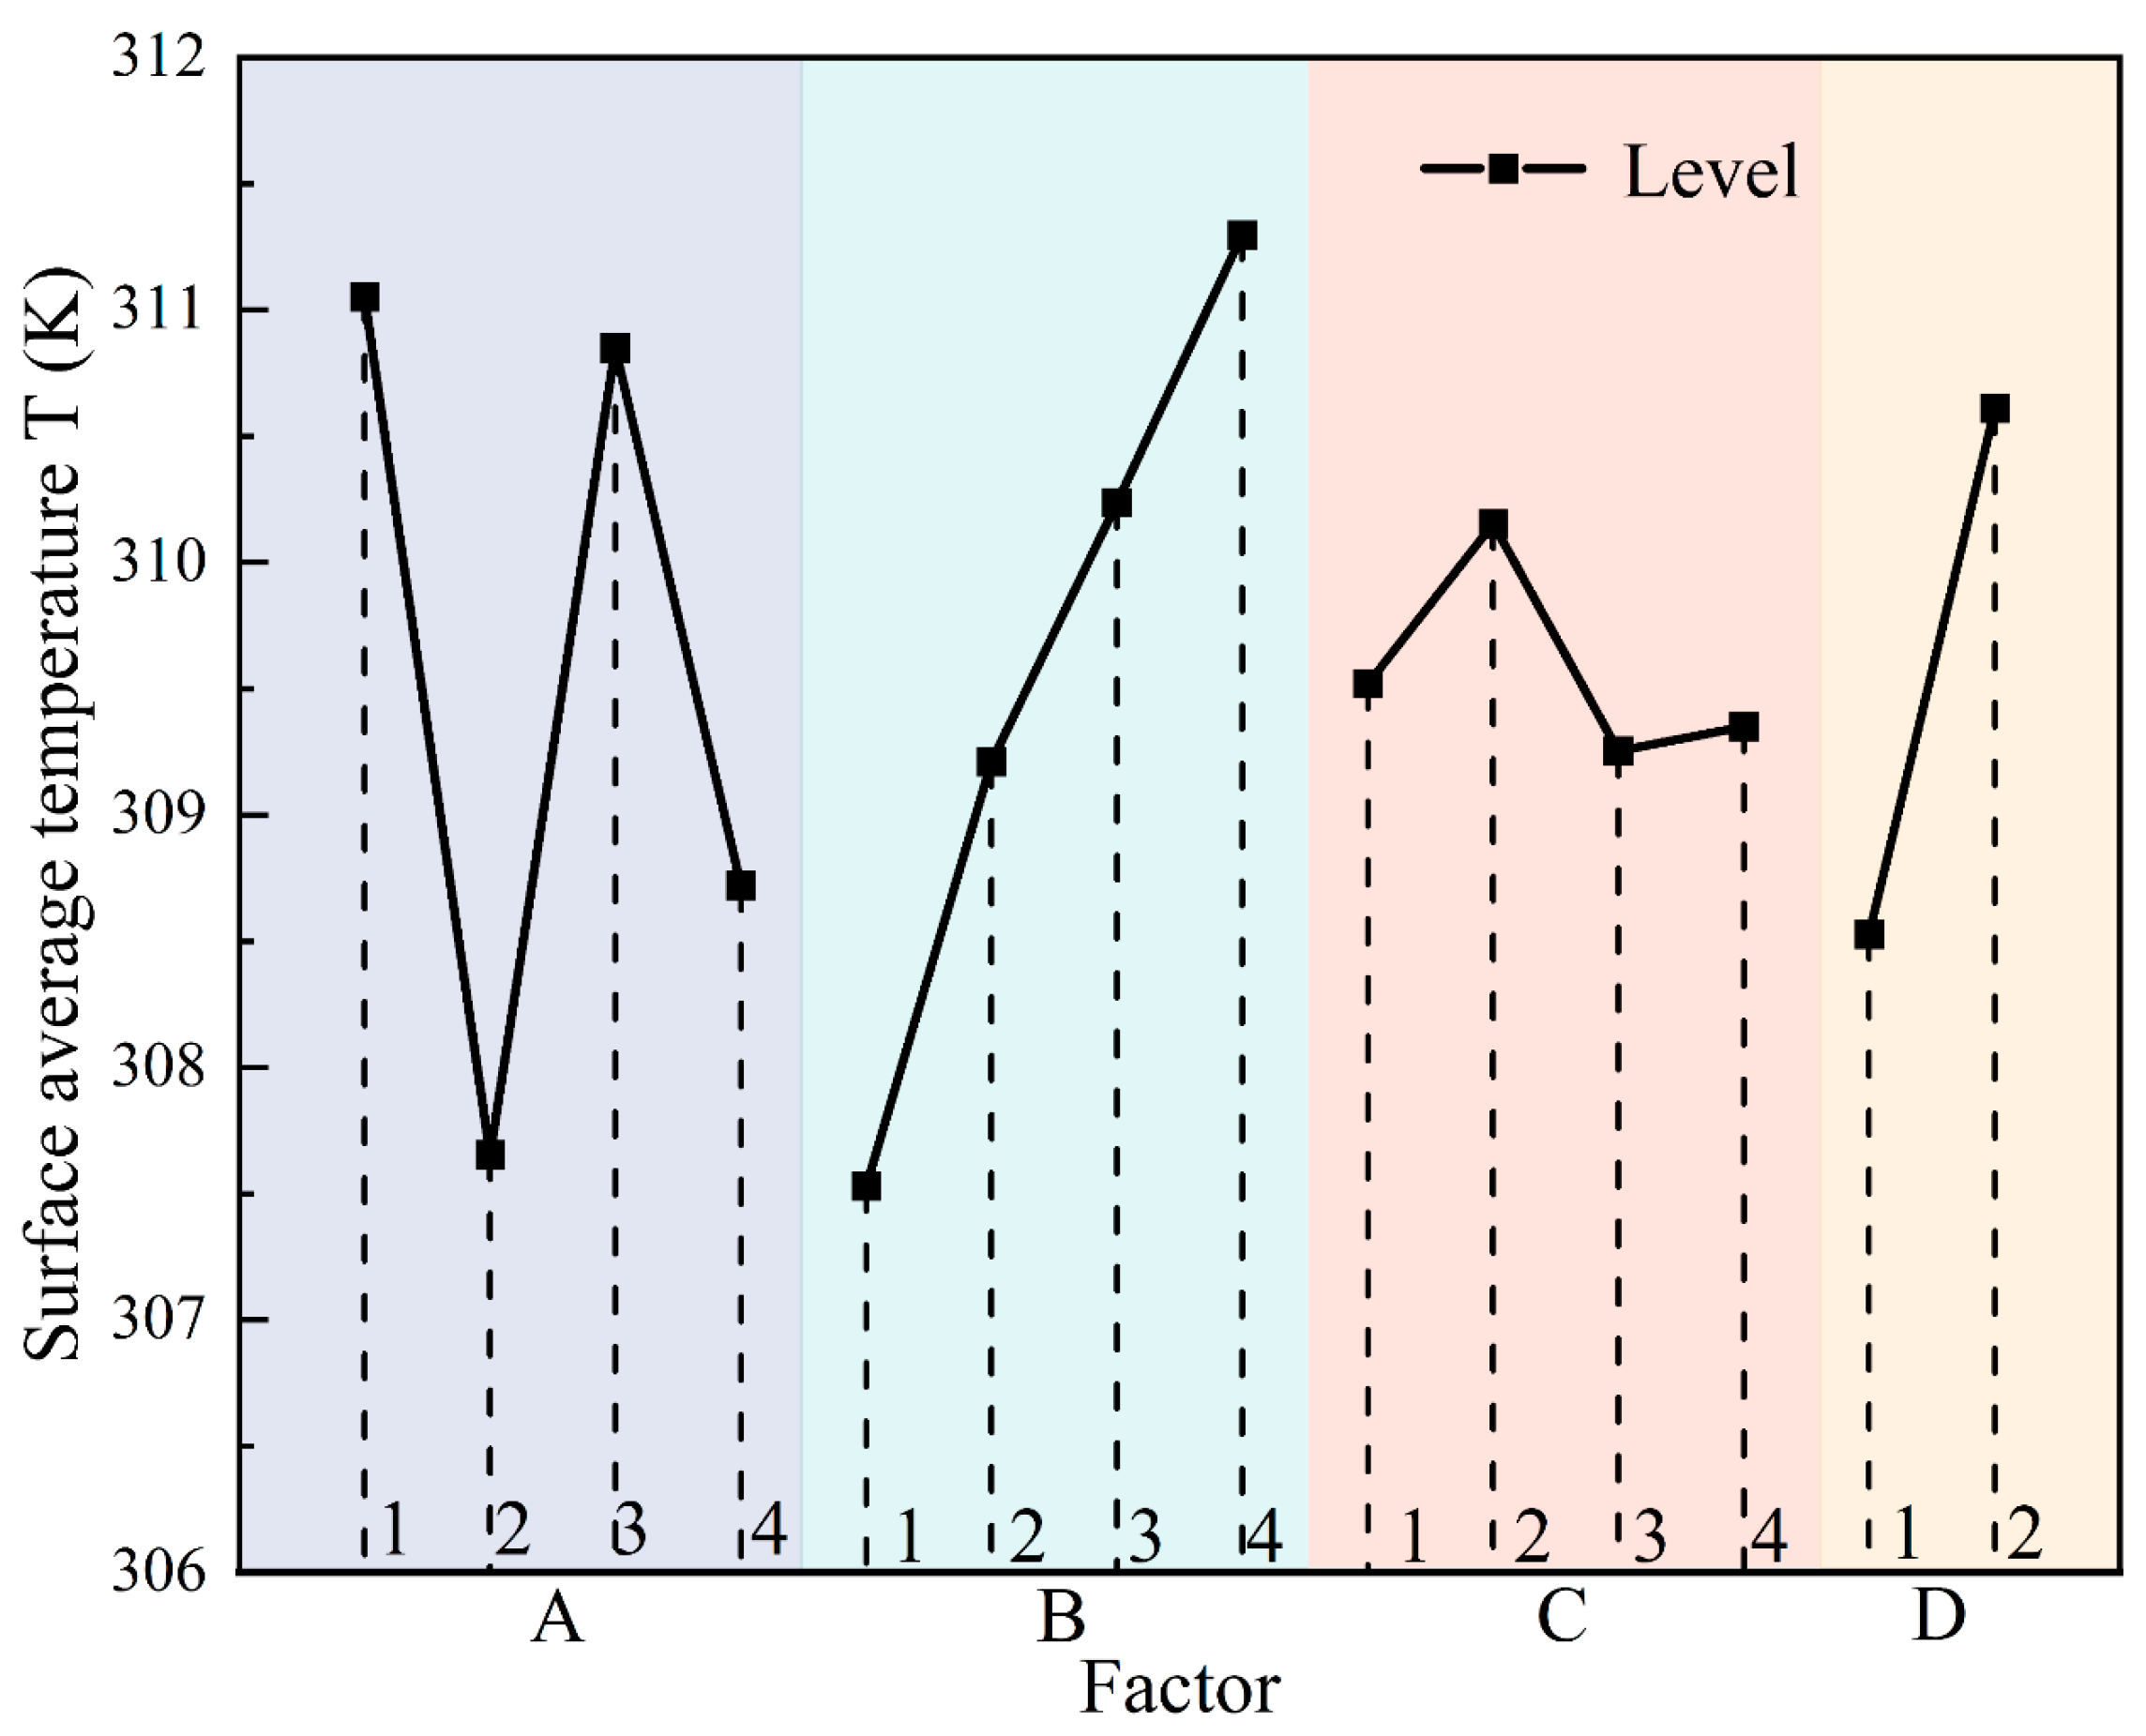
By combining Equations (19) and (20) and the ki values in Table 7, the R′ values of factors A, B, C, and D can be calculated as 3.89, 3.39, 1.10, and 3.05, respectively. By comparing the above calculated R′ values, we can obtain RA > RB > RD > RC, where, for each factor, the order of impact on the metrics is A > B > D > C. That is, for the microchannel shape (factor A) pairs, the influence of the evaluation metric is the greatest, and the influence of the microchannel width (factor B) and surface undulation (factor D) on the evaluation metric decreases sequentially, and the distribution density (factor C) has the least influence. Since the evaluation metric is the average surface temperature of the heat source, it can be seen from Table 7 that KA2 < KA4 < KA1 < KA3; therefore, it can be concluded that A2 is the optimal level of factor A. In the same way, B1, C3, and D1 can be obtained as the optimal levels of B, C, and D, respectively. Table 8 shows information about the range analysis, the order of primary and secondary differences, and the optimal combination.
By comparing the results obtained from the orthogonal experiment, this study takes the factor as the horizontal coordinate and the average of the evaluation metric corresponding to the factor level as the ordinate, and draws the relationship between the level and the evaluation metric, as shown in Figure 6. From Figure 6, the change trend for the indicators of various factors at different levels can be clearly seen. Taking the average surface temperature of the heat source as the evaluation metric, the optimal level combination obtained is A2B1C3D1. A verification experiment, test 17, was further set for the optimal level combination. The test 17 temperature contour was obtained by using the same simulation model shown in Figure 7. Obviously, compared with the 16 groups of tests in Figure 6, test 17 under the optimal level combination has the lowest overall temperature. Specifically, the average surface temperature of the heat source in test 17 is only 303.7 K, which fully proves that the structure used by test 17 has a good heat dissipation capacity. Compared to the typical traditional parallel straight microchannel (MCPS) used in test 4, the average surface temperature of test 17 is reduced by 8.6 K. At the same time, among the 16 groups of test results shown in Table 6, test 10 has the worst heat dissipation capacity. Compared with the initial value (295 K), the average surface temperature of the heat source increases by 19.7 K, with a warming rate of about 6.69%. In contrast, the temperature rise in test 17 is only 8.7 K, and the temperature rise rate is about 2.96%. It can be seen that the optimized structural combination has a great impact on the heat dissipation capacity of the MCHS.
There are many reasons for the significant difference in the performance between test 10 and test 17. By comparing the level combination used by test 10 and test 17, and combining them with Figure 6, it can be found that the MCTC structure and narrow microchannel width greatly improve the heat transfer capacity of test 17. Specifically, although both the MCW and MCT structures have improved the heat transfer capability compared to the traditional MCPS structure, the MCTC remains the optimal solution in terms of structural design. This is because the grooves of the MCW and MCT are relatively wide compared to the MCTC, resulting in a reduction in the effective heat transfer area. This also indirectly proves that there is an optimal range for the area and shape of the grooved region. On the premise that the width of the microchannel is determined, increasing the distribution density of the microchannel can improve the overall heat transfer capacity to a certain extent, but the influence of this factor on the performance is weak. In addition, the analysis of factor D in Figure 6 shows that a surface with undulations can improve the heat transfer performance; that is, the excessive pursuit of machining accuracy to achieve an ideal machining plane may not be beneficial to the performance. This may be because the surface undulation increases the heat transfer area, and the slight disturbance to the fluid helps the internal heat exchange of the fluid, which improves the heat transfer efficiency while increasing the pressure drop. And the surface undulations could potentially enhance the heat transfer performance due to their analogous effect to triangular cavities, as will be discussed in Section 4.3.2 regarding the analysis of the triangular cavities. In summary, for the heat dissipation capacity, the optimal combination is the MCTC with a microchannel width of 0.5 mm, a microchannel distribution density of 60%, and the presence of surface undulation on the microchannels.

4.2. Stress Distribution Analysis

In view of the laminated structure of the MCHS, the stress distribution in the welded interface has an important effect on the overall performance of the structure; therefore, whether the maximum stress at the interface is less than a certain threshold is an important basis for judging whether the strength of the MCHS structure meets the requirements. Therefore, in this study, a thermal and mechanical coupling simulation was carried out using unidirectional coupling. For the MCHS, the stress mainly comes from the thermal stress caused by thermal strain, and the relevant material parameters of the 304 stainless steel are shown in Table 2. In mechanical numerical calculations, the von Mises yield criterion has been widely used in metal materials, and the equivalent stress is defined as Equation (21) in the three-dimensional principal stress space, as follows:
σ ¯ = 2 2 ( σ 1 σ 2 ) 2 + ( σ 2 σ 3 ) 2 + ( σ 3 σ 1 ) 2
where σ1, σ2, and σ3 are the principal stresses in three orthogonal directions. When the von Mises stress σ exceeds the yield limit of the material σs, plastic deformation will occur.
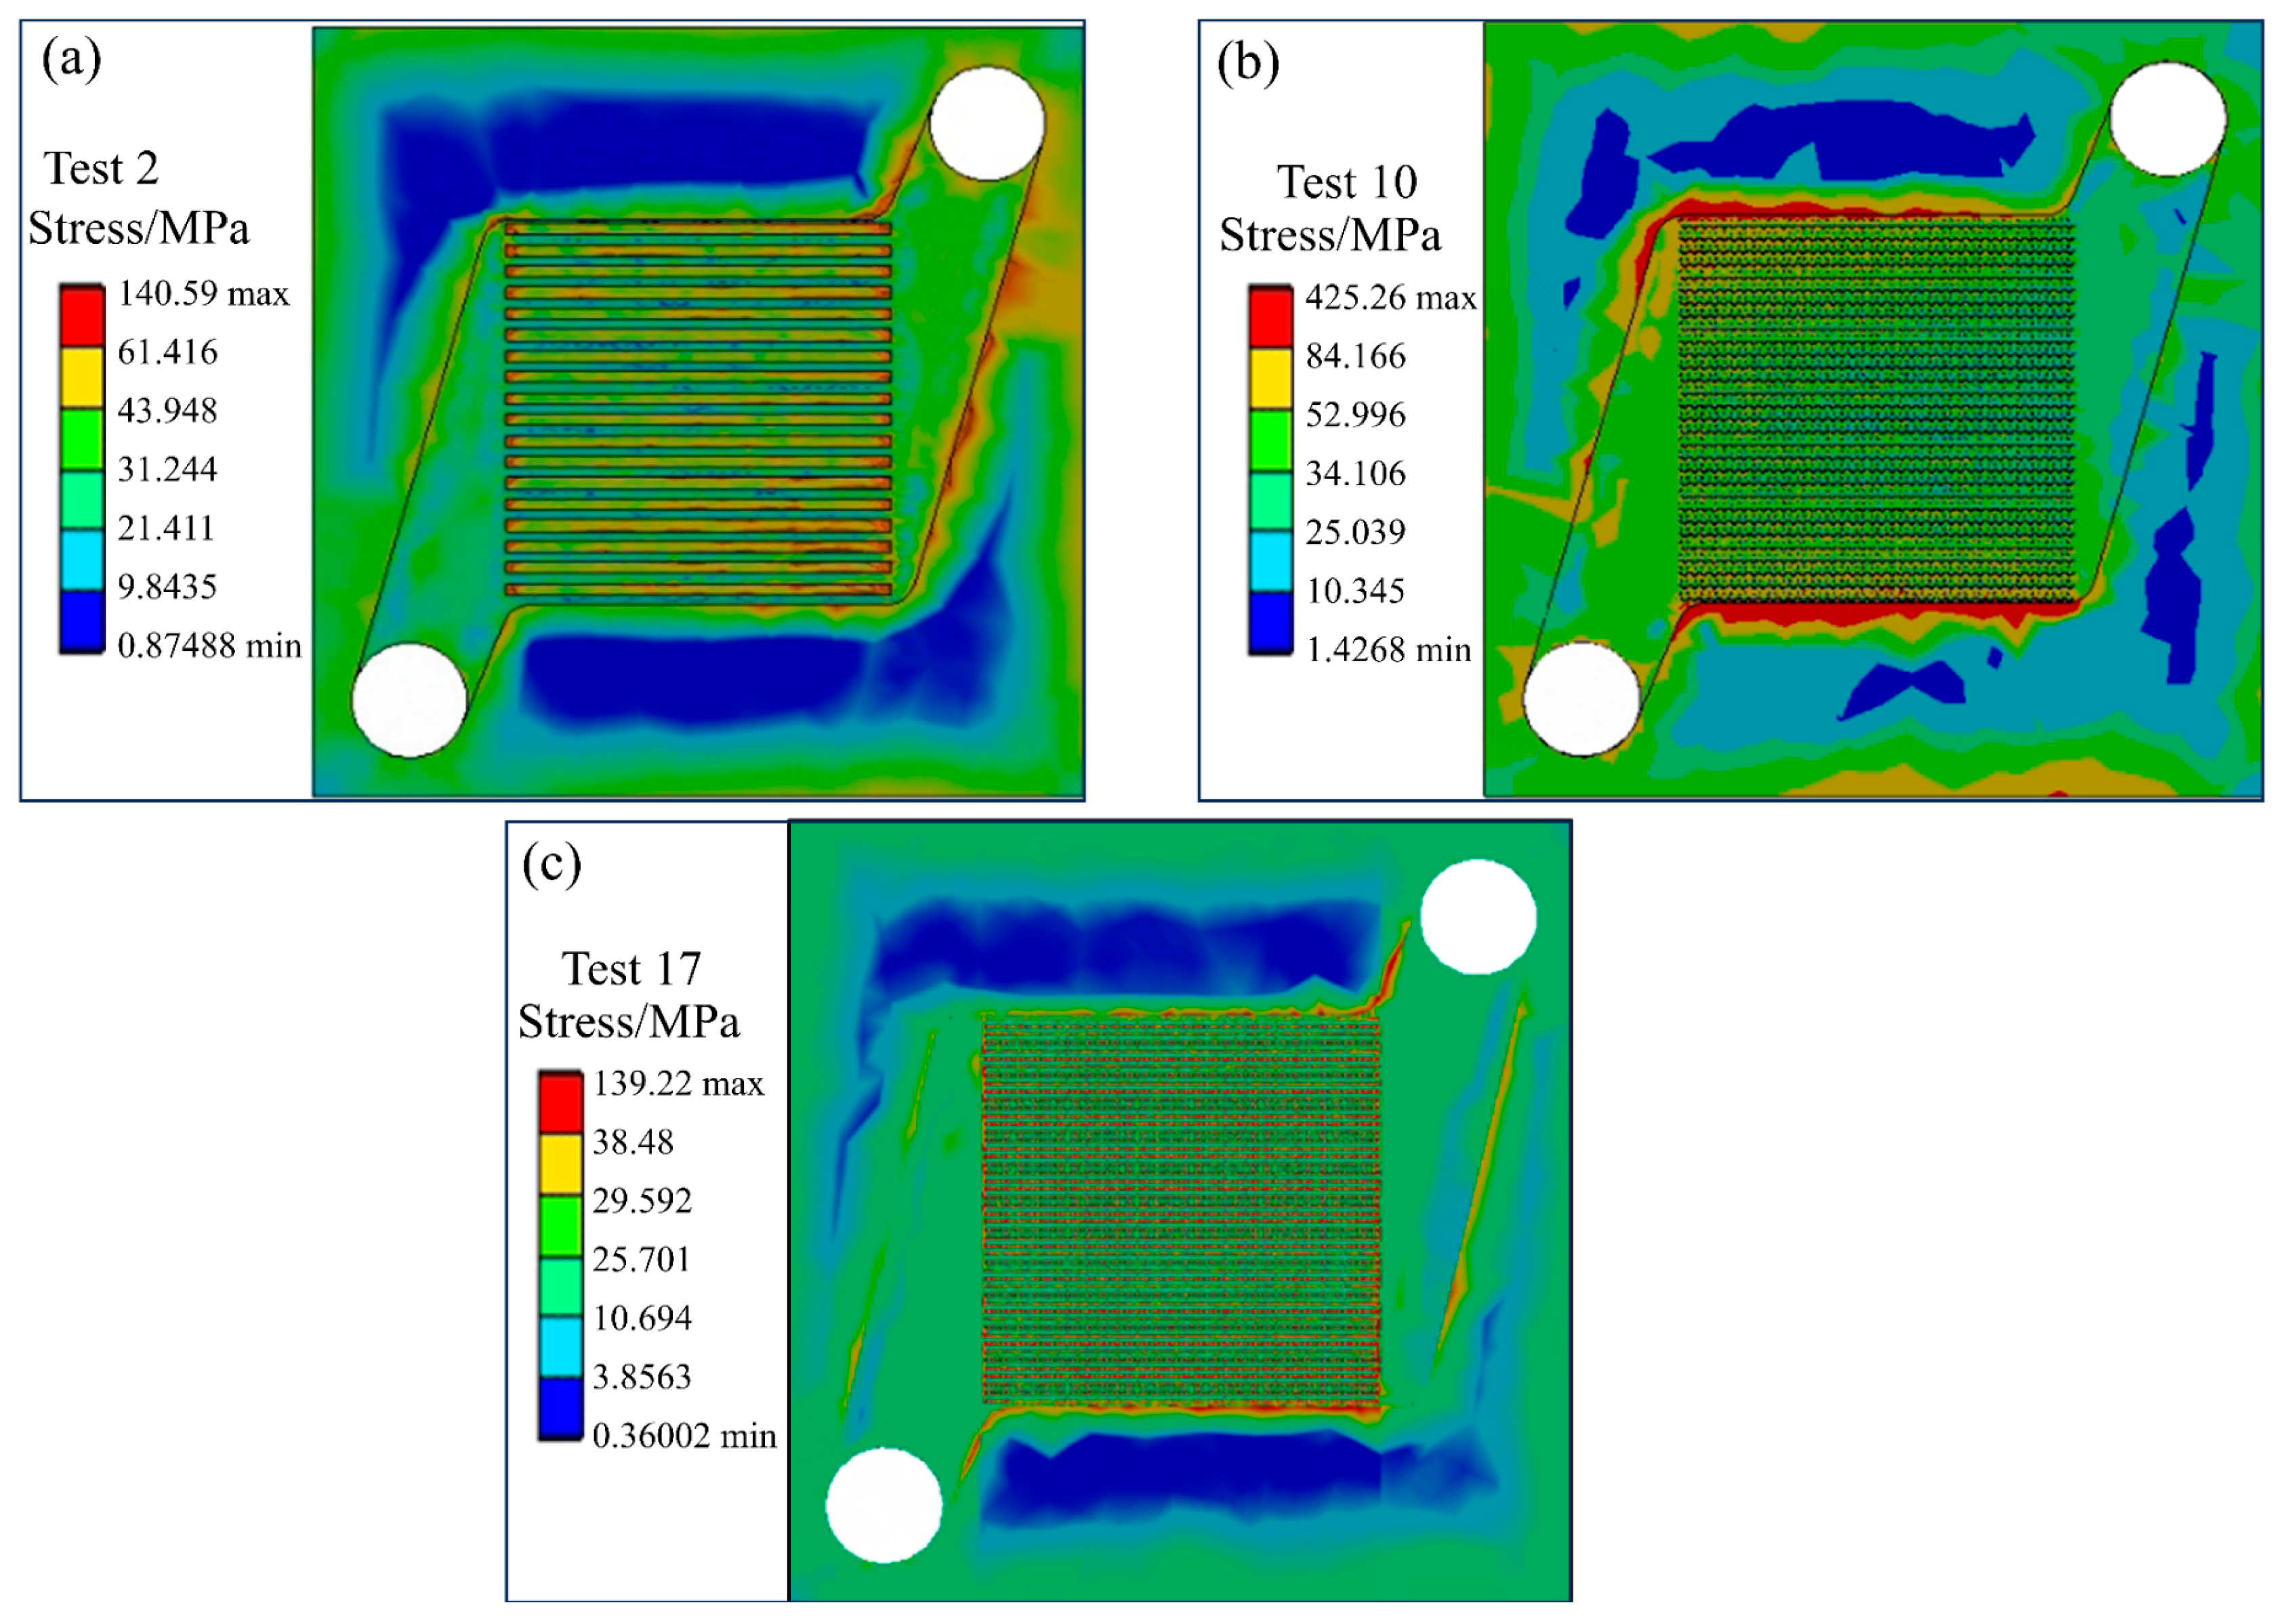
Based on the ANSYS v13.0 simulation software, the temperature field results calculated in Section 4.1 were imported into the stress analysis module as boundary conditions, and the surfaces of the upper and lower covers of the MCHS were fixed. The stress simulation of the 16 groups of orthogonal test models was carried out. Since the laminated structure often produces cracking failure between the layers, the stress distribution between the layers was mainly studied. The maximum inter-layer stress in each group of tests is shown in Table 9. As can be seen from Table 9, test 2 and test 10 have the minimum and maximum inter-layer stresses, respectively. The above stress analysis was then repeated for the optimal structure (test 17), and the maximum inter-layer stress is shown in Table 9. The influence of the structure on the stress distribution was analyzed by taking the stress simulation contour of test 2, test 10, and test 17 as examples. The inter-layer stress distribution contours of the three tests are shown in Figure 8.
The tensile strength of the laminated MCHS was analyzed as follows. The maximum tensile strength corresponding to the isotropic 304 stainless steel is about 520 MPa. However, using the longitudinal tensile test of the MCHS, the research showed that the longitudinal tensile strength of the MCHS will decline to 76.9% of the base material due to the attenuation of the mechanical properties of the inter-layer bonding zone and the manufacturing tolerances; that is, the longitudinal tensile strength of the MCHS is about 400 MPa. In combination with Table 9, it can be seen that, in 17 groups of tests, test 5, test 10, and test 15 have inter-layer cracking risks, while the optimal structure, test 17, has minimal inter-layer stress. The maximum inter-layer stress of test 17 is 139.22 MPa, which only reaches 34.8% of the longitudinal tensile strength. This proves that the optimal structure has a reliable structural strength. Next, the three typical stress distribution contours shown in Figure 8 are further analyzed. It is obvious that the stress is mainly concentrated in the corner of the microchannel zone and the edge of the fluid domain. On the one hand, this is because these regions have poor geometric continuity, where a stress concentration in the sharp corners is easy to produce. On the other hand, the temperature gradient in these regions is large, and the structural deformation caused by thermal expansion intensifies the stress increase. For the former, Figure 8a shows that test 2 has the smallest inter-layer stress besides test 17, which is mainly due to its relatively simple microchannel structure that facilitates the uniform distribution of stress. In contrast, as shown in Figure 8b, the MCW, represented by test 10, has more twists and turns, which increases the edge stress of the microchannel. Therefore, for structures like the MCW and MCT, if they cannot significantly enhance the heat transfer efficiency, the high inter-layer stress they are prone to generate can cause significant damage to the overall structural strength, further diminishing their value for selection. For the latter, the temperature distribution will also have an important influence on the stress distribution, and Figure 8c is a typical example. Although the MCTC may also have high stress (such as in test 5), its inter-layer stress reaches the lowest value for the 17 groups of tests under the lowest surface temperature, as shown in Figure 7, and it has a good cooling uniformity (see Section 4.3.1). The maximum inter-layer stress of the MCTC structure in test 17 is similar to that of the traditional MCPS structure in test 2. However, the principles behind their low inter-layer stress are different. The MCTC structure excels due to its high cooling uniformity and heat transfer efficiency, while the MCPS structure relies on its simple and smooth channel design to achieve lower inter-layer stress.

4.3. Comprehensive Analysis of Optimal Structure

According to the above research results, the optimal structure obtained through the orthogonal experiment has the best heat transfer performance and sufficient structural strength. In order to further evaluate the comprehensive performance of the structure, the cooling uniformity and fluidity of the structure are studied in this section. Meanwhile, the PEC is introduced as an indicator to comprehensively assess the heat transfer performance and fluid flow performance of the MCHS, which can be described as a better thermal performance with a lower pressure drop. Since test 4 in Section 4.1 is a typical traditional microchannel structure with great structural differences from the optimal structure, test 4 was used as the contrast group in this section to better study the comprehensive performance of the optimal structure.

4.3.1. Cooling Uniformity

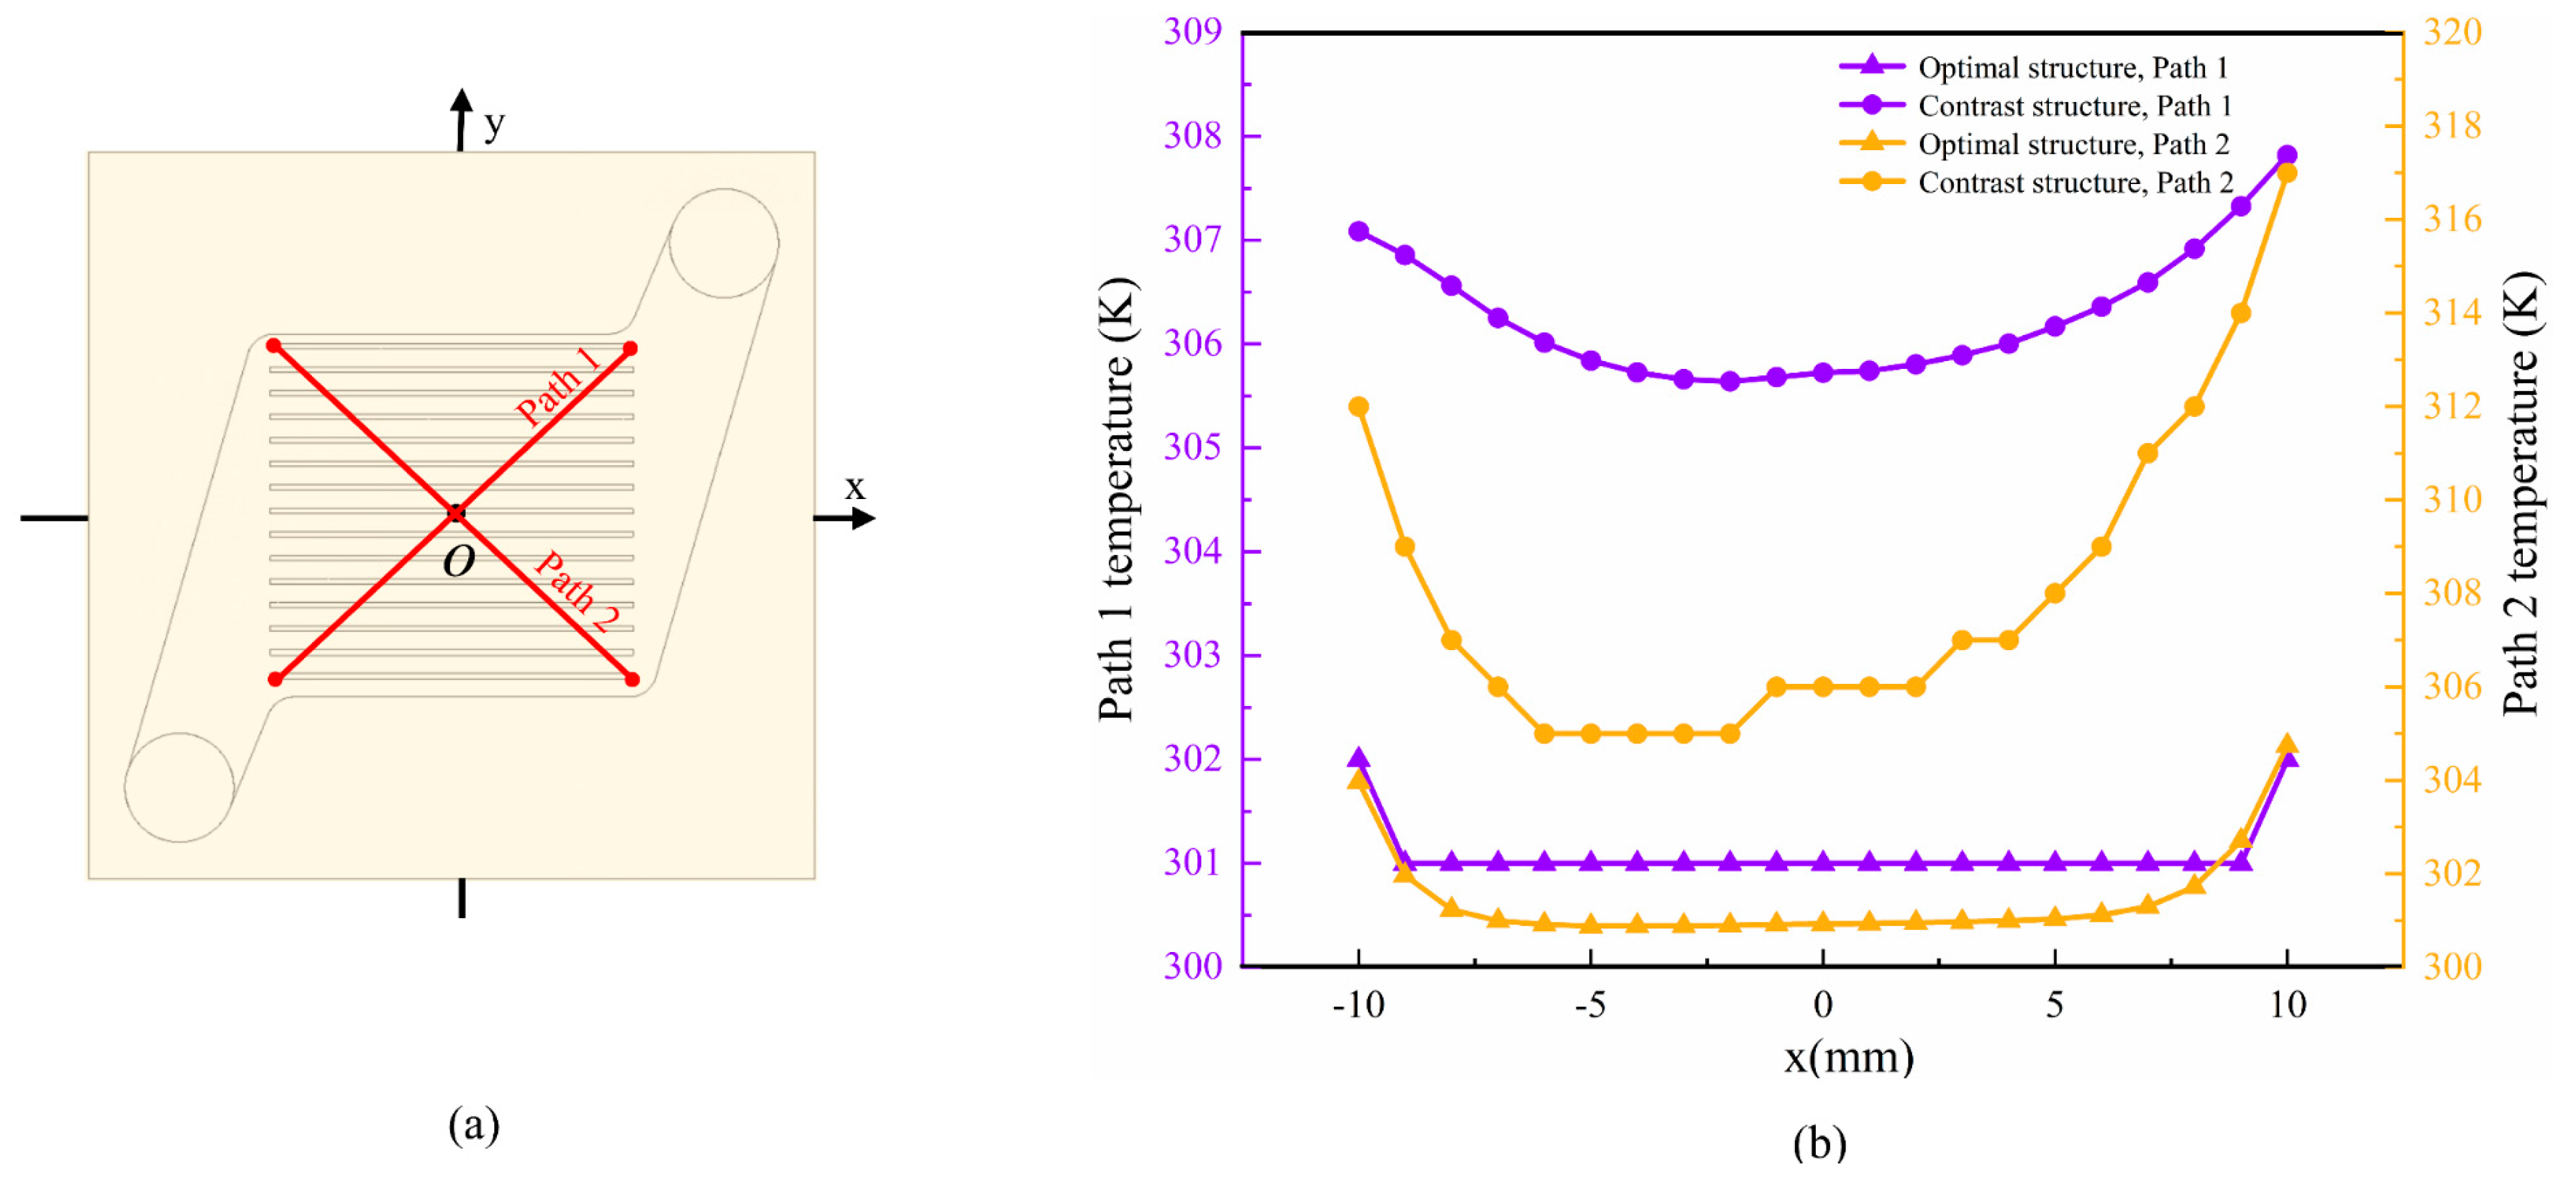
Cooling uniformity is also an important evaluation metric to measure the MCHS, and a good cooling uniformity can prevent local damage caused by uneven temperature to the components, as well as extend the service life of the MCHS. Set paths 1 and 2 on the surface of the upper cover, as shown in Figure 9a, and extract the temperature curves of the optimal structure and contrast structure on paths 1 and 2, as shown in Figure 9b.
Firstly, regardless of path 1 or 2, the temperature curve of the optimal structure is lower than that of the contrast structure, which accords with the simulation results of the temperature field. Secondly, in terms of the temperature fluctuation, the contrast structure fluctuates more sharply, while the optimal structure is almost a horizontal line. Specifically, the variance in the temperature curves of the optimal structure on path 1 and path 2 is only 23.2% and 9.9% of that of the contrast structure, respectively, which indicates that the optimal structure has an extremely good cooling uniformity, especially in the microchannel zone. Finally, by observing the temperature curve of the optimal structure, it can be found that the overall trend of the temperature is to first decrease, then to maintain a low temperature, and finally to increase, which is due to the dense fluid in the center area of the MCHS increasing the rate of the heat loss.

4.3.2. Fluidity Analysis

Because of the periodic distribution of the microchannels, it is possible to analyze the fluidity of a single microchannel. According to the rectangular coordinate system established in Figure 9, the microchannel located on the x-axis when y = 0 is taken, and the velocity and pressure distribution contour of the optimal structure and the contrast structure is shown in Figure 10. The black arrow in the microchannel indicates the speed direction. Obtain the velocity variation curve within the microchannel and calculate the average pressure drop at the inlet and outlet of the microchannels, and plot them as a comparative graph, as shown in Figure 11.
By analyzing the velocity and pressure contour of the contrast structure, it can be found that the velocity distribution of the fluid at the entrance of the microchannel is very uneven, and the pressure accordingly decreases sharply. For the entrance of the microchannel, the high-velocity area may be caused by the sudden narrowing of the channel, and the velocity of the fluid near the wall decreases sharply due to the fluid viscosity and boundary layer effect. As a result, the contrast structure may have a strong eddy current at the entrance of the microchannel, which caused the flow to stagnate to a certain extent. However, in the subsequent flow, thanks to the simplicity and smoothness of the traditional MCPS structure, the velocity uniformity of the fluid is improved, and the pressure has also been restored to a certain extent. In contrast, an analysis of the flow state of the optimal structure in Figure 10 shows that, although the velocity distribution is also less uniform at the entrance of the microchannel, the situation quickly improves. Because the triangular cavity greatly increases the surface area of the wall and obstructs the incoming flow, the vortex and stagnant fluid are rapidly captured by the cavity, which makes the flow in the middle of the microchannel smoother. Concurrently, the enlarged cavity area significantly enhances the heat transfer efficiency. However, it is important to note that the pressure continues to decrease as the triangular cavitation progressively obstructs the microchannel flow.
The above analysis is verified in Figure 11. For the velocity distribution on the x-axis, the fluid flows from the positive x-axis to the negative x-axis, and both the optimal structure and the contrast structure show a decreasing trend, but the optimal structure as a whole continues to decrease in the fluctuation, while the contrast structure significantly decreases first and then increases. At the entrance, for example, the contrast structure lost nearly 75% of its velocity due to the strong effect of the eddy current, while the optimal structure reduced this loss to about 59%. Furthermore, the pressure drop in the contrast structure, as shown in Figure 11, is about 87.4% of that in the optimal structure, which is attributed to its simpler and smoother design. In summary, compared to the traditional microchannel structure, the optimal structure has a more uniform velocity distribution at the entrance of the microchannel, with a relatively more stable decay of the velocity and pressure, although the pressure drop is slightly higher than that of the contrast structure.

4.3.3. Performance Evaluation Criterion (PEC)

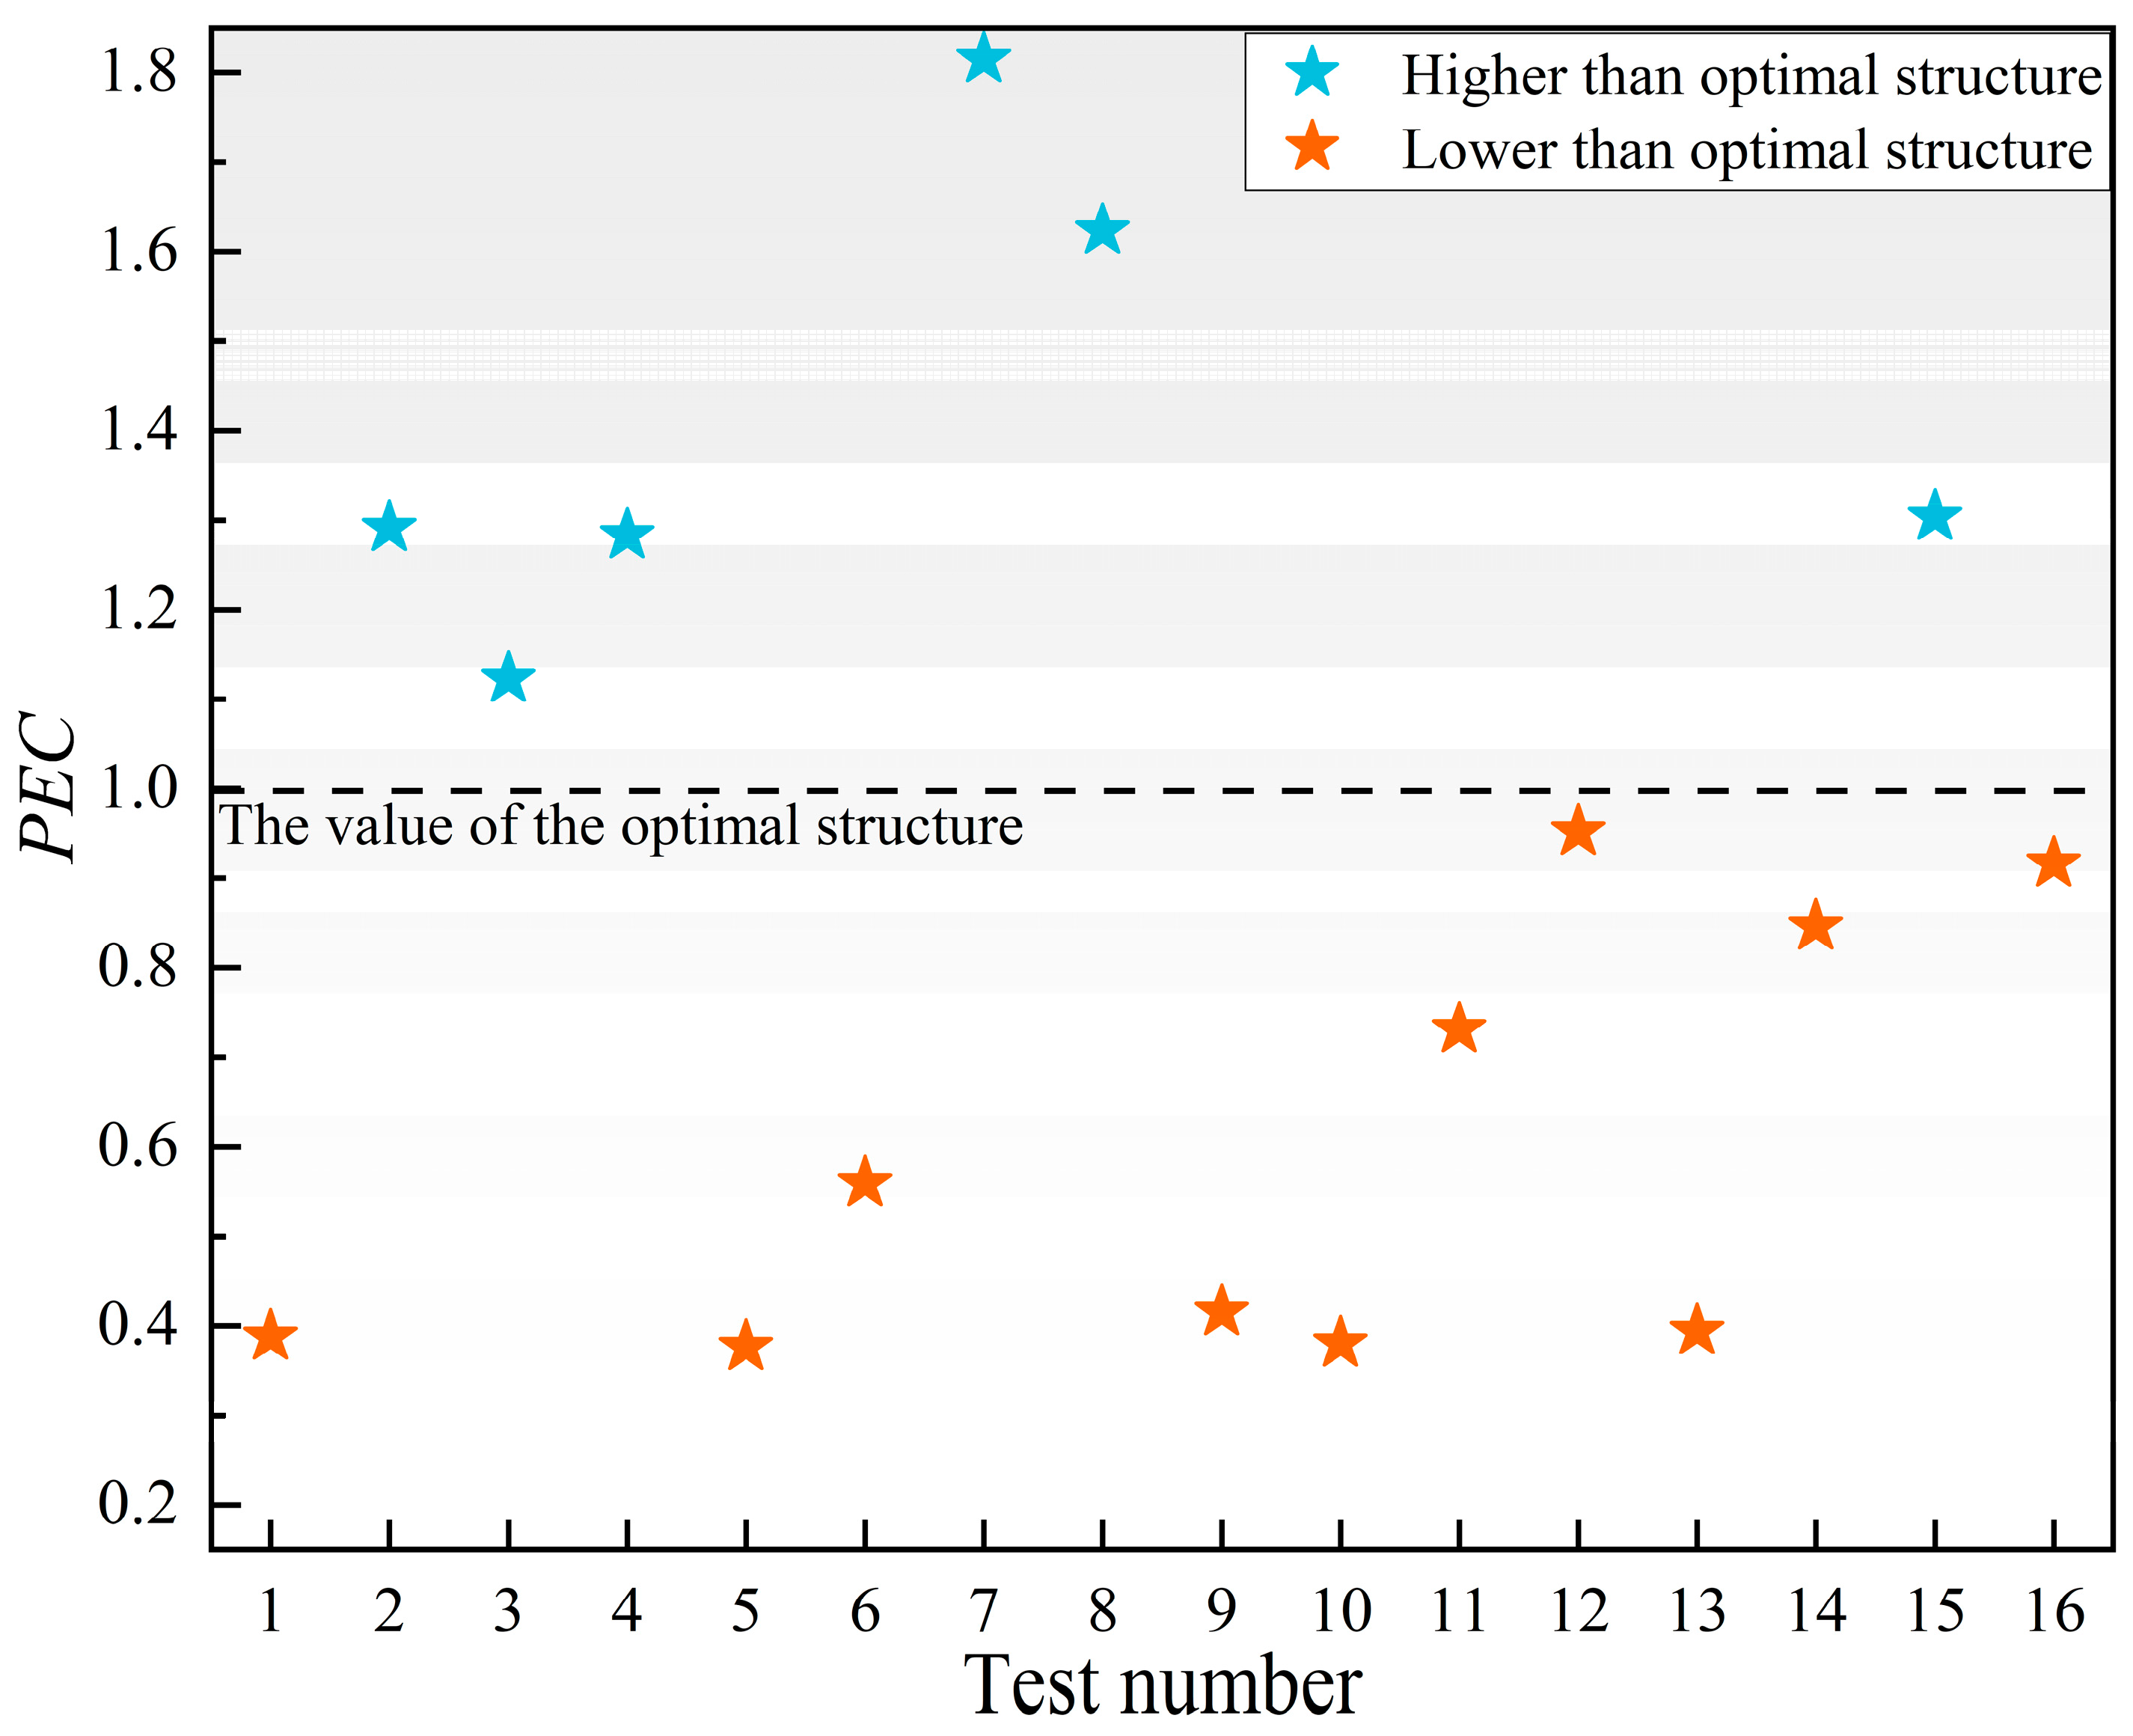
To further comprehensively evaluate the optimal structure, the PEC is used to assess both the heat transfer and fluid flow performance. The PEC is calculated by Equation (14), and it can be seen from Section 3.3 that its essence is a comprehensive calculation of the Nusselt number (Nu) and friction factor (f). Therefore, the PEC can reflect the heat transfer and flow performance of the MCHS to a certain extent. The optimal structure (test 17) was selected as the reference object to calculate the Nusselt number for the 16 tests in the orthogonal experiment in Section 4.1, and the results are shown in Figure 12. In this analysis, a PEC greater than one is considered to have better flow and heat transfer performance.
It can be seen from Figure 12 that, among the 16 groups of tests, 10 groups of structures have lower PEC values than the optimal structure, while 6 groups of structures have better PEC values. This is because the optimal structure is selected through the orthogonal experiment, in which the optimal heat transfer capacity is simply taken as the evaluation metric without considering its flow performance. Nevertheless, the optimal structure still has a good flow performance, and its PEC value is still better than that of more than half of the structures, taking into account its extremely high heat dissipation capacity and the lowest inter-layer stress. Therefore, the structure has a high selection value.

5. Conclusions

Under the conditions of an inlet flow rate of 1.5 L/min, a heat source heat flux of 50 kW/m2, and a cooling medium (deionized water) temperature of 295 K, several structures of a new laminated MCHS were numerically simulated. Under the premise of ensuring the structural strength, in order to explore a structure with a high heat dissipation capacity, an orthogonal experiment method was used and the comprehensive performance of the optimal structure was analyzed. Finally, an optimal scheme was proposed for the structural design of the MCHS which could meet the heat dissipation requirements of electronics under high heat flux. The main conclusions are as follows:
(1)
For the microchannel shape pairs, the influence of the evaluation metric is the greatest, and the influence of the microchannel width and surface undulation on the evaluation metric decreases sequentially, while the distribution density has the least effect. It can be further inferred that the heat transfer capacity will continue to increase with the decrease in the width of the microchannel, while the distribution density α of the microchannel has a weak influence on the performance. In addition, the appropriately rough surface of the microchannel can also increase its heat transfer performance.
(2)
The optimal combination is the MCTC, where the width of the microchannel is 0.5 mm, the distribution density of the microchannel is 60%, and there is the presence of surface undulation on the microchannels. Compared with the initial value (295 K), the average surface temperature of the heat source increases by 8.7 K, which corresponds to an approximate temperature rise of 2.96%. Additionally, its average surface temperature is about 8.6 K lower than that of the traditional parallel straight microchannel (MCPS).
(3)
The stress distribution is highly correlated with the microchannel structure and temperature distribution, the MCPS is very helpful in reducing the stress concentration, and the high cooling uniformity created by the MCTC can also reduce the inter-layer stress. The maximum inter-layer stress of the optimal structure is 139.22 MPa, reaching only 34.8% of its longitudinal tensile strength. Therefore, the optimal structure, as determined by the orthogonal experiment, satisfies the strength requirement.
(4)
The temperature variance in the optimal structure on a given path can be as low as 9.9% of the traditional structure. Additionally, the velocity loss at the microchannel entrance is significantly reduced, dropping from 75% in the traditional structure to 59% in the optimal design. Therefore, although the pressure drop in the microchannel of the optimal structure is increased, its cooling uniformity is greatly improved and still maintains good fluidity. In addition, since the optimal structure is designed based on the optimal heat transfer, its PEC value is not the best, but the optimal structure obtained by the orthogonal experiment still has good fluidity, so the structure still has a high selection value.

Author Contributions

Conceptualization, L.J.; Methodology, F.L., L.J., J.Z. and Z.Y.; Software, L.J. and J.Z.; Validation, F.L., Z.Y. and Y.W.; Formal analysis, F.L. and L.J.; Writing—original draft, F.L. and J.Z.; Writing—review & editing, F.L. and J.Z.; Supervision, N.Z. and Z.L.; Funding acquisition, L.J. All authors have read and agreed to the published version of the manuscript.

Funding

This work was financially supported by the GF project of China (Grant No. 80923020104) and the School-Enterprise Collaborative Innovation Fund for graduate students of the Xi’an University of Technology (Grant No. 252062302).

Data Availability Statement

The original contributions presented in the study are included in the article, further inquiries can be directed to the corresponding author.

Conflicts of Interest

The authors declare no conflict of interest.

Glossary

NomenclatureRrange of the orthogonal experiment
Awtotal heat transfer area of a single channel, m2R′range correction value of the orthogonal experiment
Aqsurface areas at the bottoms of single channels, m2rthe number of repetitions of each level of the factor
Cpfthe specific heat capacity of the fluid, J/(kg·K)Twaverage temperature of the channel wall, K
Dhhydraulic diameter, mmTmaverage temperature at the entrance and exit, K
ddiameter, mmTininlet temperature, K
ffriction coefficientToutoutlet temperature, K
hheight of the fluid domain, mmTffluid temperature, K
Hheight of the microchannel layer, mmTssolid temperature, K
hmaverage heat transfer coefficient, W/(m2·K)u,v,wvelocity components, m/s
kfthermal conductivity of the fluid, W/(m·K)uininlet velocity, m/s
ksthermal conductivity of the solid, W/(m·K)Wcwidth of the microchannel, mm
Kjfactors corresponding to the level of resultsWwwidth of the wall of the microchannel, mm
kjthe average of the levels corresponding to the factorGreek symbols
Lxlength of the microchannel zone, mmαthe distribution density of the microchannels
Lywidth of the microchannel zone, mmthe operator of the calculus
Lside length of the microchannel layer, mmμfdynamic viscosity of the fluid, kg/(m·s)
mnumber of microchannel zonesρfdensity of the fluid, kg/m3
nlayer number of the microchannel layerσmaximum equivalent stress, MPa
NuNusselt numberSubscripts
Pffluid pressure, Paffluid
Pininlet pressure, Passolid
Poutoutlet pressure, Paininlet
ΔPpressure drop, Pammean
PECperformance evaluation criterionoutoutlet
qwheat flux, W/m2wwall
ReReynolds number

References

  1. Schaller, R.R. Moore’s law: Past, present and future. IEEE Spectrum 1997, 34, 52–59. [Google Scholar] [CrossRef]
  2. Ball, P. Computer engineering: Feeling the heat. Nature 2012, 492, 174–176. [Google Scholar] [CrossRef] [PubMed]
  3. Mu, H.; Shi, W. Review of Operation Performance and Application Status of Pulsating Heat Pipe. Sustainability 2024, 16, 2722. [Google Scholar] [CrossRef]
  4. Thesiya, D.; Patel, H.; Patange, G. A comprehensive review electronic cooling: A nanomaterial perspective. Int. J. Thermofluids 2023, 19, 100382. [Google Scholar] [CrossRef]
  5. Faraji, H.; Faraji, M.; El Alami, M. Numerical Survey of the Melting Driven Natural Convection Using Generation Heat Source: Application to the Passive Cooling of Electronics Using Nano-enhanced Phase Change Material. J. Therm. Sci. Eng. Appl. 2019, 12, 021005. [Google Scholar] [CrossRef]
  6. Faraji, H.; Teggar, M.; Arshad, A.; Arıcı, M.; El Mehdi, B.; Choukairy, K. Lattice Boltzmann simulation of natural convection heat transfer phenomenon for thermal management of multiple electronic components. Therm. Sci. Eng. Prog. 2023, 45, 102126. [Google Scholar] [CrossRef]
  7. Fang, N.; Zhou, Z.; Britton, B. The Performance of Different Etchants on the Carbides of Ni600 and Ni625. Metals 2024, 14, 91. [Google Scholar] [CrossRef]
  8. Hao, X.H.; Dong, H.G.; Li, S.; Xu, X.X.; Li, P. Joining of TC4 titanium alloy to 304 stainless steel with fillet weld by GTAW using copper-based filler wire. J. Mater. Process. Technol. 2018, 257, 88–100. [Google Scholar] [CrossRef]
  9. Kim, H.; Cong, W.L.; Zhang, H.C.; Liu, Z.C. Laser engineered net shaping of Nickel Based superalloy Inconel 718 powders onto AISI 4140 alloy steel substrates: Interface bond and fracture failure mechanism. Materials 2017, 10, 341. [Google Scholar] [CrossRef]
  10. Choi, Y.H.; Lee, Y.W.; Choi, K.; Doh, D.H.; Kim, K.J. Temperature distribution and thermal stresses in various conditions of moving heating source during line heating process. J. Therm. Sci. 2012, 21, 82–87. [Google Scholar] [CrossRef]
  11. Shevchenko, V.; Korzhyk, V.; Gao, S.; Khaskin, V.; Cai, D.; Luo, Z.; Illiashenko, Y.; Kvasnytskyi, V.; Perepichay, A. Formation of Stainless Steel Welded Joints Produced with the Application of Laser and Plasma Energy Sources. Metals 2024, 14, 706. [Google Scholar] [CrossRef]
  12. Djeloud, H.; Moussaoui, M.; Kouider, R.; Al-Kassir, A.; Carrasco-Amador, J.P. Study of the Heat Exchange and Relaxation Conditions of Residual Stresses Due to Welding of Austenitic Stainless Steel. Energies 2023, 16, 3176. [Google Scholar] [CrossRef]
  13. Ren, X.P.; Chen, X.H.; Xiong, Z.P. Characterization and analysis of diffusion bonding process in a Cr25Ni7Mo4MnSi duplex stainless steel. J. Manuf. Process 2018, 34, 603–613. [Google Scholar] [CrossRef]
  14. Thiem, D.B.; Szabo, G.; Burg, T.P. Model-Based Optimization of Solid-Supported Micro-Hotplates for Microfluidic Cryofixation. Micromachines 2024, 15, 1069. [Google Scholar] [CrossRef] [PubMed]
  15. Savino, S.; Nonino, C. Thermal Performance Improvement of Cross-Flow Double-Layered Microchannel Heat Sinks through Proper Header Design. Energies 2024, 17, 3790. [Google Scholar] [CrossRef]
  16. Wan, Y.; Xie, X.; Jiang, W.; Li, S.; Ye, P.; Dong, Z. Creep damage and crack propagation behavior of printed circuit heat exchanger manufactured by diffusion welding: From material to structure. J. Mater. Res. Technol. JMRT 2023, 27, 1446–1460. [Google Scholar] [CrossRef]
  17. Tiselj, I.; Hetsroni, G.; Mavko, B.; Mosyak, A.; Pogrebnyak, E.; Segal, Z. Effect of axial conduction on the heat transfer in micro-channels. Int. J. Heat Mass Transf. 2004, 47, 2551–2565. [Google Scholar] [CrossRef]
  18. Gao, P.Z.; Person, S.L.; Marinet, M.F. Scale effects on hydrodynamics and heat transfer in two-dimensional mini and microchannels. Int. J. Therm. Sci. 2002, 41, 1017–1027. [Google Scholar] [CrossRef]
  19. Li, M.C.; Al-Refaie, A. Improving wooden part’s quality by adopting DMAIC procedure. Qual. Reliab. Eng. Int. 2008, 24, 351–360. [Google Scholar] [CrossRef]
  20. Lu, S.N.; Vafai, K. A comparative analysis of innovative microchannel heat sinks for electronic cooling. Int. Commun. Heat Mass Transf. 2016, 76, 271–284. [Google Scholar] [CrossRef]
  21. Lorenzini, M.; Suzzi, N. Combined Geometrical Optimisation of a Square Microchannel with Smoothed Corners. Energies 2024, 17, 2666. [Google Scholar] [CrossRef]
  22. Zhang, X.; Yang, T.; Chang, Z.; Xu, L.; Xi, L.; Gao, J.; Zheng, P.; Xu, R. Multi-Objective Optimization of the Microchannel Heat Sink Used for Combustor of the Gas Turbine. Energies 2024, 17, 818. [Google Scholar] [CrossRef]
  23. Kadam, S.T.; Kumar, R. Twenty first century cooling solution: Microchannel heat sinks. Int. J. Therm. Sci. 2014, 85, 73–92. [Google Scholar] [CrossRef]
  24. Wang, T.; Gao, Z.; Bai, J.; Wang, Z.; Qiao, K.; Li, P. Thermal Performance of Mini Cooling Channels for High-Power Servo Motor with Non-Uniform Heat Dissipation. J. Therm. Sci. 2023, 32, 650–661. [Google Scholar] [CrossRef]
  25. Wu, H.Y.; Cheng, P. An experimental study of convective heat transfer in silicon microchannels with different surface conditions. Int. Commun. Heat Mass Transf. 2003, 46, 2547–2556. [Google Scholar] [CrossRef]
  26. Naphon, P.; Khonseur, O. Study on the convective heat transfer and pressure drop in the micro-channel heat sink. Int. Commun. Heat Mass Transf. 2009, 36, 39–44. [Google Scholar] [CrossRef]
  27. Ghasemi, S.E.; Ranjbar, A.A.; Hoseini, M.J.; Mohsenian, S. Design optimization and experimental investigation of CPU heat sink cooled by alumina-water nanofluid. J. Mater. Res. Technol. JMRT 2021, 15, 2276–2286. [Google Scholar] [CrossRef]
  28. Tran, N.; Chang, Y.J.; Teng, J.T.; Greif, R. A study on five different channel shapes using a novel scheme for meshing and a structure of a multi-nozzle microchannel heat sink. Int. J. Heat Mass Transf. 2017, 105, 429–442. [Google Scholar] [CrossRef]
  29. Hasan, M.I.; Rageb, A.A.; Yaghoubi, M.; Homayoni, H. Influence of channel geometry on the performance of a counter flow microchannel heat exchanger. Int. J. Therm. Sci. 2009, 48, 1607–1618. [Google Scholar] [CrossRef]
  30. Ma, D.D.; Xia, G.D.; Li, Y.F.; Jia, Y.T.; Wang, J. Design study of micro heat sink configurations with offset zigzag channel for specific chips geometrics. Energy Convers. Manag. 2016, 127, 160–169. [Google Scholar] [CrossRef]
  31. Haertel, J.H.K.; Nellis, G.F. A fully developed flow thermo-fluid model for topology optimization of 3D-printed air-cooled heat exchangers. Appl. Therm. Eng. 2017, 119, 10–24. [Google Scholar] [CrossRef]
  32. Zeng, S.; Sun, Q.Z.; Lee, P.S. Thermohydraulic analysis of a new fin pattern derived from topology optimized heat sink structures. Int. J. Heat Mass Transf. 2020, 147, 118–909. [Google Scholar] [CrossRef]
  33. Zou, A.; Chuan, R.; Qian, F.; Zhang, W.Y.; Wang, Q.W.; Zhao, C.L. Topology optimization for a water-cooled heat sink in micro-electronics based on Pareto frontier. Appl. Therm. Eng. 2022, 207, 118–128. [Google Scholar] [CrossRef]
  34. Wang, R.J.; Zhai, J.G.; Kong, H.J.; Zhao, Y.X.; Zhang, M.; Xu, M.J. Joining of 304 stainless steel to PET by semiconductor laser conduction welding. J. Mater. Res. Technol. JMRT 2023, 27, 5729–5738. [Google Scholar] [CrossRef]
  35. Hwang, B.K.; Kim, T.S.; Ahn, Y.H. Experimental and numerical investigation of austenitic stainless steel (304 type) slit damper structural behavior. Thin-Walled Struct. 2024, 196, 111551. [Google Scholar] [CrossRef]
  36. Xu, B.; Ooi, K.T.; Mavriplis, C.; Zaghloul, M.E. Evaluation of viscous dissipation in liquid flow in microchannels. J. Micromech. Microeng. 2003, 13, 53–57. [Google Scholar] [CrossRef]
  37. White, F.M. Viscous Fluid Flow, 4th ed.; McGraw-Hill: New York, NY, USA, 2022; pp. 303–327. [Google Scholar]
  38. Sun, L.; Li, J.; Xu, H.; Jie, M.; Hao, P. Numerical study on heat transfer and flow characteristics of novel microchannel heat sinks. Int. J. Therm. Sci. 2022, 176, 107–535. [Google Scholar] [CrossRef]
  39. Liu, W.; Liu, Z.C.; Ming, T.Z.; Guo, Z.Y. Physical quantity synergy in laminar flow field and its application in heat transfer enhancement. Int. J. Heat Mass Transf. 2009, 52, 4669–4672. [Google Scholar] [CrossRef]
  40. Qu, W.L.; Mudawar, I. Experimental and numerical study of pressure drop and heat transfer in a single-phase micro-channel heat sink. Int. J. Heat Mass Transf. 2002, 45, 2549–2565. [Google Scholar] [CrossRef]
Figure 1. Schematic of the MCHS geometry.
Energies 17 05076 g001
Figure 2. (a) Schematic diagram of the microchannel layer, (b) the microchannel zone, and (c) the microchannel surface undulation and corresponding dimensions (unit: mm).
Energies 17 05076 g002
Figure 3. Detailed parameters of different microchannel structures.
Energies 17 05076 g003
Figure 4. (a) Sample of mesh generation; (b) Model validation by comparing with experimental results [40].
Energies 17 05076 g004
Figure 5. Temperature contour of the orthogonal experiment simulation (1–16 are test numbers).
Energies 17 05076 g005
Figure 6. Relationship between the levels and the evaluation metric (A–D are factors and 1–4 are levels of factor).
Energies 17 05076 g006
Figure 7. Temperature contour of the optimal level combination (17 is the test number).
Energies 17 05076 g007
Figure 8. Inter-layer stress distribution contours of (a) test 2, (b) test 10, and (c) test 17.
Energies 17 05076 g008
Figure 9. (a) Diagrams of different paths and (b) temperature distribution curves along the paths.
Energies 17 05076 g009
Figure 10. The (a) velocity and (b) pressure distribution contour of the optimal structure and the contrast structure.
Energies 17 05076 g010
Figure 11. Comparison of the velocity distribution curve and pressure drop between the optimal structure and the control structure.
Energies 17 05076 g011
Figure 12. PEC analysis results.
Energies 17 05076 g012
Table 1. Dimensional parameters of the MCHS.
ParametersValue (mm)
Height of the microchannel layer (H)2
Side length of the microchannel layer (L)80
Height of the fluid domain (h)1
Diameter (d)12
Length of the microchannel zone (Lx)20
Width of the microchannel zone/region (Ly)40
Width of the microchannel (Wc)0.5, 1.0, 1.5, 2
Table 2. Physical properties of the materials [34,35].
MaterialsFluid: WaterSolid: 304 Stainless Steel
μ (10−4/kg·m−1·s−1)8.5-
k (W·m−1·K−1)0.615.6
cp (J·kg−1·K−1)4178452
ρ (kg·m−3)10007830
Young’s modulus E (GPa)-179.4
Table 3. Results from grid independence tests.
ShapeUnits
MCPS1,341,646
MCTC1,417,305
MCT2,047,549
MCW1,773,218
Table 4. Orthogonal test factors and levels.
LevelTest Factor
Microchannel Shape (A)Microchannel Width (B)Distribution Density α (C)Surface Undulation (D)
1MCPS0.5 mm30%presence
2MCTC1 mm45%non-presence
3MCW1.5 mm60%-
4MCT2 mm75%-
Table 5. Orthogonal test design.
Test NumberMicrochannel ShapeMicrochannel WidthDistribution Density αSurface Undulation
1MCPS0.5 mm30%presence
2MCPS1 mm45%non-presence
3MCPS1.5 mm60%presence
4MCPS2 mm75%non-presence
5MCTC0.5 mm45%presence
6MCTC1 mm30%non-presence
7MCTC1.5 mm75%presence
8MCTC2 mm60%non-presence
9MCW0.5 mm60%presence
10MCW1 mm75%presence
11MCW1.5 mm30%non-presence
12MCW2 mm45%non-presence
13MCT0.5 mm75%non-presence
14MCT1 mm60%presence
15MCT1.5 mm45%presence
16MCT2 mm30%non-presence
Table 6. Results of the orthogonal experiment simulation.
Test NumberThe Average Surface Temperature (K)Test NumberThe Average Surface Temperature (K)
1306.99308.7
2312.410314.7
3312.511312.2
4312.312312.3
5306.913307.6
6307.414306.8
7307.315308.9
8309.016311.6
Table 7. Values of Kj and kj corresponding to different factors.
Kj and kjMicrochannel Shape (A)Microchannel Width (B)Distribution Density (C)Surface Undulation (D)
K11244.21230.11238.12472.7
K21230.61241.31240.62484.9
K31247.91240.91237.0-
K41234.91245.21241.9-
k1311.1307.5309.5309.1
k2307.7310.3310.2310.6
k3312.0310.2309.3-
k4308.7311.3310.5-
Table 8. Range analysis.
Microchannel ShapeMicrochannel WidthDistribution DensitySurface Undulation
Ri3.893.391.103.05
Priority orderABDC
Excellent levelA2B1C3D1
Table 9. The maximum inter-layer stress in each group of tests.
Test NumberThe Maximum Inter-Layer Stress (MPa)Test NumberThe Maximum Inter-Layer Stress (MPa)
1153.010425.3
2140.611230.4
3197.612268.2
4225.513318.4
5411.214301.2
6283.215401.0
7240.116352.3
8361.017139.2
9340.1--
Disclaimer/Publisher’s Note: The statements, opinions and data contained in all publications are solely those of the individual author(s) and contributor(s) and not of MDPI and/or the editor(s). MDPI and/or the editor(s) disclaim responsibility for any injury to people or property resulting from any ideas, methods, instructions or products referred to in the content.