Navigating Economies of Scale and Multiples for Nuclear-Powered Data Centers and Other Applications with High Service Availability Needs
Abstract
1. Introduction
| Advanced | Moderate | Conservative | ||
|---|---|---|---|---|
| Large Reactors | Between-of-a-kind (BOAK) OCC (USD/kWe) | 5250 | 5750 | 7750 |
| Fuel Costs (USD/MWh) | 9.1 | 10.3 | 11.3 | |
| Fixed O&M (USD/kW-yr) | 126 | 175 | 204 | |
| Variable O&M (USD/MWh) | 1.9 | 2.8 | 3.4 | |
| Total O&M (USD/MWh) | 40 | 35 | 26 | |
| Learning Rate (LR) | 8% | |||
| SMR | BOAK OCC (USD/kWe) | 5500 | 8000 | 10,000 |
| Fuel Costs (USD/MWh) | 10 | 11 | 12.1 | |
| Fixed O&M (USD/kW-yr) | 118 | 136 | 216 | |
| Variable O&M (USD/MWh) | 2.2 | 2.6 | 2.8 | |
| Total O&M (USD/MWh) | 41 | 30 | 27 | |
| LR | 9.5% | |||
| Microreactors | BOAK OCC (USD/kWe) | 9074 | 14,745 | 19,282 |
| Total O&M (USD/MWh) | 79 | 113 | 153 | |
| LR | 12.6% | |||
2. Tradeoffs between Economies of Scale Versus Economies of Multiples
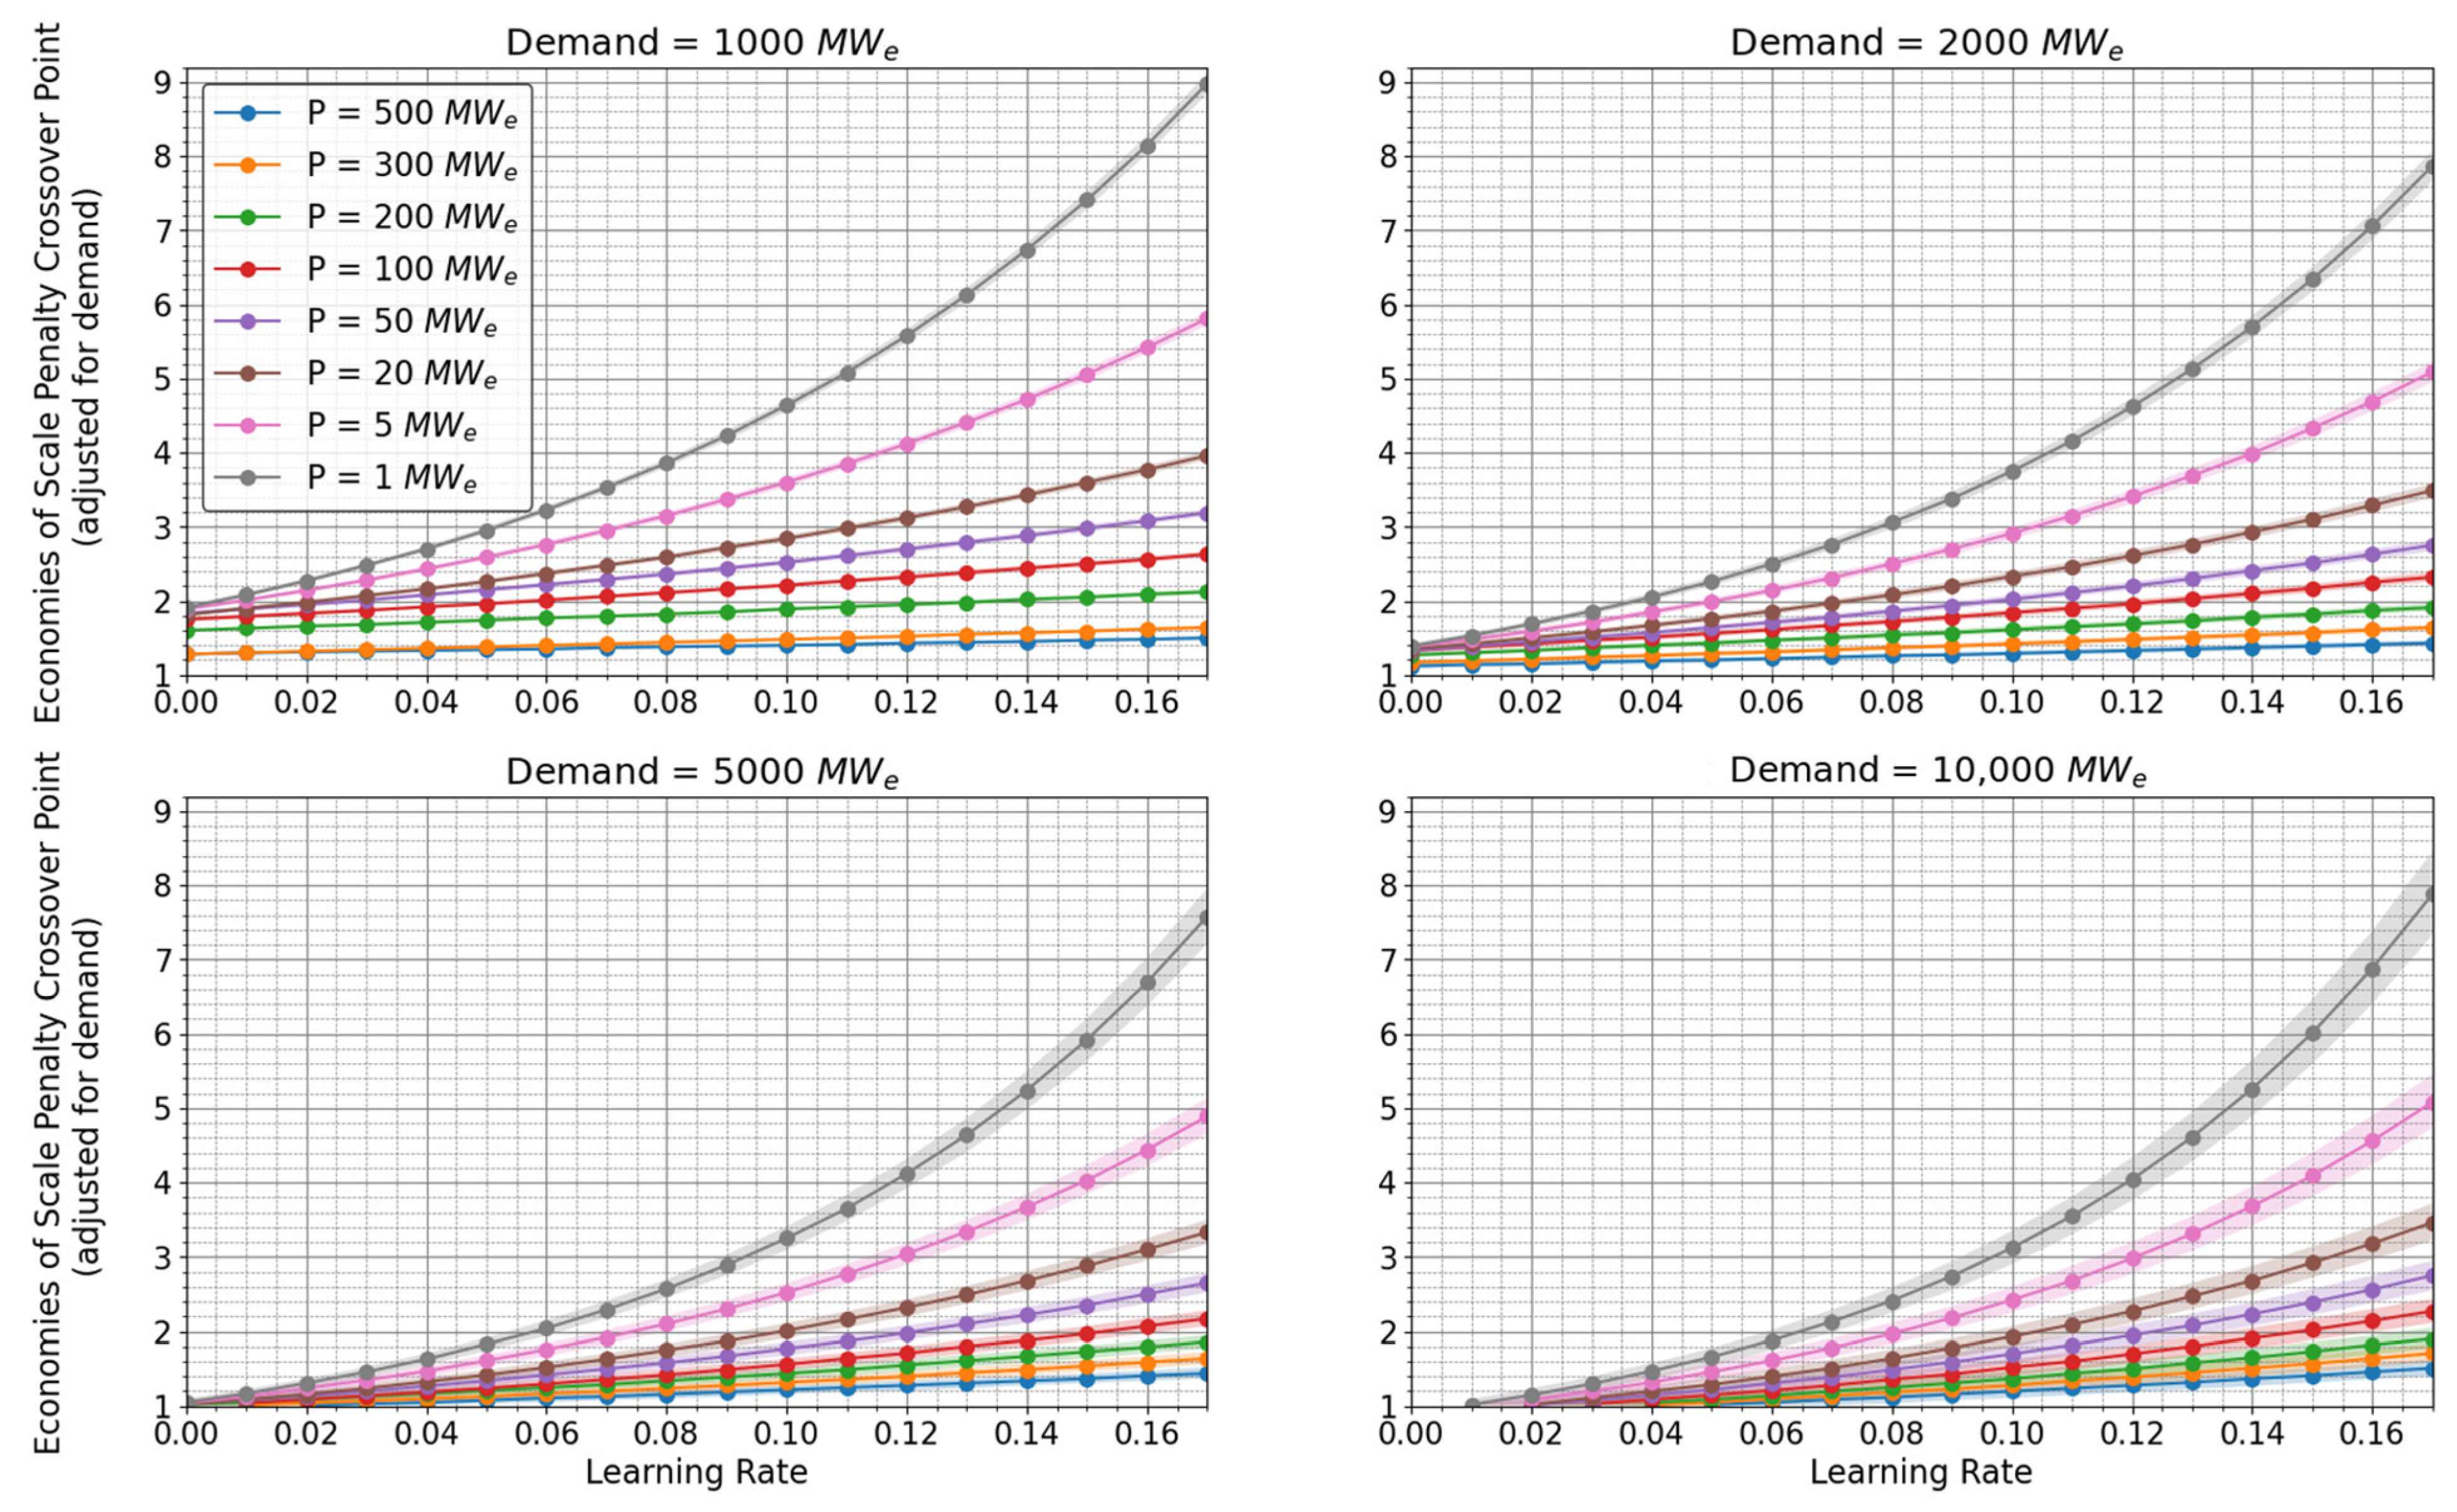
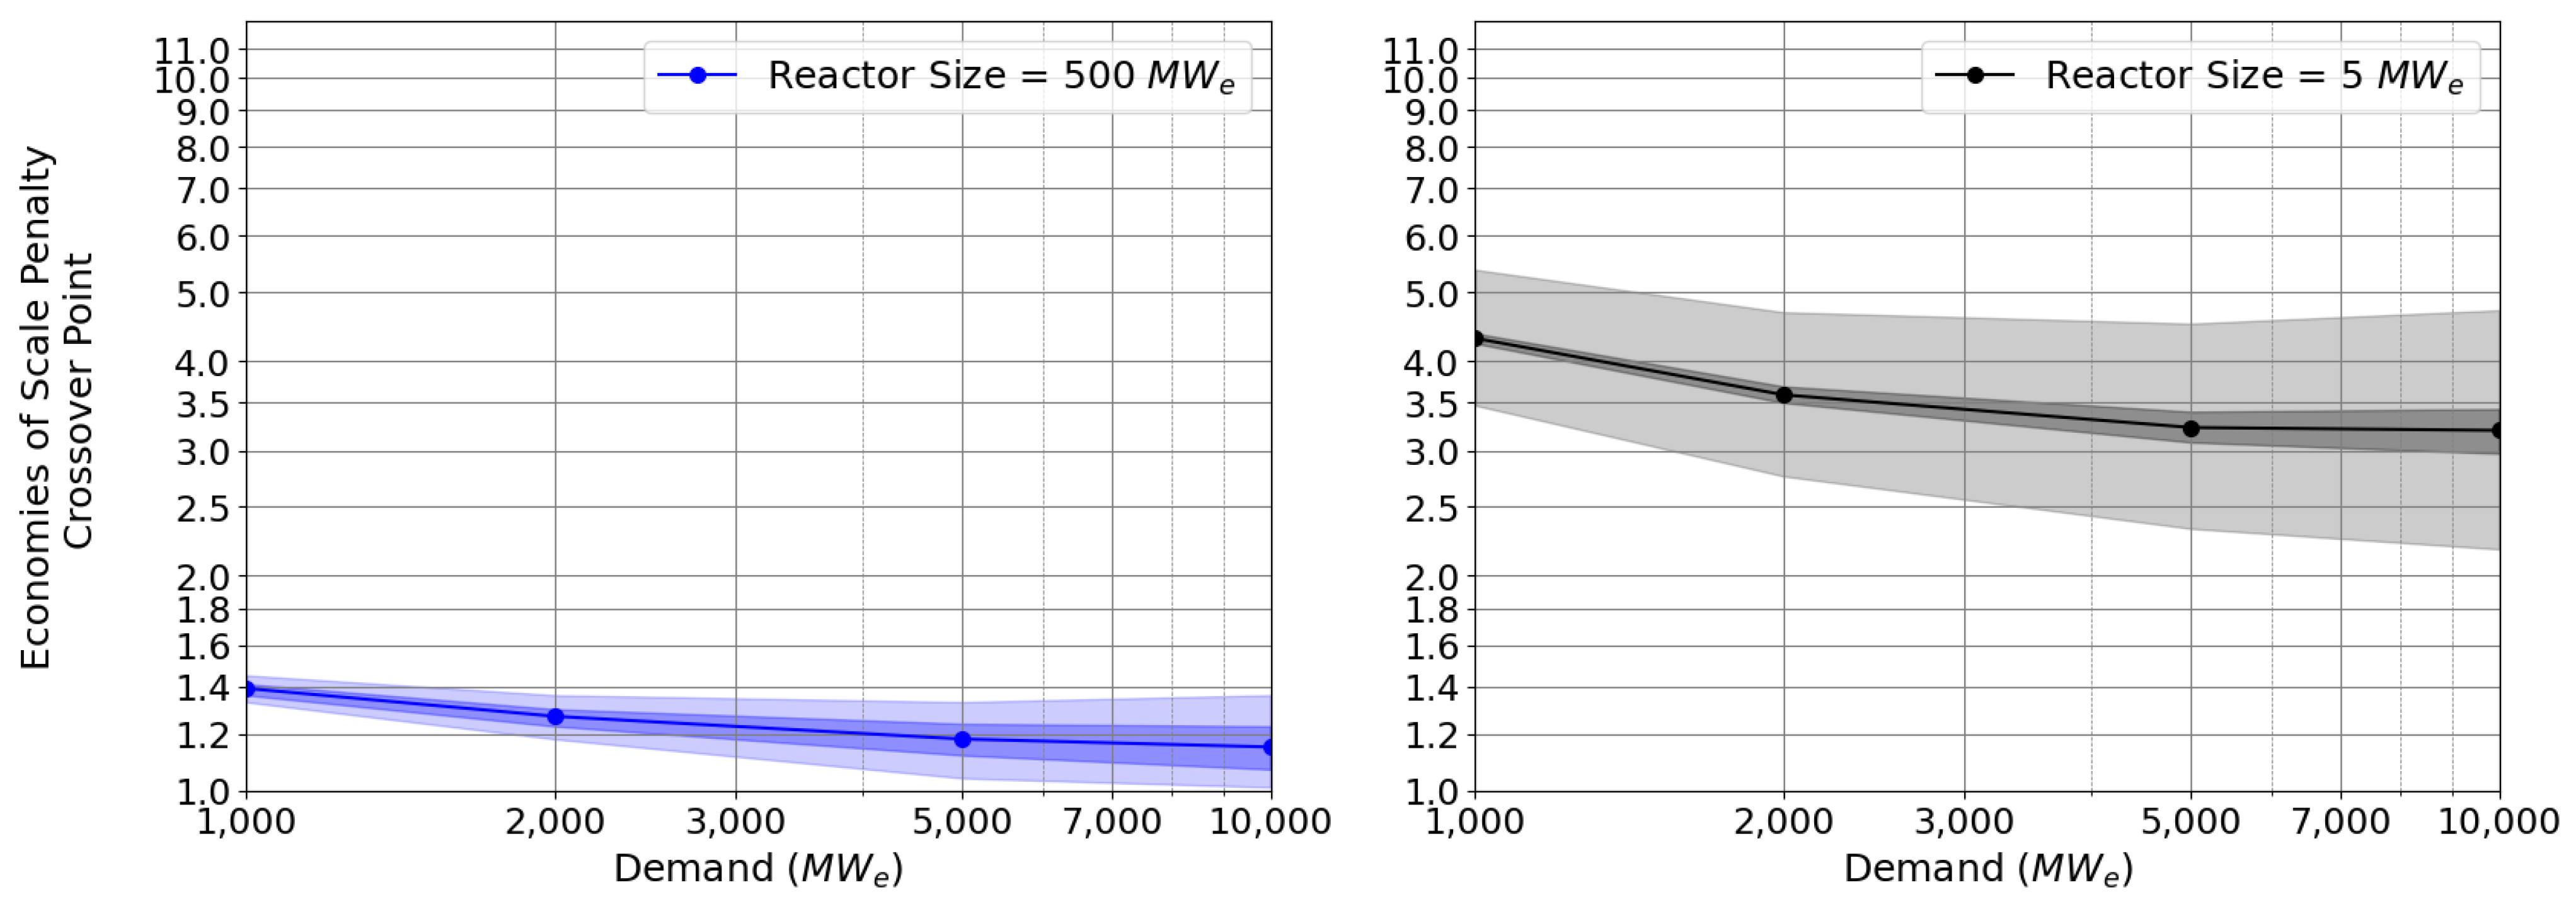
- Economies of scale: Economies of scale refer to the cost advantages that arise as the size of the nuclear plant increases. It is an accepted axiom that the levelized capital cost (USD/kWe) of a nuclear reactor is lower if the reactor’s capacity is higher due to the reduction of costs in several activities (siting activities or civil work) [29]. In this paper, the higher levelized capital cost of SMRs or microreactors due to the economies of scale is referred to as the economies-of-scale penalty, which is defined as follows:
- The economies-of-scale penalty is the levelized cost premium associated with building the First-of-a-Kind (FOAK) plant. In other words, the economies-of-scale penalty associated with the cost of an SMR or a microreactor is:
- Economies of multiples: Also known as economies of learning or learning economies) refer to the cost advantages and efficiencies gained when constructing and operating multiple nuclear reactors. It is well established that a Nth-of-a-Kind (NOAK) plant typically costs less than a First-of-a-Kind (FOAK) plant due to the lessons learned from the construction and deployment of earlier units. Generally, learning economies are an advantage for smaller reactors [29], as they can be constructed more quickly, allowing for a faster accumulation of experience. Additionally, smaller reactors have greater potential to benefit from factory fabrication and mass production, which further reduces costs. The equation shown below [31,32] indicates how savings equating to the LR are reached by producing units. The LR correlates with the reduction in costs (FOAK to NOAK) as follows:
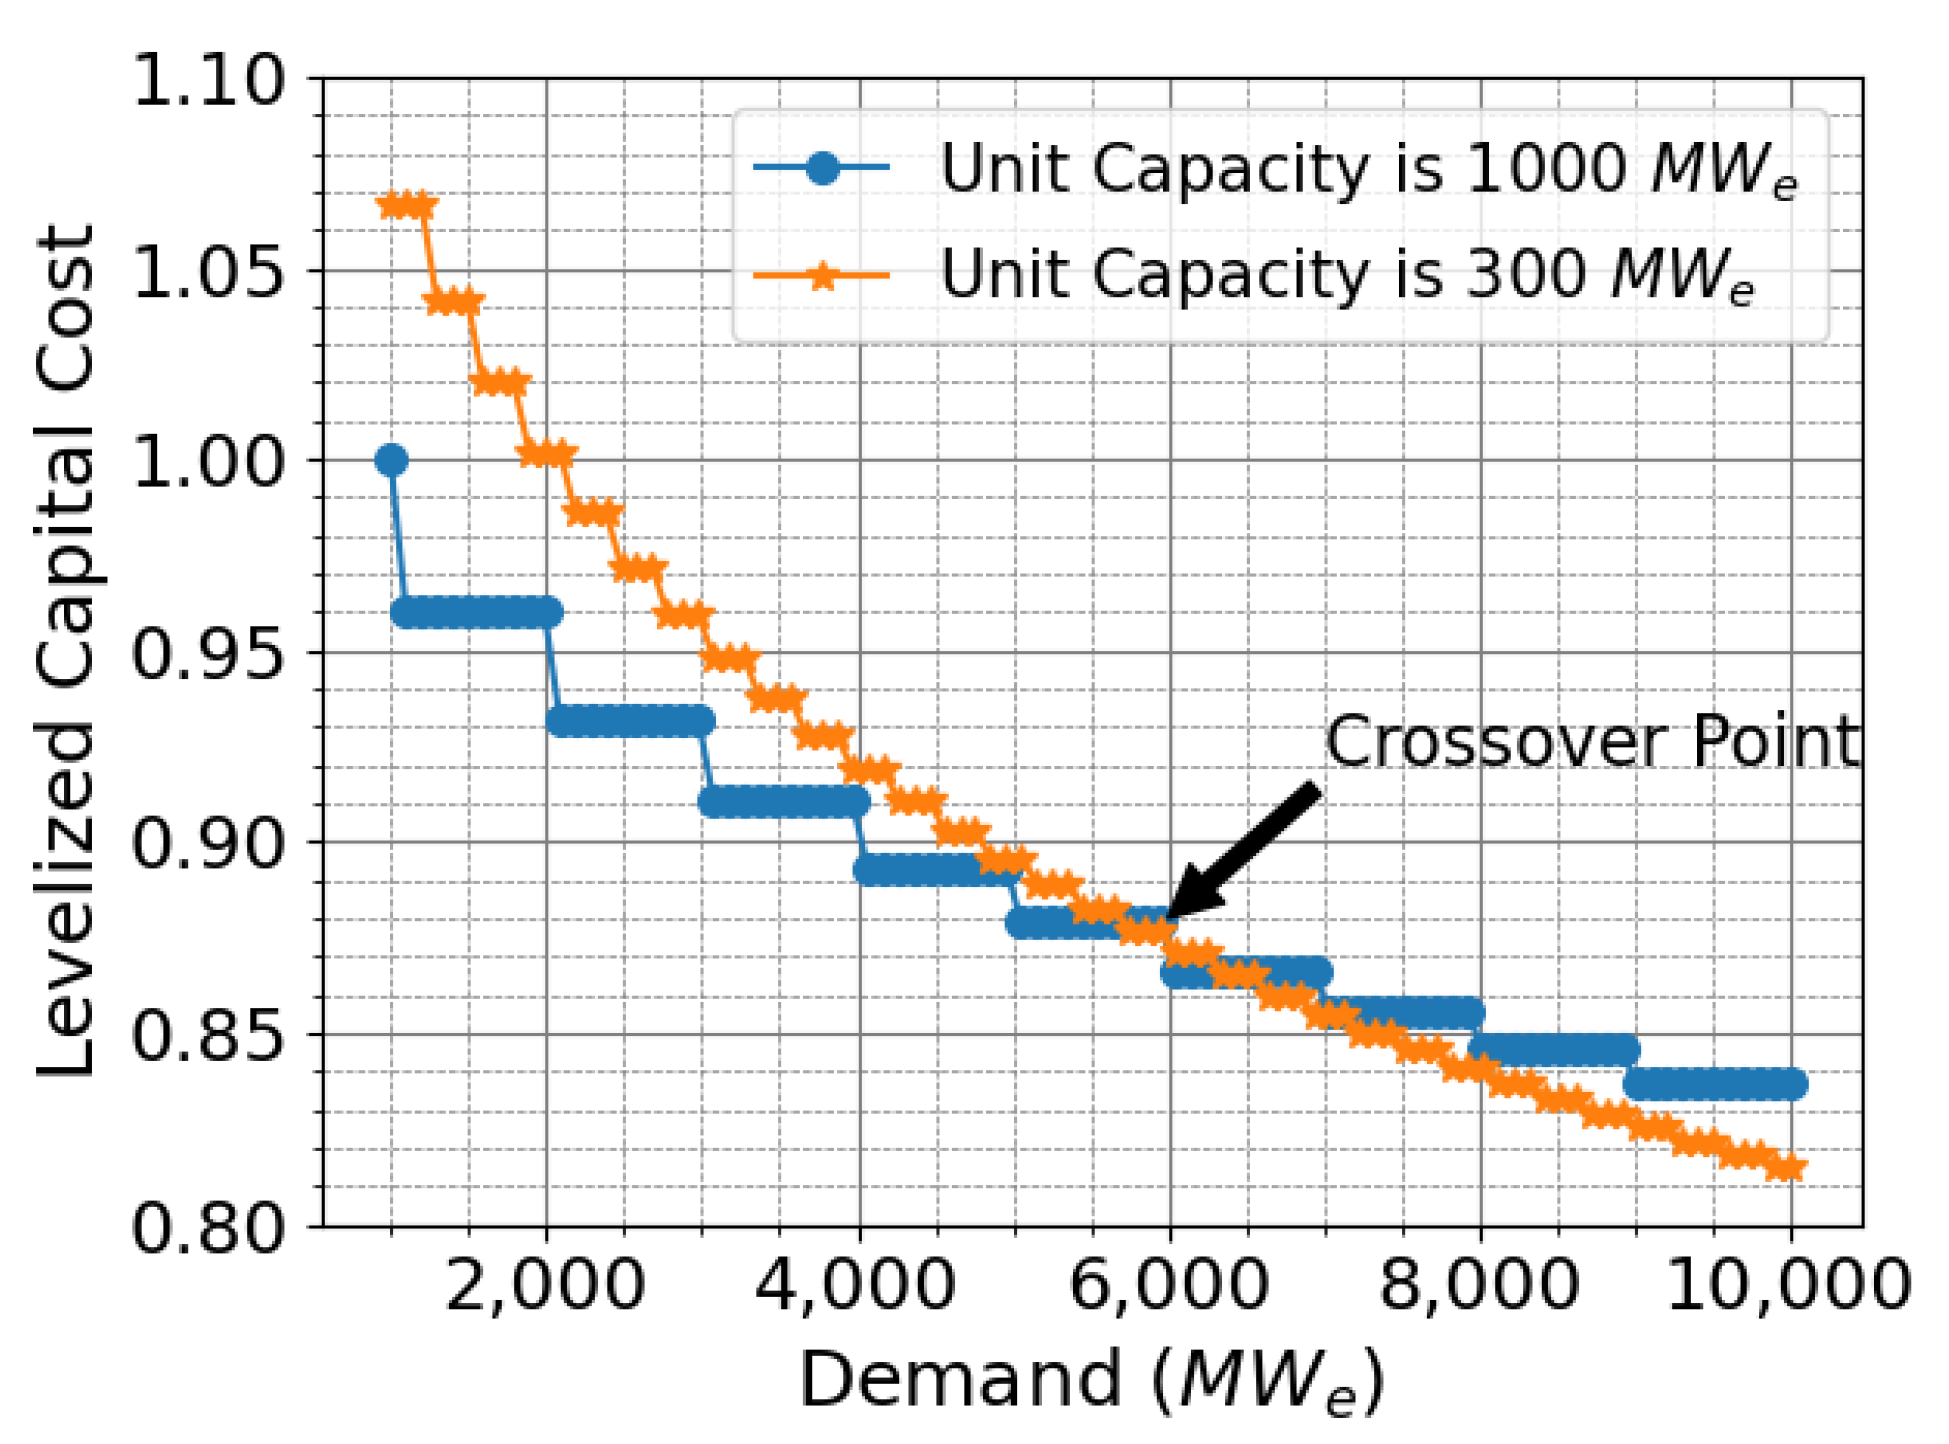
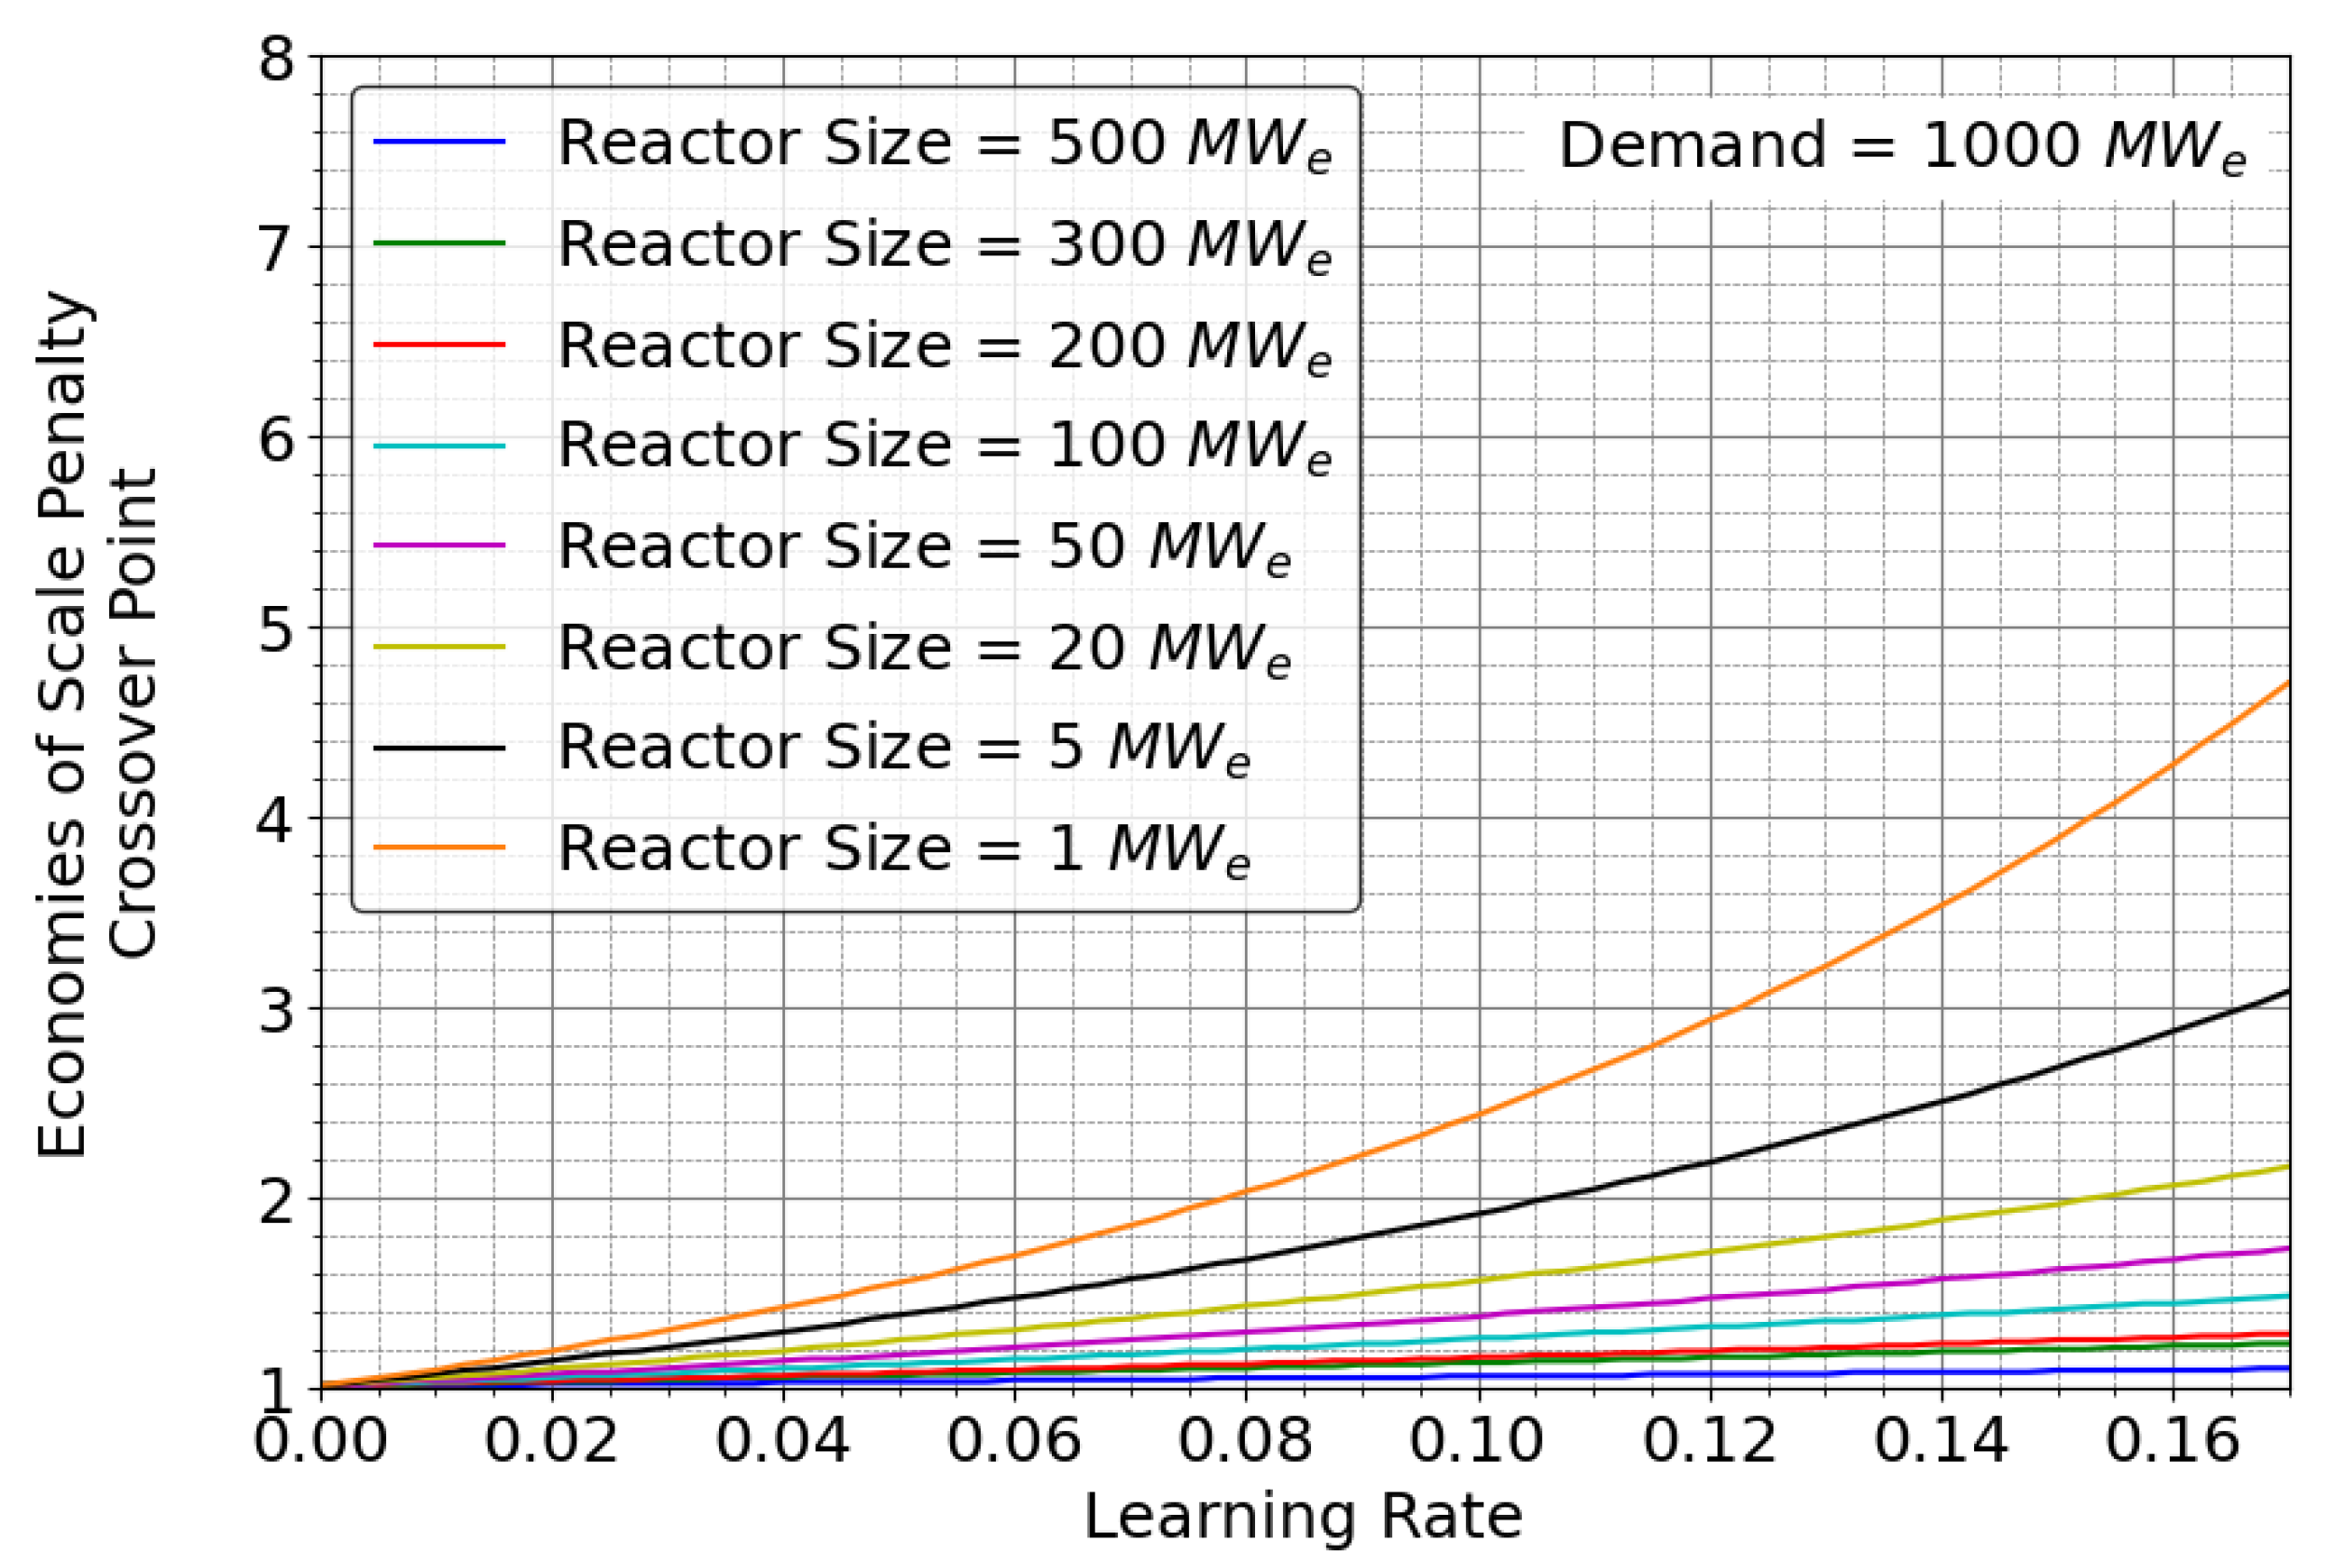
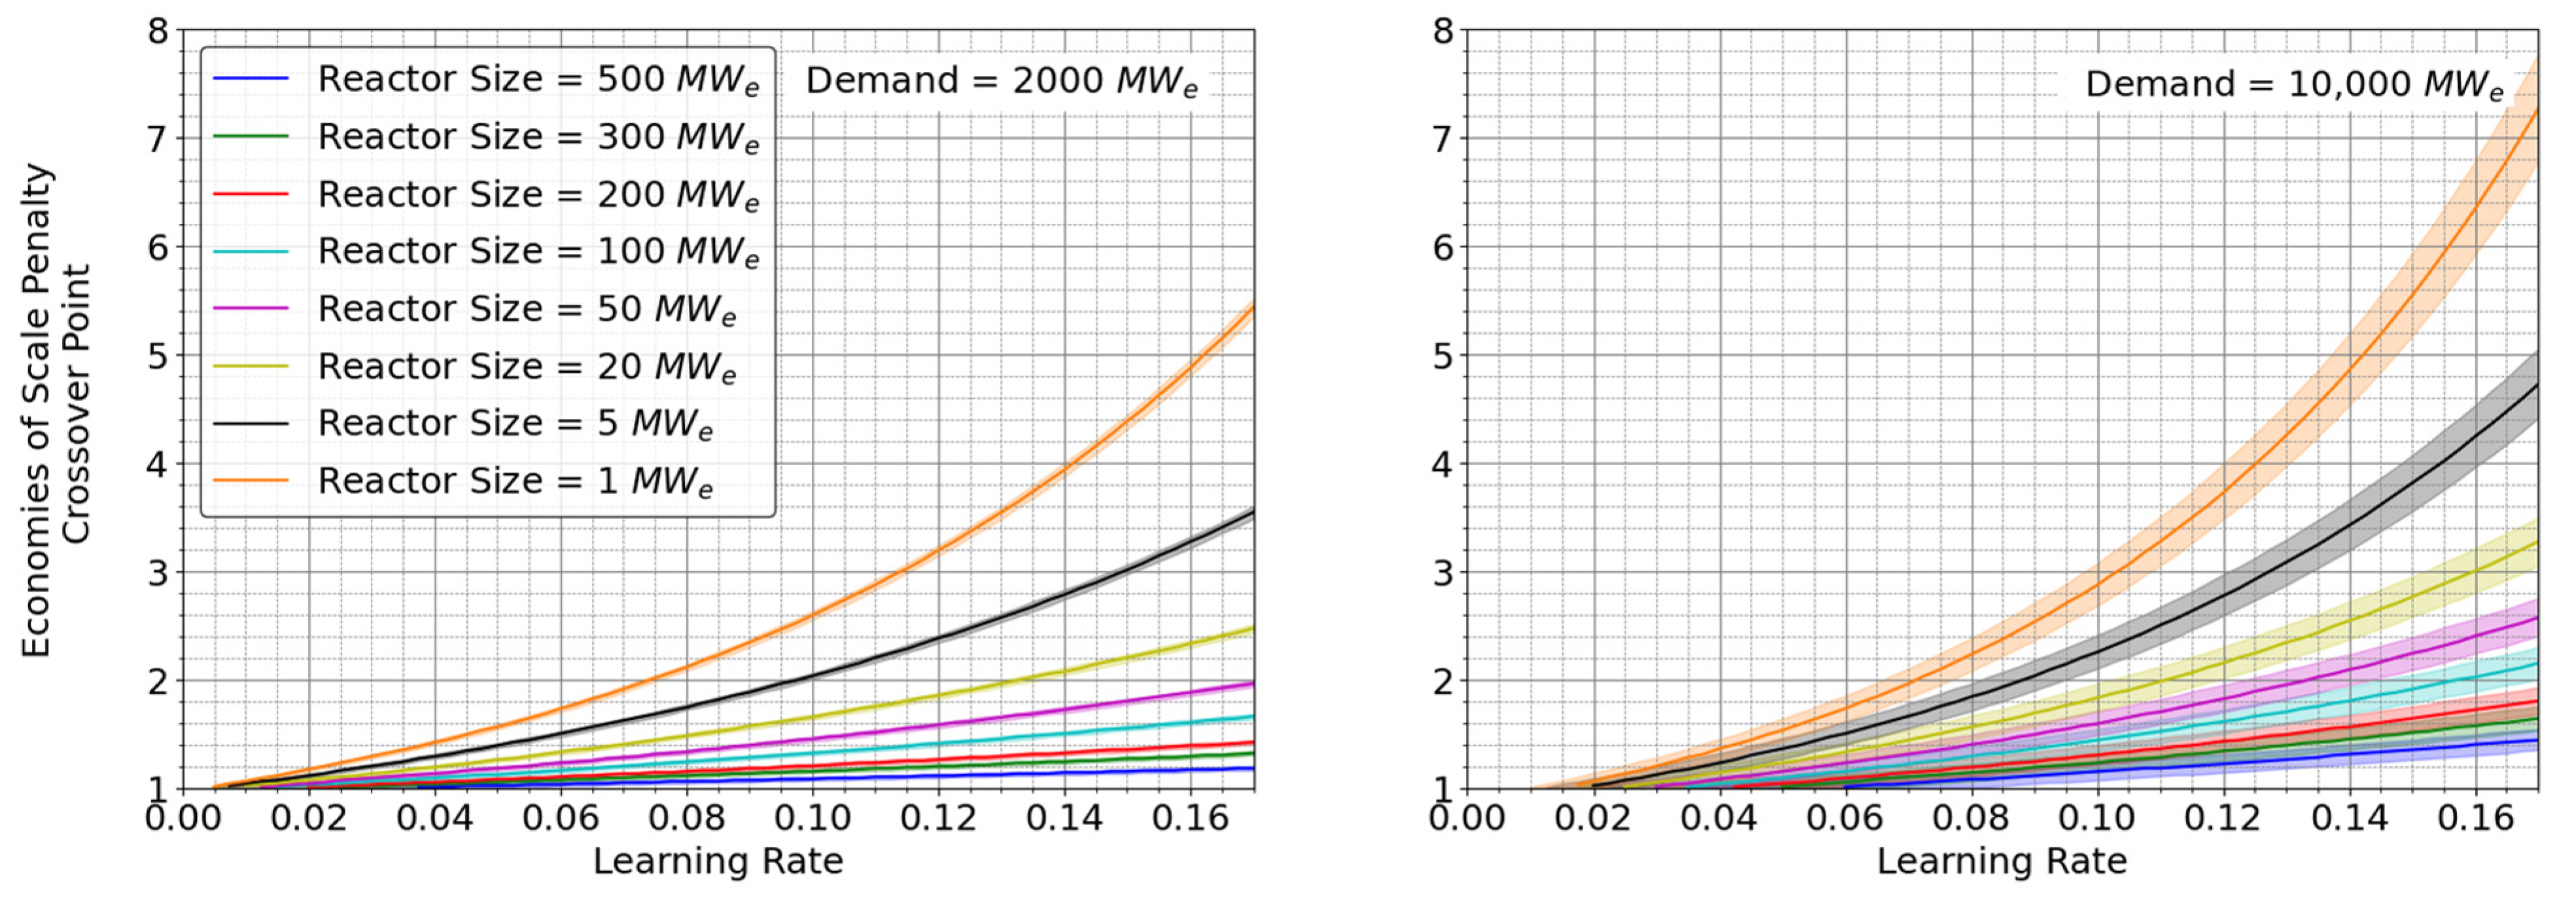
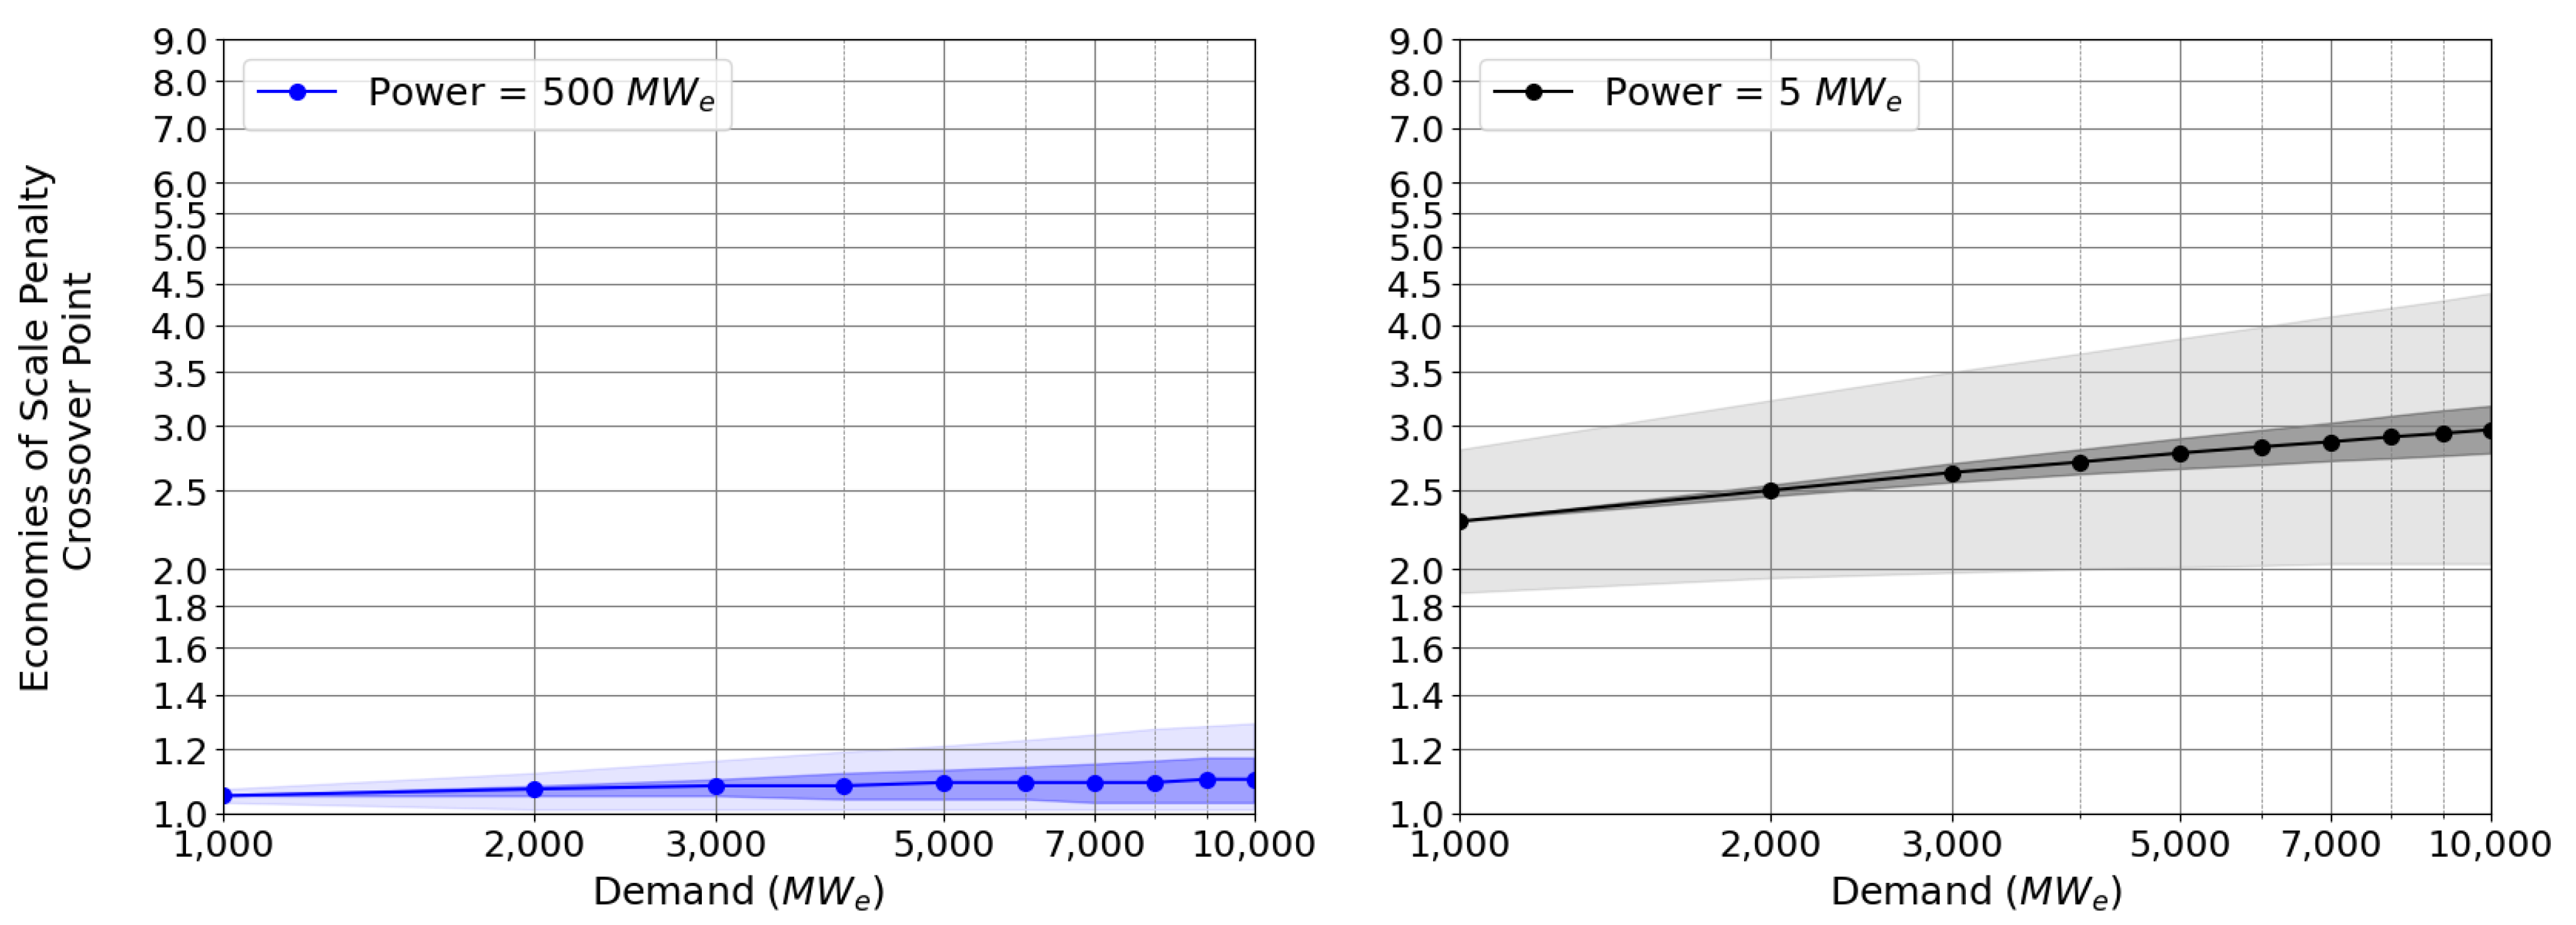
- Economies of Scale Penalty Crossover Point (Example Scenario)
2.1. Estimating the Crossover Point between Economies-of-Scale and Economies-of-Multiple
- The electricity demand is 1000 Mwe.
- The 1 MW microreactors are being built to satisfy this demand (1000 units are needed).
- Assuming that the LR of the 1 MW microreactor is 0.1.
2.2. Crossover Point for Assumed Learning Rate Value
3. Availability Factor Impact
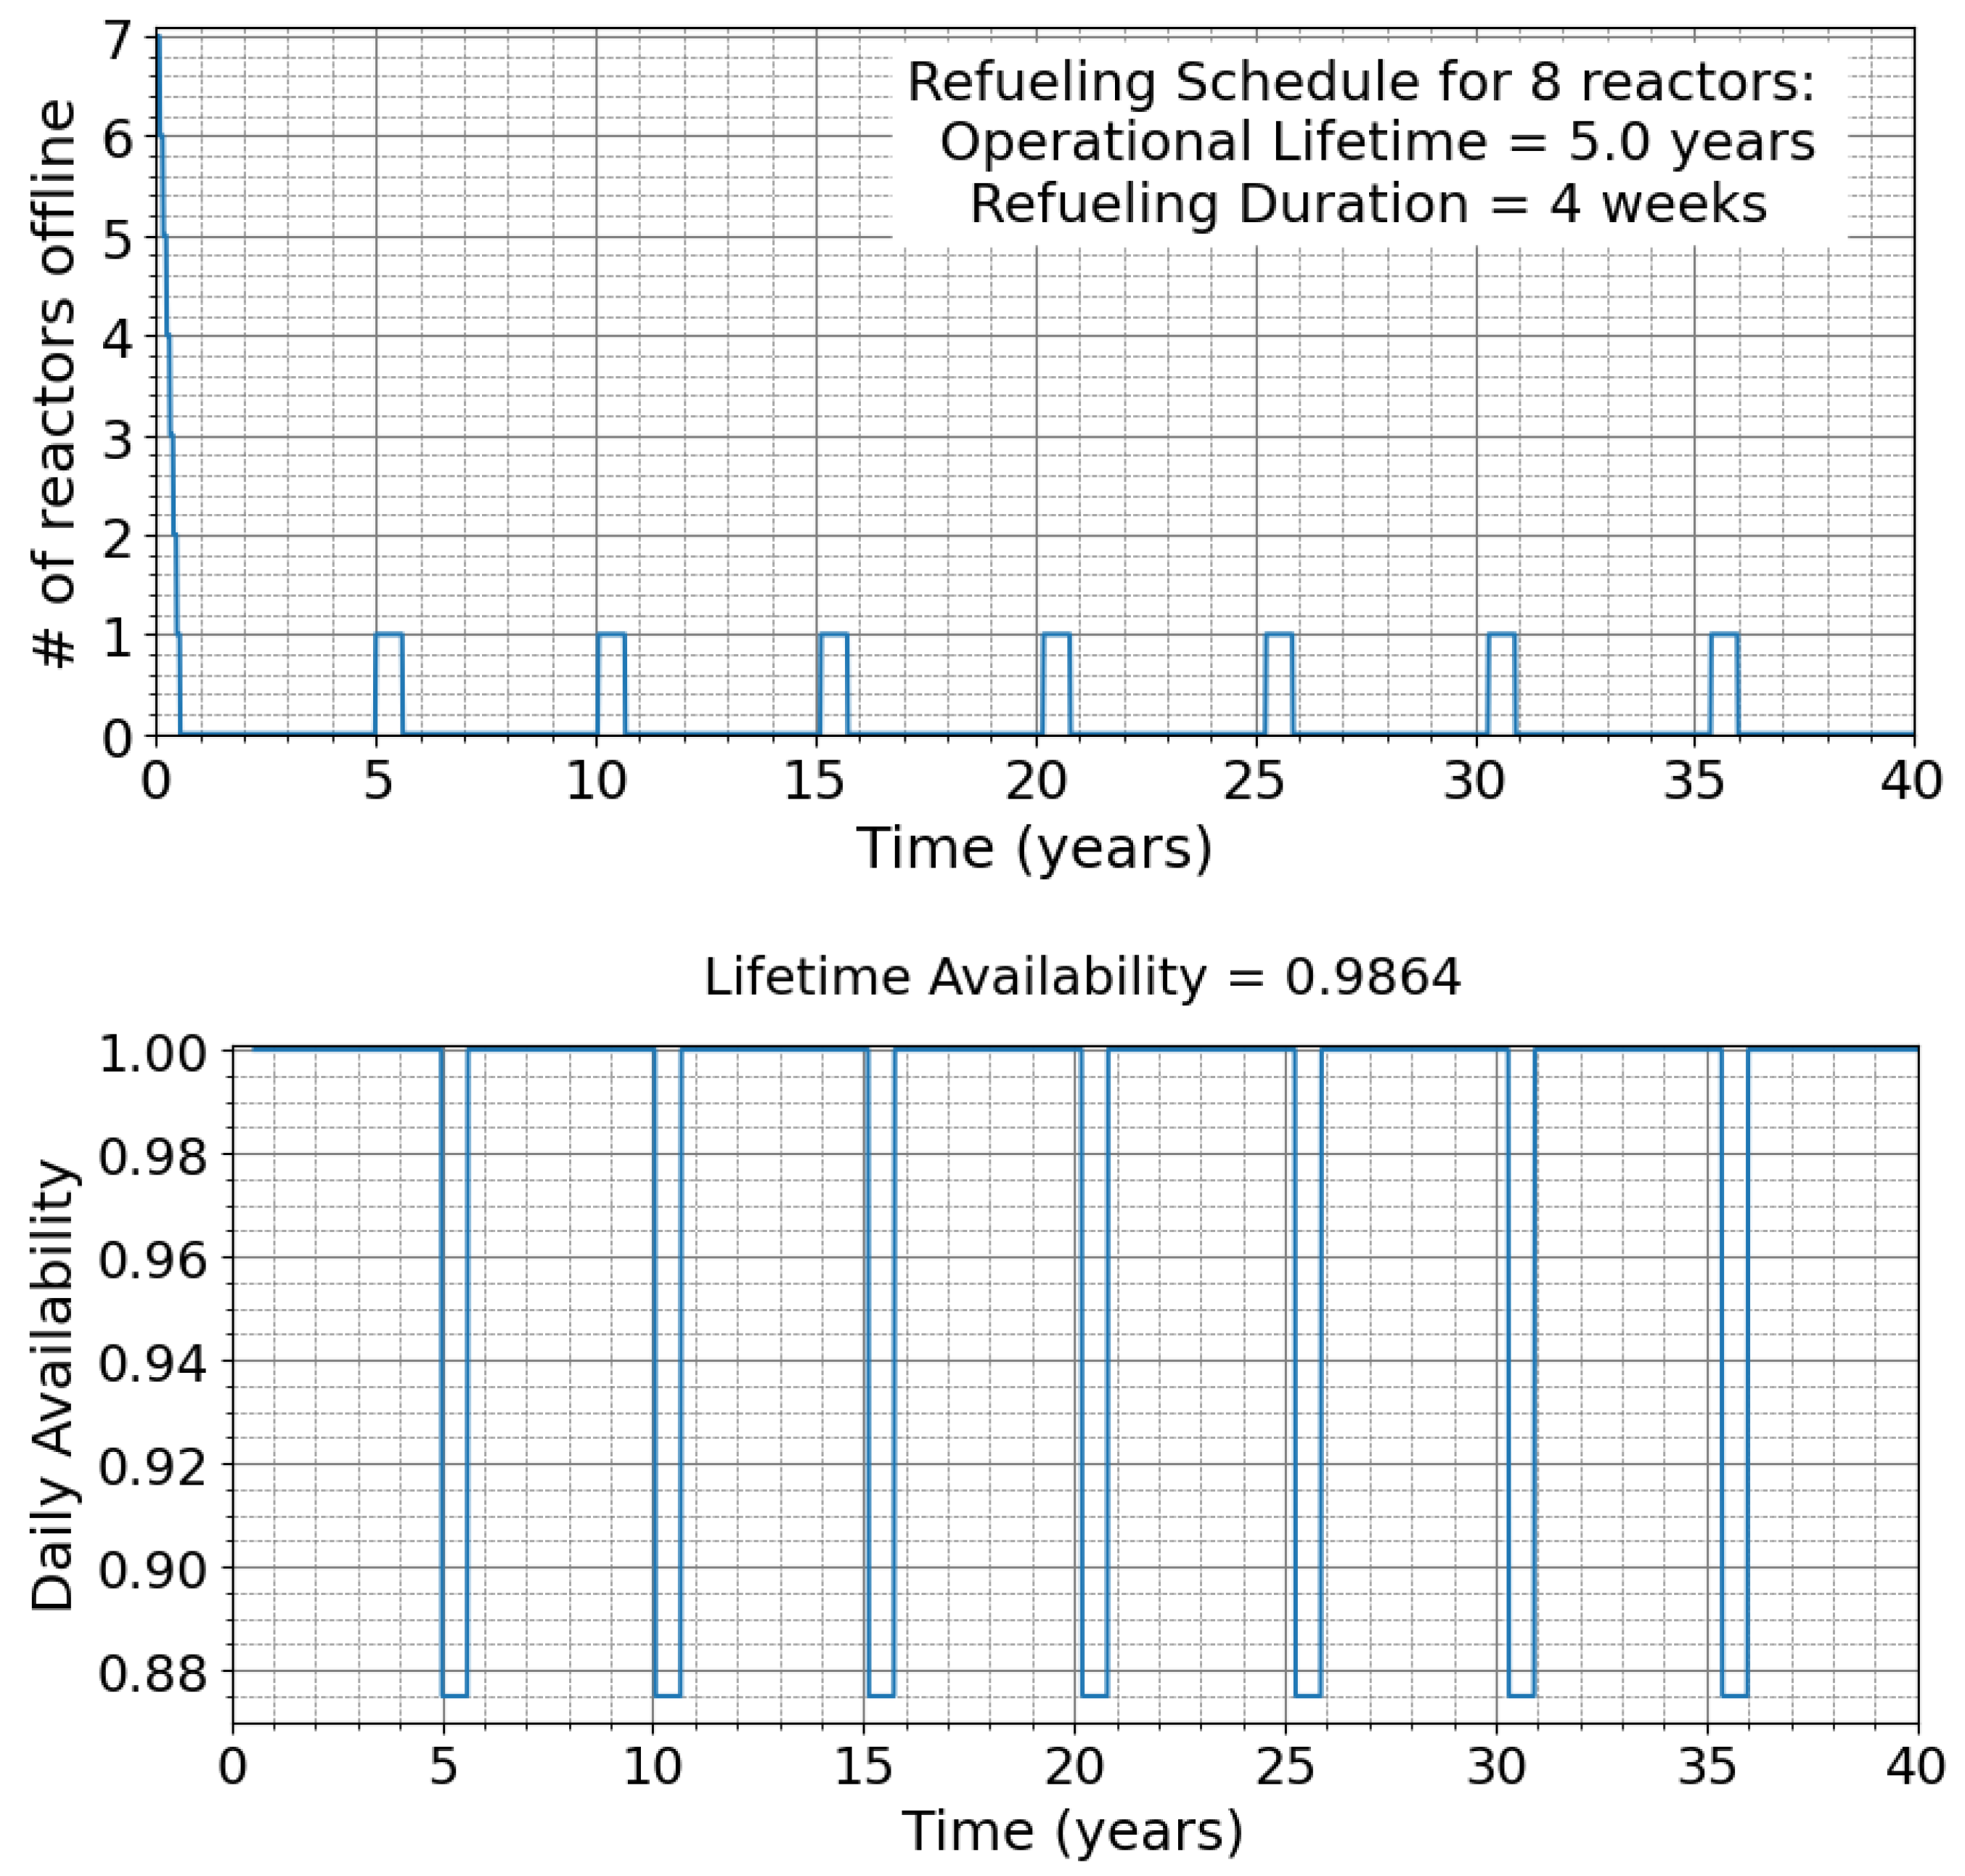
- Capacity factor: The ratio of the actual electrical output to the theoretical maximum. The capacity factor is influenced by operational efficiency, as well as planned and unplanned outages. It is inherent to the reactor technology itself. In this work, the capacity factor is estimated based solely on the duration and frequency of refueling. The mean time between a number of unplanned shutdowns is not accounted for explicitly.
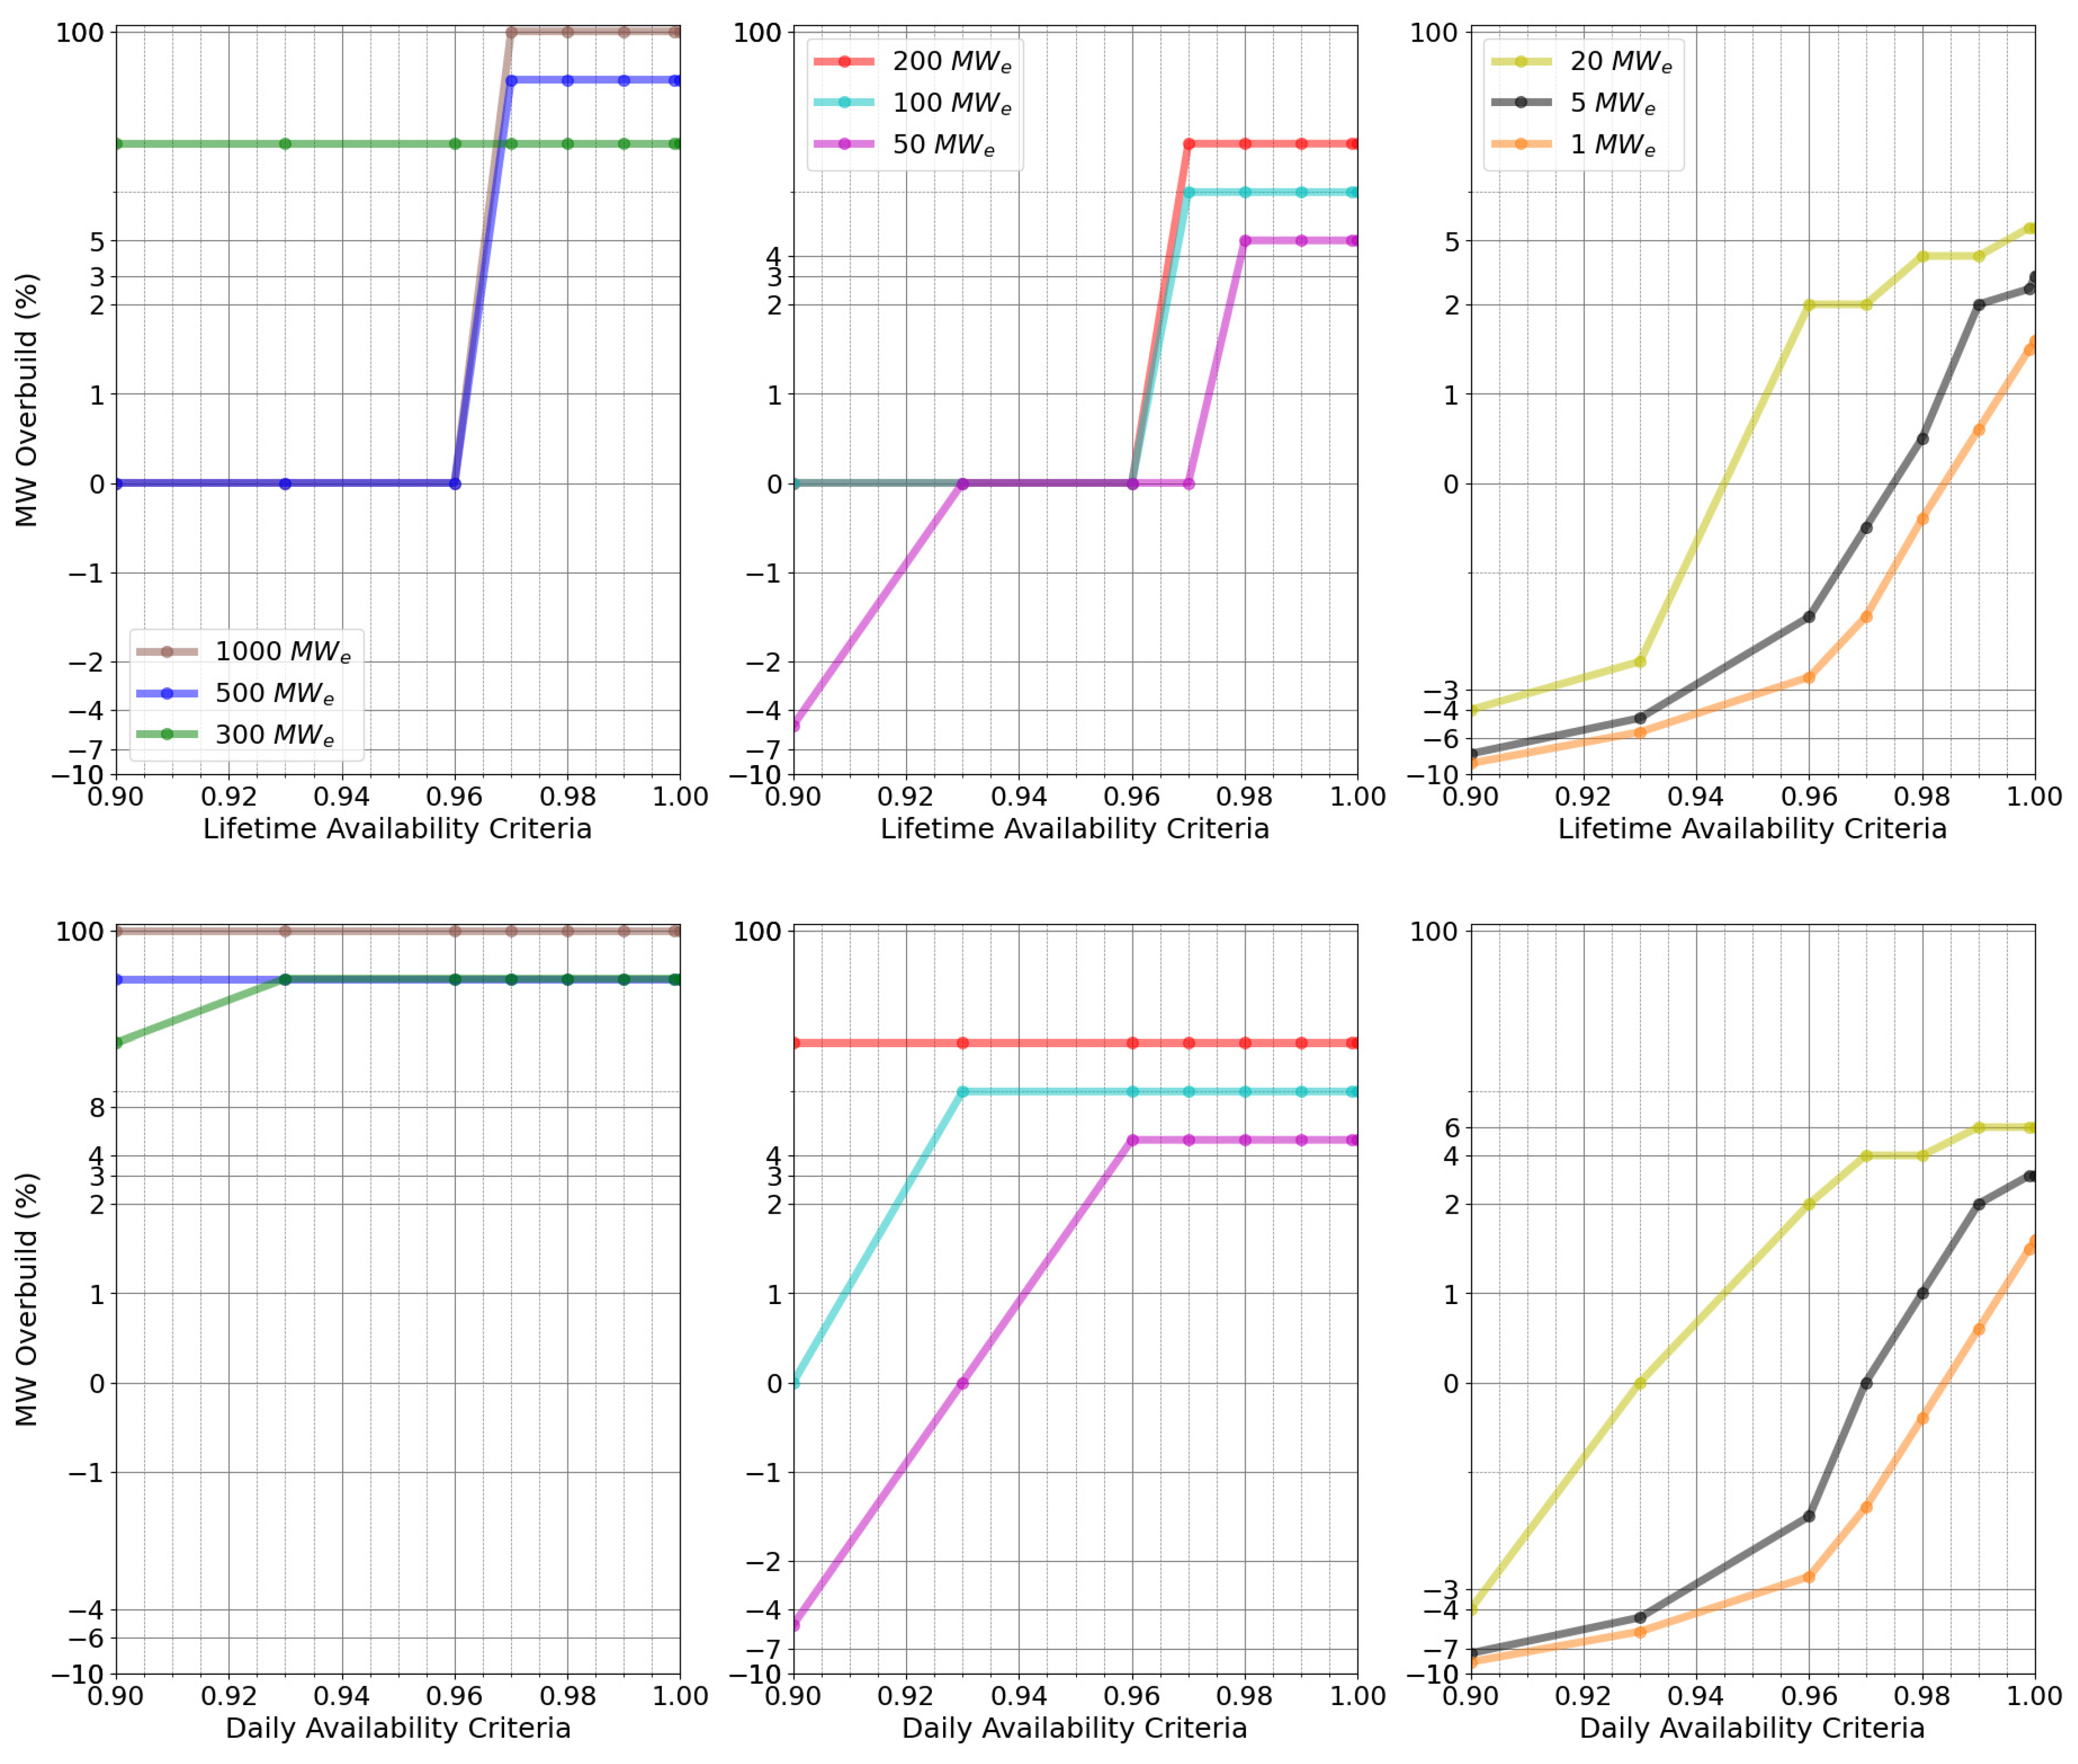
- Availability requirement: This a system-wide metric describing the demand-side requirement in terms of minimal downtime allowable. For instance, an availability requirement of 99% indicates that only 1% downtime energy generation is available. In effect, this is met by aggregating the capacity factor of individual reactors and often results in overbuilding to ensure targets are met. This study distinguishes between lifetime availability criteria, which must be satisfied over the nuclear plant’s lifetime, and daily or time-dependent availability criteria, which must be met each day. For example, a requirement of 99% lifetime availability can be met even if the total reactor output drops to zero on certain days (due to refueling, emergency shutdowns, etc.). However, daily 99% availability will not be satisfied unless the total energy output each day is at least 99% of the demand. The concept of daily availability is crucial for data centers, as they require consistent power, especially in a scenario where the data center is solely powered by a nuclear power plant. Examples illustrating these concepts will be presented in the following subsections.
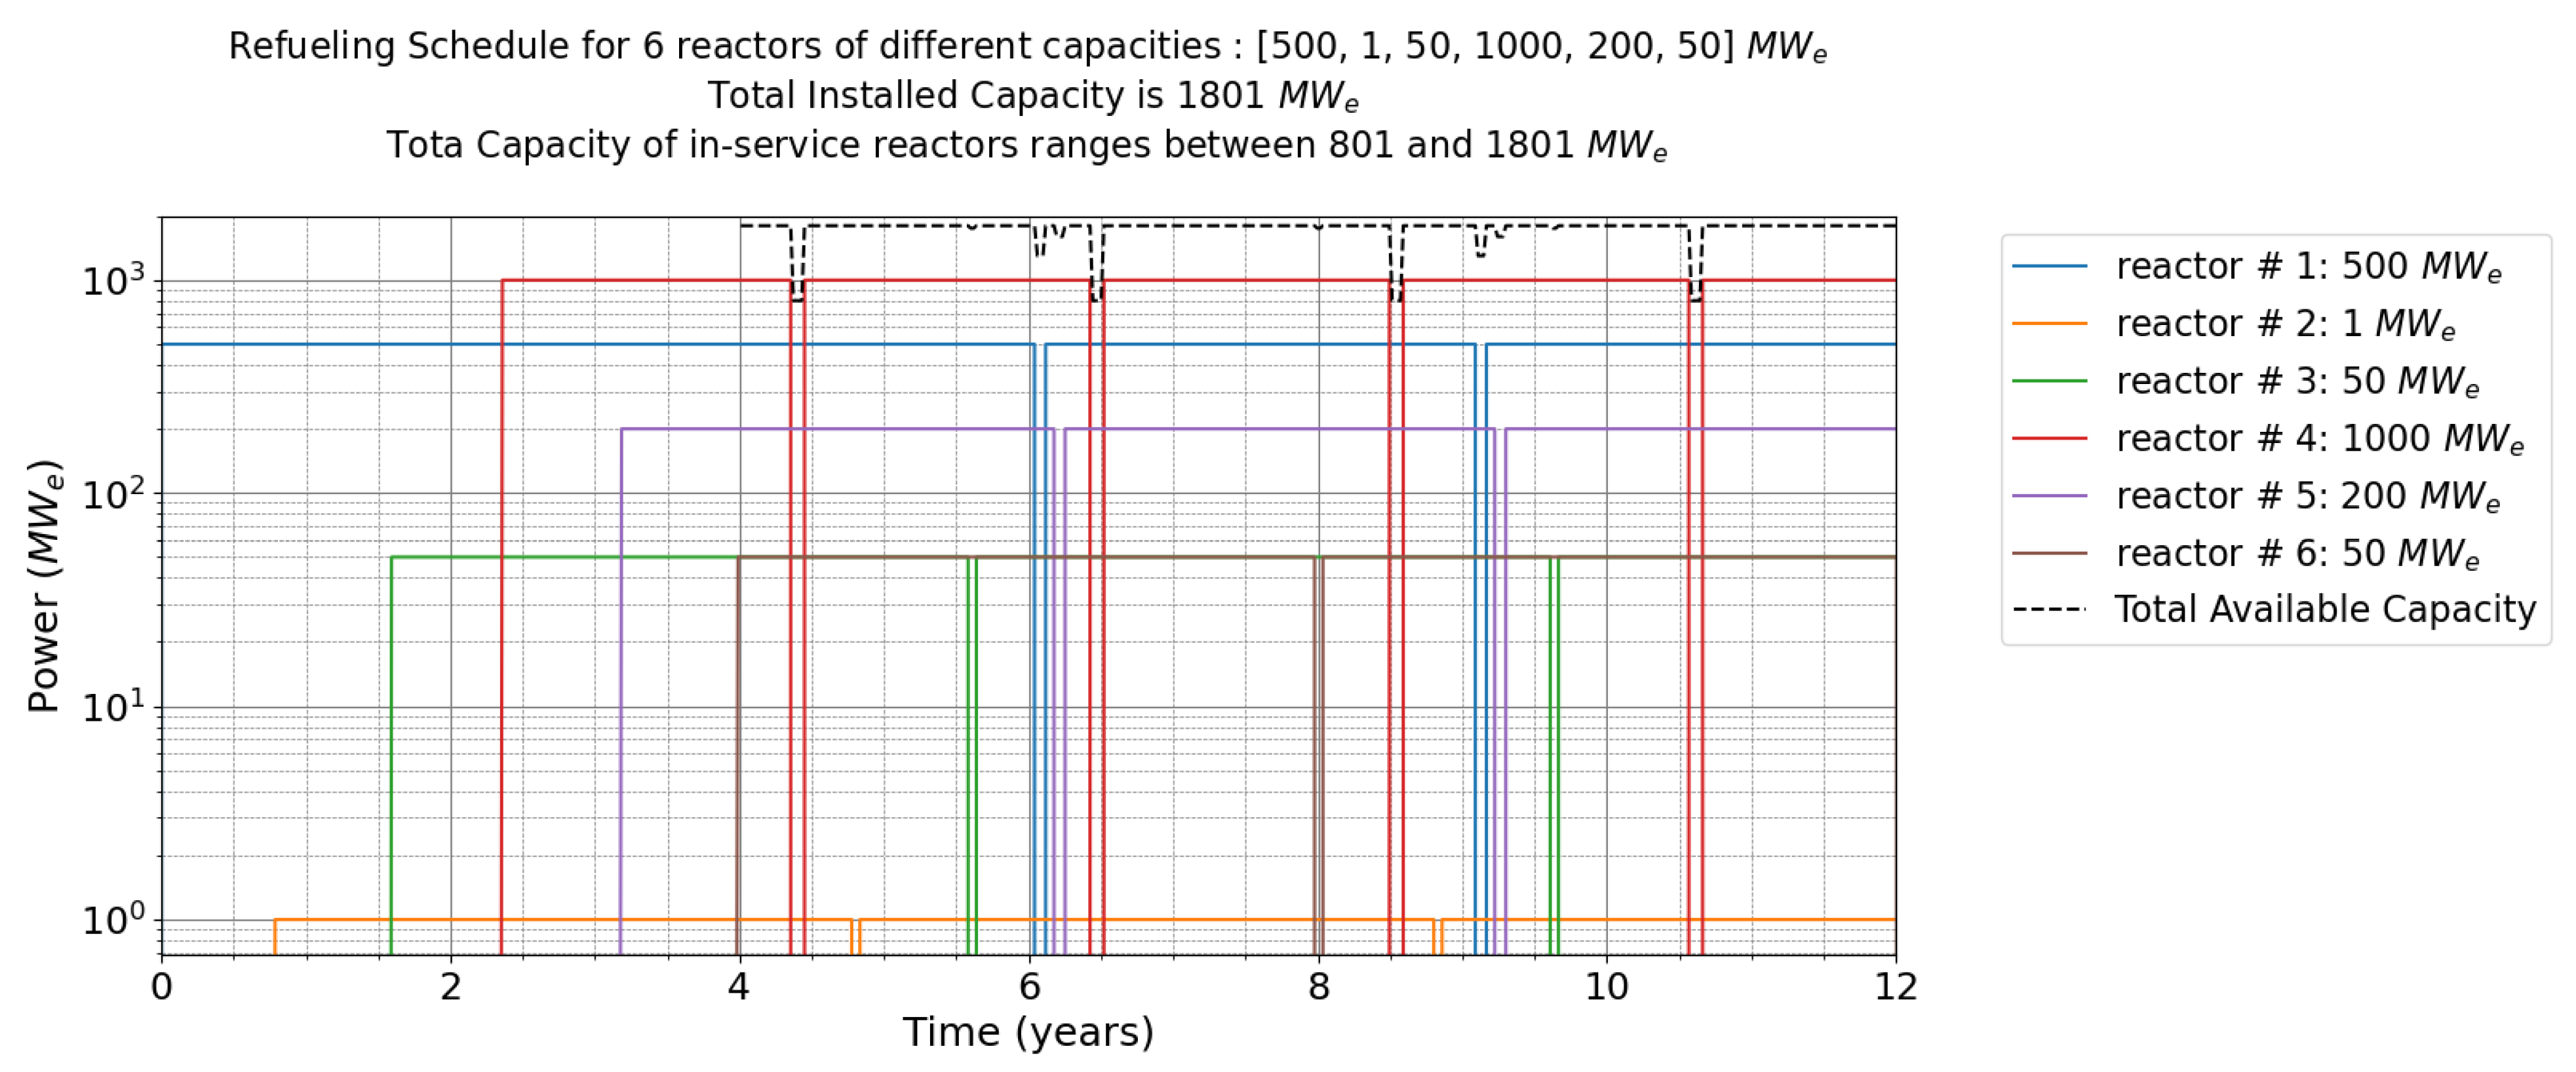
3.1. Overview of Refueling Model
3.2. Resulting Overbuilt Capacity
4. Quantitative Comparison of Economics of Reactor Size Using Best Estimates
4.1. Developing Economies of Scale Curves
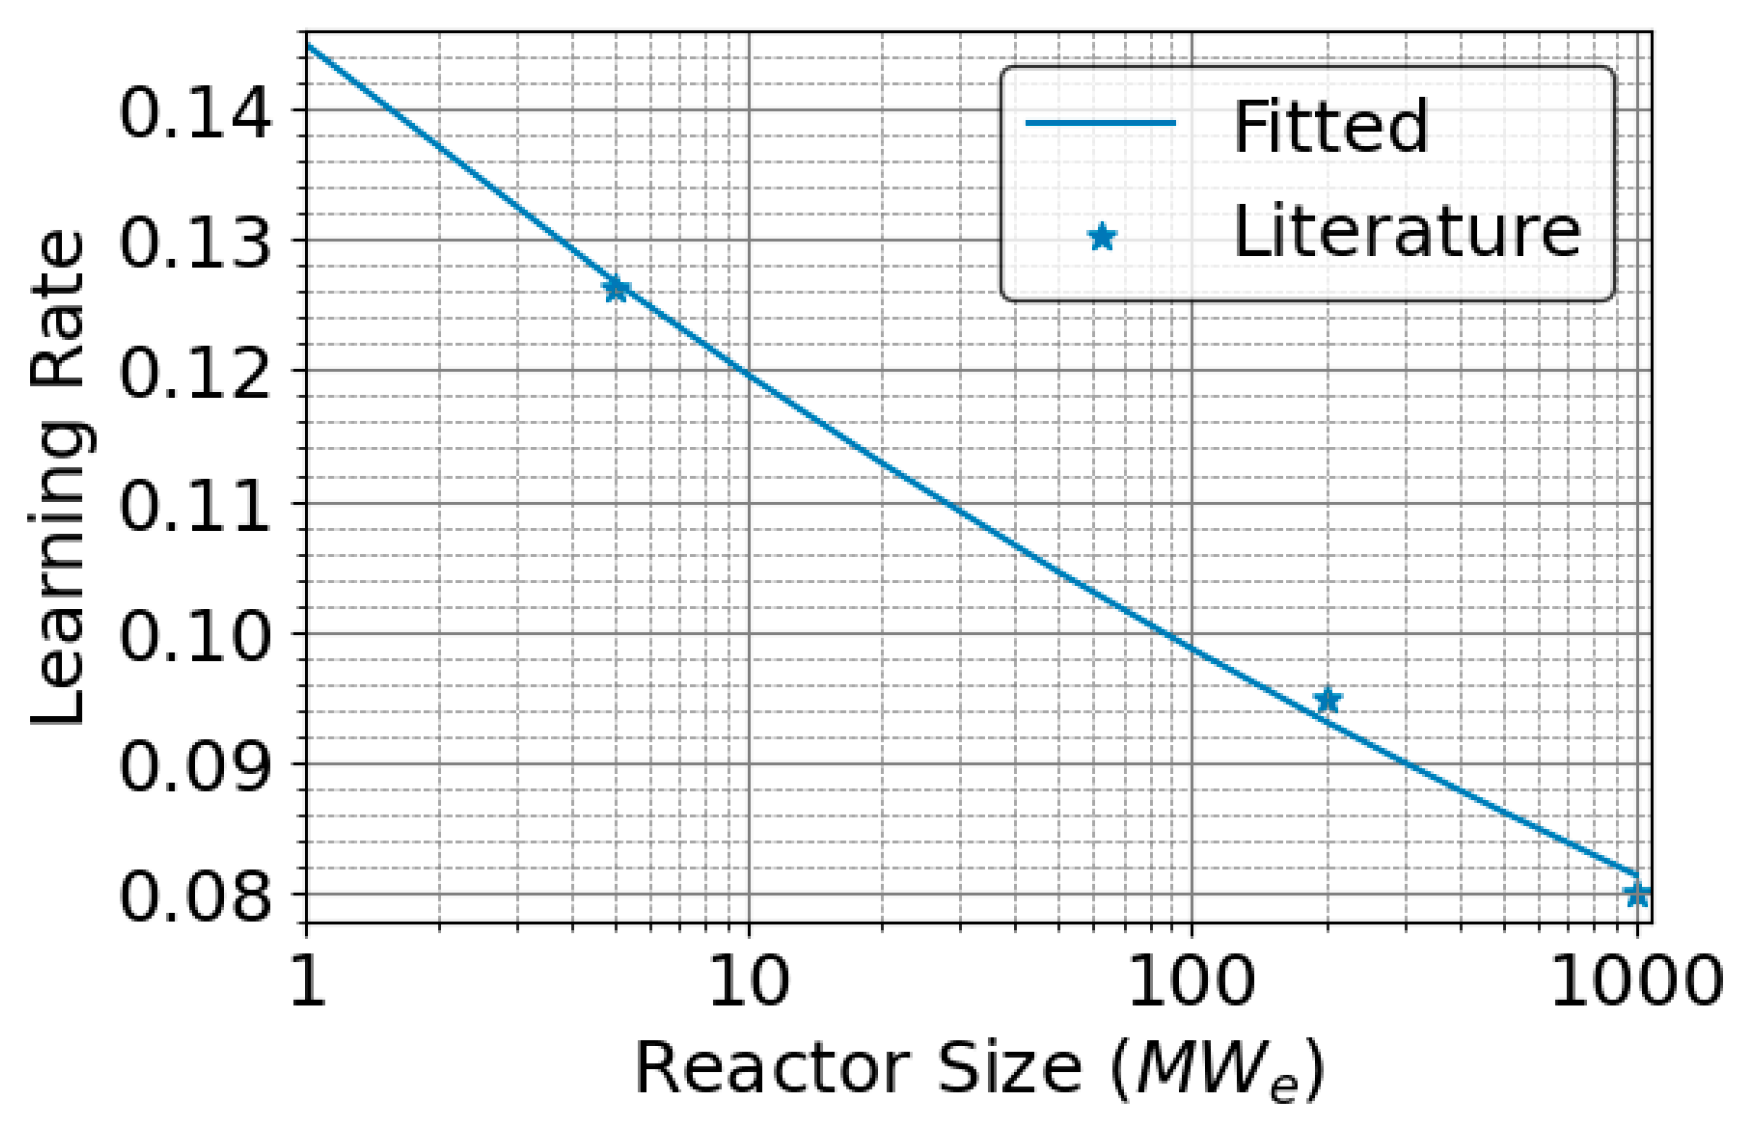
- Ref. [27]: This is the main reference used. It consists of a meta-analysis that surveyed more than 30 detailed cost estimates for nuclear energy and provided reference–cost ranges for large reactors and SMRs. Values are provided in low, medium, and high ranges for a BOAK reactor. Because the FOAK demonstrations are already well underway, the BOAK estimates (sometimes referred to as the “next commercial offering”) were deemed suitable for the purposes of this study. The OCC, O&M, LR, and construction time values from this paper were leveraged to fit economies of scale curves.
- Ref. [28]: Because the reference above did not include projected microreactor cost information, reference values for this class of reactor were derived from this reference. Again, this report consisted of a survey and consolidation of various cost estimates in the literature. While significant uncertainty remains for microreactor costs, especially, the reference provides a broad range of where costs are expected to lie.
- Ref. [42]: The impact of economies of multiple on OCC is represented via the learning rate effect. For O&M costs, however, there are well-documented synergies in hosting multiunit plants. This is not exactly the same as the learning effect, but it can be represented in a similar fashion. This reference recommends an asymptotic function for multiunit O&M cost reductions that plateaus at a certain value. According to [42], a fixed fraction of the O&M cost remains constant, and the remaining cost increases linearly with an increased number of units. Using the correlation and leveraging literature [43,44,45] about the levelized O&M cost reduction with building more units, a curve was fitted to evaluate the O&M cost’s dependence on the number of units.
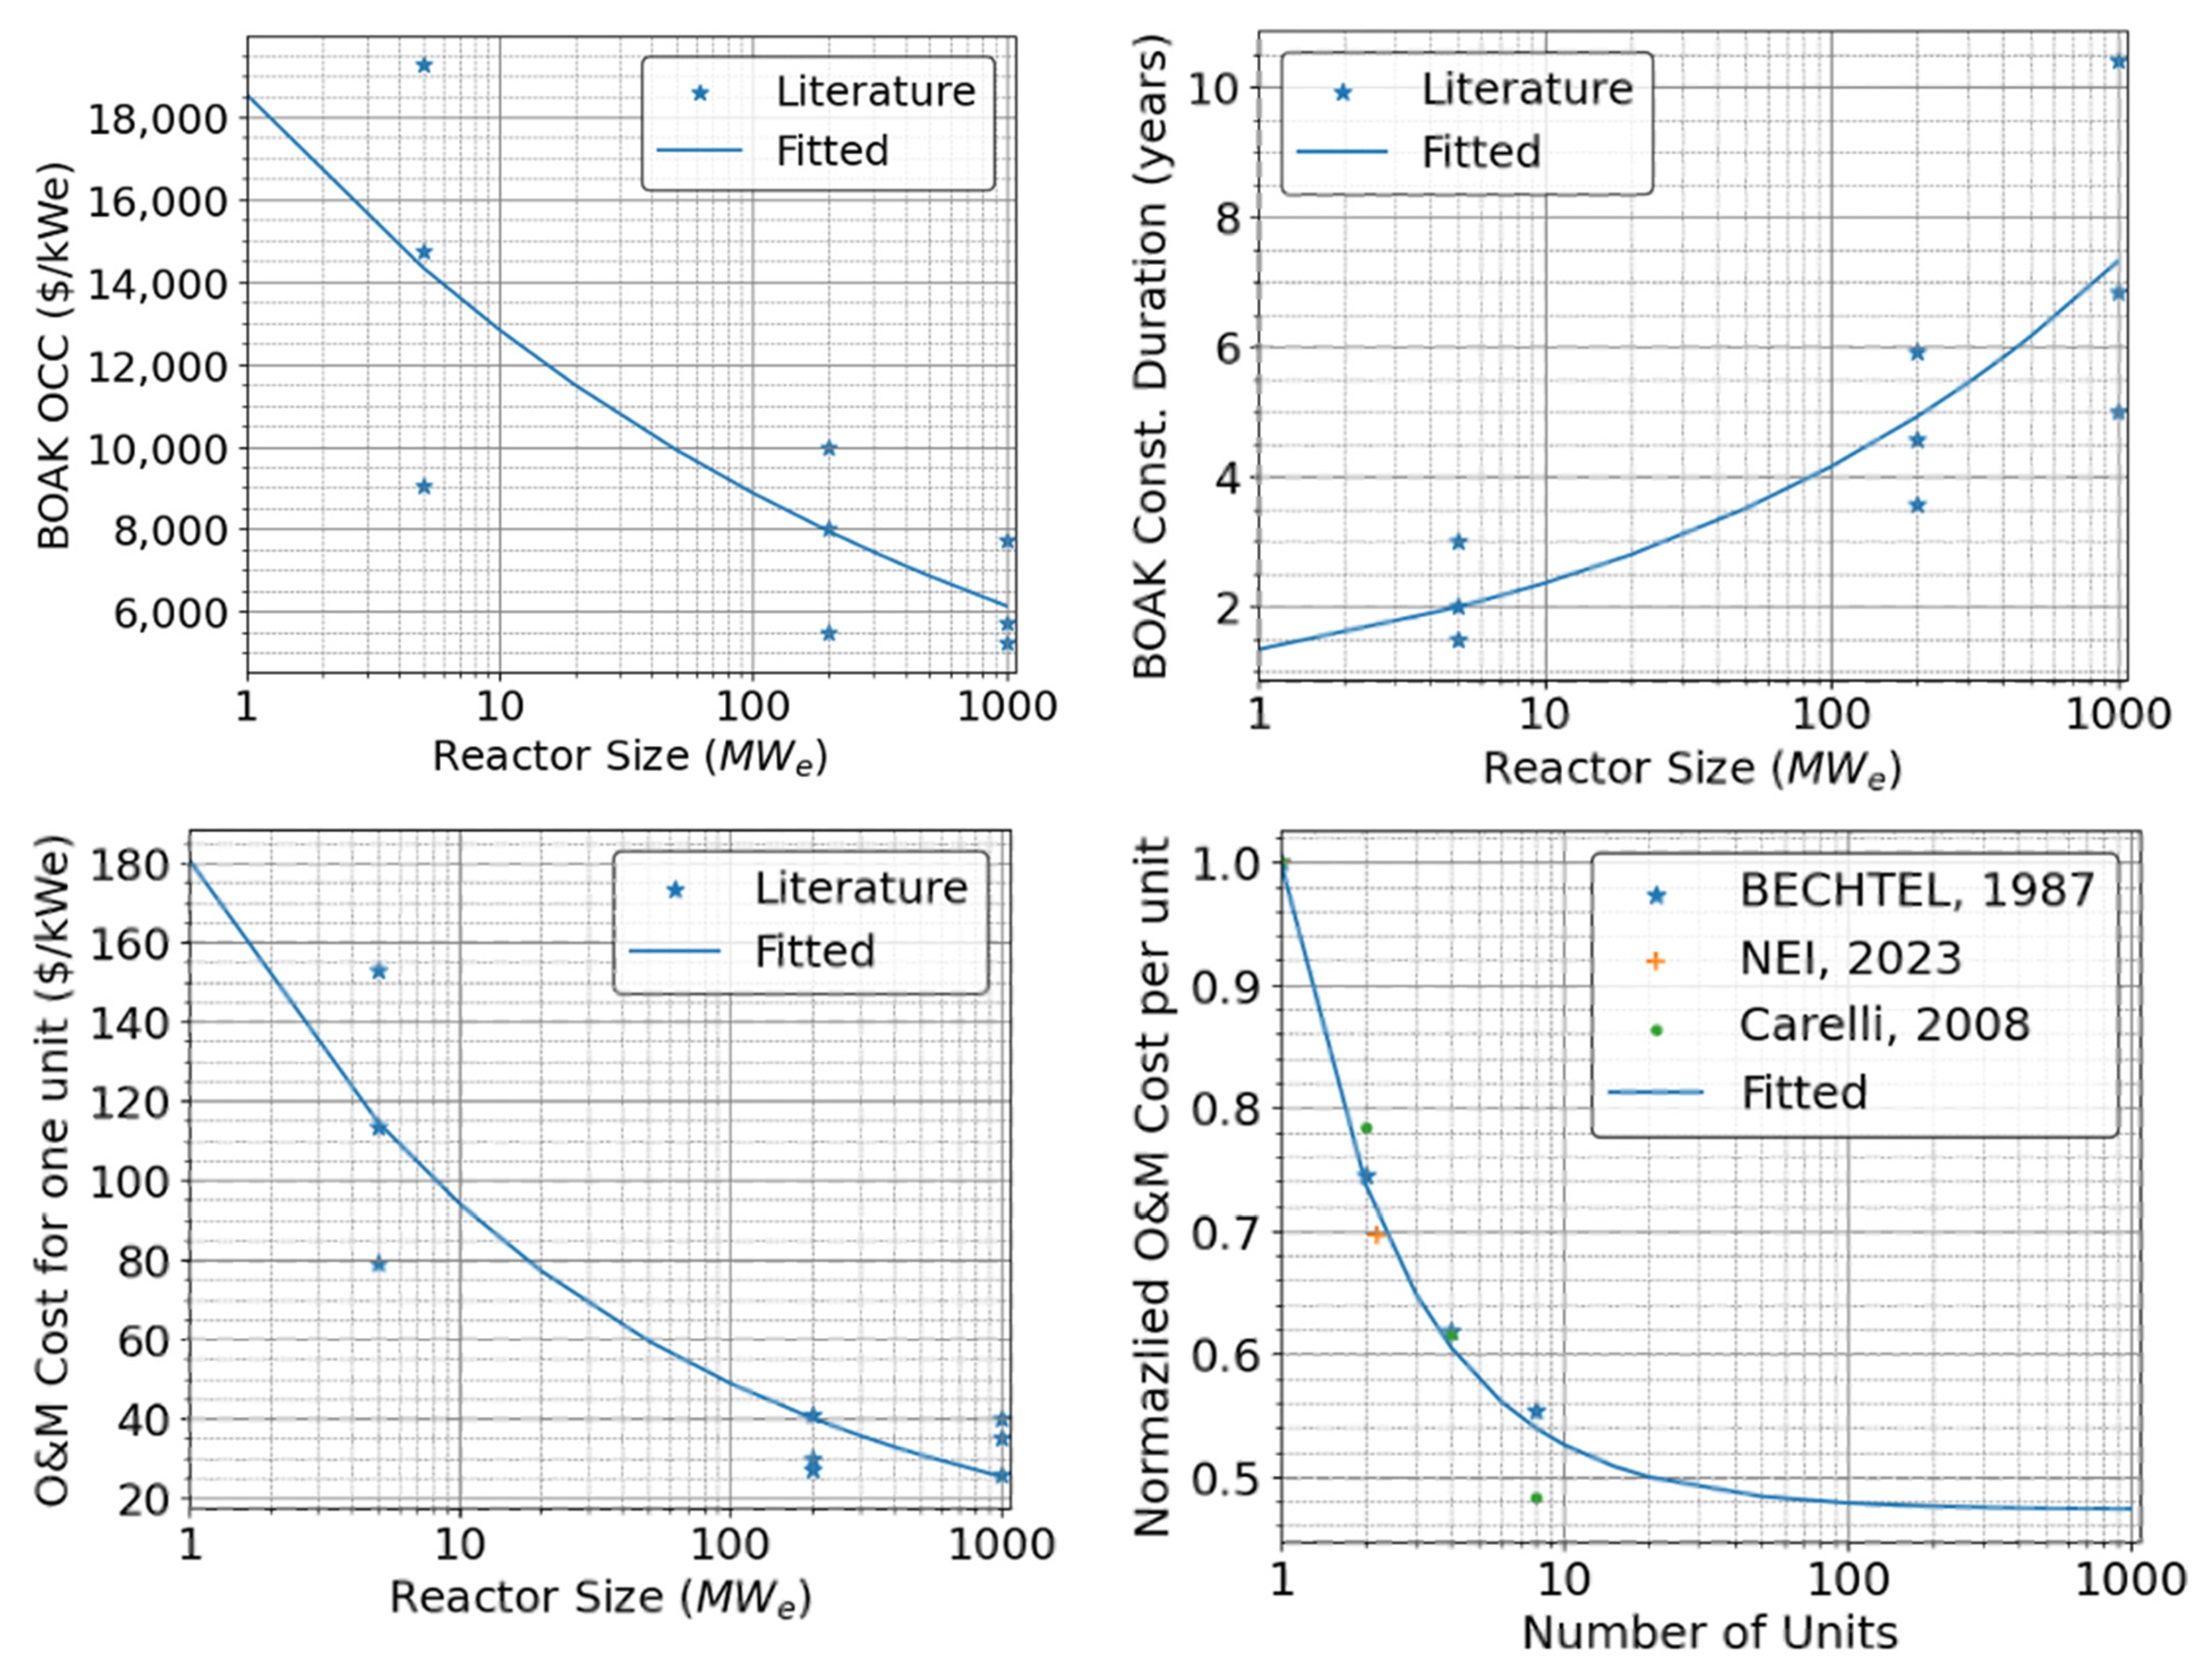
| Equation | Value at 1 GW | Value at 300 MW | Value at 5 MW | Refs. | |
|---|---|---|---|---|---|
| BOAK OCC (USD/kWe) | 6145 | 7451 | 14,347 | [27,28] | |
| O&M (USD/MWh) for one unit | 25 | 36 | 115 | [27,28] | |
| Normalized O&M cost reduction with more units | 0.74 (2 units), 0.61 (4 units), 0.54 (8 units) | [42,43,44,45] | |||
| BOAK Construction duration (months) | 90 | 65 | 24 | [27,28,46] | |
| LR | 8% | 9% | 12.7% | [27,28,34] | |
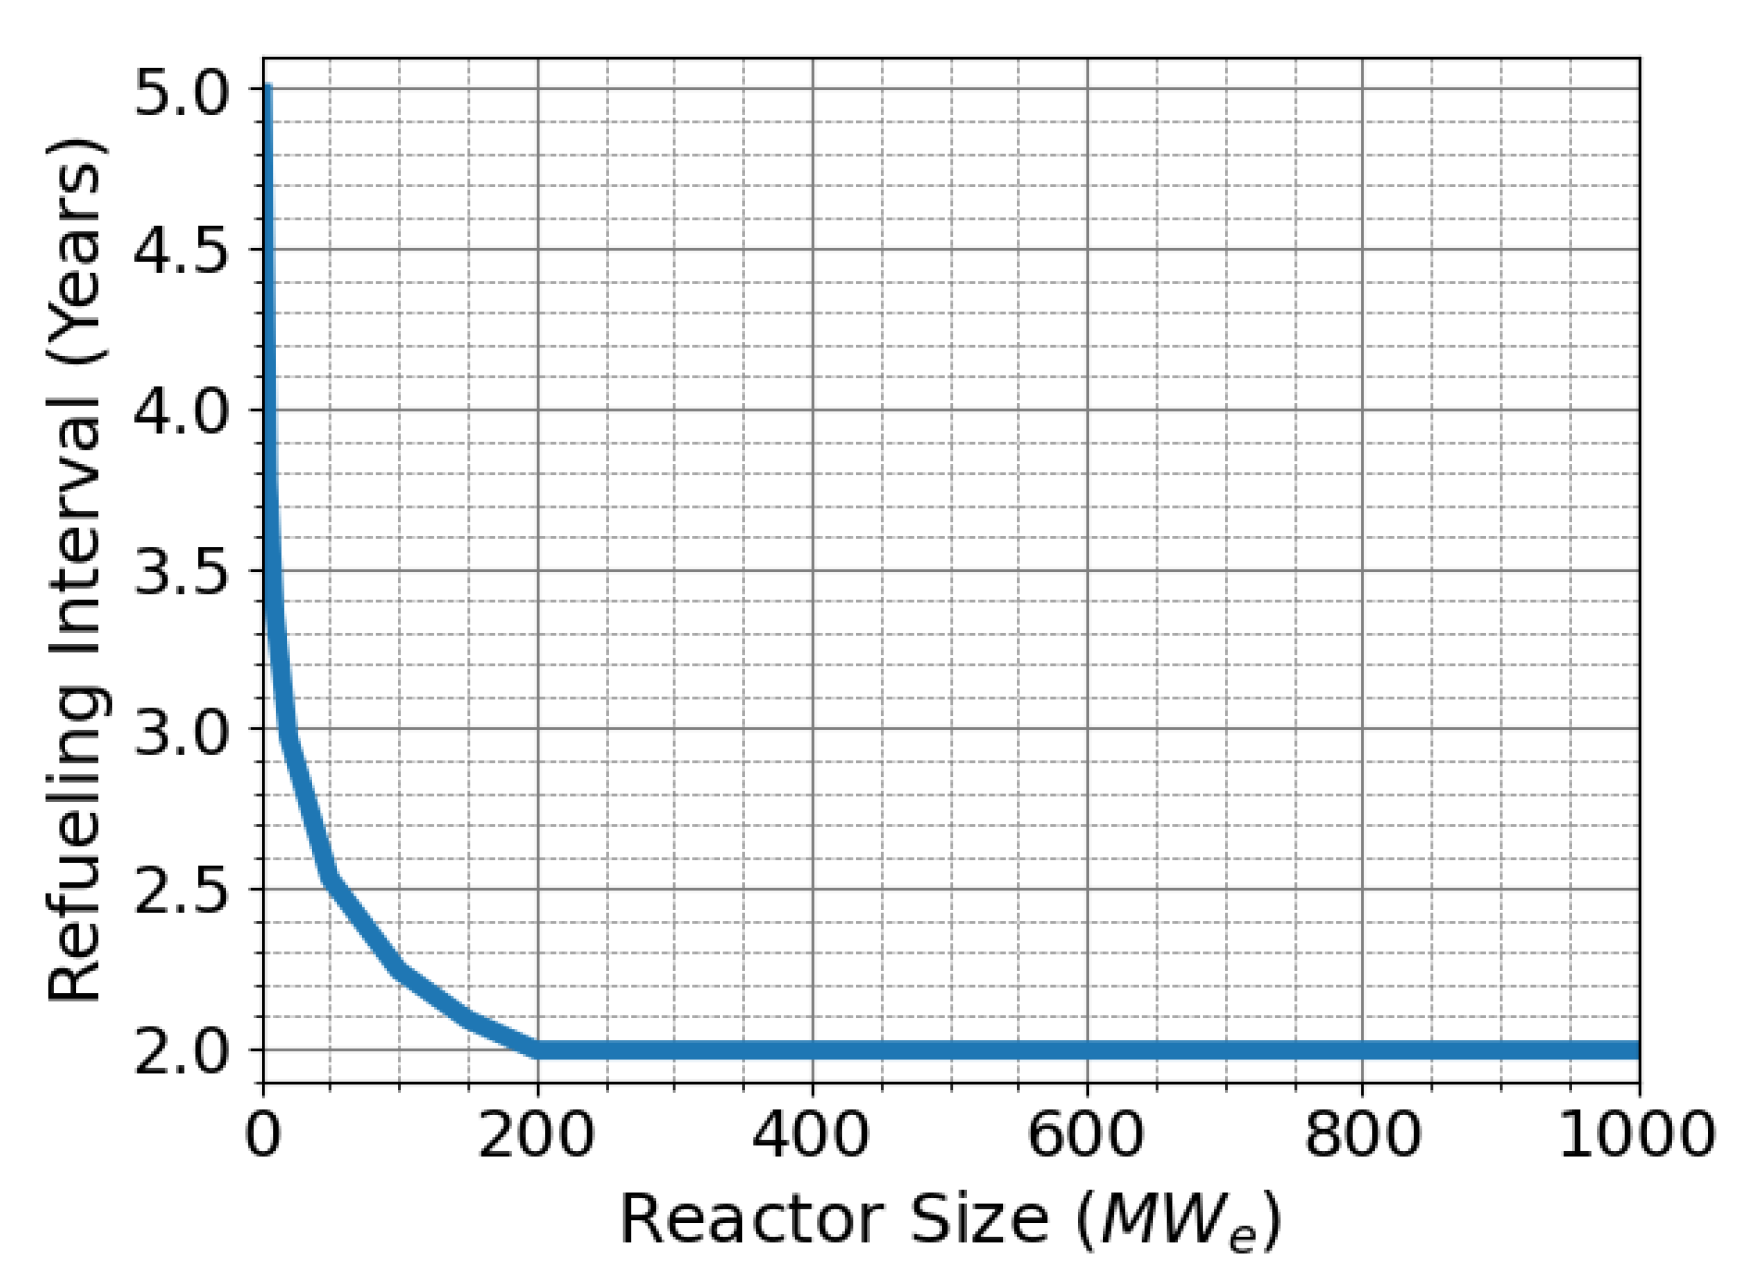
| Refueling interval (years) | (2 years if P ≥ 200) | 2 | 2 | 3.8 | [40,41] |
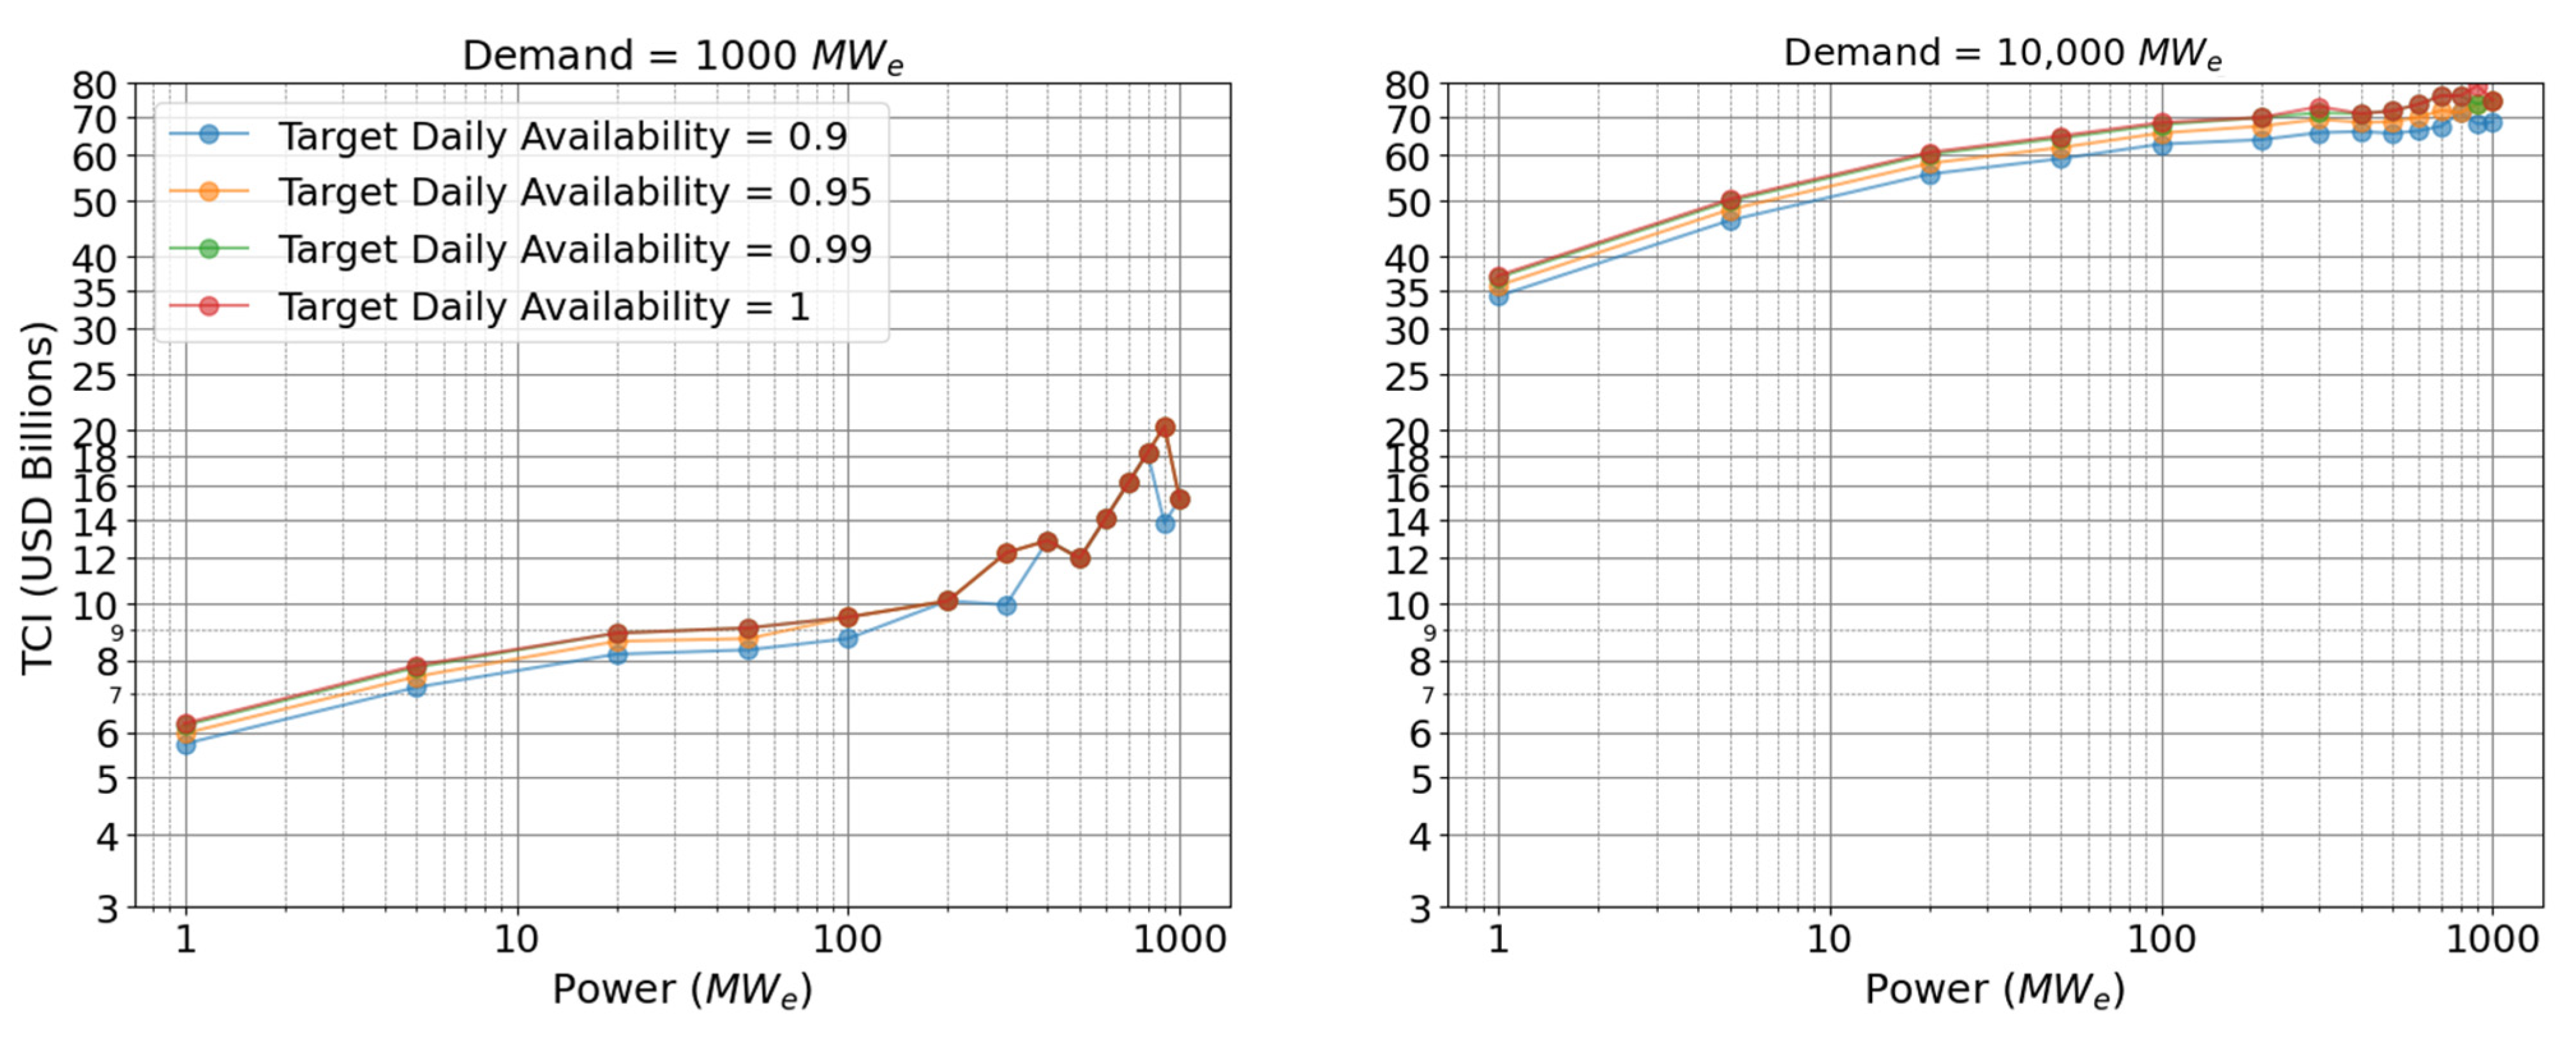
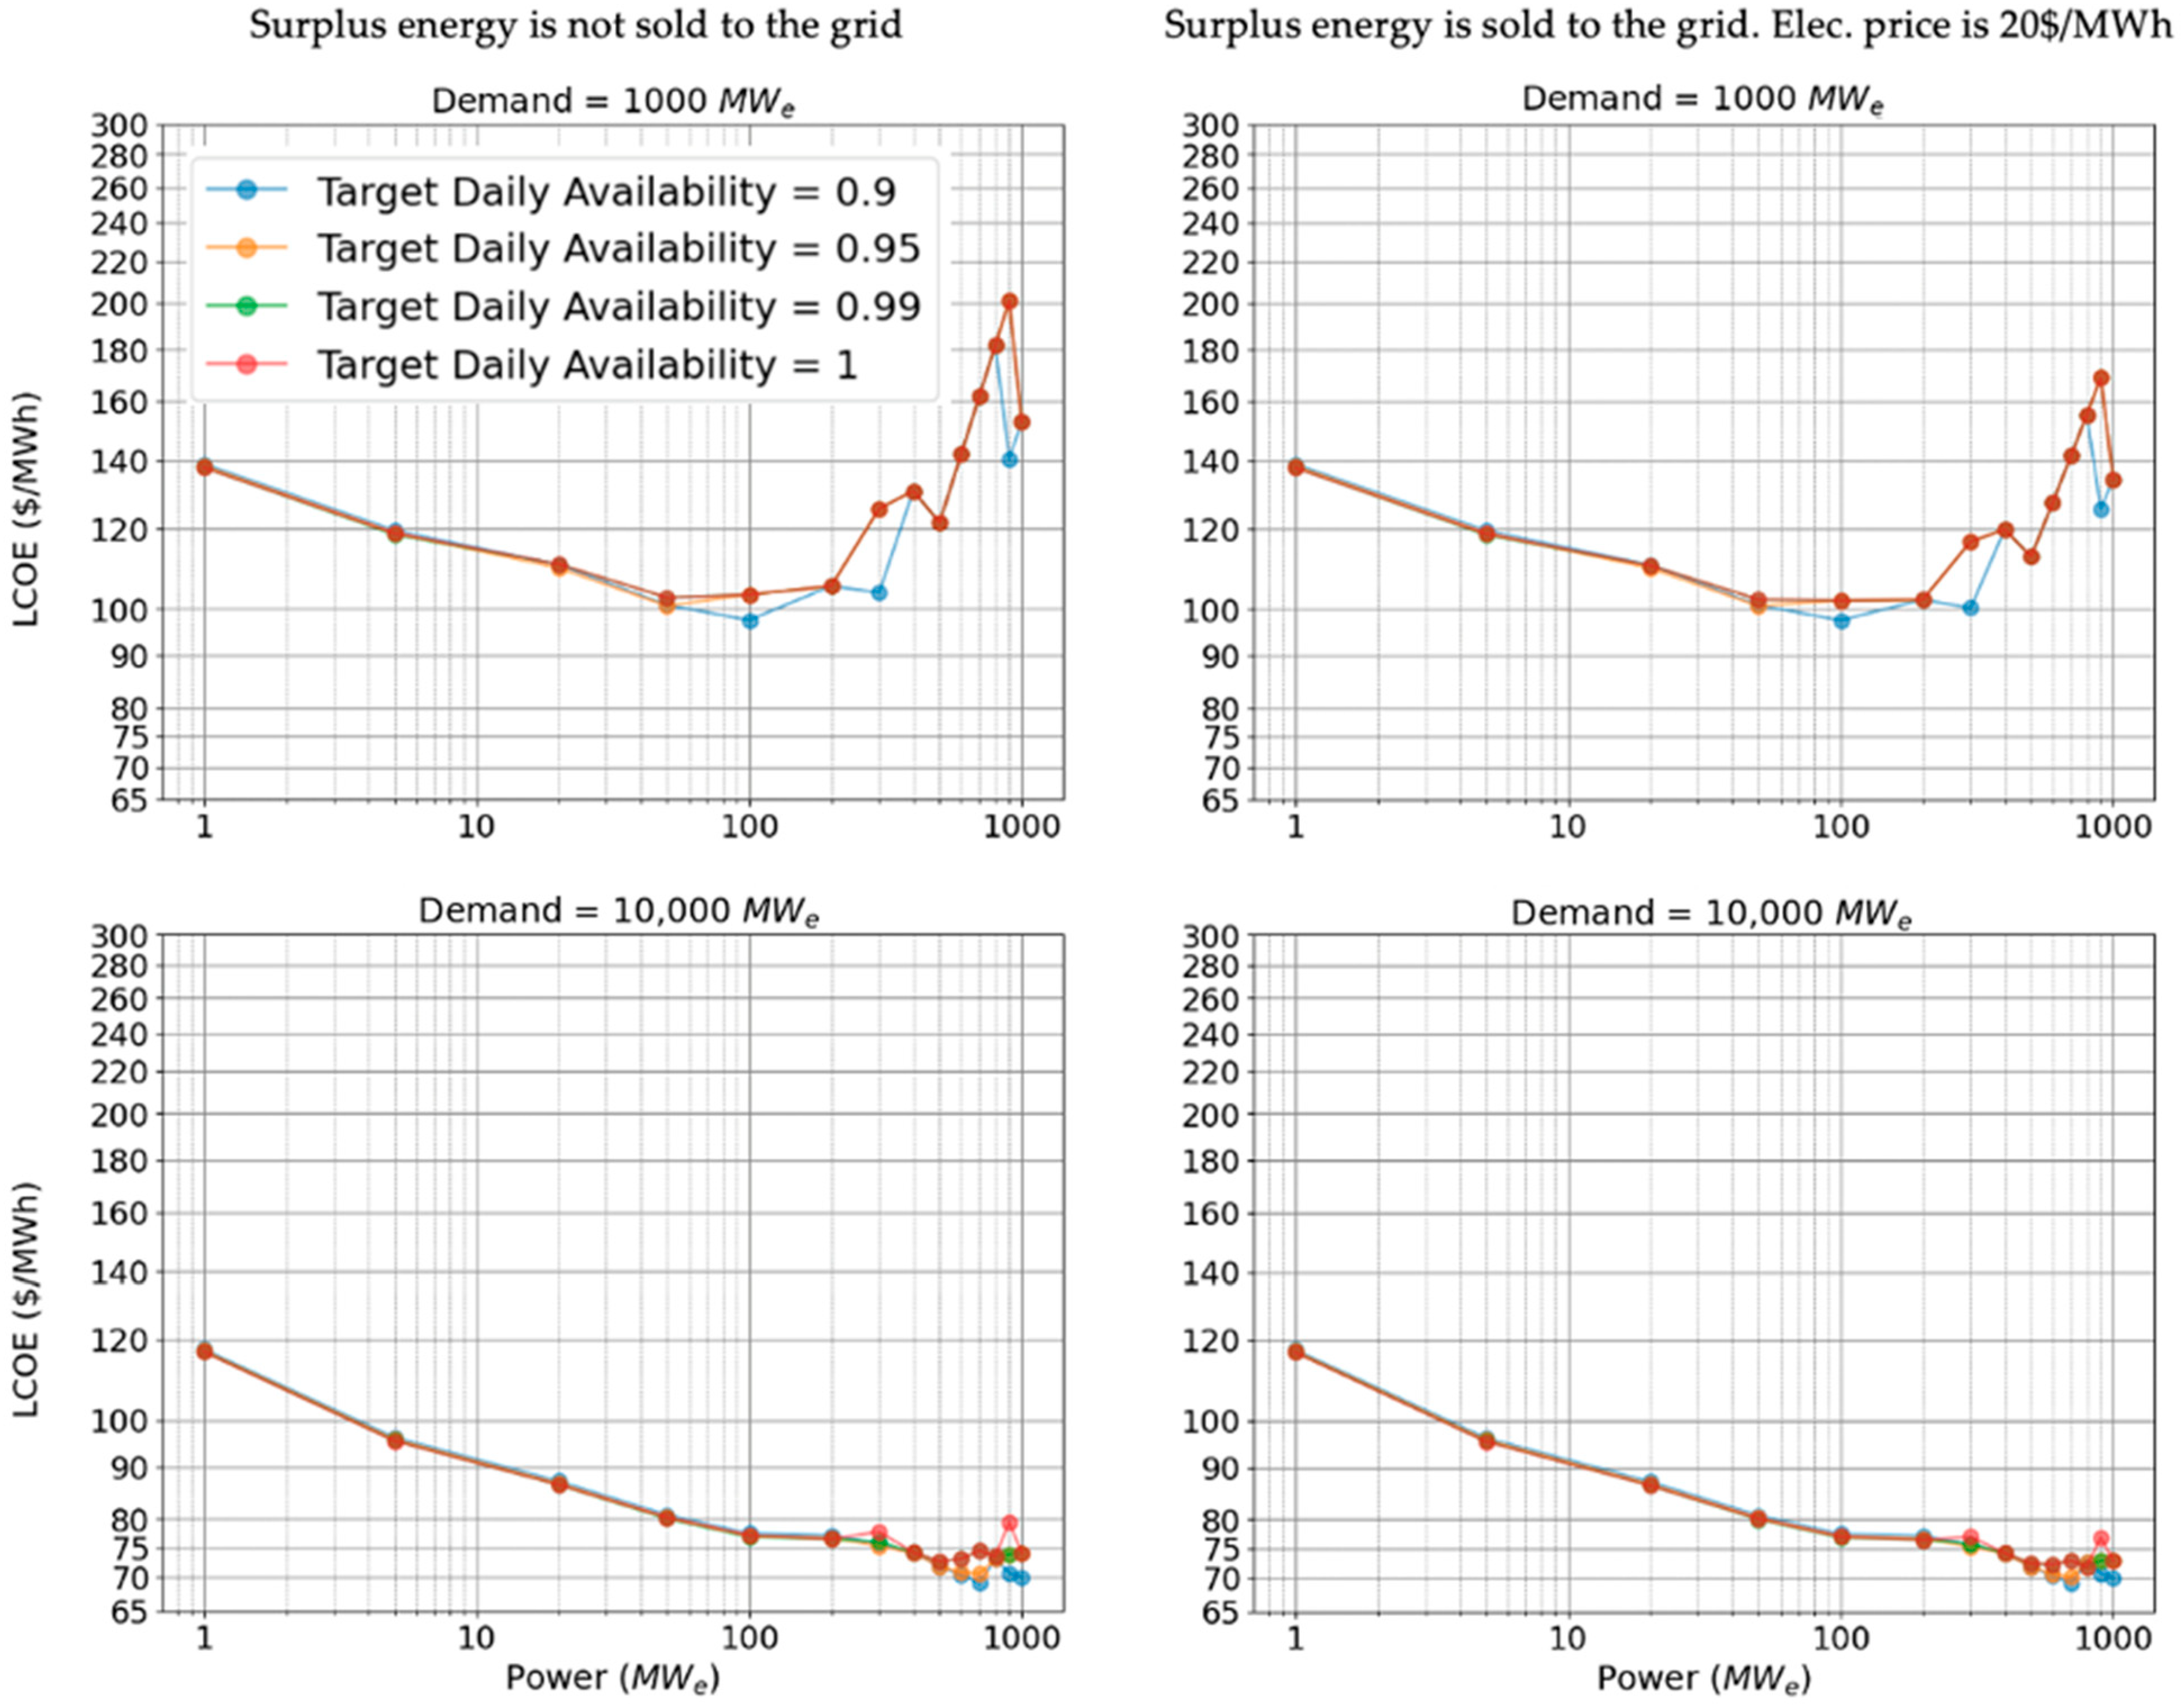
4.2. Resulting Technoeconomic Assessment
5. Optimizing the Mix of Nuclear Reactor Sizes
5.1. Methodology for Evaluating Mixed Reactor Size Arrangements
5.2. Imposing Daily Availability Requirements
5.3. Imposing Lifetime-Based Availability Requirements
6. Applicability to Other Sectors: Thermal Heat Use Case
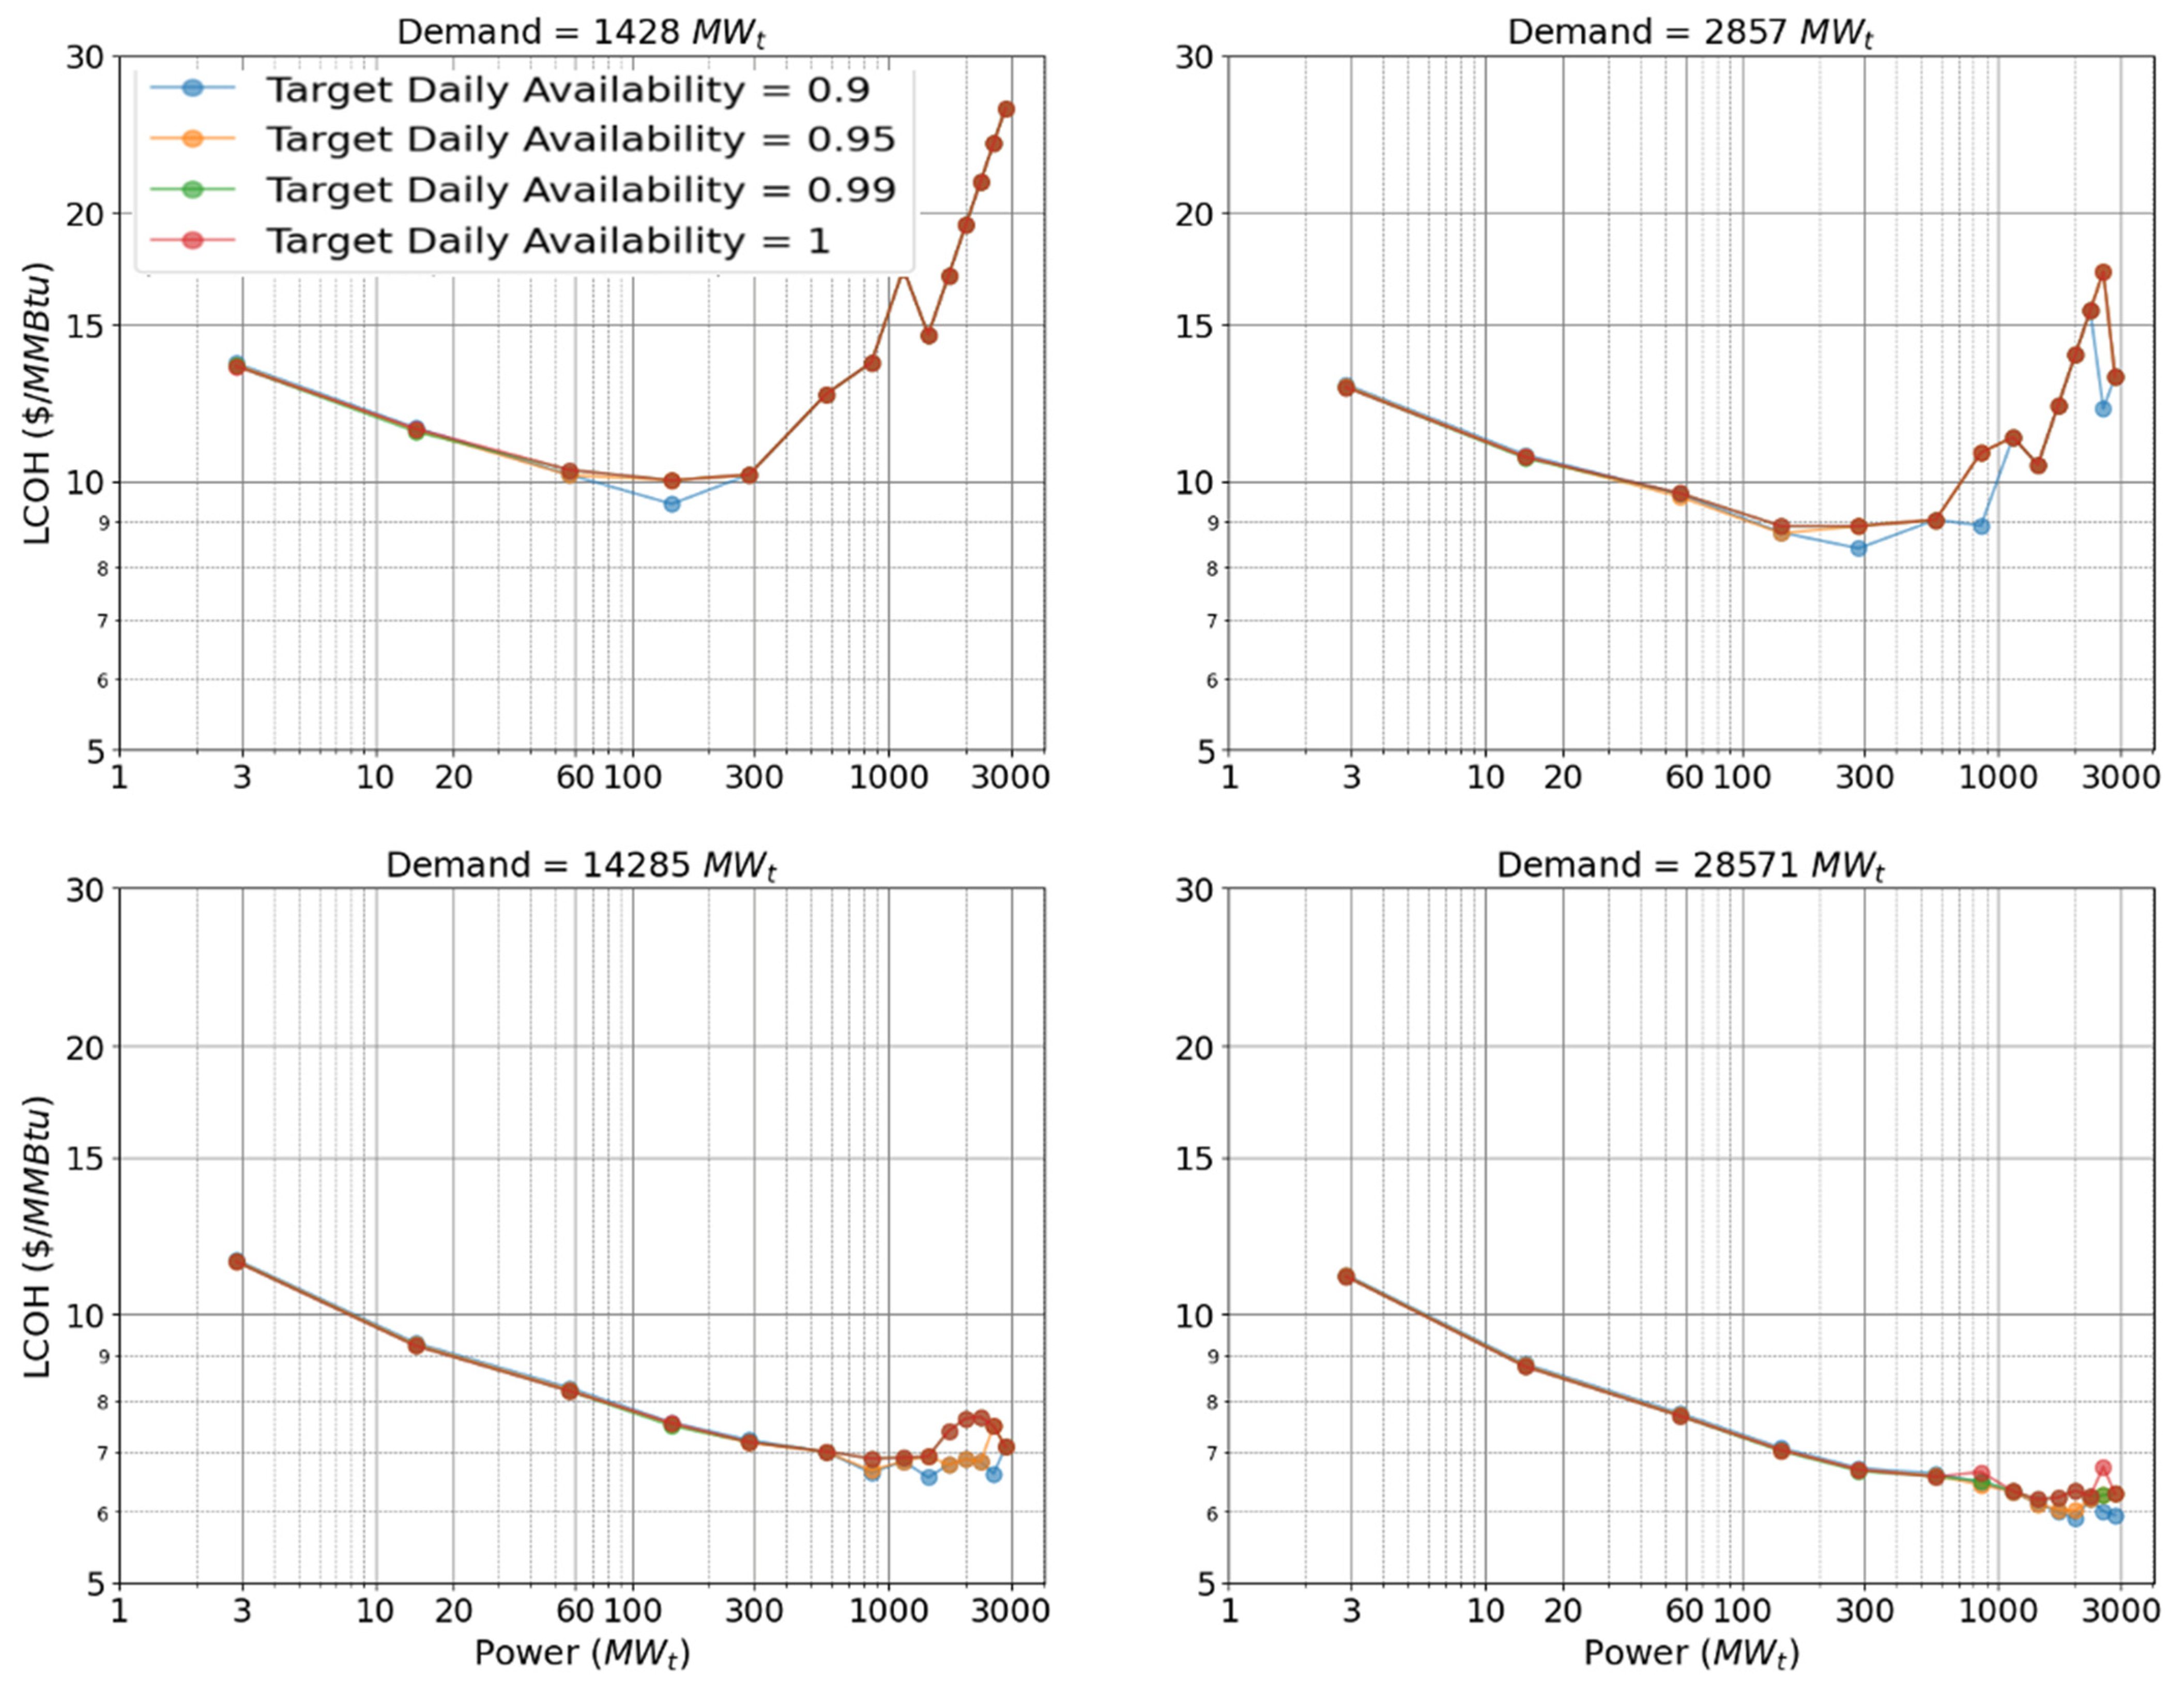
6.1. Projected Levelized Cost of Heat
- A thermal-only power plant will not need to incur the costs of the turbine and associated maintenance. Because the only output is steam, those costs can be avoided. The authors of [27] reviewed several cost estimates in the literature that were conducted for electricity applications and thermal-only applications (assuming all other reactor components stay the same). Based on the findings in the review, an OCC multiplier of 0.795 and an O&M multiplier of 0.966 are recommended for heat-only applications.
- Values expressed in megawatts-electric must also be converted to megawatts-thermal via the corresponding thermal efficiency. This is strongly reactor-dependent, with water-cooled designs usually touting efficiencies around 33%, while sodium- and gas-cooled variants have efficiencies approaching 40% in light of their higher operating temperatures [27]. For simplicity in this section, a 35% thermal efficiency is assumed throughout the reactor sizes. This implicitly assumed that only reactors of a similar design are compared. Readers are directed to [59,60] for studies evaluating the tradeoffs between reactor technologies of different temperature outputs.
6.2. Reactor Mixes for Different Heat Demand Sizes
7. Conclusions
8. Future Work
Supplementary Materials
Author Contributions
Funding
Data Availability Statement
Acknowledgments
Conflicts of Interest
Appendix A. Background on Nuclear Energy and Data Centers
Appendix B. Ongoing Nuclear Project in the U.S.
| Project | Vogtle [63] | GE-Hitachi [64,65] | Advanced Reactor Demonstration Program (ARDP) | Kairos [66] | DOME FEEED [62] | Department of Defense (DoD) | |||
|---|---|---|---|---|---|---|---|---|---|
| AP1000 | BWRX-300 | Xe-100 [21] | Natrium [67] | Hermes | USNC | Radiant | Westinghouse | Project Pele [68] | |
| Power Output (MWe) | 2334 | 300 | 320 (four 80 MWe modules) | 345 | Test Reactor | Design test reactor experiments | 1–5 | ||
| Expected Operation Date (These are the currently expected dates for operation, but they may change.) | 2024 | 2027–2028 | 2030 | 2028 | 2026 | 2026 | 2026 | 2026 | 2025 |
Appendix C. Additional Results

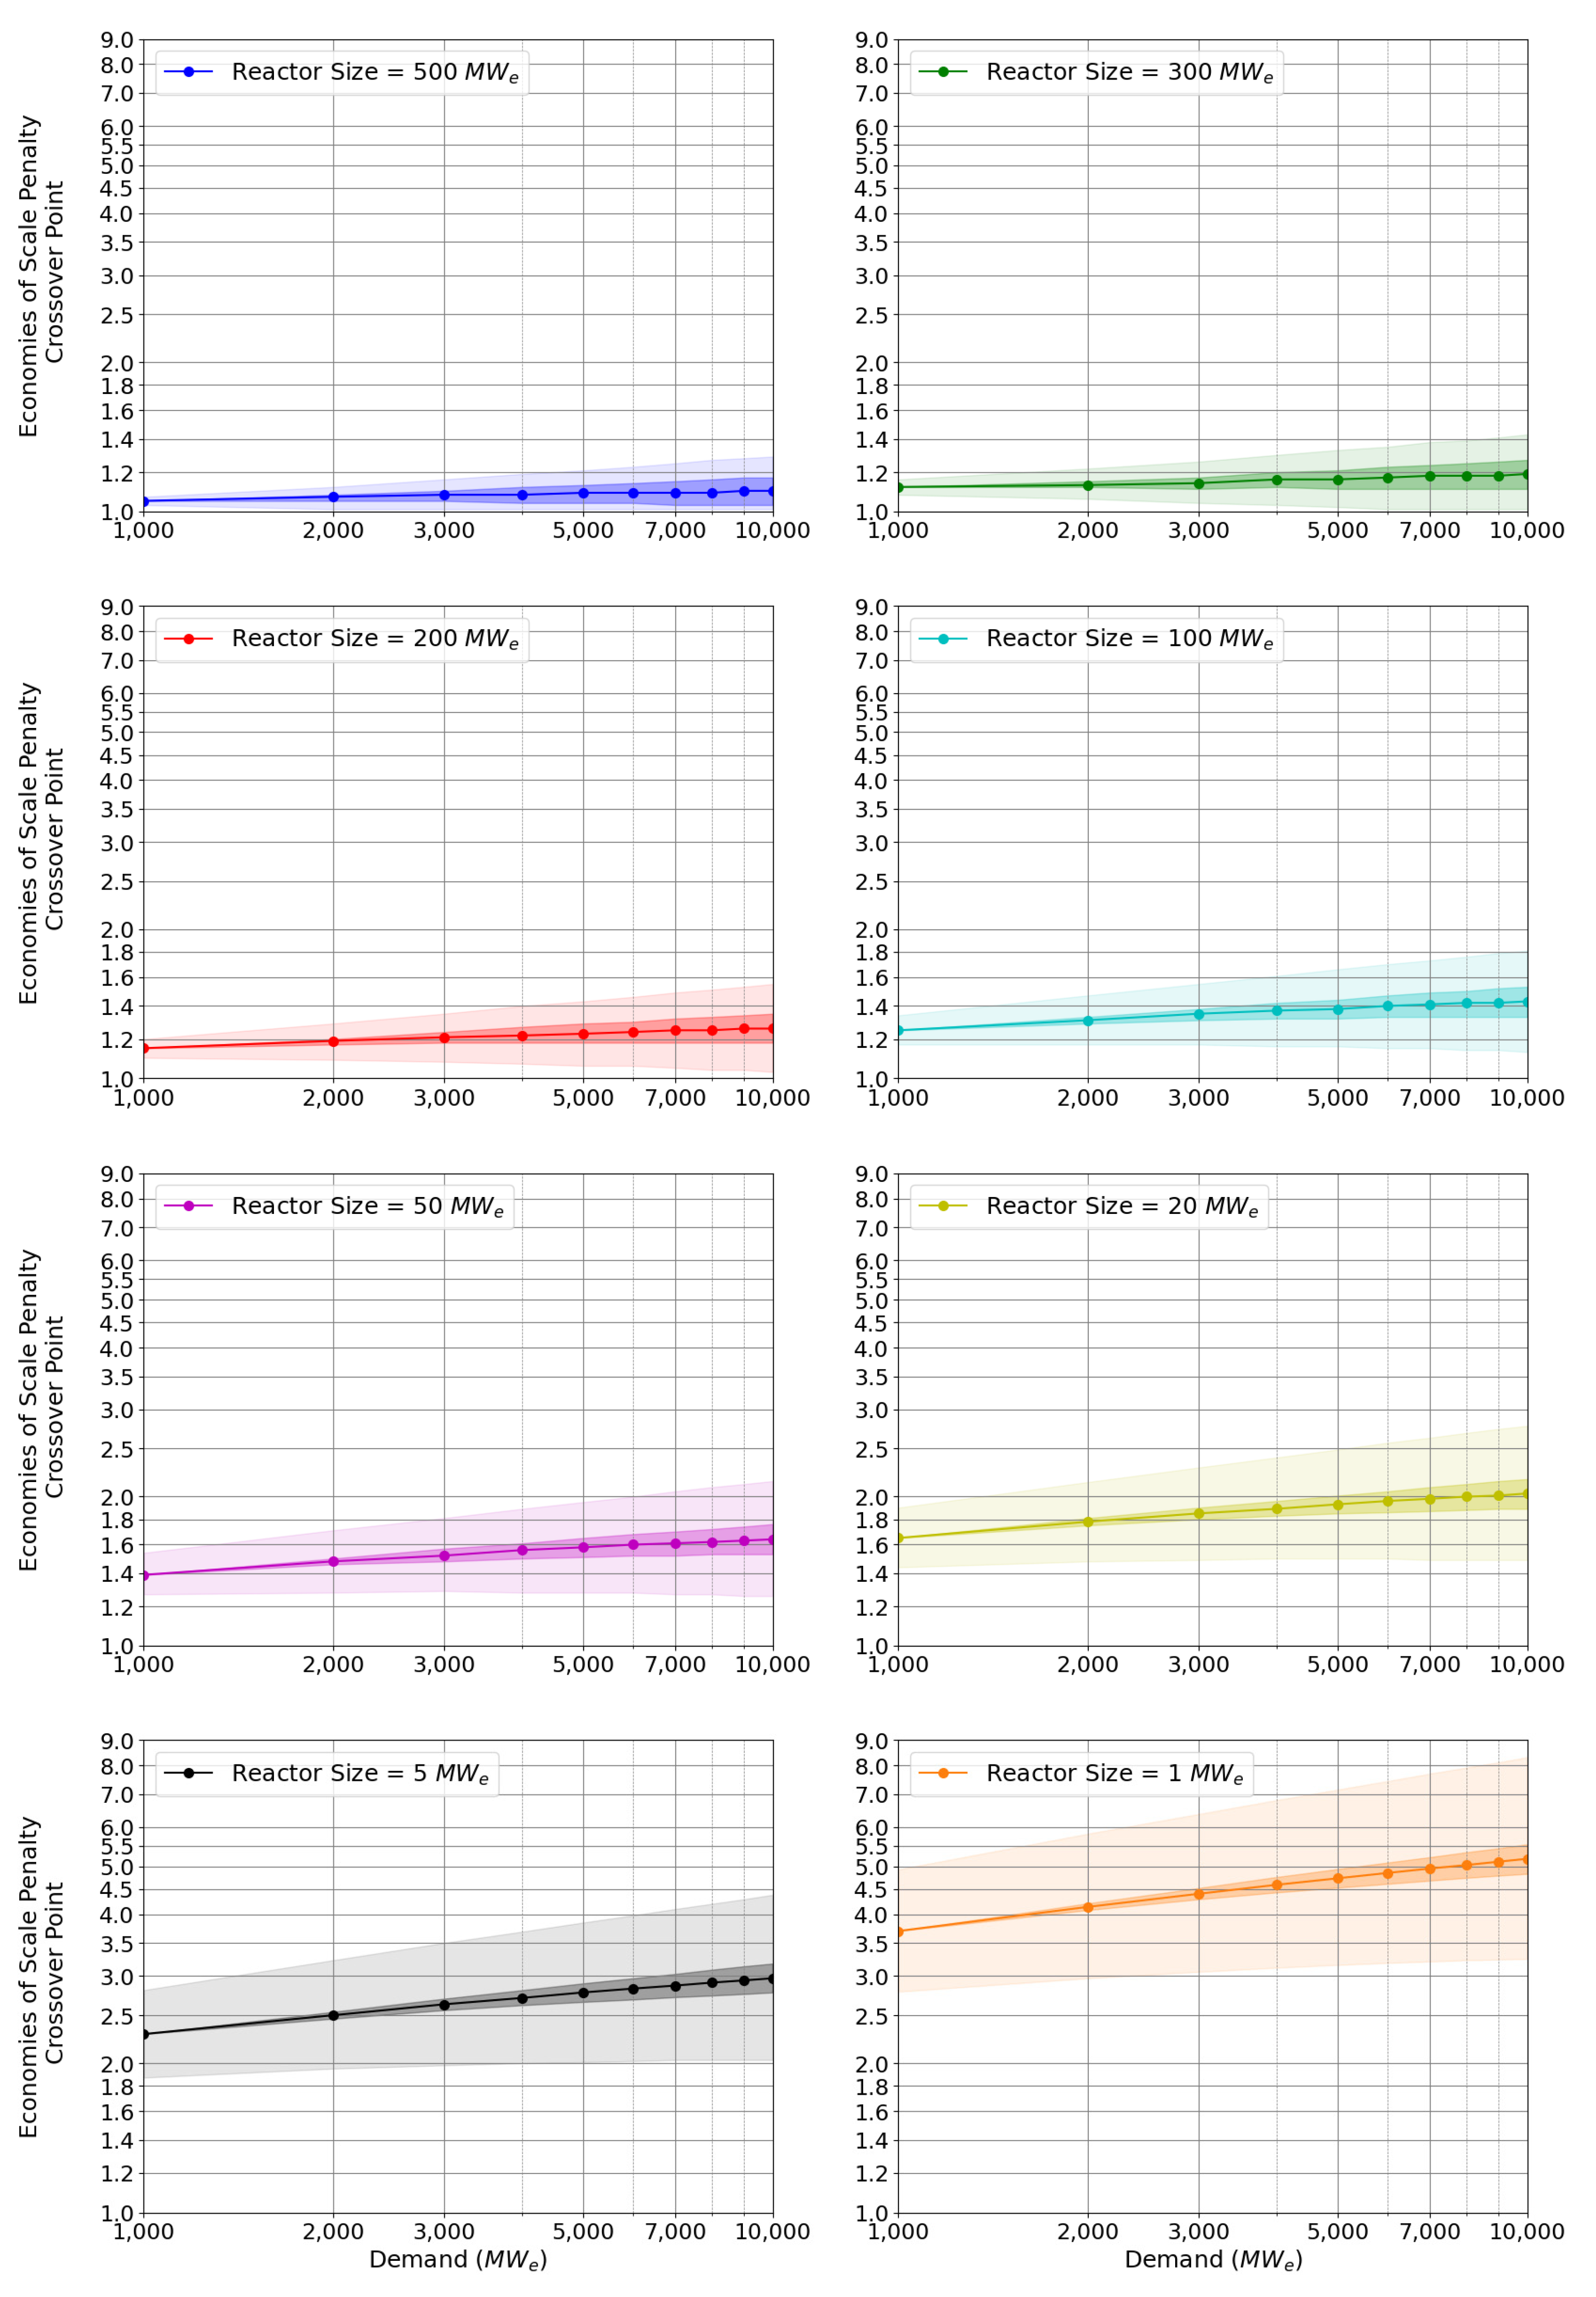
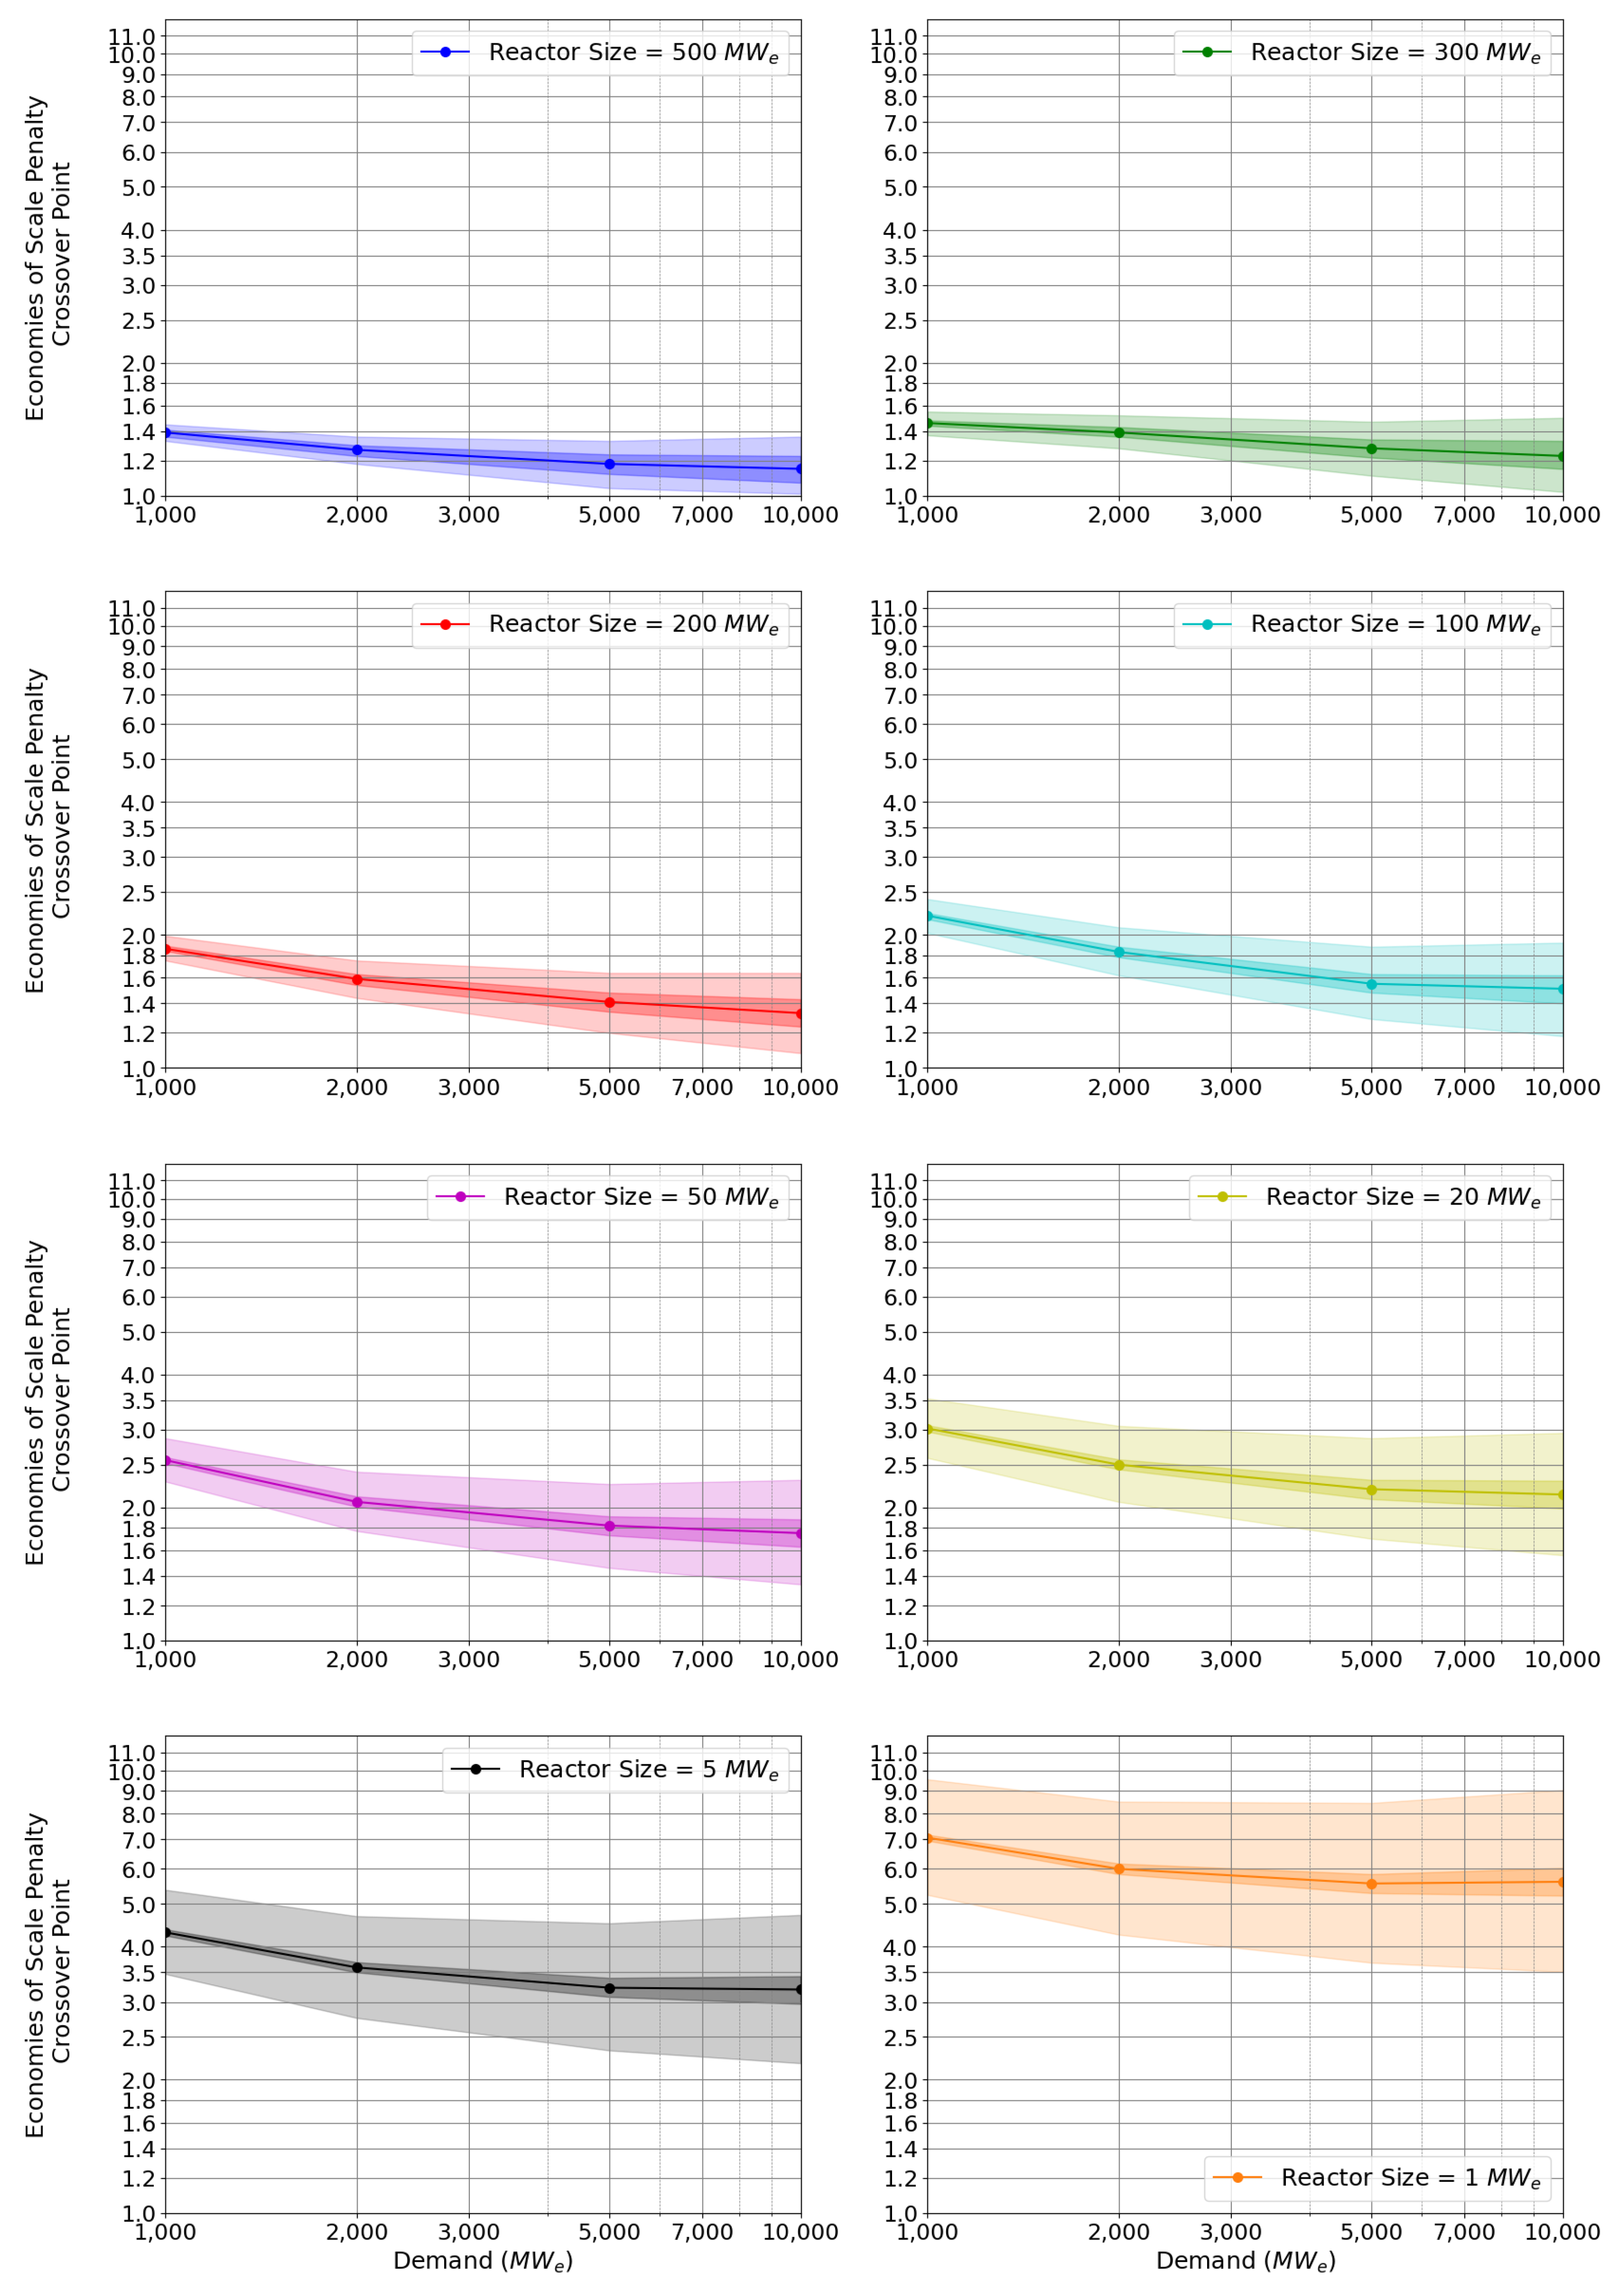
Appendix D. Economic Considerations for Nuclear Energy
References
- EPRI. Powering Intelligence: Analyzing Artificial Intelligence and Data Center Energy Consumption; Electric Power Research Institute: Washington, DC, USA, 2024; Available online: https://www.epri.com/research/products/000000003002028905. (accessed on 1 July 2024).
- Malmodin, J.; Lundén, D. The energy and carbon footprint of the global ICT and E&M sectors 2010–2015. Sustainability 2018, 10, 3027. [Google Scholar] [CrossRef]
- Bart Valkhof, E.K.; Stark, J. Energy Transition: Data volume is soaring. In Here’s How the ICT Sector Can Sustainably Handle the Surge; World Economic Forum: Cologny, Switzerland, 2024. [Google Scholar]
- Andrae, A.S.G. Comparison of several simplistic high-level approaches for estimating the global energy and electricity use of ICT networks and data centers. Int. J. Green Technol. 2019, 5, 50–63. [Google Scholar] [CrossRef]
- Andrae, S.G.A. New perspectives on internet electricity use in 2030. Eng. Appl. Sci. Lett. 2020, 3, 19–31. [Google Scholar]
- Koot, M.; Wijnhoven, F. Usage impact on data center electricity needs: A system dynamic forecasting model. Appl. Energy 2021, 291, 116798. [Google Scholar] [CrossRef]
- Hintemann, R.; Hinterholzer, S. Energy consumption of data centers worldwide-how will the internet become green? In Proceedings of the ICT4S, Lappeenranta, Finland, 10–14 June 2019.
- IEA. Electricity 2024 Analysis and Forecast to 2026; International Energy Agency: Paris, France, 2024. [Google Scholar]
- Wilson, J.D.; Zimmerman, Z. The Era of Flat Power Demand is Over. Grid Strateg. 2023, 3, 1–29. [Google Scholar]
- Google. Aiming to Achieve Net-Zero Emissions and 24/7 Carbon-Free Energy. Net-Zero Carbon 2024. Available online: https://sustainability.google/operating-sustainably/net-zero-carbon/ (accessed on 1 July 2024).
- Smith, B. Microsoft will be carbon negative by 2030. In Official Microsoft Blog; Microsoft: Redmond, WA, USA, 2020. [Google Scholar]
- NUCOR. GOOGLE, MICROSOFT, and NUCOR announce a new initiative to aggregate demand to scale the adoption of advanced clean electricity technologies. In The Companies Will Work to Address Barriers to Early-Stage Commercial Project Deployment; NUCOR: Charlotte, NC, USA, 2024. [Google Scholar]
- Kleyman, B. Welcome to the Era of the Nuclear-Powered Data Center. Available online: https://www.datacenterknowledge.com/next-gen-data-centers/welcome-to-the-era-of-the-nuclear-powered-data-center (accessed on 1 July 2024).
- Kimball, S. Dominion Energy Looking at Connecting Data Center Directly to Connecticut Nuclear Plant; CNBC: Englewood Cliffs, NJ, USA, 2024. [Google Scholar]
- Swinhoe, D. AWS Acquires Talen’s Nuclear Data Center Campus in Pennsylvania. 2024. Available online: https://www.datacenterdynamics.com/en/news/aws-acquires-talens-nuclear-data-center-campus-in-pennsylvania/ (accessed on 1 July 2024).
- Guaita, N. Uncovering Hidden Market Opportunities for Advanced Nuclear Reactors; Idaho National Laboratory (INL): Idaho Falls, ID, USA, 2023. [Google Scholar]
- Aumeier, S.E.; Shropshire, D.E.; Araújo, K.; Koerner, C.; Bell, C.; Fauske, G.; Johnson, R.; Parsons, J.; Gerace, S.; Holubynak, E.; et al. Microreactor Applications in U.S. Markets: Evaluation of State-Level Legal, Regulatory, Economic and Technology Implications; Idaho National Laboratory: Idaho Falls, ID, USA, 2023; 166p. [Google Scholar]
- Forsberg, C.; Foss, A.; Abou-Jaoude, A. Fission battery economics-by-design. Prog. Nucl. Energy 2022, 152, 104366. [Google Scholar] [CrossRef]
- Rissman, J.; Bataille, C.; Masanet, E.; Aden, N.; Morrow, W.R., III; Zhou, N.; Elliott, N.; Dell, R.; Heeren, N.; Huckestein, B. Technologies and policies to decarbonize global industry: Review and assessment of mitigation drivers through 2070. Appl. Energy 2020, 266, 114848. [Google Scholar] [CrossRef]
- Thiel, G.P.; Stark, A.K. To decarbonize industry, we must decarbonize heat. Joule 2021, 5, 531–550. [Google Scholar] [CrossRef]
- X-Energy. Dow’s Seadrift, Texas Location Selected for X-Energy Advanced SMR Nuclear Project to Deliver Safe, Reliable, Zero Carbon Emissions Power and Steam Production; X-Energy: Rockville, MD, USA, 2023. [Google Scholar]
- EPA. Inventory of U.S. Greenhouse Gas Emissions and Sinks: 1990–2022; U.S. Environmental Protection Agency: Washington, DC, USA, 2024. [Google Scholar]
- Thomas Bowen, C.G.-W. Behind-The-Meter Battery Energy Storage. In Energy Storage Toolkit; National Renewable Energy Lab. (NREL): Golden, CO, USA, 2021. [Google Scholar] [CrossRef]
- Advanced Reactors Policy Branch, Division of Safety Systems, Risk Assessment, and Advanced Reactors, Office of New Reactors. Risk Assessment, and Advanced Reactors, Office of New Reactors. In A Regulatory Review Roadmap For Non-Light Water Reactors; United States Nuclear Regulatory Commission: Rockville, MD, USA, 2017. [Google Scholar]
- José Reyes, F.S.; Woods, B. Why the Unique Safety Features of Advanced Reactors Matter. In The Bridge: Linking Engineering and Society; National Academy of Engineering: Washington, DC, USA, 2020. [Google Scholar]
- Buongiorno, J.; Carmichael, B.; Dunkin, B.; Parsons, J.; Smit, D. Can nuclear batteries be economically competitive in large markets? Energies 2021, 14, 4385. [Google Scholar] [CrossRef]
- Abou-Jaoude, A.; Lohse, C.S.; Larsen, L.M.; Guaita, N.; Trivedi, I.; Joseck, F.C.; Hoffman, E.; Stauff, N.; Shirvan, K.; Stein, A. Meta-Analysis of Advanced Nuclear Reactor Cost Estimations; Idaho National Laboratory (INL): Idaho Falls, ID, USA, 2024. [Google Scholar]
- Abou Jaoude, A.; Bolisetti, C.; Lin, L.; Larsen, L.M.; Epiney, A.S.; Worsham, E.K. Literature Review of Advanced Reactor Cost Estimates; Idaho National Laboratory (INL): Idaho Falls, ID, USA, 2023. [Google Scholar]
- Carelli, M.D.; Garrone, P.; Locatelli, G.; Mancini, M.; Mycoff, C.; Trucco, P.; Ricotti, M.E. Economic features of integral, modular, small-to-medium size reactors. Prog. Nucl. Energy 2010, 52, 403–414. [Google Scholar] [CrossRef]
- Lovering, J.R.; McBride, J.R. Chasing Cheap Nuclear: Economic Trade-Offs for Small Modular Reactors. In The Bridge: Linking Engineering and Society; National Academy of Engineering: Washington, DC, USA, 2020. [Google Scholar]
- Wright, T.P. Factors affecting the cost of airplanes. J. Aeronaut. Sci. 1936, 3, 122–128. [Google Scholar] [CrossRef]
- Mislick, G.K.; Nussbaum, D.A. Cost Estimation: Methods and Tools; John Wiley & Sons: Hoboken, NJ, USA, 2015. [Google Scholar]
- Miller, R. The Gigawatt Data Center Campus is Coming. In Data Center Frontier; International District Energy Associstion: Westborough, MA, USA, 2024. [Google Scholar]
- Abou-Jaoude, A.; Arafat, Y.; Bolisetti, C.; Hanna, B.; Belvedere, J.; Blocker, J.; Cooper, B.; Harmon, S.; McCarthy, D. Assessment of Factory Fabrication Considerations for Nuclear Microreactors. Nucl. Technol. 2023, 209, 1697–1732. [Google Scholar] [CrossRef]
- Office of Nuclear Energy. What Is Generation Capacity? 2020. Available online: https://www.energy.gov/ne/articles/what-generation-capacity#:~:text=The%20Capacity%20Factor&text=Nuclear%20has%20the%20highest%20capacity,and%20solar%20(24.6%25)%20plants (accessed on 1 July 2024).
- Zakharov, A.; Gusev, O.; Cho, G. Reliability Assesment of Data Centers Power System. In Proceedings of the IEEE 2018 IV International Conference on Information Technologies in Engineering Education (Inforino), Moscow, Russia, 23–26 October 2018. [Google Scholar]
- Johnson, S.; Hodge, T.U.S. Summer Nuclear Outages Rose in 2023, Returning to 2021 Levels. Today in Energy 2023. Available online: https://www.eia.gov/todayinenergy/detail.php?id=60682#:~:text=Unplanned%2C%20or%20forced%2C%20nuclear%20generation,compared%20with%2035%20in%202022 (accessed on 1 July 2024).
- GE Hitachi Nuclear Energy. BWRX-300 General Description; GE-Hitachi Nuclear Energy Americas LLC: Wilmington, NC, USA, 2023. [Google Scholar]
- Mulder, E.; Boyes, W. Neutronics characteristics of a 165 MWth Xe-100 reactor. Nucl. Eng. Des. 2020, 357, 110415. [Google Scholar] [CrossRef]
- Doyle, J.; Haley, B.; Fachiol, C.; Galyean, B.; Ingersoll, D. Highly reliable nuclear power for mission-critical applications. In Proceedings of the ICAPP, San Francisco, CA, USA, 17–20 April 2016. [Google Scholar]
- Bernauer, D. Why I Started Radiant. 2023. Available online: https://radiantnuclear.com/blog/why-i-started-radiant/ (accessed on 1 July 2024).
- NPR Cost Evaluation, Technical Support Group. NPR Capacity Cost Evaluation; Oak Ridge National Laboratory (ORNL): Oak Ridge, TN, USA, 1988; p. 141. [Google Scholar]
- Bechtel National, Inc.; Ga Technologies, Inc.; Gas-Cooled Reactor Associates, General Electric Company; Oak Ridge National Laboratory; Stone & Webster Engineering Corp. Modular High Temperature Gas-Cooled Reactor Plant Capital and Busbar Generation Cost Estimates; Gas-Cooled Reactor Associates: San Diego, CA, USA, 1987. [Google Scholar]
- NEI. Nuclear Costs in Context; Nuclear Energy Institute: Washington, DC, USA, 2023. [Google Scholar]
- Carelli, M.D.; Mycoff, C.W.; Garrone, P.; Locatelli, G.; Mancini, M.; Ricotti, M.E.; Trianni, A.; Trucco, P. Competitiveness of small-medium, new generation reactors: A comparative study on capital and O&M costs. In Proceedings of the International Conference on Nuclear Engineering, Orlando, FL, USA, 11–15 May 2008. [Google Scholar]
- Nichol, M. Roadmap for the deployment of micro-reactors for us department of defense domestic installations. In Report; Nuclear Energy Institute: Washington, DC, USA, 2018. [Google Scholar]
- EIA. Wholesale Electricity and Natural Gas Market Data. 2023. Available online: https://www.eia.gov/electricity/wholesale/ (accessed on 1 July 2024).
- EIA. US Electricity Profile 2022. 2022. Available online: https://www.eia.gov/electricity/state/ (accessed on 1 July 2024).
- Mai, T.; Cole, W.; Lantz, E.; Marcy, C.; Sigrin, B. Impacts of Federal Tax Credit Extensions on Renewable Deployment and Power Sector Emissions; National Renewable Energy Lab. (NREL): Golden, CO, USA, 2016. [Google Scholar]
- Cleanenergy.gov. Building a clean energy economy: A guidebook to the inflation reduction act’s investments in clean energy and climate action. In Cleanenergy; The White House: Washington, DC, USA, 2023. [Google Scholar]
- Inflation Reduction Act of 2022, H.R.5376, US House—117th Congress (2023). Available online: https://www.congress.gov/bill/117th-congress/house-bill/5376/text (accessed on 1 July 2024).
- Guaita, N.; Hansen, J.K. Analyzing the Inflation Reduction Act and the Bipartisan Infrastructure Law for Their Effects on Nuclear Cost Data; Idaho National Laboratory (INL): Idaho Falls, ID, USA, 2024. [Google Scholar]
- Gad, A.F. Pygad: An intuitive genetic algorithm python library. Multimed. Tools Appl. 2024, 83, 58029–58042. [Google Scholar] [CrossRef]
- Soto, G.J.; Hanna, B.; Toman, J.; Guaita, N.; Talbot, P.; Epiney, A.; Lohse, C.S. Powering Data Centers with Clean Energy: A Techno-Economic Case Study of Nuclear and Renewable Energy Dependability; Idaho National Laboratory (INL): Idaho Falls, ID, USA, 2024. [Google Scholar]
- Knighton, L.T.; Wendt, D.S.; Richards, J.D.; Rabiti, C.; Abou Jaoude, A.; Westover, T.L.; Vedros, K.G.; Bates, S.; Elgowainy, A.; Bafana, A.; et al. Techno-Economic Analysis of Product Diversification Options for Sustainability of the Monticello and Prairie Island Nuclear Power Plants; Idaho National Laboratory: Idaho Falls, ID, USA, 2021. [Google Scholar]
- Stauff, N.E.; Mann, W.N.; Moisseytsev, A.; Durvasulu, V.; Mantripragada, H.; Fout, T. Assessment of Nuclear Energy to Support Negative Emission Technologies; Argonne National Laboratory (ANL): Lemont, IL, USA, 2023. [Google Scholar]
- Epiney, A.S.; Richards, J.D.; Hansen, J.K.; Talbot, P.W.; Burli, P.H.; Rabiti, C.; Bragg-Sitton, S.M. Integrated Nuclear-Driven Water Desalination: Providing Regional Potable Water in Arizona; Idaho National Laboratory (INL): Idaho Falls, ID, USA, 2021. [Google Scholar]
- Saeed, R.M.; Worsham, E.K.; Choi, B.-H.; Joseck, F.; Popli, N.; Toman, J.; Costanza, K.; Mikkelson, D.M. Outlook on Industrial Requirements for Incorporating Nuclear Energy into Industrial Processes; Idaho National Laboratory (INL): Idaho Falls, ID, USA, 2023. [Google Scholar]
- Vanatta, M.; Stewart, W.; Craig, M. The Role of Policy and Module Manufacturing Learning in Industrial Decarbonization by Small Modular Reactors. 2023. Available online: https://www.researchsquare.com/article/rs-3726363/v1 (accessed on 1 July 2024).
- Vanatta, M.; Patel, D.; Allen, T.; Cooper, D.; Craig, M.T. Technoeconomic analysis of small modular reactors decarbonizing industrial process heat. Joule 2023, 7, 713–737. [Google Scholar] [CrossRef]
- INL. The Framework for Optimization of Resources and Economics (FORCE). 2024. Available online: https://github.com/idaholab/FORCE (accessed on 1 July 2024).
- DOE. DOE Awards $3.9 Million for Advanced Reactor Experiment Designs; Office of Nuclear Energy, Department of Energy (DOE): Washington, DC, USA, 2023. [Google Scholar]
- Westinghouse. Westinghouse Celebrates Milestone Achievement as AP1000® Technology Powers Plant Vogtle Unit 4 into Commercial Operation; Westinghouse Electric Company: Cranberry Township, PA, USA, 2024. [Google Scholar]
- HITACHI. BWRX-300 Small Modular Reactor. 2024. Available online: https://www.gevernova.com/nuclear/carbon-free-power/bwrx-300-small-modular-reactor (accessed on 1 July 2024).
- Clark, K. OPG Expects Nuclear Construction on First SMR to Begin in 2025. Nuclear 2024. Available online: https://www.power-eng.com/nuclear/opg-expects-nuclear-construction-on-first-smr-to-begin-in-2025/#gref (accessed on 1 July 2024).
- Kairos. How It Works. Technology 2024. Available online: https://kairospower.com/technology/ (accessed on 1 July 2024).
- TerraPower. The Next Generation of Power Is Here—The Natrium™ Reactor and Energy Storage System. Natrium 2024. Available online: https://www.terrapower.com/downloads/Natrium_Technology.pdf (accessed on 1 July 2024).
- ANS. Project Pele Will “Nurture” a Second Microreactor: X-Energy’s Xe-Mobile. NuclearNewswire 2023. Available online: https://www.ans.org/news/article-5353/project-pele-will-nurture-a-second-microreactor-xenergys-xemobile/ (accessed on 1 July 2024).
- Abou Jaoude, A. An Economics-by-Design Approach Applied to a Heat Pipe Microreactor Concept; Idaho National Laboratory: Idaho Falls, ID, USA, 2021. [Google Scholar]
| Excess Electricity Sales in BTM (USD/MWh) | 0 | 20 | 40 | 60 | ||||||
|---|---|---|---|---|---|---|---|---|---|---|
| Interest Rate | Demand (MWe) | Daily Availability Criteria | Optimal Capacity (MW) | LCOE (USD/MWh) | Optimal Capacity (MW) | LCOE (USD/MWh) | Optimal Capacity (MW) | LCOE (USD/MWh) | Optimal Capacity (MW) | LCOE (USD/MWh) |
| 6% | 1000 | 0.9 | 100 | 97.54 | 100 | 97.54 | 300 | 96.83 | 300 | 93.34 |
| 0.95 | 50 | 100.76 | 50 | 100.76 | 200 | 99.03 | 500 | 94.76 | ||
| 0.99 | 50 | 102.65 | 100 | 102.01 | 200 | 99.03 | 500 | 94.76 | ||
| 1 | 50 | 102.65 | 100 | 102.01 | 200 | 99.03 | 500 | 94.76 | ||
| 5000 | 0.9 | 500 | 76.93 | 900 | 76.55 | 900 | 75.26 | 900 | 73.97 | |
| 0.95 | 300 | 77.99 | 300 | 77.83 | 800 | 76.64 | 1000 | 74.01 | ||
| 0.99 | 300 | 80.42 | 400 | 79.12 | 1000 | 77.17 | 1000 | 74.01 | ||
| 1 | 300 | 80.42 | 400 | 79.12 | 1000 | 77.17 | 1000 | 74.01 | ||
| 10,000 | 0.9 | 700 | 69.22 | 700 | 69.22 | 700 | 69.22 | 700 | 69.22 | |
| 0.95 | 700 | 70.68 | 700 | 70.21 | 700 | 69.75 | 700 | 69.28 | ||
| 0.99 | 500 | 72.63 | 800 | 71.85 | 800 | 70.25 | 800 | 68.65 | ||
| 1 | 500 | 72.63 | 800 | 71.85 | 800 | 70.25 | 800 | 68.65 | ||
| 4% | 1000 | 0.9 | 100 | 77.62 | 100 | 77.62 | 300 | 74.71 | 800 | 61.43 |
| 0.95 | 50 | 81.82 | 200 | 79.99 | 200 | 76.83 | 900 | 58.53 | ||
| 0.99 | 100 | 82.11 | 200 | 79.99 | 200 | 76.83 | 900 | 58.53 | ||
| 1 | 100 | 82.11 | 200 | 79.99 | 200 | 76.83 | 900 | 58.53 | ||
| 5000 | 0.9 | 500 | 59.18 | 900 | 58.1 | 900 | 56.81 | 1000 | 54.06 | |
| 0.95 | 600 | 61.04 | 800 | 59.5 | 1000 | 57.21 | 1000 | 54.06 | ||
| 0.99 | 500 | 62.41 | 1000 | 60.36 | 1000 | 57.21 | 1000 | 54.06 | ||
| 1 | 500 | 62.41 | 1000 | 60.36 | 1000 | 57.21 | 1000 | 54.06 | ||
| 10,000 | 0.9 | 1000 | 53.02 | 1000 | 53.02 | 1000 | 53.02 | 1000 | 53.02 | |
| 0.95 | 700 | 54.57 | 700 | 54.11 | 1000 | 53.51 | 1000 | 52.3 | ||
| 0.99 | 900 | 55.8 | 1000 | 54.72 | 800 | 53.38 | 800 | 51.79 | ||
| 1 | 1000 | 55.94 | 1000 | 54.72 | 800 | 53.38 | 800 | 51.79 | ||
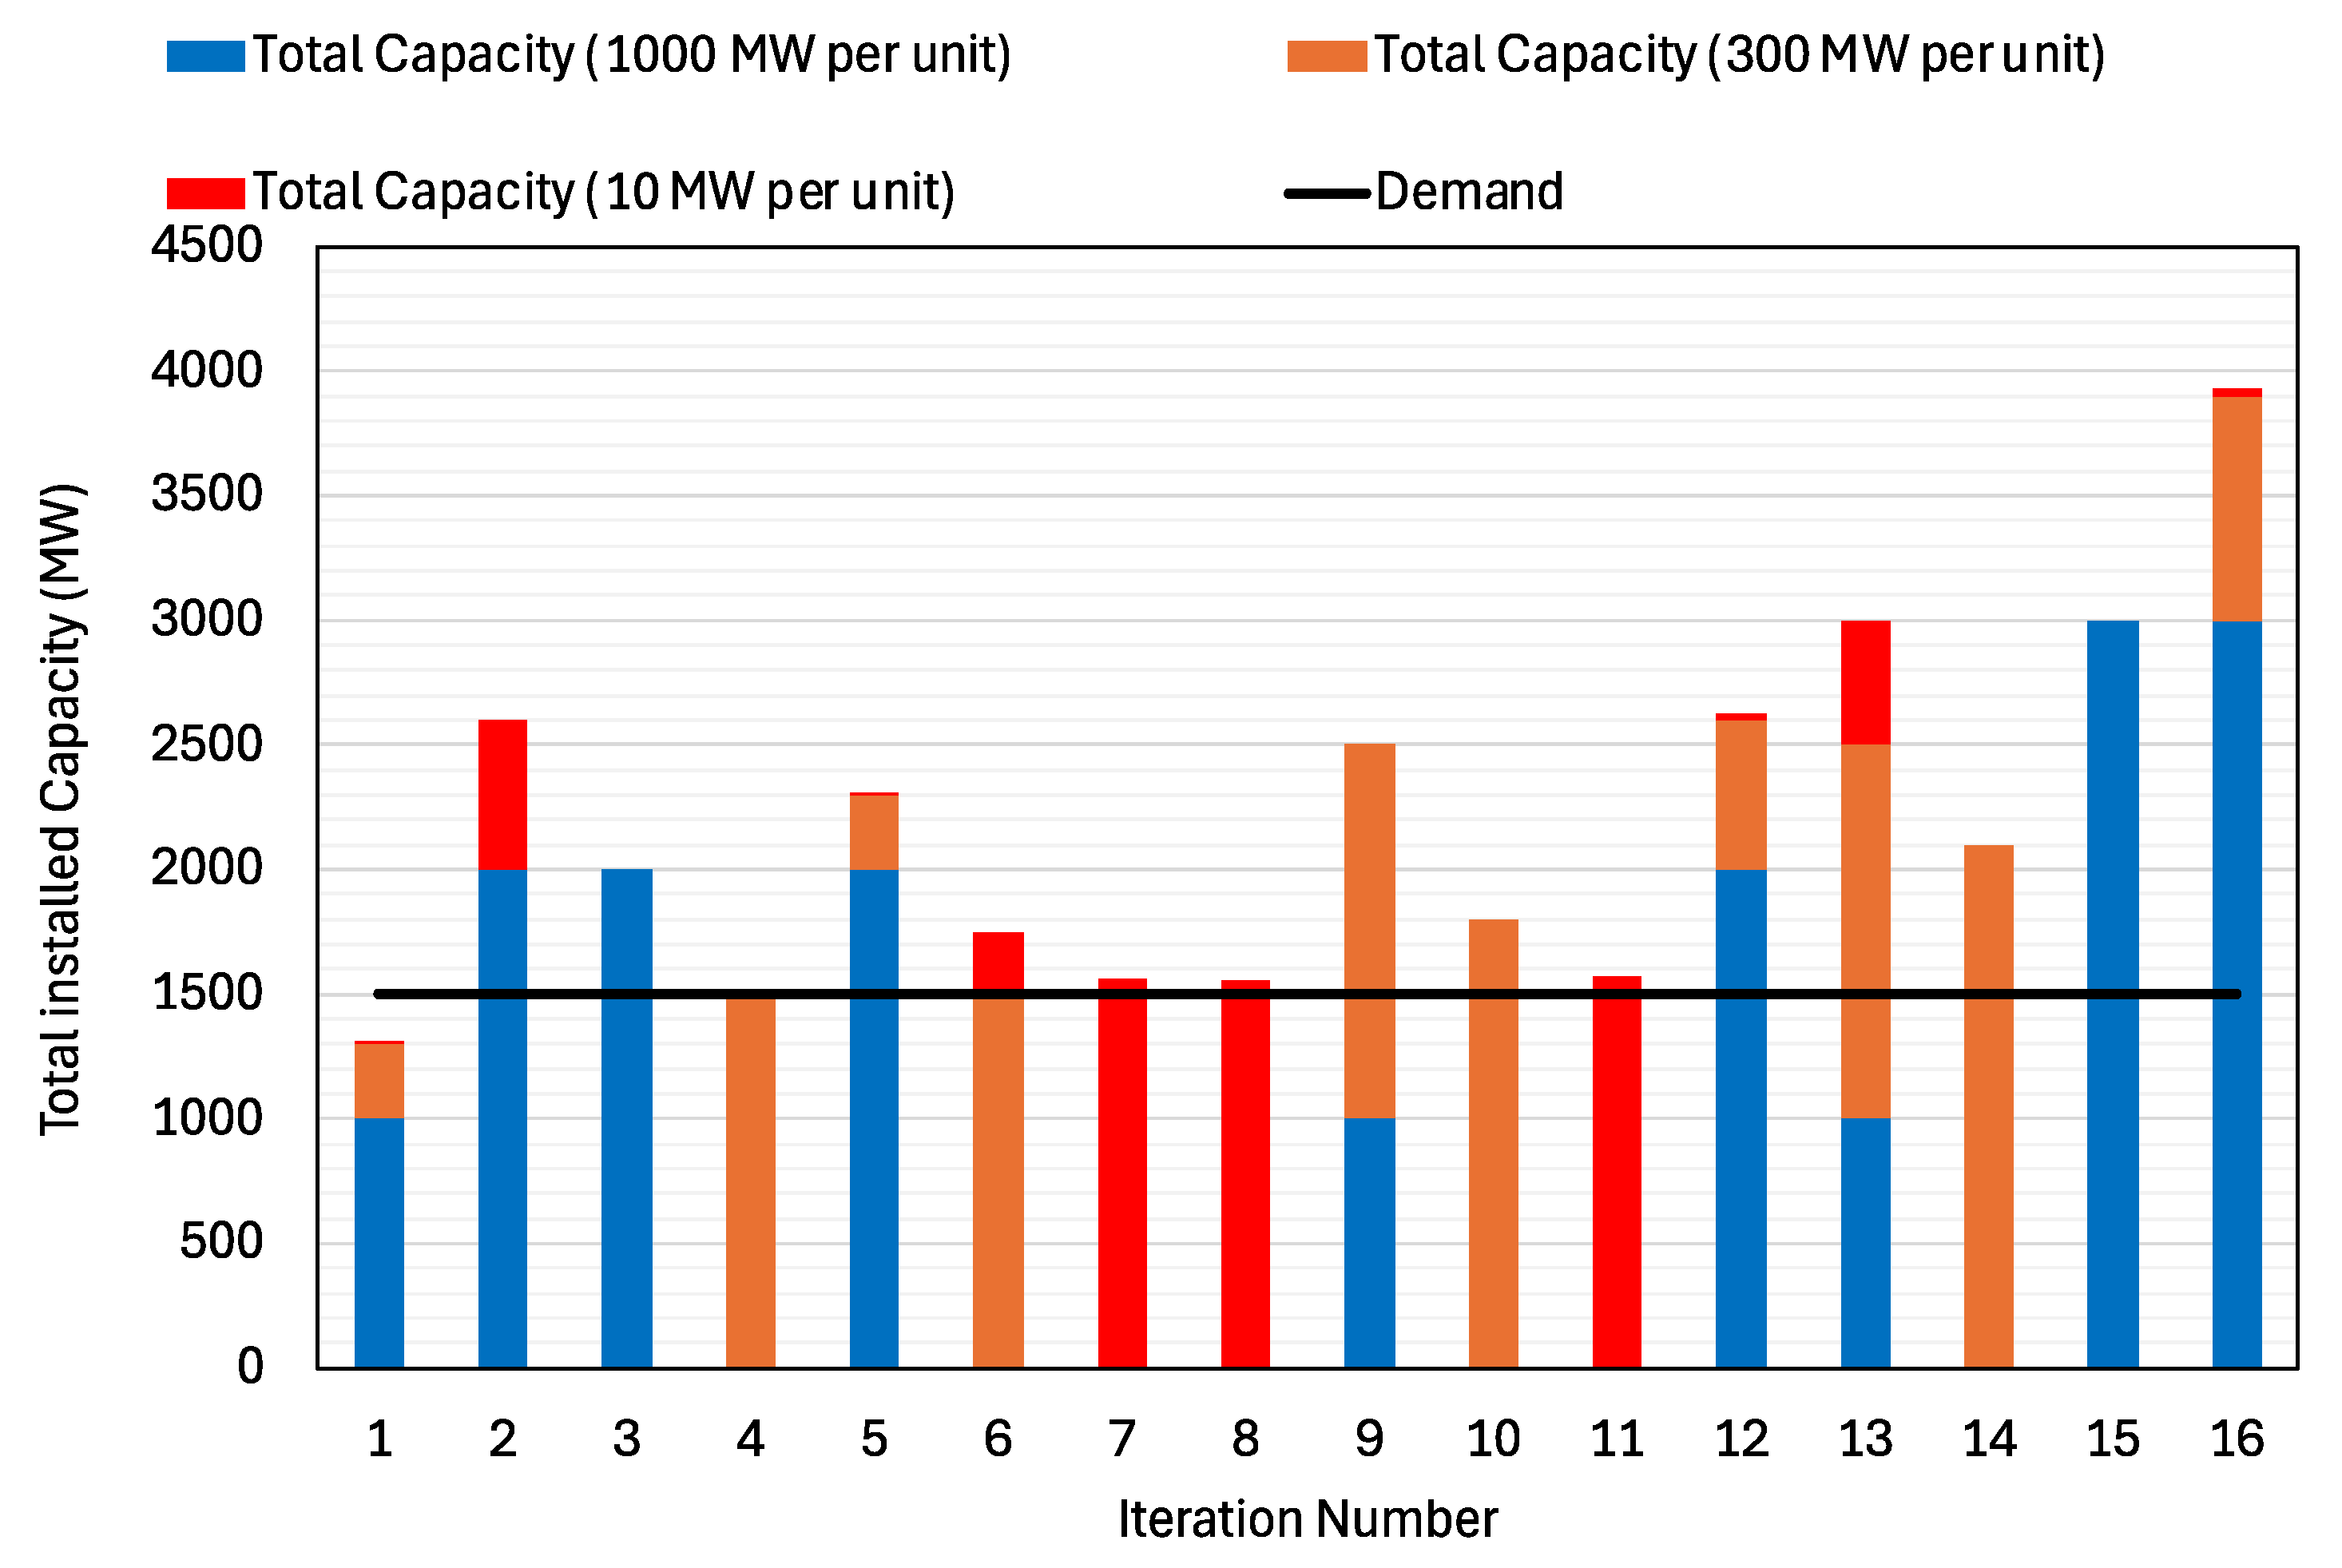
| Power Output | OCC | O&M | Learning Rate | Refueling Interval | |
|---|---|---|---|---|---|
| Large Reactor | 1000 MWe | USD 6145/kWe | USD 25/MWh | 8% | 2 years |
| SMR | 300 MWe | USD 7451/kWe | USD 36/MWh | 9% | 2 years |
| Microreactor | 10 MWe | USD 12,841/kWe | USD 94/MWh | 12% | 3.4 years |
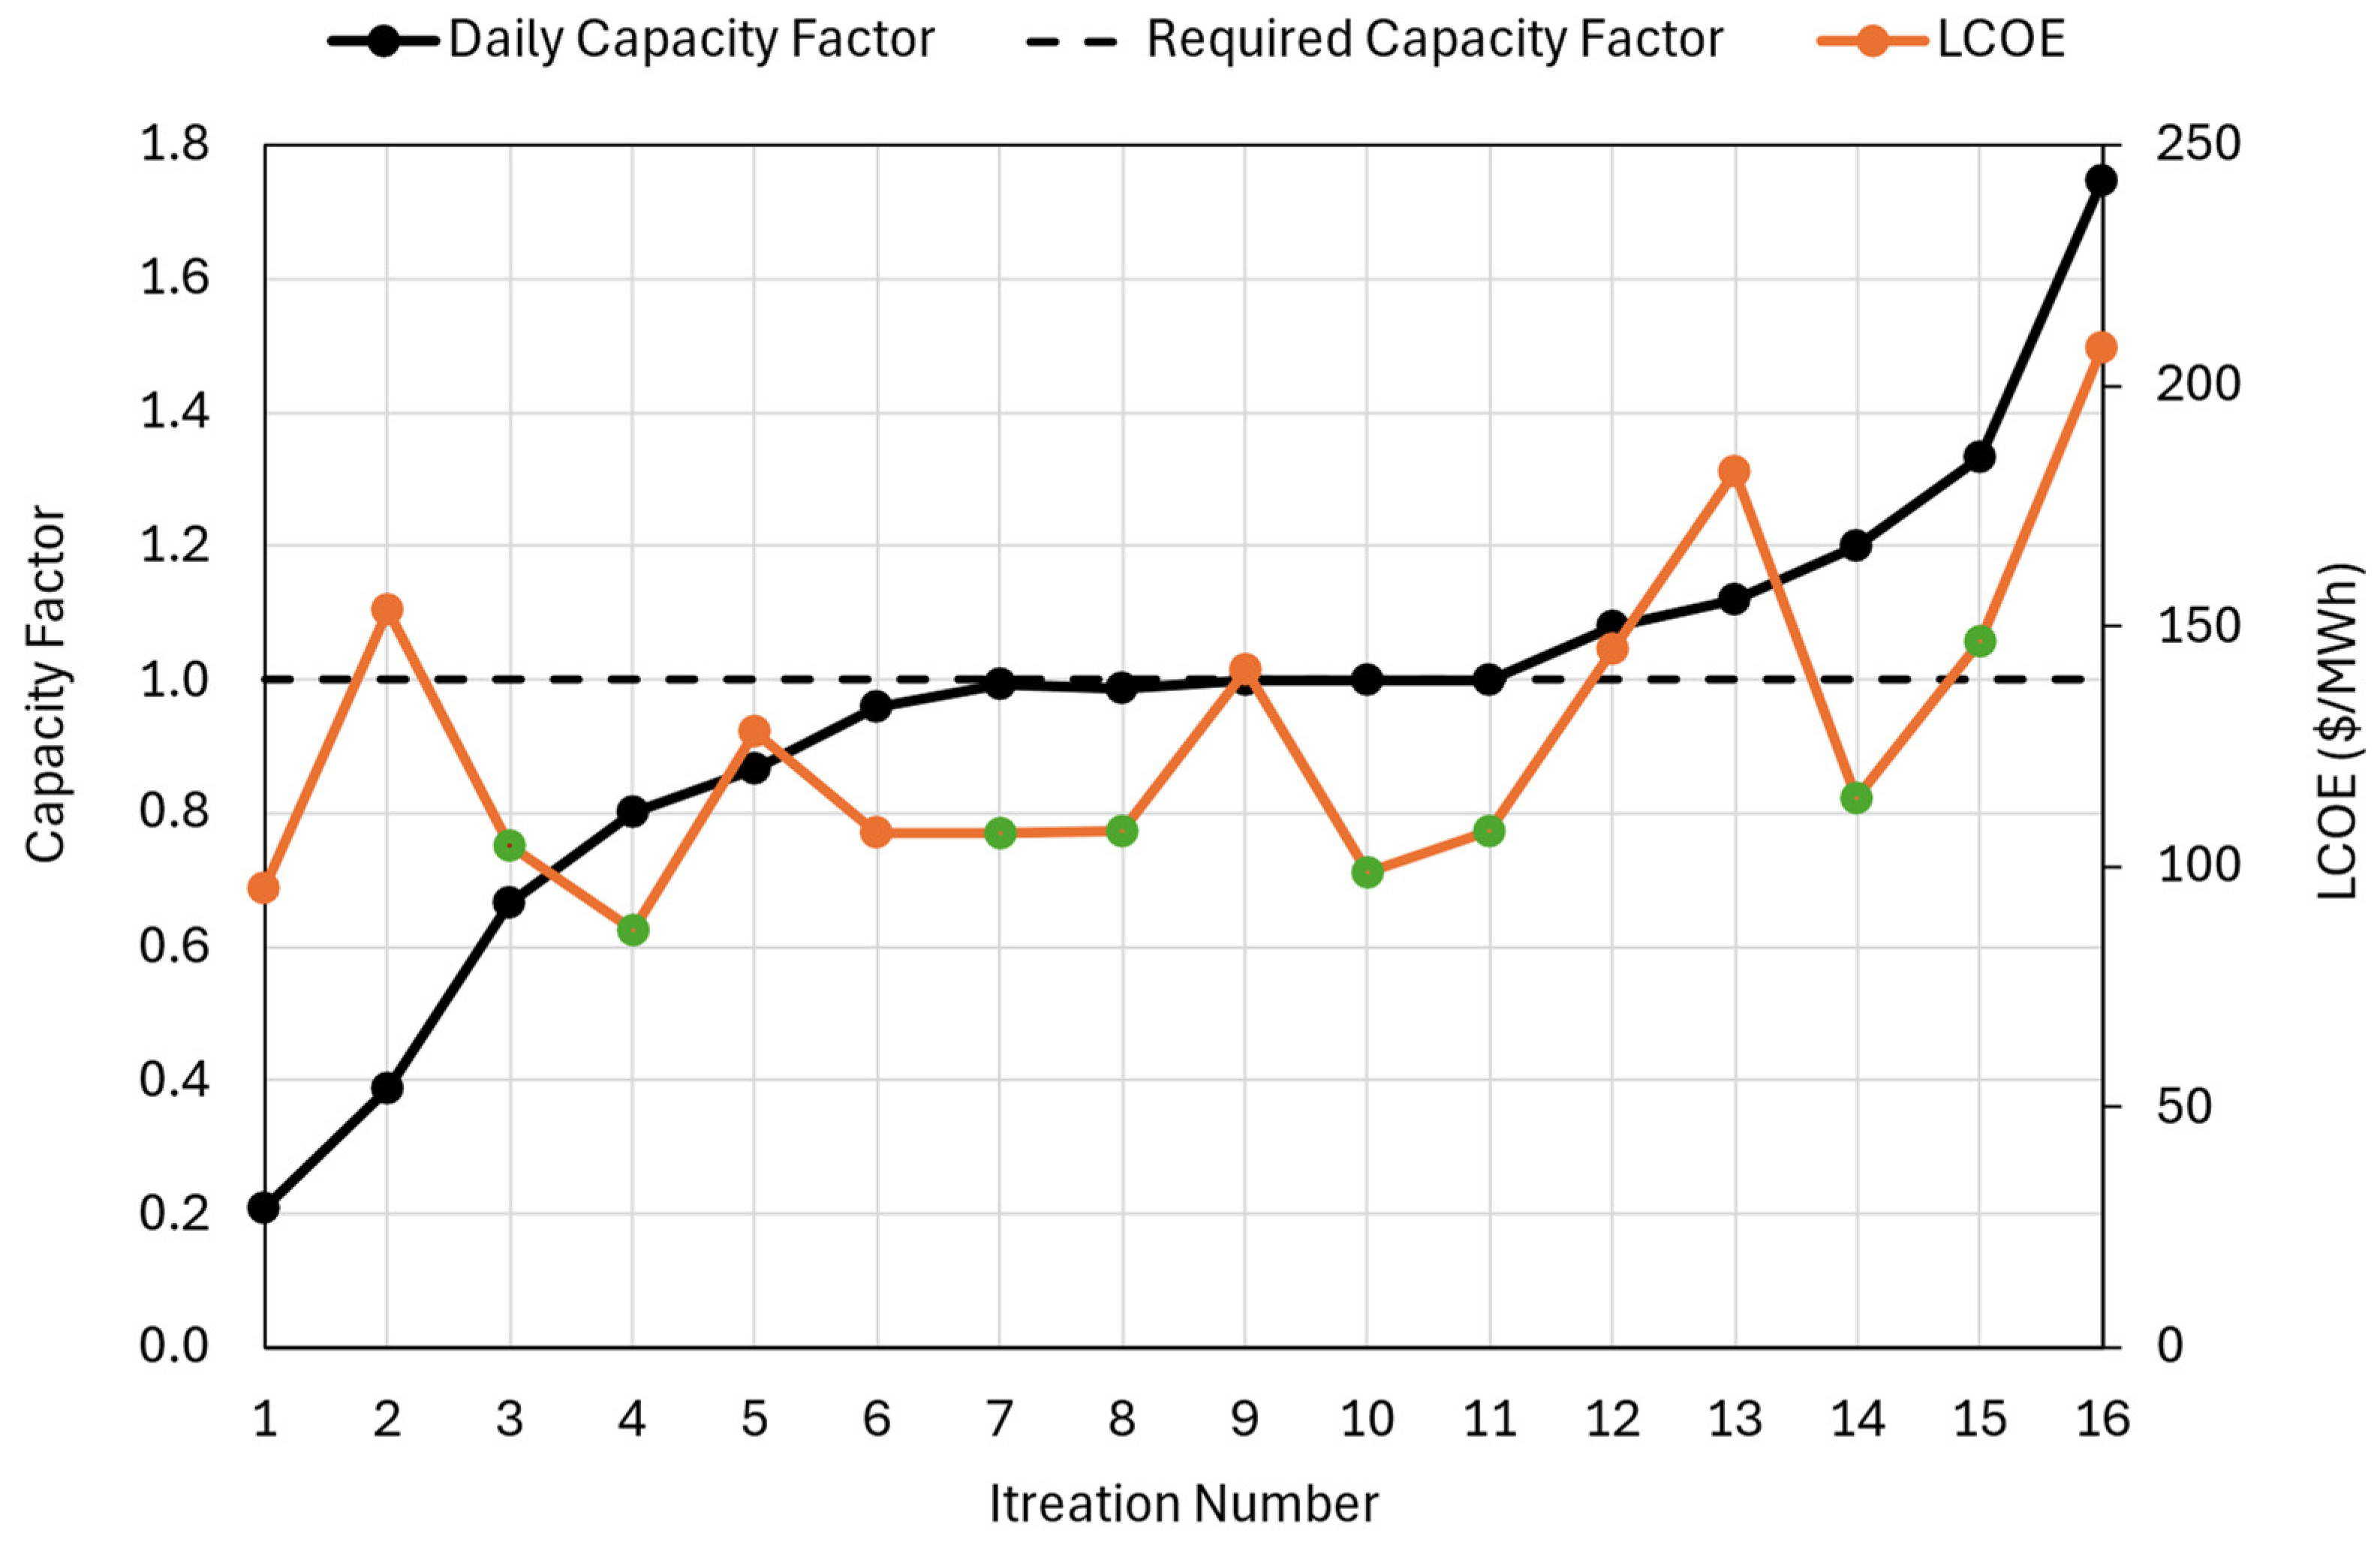
| Number of Large Reactors | Number of SMRs | Number of Microreactors | Daily Capacity Factor | LCOE (USD/MWh) | Overbuild |
|---|---|---|---|---|---|
| 1 | 1 | 1 | 0.21 | 95 | 87% |
| 2 | 0 | 60 | 0.39 | 153 | 173% |
| 2 | 0 | 0 | 0.67 | 104 | 133% |
| 0 | 5 | 0 | 0.80 | 87 | 100% |
| 2 | 1 | 1 | 0.87 | 128 | 154% |
| 0 | 5 | 25 | 0.96 | 107 | 117% |
| 0 | 0 | 156 | 0.99 | 107 | 104% |
| 0 | 0 | 155 | 0.99 | 107 | 103% |
| 1 | 5 | 0 | 1.00 | 141 | 167% |
| 0 | 6 | 0 | 1.00 | 99 | 120% |
| 0 | 0 | 157 | 1.00 | 107 | 105% |
| 2 | 2 | 2 | 1.08 | 145 | 175% |
| 1 | 5 | 50 | 1.12 | 182 | 200% |
| 0 | 7 | 0 | 1.20 | 114 | 140% |
| 3 | 0 | 0 | 1.33 | 147 | 200% |
| 3 | 3 | 3 | 1.75 | 208 | 262% |
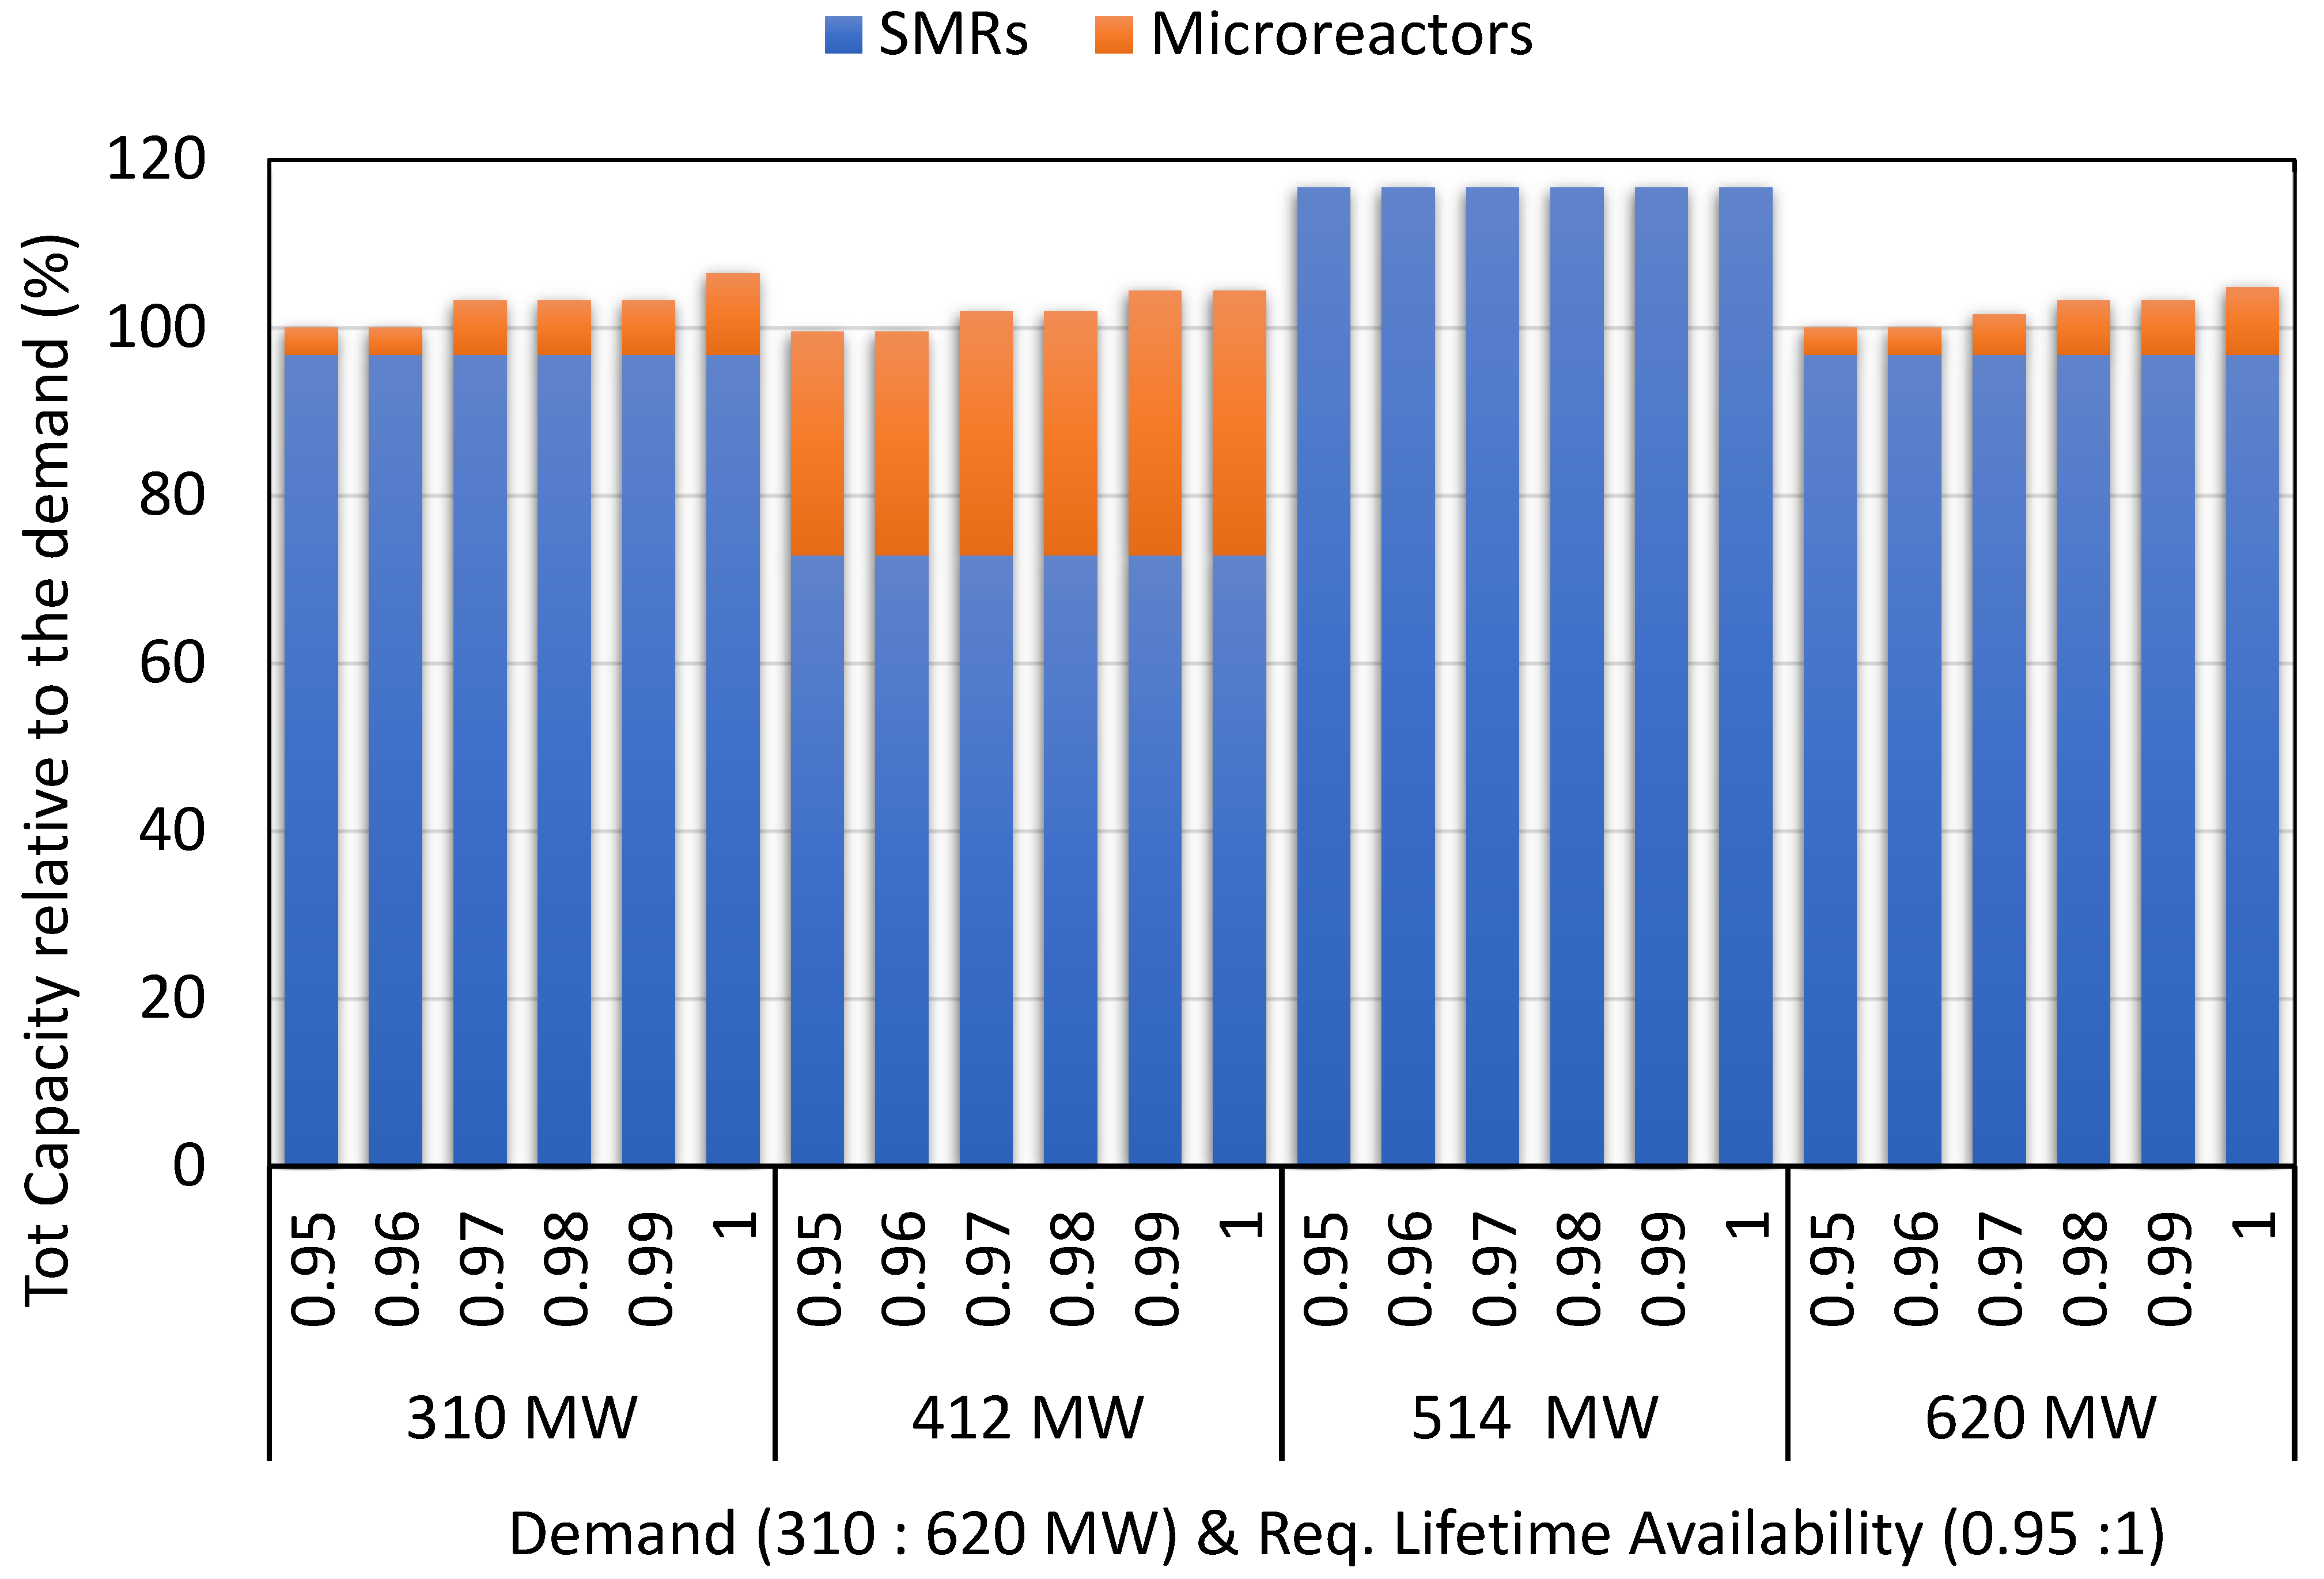
| Demand (MWe) | Required Lifetime Availability | Number of Reactors | Total Installed Capacity Normalized by the Demand | Actual Overall Capacity Factor | LCOE (USD/MWh) | ||
|---|---|---|---|---|---|---|---|
| SMRs (300 MW) | Microreactors (10 MW) | SMRs | Microreactors | ||||
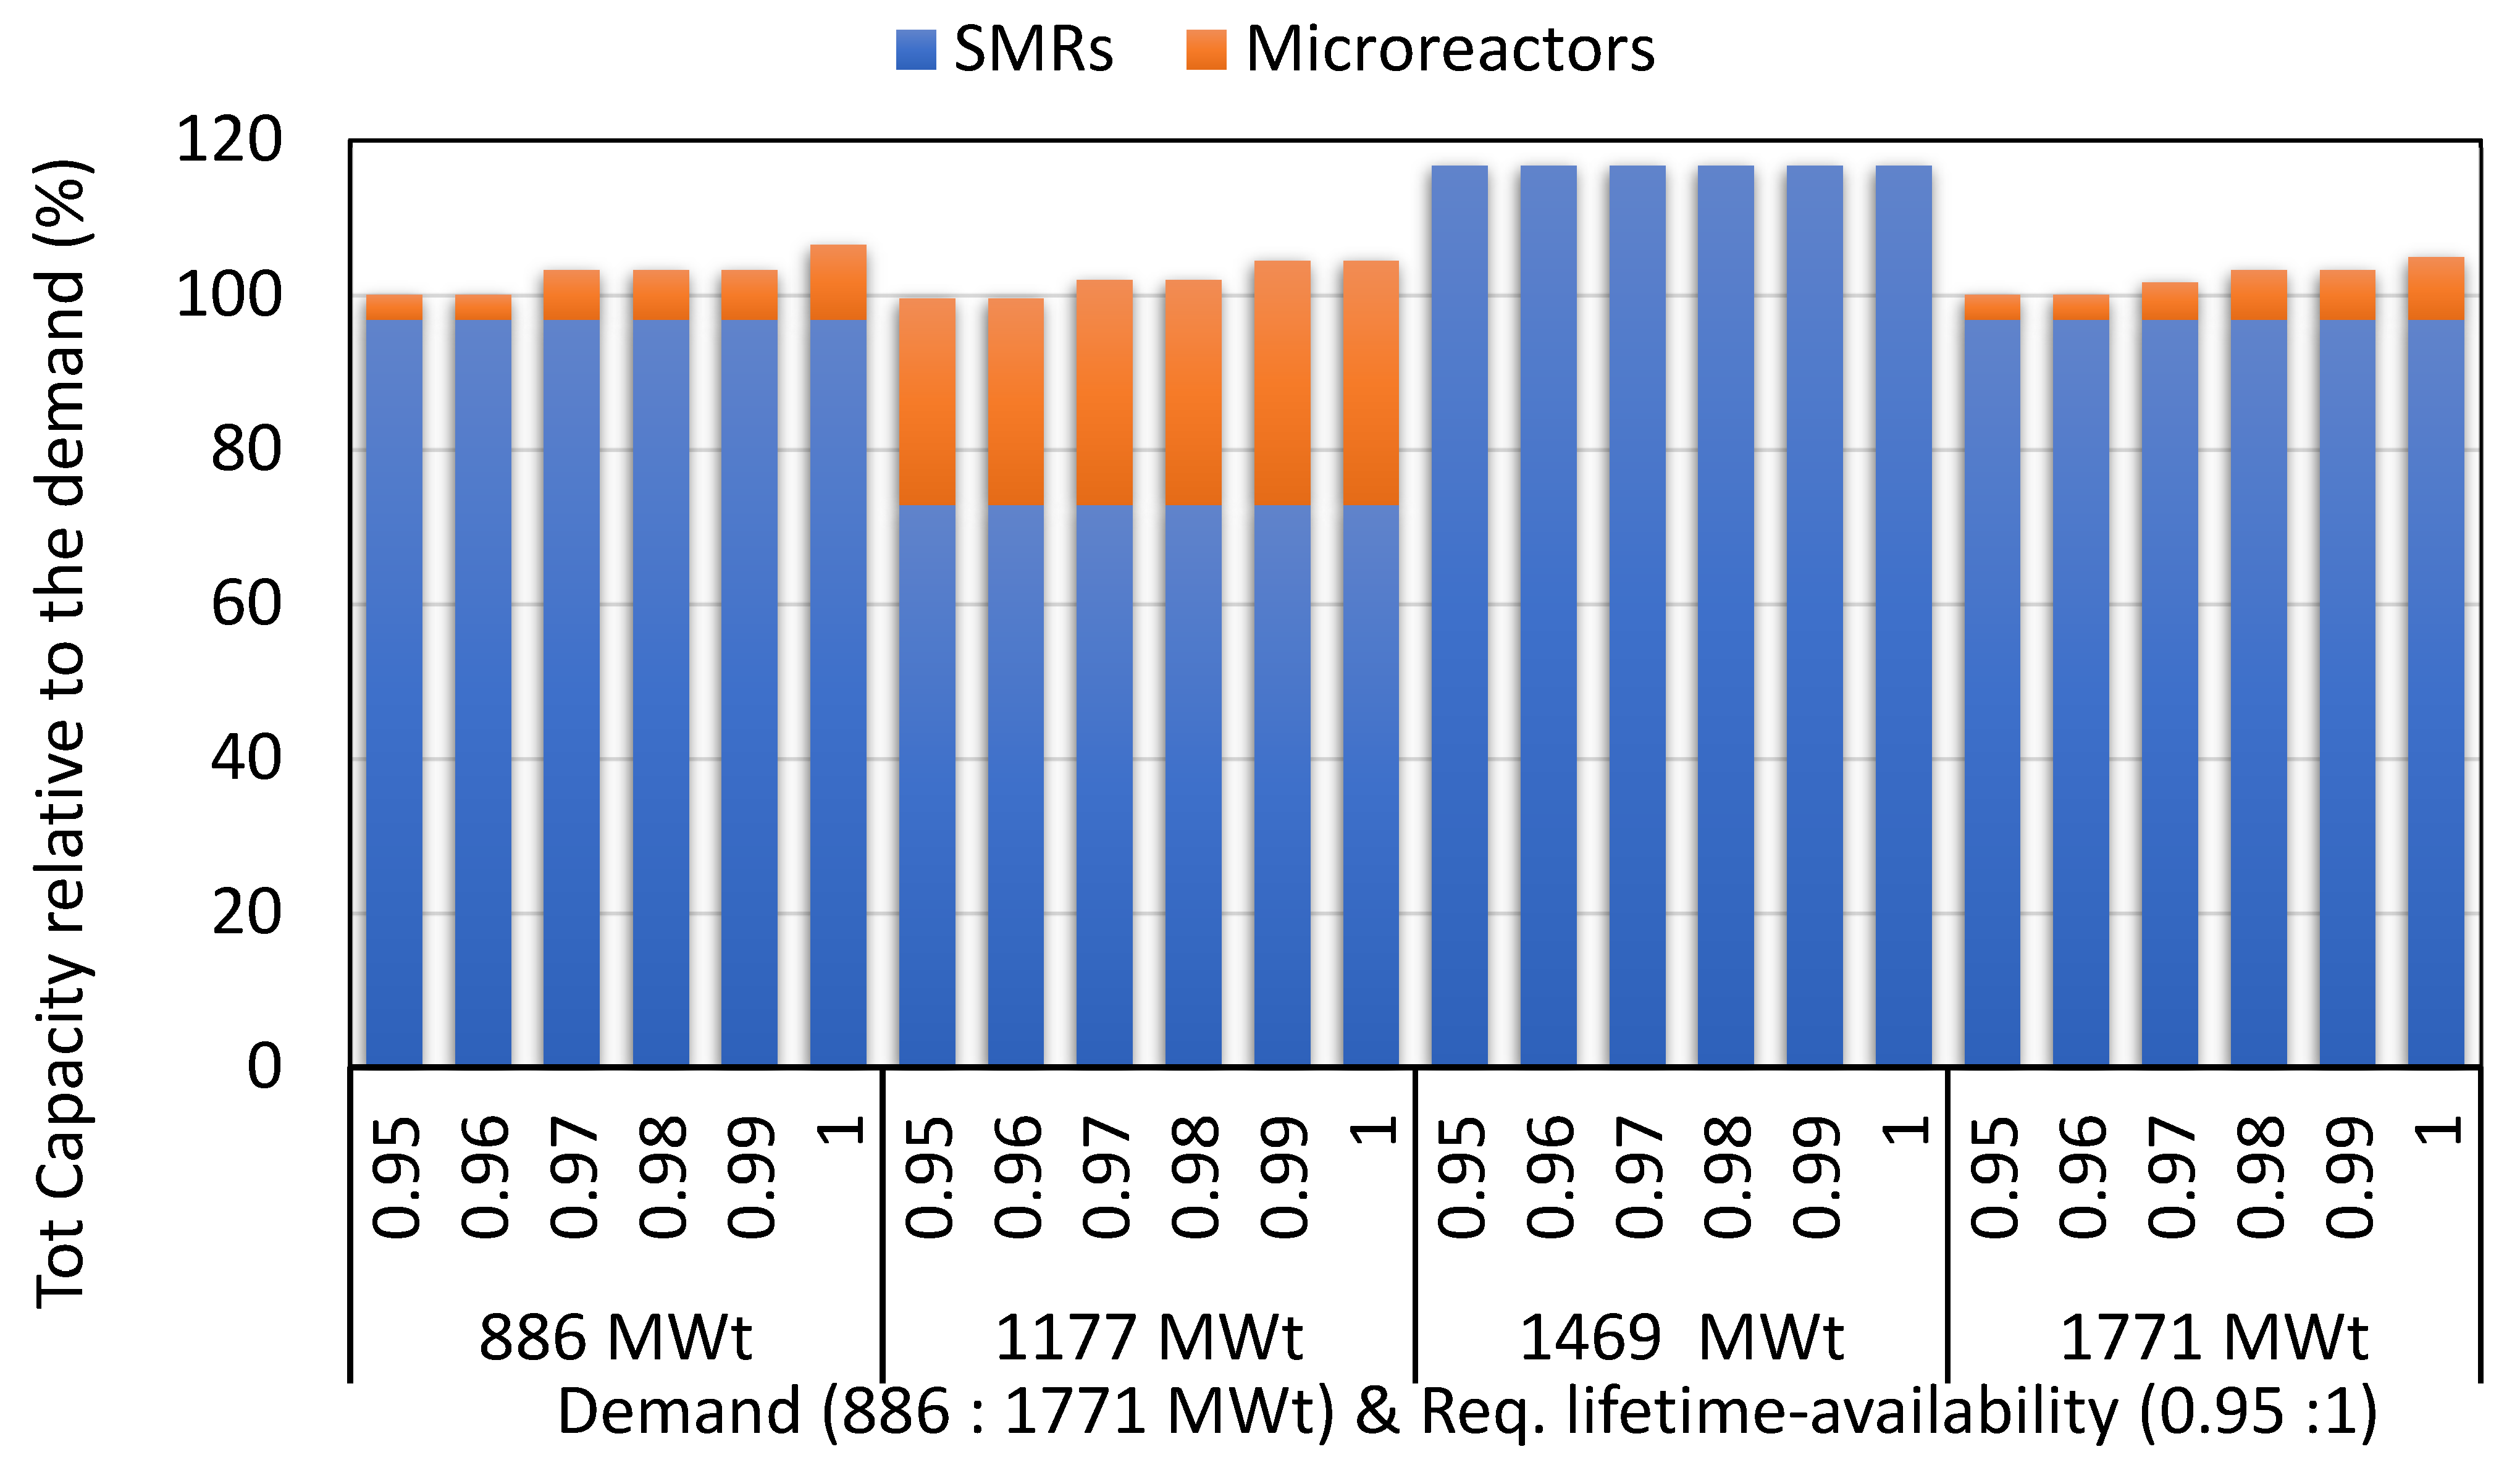
| 310 | 0.95 | 1 | 1 | 96.8% | 3.2% | 0.962 | 109.6 |
| 0.96 | 1 | 1 | 96.8% | 3.2% | 0.962 | 109.6 | |
| 0.97 | 1 | 2 | 96.8% | 6.5% | 0.994 | 110.7 | |
| 0.98 | 1 | 2 | 96.8% | 6.5% | 0.994 | 110.7 | |
| 0.99 | 1 | 2 | 96.8% | 6.5% | 0.994 | 110.7 | |
| 1 | 1 | 3 | 96.8% | 9.7% | 1.025 | 114.4 | |
| 412 | 0.95 | 1 | 11 | 72.8% | 26.7% | 0.961 | 114.9 |
| 0.96 | 1 | 11 | 72.8% | 26.7% | 0.961 | 114.9 | |
| 0.97 | 1 | 12 | 72.8% | 29.1% | 0.985 | 115.1 | |
| 0.98 | 1 | 12 | 72.8% | 29.1% | 0.985 | 115.1 | |
| 0.99 | 1 | 13 | 72.8% | 31.6% | 1.008 | 116.2 | |
| 1 | 1 | 13 | 72.8% | 31.6% | 1.008 | 116.2 | |
| 514 | 0.95 | 2 | 0 | 116.7% | 0.0% | 1.122 | 106.7 |
| 0.96 | 2 | 0 | 116.7% | 0.0% | 1.122 | 106.7 | |
| 0.97 | 2 | 0 | 116.7% | 0.0% | 1.122 | 106.7 | |
| 0.98 | 2 | 0 | 116.7% | 0.0% | 1.122 | 106.7 | |
| 0.99 | 2 | 0 | 116.7% | 0.0% | 1.122 | 106.7 | |
| 1 | 2 | 0 | 116.7% | 0.0% | 1.122 | 106.7 | |
| 620 | 0.95 | 2 | 2 | 96.8% | 3.2% | 0.962 | 97.7 |
| 0.96 | 2 | 2 | 96.8% | 3.2% | 0.962 | 97.7 | |
| 0.97 | 2 | 3 | 96.8% | 4.8% | 0.978 | 98.4 | |
| 0.98 | 2 | 4 | 96.8% | 6.5% | 0.994 | 99.0 | |
| 0.99 | 2 | 4 | 96.8% | 6.5% | 0.994 | 99.0 | |
| 1 | 2 | 5 | 96.8% | 8.1% | 1.009 | 100.4 | |
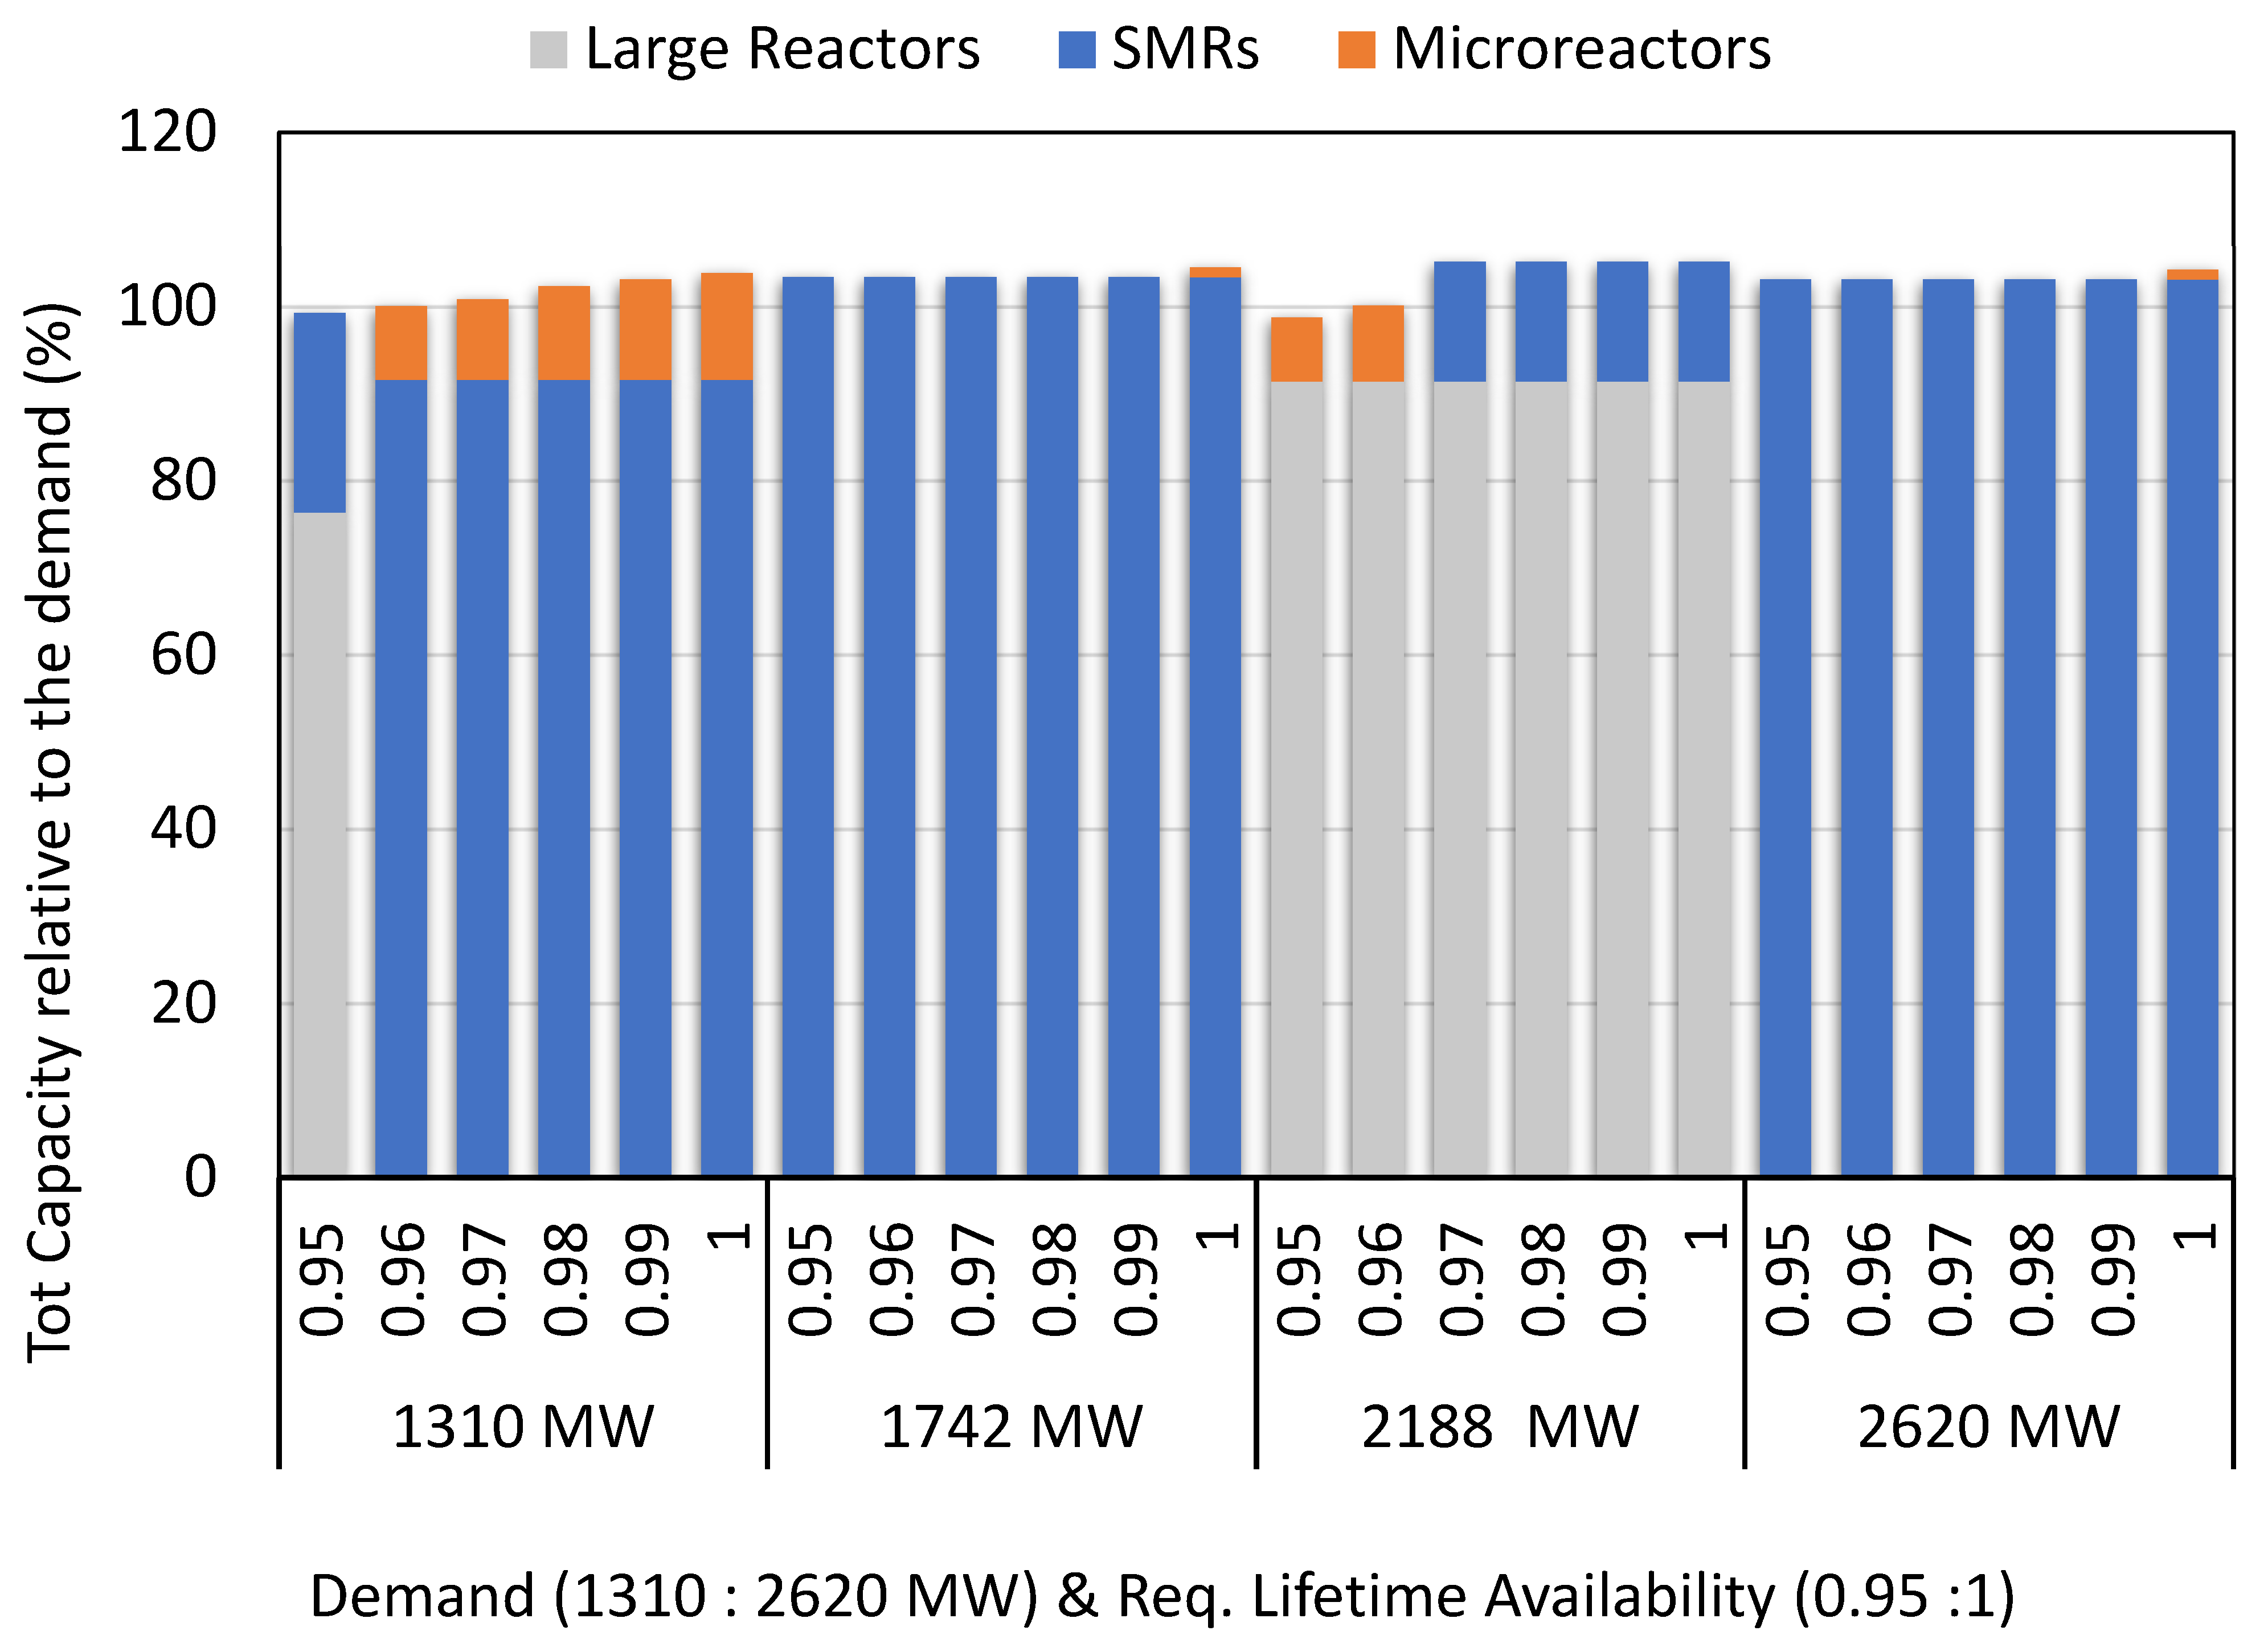
| Demand (MWe) | Req. Lifetime Availability | Number of Reactors | Total Installed Capacity, Normalized by Demand (%) | Actual Overall Capacity Factor | LCOE (USD/MWh) | ||||
|---|---|---|---|---|---|---|---|---|---|
| Large Reactors (1000 MW) | SMRs (300 MW) | Microreactors (10 MW) | Large Reactors | SMRs | Microreactors | ||||
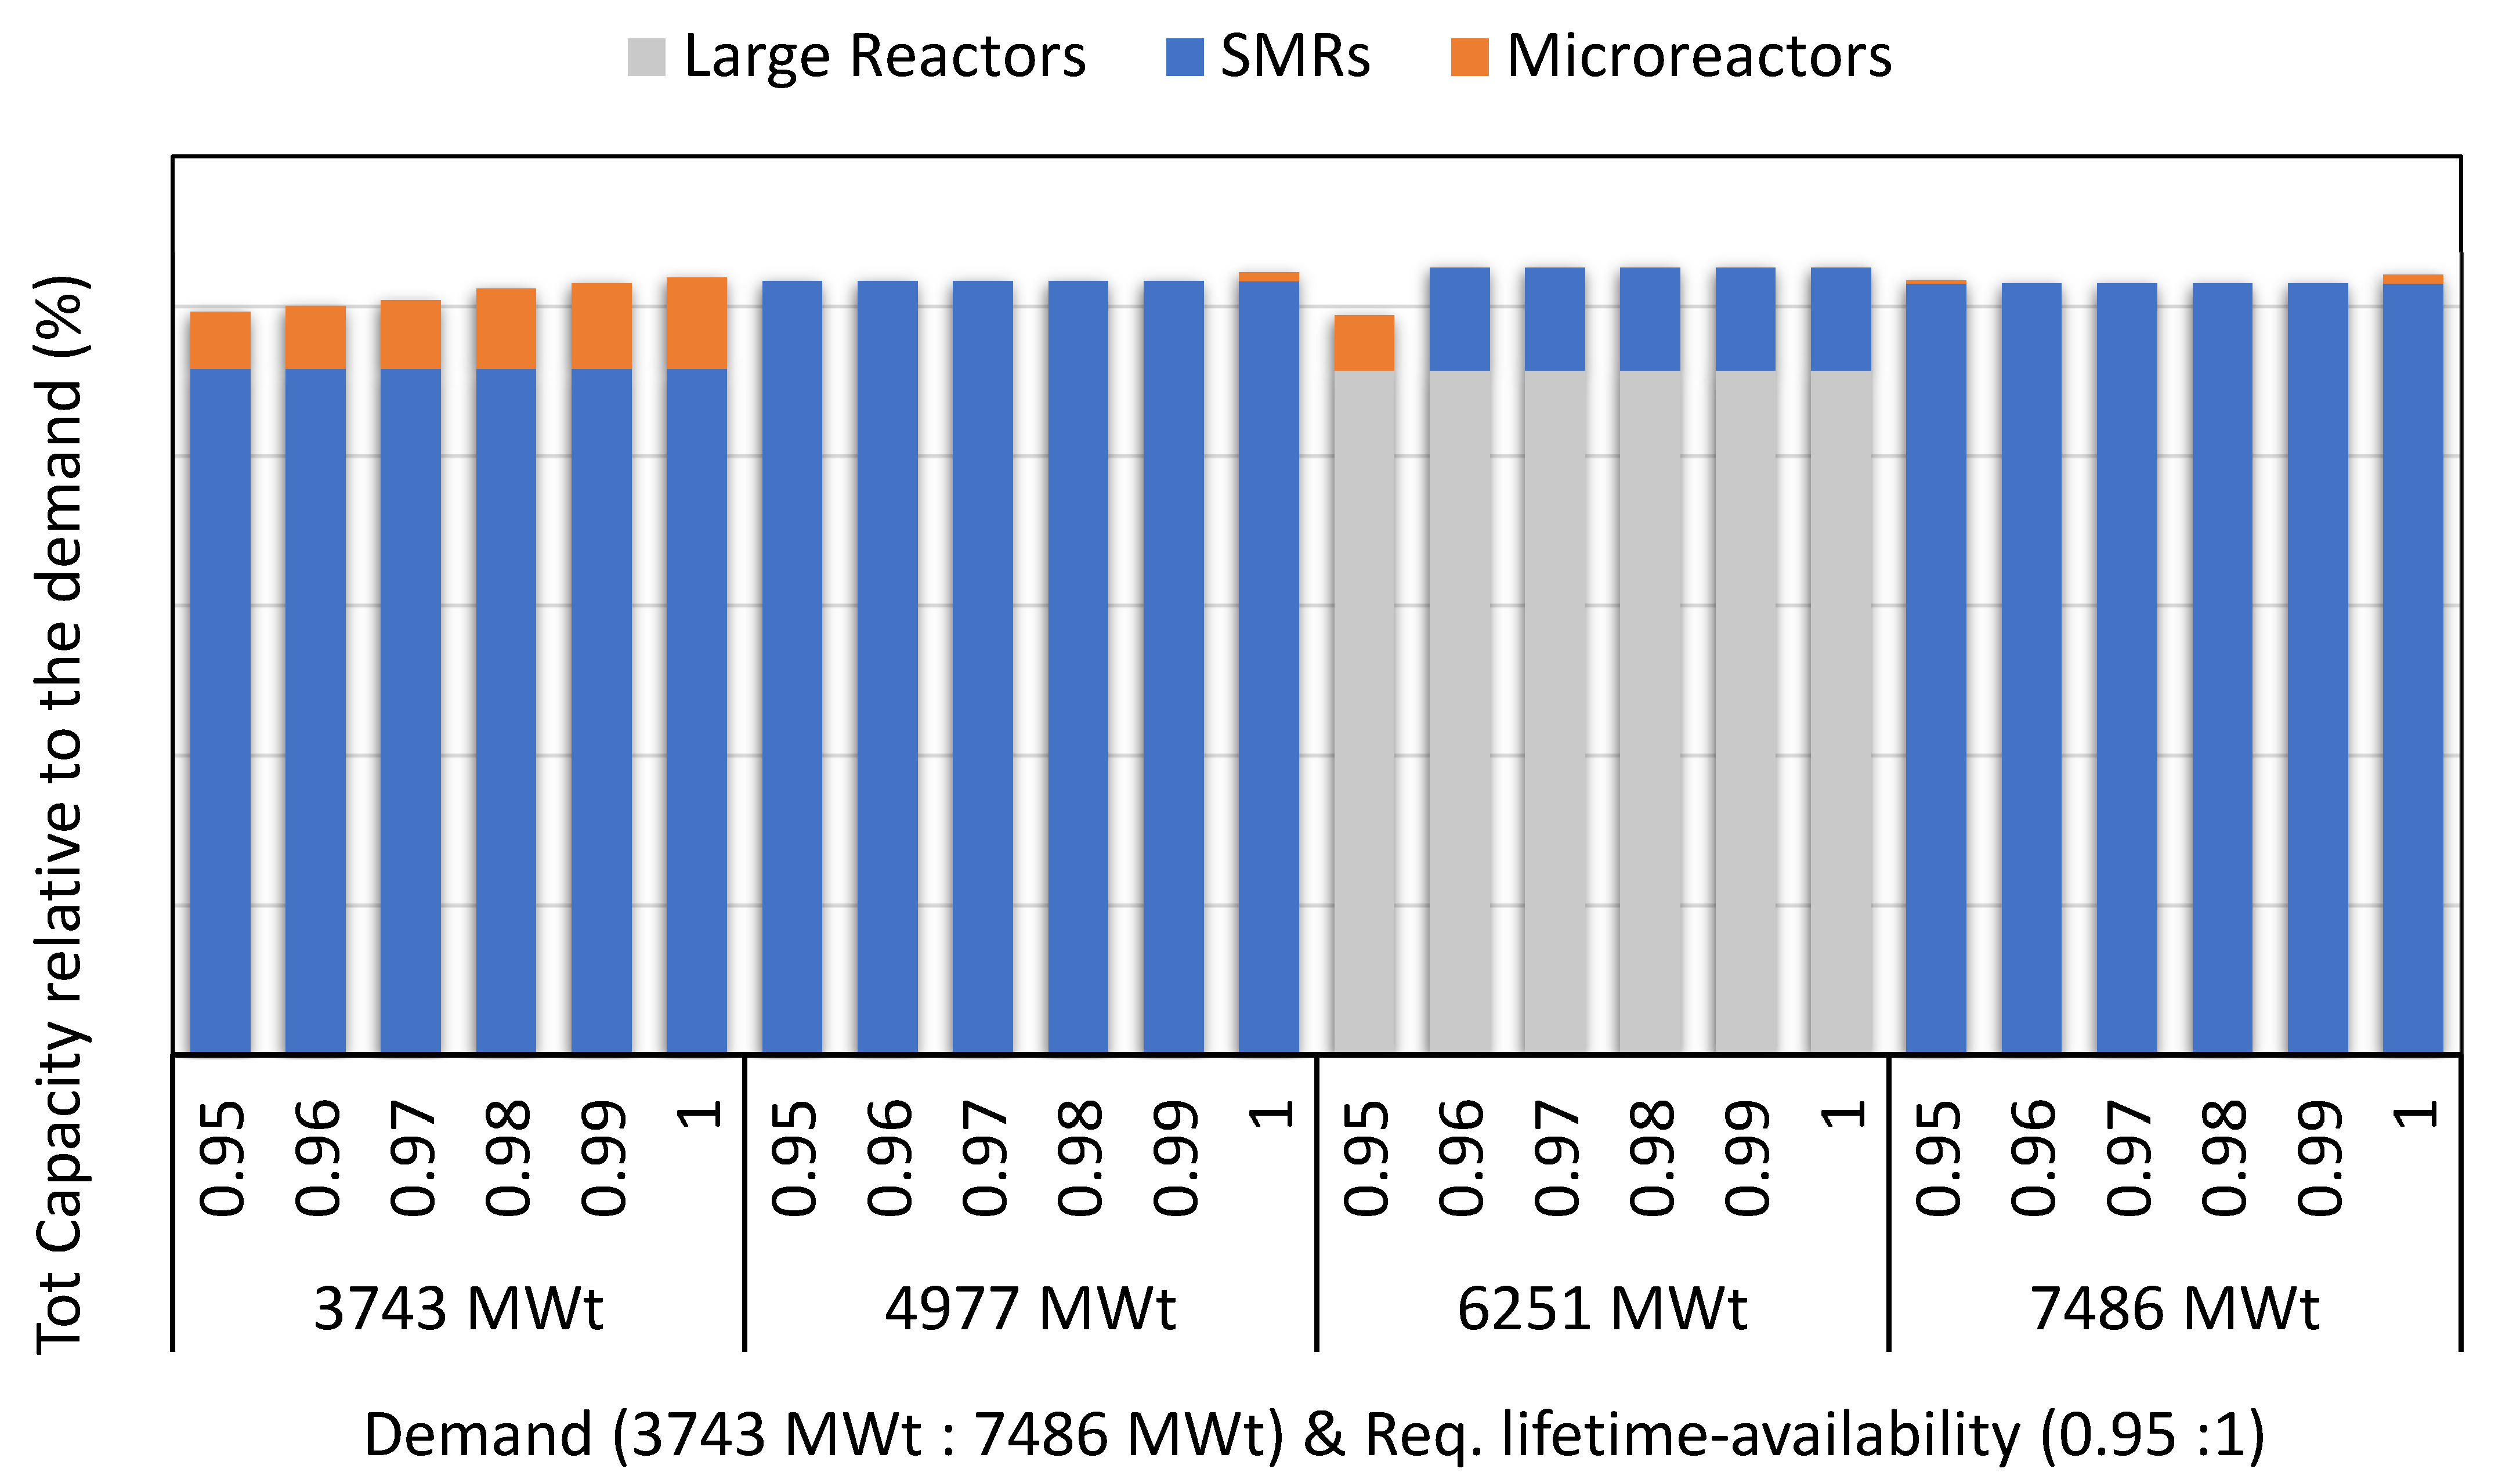
| 1310 | 0.95 | 1 | 1 | 0 | 76.3% | 22.9% | 0.0 | 0.954 | 91.7 |
| 0.96 | 0 | 4 | 11 | 0.0 | 91.6% | 8.4% | 0.963 | 91.9 | |
| 0.97 | 0 | 4 | 12 | 0.0 | 91.6% | 9.2% | 0.970 | 92.2 | |
| 0.98 | 0 | 4 | 14 | 0.0 | 91.6% | 10.7% | 0.985 | 92.6 | |
| 0.99 | 0 | 4 | 15 | 0.0 | 91.6% | 11.5% | 0.993 | 92.8 | |
| 1 | 0 | 4 | 16 | 0.0 | 91.6% | 12.2% | 1.000 | 93.0 | |
| 1742 | 0.95 | 0 | 6 | 0 | 0.0 | 103.3% | 0.0 | 0.994 | 84.2 |
| 0.96 | 0 | 6 | 0 | 0.0 | 103.3% | 0.0 | 0.994 | 84.2 | |
| 0.97 | 0 | 6 | 0 | 0.0 | 103.3% | 0.0 | 0.994 | 84.2 | |
| 0.98 | 0 | 6 | 0 | 0.0 | 103.3% | 0.0 | 0.994 | 84.2 | |
| 0.99 | 0 | 6 | 0 | 0.0 | 103.3% | 0.0 | 0.994 | 84.2 | |
| 1 | 0 | 6 | 2 | 0.0 | 103.3% | 1.1% | 1.005 | 85.6 | |
| 2188 | 0.95 | 2 | 0 | 16 | 91.4% | 0.0 | 7.3% | 0.950 | 83.1 |
| 0.96 | 2 | 0 | 19 | 91.4% | 0.0 | 8.7% | 0.964 | 83.5 | |
| 0.97 | 2 | 1 | 0 | 91.4% | 13.7% | 0.0 | 1.011 | 83.5 | |
| 0.98 | 2 | 1 | 0 | 91.4% | 13.7% | 0.0 | 1.011 | 83.5 | |
| 0.99 | 2 | 1 | 0 | 91.4% | 13.7% | 0.0 | 1.011 | 83.5 | |
| 1 | 2 | 1 | 0 | 91.4% | 13.7% | 0.0 | 1.011 | 83.5 | |
| 2620 | 0.95 | 0 | 9 | 0 | 0.0 | 103.1% | 0.0 | 0.991 | 81.0 |
| 0.96 | 0 | 9 | 0 | 0.0 | 103.1% | 0.0 | 0.991 | 81.0 | |
| 0.97 | 0 | 9 | 0 | 0.0 | 103.1% | 0.0 | 0.991 | 81.0 | |
| 0.98 | 0 | 9 | 0 | 0.0 | 103.1% | 0.0 | 0.991 | 81.0 | |
| 0.99 | 0 | 9 | 0 | 0.0 | 103.1% | 0.0 | 0.991 | 81.0 | |
| 1 | 0 | 9 | 3 | 0.0 | 103.1% | 1.1% | 1.002 | 82.0 | |
Disclaimer/Publisher’s Note: The statements, opinions and data contained in all publications are solely those of the individual author(s) and contributor(s) and not of MDPI and/or the editor(s). MDPI and/or the editor(s) disclaim responsibility for any injury to people or property resulting from any ideas, methods, instructions or products referred to in the content. |
© 2024 by the authors. Licensee MDPI, Basel, Switzerland. This article is an open access article distributed under the terms and conditions of the Creative Commons Attribution (CC BY) license (https://creativecommons.org/licenses/by/4.0/).
Share and Cite
Hanna, B.N.; Abou-Jaoude, A.; Guaita, N.; Talbot, P.; Lohse, C. Navigating Economies of Scale and Multiples for Nuclear-Powered Data Centers and Other Applications with High Service Availability Needs. Energies 2024, 17, 5073. https://doi.org/10.3390/en17205073
Hanna BN, Abou-Jaoude A, Guaita N, Talbot P, Lohse C. Navigating Economies of Scale and Multiples for Nuclear-Powered Data Centers and Other Applications with High Service Availability Needs. Energies. 2024; 17(20):5073. https://doi.org/10.3390/en17205073
Chicago/Turabian StyleHanna, Botros N., Abdalla Abou-Jaoude, Nahuel Guaita, Paul Talbot, and Christopher Lohse. 2024. "Navigating Economies of Scale and Multiples for Nuclear-Powered Data Centers and Other Applications with High Service Availability Needs" Energies 17, no. 20: 5073. https://doi.org/10.3390/en17205073
APA StyleHanna, B. N., Abou-Jaoude, A., Guaita, N., Talbot, P., & Lohse, C. (2024). Navigating Economies of Scale and Multiples for Nuclear-Powered Data Centers and Other Applications with High Service Availability Needs. Energies, 17(20), 5073. https://doi.org/10.3390/en17205073


