Article

Analysis and Optimization of a s-CO2 Cycle Coupled to Solar, Biomass, and Geothermal Energy Technologies

by
Orlando Anaya-Reyes
1,
Iván Salgado-Transito
2,
David Aarón Rodríguez-Alejandro
1,*,
Alejandro Zaleta-Aguilar
1,
Carlos Benito Martínez-Pérez
3 and
Sergio Cano-Andrade
1,*
1
Department of Mechanical Engineering, Universidad de Guanajuato, Salamanca 36885, Mexico
2
CONAHCyT—Centro de Investigaciones en Óptica A.C., Prol. Constitución 607, Fracc. Reserva Loma Bonita, Aguascalientes 20200, Mexico
3
Department of Industrial Engineering, Sistema Avanzado de Bachillerato y Educación Superior en el Estado de Guanajuato, Leon 37234, Mexico
*
Authors to whom correspondence should be addressed.
Energies 2024, 17(20), 5077; https://doi.org/10.3390/en17205077
Submission received: 31 July 2024 / Revised: 1 October 2024 / Accepted: 9 October 2024 / Published: 12 October 2024
(This article belongs to the Section B2: Clean Energy)

Abstract

:
This paper presents an analysis and optimization of a polygeneration power-production system that integrates a concentrating solar tower, a supercritical CO2 Brayton cycle, a double-flash geothermal Rankine cycle, and an internal combustion engine. The concentrating solar tower is analyzed under the weather conditions of the Mexicali Valley, Mexico, optimizing the incident radiation on the receiver and its size, the tower height, and the number of heliostats and their distribution. The integrated polygeneration system is studied by first and second law analyses, and its optimization is also developed. Results show that the optimal parameters for the solar field are a solar flux of 549.2 kW/m2, a height tower of 73.71 m, an external receiver of 1.86 m height with a 6.91 m diameter, and a total of 1116 heliostats of 6 m × 6 m. For the integrated polygeneration system, the optimal values of the variables considered are 1437 kPa and 351.2 kPa for the separation pressures of both flash chambers, 753 °C for the gasification temperature, 741.1 °C for the inlet temperature to the turbine, 2.5 and 1.503 for the turbine pressure ratios, 0.5964 for the air–biomass equivalence ratio, and 0.5881 for the CO2 mass flow splitting fraction. Finally, for the optimal system, the thermal efficiency is 38.8%, and the exergetic efficiency is 30.9%.

1. Introduction

Society is currently facing two significant energy challenges. The first one consists of satisfying the growing energy demand, which is estimated to increase by 1.8% per year until 2030 [1]. The second one involves meeting this energy demand sustainably, avoiding using fossil fuels which are nonrenewable and highly polluting energy resources [2]. To address these challenges, the International Energy Agency (IEA) proposes to reduce hydrocarbon consumption from 81.1% in 2016 to 68.1% by 2030, which can be possible by increasing the use of clean energy resources [3]. Mexico has a potential for renewable energy resources to achieve this goal due to its location, particularly solar energy, geothermal energy, and biomass. In terms of solar resources, Mexico’s average direct normal irradiation (DNI) is about 5.5 kWh/m2 per day, with the highest peaks in the northwest part of the country, where it exceeds 7.5 kWh/m2 per day [4]. Regarding geothermal resources, Mexico is the fourth country in the world with the highest installed capacity, which is about 958 MW, where its major geothermal reservoirs are Los Azufres, Los Humeros, Las Tres Virgenes, and Cerro Prieto [5]. In terms of biomass, Mexico is a country with a significant agricultural activity, where the entire territory has the possibility of producing biomass, as it is estimated that Mexico generates more than 76 million tons of agricultural waste per year, being the country in Latin America with the third largest cultivated area [6].
Among the concentrating solar power technologies (CSPs), solar towers are the most promising in terms of a potential reduction in levelized cost of electricity (LCOE) due to their higher concentration ratio and thermal efficiency [7]. Solar concentrating systems can also be integrated with other energy-production technologies; for instance, Zhou [8] proposed a solar-geothermal plant with parabolic troughs integrated with an organic Rankine cycle, analyzing the effects that some environmental parameters such as temperature, solar radiation, geographical location, and quality of the geothermal resource have on the overall performance, showing that the power output increases between 22% and 78% depending on the size of the solar field. Astolfi et al. [9] analyzed the integration of a concentrating solar plant with a geothermal organic Rankine cycle, obtaining a 60% reduction in the cost of the energy produced when compared to that obtained by the solar plant individually. Lentz and Almanza [10] developed two strategies to combine a flash-type geothermal system with parabolic solar collectors in Cerro Prieto, Mexico, increasing the steam quality by 10% to achieve higher electricity production. Cardemil et al. [11] developed an exergy analysis of the integration of flash-type plants with parabolic troughs, finding an increase in power production of up to 20% when operating together. Boukelia et al. [12] analyzed the integration of a conventional solar tower plant with a geothermal cycle, obtaining an increase in the dispatch capacity and annual thermodynamic performance of more than 30% over the operation of the solar tower plant alone. Javadi et al. [13] developed an exergoeconomic analysis of a solar tower plant integrated with a dual-flash geothermal plant, obtaining a reduction in the consumption of the geothermal resource by 21%.
Solar thermal technologies are also compatible with supercritical carbon dioxide (s-CO2) Brayton cycles, which have recently gained significant interest in the scientific community mainly because of their advantages, such as their compact turbomachinery as well as the low corrosivity and high chemical stability of s-CO2 in contrast to steam cycles [14]. These benefits result in lower capital cost, as maintenance becomes easier and greater efficiencies are achieved. Feher [15] and Angelino [16] were the first to propose the s-CO2 cycles in the 1960s, demonstrating that efficiencies close to 55% could be achieved under ideal conditions. For years, this technology was neglected until 2004, when Dostal [17] proposed a s-CO2 Brayton cycle for applications in new-generation nuclear reactors, reawakening the interest in these systems. In 2011, Kulhanek and Dostal [14] and Moisseytsev and Sienicki [18] analyzed some s-CO2 Brayton cycle configurations, finding that the most efficient configuration includes a partial cooling and a recompression stage. In 2015, Padilla et al. [19] conducted a detailed energy and exergy analysis of four different configurations of these cycles integrated with a central solar receiver, finding that the optimal input temperature for the gas turbine is 700–750 °C. On the other hand, the first experimental demonstrations of s-CO2 at a laboratory scale (1 MWe) were developed at the Sandia Lab by Conboy et al. and Iverson et al. [20,21], who analyzed different components under variable working conditions.
Recently, s-CO2 cycles have been integrated with other technologies such as biomass gasifiers and geothermal energy in order to achieve polygeneration; for example, Wang et al. [22] proposed a hybrid cascade system, integrating a biomass burner to compensate for the intrinsic intermittency of the solar concentrator, achieving a thermal efficiency of 40%. Yu et al. [23] analyzed the integration of s-CO2 Brayton cycles for the recovery of heat from the exhaust gases of an internal combustion engine (ICE), showing the importance of choosing an appropriate compressor input pressure to achieve maximum heat recovery efficiency. Nkhonjera et al. [24] analyzed the integration of a coal gasification plant and a s-CO2 Brayton cycle, using the heat produced by burning the syngas in the s-CO2 cycle, achieving thermal efficiencies of about 60%. In 2021, Cao et al. [25] presented an exergoeconomic performance of combined s-CO2 biomass cycle with a CSP system serving as a heat source, reaching a highest energy efficiency of 63%. Altinkaynak and Ozturk [26] analyzed a combined s-CO2-ORC system by applying the first and second law of thermodynamics, showing energy and exergy efficiencies of 45% and 43%, respectively. Finally, according to Manesh et al. [27], the optimization of parameters such as exergy efficiency can be used as an effective methodology to improve the performance of polygeneration systems, as Chitgar and Moghimi [28] did for an integrated system based on solid oxide fuel cell gas turbine by using a genetic algorithm.
As is observed above, the literature shows that during the last decade, central receiver towers with a heliostat field and supercritical CO2 Brayton cycles have been the center of attention because of their promising advantages over conventional technologies, such as low costs of operation, high efficiency, compactness, and clean operation. To the best knowledge of the authors, energy and exergy analysis have been developed for different operating conditions of these energy systems. Also, performance optimizations based on the first law efficiency have been developed. These systems have been studied working individually and in an integrated manner. The contribution of this paper is the study of a system composed by a central receiver tower with a heliostat field coupled with a supercritical CO2 Brayton cycle with a partial cooling stage. In particular, the viability of its operation at the Mexicali Valley, Mexico, is studied. Also, a double-flash geothermal Rankine cycle is integrated because the main geothermal reservoir of Mexico is located in this zone. In addition, a reciprocating internal combustion engine working with syngas obtained from a downdraft biomass gasifier is integrated. Detailed energy and exergy analyses are developed for the integrated system. The optical design of the solar field is optimized for the particular weather conditions of the location. Also, the second law efficiency of the integrated system is optimized, considering decision variables that affect the performance of the four cycles, in order to know the best performance conditions of the integrated power plant. The remainder of the paper is organized as follows. Section 2 provides a description of the individual systems and their integration into a single polygeneration power plant; in addition, the methodology used for the analysis and optimization of the system is described; Section 3 provides the results and a discussion of the main findings; and finally, Section 4 concludes the paper.

2. Materials and Methods

2.1. Location

The analysis and optimisation are developed under the weather conditions of Mexicali Valley, in the northwest part of Mexico, where the DNI is about 7.0 kWh/m2 per day [29]. Also, the most important geothermal reservoir in Mexico, Cerro Prieto, is located in this area. Table 1 shows the characteristics of the four geothermal wells available. For the present analysis, well No. 4 is considered due to the compressed liquid conditions, since the validation of the system was conducted under these characteristics [30].

2.2. System Configuration

The polygeneration system under analysis is shown in Figure 1. Section A corresponds to the reciprocating internal combustion engine and encompasses thermodynamic states 1–21, section B corresponds to the solar central tower plant and encompasses thermodynamic state 22, section C corresponds to the s-CO2 Brayton cycle and encompasses thermodynamic states 23–40, and section D corresponds to the geothermal Rankine cycle and encompasses thermodynamic states 41–59. The streams and components of the cycle are also depicted in the figure.

2.3. Reciprocating Internal Combustion Engine

For the ICE, syngas is produced at high temperature in a downdraft biomass gasifier fed by pine wood and atmospheric air; then, the syngas enters a cyclone, where ash and other unburned particles are removed; subsequently, oils such as tar are removed in a filter; and finally, a fraction of the syngas is cooled until the working inlet temperature of the ICE is reached. The other fraction of the syngas is burned in the combustion chamber of the s-CO2 cycle.
For the downdraft reactor, the following assumptions are considered: (1) ideal gas model, (2) the reactor is adiabatic and isothermal, and (3) the temperature and reaction time are enough to reach equilibrium. Biomass gasification involves a large number of both endothermic and exothermic reactions; however, the model can generally be represented in a single overall gasification reaction, such as
C x H y O z + ( W + W air ) H 2 O + m O 2 + r N / O m N 2 x 1 H 2 + x 2 C O + x 3 C O 2 + x 4 H 2 O + x 5 C H 4 + r N / O m N 2
where x, y, and z are the molar ratios C / C , H / C , and O / C , respectively, while r N / O is the nitrogen–oxygen molar ratio of the air, W is the moisture content in the biomass, W a i r is the amount of water in the air, and m represents the air molar ratio of air supplied to the reaction. The concentrations of hydrogen, carbon monoxide, carbon dioxide, water vapor, and methane in the produced gas are represented by x 1 to x 5 . In order to solve the resulting system, it is necessary to determine the equilibrium constants of the methane-formation reaction and the water–gas equilibrium reaction through their partial pressures as shown in [31,32].
The higher and lower heating values of the syngas produced are defined as
H H V syn = 2.32779 ( 85.65 + 137.04 C + 217.55 H + 62.56 N + 107.73 S + 8.04 O 12.94 ash )
L H V syn = H H V syn 600 m water m bio
The equivalence ratio ξ is one of the most critical parameters in gasification processes since it helps to set up and operate the reactor and relates the actual air–fuel ratio ( R A / F ) r with the stoichiometric air–fuel ratio ( R A / F ) s . For a correct gasification, values between 0.2 and 0.5 are recommended.
ξ = ( R A / F ) r ( R A / F ) s
( R A / F ) s = 8.89 ( % C + 0.375 · % S ) + 26.5 · % H 3.3 · % O
The performance of a gasifier can be expressed in terms of its thermal efficiency, which can be defined by the cold gas efficiency, η CGE , used to quantify the conversion value after removing tar vapors and other residues at room temperature, given as
η CGE = η I , gas = V ˙ syn · L H V syn m ˙ bio · L H V bio
The exergetic efficiency of the gasification system is given as
η II , gas = E ˙ syn m ˙ bio L H V bio β
where E ˙ syngas is the chemical exergy of the synthesis gas and β is a correlation factor for wood pellets, which depends on the proportions H / C and O / C in the biomass composition [33], such as
β = 1.0414 + 0.0177 H C 0.3328 O C [ 1 + 0.0537 H C ] 1 0.4021 O C
By applying an exergy balance on the gasification system, its exergy destruction rate is obtained as
E ˙ d , gas = m ˙ bio L H V bio β E ˙ syn
An internal combustion engine Ettes Power model 9300 D/M-1 is selected for the cycle. This is a low-speed, nine-cylinder in-line, and four-stroke engine designed to work with synthesis gas. The technical specifications are given in Table 2.
The stoichiometric mixture dosing F relates the mass flow of air and the mass flow of fuel required for complete combustion, where a typical value of 1/14.7 is commonly used [34].
F = m ˙ syn m ˙ air
The lower heating value of the mixture can be obtained as [34]
L H V mix = 12655 V C O + 10770 V H 2 + 35825 V C H 4 1 + 2.38 ( V C O + V H 2 ) + 9.52 V C H 4
where V C O , V H 2 , and V C H 4 are the volume fractions of the respective compounds before mixing with air. Thus, the thermal and exergetic efficiency of the ICE are obtained as
η I , ICE = W ˙ ICE m ˙ mix L H V mix
η II , ICE = W ˙ ICE m ˙ mix e mix
where the specific exergy of the mixture is given by a chemical exergy factor τ , which depends on the mass fractions of hydrogen, oxygen, carbon, and sulfur, respectively.
e mix = τ L H V mix
τ = 1.0401 + 0.1728 h c + 0.0432 o c + 0.2169 s c 1.216901 h c
The exergy destruction that takes place in this component is obtained as
E ˙ d , ICE = m ˙ mix ( e mix ) m ˙ scape ( e scape ) W ˙ ICE

2.4. Concentrating Solar Tower

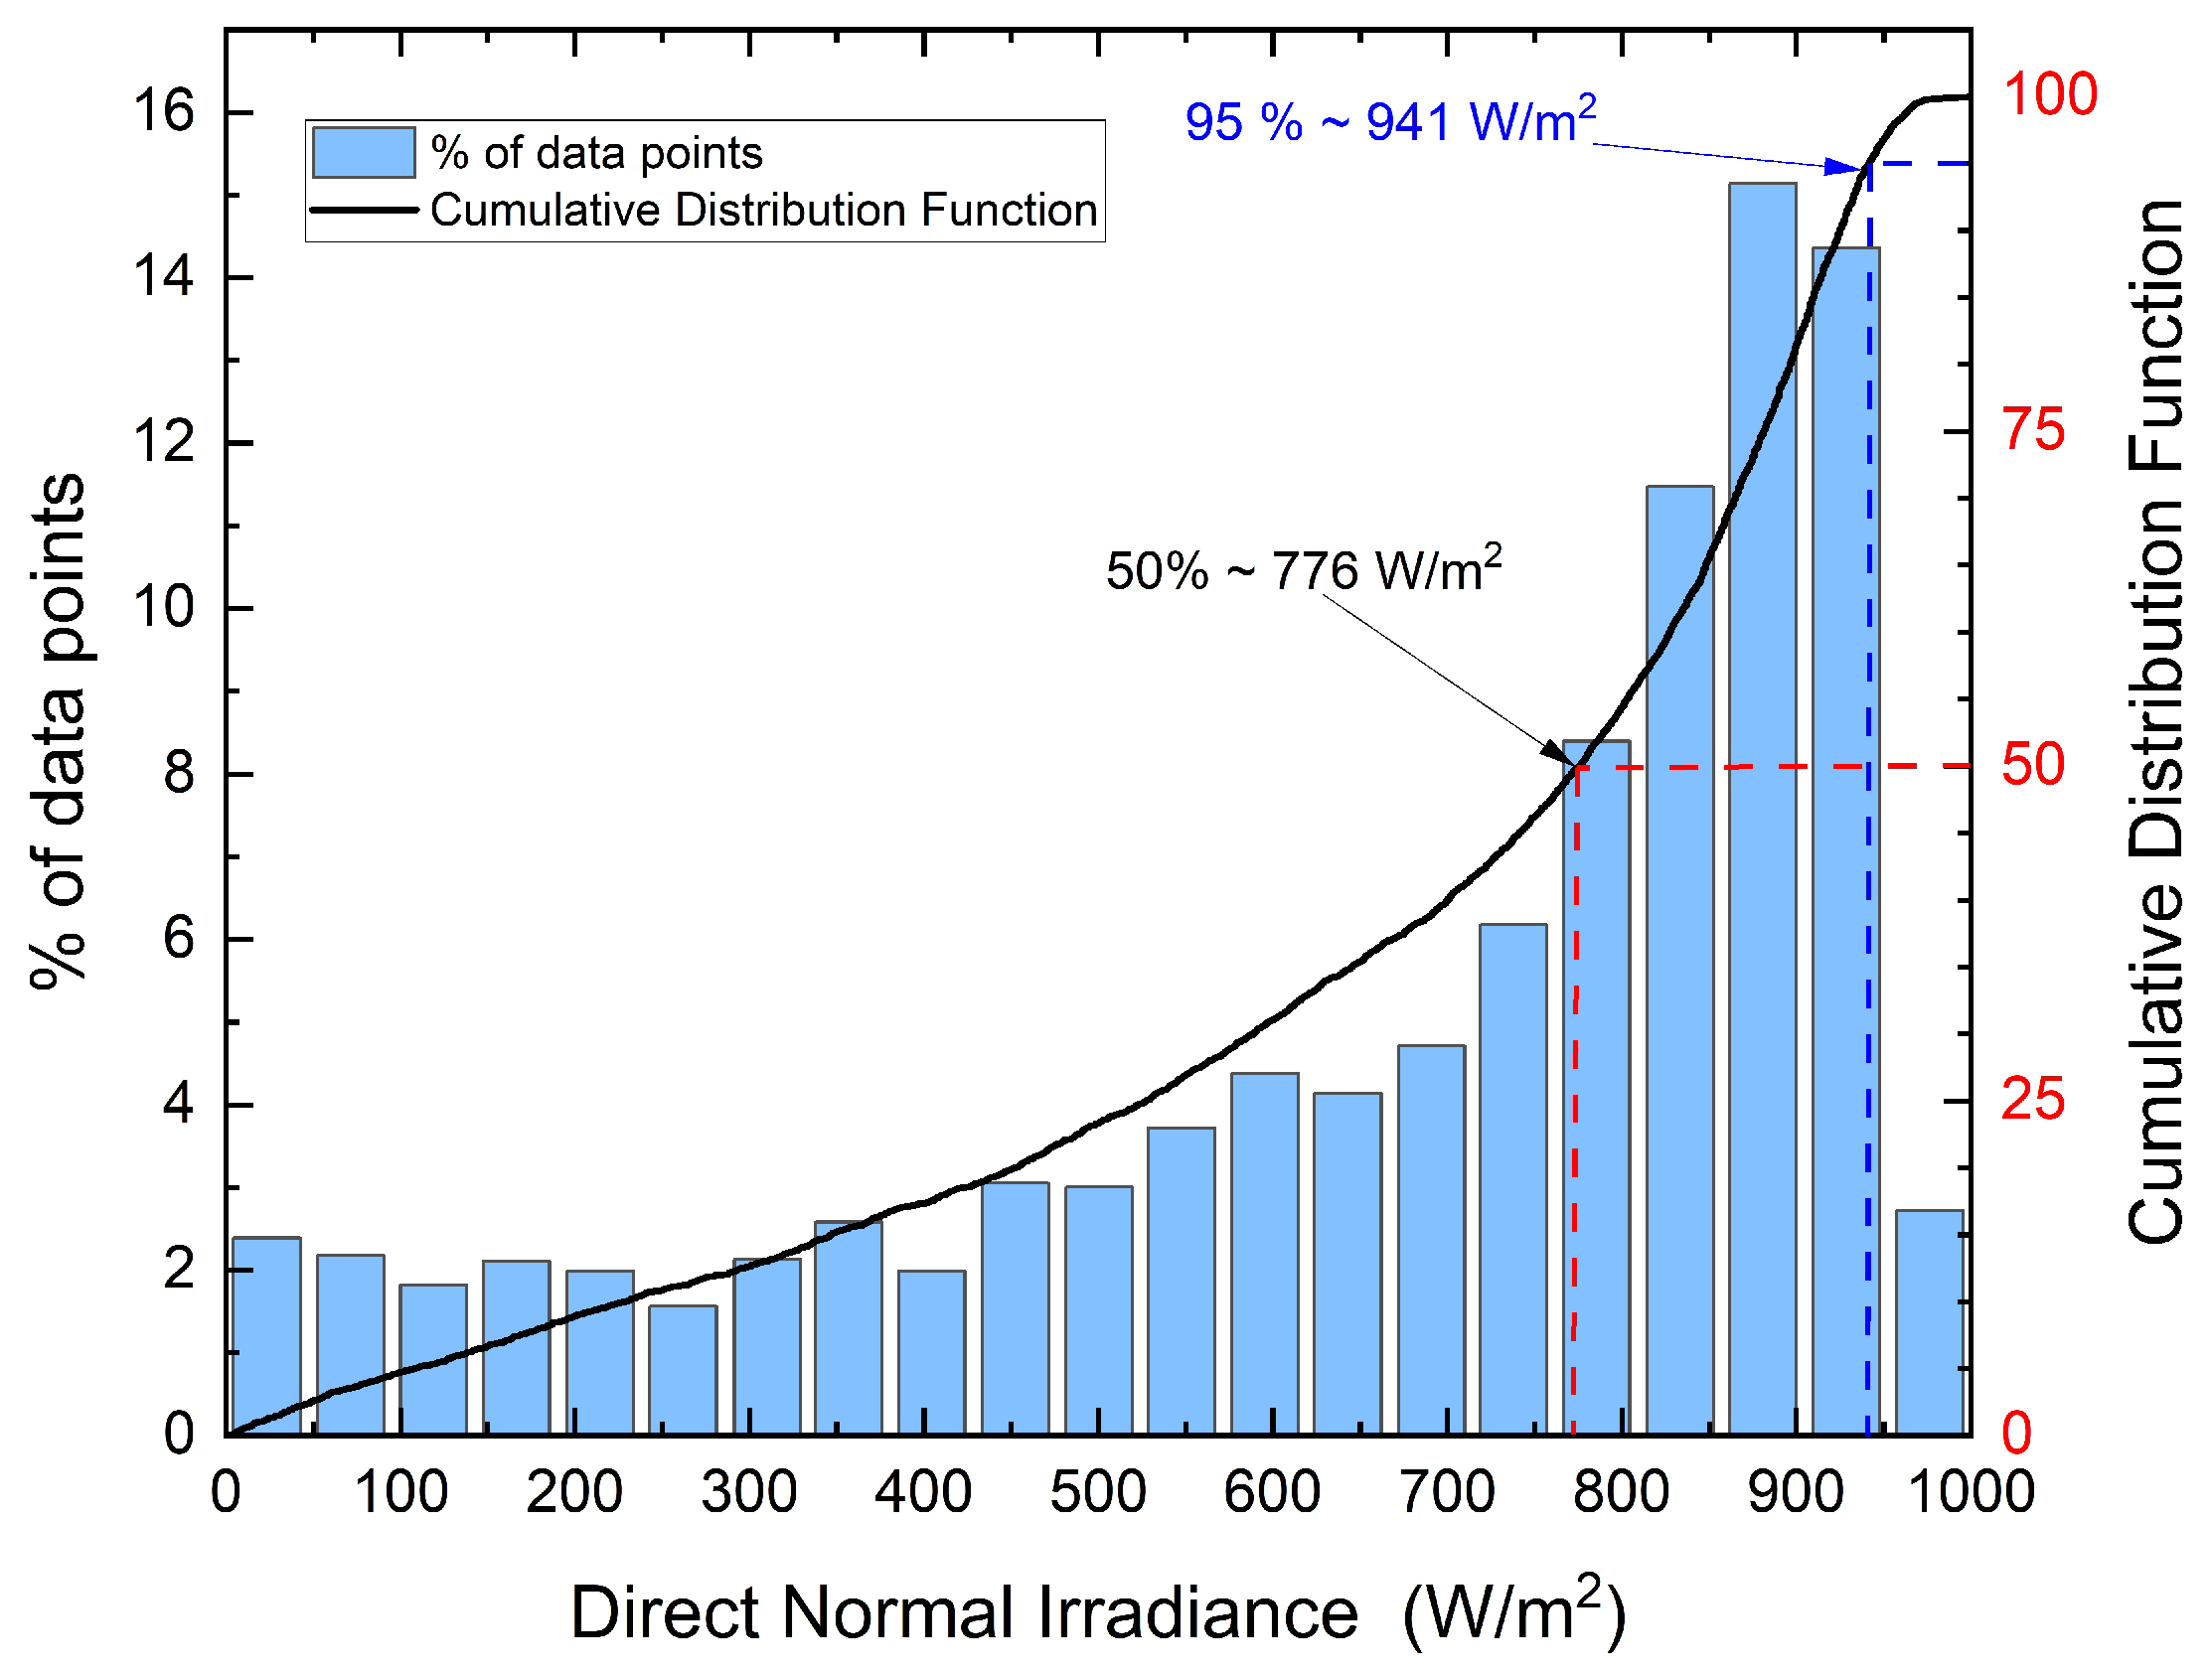
In the concentrating solar tower, the exhaust CO2 stream is heated to its maximum operating temperature by absorbing the energy collected by the solar receiver. Then, the stream enters the high-pressure turbine of the s-CO2 system, restarting the cycle. Figure 2 shows the DNI for the Mexicali Valley. The blue bars represent the irradiance probability density function (PDF) and the solid black curve represents the cumulative density function (CDF). A value of 95%, the maximum irradiance, is considered for the DNI [35].
The operating conditions under which the concentrating solar tower is considered to be working are given in Table 3. A radial staggered array is considered for the heliostat field because of its high efficiency [37]. As for the weather conditions, midday of the spring equinox, 20 March at 12:00 o’clock, is considered for the model [7].

2.5. Supercritical CO2 Brayton Cycle

The s-CO2 Brayton cycle is considered to have a partial cooling stage, where a stream of CO2 at high temperature and pressure from the solar tower enters the first turbine of the Brayton cycle, expanding to an intermediate pressure. The stream is reheated by using the combustion of syngas from the ICE cycle. The stream is then expanded in a low-pressure turbine. The CO2 stream is transferred to two heat recuperators at high (HTR) and low temperature (LTR), respectively. The stream leaving the LTR enters a cooler in order to reduce its temperature to enter a first compressor that raises its pressure to an intermediate level. This current is then split into two different streams; one of them is sent directly to a third compressor, which raises its pressure to the maximum operating pressure of the cycle; the other stream passes through a second cooling stage to lower its temperature and enters a second compressor that raises its pressure to the maximum operating pressure of the cycle before entering the LTR. The streams are remixed at the exit of the LTR before entering the HTR. The stream then exchanges heat in two heat exchangers of the geothermal cycle before entering the solar tower.
Energy and exergy analyses are developed for the system, taking into account the following assumptions: (1) steady state performance, (2) all the components are well isolated, (3) changes in kinetic and potential energy are negligible, and (4) pressure loss through pipes and heat exchangers is negligible. Applying mass and energy balances for each component of the system, the work produced by the gas turbines is given as
W ˙ GT = m ˙ in h in m ˙ out h out
and the isentropic efficiency of the gas turbines is given as
η GT = h in h out h in h out s
the power required by the compressors is given as
W ˙ GC = m ˙ out h out m ˙ in h in
and the isentropic efficiency of the compressors is given as
η GC = h out s h in h out h in
The inlet temperature of the compressors, T CIT , can be approximated as
T CIT = T 0 + T ITD
where T ITD is the initial temperature difference, and its value typically ranges from 14 °C to 33.3 °C [19]. Due to the arid climate of the proposed location, the use of dry-air cooling is proposed. For the analysis of the HTR and LTR, an effectiveness factor ϵ is given as
ϵ = ( h i , HTR h o , LTR ) hot ( h i , HTR h o @ T c , LTR ) cold
where the enthalpy h o @ T c , L T R is the enthalpy obtained according to the minimum temperature that the hot stream leaving the LTR can reach, which is equivalent to the temperature of the cold stream entering the LTR [19].
The power produced by the Brayton cycle is given as
W ˙ Brayton = j = 1 2 W ˙ GT , j j = 1 3 W ˙ GC , j
and the energetic efficiency is given as
η I , Brayton = W ˙ Brayton Q ˙ s o l a r + Q ˙ C C
The operating conditions of the s-CO2 Brayton cycle are given in Table 4.
An exergy balance for the s-CO2 Brayton cycle is given as
j E ˙ q , j k E ˙ w , k + i n m ˙ i n e i n o u t m ˙ o u t e o u t E ˙ d = 0
where
E q , j = Q ˙ j 1 T 0 T j
is the exergy associated with heat transfer, and
E w , k = W ˙ c v P 0 d V c v d t
is the exergy associated with work interactions, and
e i n / o u t = h i n / o u t h 0 T 0 ( s i n / o u t s 0 )
is the physical exergy associated to the inlet and exergy flows, respectively, and
E ˙ d = T 0 S ˙ irr
are the irreversibilities of the components, where for the turbines this exergy destruction rate is given as
E ˙ d , t = m ˙ ( e i n e o u t ) W ˙ t
and for the compressors, it is given as
E ˙ d , c = W ˙ t m ˙ ( e o u t e i n )
and for the HTR/LTR it is given as
E ˙ d , H T R / L T R = m ˙ C O 2 ( e i n e o u t ) hot m ˙ C O 2 ( e o u t e i n ) cold
For the coolers in the Brayton cycle, there is an increase in the exergy of the cooling air during the heat-transfer process because part of the exergy entering from the CO2 is transferred to the air. This exergy gain can be given as
E ˙ air = m ˙ air [ ( h 0 h i n ) T 0 ( s 0 s i n ) ] air
Thus, the rate of exergy destruction in these components is given as
E ˙ d , cooler = m ˙ C O 2 ( e i n e o u t ) E ˙ air
Thus, the exergetic efficiency of the s-CO2 Brayton cycle is given as
η II , Brayton = W ˙ Brayton E ˙ s o l a r + E ˙ C C

2.6. Double-Flash Geothermal Rankine Cycle

The geothermal Rankine system is fed from a well where saturated water liquid is extracted at 320 °C. The stream then passes through an expansion valve, producing a two-phase liquid–vapor mixture. The saturated liquid is separated from the saturated steam in a flash chamber. The liquid is heated by exchanging energy with the CO2 stream, producing an additional amount of vapor, where it is separated from the remaining saturated liquid. This additional vapor is merged with the vapor extracted from the flash chamber. It is heated again by exchanging energy with the CO2 stream to be converted into superheated vapor and then enters the high-pressure turbine. On the other hand, the saturated liquid from the separator passes through a second expansion valve before entering a second flash chamber. In the flash chamber the liquid is separated from the vapor, where the liquid is sent back to the well and the vapor is superheated by exchanging energy with the exhaust gases of the ICE. This vapor is joined with the exhaust vapor from the high-pressure turbine and then the joined stream is exhausted in the low-pressure turbine. Finally, this stream enters a condenser to return to the well as a sub-cooled liquid.
Energy and exergy analyses are developed for the geothermal Rankine system, taking into account the same assumptions as for the s-CO2 Brayton cycle. By applying mass and energy balances to each of the components of the system, the work produced by the steam turbines is given as
W ˙ ST = m ˙ in h in m ˙ out h out
Steam turbines can operate in humid conditions when a double-phase liquid–vapor is present. Thus, their isentropic efficiency is affected according to the percentage of humidity present. Baumann’s rule [38] suggests that for every 1% of moisture present, there is a decrease of 1% in the efficiency of the turbines. Thus, the efficiency of the steam turbines is given as
η ST = η dry ( x i n x o u t 2 )
where η dry is the efficiency of the turbines in dry steam conditions, while x i n and x o u t represent the quality of the steam at the inlet and exit of the turbines, given as
x i n / o u t = m ˙ S T m ˙ S T + m ˙ f
Depending on the temperature variation in the inlet steam, the turbines can operate in the dry steam region, where steam expansion occurs as an isentropic process. The power produced by the Rankine cycle is given as
W ˙ Rankine = j = 1 2 W ˙ ST , j
and the first and second law efficiency of the double-flash geothermal Rankine cycle is given as
η I , Rankine = W ˙ Rankine Q ˙ geo + Q ˙ C O 2 + Q ˙ esc + Q ˙ comb
η II , Rankine = W ˙ Rankine E ˙ geo + E ˙ C O 2 + E ˙ esc + + E ˙ comb
Finally, the operating conditions of the s-CO2 Brayton cycle and the double-flash geothermal Rankine cycle are given in Table 4.

2.7. Optimization Methodology

The polygeneration system is optimized in two steps. Firstly, the concentrating solar tower is optimized in order to obtain its best operating conditions under the established weather conditions. Secondly, the integrated system is optimized considering the optimal configuration of the concentrating solar tower as an input.
The objective function for the optimization of the concentrating solar tower is given as
f solar ( x ¯ s ) = C Tot ( x ¯ s ) E Annual ( x ¯ s ) 1 + Π 1 Q ˙ cs ( x ¯ s ) Q ˙ cs , des
where x ¯ s is the set of variables that correspond to the tower height, H Tower , receiver height, H Receiver , and receiver diameter, D Receiver ; C Tot ( x ¯ s ) is the total monetary cost of the plant, E Annual ( x ¯ s ) is the expected energy delivered by the concentrating solar tower, Q ˙ cs ( x ¯ s ) is the actual heat rate produced by the solar receiver, Q ˙ cs , des is the desired heat rate from the solar receiver (20 MWt), and Π is a penalty factor applied to solar fields that produce a lower heat rate than the desired output [39]. The optimization is developed by using a constrained optimization by linear approximation algorithm. The lower and upper bounds of the decision variables, x ¯ s , are shown in Table 5. The second law efficiency is used as an objective function for the optimization of the integrated system, such as
η II = W ˙ Rankine + W ˙ Brayton + W ˙ ICE E ˙ Biomass + E ˙ Solar + E ˙ Geothermal
where E ˙ Biomass = m ˙ Biomass L H V Biomass β , with respect to non-negative decision variables, such as separation pressures of the flash chambers, P sep 1 and P sep 2 , gas turbine inlet temperature, T GTI , pressure ratio of the gas turbines, ϕ 1 and ϕ 2 , CO2 mass flow splitting fraction, γ , temperature of gasification, T gas , and equivalence ratio, ξ . The lower and upper bounds of the decision variables are shown in Table 5. The optimization is subject to the restrictions established by the mass, energy, and exergy balances. A genetic algorithm is used for the optimization process.

3. Results and Discussion

3.1. Validation of the Model

The model of the biomass gasifier is validated with the results of Rodríguez [31], where values for the energetic and exergetic efficiencies of 43.90% and 34.34%, respectively, are reported, at a gasification temperature of 700 °C. For the present model, values of 44.33% and 36.35% are obtained for the energetic and exergetic efficiencies, respectively. This shows that an error of 0.43% for the energetic efficiency and 2.01% for the exergetic efficiency are obtained, which shows that the model accurately predicts the phenomena.
The model of the s-CO2 Brayton cycle is validated with data from Vasquez et al. [19]. Values for the first and second law efficiencies reported are 49.35% and 23.45%, respectively, at a turbine inlet temperature of 700 °C. The values for the first and second law efficiencies obtained in the present model at the same operating temperature are 49.29% and 23.36%, respectively. This shows an error of 0.06% for the first law efficiency and 0.09% for the exergetic efficiency.
The geothermal Rankine cycle is validated with the results reported by Cardemil et al. [11]. The power and exergetic efficiency reported are 10,266 kW and 40.52%, respectively. In the present model, values of 10,291 kW and 41.33% are obtained for the power and exergetic efficiency, respectively, showing an error of 0.24% for the exergetic efficiency and 0.81% for the power produced by the cycle.

3.2. Performance of the Concentrating Solar Tower

As a result of the optical analysis, the optimum design of the solar field is obtained. Its efficiency depends on factors such as the weather conditions, the distribution of the mirrors, and the orography of the terrain, among others. Figure 3 shows the cosine efficiency of the solar system. It is observed that the average optical efficiency is 87.6%, observing a minimum of 80.3% and a maximum of 97.6%. This efficiency depends directly on the position of the sun and the distance between each heliostat and the receiver, so the larger the size of the solar field, the lower its efficiency; thus, small configurations are desirable. However, a reduction in the size of the solar field may cause the heliostats to be installed close to each other, which may cause a significant amount of losses due to shadowing between the heliostats. Despite this, it is preferable to prioritize cosine efficiency as losses of this type are the most important in the performance of the solar field. For this reason, staggered radial distributions are usually preferred, as they minimize cosine losses and increase optical efficiency.
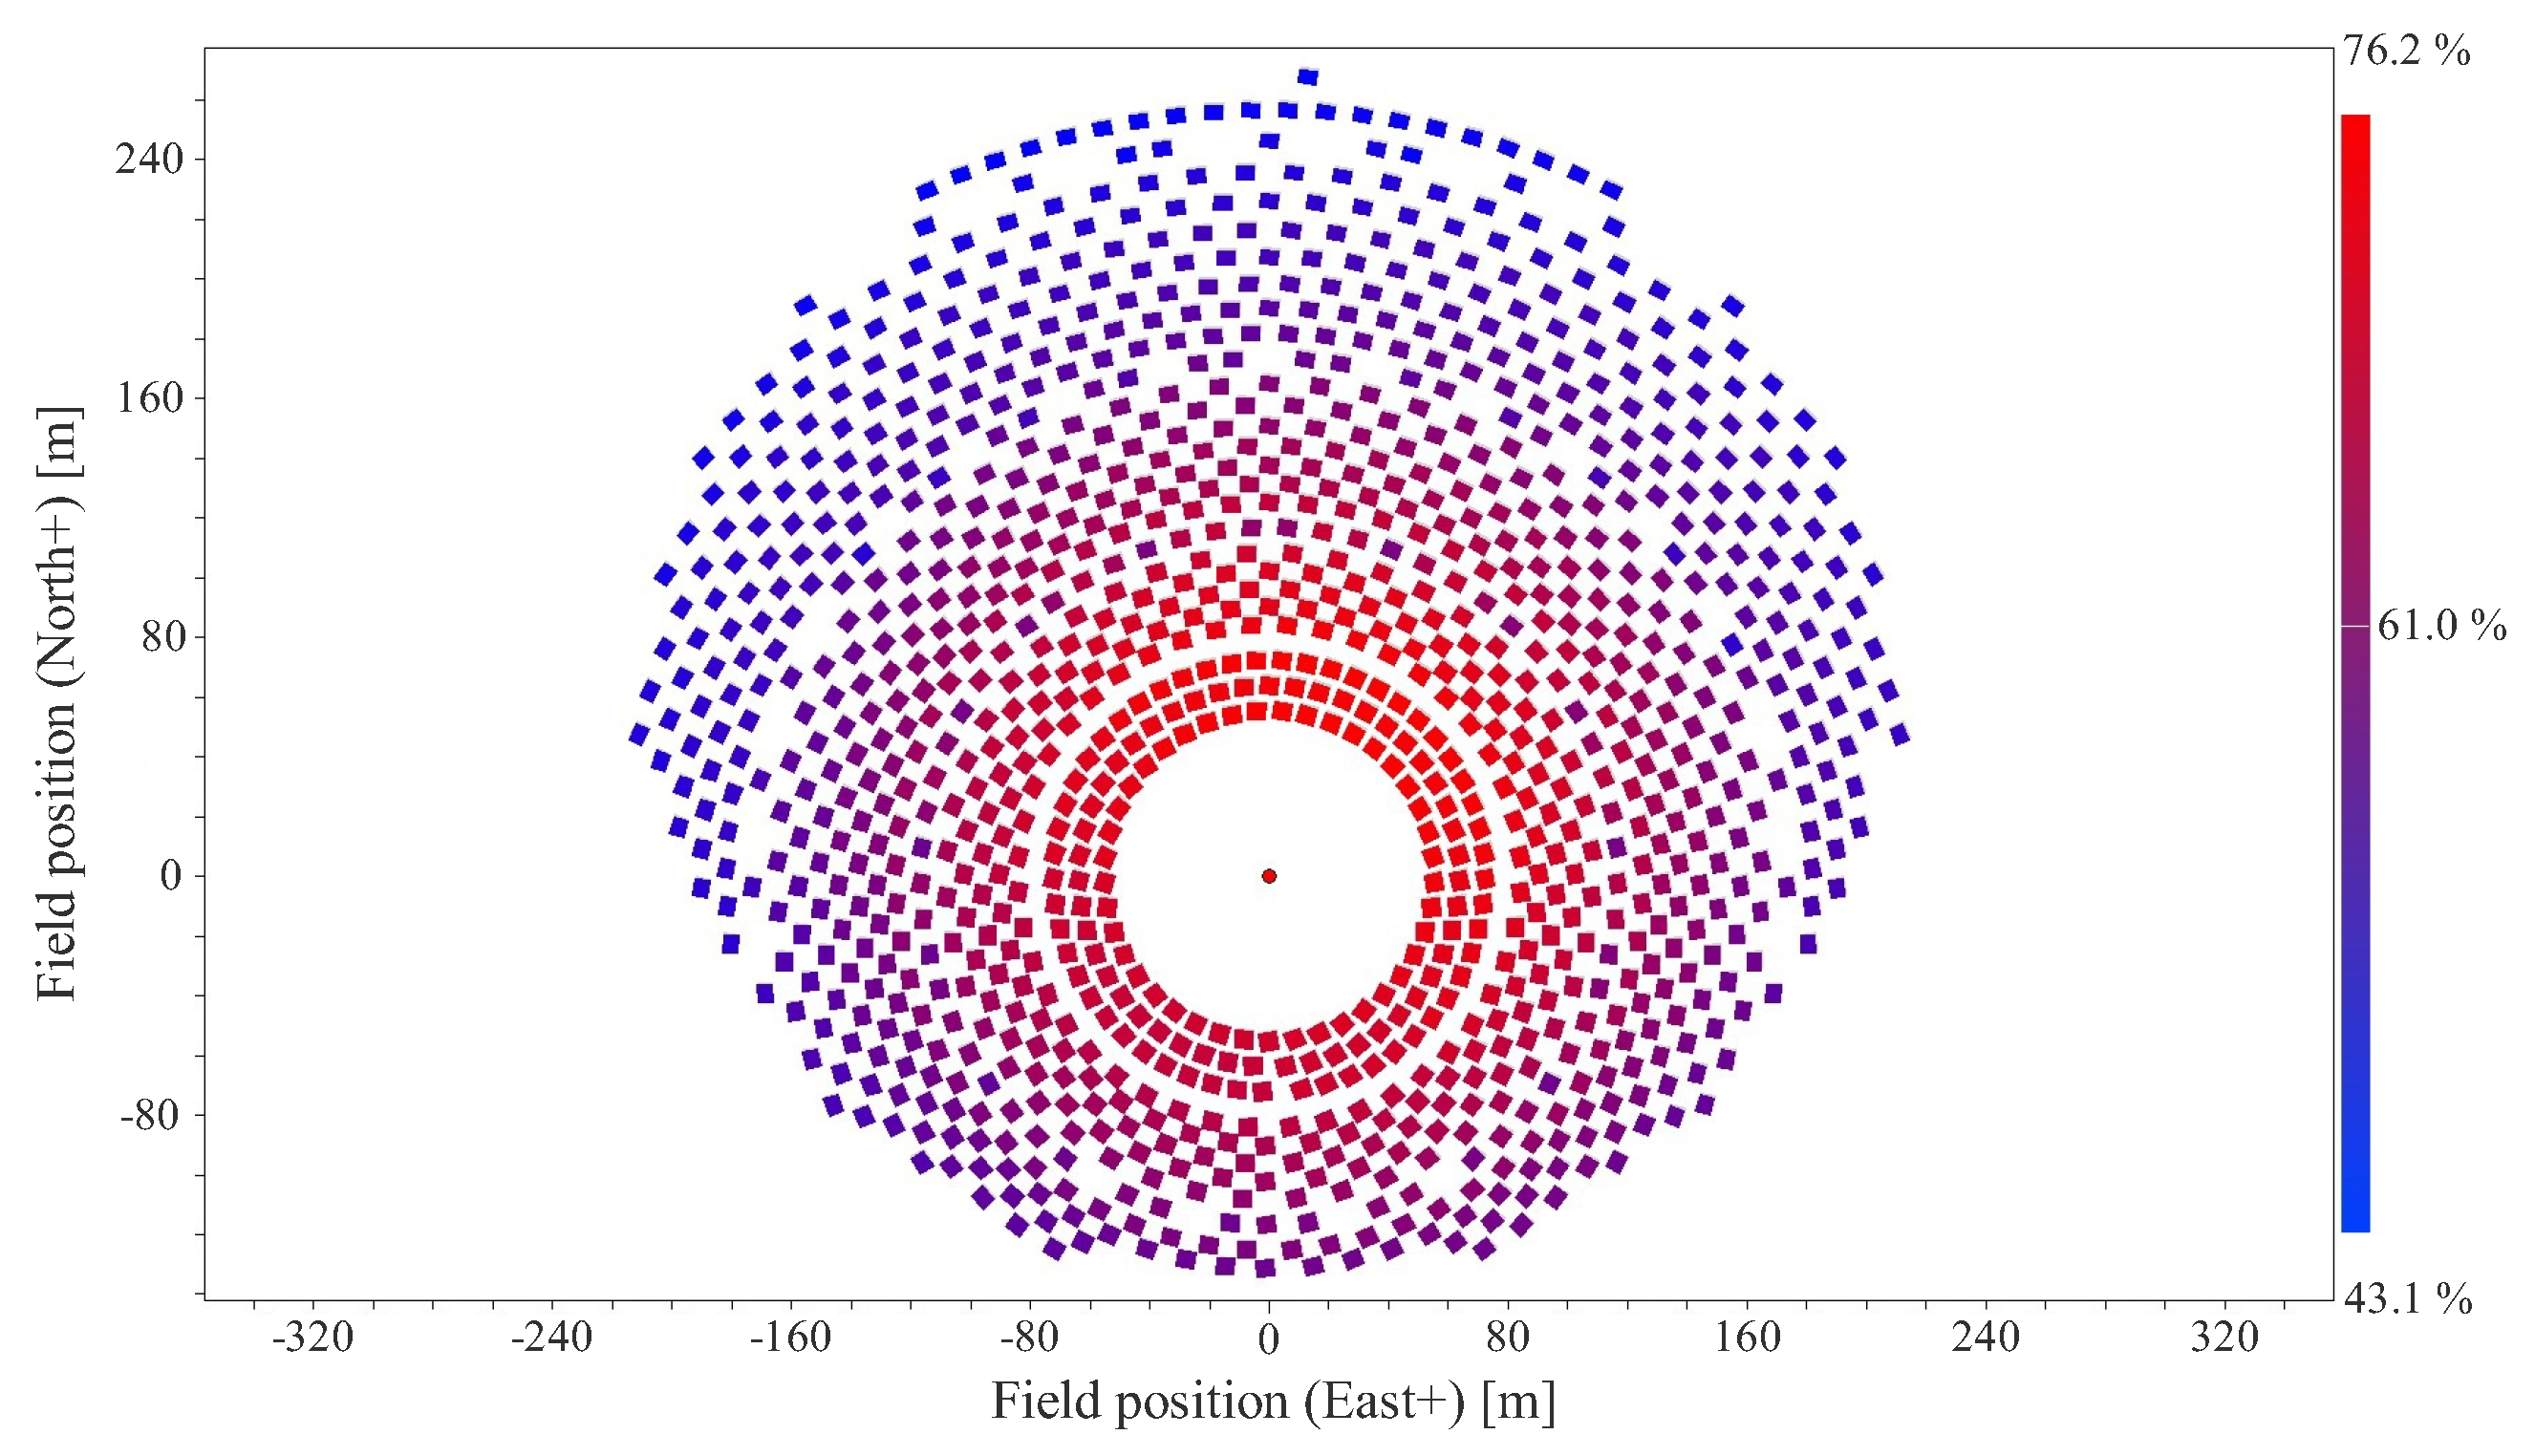
Figure 4 shows the total optical efficiency of the heliostat field. One can observe an average value of 61%, with a maximum value of 76.2% and a minimum value of 43.1%. This parameter encompasses all the other types of efficiencies present in the heliostats, whose individual values are shown in Table 6, together with other important results of the design and optimum performance of the concentrating solar tower. These results are obtained by optimizing the solar system by means of Equation (42).
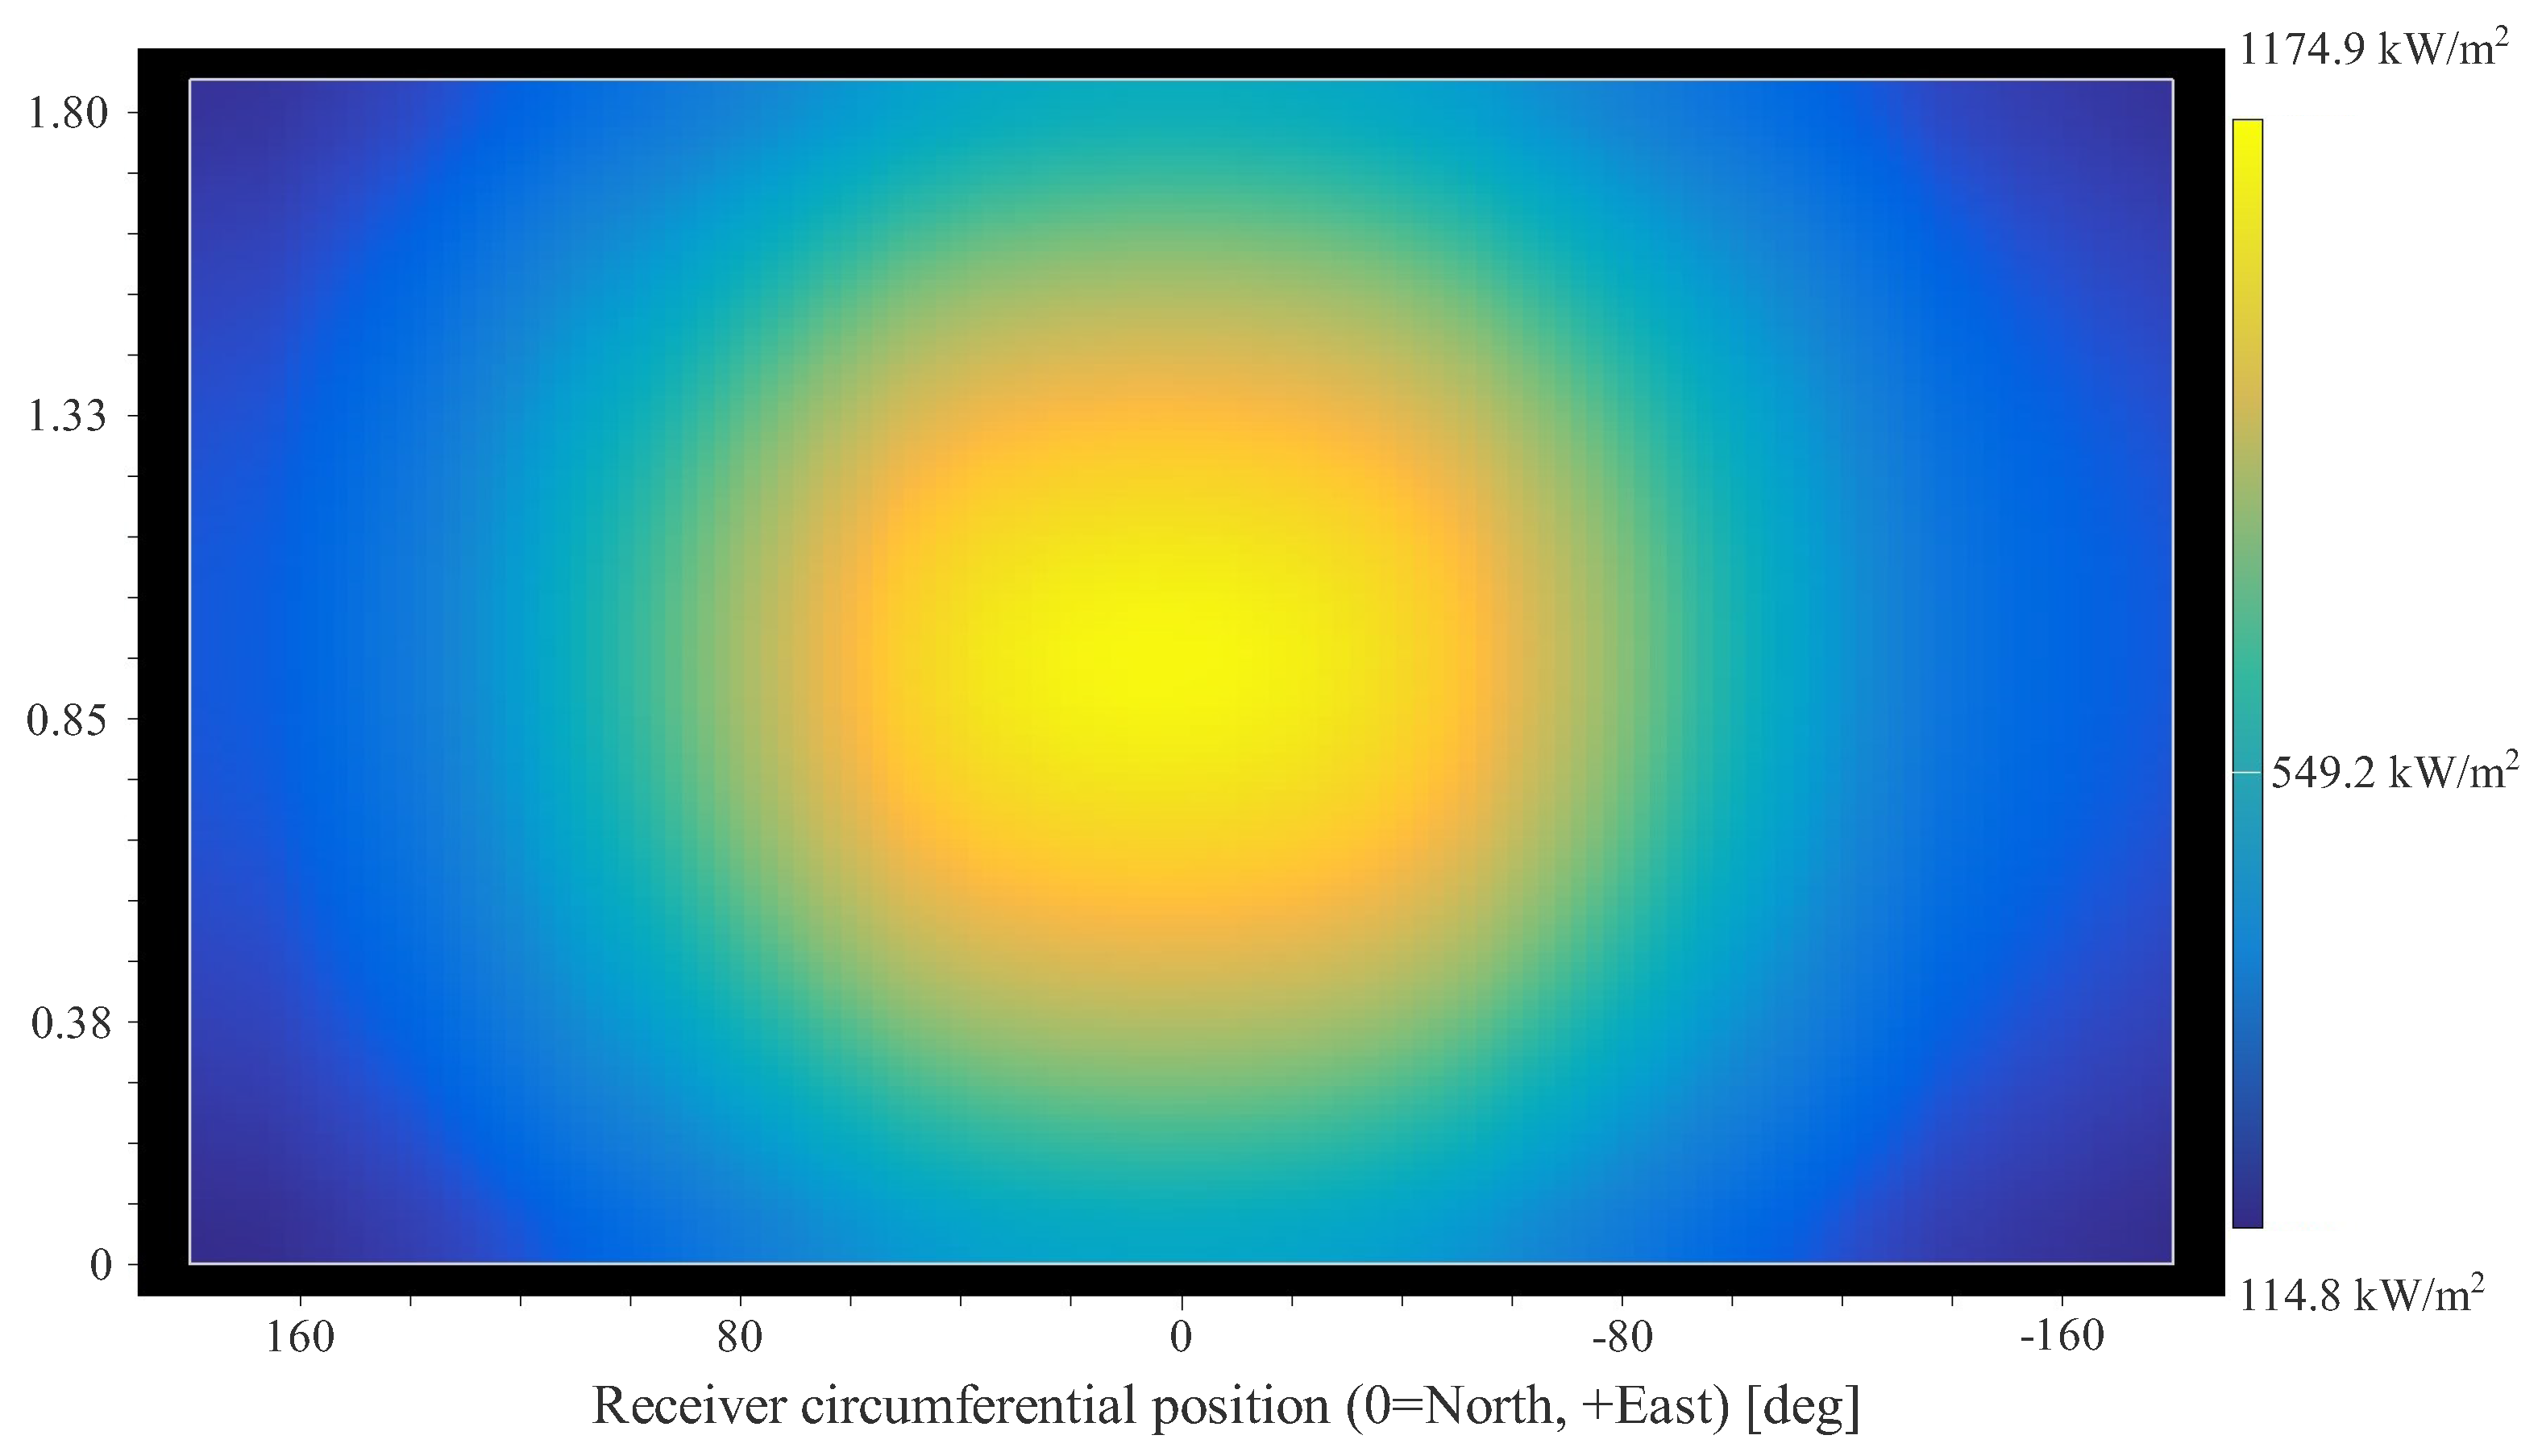
One of the most critical parameters is the solar flux distribution or spot, which is the flux distribution that each heliostat projects on the receiver surface. The spot profile aids in designing and optimizing the solar field in order to maximize the energy production. Additionally, it is used in the development of strategies that can yield a uniform spot across the entire area to avoid thermal stress problems on the receiver materials. Figure 5 shows the solar flow profile at the receiver. One can observe an average value of 549.2 kW/m2, with a maximum value of 1174.9 kW/m2 and a minimum value of 114.8 kW/m2.

3.3. Performance of the Biomass Gasifier

An analysis of the biomass is developed in order to determine its content of carbon, ash, volatile compounds, humidity, and chemical composition. The LHV and HHV of the biomass are 16,949 and 17,281, respectively; and other characteristics are given in Table 7.
With a total amount of 1718 kg/h of biomass and 2470 kg/h of air, 3614 kg/h of syngas is produced in the biomass gasifier. The LHV and HHV of the synthesis gas are 5.62 and 6.46, respectively; and its chemical composition is given in Table 8. Of this amount of syngas produced, 1751 kg/h is burned in the combustion chamber of the s-CO2 cycle and the remaining 1863 kg/h is burned in the ICE. The combustion of the syngas produces 391.8 kg/h of ash and 182 kg/h of tar. This shows that the gasifier has an energetic efficiency of 69.69%, and an exergetic efficiency of 48.20%.
The gasification temperature is one of the variables that have an influence on the production amount and the syngas quality because the equilibrium constants of the chemical reactions are associated with this variable. Also, this temperature restricts the percentage of each element present in the syngas and the amount of residues. Figure 6 shows the effect of the gasification temperature on the syngas LHV and the production. It is observed that the LHV increases with temperature to reach a maximum value of 5.64 MJ/m3 at 718.4 °C. It is also observed that the syngas production also increases smoothly when the temperature rises. This behavior follows the quasi-equilibrium model proposed by [40], which implies that to raise the gasification temperature, a greater quantity of oxidizing agent is required, which leads to increasing the equivalence ratio and causing the combustion of some elements that consume syngas (CO and H2), such that its heat value is decreased; however, syngas is produced continually.
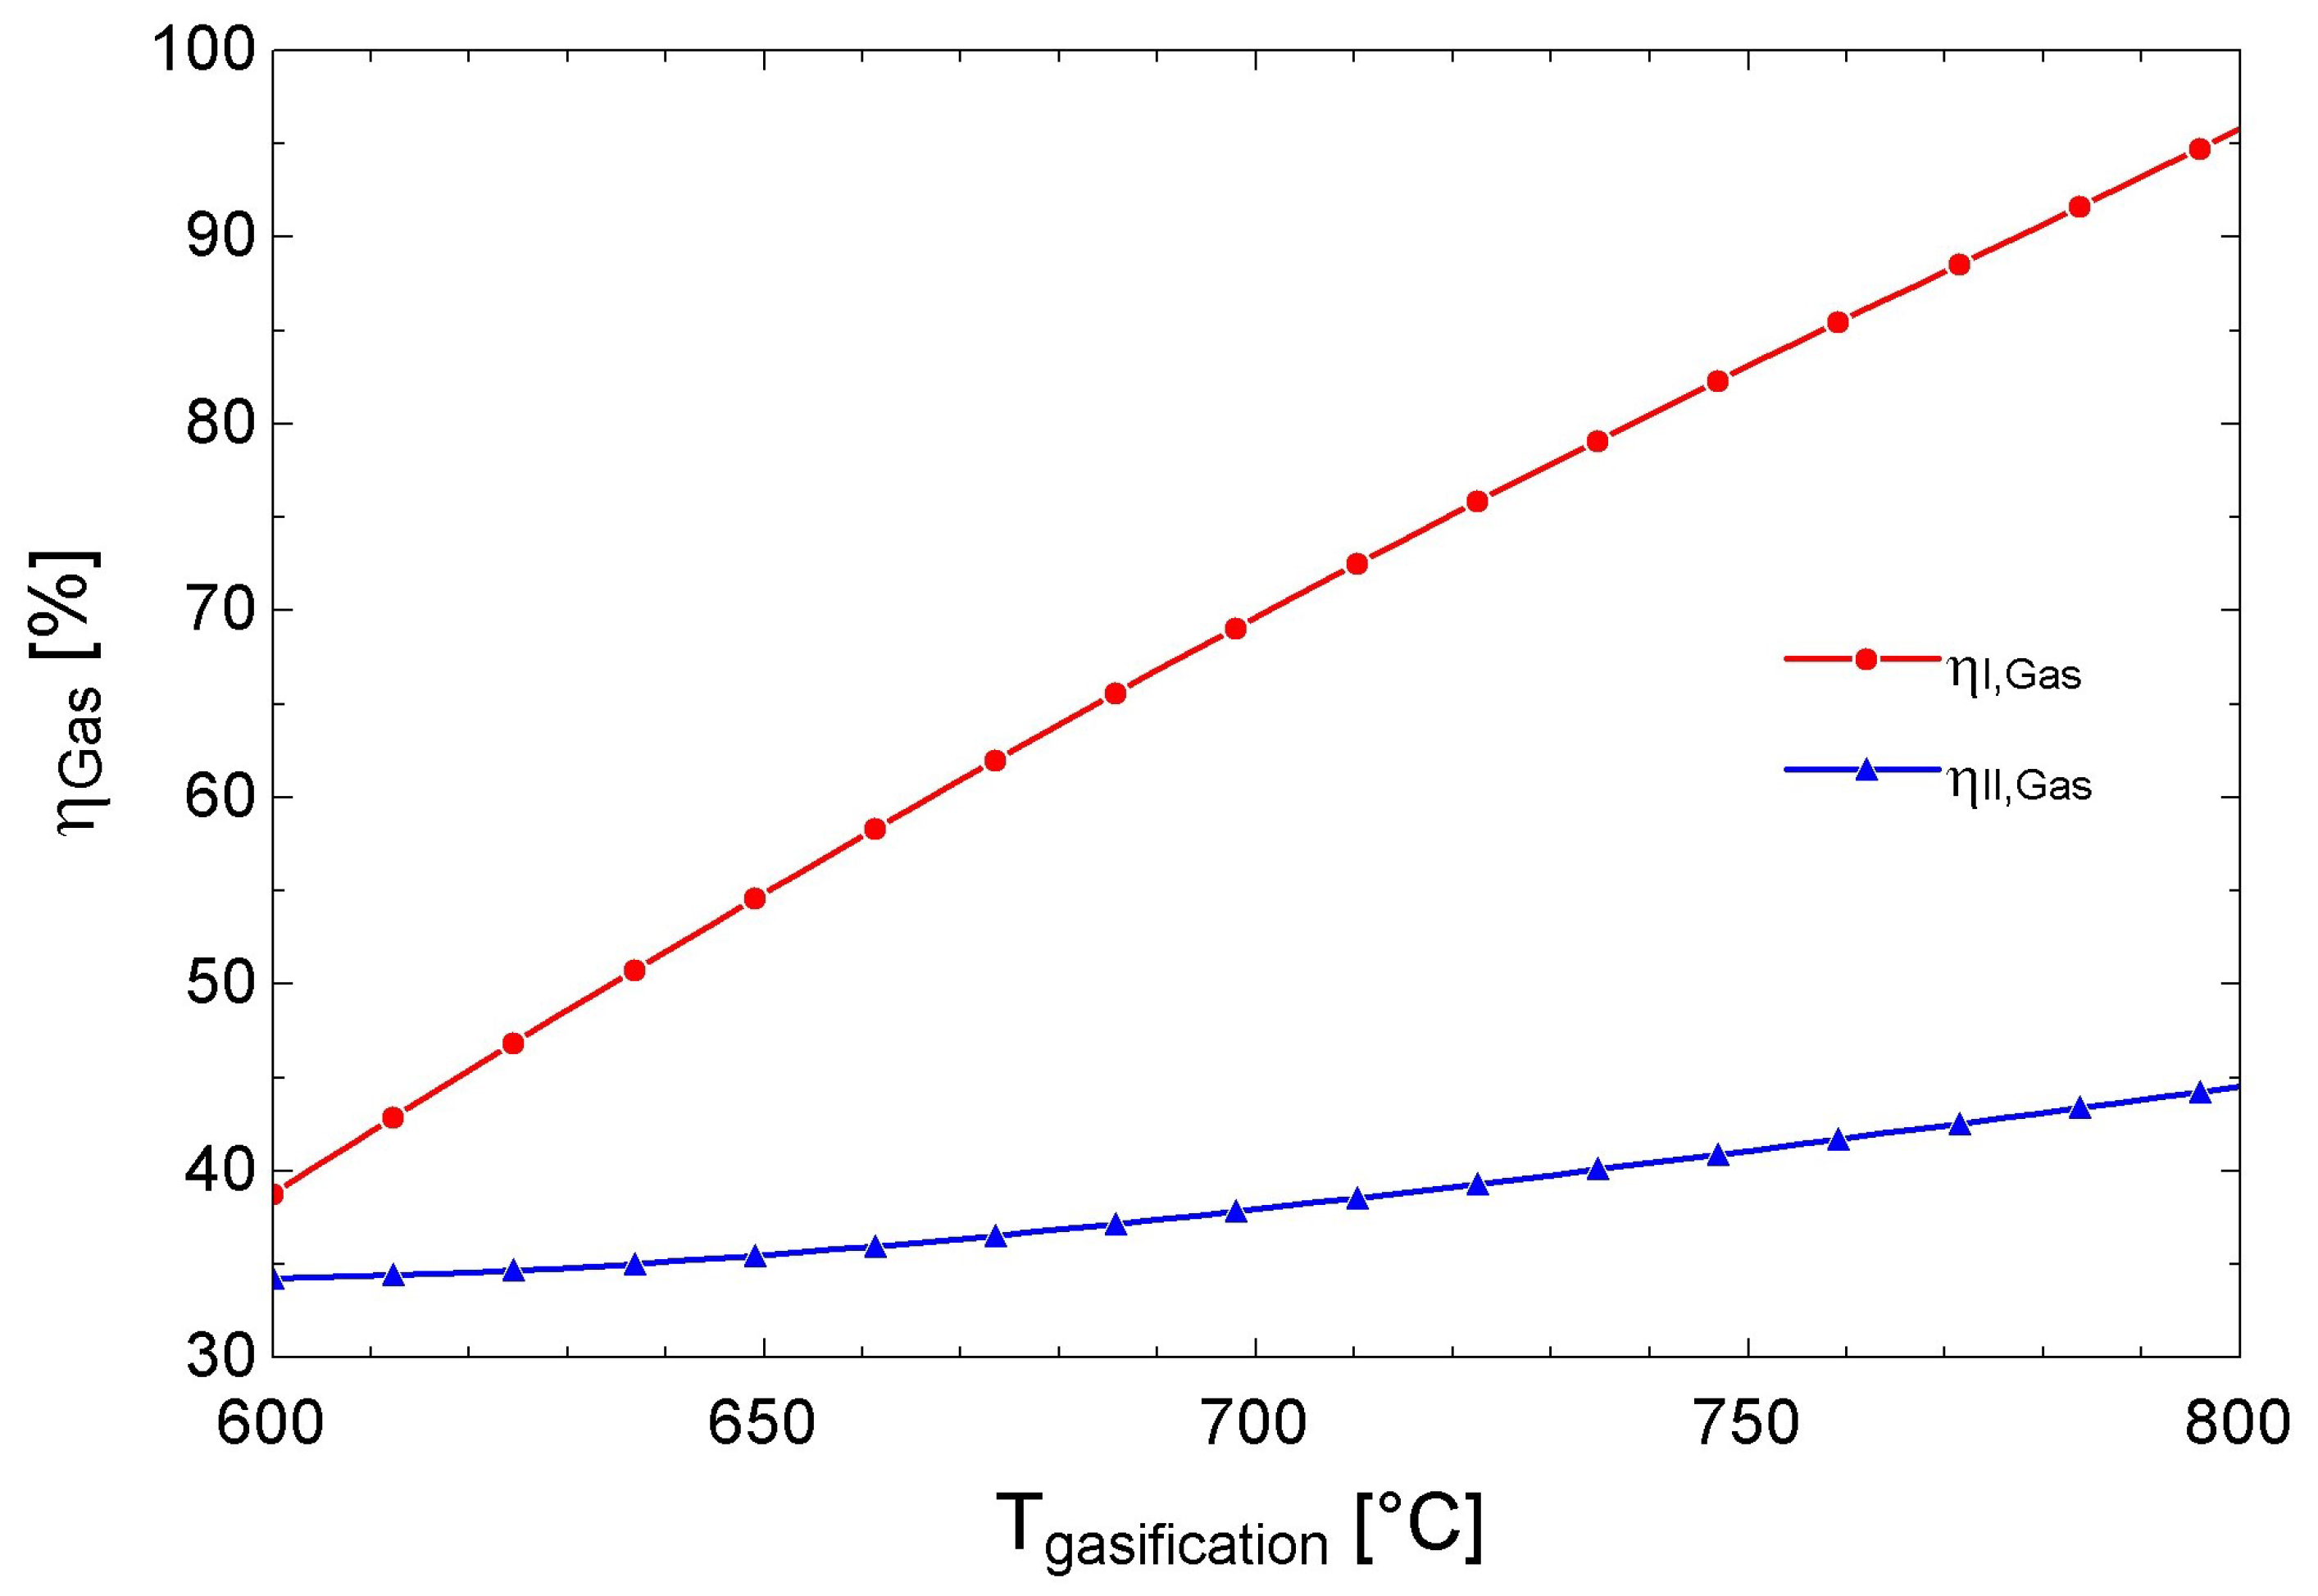
The gasification temperature also has an impact on the efficiency of the process. Figure 7 shows the energetic and exergetic efficiencies of the gasifier as a function of the gasification temperature. It is observed that both efficiencies increase at high temperatures because there is a direct relationship with syngas volumetric flow as is found in Equations (6) and (7).
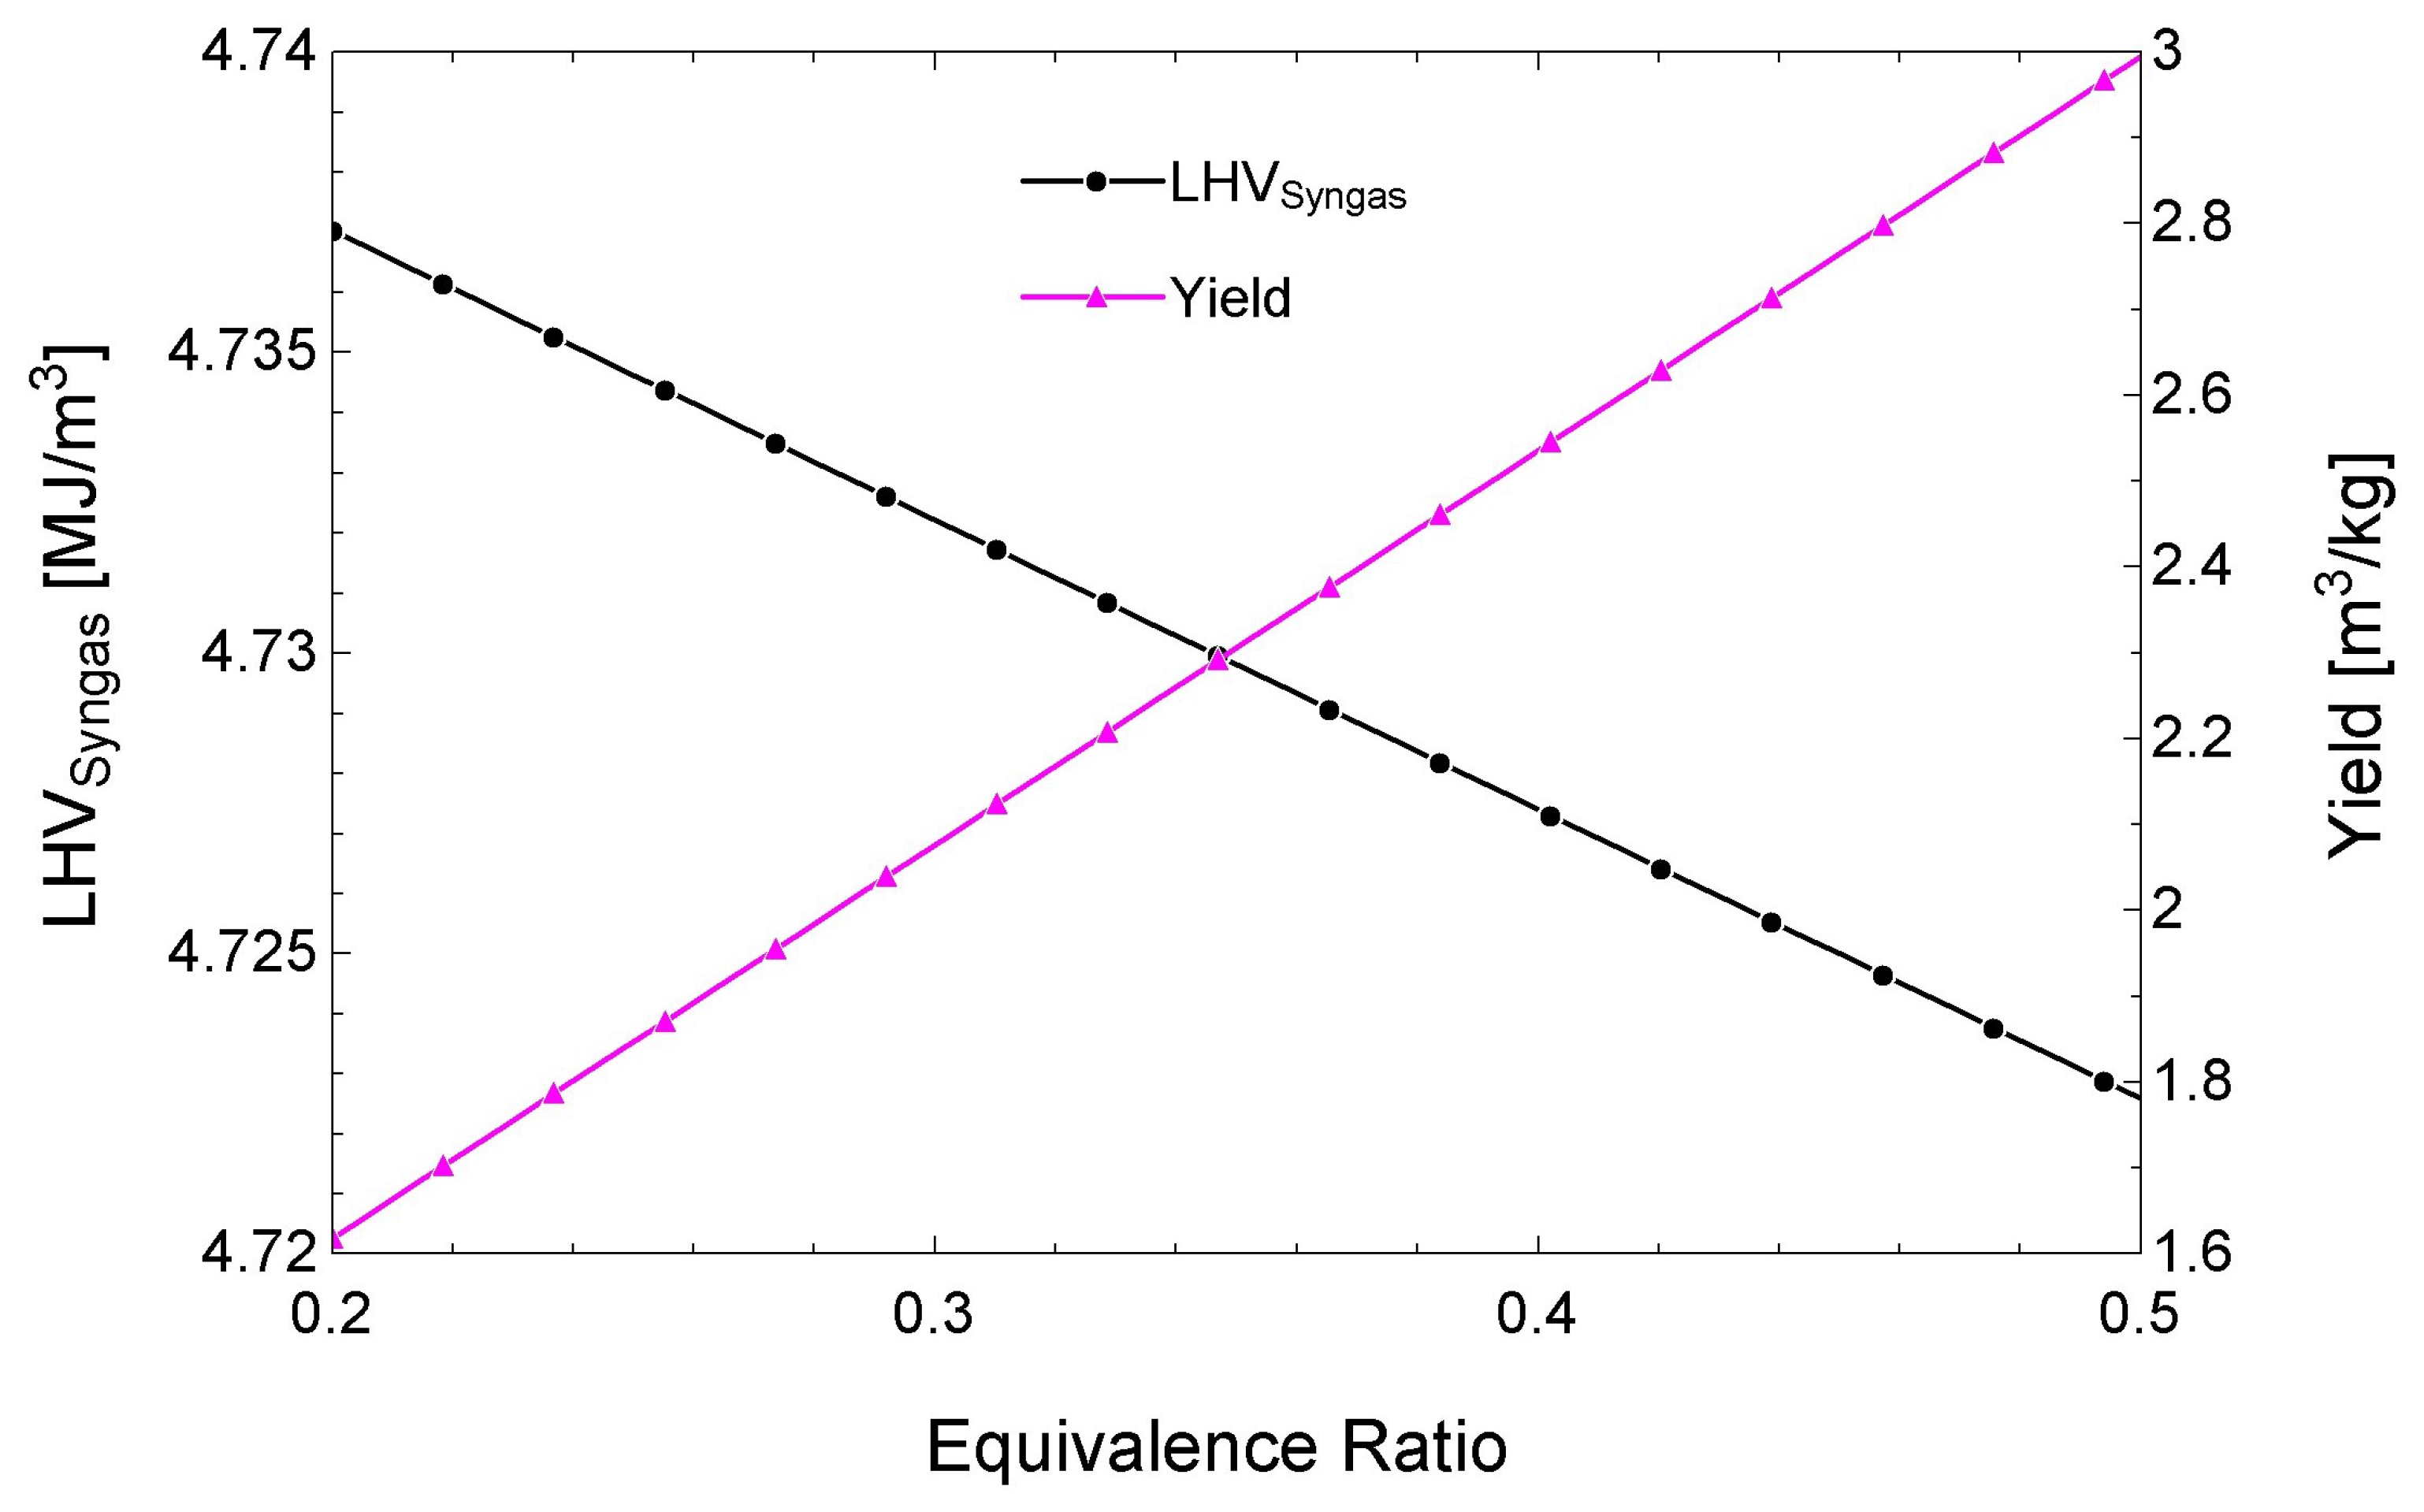
Another variable that affects the performance of the gasifier is the amount of air used with respect to the total amount of biomass. If a small value is used, both the reaction temperature and heat needed to keep the reaction in the reduction zone lowered. If a high value is used, high reaction temperatures are obtained, which may cause a combustion instead of a gasification, producing a syngas of low quality because the amounts of CO2 and water vapor present in the syngas will be higher. Figure 8 shows the effect of the equivalence ratio on the LHV and the production rate. It is observed that the LHV of the syngas decreases as the equivalence ratio increases, and the opposite is observed for the production rate.
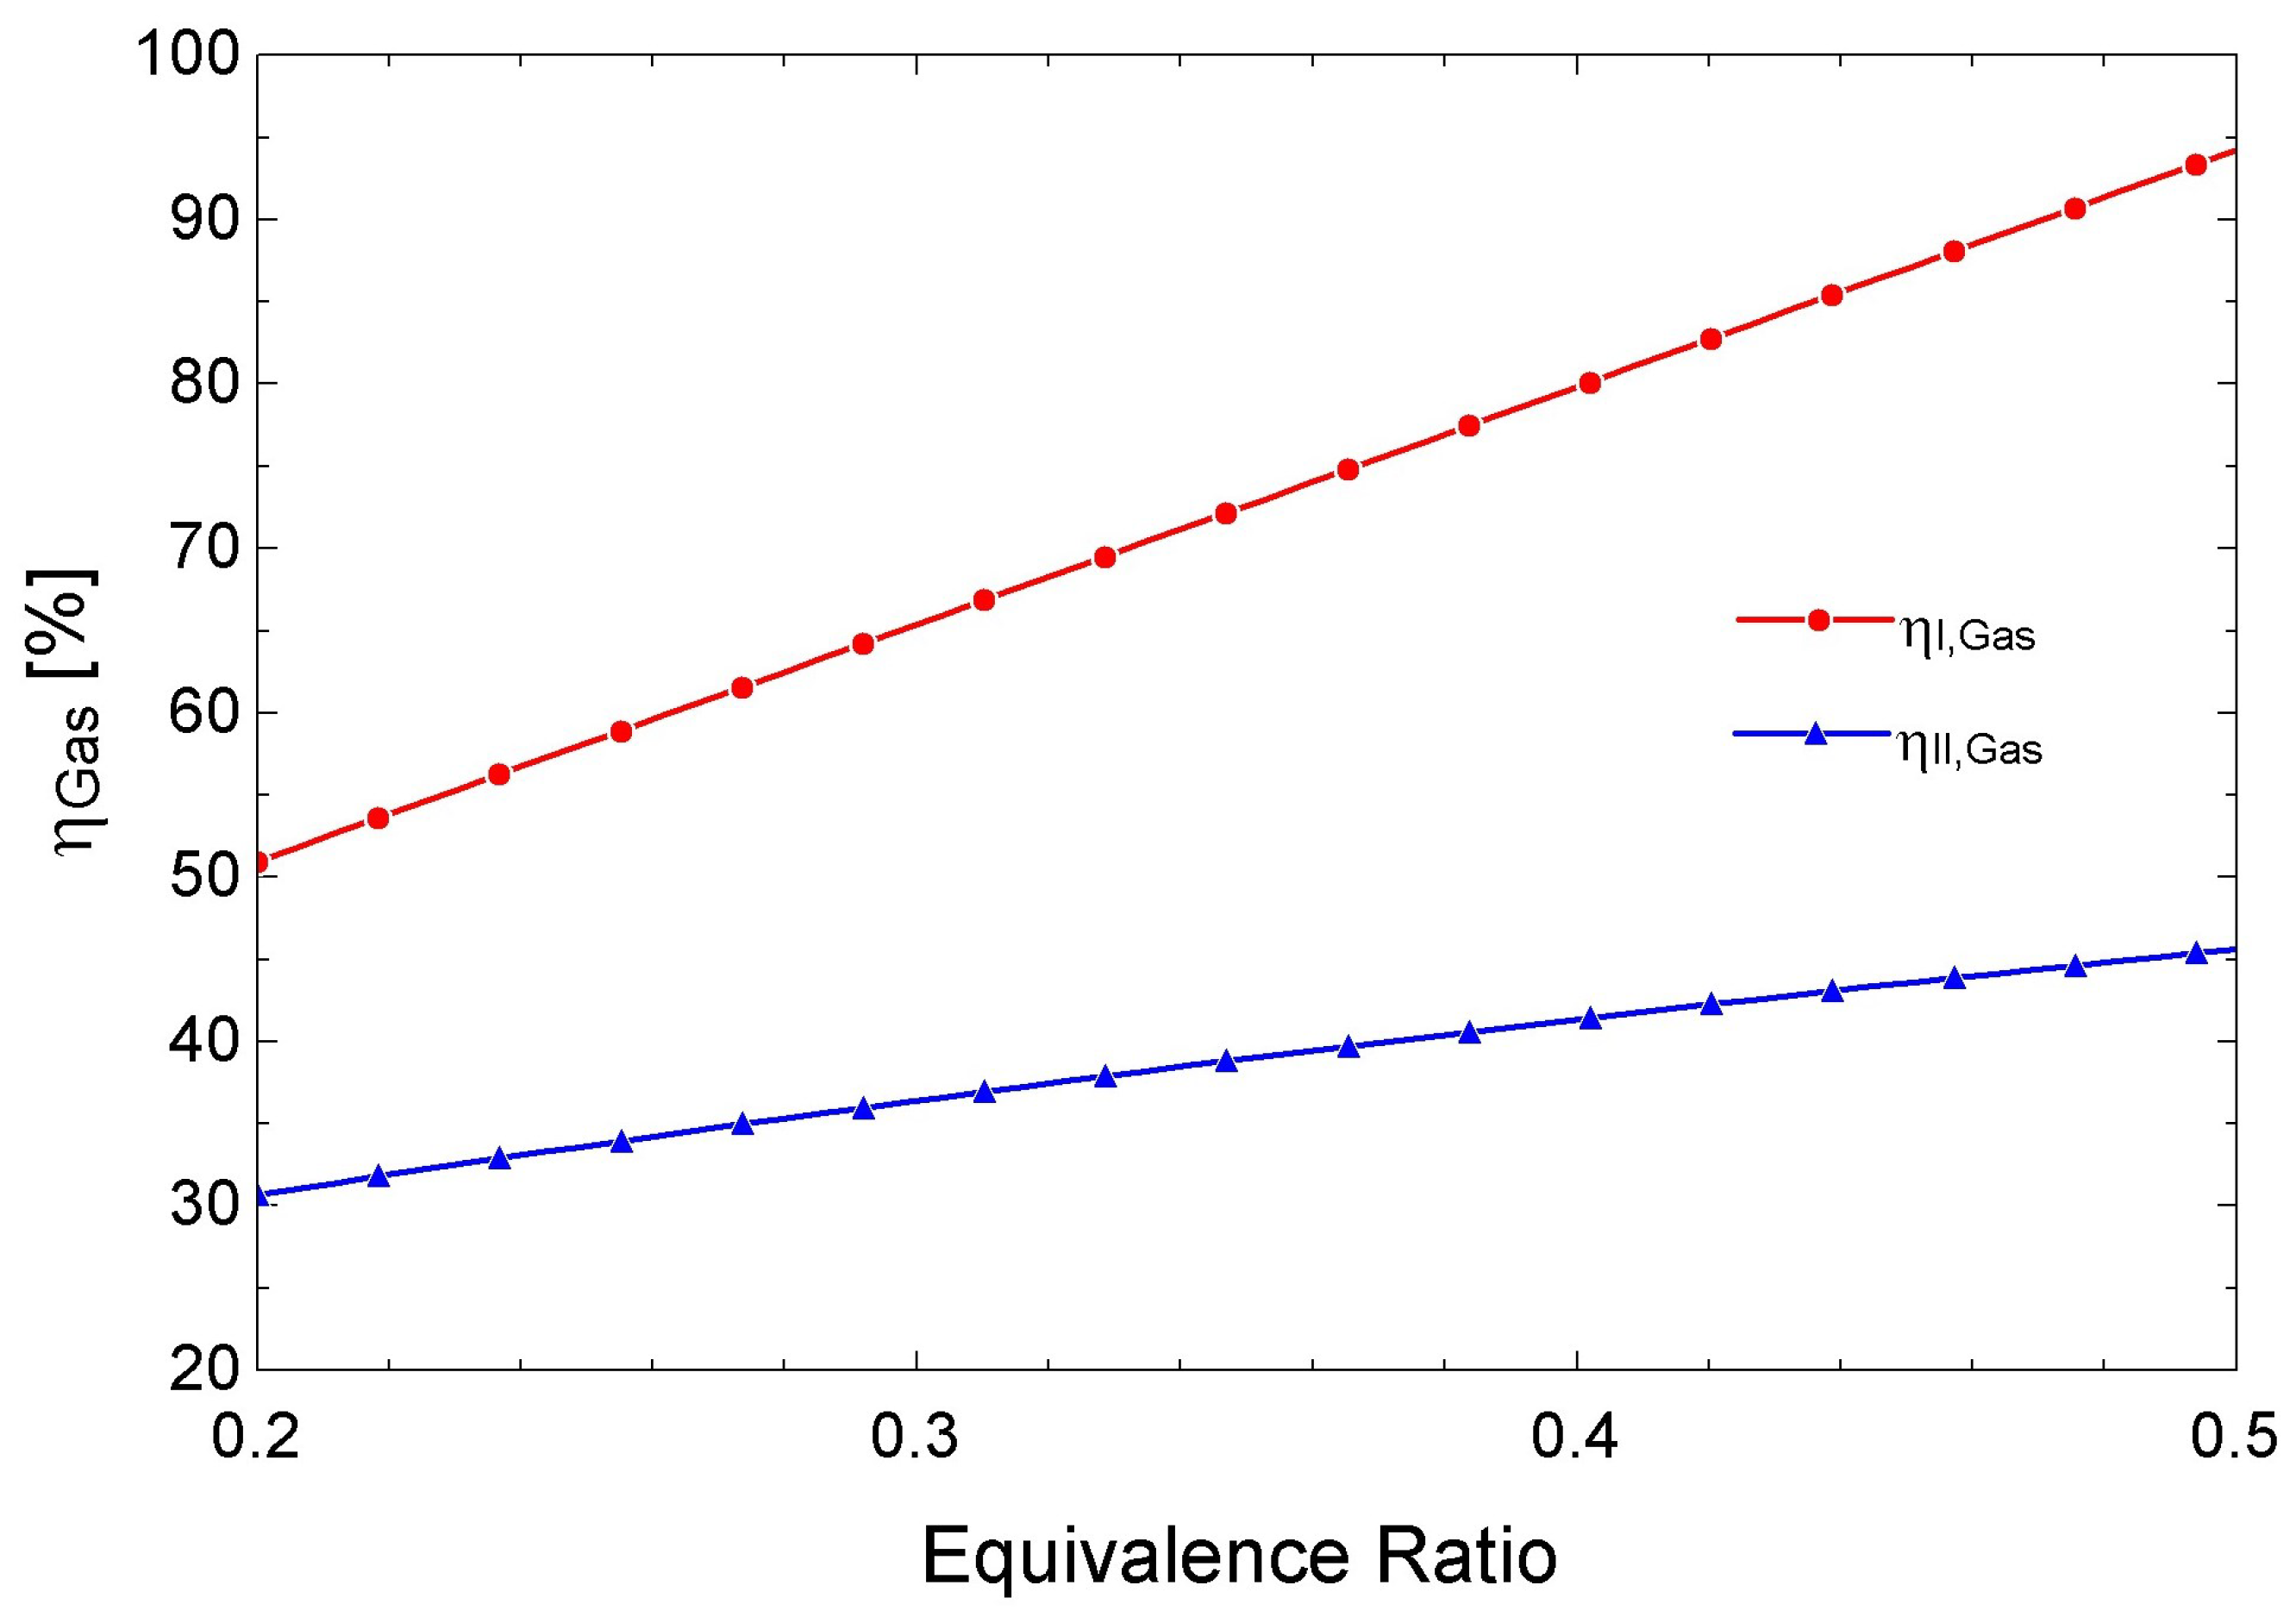
Figure 9 shows the effect of the equivalence ratio on the first law; when ER takes higher values, the energetic efficiency increases; this represents the energy available in the synthesis gas at normal conditions concerning the initial thermal energy contained in the biomass. Similarly, the exergy efficiency has the same behavior and considers the irreversibilities of the conversion process. It is interpreted as the useful energy available to be converted into work by the produced gas regarding the chemical exergy contained in the biomass before the gasification process.

3.4. Performance of the s-CO2 Brayton Cycle

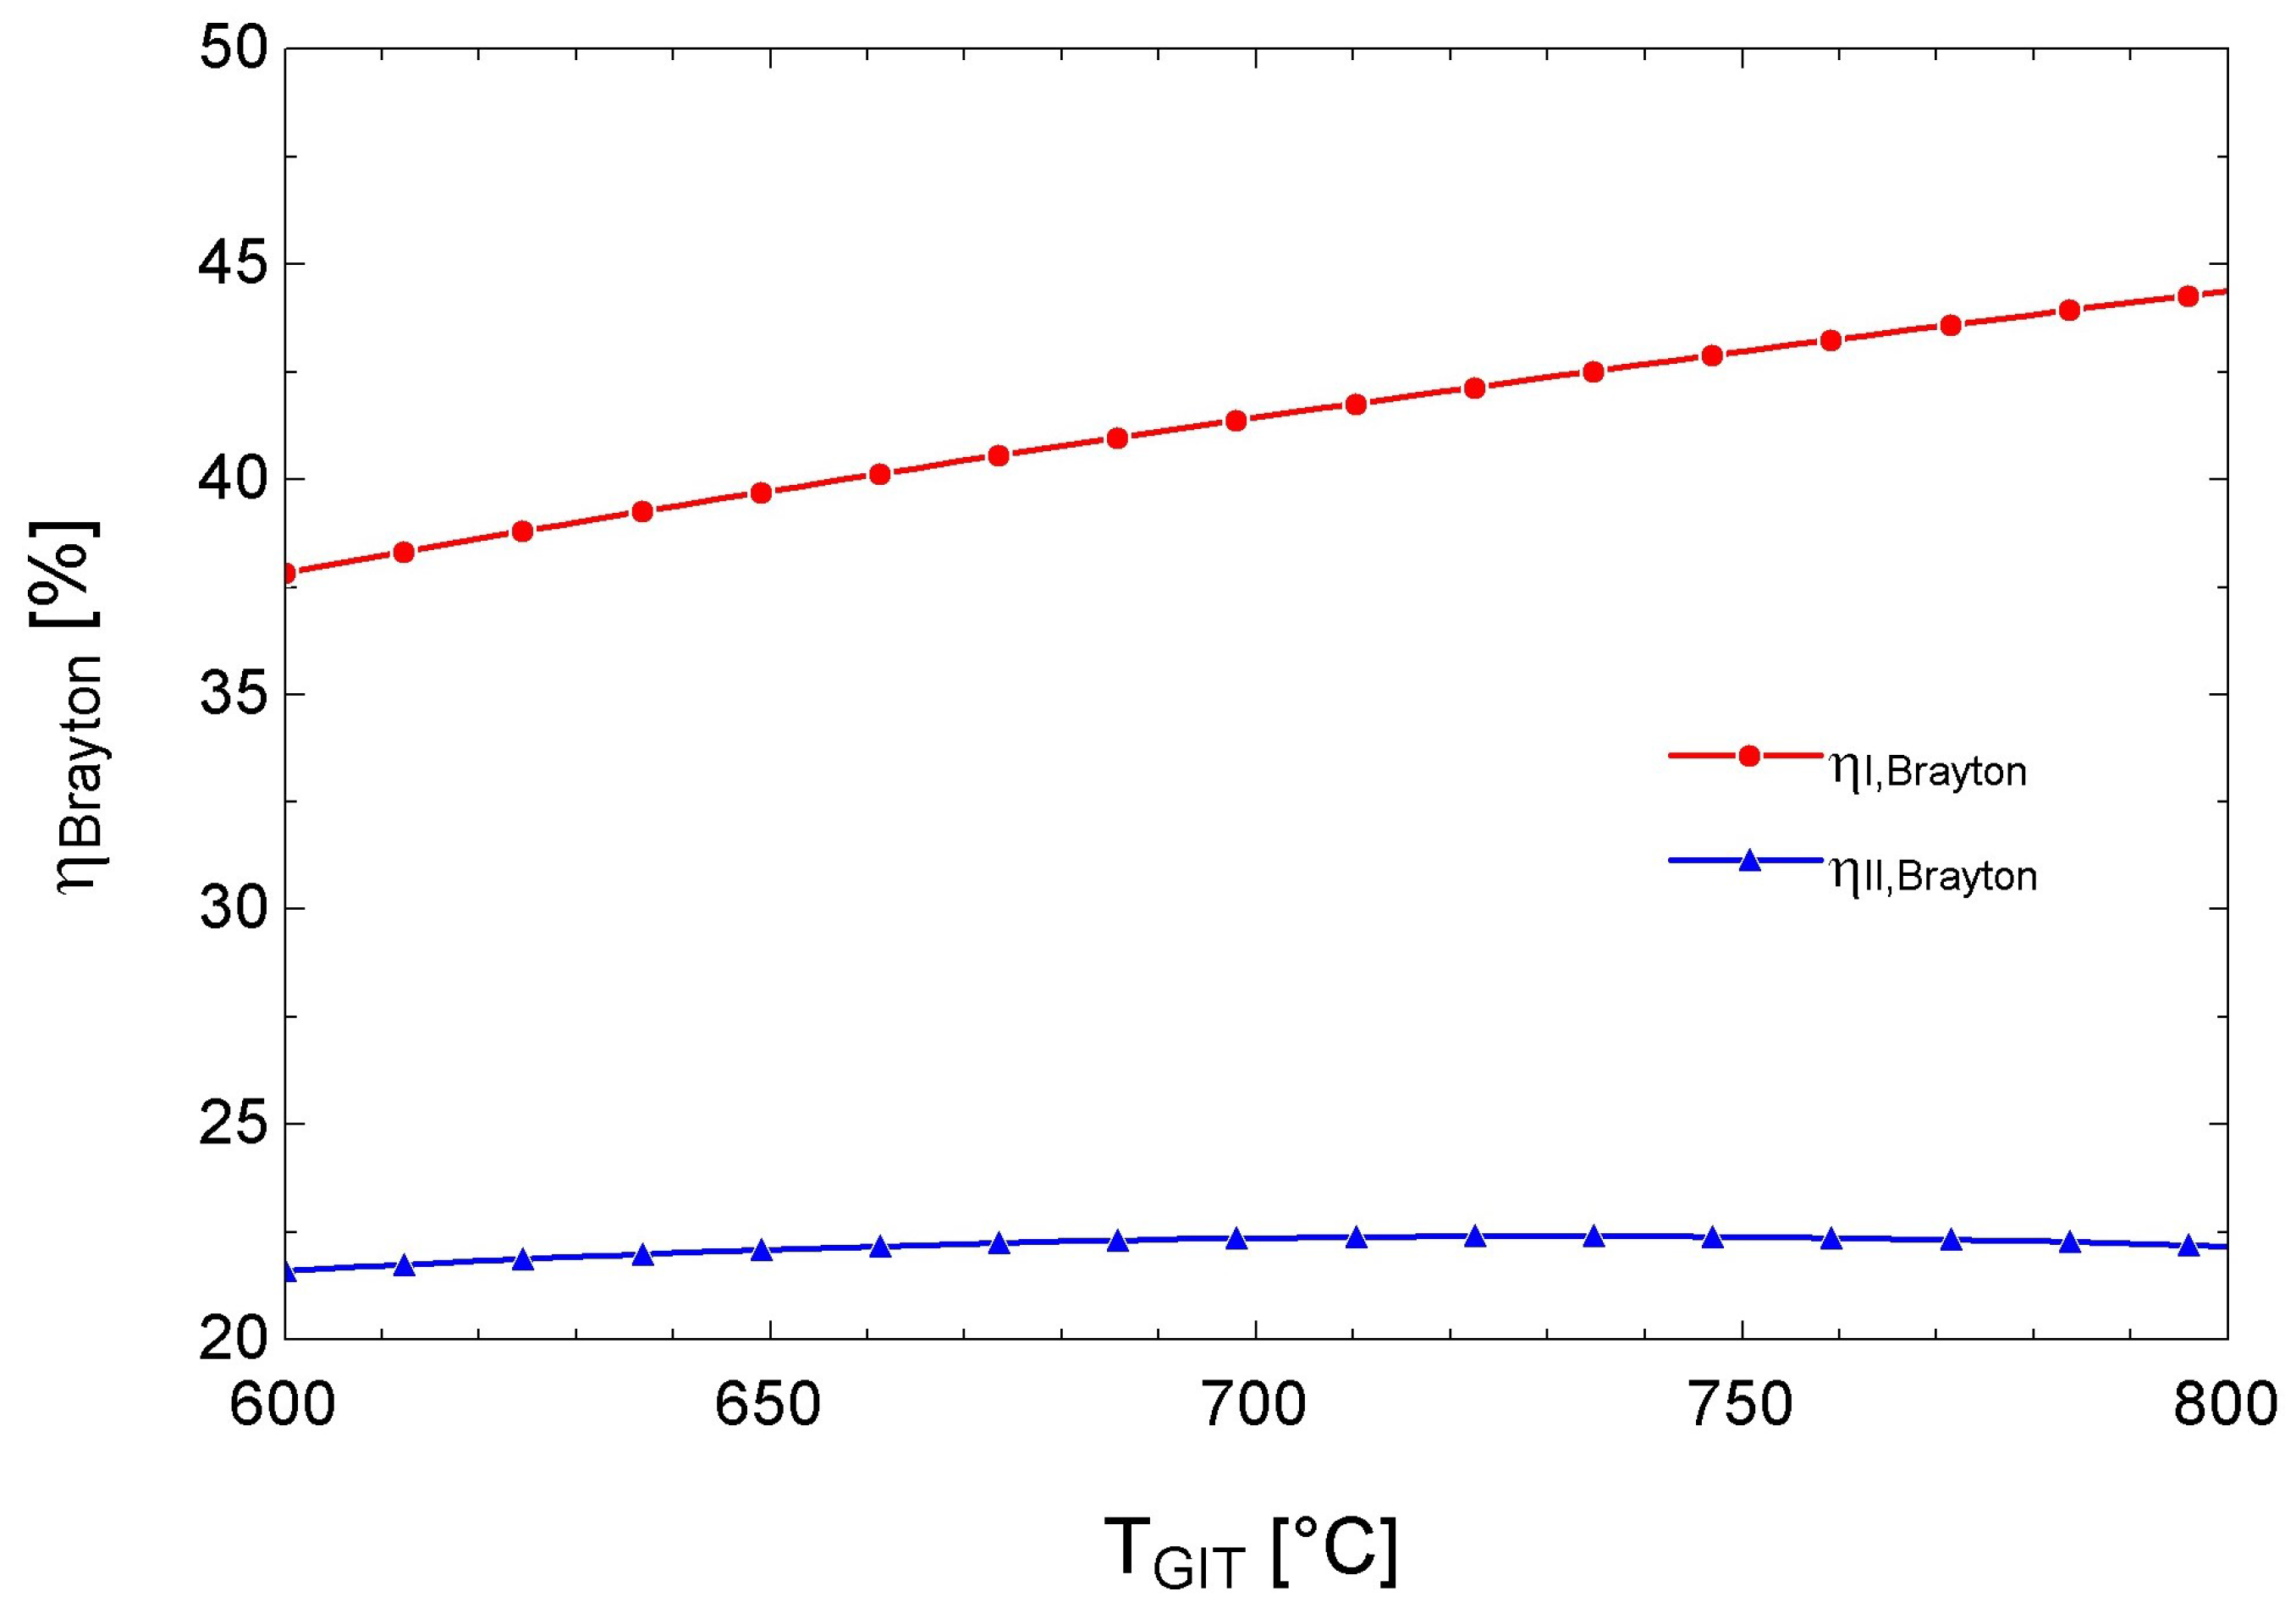
Figure 10 shows the effect of the gas turbine inlet temperature on the first and second law efficiencies of the cycle. It is observed that first law efficiency increases from a value of 37.84% to a value of 44.37%, while the second law efficiency increases from a value of 21.5% to a value of 22.1%, showing a maximum value of 22.4% at a tempeature of 726.5 °C.
The CO2 mass flow splitting fraction has an important influence on the performance of the compressors, reducing the amount of work needed to increase the pressure of both streams because the mass flow is reduced by splitting the mainstream. By lowering the temperature of stream 31, the work needed by compressor 2 is also reduced. Figure 11 shows the effect of the CO2 mass flow splitting fraction on the first and second law efficiencies. It is observed that both efficiencies increase when γ increases, reaching both a maximum at a value γ of 0.6306 for the first law efficiency and a value of γ of 0.6469 for the second law efficiency. After this maximum value, both efficiencies decrease when γ increases.
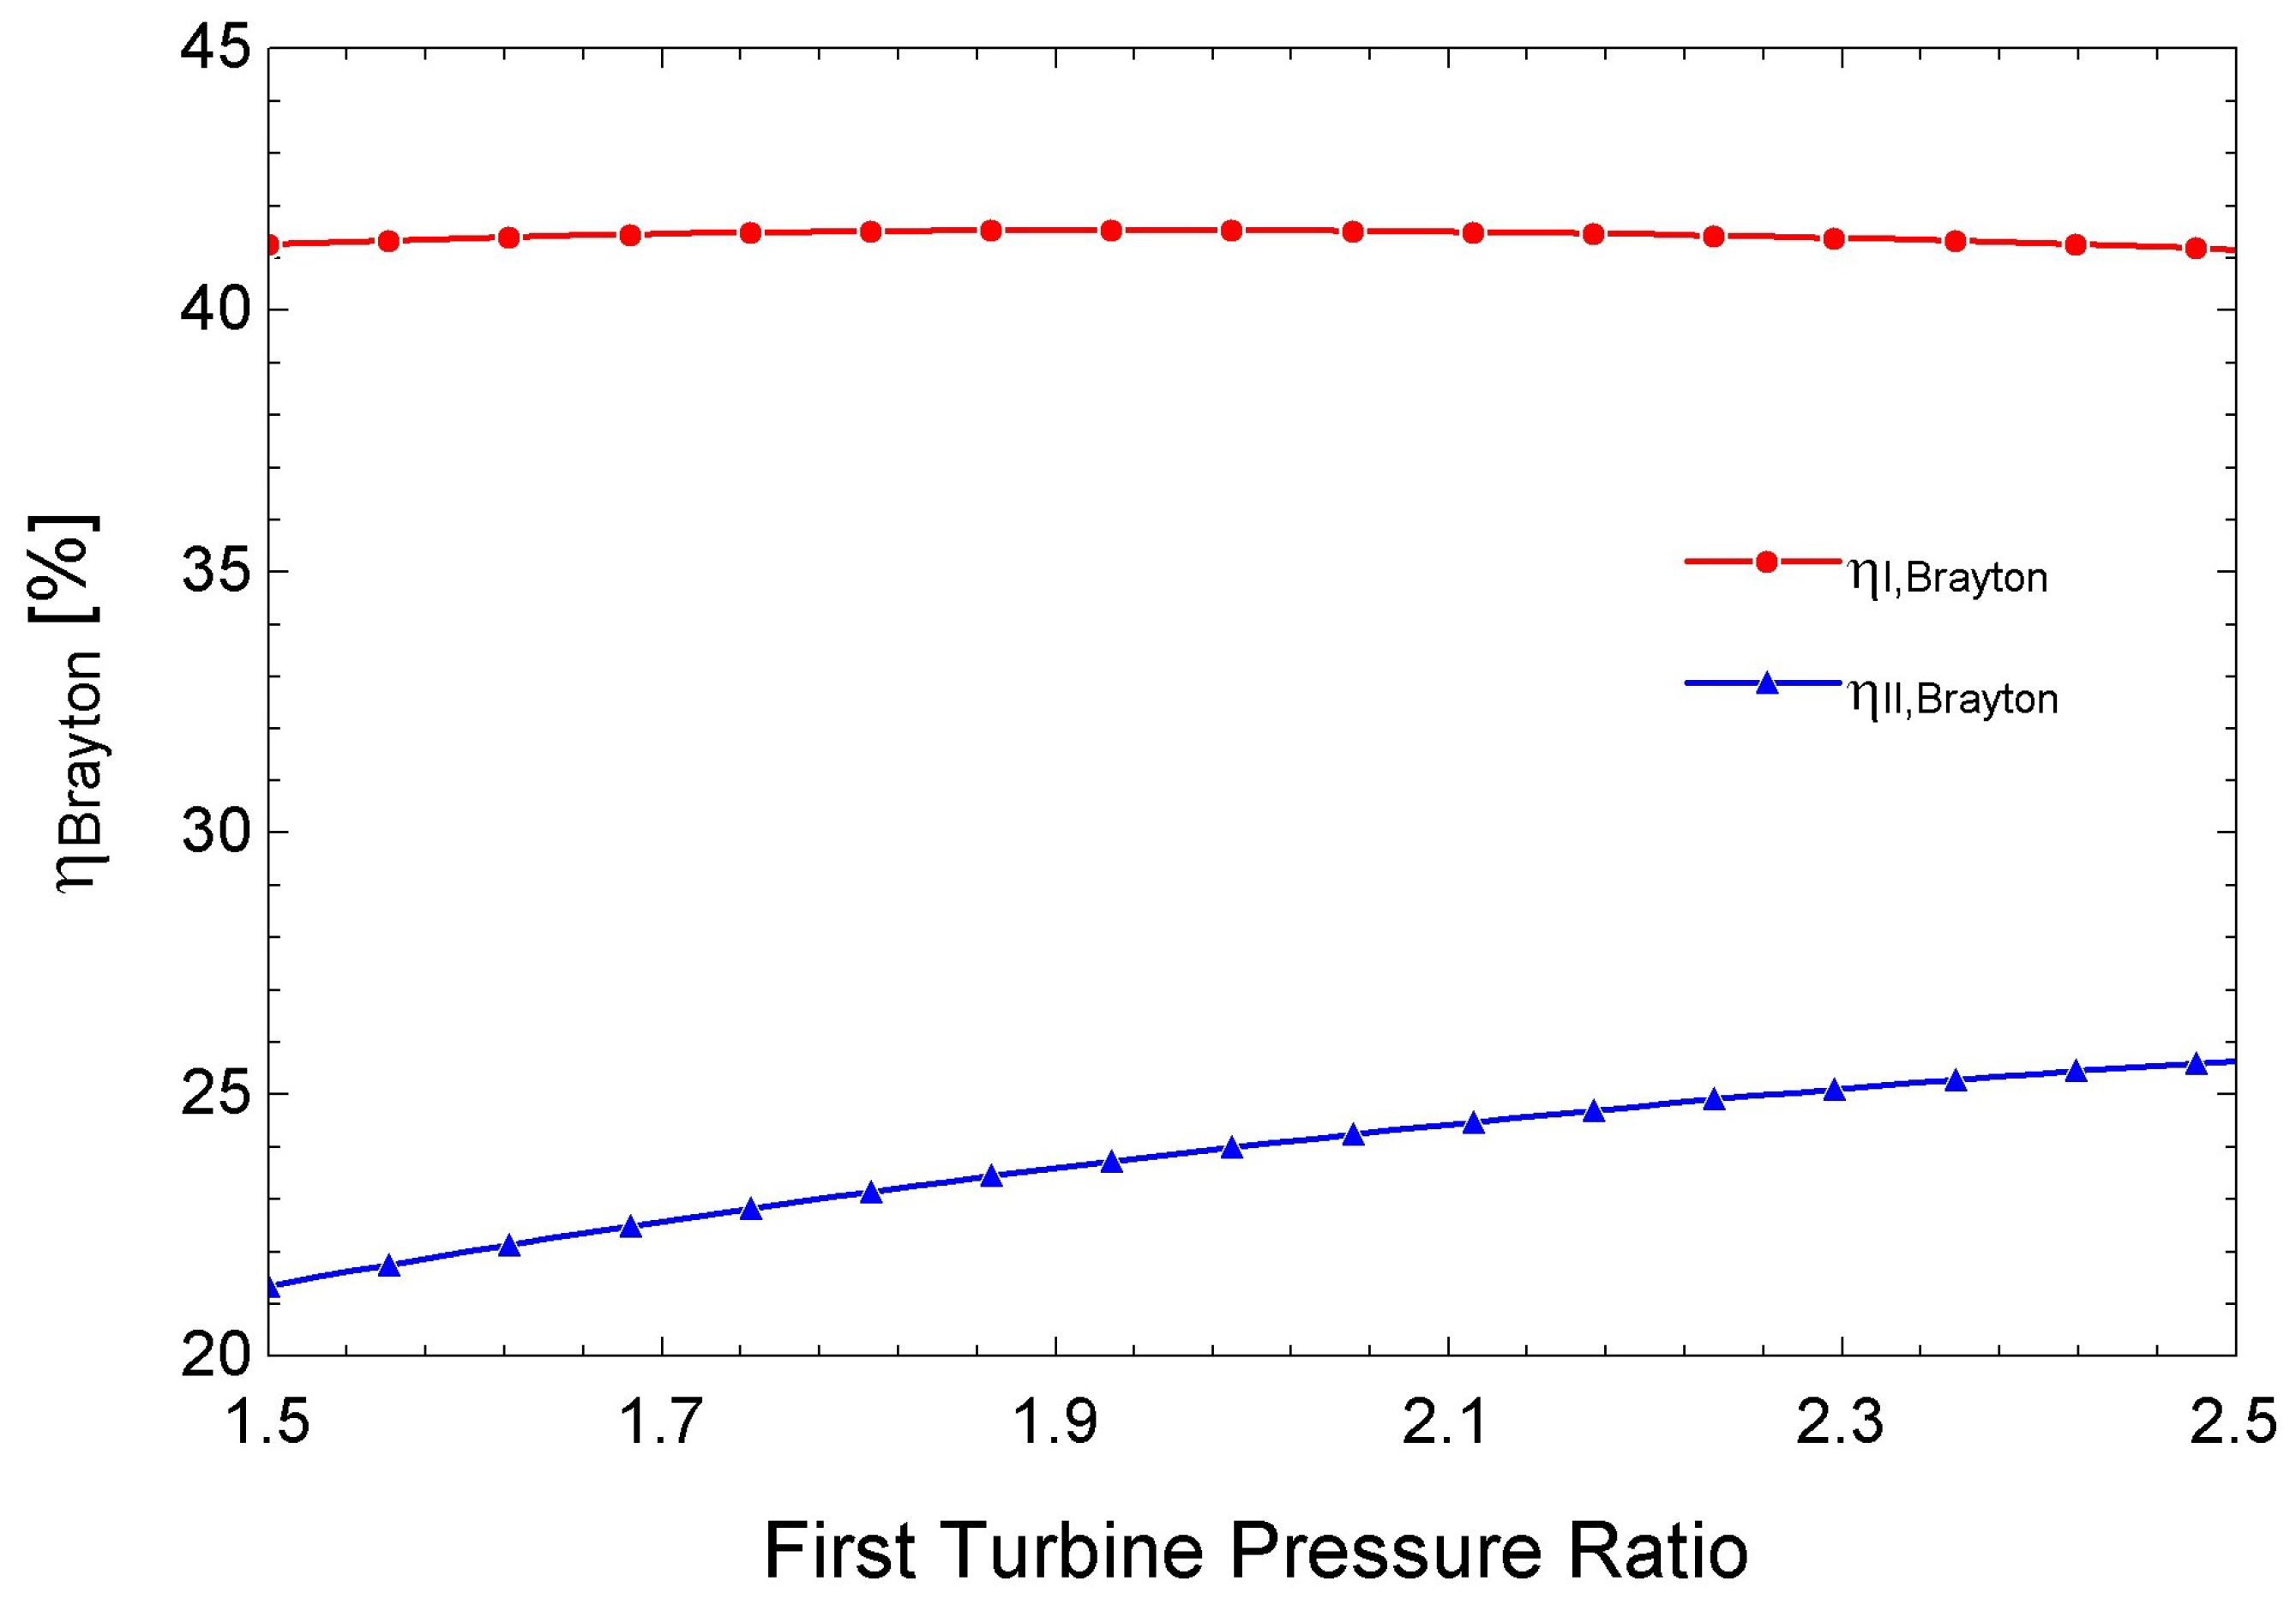
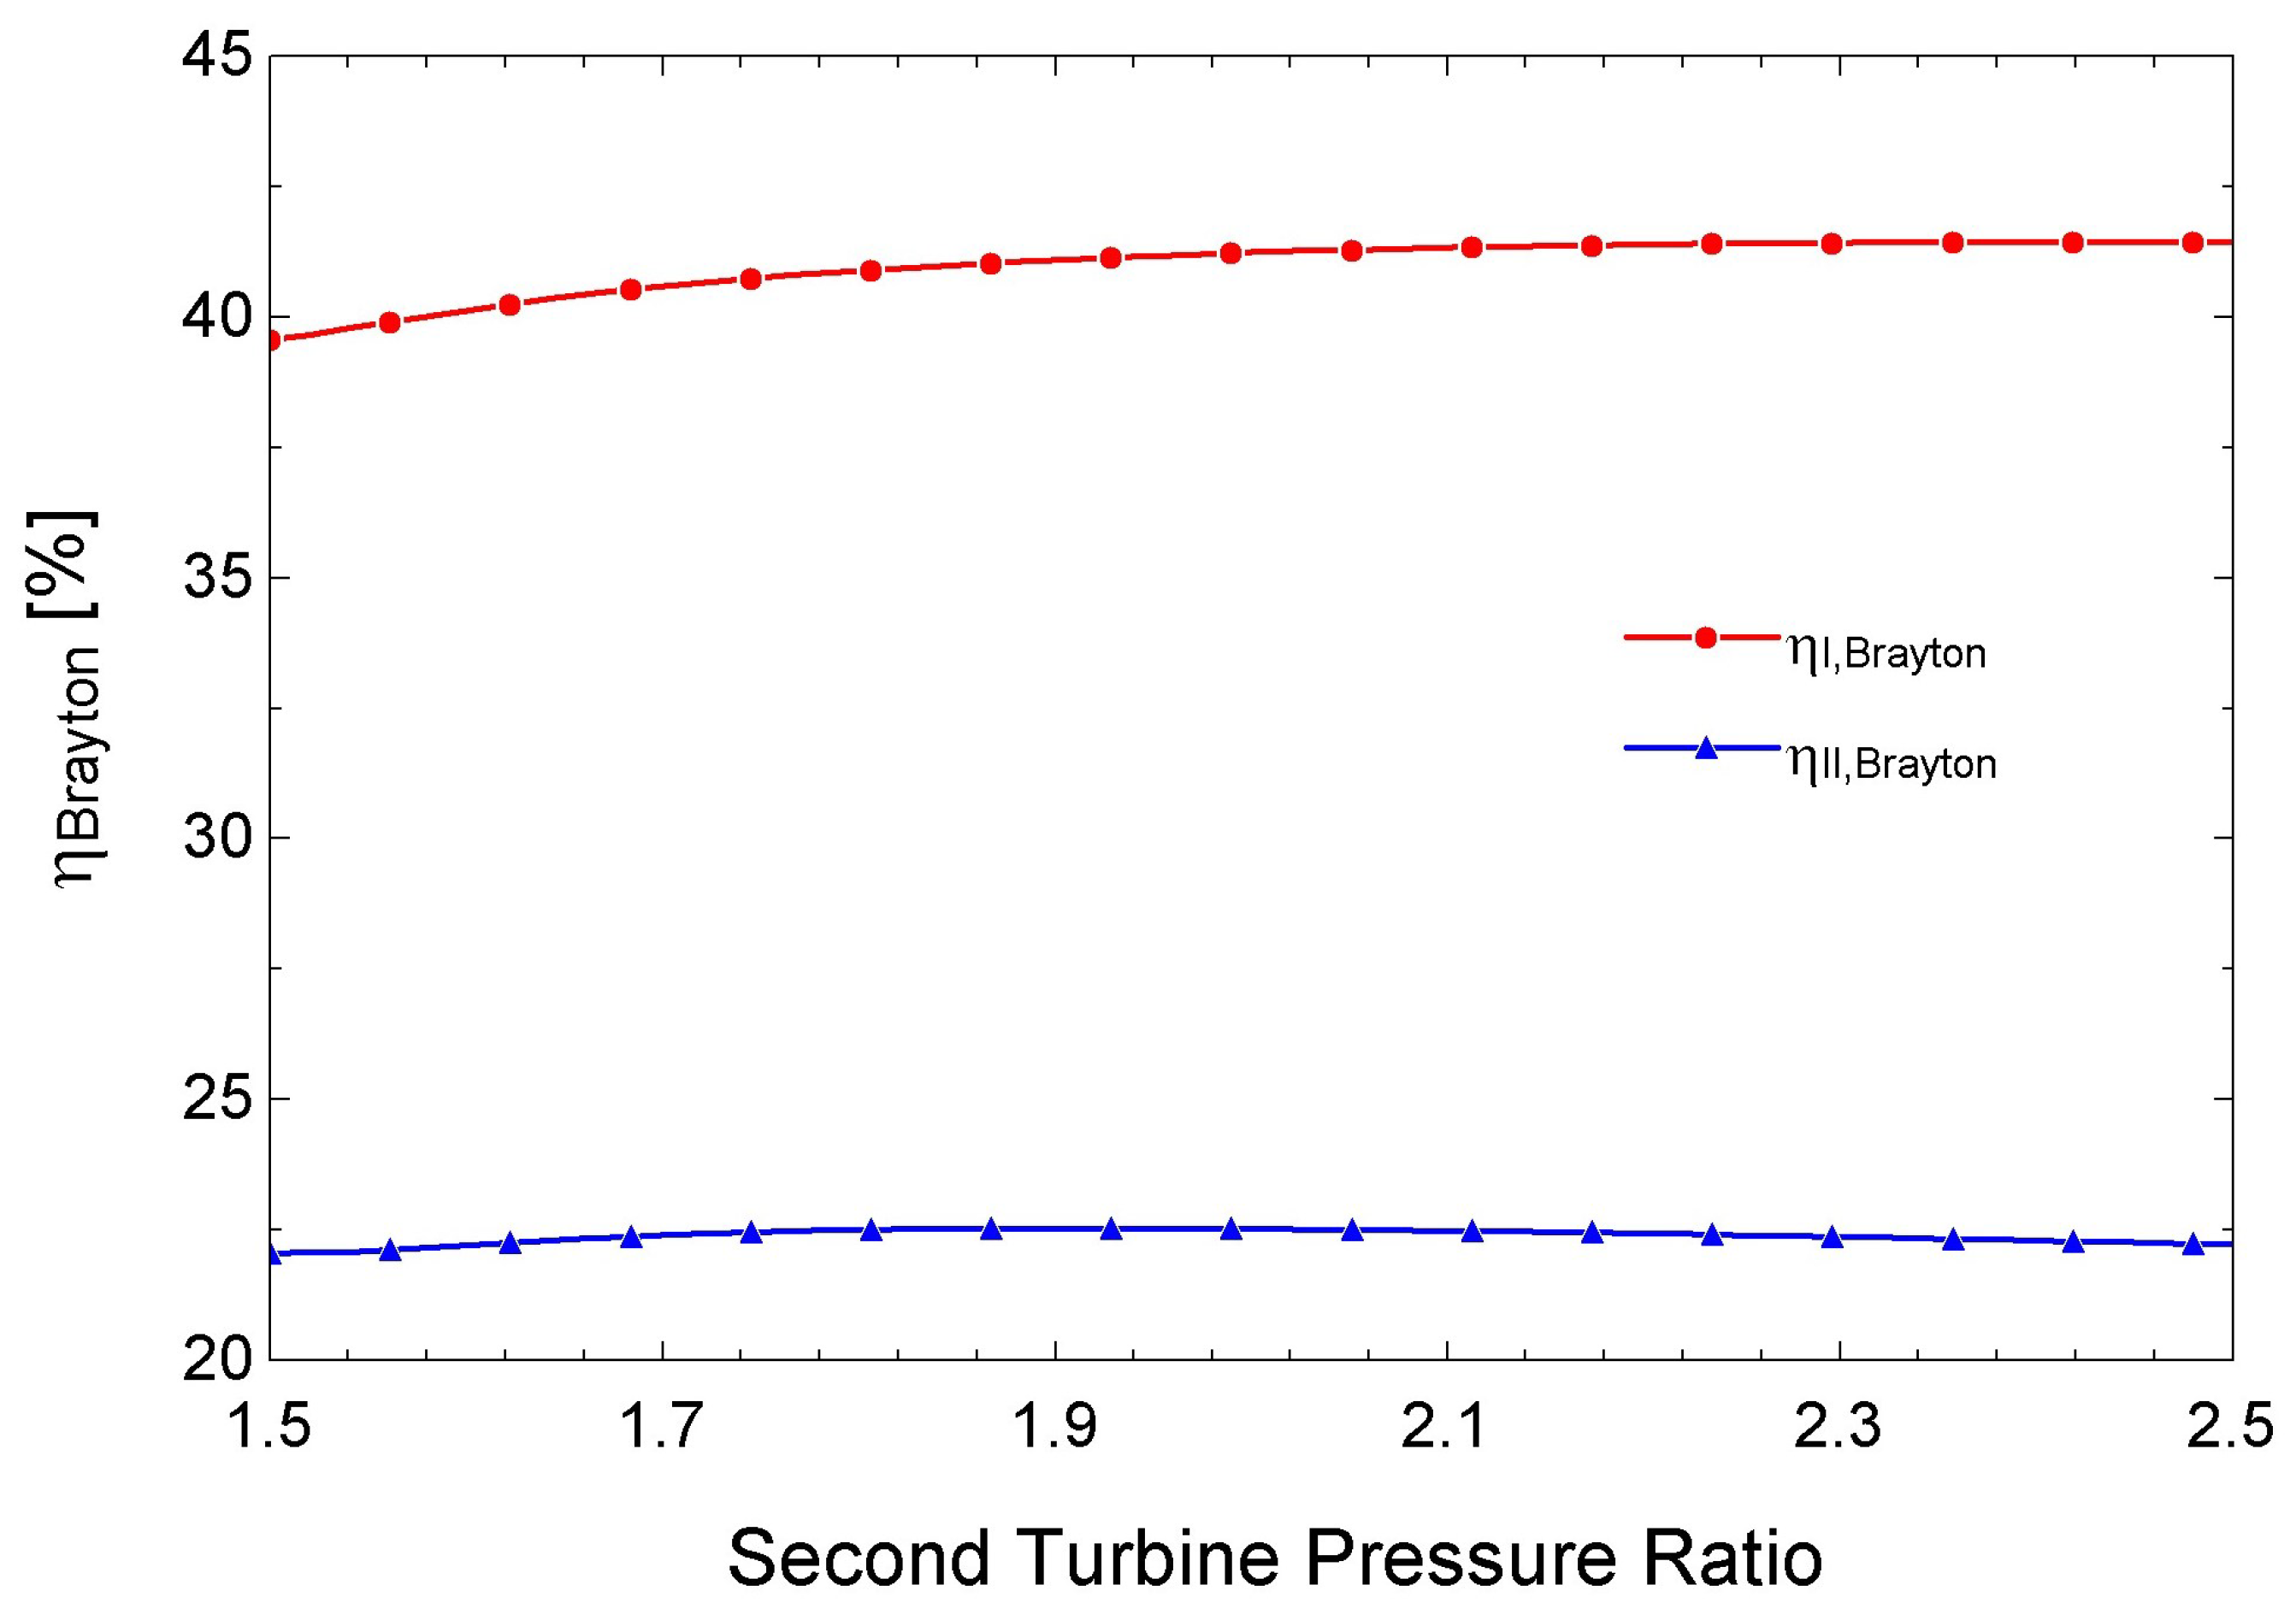
The pressure ratios of both gas turbines also have an important influence on the performance of the s-CO2 Brayton cycle. Both pressure ratios relate the different pressures at which the Brayton cycle is operating. Figure 12 shows the effect of the pressure ratio of the first gas turbine on the energetic and exergetic efficiencies of the cycle. It is observed that the energetic efficiency increases to a maximum value of 41.53% when the pressure ratio is about 1.95; after that, it decreases as the pressure ratio increases. It is also observed that the exergetic efficiency increases as the pressure ratio increases. Figure 13 shows the effect of the pressure ratio of the second gas turbine on the energetic and exergetic efficiencies of the cycle. It is observed that the energetic efficiency increases as the pressure ratio increases. It is also observed that the exergetic efficiency increases to a maximum value of 22.53% at a pressure ratio of 1.9; after that, it decreases as the pressure ratio increases.

3.5. Performance of the Double-Flash Geothermal Rankine Cycle

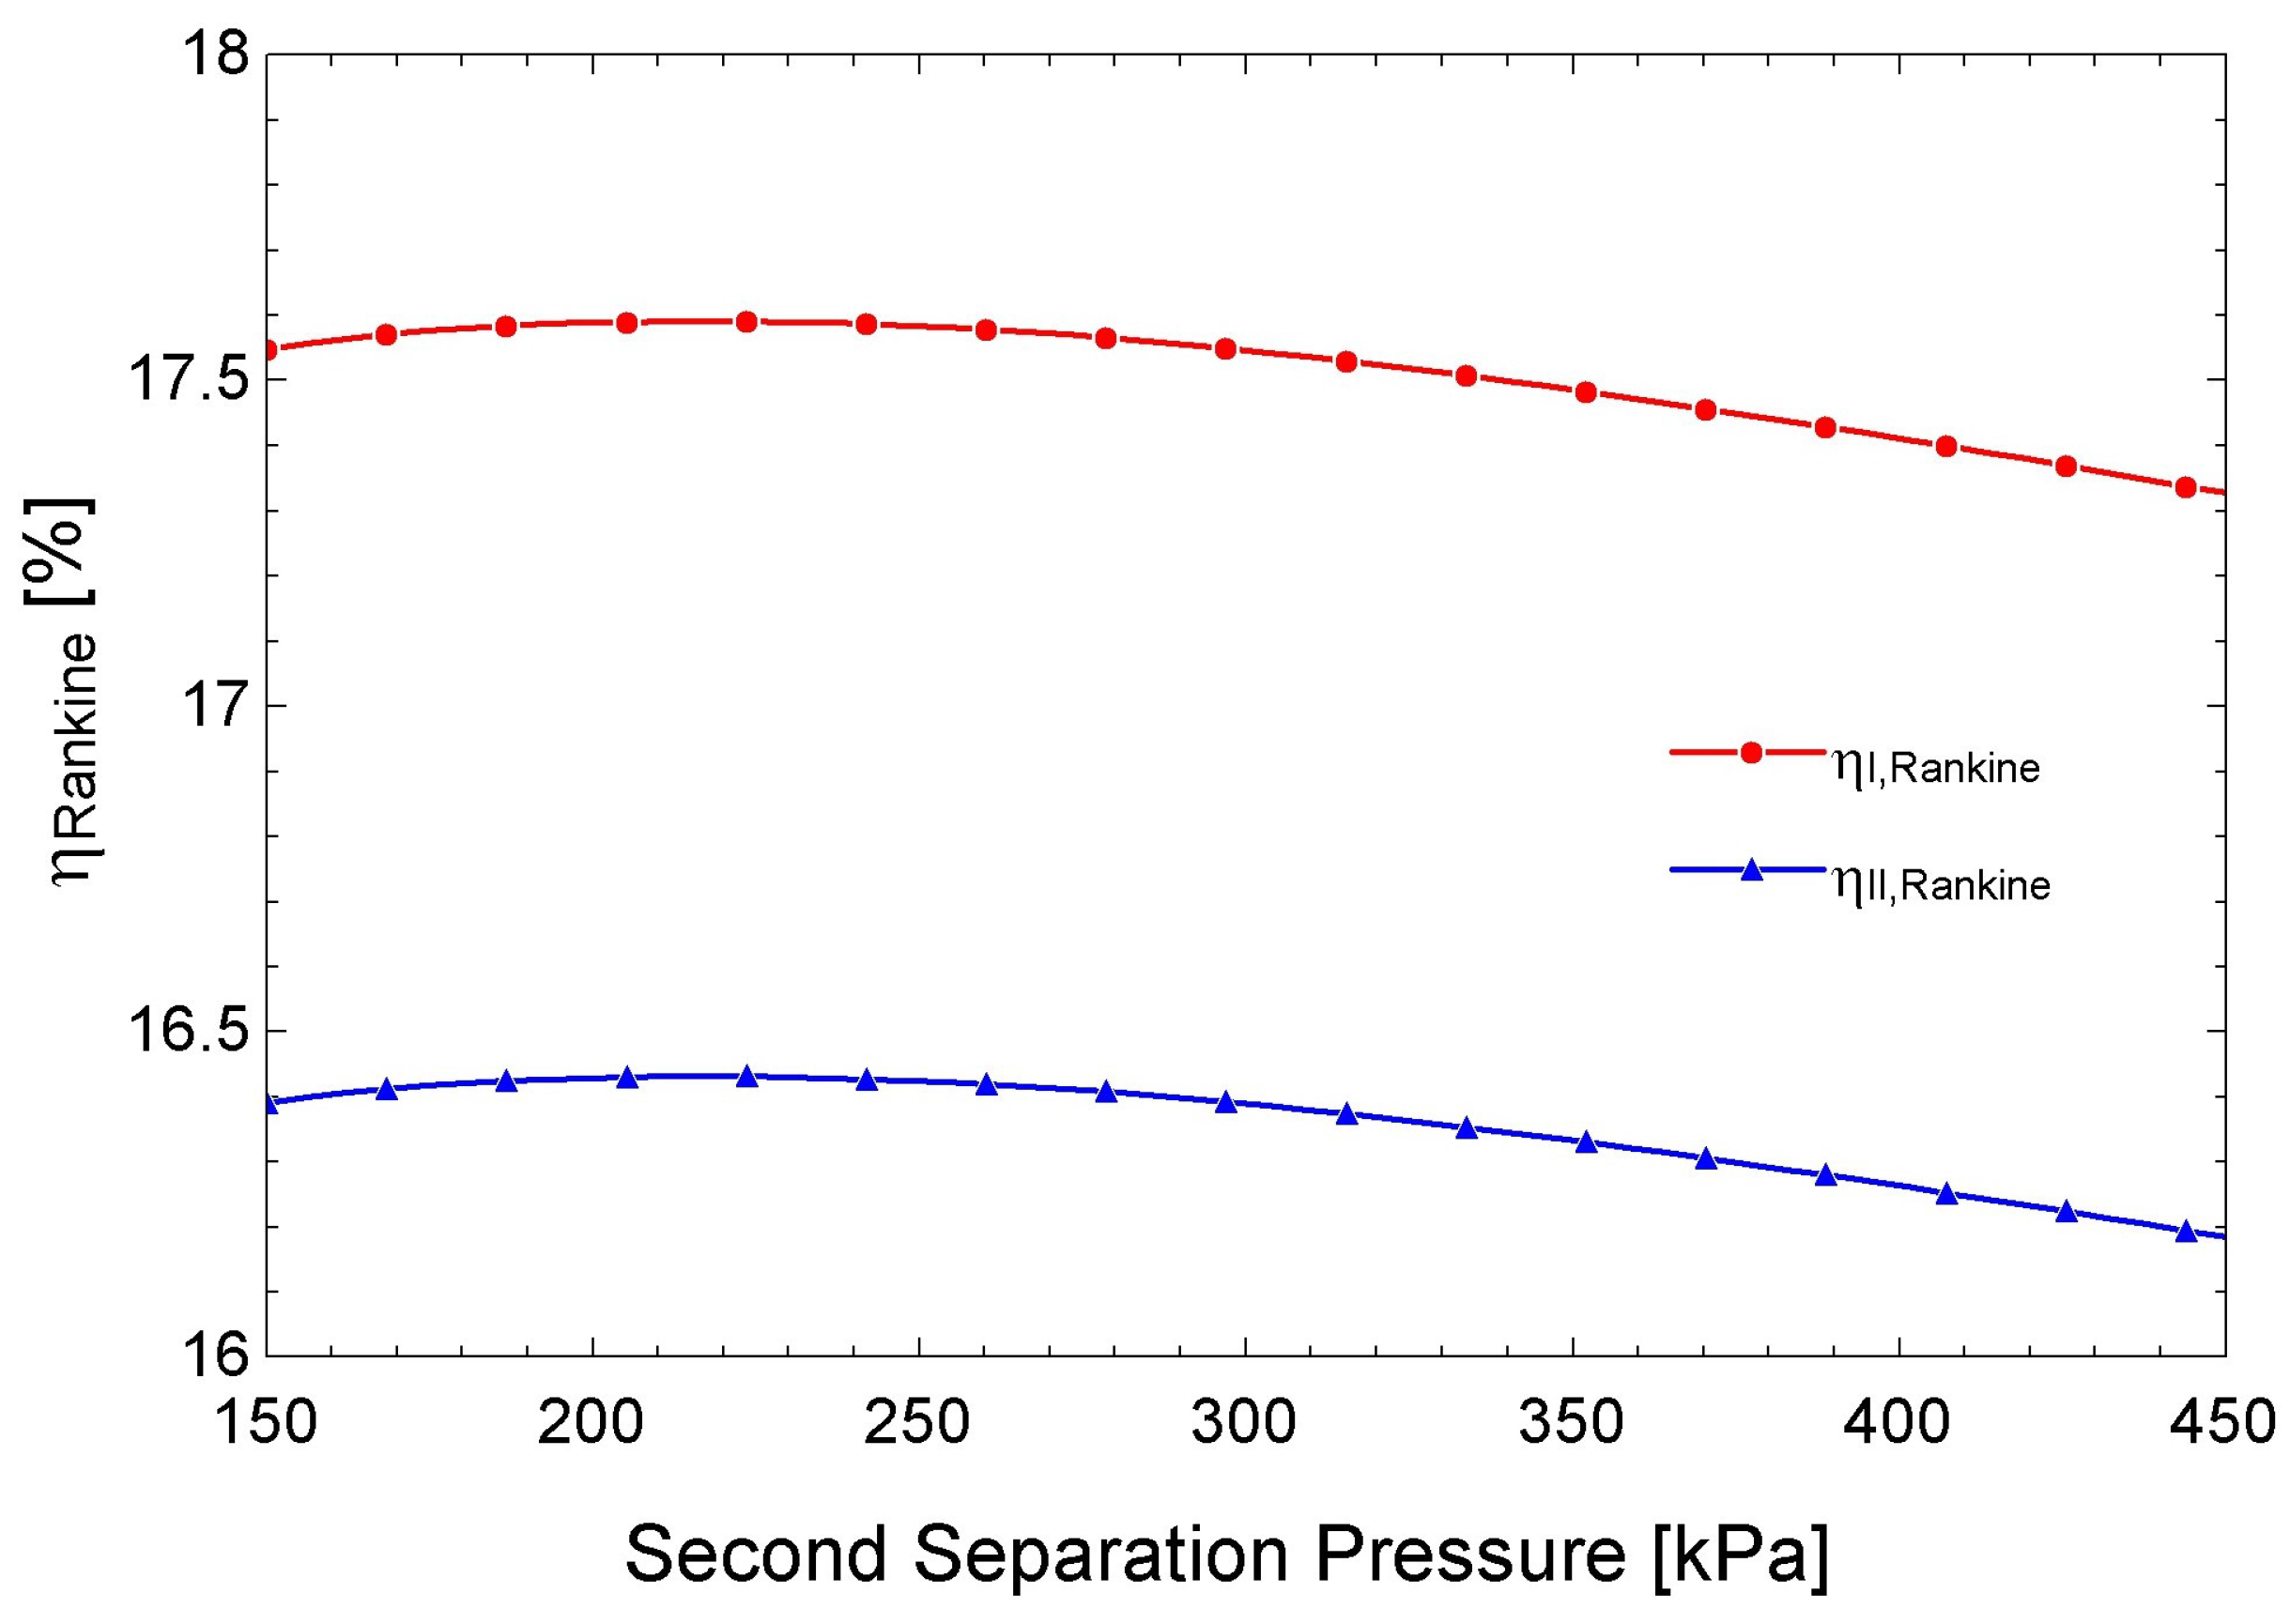
In the Rankine cycle, the pressure in the separation chambers is important because it is in these components where saturated vapor is produced. Figure 14 and Figure 15 show the effect of the separation pressure in the first and second chamber, respectively, on the energetic and exergetic efficiencies of the cycle. It is observed that both efficiencies increase as the separation pressure in the first chamber increases. On the other hand, it is observed that both efficiencies decrease as the separation pressure in the second chamber increases.

3.6. Optimum Performance Conditions of the Integrated Power System

Table 9 gives the operating conditions of the integrated power-production system, as well as its optimum operating conditions obtained by maximizing Equation (43).
It is observed that, for the non-optimized integrated system, the overall energetic efficiency of the integrated cycle is 31.5%, the overall exergetic efficiency of the cycle is 25.7%, and the total power produced is 16.1 MW. It is also observed that, for the optimized integrated system, the overall energetic efficiency of the cycle is 38.8%, the overall exergetic efficiency of the cycle is 30.9%, and the total power produced is 20.6 MW. When compared with the results of the system before the optimization, an improvement in the performance of the integrated system is observed.
The optimum values of the decision variables are as follows: for the s-CO2 Brayton cycle, the inlet gas turbine temperature is 741.1 °C, the pressure ratio of the gas turbines are 2.5 and 1.503, respectively, and the CO2 mass flow splitting fraction is 0.5881; for the geothermal Rankine cycle, the separation pressures of the flash chambers are 1437 kPa and 351.2 kPa, respectively; and for the ICE, the gasification temperature is 753 °C, and the equivalence ratio is 0.5964.
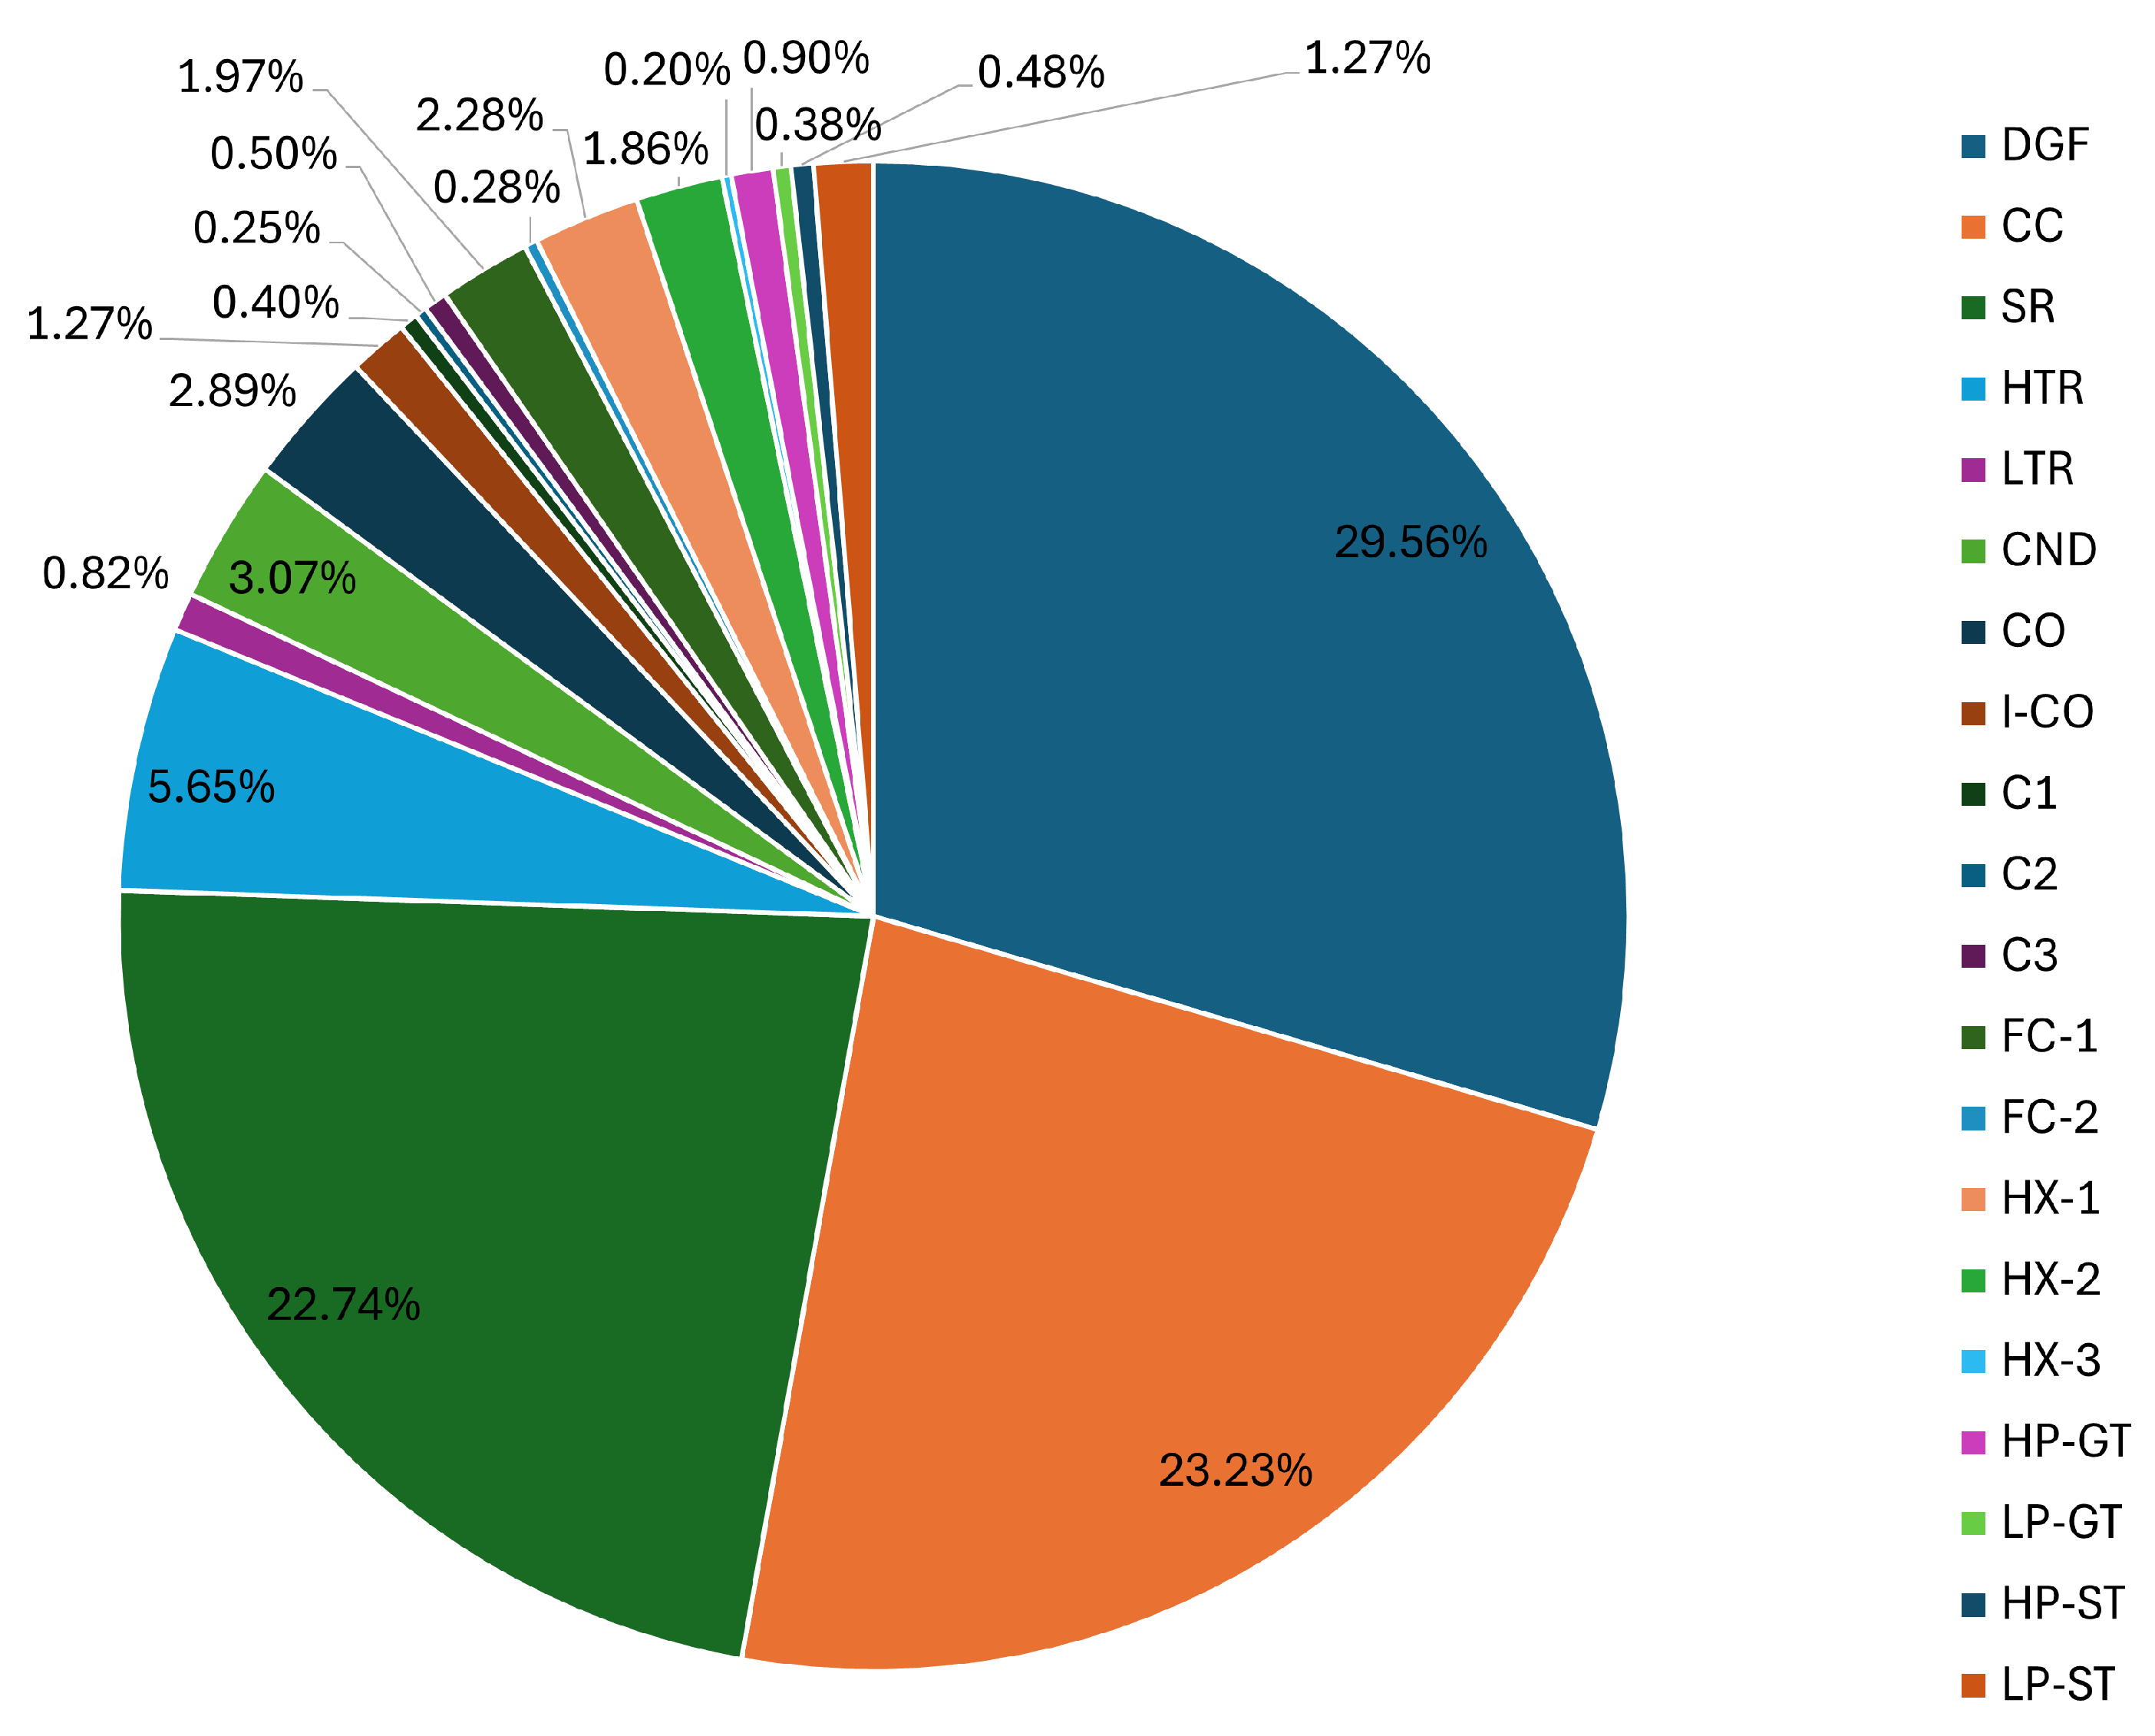
Figure 16 shows the exergy destruction rates for each component, with the downdraft gasifier being the device with the highest loss, followed by the combustion chamber and the solar receiver. Finally, Table A1 of Appendix A gives the properties of the different states for the optimal performance of the power-production system.
Individually, the biomass gasification system was able to produce a total of 5547 kg/h of syngas with an LHV of 5.6 kJ/kg, 496 kg/h of ash, and 230.4 kg/h of tar from 2176 kg/h of biomass and 4098 kg/h of air. Of this amount of syngas, 3766 kg/h are burned directly in the combustion chamber to reheat the Brayton cycle CO2, while the remaining 1781 kg/h feeds the ICE. Thus, the gasifier’s thermal or cold gas efficiency was 83.9%, and the exergy efficiency was 54.7%. The optimal Brayton cycle delivered a total power of 15 MW, reaching a thermal efficiency of 43.8% and an exegetic efficiency of 28.6, integrated with a solar receiver whose thermal efficiency was 76.4%. To have a good point of comparison, we can compare the system with the Gemasolar plant, the world’s first commercial high-temperature central tower power plant, located in Seville, Spain, whose thermal efficiency is 40% with a power of 19.9 MW.
Regarding the performance of the ICE, according to the literature, the thermal efficiency of this equipment working only with syngas as fuel is usually around 10 to 15%. Its average exergy efficiency varies from 35 to 40% [41]. After optimization, the engine achieved a thermal efficiency of 10.1% and an exergy efficiency of 20.5%. Likewise, the literature reports that the average thermal efficiency of geothermal systems is 12%, up to 21% for modern technologies. The system proposed in this work had a thermal efficiency of 18.7% and an exergy efficiency of 17.2%, producing 4.6 MWe.
Finally, an economic analysis was conducted to analyze the profitability of the project implementation; the evaluation considers sales and production costs in Mexico per kWh [42]; the calculated profit is 0.11 USD/kWh; so having a plant investment of a little more than USD 96 million and a plant capacity of 16.1 MWe, it is estimated that the payback time of the investment ranges between 6 and 7 years depending on some risk factors in the creation of the plant and its commercial operation. The results of this analysis are shown in Table A2 of Appendix B.

4. Conclusions

The design, analysis, and optimization of a cascade polygeneration power plant integrating different technologies is presented, reaching an overall thermal efficiency of 38.8% and an overall exergetic efficiency of 30.9%. The performance of each subsystem is evaluated separately and as a whole.
The optimal system can produce a maximum of 20.6 MWe of power from 21.0 MWt of solar energy incident on the receiver. In addition, 21.9 MWt of geothermal energy was obtained from the well, and 10.2 MWt of energy was available in the biomass.
The highest percentage of destruction exergy is found in the two components CC and DGF due to the generation of irreversibilities caused by chemical reactions, as well as heat transfer between gases. If the solar receiver is added, a total of 75.5% is reached.
An economic analysis was also realized to analyze the profitability of the project implementation, estimating that the payback time of the investment ranges between 6 and 7 years, depending on some risk factors in the creation of the plant and its commercial operation.
The results show the thermodynamic viability of the proposed system, being competent in comparison with an average thermoelectric power plant operating with fossil fuels (either coal or natural gas), since in addition to having quite acceptable efficiencies, it has the advantage of meaningful reduction in the emission of pollutants to the atmosphere by using clean energy sources.

Author Contributions

O.A.-R. developed the investigation and formal analysis, I.S.-T. established the methodology for the analysis and optimization of the solar collector; A.Z.-A. and C.B.M.-P. contributed with writing the first draft of the paper; D.A.R.-A. and S.C.-A. established the methodology for the analysis of the integrated system, supervised the project, and wrote the final version of the paper. All authors have read and agreed to the published version of the manuscript.

Funding

This research received no external funding.

Data Availability Statement

The original contributions presented in the study are included in the article, further inquiries can be directed to the corresponding author.

Acknowledgments

D. A. Rodriguez-Alejandro, A. Zaleta-Aguilar, and S. Cano-Andrade gratefully acknowledge the financial support of the National Council of Humanities, Sciences, and Technologies (CONAHCyT), Mexico, under its SNII program. O. Anaya-Reyes also acknowledges the financial support of CONAHCyT, under its national scholarship program under Grant No. 846216 (CVU-1245994).

Conflicts of Interest

The authors declare no conflicts of interest. The funders had no role in the design of the study; in the collection, analyses, or interpretation of data; in the writing of the manuscript; or in the decision to publish the results.

Abbreviations

The following abbreviations are used in this manuscript:
Symbols:
η Efficiency (%)
α Absortivity (%)
ϵ Thermal Emissivity (%)
β Pellets Correlation Factor (-)
δ Solar Cone Angle (rad)
π Penalty Factor (-)
ω Nominal Rotation Velocity (RPM)
bStroke (m)
dDiameter (m)
zNo. of Cylinders (-)
lDisplacement (m3)
hSpecific Enthalpy (kJ/kg)
eSpecific Exergy (kJ/kg)
m ˙ Mass Flow (kg/s)
W ˙ Power (kW)
TTemperature (°C)
E ˙ Exergy (kW)
PPressure (kP)
Subscripts:
0Ambient Conditions
s y n Syngas
b i o Biomass
m i x Mixture
i n Inlet
o u t Outlet
Acronyms:
DNI Direct Normal Irradiation
CSP Concentrating Solar Power
IEA International Energy Agency
LCOE Levelized Cost Of Electricity
CDF Cumulative Density Function
PDF Probability Density Function
HHV High Heating Value
LHV Low Heating Value
HF Heliostat Field
SR Solar Receiver
HP GT High Pressure Gas Turbine
LP GT Low Pressure Gas Turbine
HP ST High Pressure Steam Turbine
LP ST Low Pressure Steam Turbine
HTR High Temperature Recuperator
LTR Low Temperature Recuperator
C 1 Compressor 1
C 2 Compressor 2
C 3 Compressor 3
CC Combustion Chamber
DGF Downdraft Gasifier
CY Cyclone
FL Filter
ICE Internal Combustion Engine
HX 1 Heat Exchanger 1
HX 2 Heat Exchanger 2
HX 3 Heat Exchanger 3
CND Condenser
FC 1 Flash Chamber 1
FC 2 Flash Chamber 2
EV 1 Expansion Valve 1
EV 2 Expansion Valve 2
P Well Production Well
I Well Injection Well
CO Cooler
I CO Intercooler
CGE Cold Gas Efficiency

Appendix A

Table A1. Values of the properties for each state of the optimized cycle.
StateFluidT (°C)P (kPa)h (kJ/kg)s (kJ/kg-K)e (kJ/kg)m (kg/s)W (MW)
0Air23.4100.8−5.10.242---
0′Carbon dioxide23.4100.8−2.3−0.005---
0″Water23.4100.898.20.345---
1Biomass23.4----0.626-
2Air23.4100.80055.11.360-
3Air23.4100.80055.12.395-
4Air23.4100.80055.18.112-
5Air30098.810.00.02458.011.360-
6Syngas794.198.845.80.07541441.986-
7Syngas23094.811.50.03041101.986-
8Syngas21692.9--9.61.883-
9Syngas216510.70.07240941.817-
10Syngas216510.70.07241711.298-
11Syngas216510.70.07240940.479-
12Syngas4050.9050.04840942.874-
13Exhaust gas6005903.27.678-2.874-
14Exhaust gas1005374.16.785-2.874-
15Syngas216510.70.07241719.410-
16Syngas2082527.08.970.059.410-
17Ashes----13,8340.143-
18Tar----12,8170.066-
19ICE power------1
20GT power------14.6
21ST power------4.6
22Solar power------21.0
23Carbon dioxide700.225,0007150.166666.391.8-
24Carbon dioxide573.510,000564.70.17951291.8-
25Carbon dioxide700.210,000720.90.351617.391.8-
26Carbon dioxide64366406520.357546.791.8-
27Carbon dioxide184.46640120.4−0.442252.391.8-
28Carbon dioxide107.3664032.1−0.654226.791.8-
29Carbon dioxide43.46640−59.7−0.920213.891.8-
30Carbon dioxide77.510,000−40.8−0.91423191.8-
31Carbon dioxide77.510,000−40.8−0.91423140.7-
32Carbon dioxide43.410,000−171.1−1.311218.240.7-
33Carbon dioxide81.425,000−144.2−1.302242.740.7-
34Carbon dioxide159.425,00024.4−0.90029240.7-
35Carbon dioxide77.510,000−40.8−0.91423151.1-
36Carbon dioxide159.425,00012.6−0.900280.351.1-
37Carbon dioxide159.425,00017.8−0.900285.591.8-
38Carbon dioxide569.425,000549.4−0.016554.991.8-
39Carbon dioxide549.425,000524.3−0.046538.791.8-
40Carbon dioxide529.425,000499.2−0.077522.891.8-
41Water32011,35714613.447442.815-
42Water195.9142614613.629388.915-
43Water195.91426834.12.292158.310.2-
44Water195.9142610372.726233.110.2-
45Water195.91426834.12.292158.39.1-
46Water138.3344.6834.12.335145.89.1-
47Water138.3344.6582.11.72275.48.1-
48Water97.7344.6409.71.28133.815-
49Water138.3344.627326.946675.91.1-
50Water239.8344.629457.409751.41.1-
51Water195.9142627906.462877.64.8-
52Water195.9142627906.462877.61.1-
53Water195.9142627906.452877.65.9-
54Water347.8142631447.11810375.9-
55Water196.8344.628567.229716.35.9-
56Water203.4344.628707.258721.46.9-
57Water5012.324097.510185.66.9-
58Water5012.3209.30.7044.66.9-

Appendix B

Table A2. Economic equipment cost [43,44].
ComponentCost FunctionValue (USD)
C1 Z C = 39.5 × m ˙ a 0.9 η c P o u t P i n l n P o u t P i n 217,283.00
C2 Z C = 39.5 × m ˙ a 0.9 η c P o u t P i n l n P o u t P i n 334,768.00
C3 Z C = 39.5 × m ˙ a 0.9 η c P o u t P i n l n P o u t P i n 477,973.00
HP-ST Z S T = 600 W ˙ S T 0.7 107,756.00
LP-ST Z S T = 600 W ˙ S T 0.7 170,620.00
HP-GT Z G T = W ˙ G T 1318.5 98.328 l n W ˙ G T 18,600,000.00
LP-GT Z G T = W ˙ G T 1318.5 98.328 l n W ˙ G T 8,470,000.00
DGF Z D G F = 2.9 × 10 6 3.6 m ˙ b i o 0.7 4,990,000.00
CND Z C N D = 17773 m ˙ i n 122,799.00
CC Z C C = 46.08 × m ˙ i n 0.995 P o u t P i n 1 + e x p 0.018 T o u t 26.4 6,500,000.00
HX-1 Z H X = 130 A 0.093 0.78 19,493.00
HX-2 Z H X = 130 A 0.093 0.78 17,964.00
HX-3 Z H X = 130 A 0.093 0.78 18,072.00
CO Z H X = 130 A 0.093 0.78 15,766.00
I-CO Z H X = 130 A 0.093 0.78 17,413.00
FC-1 Z F C = 280.3 m ˙ s e p 4205.00
FC-2 Z F C = 280.3 m ˙ s e p 2568.00
HTR Z H X = 130 A 0.093 0.78 16,840.00
LTR Z H X = 130 A 0.093 0.78 18,558.00

References

  1. Nations, U. World Population Prospects: The 2017 Revision, Key Findings and Advance Tables; Working Paper No. ESA/P/WP/248; United Nations: New York, NY, USA, 2017.
  2. Steen, M. Greenhouse Gas Emissions from Fossil Fuel Fired Power Generation Systems; Institute for Advanced Materials, Joint Research Centre, European Commission: Ispra, Italy, 2001. [Google Scholar]
  3. Colgan, J.D. The International Energy Agency; Challenges for the 21st Century. GPPi Energy Policy Paper; Global Public Policy Institute (GPPI): Berlin, Germany, 2009; Volume 6. [Google Scholar]
  4. Sengupta, M.; Xie, Y.; Lopez, A.; Habte, A.; Maclaurin, G.; Shelby, J. The national solar radiation data base (NSRDB). Renew. Sustain. Energy Rev. 2018, 89, 51–60. [Google Scholar] [CrossRef]
  5. Le Bert, G.H.; Gutiérrez-Negrín, L.C.; Quijano León, H.L.; Ornelas Celis, A.; Espíndola, S.; Hernandez Carrillo, I. Evaluación de la energía geotérmica en México. In Informe Para el Banco Interamericano de Desarrollo y la Comisión Reguladora de Energía; Comisión Reguladora de Energía: Mexico City, Mexico, 2011. [Google Scholar]
  6. Valdez-Vazquez, I.; Acevedo-Benítez, J.A.; Hernández-Santiago, C. Distribution and potential of bioenergy resources from agricultural activities in Mexico. Renew. Sustain. Energy Rev. 2010, 14, 2147–2153. [Google Scholar] [CrossRef]
  7. Binotti, M.; Astolfi, M.; Campanari, S.; Manzolini, G.; Silva, P. Preliminary assessment of sCO2 power cycles for application to CSP Solar Tower plants. Energy Procedia 2017, 105, 1116–1122. [Google Scholar] [CrossRef]
  8. Zhou, C. Hybridisation of solar and geothermal energy in both subcritical and supercritical Organic Rankine Cycles. Energy Convers. Manag. 2014, 81, 72–82. [Google Scholar] [CrossRef]
  9. Astolfi, M.; Xodo, L.; Romano, M.C.; Macchi, E. Technical and economical analysis of a solar–geothermal hybrid plant based on an Organic Rankine Cycle. Geothermics 2011, 40, 58–68. [Google Scholar] [CrossRef]
  10. Lentz, Á.; Almanza, R. Solar–geothermal hybrid system. Appl. Therm. Eng. 2006, 26, 1537–1544. [Google Scholar] [CrossRef]
  11. Cardemil, J.M.; Cortés, F.; Díaz, A.; Escobar, R. Thermodynamic evaluation of solar-geothermal hybrid power plants in northern Chile. Energy Convers. Manag. 2016, 123, 348–361. [Google Scholar] [CrossRef]
  12. Boukelia, T.E.; Arslan, O.; Bouraoui, A. Thermodynamic performance assessment of a new solar tower-geothermal combined power plant compared to the conventional solar tower power plant. Energy 2021, 232, 121109. [Google Scholar] [CrossRef]
  13. Javadi, M.A.; Abhari, M.K.; Ghasemiasl, R.; Ghomashi, H. Energy, exergy and exergy-economic analysis of a new multigeneration system based on double-flash geothermal power plant and solar power tower. Sustain. Energy Technol. Assess. 2021, 47, 101536. [Google Scholar] [CrossRef]
  14. Kulhánek, M.A.D.V.; Dostal, V. Thermodynamic analysis and comparison of supercritical carbon dioxide cycles. In Proceedings of the Supercritical CO2 Power Cycle Symposium, Boulder, CO, USA, 24–25 May 2011; pp. 1–7. [Google Scholar]
  15. Feher, E.G. The supercritical thermodynamic power cycle. Energy Convers. 1968, 8, 85–90. [Google Scholar] [CrossRef]
  16. Angelino, G. Carbon dioxide condensation cycles for power production. J. Eng. Power 1968, 90, 287–295. [Google Scholar] [CrossRef]
  17. Dostal, V. A Supercritical Carbon Dioxide Cycle for Next Generation Nuclear Reactors. Ph.D. Thesis, Massachusetts Institute of Technology, Department of Nuclear Engineering, Cambridge, MA, USA, 2004. [Google Scholar]
  18. Moisseytsev, A.; Sienicki, J.J. Investigation of alternative layouts for the supercritical carbon dioxide Brayton cycle for a sodium-cooled fast reactor. Nucl. Eng. Des. 2009, 239, 1362–1371. [Google Scholar] [CrossRef]
  19. Padilla, R.V.; Too, Y.C.S.; Benito, R.; Stein, W. Exergetic analysis of supercritical CO2 Brayton cycles integrated with solar central receivers. Appl. Energy 2015, 148, 348–365. [Google Scholar] [CrossRef]
  20. Conboy, T.; Wright, S.; Pasch, J.; Fleming, D.; Rochau, G.; Fuller, R. Performance characteristics of an operating supercritical CO2 Brayton cycle. J. Eng. Gas Turbines Power. 2012, 134, 111703. [Google Scholar] [CrossRef]
  21. Iverson, B.D.; Conboy, T.M.; Pasch, J.J.; Kruizenga, A.M. Supercritical CO2 Brayton cycles for solar-thermal energy. Appl. Energy 2013, 111, 957–970. [Google Scholar] [CrossRef]
  22. Wang, X.; Liu, Q.; Bai, Z.; Lei, J.; Jin, H. Thermodynamic analysis of the cascaded supercritical CO2 cycle integrated with solar and biomass energy. Energy Procedia 2017, 105, 445–452. [Google Scholar] [CrossRef]
  23. Yu, W.; Gong, Q.; Gao, D.; Wang, G.; Su, H.; Li, X. Thermodynamic analysis of supercritical carbon dioxide cycle for internal combustion engine waste heat recovery. Processes 2020, 8, 216. [Google Scholar] [CrossRef]
  24. Nkhonjera, L.; Ansari, S.; Liu, X. Development of hybrid CSP biomass gasification process with supercritical carbon dioxide cycle for power generation. In AIP Conference Proceedings; AIP Publishing: New York, NY, USA, 2020; Volume 2303, p. 080005. [Google Scholar]
  25. Cao, Y.; Habibi, H.; Zoghi, M.; Raise, A. Waste heat recovery of a combined regenerative gas turbine-recompression supercritical CO2 Brayton cycle driven by a hybrid solar-biomass heat source for multi-generation purpose: 4E analysis and parametric study. Energy 2021, 236, 121432. [Google Scholar] [CrossRef]
  26. Altinkaynak, M.; Ozturk, M. Thermodynamic analysis of a novel integrated system operating with gas turbine, s-CO2 and t-CO2 power systems for hydrogen production and storage. Int. J. Hydrogen Energy 2022, 47, 3484–3503. [Google Scholar] [CrossRef]
  27. Manesh, M.K.; Mehrabian, M.; Nourpour, M.; Onishi, V. Risk and 4E analyses and optimization of a novel solar-natural gas-driven polygeneration system based on Integration of Gas Turbine–SCO2–ORC-solar PV-PEM electrolyzer. Energy 2023, 263, 125777. [Google Scholar] [CrossRef]
  28. Chitgar, N.; Moghimi, M. Design and evaluation of a novel multi-generation system based on SOFC-GT for electricity, fresh water and hydrogen production. Energy 2020, 197, 117162. [Google Scholar] [CrossRef]
  29. Molina Pfennig, P.D.; González-Baheza, A. Evaluación de los recursos de radiación solar en los municipios de Baja California Sur, México, mediante un modelo de aptitud socioambiental. Región Soc. 2020, 32, e1296. [Google Scholar] [CrossRef] [PubMed]
  30. Barragán, M.A.M.; Ochoa, E.d.J.R.; García, A.Z.; Buriticá, N.G.M. Energía geotérmica en México, una alternativa con el medio ambiente: Cerro Prieto. p. 71. Available online: https://revistas.udem.edu.co/index.php/fragua/issue/download/238/51#page=71 (accessed on 11 April 2023).
  31. Rodríguez-Alejandro, D.A. Optimización de un Gasificador de Biomasa Basado en la Exergo-Caracterización. Master’s Thesis, Universidad de Guanajuato, Salamanca, Mexico, 2012. [Google Scholar]
  32. Alejandro, D.A.R. Gasificación de Biomasa: Modelado, Simulación y Análisis Experimental. Ph.D. Thesis, Universidad de Guanajuato, Guanajuato, Mexico, 2017. [Google Scholar]
  33. Ebrahimi, A.; Ghorbani, B.; Ziabasharhagh, M.; Rahimi, M.J. Biomass gasification process integration with Stirling engine, solid oxide fuel cell, and multi-effect distillation. J. Therm. Anal. Calorim. 2021, 145, 1283–1302. [Google Scholar] [CrossRef]
  34. Atoche Sánchez, E.A. Estudio de Factibilidad de un Sistema Moto-Generador Empleando Gasificación de Biomasa. Bachelor Thesis, Universidad de Piura, Piura, Peru, 2018. [Google Scholar]
  35. Alsagri, A.S.H. Thermoeconomic and Optimization Analysis of Advanced Supercritical Carbon Dioxide Power Cycles in Concentrated Solar Power Application; University of Dayton: Dayton, OH, USA, 2018. [Google Scholar]
  36. U.S. National Renewable Energy Laboratory. Available online: https://www.nrel.gov/ (accessed on 3 November 2023).
  37. Scheffler, O.C. Optimization of an Optical Field for a Central Receiver Solar Thermal Power Plant; Stellenbosch University: Stellenbosch, South Africa, 2015. [Google Scholar]
  38. DiPippo, R. Geothermal Power Plants: Principles, Applications, Case Studies and Environmental Impact; Butterworth-Heinemann: Woburn, MA, USA, 2012. [Google Scholar]
  39. Powell, M.J.D. A direct search optimization method that models the objective and constraint functions by linear interpolation. In Advances in Optimization and Numerical Analysis; Mathematics and Its Applications; Gomez, S., Hennart, J.P., Eds.; Springer: Berlin/Heidelberg, Germany, 1994; Volume 275, pp. 51–67. [Google Scholar] [CrossRef]
  40. Rodriguez-Alejandro, D.A.; Nam, H.; Maglinao, A.L., Jr.; Capareda, S.C.; Aguilera-Alvarado, A.F. Development of a modified equilibrium model for biomass pilot-scale fluidized bed gasifier performance predictions. Energy 2016, 115, 1092–1108. [Google Scholar] [CrossRef]
  41. Karagoz, M.; Uysal, C.; Agbulut, U.; Saridemir, S. Energy, exergy, economic and sustainability assessments of a compression ignition diesel engine fueled with tire pyrolytic oil-diesel blends. J. Clean. Prod. 2020, 264, 121724. [Google Scholar] [CrossRef]
  42. Comision Federal de Electricidad. Available online: https://www.cfe.mx/hogar/tarifas/Pages/Acuerdosdetarifasant.aspx (accessed on 15 September 2024).
  43. Mamaghani, A.H.; Najafi, B.; Shirazi, A.; Rinaldi, F. 4E analysis and multi-objective optimization of an integrated MCFC (molten carbonate fuel cell) and ORC (organic Rankine cycle) system. Energy 2015, 82, 650–663. [Google Scholar] [CrossRef]
  44. Abam, F.; Diemuodeke, O.; Ekwe, E.; Samuel, O.; Farooq, M. Exergoeconomic and environmental modeling of integrated polygeneration power plant with biomass-based syngas supplemental firing. Energies 2020, 13, 6018. [Google Scholar] [CrossRef]
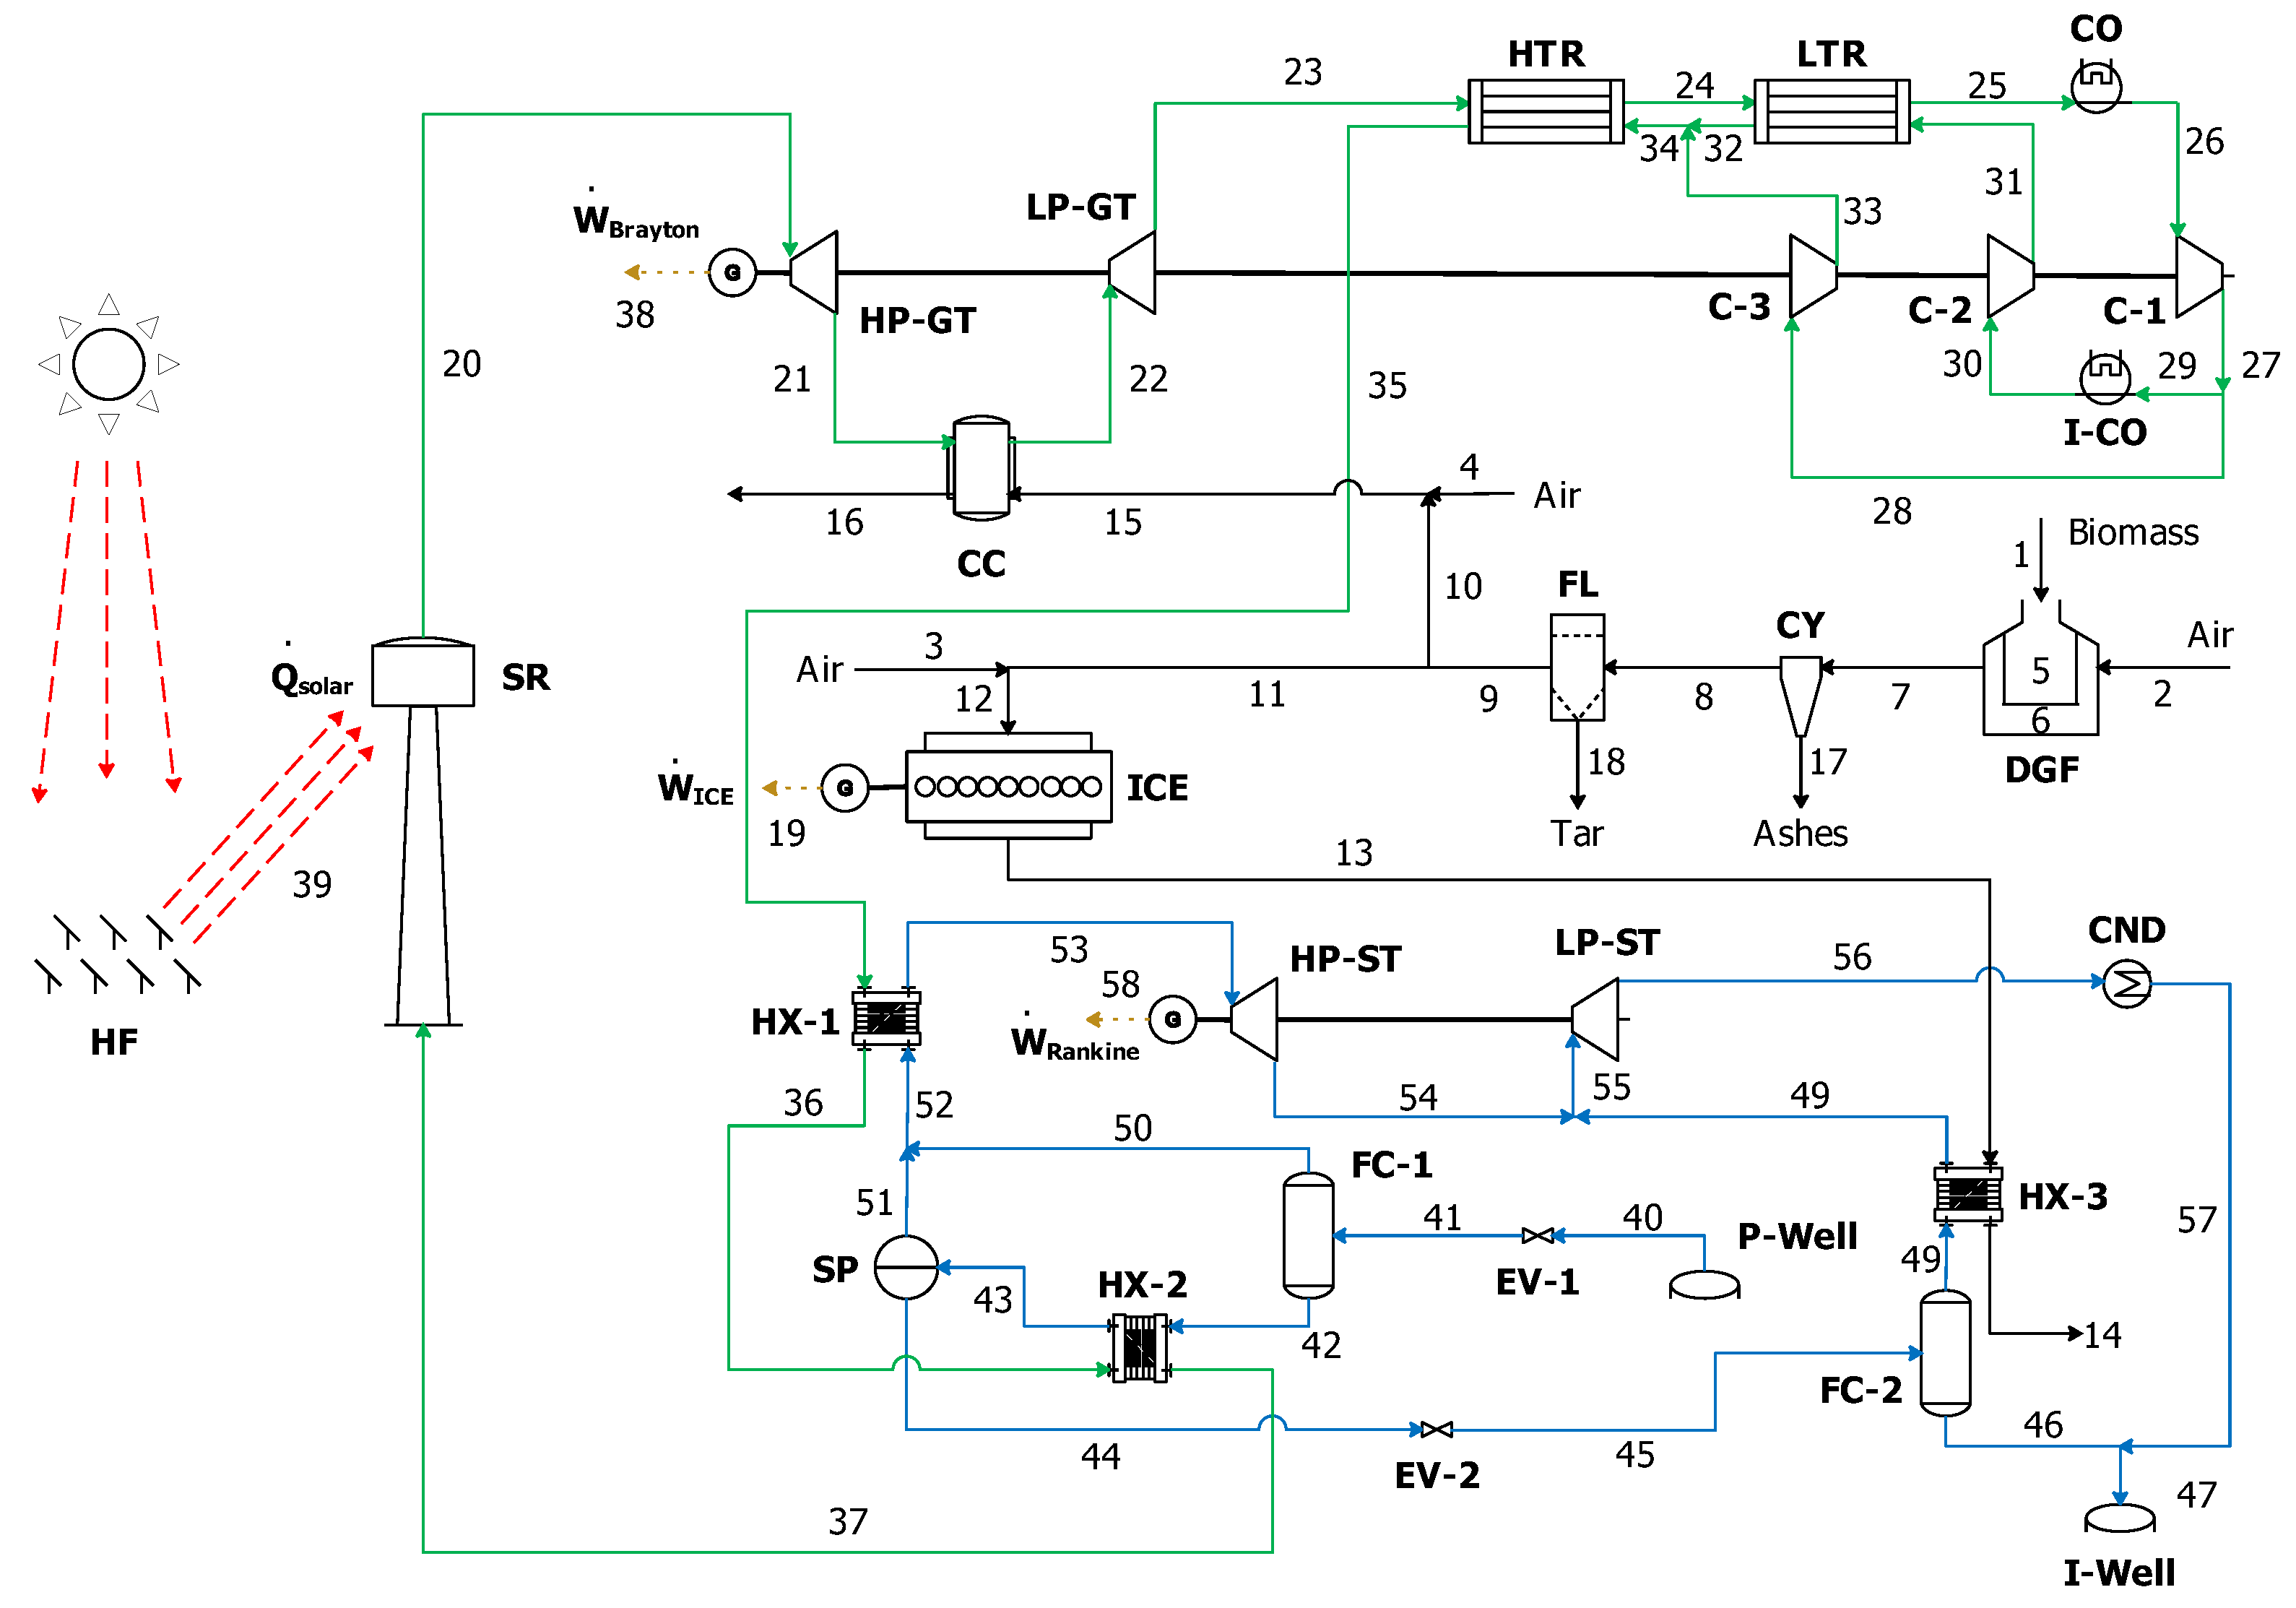
Figure 1. Schematic diagram of the integrated polygeneration power system under study.
Energies 17 05077 g001
Figure 2. DNI observed in the Mexicali Valley, Mexico [36].
Energies 17 05077 g002
Figure 3. Cosine efficiency of the heliostat field.
Energies 17 05077 g003
Figure 4. Optical efficiency of the heliostat field.
Energies 17 05077 g004
Figure 5. Solar flux profile at the receiver.
Energies 17 05077 g005
Figure 6. Effect of the gasification temperature on the syngas LHV and production rate m3 of syngas/kg of biomass.
Energies 17 05077 g006
Figure 7. Effect of the gasification temperature on the first and second law efficiencies of the gasification system.
Energies 17 05077 g007
Figure 8. Effect of ξ on the syngas LHV and production rate of the gasification system.
Energies 17 05077 g008
Figure 9. Effect of ξ on the energetic and exergetic efficiencies of the gasification system.
Energies 17 05077 g009
Figure 10. Effect of T GTI on the energetic and exergetic efficiencies of the Brayton cycle.
Energies 17 05077 g010
Figure 11. Effect of γ on the energetic and exergetic efficiencies of the Brayton cycle.
Energies 17 05077 g011
Figure 12. Effect of ϕ 1 on the energetic and exergetic efficiencies of the Brayton cycle.
Energies 17 05077 g012
Figure 13. Effect of ϕ 2 on the energetic and exergetic efficiencies of the Brayton cycle.
Energies 17 05077 g013
Figure 14. Effect of P sep 1 on the energetic and exergetic efficiencies of the Rankine cycle.
Energies 17 05077 g014
Figure 15. Effect of P sep 2 on the energetic and exergetic efficiencies of the Rankine cycle.
Energies 17 05077 g015
Figure 16. Percentage of exergy destruction rates by component.
Energies 17 05077 g016
Table 1. Characteristics of Cerro Prieto geothermal reservoir [30].
Well
No.
Temperature
[°C]
Production
[Ton/h]
Enthalpy
(kJ/kg)
1305201300
2322531520
3333491620
4320571461
Table 2. Technical specifications of the ICE.
ParameterValueUnits
Nominal power, W ˙ I C E 1000kW
Syngas pressure, P syn 3–5kPa
Exhaust gas temperature, T esc 600°C
Nominal rotational velocity, ω 720RPM
Compression ratio, C R 9:1-
No. of cylinders, z9-
Diameter, d0.300m
Stroke, b0.380m
Displacement, l0.242m3
Table 3. Conditions considered for the operation of the concentrating solar tower.
VariableValue
Location115°14′ W; 32°25′ N
Direct normal irradiation, DNI941 W/m2
Unitary heliostat size 6 × 6 m
Solar cone angle, δ 0.005 rad
Coefficient of convection, h conv 10 W/m2 K
Absorptivity, α 0.95
Thermal emissivity, ε 0.85
Fouling factor, θ R d 0.95
Reflectivity factor, θ R f 0.95
View factor, θ view 1
Convective loss factor, L conv 1
Table 4. Operating conditions of the Brayton and Rankine cycles [11,19].
VariableValueUnits
Rankine Cycle
HP-ST efficiency, η t D 85%
LP-ST efficiency, η t D 85%
First flash pressure, P s e p 1 0.8668MPa
Second flash pressure, P s e p 2 0.2768MPa
Brayton Cycle
HP-GT efficiency, η GT 93%
LP-GT efficiency, η GT 93%
C-1 efficiency, η GC 89%
C-2 efficiency, η GC 89%
C-3 efficiency, η GC 89%
Heat exchanger effectiveness, ϵ 95%
CO2 max pressure, P C O 2 25MPa
CO2 split fraction, γ 0.8606-
Gas turbine inlet temperature, T TIT 700°C
Initial temperture difference, T ITD 20°C
Table 5. Upper and lower bounds of the decision variables.
Decision
Variable
Lower
Bound
Guess
Value
Upper
Bound
Solar tower system
H Tower 150200
H Receiver 11050
D Receiver 11050
s-CO2 Brayton cycle
T G I T 600 °C700 °C800 °C
ϕ 1 1.51.6622.5
ϕ 2 1.52.3172.5
γ 0.50.86060.9
Rankine cycle
P sep 1 500 kPa1200 kPa1500 kPa
P sep 2 150 kPa395 kPa450 kPa
ICE cycle
T gas 600 °C700 °C800 °C
ξ 0.20.350.5
Table 6. Optimum results for the design and performance of the concentrating solar tower.
VariableValueUnits
Tower height73.71m
Receiver height1.86m
Diameter of the receiver6.91m
Number of heliostats1116-
Total area of heliostats38,971m2
Cosine efficiency88.06%
Attenuation efficiency97.70%
Intersection efficiency78.34%
Shadow efficiency100.00%
Locking efficiency99.35%
Reflectivity efficiency90.25%
Optical efficiency57.41%
Incident heat rate on the heliostats36,632kW
Heat rate absorbed by the receiver21,031kW
Heat rate transmitted to the working flow19,822kW
Incident flux on the receiver549.23kW/m2
Table 7. Chemical analysis of the pine wood.
ElementDry BaseHumid Base
(%)(%)
C45.739.9
H6.94.9
O42.036.5
N00
S00
Humidity013.2
Ashes5.45.5
Total100100
Table 8. Chemical composition of the syngas produced.
ConstituentSymbolContent
Hydrogen H 2 21.53%
Nitrogen N 2 40.65%
Carbon monoxide CO 17.22%
Carbon dioxide CO 2 11.20%
Methane CH 4 0.65%
Water H 2 O 8.76%
Table 9. Performance of the integrated power system.
System η I  
(%)
η II  
(%)
W ˙  
(MW)
η I  
(%)
η II  
(%)
W ˙  
(MW)
Individual
Performance
Optimized
System
Solar Tower78.7--76.4--
Gasifier69.748.2-83.954.7-
Brayton41.422.410.943.828.615.0
Rankine17.416.34.218.717.24.6
ICE9.619.21.010.120.51.0
Overall31.525.716.138.830.920.6
Disclaimer/Publisher’s Note: The statements, opinions and data contained in all publications are solely those of the individual author(s) and contributor(s) and not of MDPI and/or the editor(s). MDPI and/or the editor(s) disclaim responsibility for any injury to people or property resulting from any ideas, methods, instructions or products referred to in the content.