Article

Loss and Thermal Analysis of a High-Power-Density Permanent Magnet Starter/Generator

by
Xiaojun Ren
*,
Zhikai Chen
,
Rui Du
and
Ming Feng
Fluid and Monitoring Laboratory, School of Mechanical Engineering, University of Science and Technology Beijing, Beijing 100083, China
*
Author to whom correspondence should be addressed.
Energies 2024, 17(20), 5049; https://doi.org/10.3390/en17205049
Submission received: 13 September 2024 / Revised: 30 September 2024 / Accepted: 3 October 2024 / Published: 11 October 2024
(This article belongs to the Special Issue Energy, Electrical and Power Engineering: 3rd Edition)

Abstract

:
Reducing heat and improving the overall operation stability of the motor play a key role in the design of a starting engine. This paper focuses on the loss and thermal analysis of a permanent magnet (PM) brushless machine used in starter generators. The loss of the starter generator was calculated through a combination of theoretical analysis and the finite element method. A thermal analysis model was established based on the division of the fluid domain, boundary grid, heat source setting, and so on. The temperature fields of the whole motor and the main components were calculated and analyzed. The main factors affecting the air cooling effect were analyzed, including air flow rate, air temperature, and motor speed. A prototype experimental platform of the SG motor was built. The efficiency and temperature rise in the motor were tested. The temperature values were compared with the calculated values. The experimental results show that the performance of the motor is excellent, and the error between the temperature and the design calculation is less than 10% under each load torque. The accuracy of the thermal analysis method is verified. The correctness of the motor transient model was also confirmed through a temperature rise experiment under rated conditions, providing a research basis for improving operation efficiency.

1. Introduction

Aircraft engines not only supply propulsion for the aircraft but also need to convert part of the mechanical energy into the secondary energy required by the aircraft, such as electric energy, air pressure energy, and so on [1]. While these secondary energy technologies have made significant advancements in recent years, each type of secondary energy requires its own separate system for distribution and conversion. This results in extensive energy recycling within the aircraft, leading to constrained cabin space and escalating maintenance costs, ultimately impeding aircraft development [2,3]. The transportation industry, represented by aerospace, ships, and vehicles, is currently undergoing an electrification revolution in order to reduce carbon dioxide emissions and improve energy utilization [4]. This revolution includes the development of pure electric aircraft, hybrid aircraft, and multi-electric aircraft [5]. The advancement of fully electric aircraft (FEA) and multi-electric aircraft (MEA) not only simplifies the electrical systems of aircraft and enhances their aerodynamic characteristics, but also results in lightweight aircraft with improved fuel economy. With these advantages, it is anticipated that multi-electric and all-electric aircraft will become the dominant trend in the aviation industry [6,7].
The starter generator (SG) is a key component of an aviation starter generation system [8,9]. The permanent magnet synchronous motor (PMSM) offers significant advantages in aviation starting power generation systems due to its superior power density, efficiency, minimal losses, and compact dimensions [10,11]. This is of paramount significance for the miniaturization and lightweight optimization of the system [12,13]. Loss and thermal loss are closely related to the performance of PM starter generators, such as power density and efficiency [14]. According to different motor models, the methods for calculating temperature rise vary. The average temperature rise in the motor can be calculated using Newton’s heat dissipation formula [15]. This method is straightforward in calculation and suitable for traditional motors with uncomplicated operating conditions. The thermal path method involves converting the dispersed heat source in the motor into several concentrated heat sources, transforming the contact between different modules into equivalent thermal resistance, and constructing a thermal path model of the motor by simulating the circuit model [16]. Kirchhoff’s law is utilized to establish heat balance equations for different modules in the motor, and the average temperature rise in each module is calculated by solving linear circuits, which provides more accurate results compared to simplified formula methods [17]. By considering only the axial conduction of heat along the motor, segment-equivalent heat paths were used to establish heat transfer equations between adjacent nodes. The temperature rise in asynchronous motors was then calculated using the Gaussian elimination method with accuracy verified through experiments [18]. Based on the thermal network method, the calculation program was divided into two parts—the cooling thermal network and uncooled thermal network—for an iterative solution. The applicability of this method to calculate temperature rise in an air-cooled motor is demonstrated by experiments [19]. Thermal resistance values for each component in a hybrid rotor two-stator motor with a complex structure were derived and the thermal network model was established [20]. An effective cooling method is essential for increasing the power density of PM machines, especially for concentrated winding PM machines [21]. In concentrated winding PM machines, the highest temperature is focused on the middle of the stator slot due to the long heat-transfer path [22]. To reduce the winding temperature in the stator slot, a water-cooled direct winding heat exchanger was proposed to directly extract heat from the winding [23]. Additionally, a stator cooling tooth with a back iron part extended into the stator slot was designed as a means to reduce the difficulty and cost of heat dissipation [24]. Previous research on improving the power density of PM machines has focused on optimizing their electromagnetic performance and developing novel cooling methods, which makes it difficult to balance their electromagnetic and temperature characteristics. However, high-speed starter generators generally have more intricate structures and advanced heat transfer mechanisms, rendering them inaccurate for calculating the temperature rise in a motor using a simplified formula method.
Generally, the performance analysis of a motor body includes magnetic field distribution, loss analysis, thermal analysis, and cooling analysis. The calculation of magnetic field distribution and loss is the basis of the thermal analysis. The cooling analysis is used to improve the temperature distribution. This paper focuses on the thermal analysis and temperature distribution of an SG motor. Firstly, the system composition of the SG motor was introduced briefly; secondly, the loss of the SG motor was calculated; and thirdly, a thermal analysis model was established—the overall steady-state temperature field distribution was given, and the temperature fields of key components were calculated. Fourthly, the cooling system design for the motor was completed. An analysis was conducted on three factors that affect air cooling efficiency: air flow rate, air temperature, and motor speed. Subsequently, a prototype was fabricated, an experimental platform was established, and tests were conducted to evaluate the motor load and temperature rise in order to validate both the motor’s performance and the accuracy of the thermal analysis.

2. System Composition of the SG Motor

The starter generation system utilizes the reversible principle of the motor to enable dual use of the aircraft power system generator. The structure of the SG is shown in Figure 1. When the machine is energized, it functions as a motor converting electrical energy into mechanical energy. Conversely, when the machine is rotated and towed, it operates as a generator converting mechanical energy into electrical energy. A permanent magnet synchronous motor has the advantages of high power density, high efficiency, and small volume and weight, which have great potential for application in aviation starting power generation systems. Therefore, the starter generator used in this paper utilized a permanent magnet motor with an external rotor configuration. Figure 2 shows the topology of the motor. To ensure enhanced stability in output torque during startup and optimize stator slot space utilization, an 8P9S architecture (eight poles and nine slots) was implemented for the starter generator.
The main parameters of the starter generator are listed in Table 1.

3. Loss Calculation and Analysis

During motor operation, the higher the loss, the greater the corresponding temperature rise, which may lead to inter-turn short circuits and other faults. As the insulation layer of the winding ages, the likelihood of inter-turn short circuits gradually increases, impacting motor lifespan and reducing operational efficiency.

3.1. Magnetic Field

The iron loss of the SG motor is closely related to its magnetic density waveform and variation frequency. The establishment of a starter generator electromagnetic simulation model using Maxwell 2D is illustrated in Figure 3. It can be observed from Figure 3a that the maximum magnetic field strength in the stator is approximately 1.65 T at the top of the tooth, and the maximum magnetic field strength in the yoke is 1.19 T, which does not exceed the magnetic saturation density of the silicon steel sheet material. The magnetic field line distribution cloud map obtained by the simulation of the starter generator is presented in Figure 3b. It can be seen that there are a small number of magnetic field lines in the stator slot, and the remainder of the magnetic field lines are distributed regularly, without a large-scale magnetic leakage phenomenon.

3.2. Iron Loss

The motor iron loss is influenced not only by the alternating magnetic field but also by the rotating magnetic field. Failure to consider the impact of the rotating magnetic field on motor iron loss will result in significant calculation errors. Therefore, we decomposed the rotating magnetic field into two orthogonal quantities for equivalent calculation.
B t = B r t + B t t
where Br represents the radial flux and Bt represents the tangential flux.
The magnitude of iron loss is not only dependent on the magnetic flux density of the core but also on the operating frequency. The formula for iron loss (W/kg) at each subdivision point of the prototype is as follows:
P F e ( e l ) = P h ( e l ) + P c ( e l ) P h ( e l ) = K h f 1 k = 1 m k B k max α + B k min α P c ( e l ) = K e f 1 2 k = 1 m k 2 B k max 2 + B k min 2
where P F e ( e l ) , P h ( e l ) , and P c ( e l ) denote the iron loss, hysteresis loss, and eddy current loss of the element, respectively; Kh and Ke are the coefficients of core hysteresis and eddy current loss, respectively; f1 is the fundamental frequency of stator and rotor magnetic density; k denotes the kth harmonic; Bkmax and Bkmin are the major and minor magnetic density components of the kth harmonic; and α is related to the magnetic density of different motors.
The formula for calculating the iron loss of the whole motor is as follows.
P F e = i = 1 j P h ( e l ) + P e ( e l ) ρ F e L F e A e l
where ρ F e represents the magnetic density of the motor core; LFe represents the axial length of the motor; A e l represents the area of the subdivision unit; and j denotes the number of subdivision cells.

3.3. Copper Loss

Winding copper loss is an important part of SG motor loss, which is mainly divided into DC copper loss and AC copper loss. It can be calculated as
P a c = P d c + P a d
where P a c represents the ac copper loss, P d c represents the dc copper loss, and P a d represents the additional eddy current loss.
The DC copper loss P d c is calculated as
P d c = m I 2 R P
where m represents the number of stator winding phases; I represents the RMS (root mean square) value of the current; and R p represents the winding resistance of each phase.
The additional eddy current loss P a d is calculated as follows.
p a d = P d c k d 1
where kd represents the coefficient of resistivity.

3.4. Wind Friction Loss

The wind friction loss is attributed to the aerodynamic drag between the rotor surface and the surrounding air during motor rotation. This can be alleviated by optimizing the rotor structure to minimize aerodynamic contact area. It can be calculated as
P a f = k r C f π ρ a ω r 3 r 4 l
where kr and Cf are the surface roughness coefficient and friction coefficient of the rotor; ρa is the air density; and ωr, l, and r are the angular velocity, axial length, and radius of the rotor, respectively.
The friction coefficient is calculated as follows.
C f = 0.0152 Re δ 0.24 1 + 8 7 2 4 Re a Re δ 2 0.38
The radial and axial Reynolds coefficients are expressed as follows.
Re δ = ρ a ω m r δ μ a Re a = ρ a ω a 2 δ μ a
where δ is the radial length of the air gap, and va and μa are the air flow velocity and kinematic viscosity, respectively.

3.5. Loss Calculation with FEM

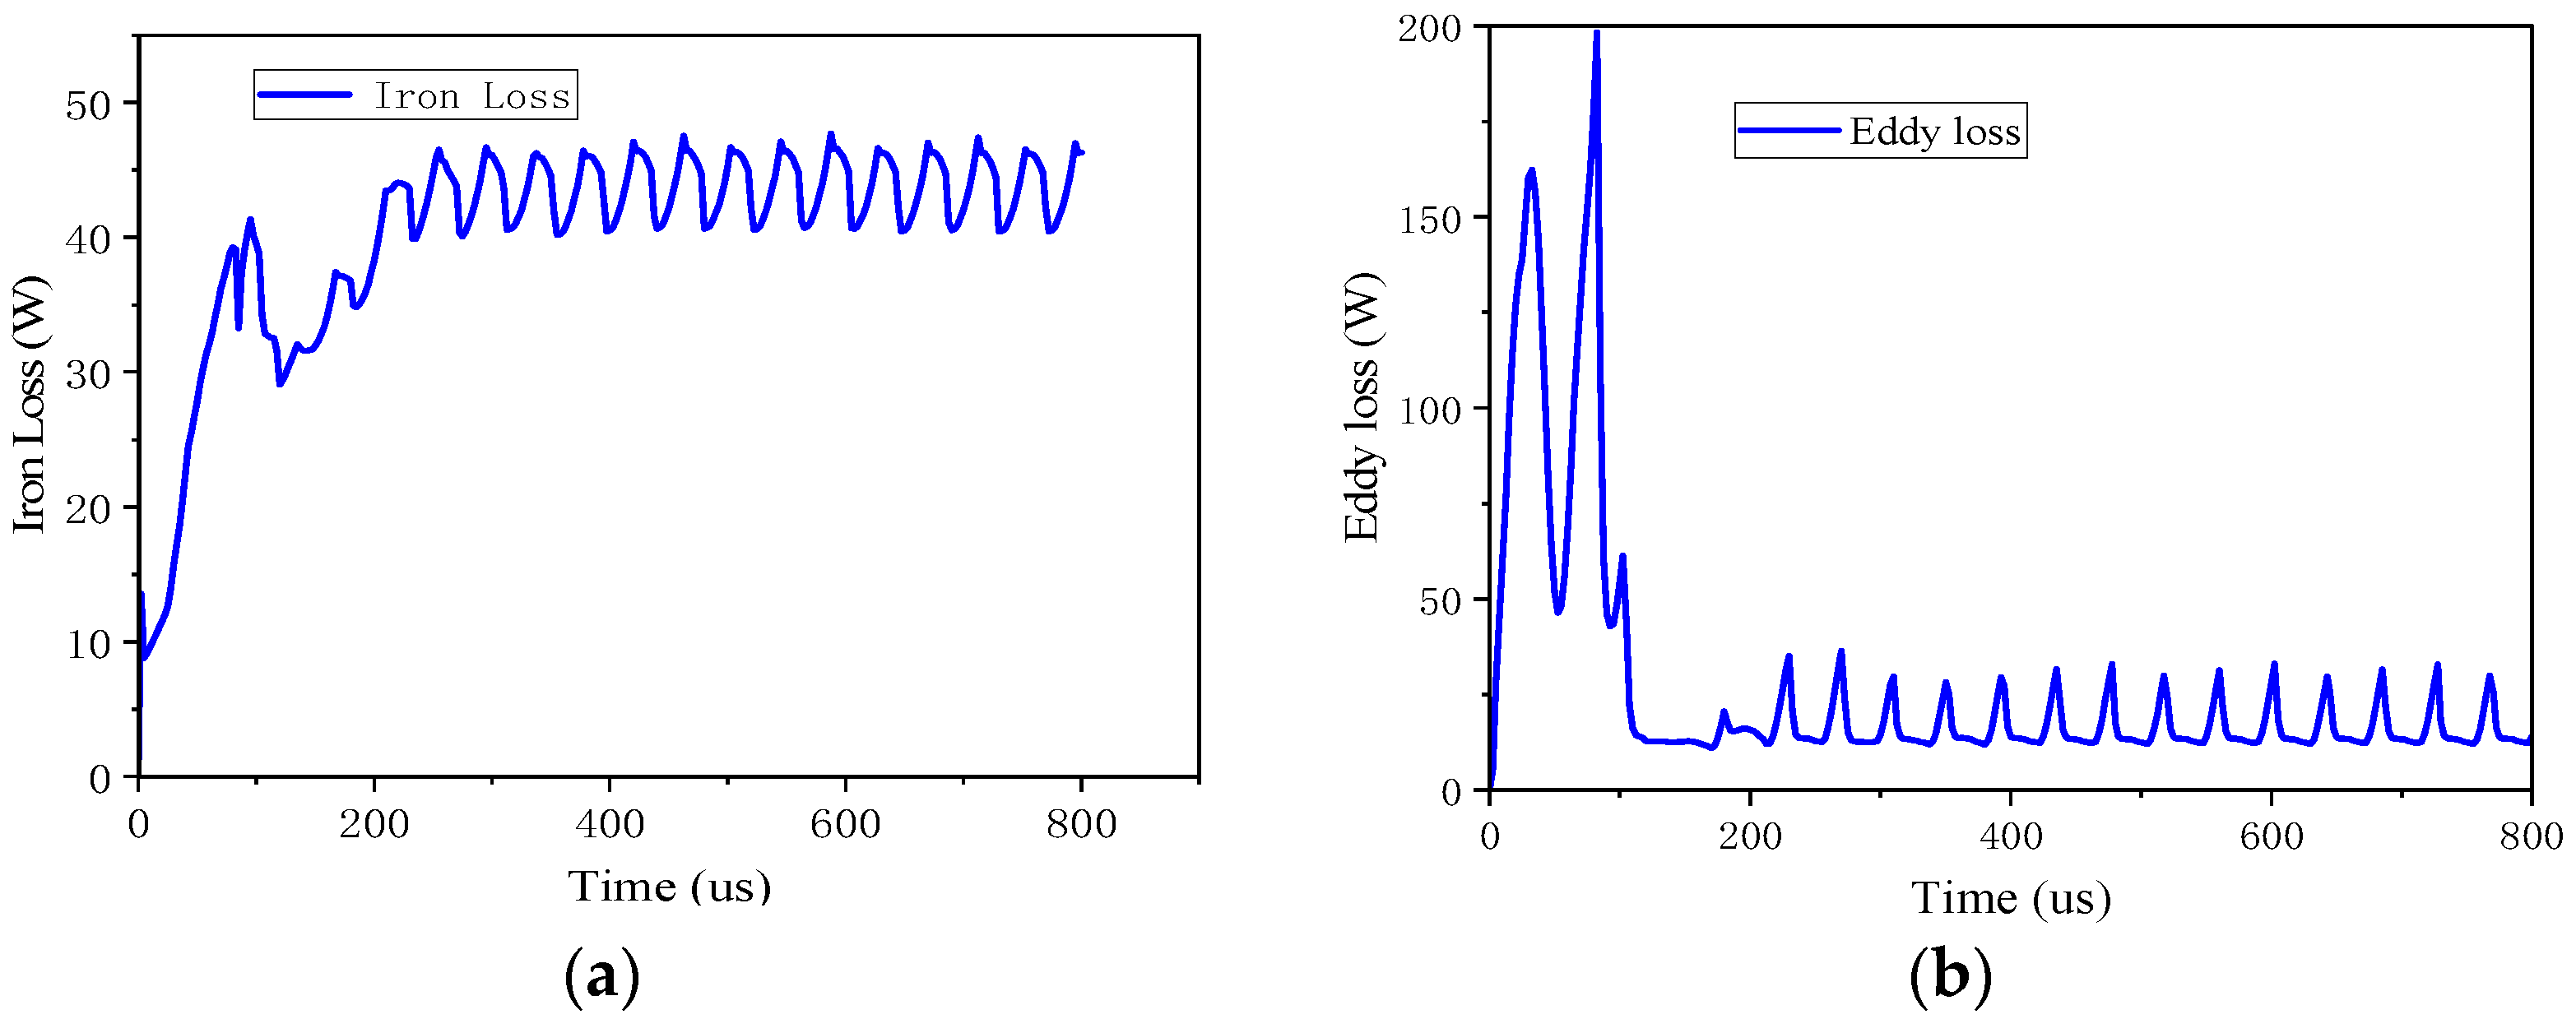
Figure 4 shows the generator’s simulation waveform of iron loss and eddy current loss. The calculated iron loss is 43.8 W, and the eddy current is 14.7 W. Based on the resistance value and phase current, the copper loss is 14.6 W and the generator’s electromagnetic efficiency is 96.06%.
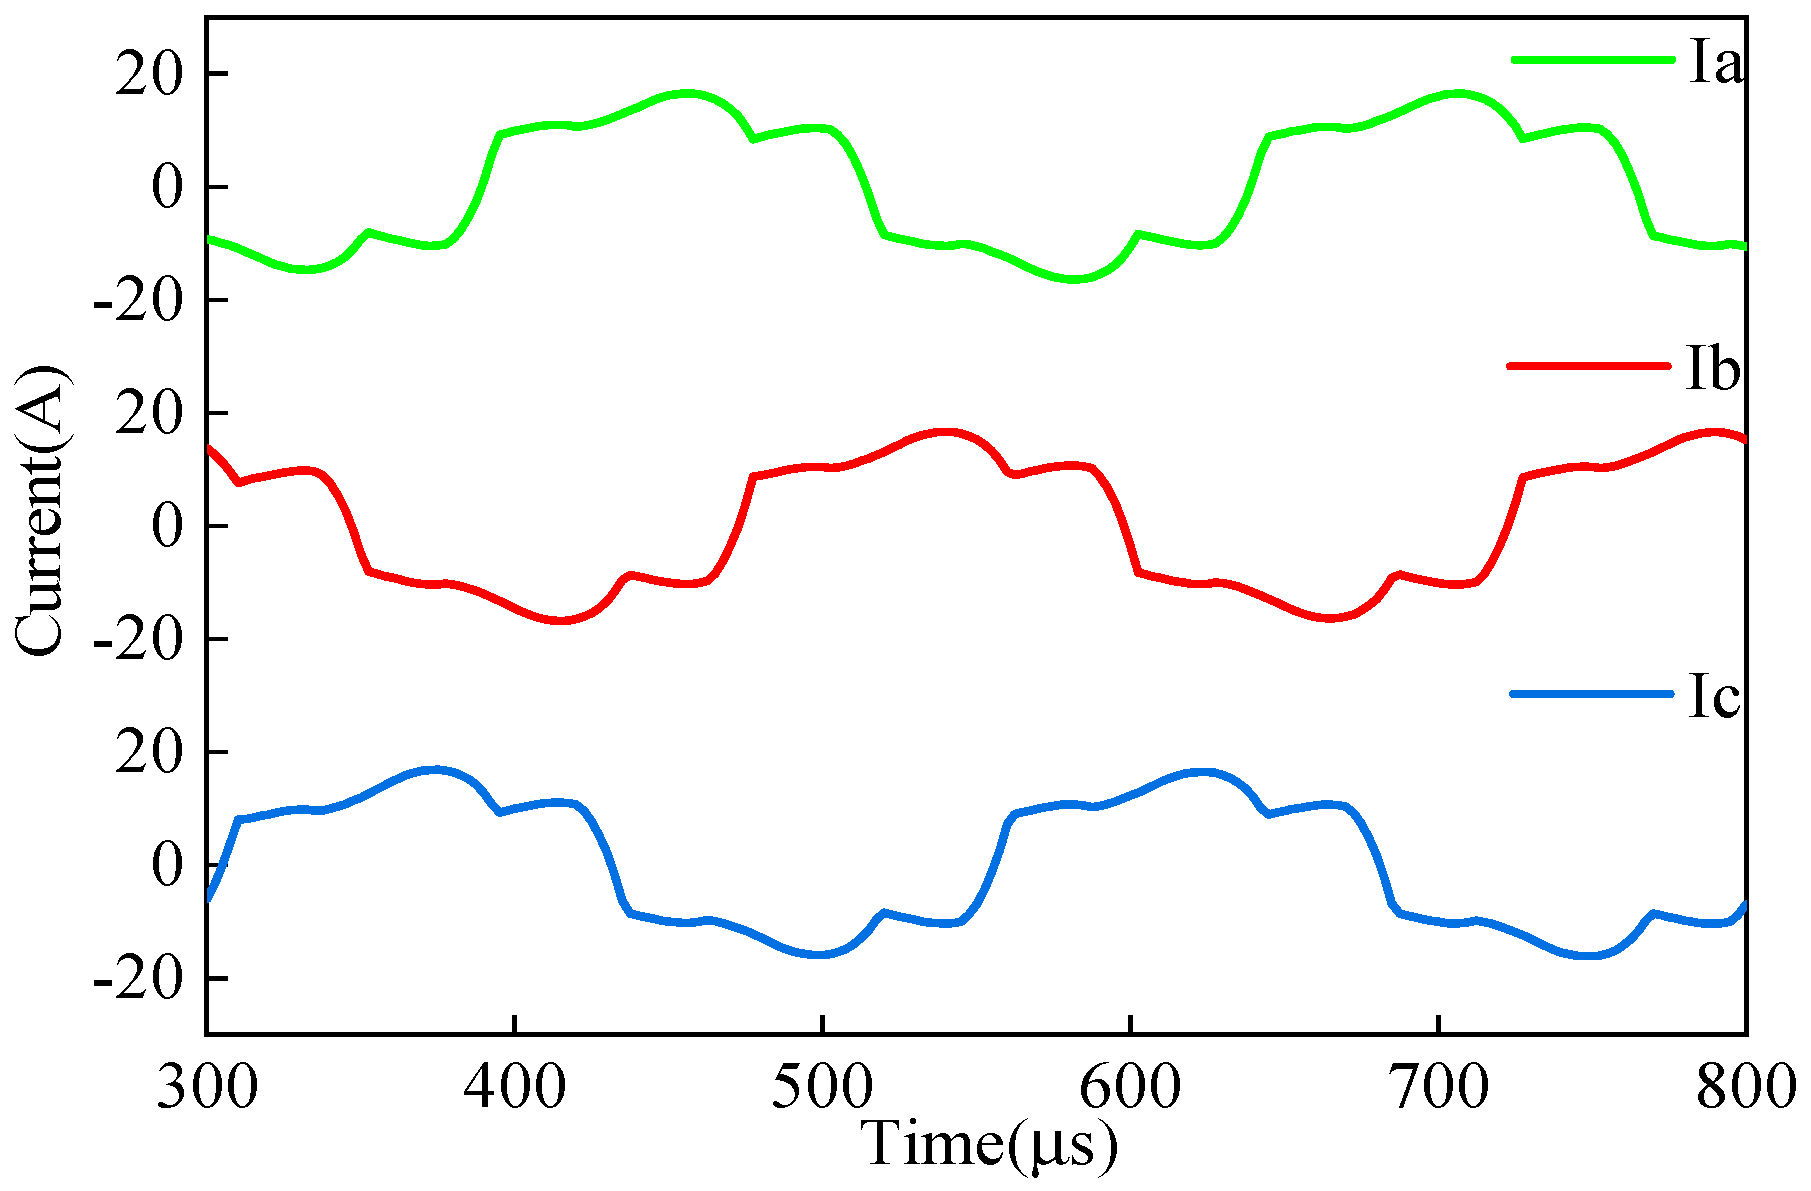
The line current waveform is shown in Figure 5 through Maxwell simulation, and the line current RMS stabilizes at 25.02 A.

4. Temperature Field Analysis

The power density of a high-speed permanent magnet starter is typically high, and this elevated power density is often accompanied by a high heat flux, resulting in a substantial increase in motor temperature. Elevating the permanent magnet’s temperature in the motor will induce demagnetization, compromising output performance and potentially resulting in irreversible magnetic degradation. Exceeding the permissible stator winding temperature may also compromise the motor’s safe operation. Hence, the accurate calculation of temperature rise is an indispensable facet of motor design.
For high-speed permanent magnet motors, the combination of high power density and high electromagnetic loss density results in a significant increase in wind and friction losses at high speeds. Additionally, the compact internal structure limits heat dissipation, leading to potential overheating issues.

4.1. Construction of Thermal Analysis Model

(1)
Fluid domains of simulation model
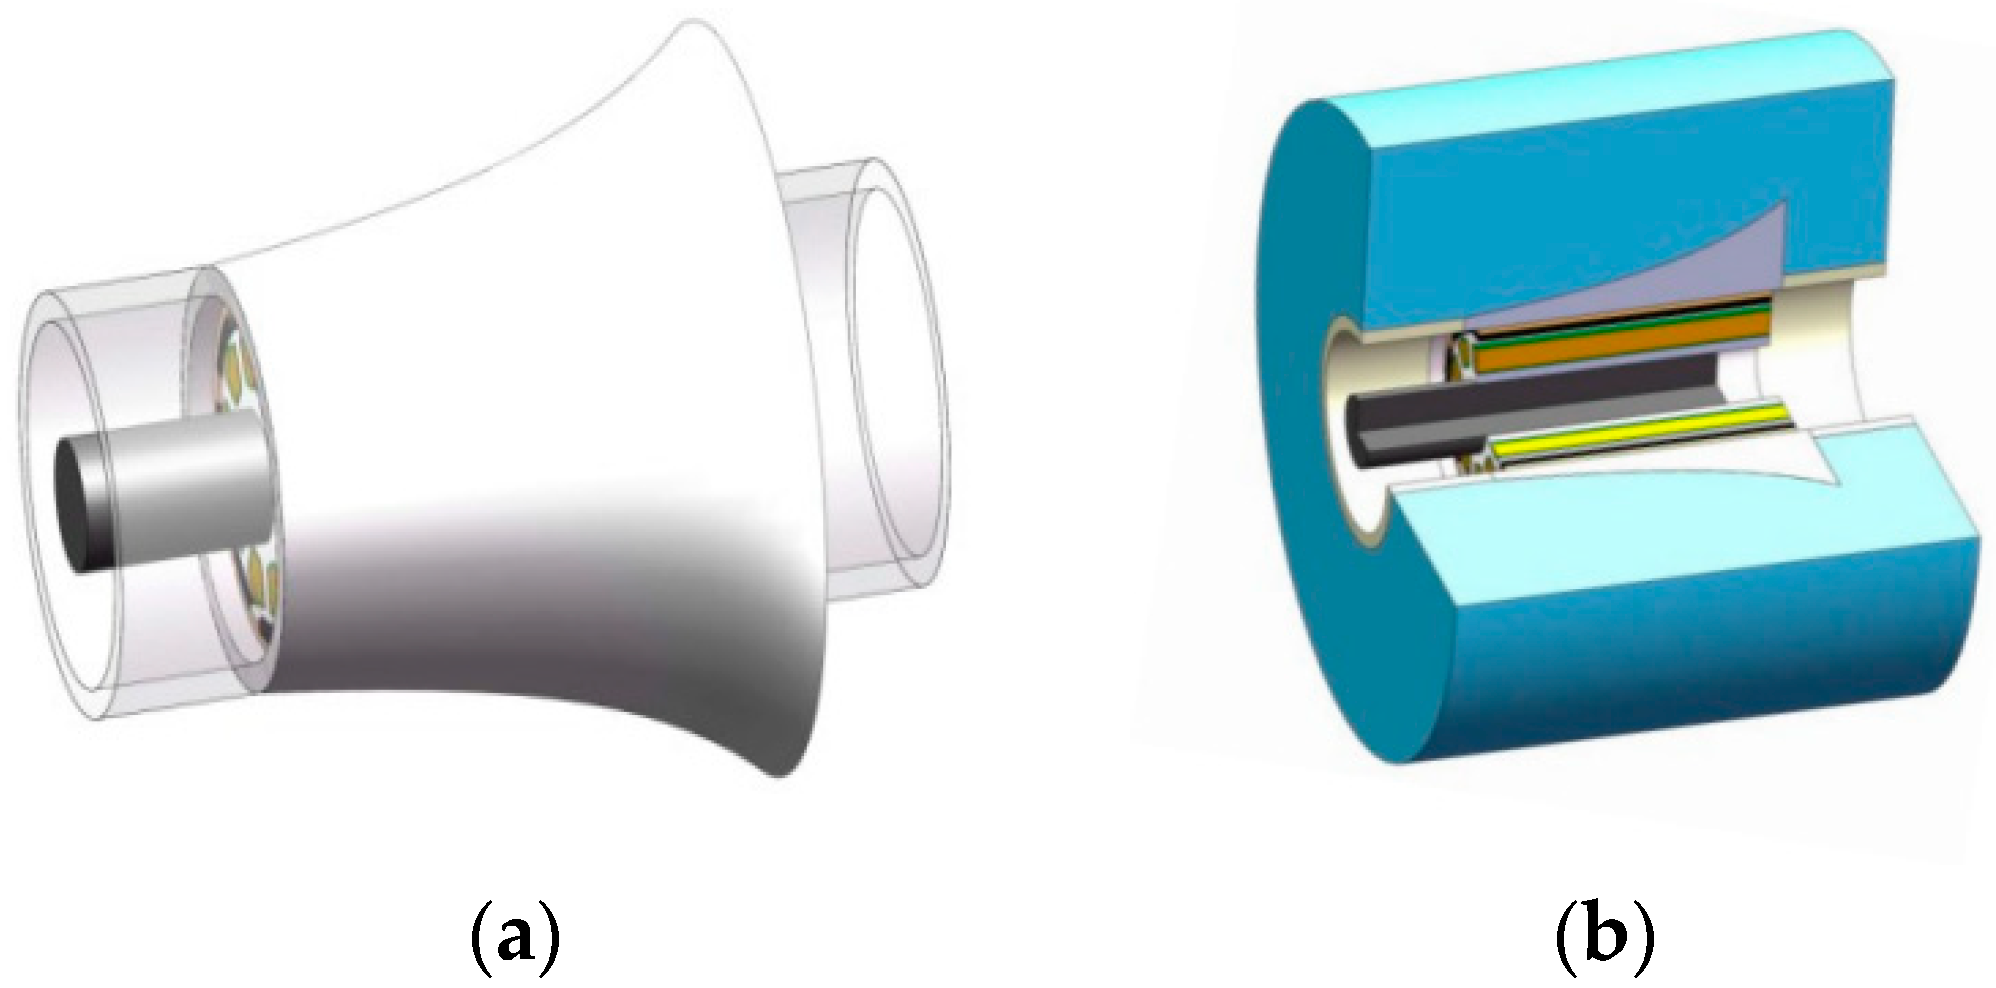
There are two fluid domains in the starter generator simulation model. One fluid domain is cooled air flowing axially along the inside of the centrifugal impeller, as shown in Figure 6a. The inlet cooling air mass flow rate was 6.7 g/s, and the temperature was 128 °C. Cool air flows in from the left side, through the entire starter generator to cool it, and then flows out from the right side. To avoid backflow and speed up convergence, the inlet and outlet gas routes were extended. The other fluid domain is the air in contact with the outer surface of the centrifugal impeller, as shown in Figure 6b. The centrifugal impeller rotates to drive the external air flow. The initial temperature of the outside air was 128 °C.
(2)
Boundary meshing
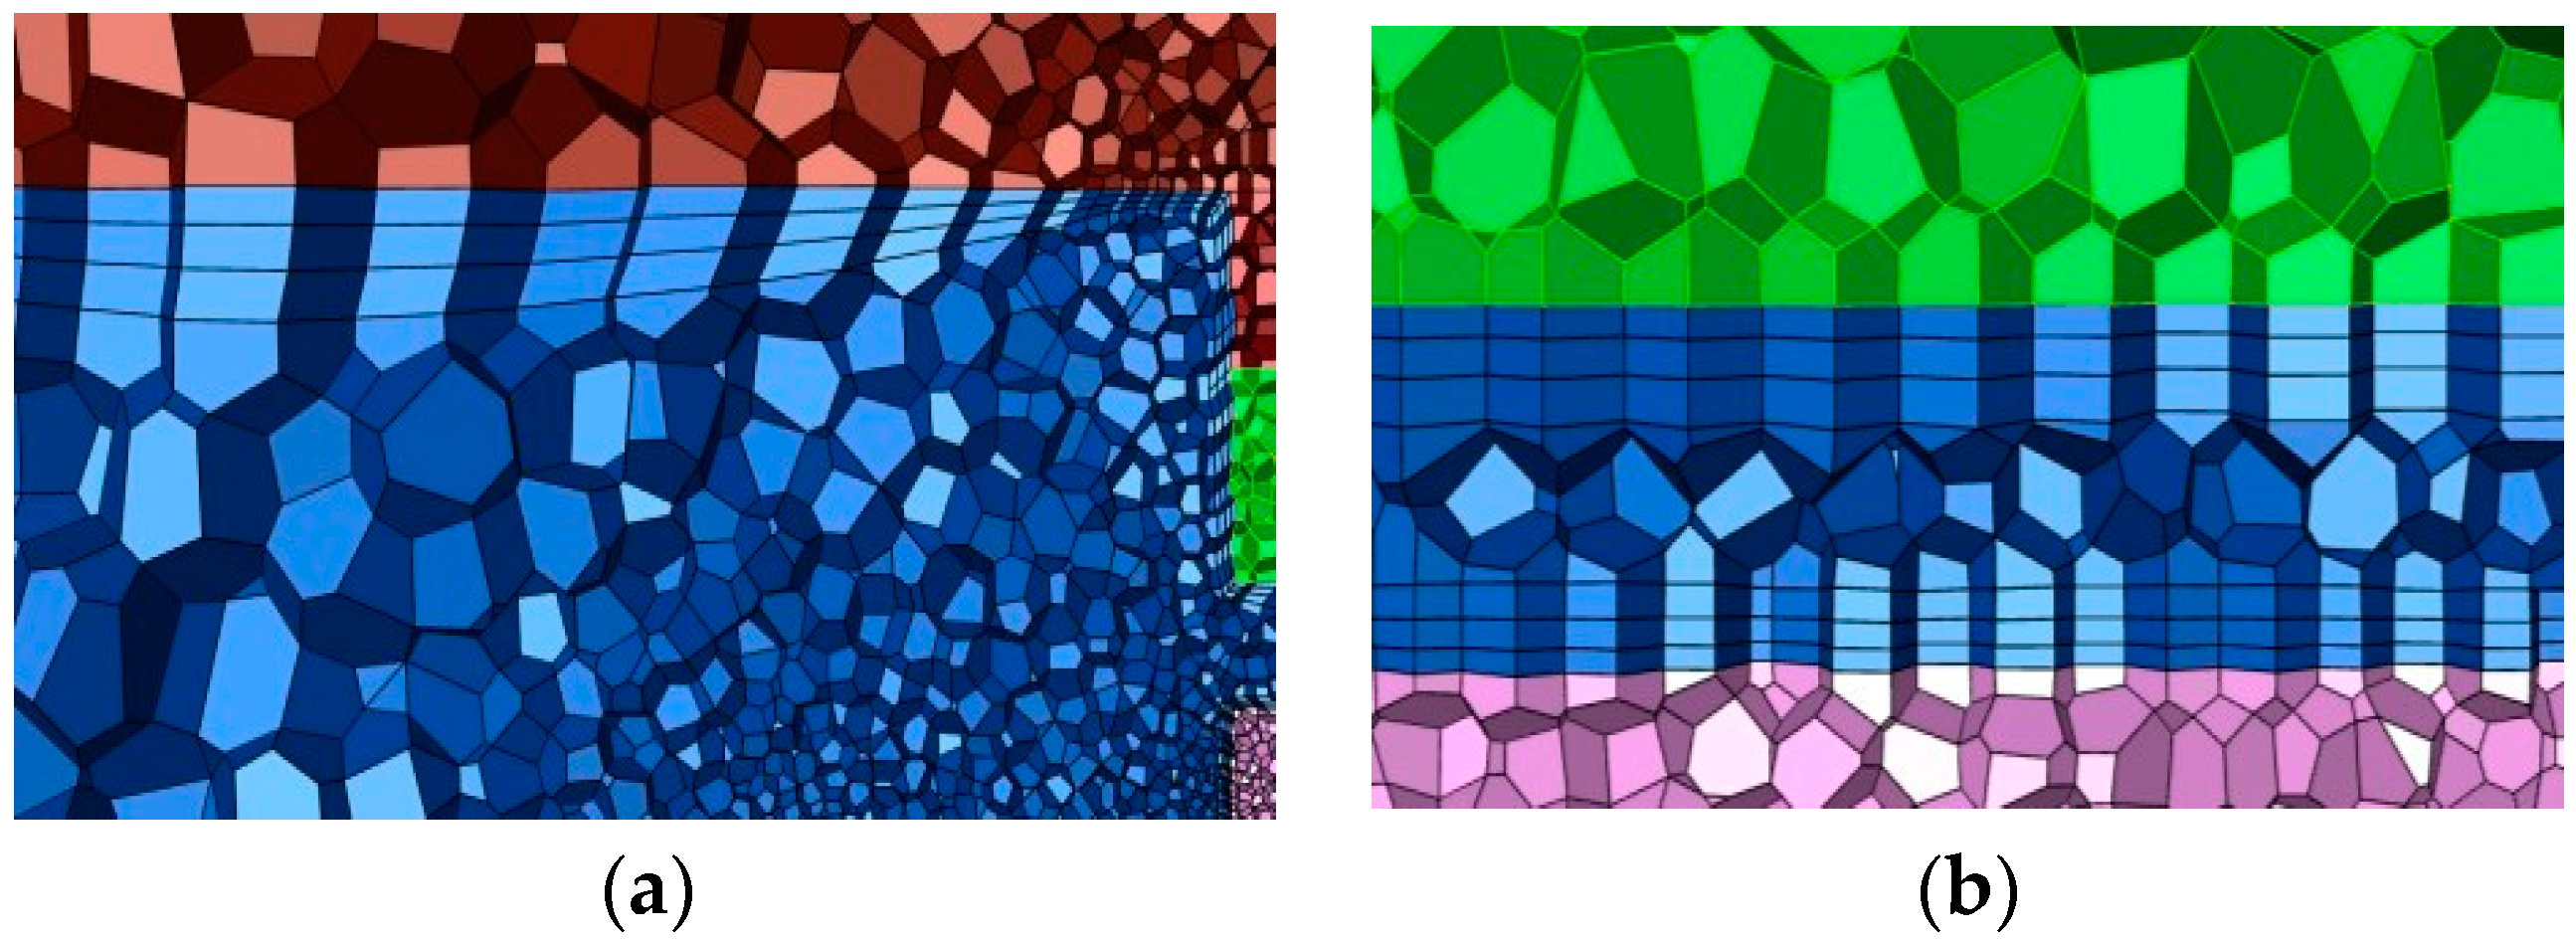
Setting appropriate mesh parameters to generate the surface mesh will directly impact the reliability and accuracy of the simulation results. The area with a large temperature gradient on the model is discretized, and ultimately, the volume grid of the starter generator model is generated based on the optimized surface grid. The air flow within the centrifugal impeller is complex due to the viscosity of air, resulting in a thin boundary layer near the solid surface experiencing shear stress and step changes in velocity. The velocity near the rotor surface matches that of the rotor, while it approaches zero near the stator surface. As one moves outward from the object’s surface, there is a gradual transition in velocity until it reaches the mainstream flow rate, representing axial flow along the centrifugal blade wheel. This thin fluid layer adjacent to the rotor surface is known as the boundary layer. To ensure more accurate calculation results, it is essential to refine the boundary layer mesh during pre-processing appropriately. Figure 7 illustrates this division of boundary layers within the air flow inside the centrifugal impeller, which is labeled by blue color.
(3)
Heat Source Setting
During the operation of the starter generator, a series of losses will be generated, which will be converted into heat energy and dissipated. The greater the loss density of the component, the higher its temperature rise, and the output performance of the starter generator will decline. Therefore, the accurate calculation of heat source distribution and reasonable loading are crucial steps in temperature field simulation calculation. The loss in the starter generator is mainly distributed in the stator, winding, protective sleeve, and permanent magnet; therefore, body heat source loading is used. The heat generation rate can be calculated as
q = P l o s s V
where P l o s s is the loss of various parts of the starter generator; and V is the effective volume of the lossy part of the starter generator.
According to the loss and Equation (10) of the starter generator under two working conditions, Table 2 illustrates the distribution of heat sources and heat generation rates in the starter generator.

4.2. Temperature Field Calculation Results

(1)
Steady-state temperature field distribution
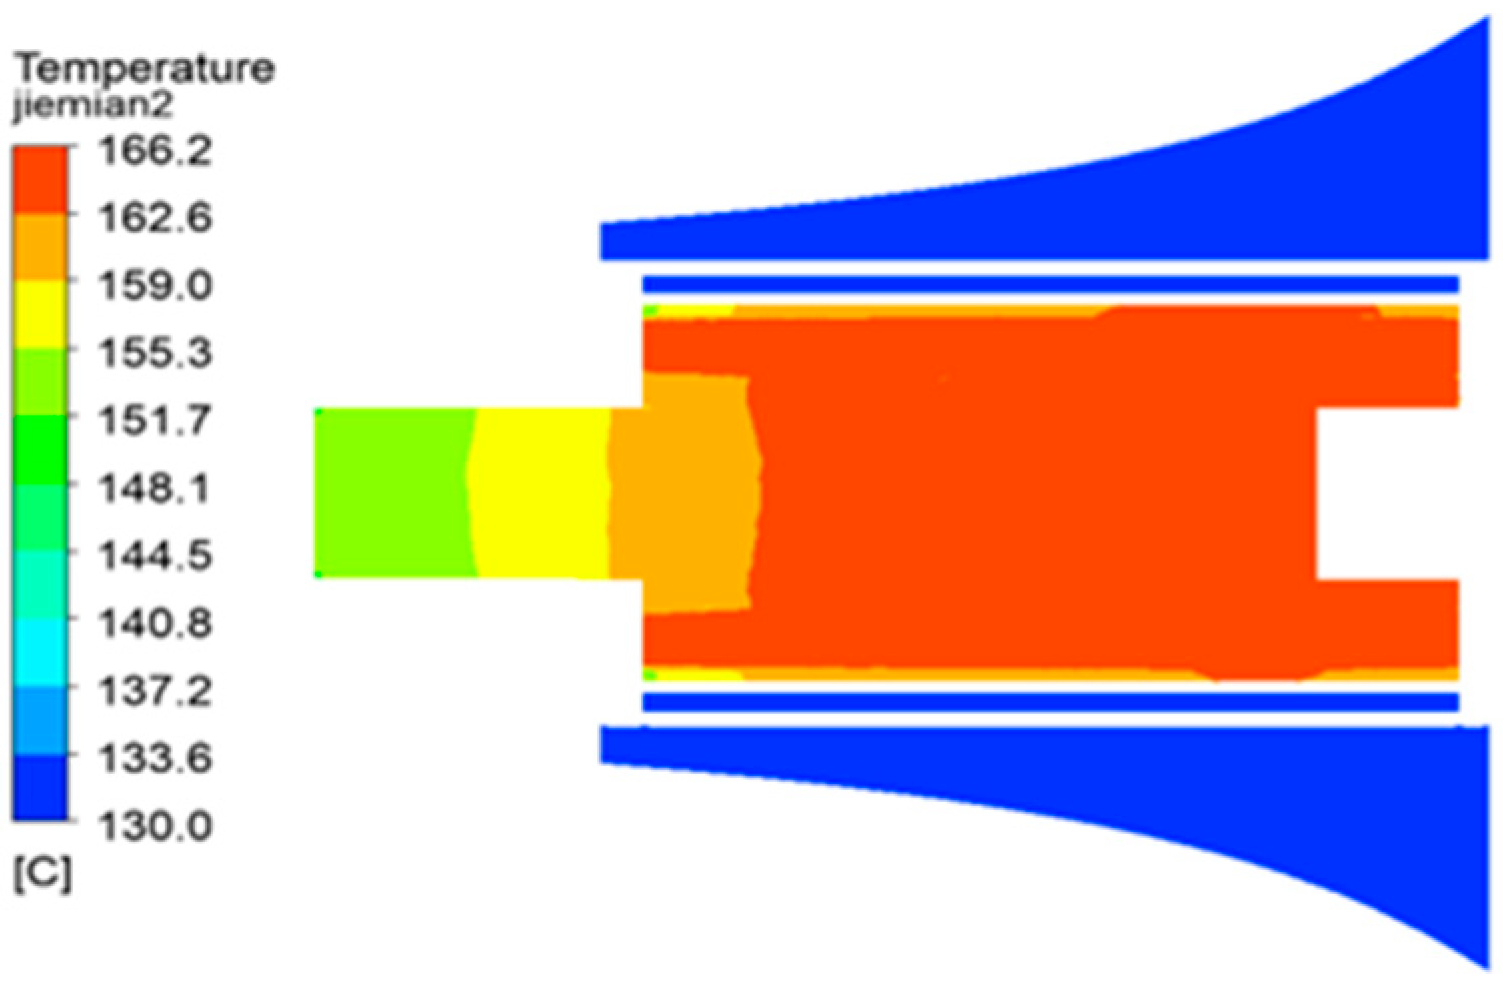
The steady-state temperature field cloud image of the starter generator section is shown in Figure 8. As can be seen from Figure 8, the highest temperatures are observed in the winding and stator of the starter generator, which can be attributed to their roles as primary heat sources and their relatively limited heat dissipation capabilities. Conversely, the protective sleeve and permanent magnet exhibit lower temperatures due to their high-speed rotation, efficient convection heat transfer with air, favorable heat dissipation conditions, low loss, and minimal heat generation.
(2)
Temperature field of centrifugal impeller
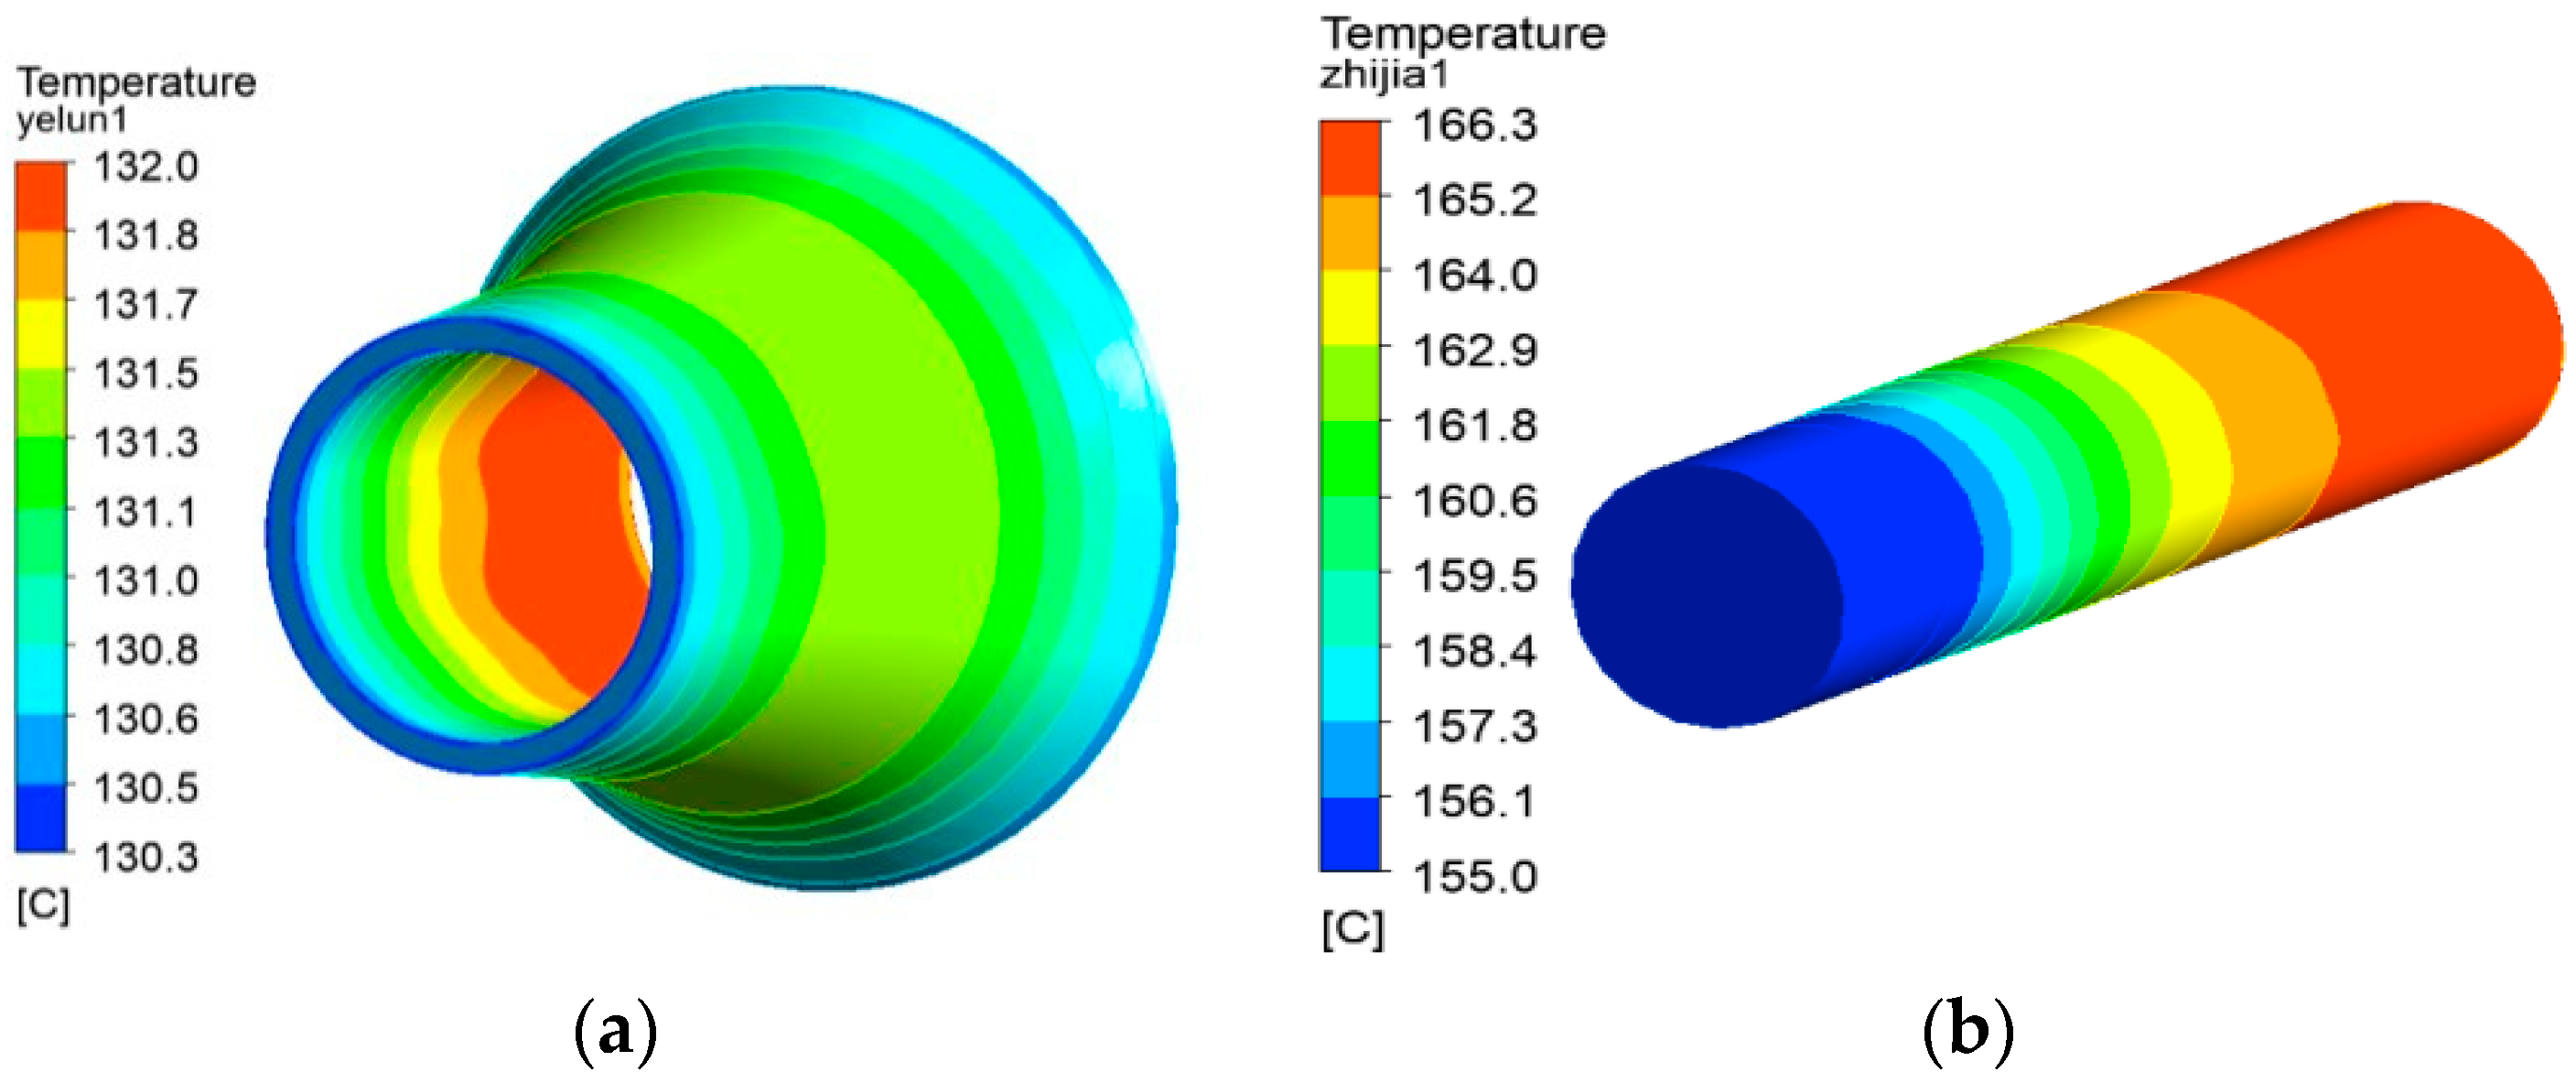
The temperature distribution of the centrifugal impeller is depicted in Figure 9a. It is evident from the illustration that the overall temperature of the impeller remains relatively low, with a peak temperature of 134 °C occurring at its midpoint. This phenomenon can be attributed to the rapid rotation of the impeller, which facilitates efficient convection heat transfer with both internal and external air, thereby ensuring favorable heat dissipation conditions.
(3)
Temperature field of the stator and winding
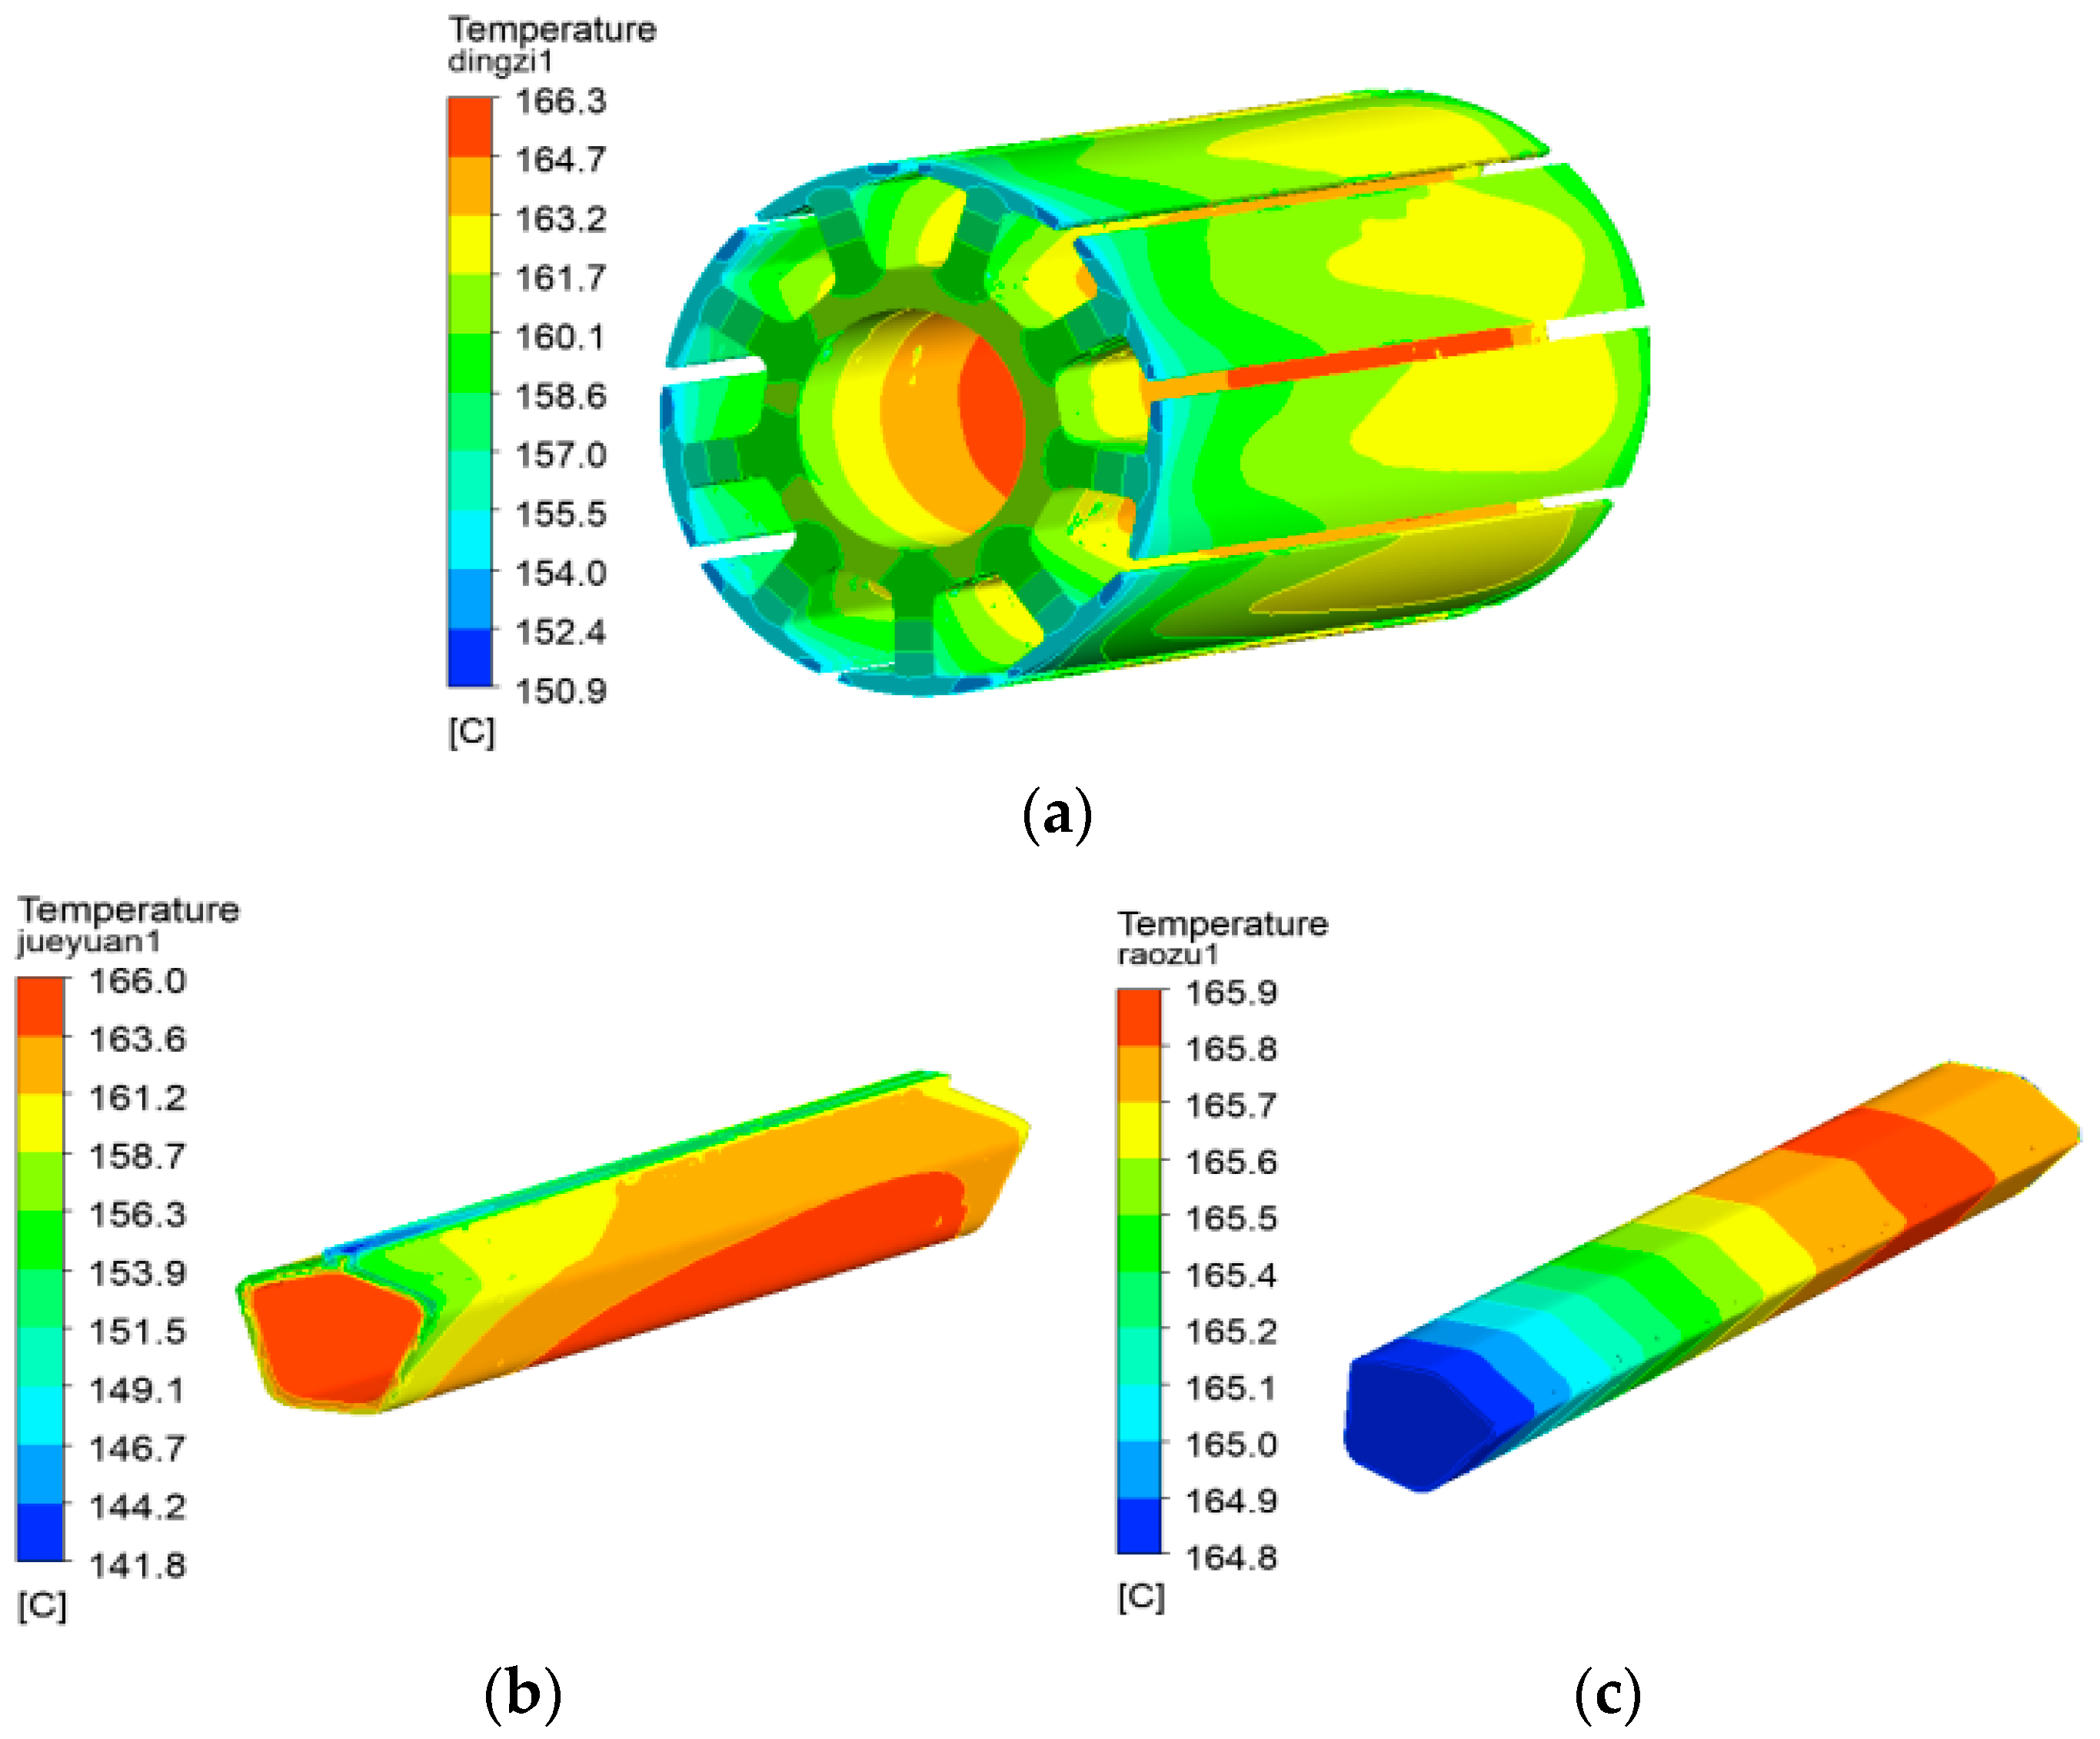
The temperature of the motor winding is closely associated with its insulation effectiveness and aging rate, making it a crucial parameter in motor design. The temperature distribution of the stator and winding is illustrated in Figure 10.
The temperature distribution of the stator core is illustrated in Figure 10a, showing that the highest temperature of 166.3 °C appears on the right part in contact with the equivalent insulation and the inner surface, while the lowest temperature of 150.9 °C appears on the left outer surface. The higher temperature on the right side can be attributed to two factors: firstly, the better cooling effect from the air inlet on the left side; secondly, the greater thermal conductivity of support compared to air, resulting in faster heat dissipation and lower temperature on the left side. The equivalent insulation is situated between the inner wall of the stator groove and the winding, with its temperature cloud map depicted in Figure 10b. Due to the winding and stator core being the primary heat sources, a maximum temperature of 166 °C is observed on the inner surface in contact with the winding and on the part in contact with the right side of the stator core. The section of equivalent insulation in contact with cooling air exhibits rapid heat dissipation, resulting in a minimum temperature of 141.8 °C on its outer surface. The significant temperature difference is attributed to low thermal conductivity, leading to a significant temperature gradient during heat transfer.
The temperature cloud diagram for the starter generator’s winding under rated working conditions is depicted in Figure 10c. The highest temperature, reaching 165.9 °C, is located on the right side of the middle of the winding. The enameled wire used in the starter generator has a maximum allowable temperature of 220 °C, indicating a significant margin for operation within the winding.
(4)
Temperature field of protective sleeve and PM
The temperature distribution of the starter generator’s permanent magnet and protective sleeve is depicted in Figure 11.
The simulation results indicate that the maximum temperature experienced by the permanent magnet is 132 °C. The permanent magnet was designed with N35UH specifications, featuring a demagnetization temperature of 180 °C. Consequently, under the rated output conditions, there is no risk of demagnetization for the permanent magnet.

5. Enhanced Analysis of Air Cool

5.1. Effect of Cooling Air Flow on Temperature

The starter generator in this paper employs air circulation for cooling. Based on fluid mechanics principles, an increase in the cooling air flow will result in a corresponding increase in the Reynolds number of the fluid, leading to improved forced convection heat transfer and a reduced overall temperature rise in the starter generator.
The temperature changes in the winding and permanent magnet under different cooling air flows are illustrated in Figure 12. It is evident from the figure that the winding temperature exhibits a decreasing trend with an increase in the cooling flow rate, although the rate of decrease slows down significantly. When the cooling air flow rate ranges from 0 to 4 g/s, the winding temperature decreases from 228.1 °C to 175.1 °C, marking a reduction of 23.2% and demonstrating a significant cooling effect. However, as the cooling air flow rate increases from 4 g/s to 10 g/s, the winding temperature only drops by 9.1%, indicating a dramatic slowdown in temperature reduction. In addition to being cooled by air, the permanent magnet undergoes forced convection heat transfer through its high-speed rotation. Consequently, the impact of cooling air flow on permanent magnet temperature rise is not as pronounced as it is for winding temperature rise. Increasing the cooling air flow rate from 0 to 2 g/s results in a decrease in permanent magnet temperature from 151.9 °C to 135.8 °C, representing a reduction of only 9.9%. Further increasing this flow rate to 10 g/s leads to little change in permanent magnet temperature (from 135.8 °C to 131.2 °C). It can be seen that when the cooling air flow rate increases to 2 g/s, the temperature drop rate of the permanent magnet of the starter generator is very low. In general, increasing the flow rate can effectively mitigate the rise in the temperature of the starter generator. However, the relationship between the two is not linear, and an excessive increase in flow rate cannot achieve good results.

5.2. Effect of Cooling Air Temperature

The temperature of the cooling air circulation system is influenced by various environmental and operating conditions during the operation of the starter generator. Therefore, investigating the correlation between the temperature rise in the starter generator and the cooling air temperature is essential for understanding its operational parameters and determining its functionality under different temperature environments. Figure 13 illustrates the relationship between the starter generator and the cooling air temperatures.
Figure 13 illustrates that as the cooling air temperature rises, the temperatures of the winding and permanent magnet also increase. When the cooling air temperature increases from 90 °C to 140 °C, the winding temperature rises from 130.1 °C to 179.9 °C, and the permanent magnet temperature rises from 116.5 °C to 136.3 °C. The temperature rise in both components shows a proportional change with the cooling water, but the slope of the permanent magnet’s temperature rise curve is smaller, indicating that its temperature rise is less affected by the cooling air temperature compared to that of the winding. This demonstrates that lower-temperature cooling air has a significant impact on its cooling capacity under these conditions.

5.3. Effect of Speed on Motor Temperature

In the power generation state, the motor speed ranges from 45 krpm to 60 krpm. To investigate the temperature rise in the starter generator under different speed conditions, Figure 14 shows the temperature curves of the winding and permanent magnet with simulated speeds. It is evident that as the speed increases, there is a gradual decrease in winding temperature. Specifically, as the speed rises from 45 krpm to 60 krpm, there is a decrease in winding temperature of 6.6 °C.
The copper loss of the winding decreases with increasing speed when the output power is constant, leading to a decrease in winding temperature. Similarly, the temperature of the permanent magnet also decreases gradually as rotational speed increases, albeit by a small margin. For instance, when the rotational speed rises from 45 krpm to 60 krpm, there is a decrease of 1.7 °C in the permanent magnet’s temperature. This phenomenon can be attributed to the fact that as rotational speed increases, the rotor’s surface convective heat transfer coefficient also increases correspondingly, resulting in faster heat dissipation. Furthermore, simulation calculations indicate that under different speed conditions, the maximum temperature of the starter generator remains below 175 °C, demonstrating its ability to function normally across varying speeds.

6. Experiments

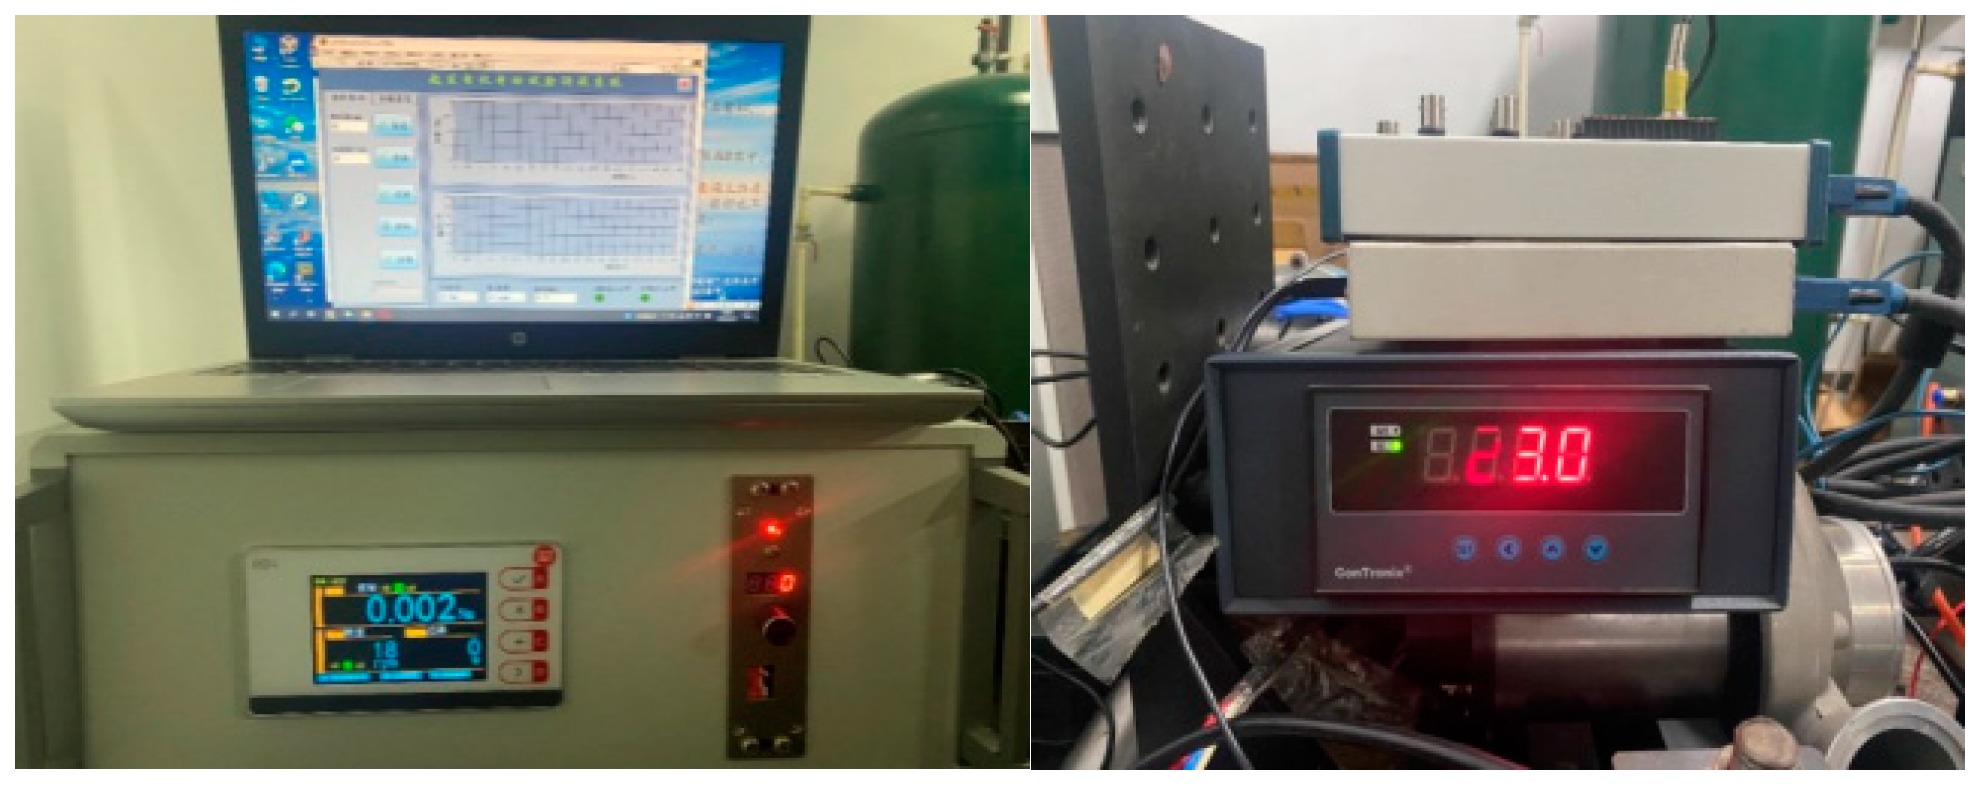
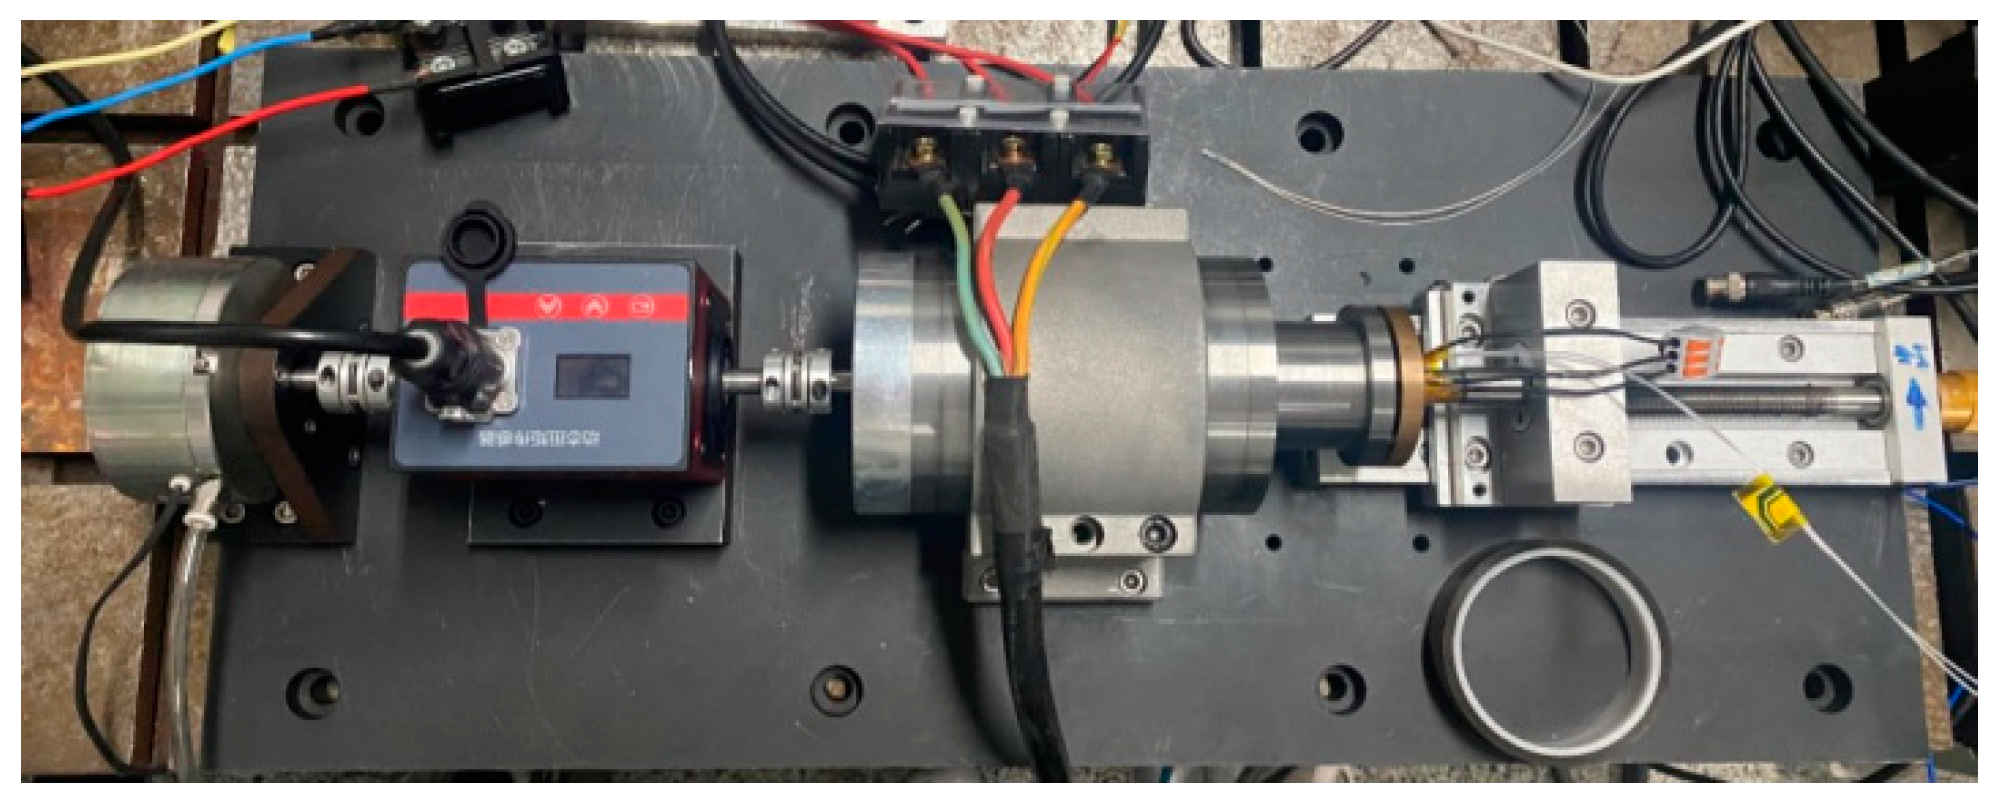
A starting performance test experiment system was constructed to evaluate the starting performance of the starter generator, as depicted in Figure 15. The experimental setup comprised four components: a power output cabinet, a drive controller, a permanent magnet starter generator, and a torque loader.

6.1. Load Test

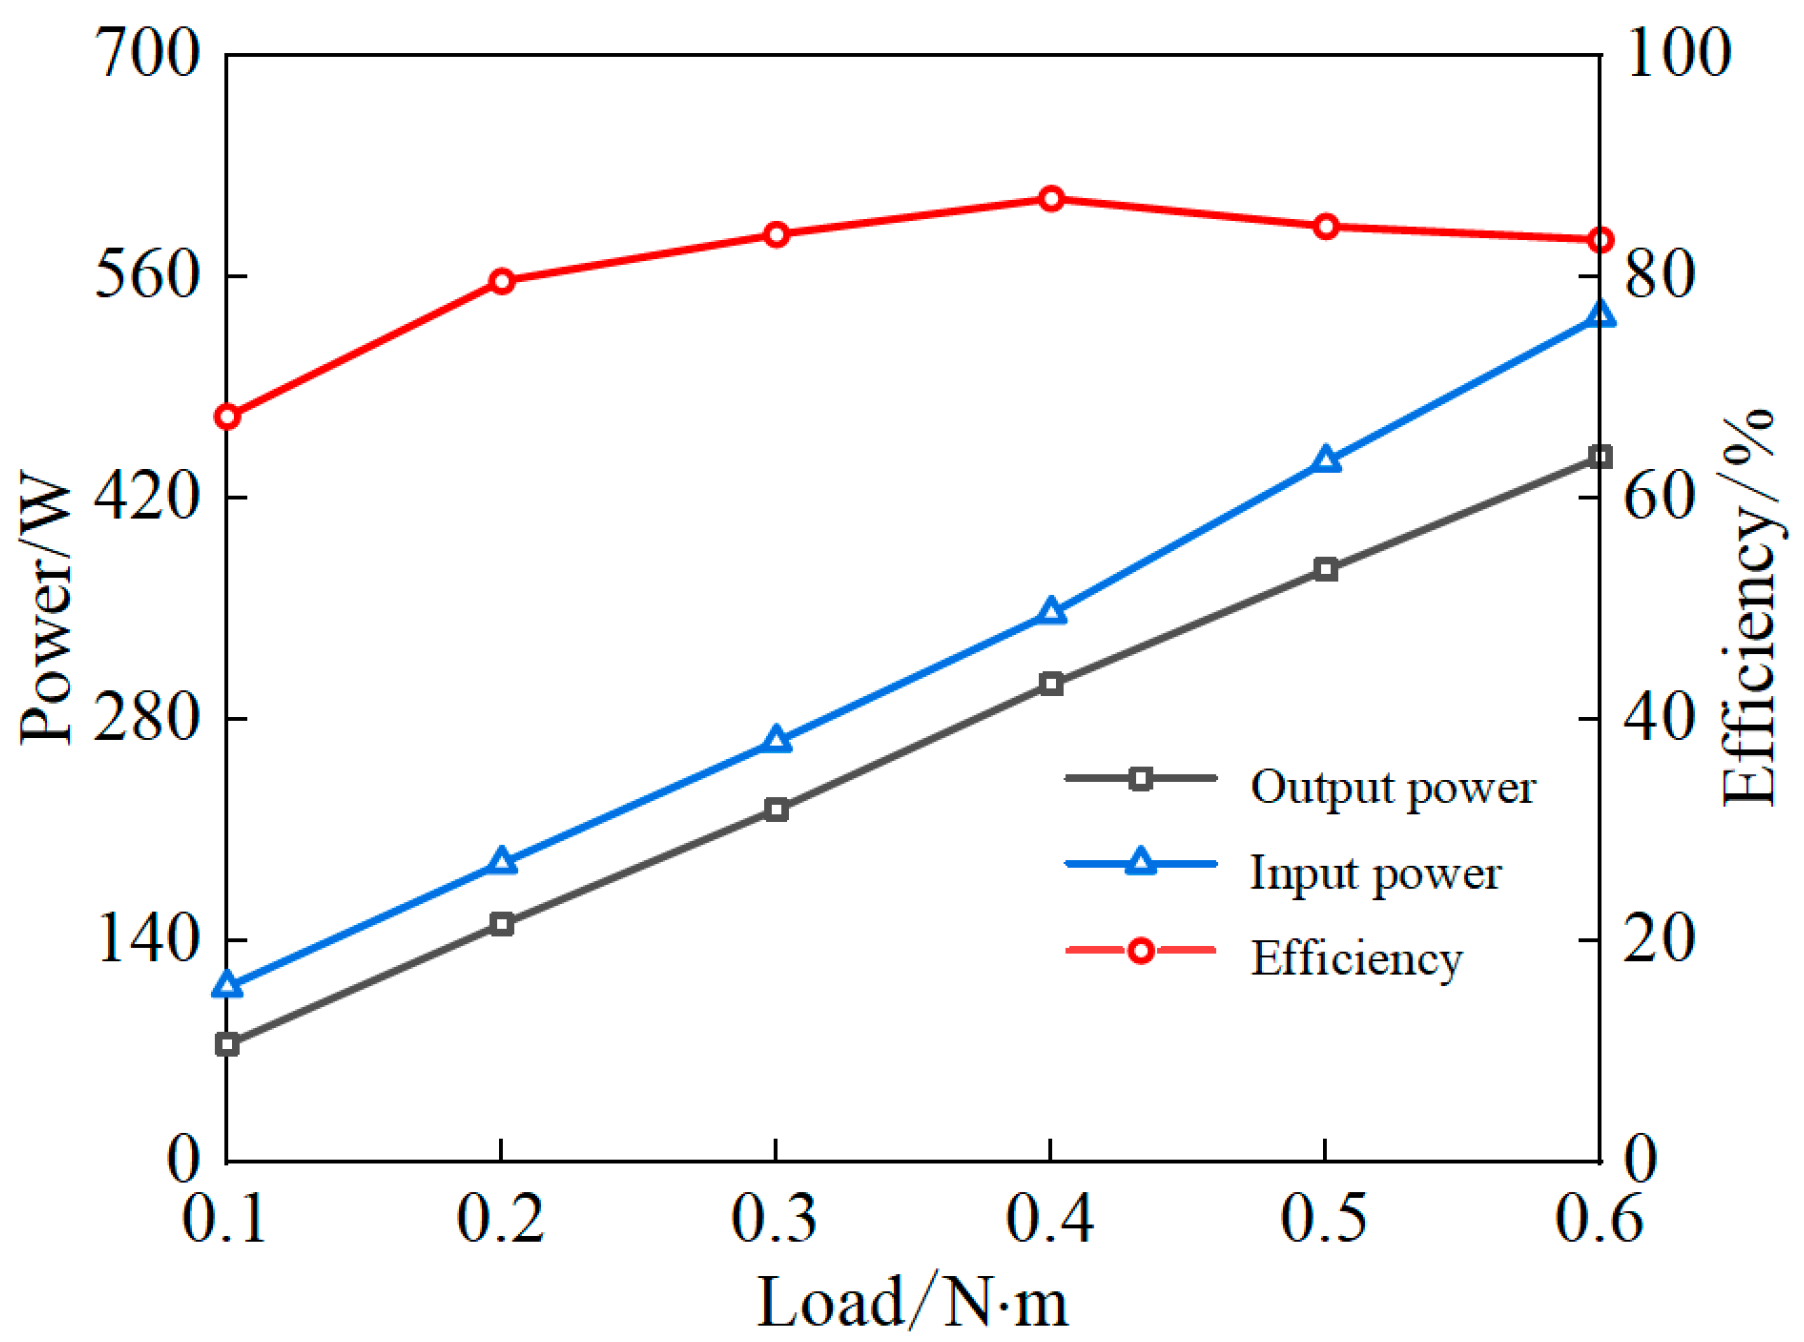
The test host computer was utilized to apply load to the shaft end of the starter generator in order to assess the motor’s load capacity and efficiency under varying conditions. The test curves of power and efficiency under different loads are shown in Figure 16. It can be seen from Figure 16 that when the load torque is small, the motor output power is also small. Due to the large proportion of no-load loss in the input power, the efficiency of the motor is low. With an increase in load torque, the motor’s output power gradually increases, the proportion of no-load loss in the input power decreases, and the efficiency of the motor increases. Because the copper loss rises with the quadratic function relationship, the electromagnetic loss in the input power will gradually increase with the increase in torque, so the motor efficiency shows a trend of first increasing and then decreasing. The test shows that with a load torque of 0.6 N·m, the motor efficiency is 83.4%.

6.2. Temperature Rise Experiment

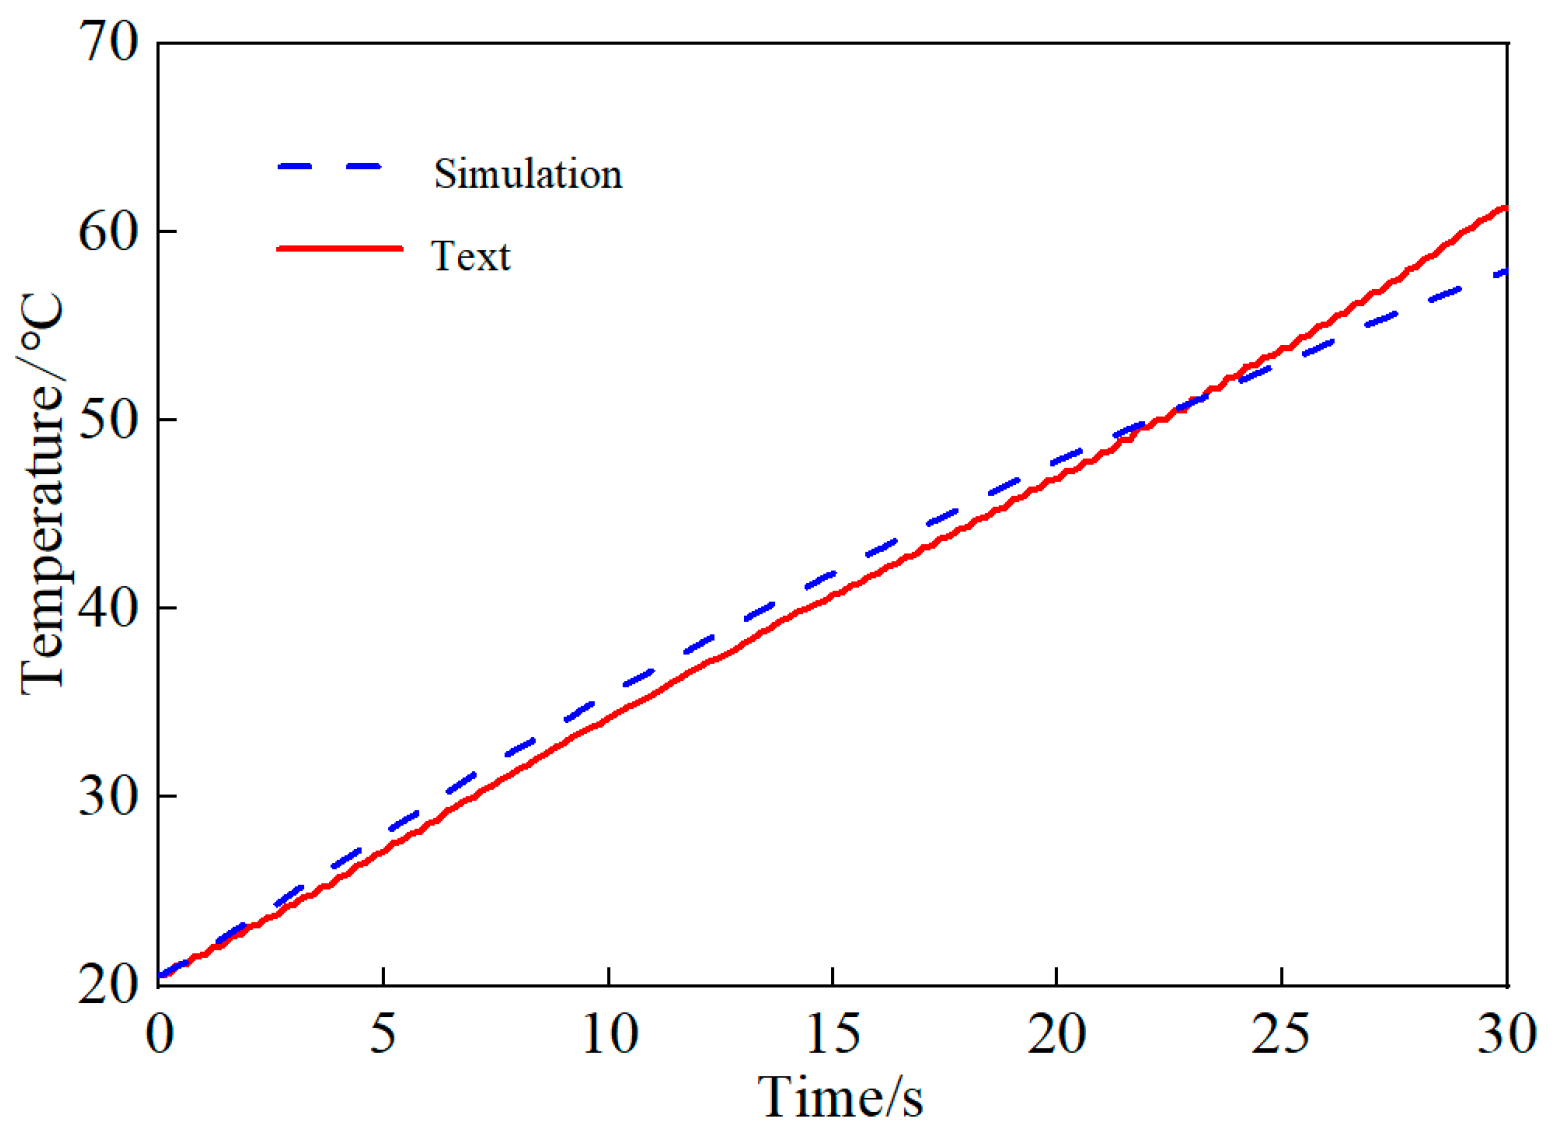
The rotational speed is 7150 rpm, and the torque is 0.6 N m. Figure 17 illustrates the temperature rise curve for both testing and simulation. As the starter generator is used in the flight system, the cooling gas is the output of other components in actual operation. Currently, there is no comprehensive test platform including all components, so there is no cooling equipment that can be used for a long-term temperature rise experiment. The temperature rise data of the first 30 s were collected in this experiment to compare with the transient thermal simulation data. The initial temperature is 20.6 °C. It can be observed from the figure that the transient thermal simulation results align with the actual temperature rise trend, with a temperature rise error of only 5.87%.
The transient thermal temperature rise within the first 30 s under various load torques was obtained through simulation calculations and compared with the experimental data. Table 3 presents the simulated winding temperatures under different load torques at 30 s, along with their respective experimental temperatures and errors. It is evident from the table that as load torque increases, the winding’s temperature rise rate gradually accelerates, consistent with the theoretical analysis. Furthermore, it can be noted that there is a relative error of only 10% between the simulated and experimental temperatures, thus validating the reasonableness of our temperature field calculation model.

7. Conclusions

Thermal analysis plays a crucial role in ensuring the optimal performance and high efficiency of SG motors during prolonged operation. This paper presents a comprehensive thermal analysis approach for SG motors, encompassing temperature field and air cooling, based on loss calculation theory and the finite element method. The loss of the SG motor is calculated, and 2D and 3D thermal analysis models are developed. The temperature field distribution of the motor is calculated and predicted. The calculation results indicate that the stator and winding experience the highest temperatures, while the centrifugal impeller has a lower temperature. Furthermore, it is observed that the maximum temperature of the permanent magnet remains below its demagnetization threshold, ensuring no risk of demagnetization due to elevated temperatures. Additionally, an investigation into air cooling reveals that higher air flow rates do not significantly enhance cooling beyond a flow rate of 4 g/s. Moreover, it has been found that cooling air temperature has less impact on permanent magnet cooling than winding cooling. In addition, when increasing the motor speed from 45 krpm to 60 krpm, there is a decrease in winding temperature of approximately 6.6 degrees Celsius. A prototype of the SG motor was fabricated and tested for load performance and temperature rise on an experimental platform. The experimental results show that the winding temperature rise speed increases as the load torque increases. The test shows that with a load torque of 0.6 N·m, the motor efficiency is 83.4%. The simulation calculation and experiment of the transient temperature rise in the motor winding under different load torques are carried out. The simulated transient temperature rise curve is compared with the experimental temperature rise curve, and the consistency between the two is good; the relative error is less than 10%, which verifies the rationality of the temperature field calculation model.

Author Contributions

Software simulation, formal analysis, experiment, Z.C.; resources, data calculation, experiment, R.D.; programming, experiment, writing—original draft preparation, writing—review and editing, X.R.; supervision, project administration, M.F. All authors have read and agreed to the published version of the manuscript.

Funding

This research received no external funding.

Institutional Review Board Statement

Exclude this statement.

Informed Consent Statement

Not applicable.

Data Availability Statement

The data that support the findings of this study are available on request from the corresponding author, upon reasonable request.

Conflicts of Interest

The authors declare no conflicts of interest.

References

  1. Noland, J.K.; Leandro, M.; Suul, J.A.; Molinas, M. High-Power Machines and Starter-Generator Topologies for More Electric Aircraft: A Technology Outlook. IEEE Access 2020, 8, 130104–130123. [Google Scholar] [CrossRef]
  2. Xiao, D.; Shi, L.; Guo, Y.; Han, Z.; Zhou, X. Investigation of the working mechanism and characteristics of dual-mode doubly salient starter generator with variable winding. IET Electr. Power Appl. 2018, 12, 1240–1246. [Google Scholar] [CrossRef]
  3. Cai, S.; Wang, Y.; Chen, H.; Yuan, X.; Yu, L.; Zhang, Z.; Lee, C.H.T. Design and Analysis of a Doubly Salient Wound Field Starter Generator for Cost-Effective Automobile Application. IEEE Trans. Veh. Technol. 2022, 71, 6900–6911. [Google Scholar] [CrossRef]
  4. Vavilov, V.Y.; Argakov, A.S.; Garipov, I.R. Integrated Starter-Generator for a More Electric Engine: A Brief Overview. In Proceedings of the 2023 Russian Workshop on Power Engineering and Automation of Metallurgy Industry: Research & Practice (PEAMI), Magnitogorsk, Russia, 29 September–1 October 2023; pp. 23–28. [Google Scholar]
  5. Itoh, J.-I.; Kawamura, K.; Koshikizawa, H.; Abe, K. Control Strategy for Starter Generator in UAV with Micro Jet Engine. In Proceedings of the 2018 International Power Electronics Conference (IPEC-Niigata 2018-ECCE Asia), Niigata, Japan, 20–24 May 2018; pp. 1567–1574. [Google Scholar] [CrossRef]
  6. Yingzhi, G.; Liwei, S.; Wenchao, Z.; Wenping, C.; Byung-Il, K. Research on 3/6-phase Winding Switching Integrated Starter Generator for Range Extender Electric Vehicles. In Proceedings of the 2019 10th International Conference on Power Electronics and ECCE Asia (ICPE 2019—ECCE Asia), Busan, Republic of Korea, 27–30 May 2019; pp. 2492–2497. [Google Scholar] [CrossRef]
  7. Okazaki, K.; Miyama, Y.; Kitao, J.; Takahashi, T.; Kumagai, K.; Ohashi, N.; Ota, N.; Totsuka, F. Low-Noise and High-Power Spoke-Type Magnet-Assisted Flat-Plate IPMSM for Integrated Starter Generator Motor. In Proceedings of the 2023 IEEE Energy Conversion Congress and Exposition (ECCE), Nashville, TN, USA, 29 October–2 November 2023; pp. 3924–3929. [Google Scholar] [CrossRef]
  8. Inoue, M.; Kitao, J.; Miyama, Y.; Hazeyama, M.; Isoda, H.; Arita, H.; Nishizawa, K.; Nishimura, T.; Nakano, M. Development of a 48V Integrated Starter Generator for Mild Hybrid Vehicles. IEEJ J. Ind. Appl. 2022, 11, 388–395. [Google Scholar] [CrossRef]
  9. Zhang, H.; Kou, B.; Zhang, L. Design and Analysis of a Stator Field Control Permanent Magnet Synchronous Starter–Generator System. Energies 2023, 16, 5125. [Google Scholar] [CrossRef]
  10. Lin, X.; Xu, R.; Yao, W.; Gao, Y.; Sun, G.; Liu, J.; Peretti, L.; Wu, L. Observer-Based Prescribed Performance Speed Control for PMSMs: A Data-Driven RBF Neural Network Approach. IEEE Trans. Ind. Inform. 2024, 20, 7502–7512. [Google Scholar] [CrossRef]
  11. Lin, X.; Wu, C.; Yao, W.; Liu, Z.; Shen, X.; Xu, R.; Sun, G.; Liu, J. Observer-Based Fixed-Time Control for Permanent-Magnet Synchronous Motors with Parameter Uncertainties. IEEE Trans. Power Electron. 2023, 38, 4335–4344. [Google Scholar] [CrossRef]
  12. Reshetnikov, A.N. Modeling of integrated starter-generator. In Proceedings of the 2015 16th International Conference of Young Specialists on Micro/Nano technologies and Electron Devices (EDM), Erlagol, Russia, 29 June–3 July 2015; pp. 470–471. [Google Scholar]
  13. Xie, Y.; Zhang, J.; Jiang, D.; Liu, Z.; Tian, L. Emulation of Integrated Starter/Generator Using Power Electronic Devices. IEEE Trans. Ind. Appl. 2023, 59, 6556–6567. [Google Scholar] [CrossRef]
  14. Wang, B.; Vakil, G.; Liu, Y.; Yang, T.; Zhang, Z.; Gerada, C. Optimization and Analysis of a High Power Density and Fault Tolerant Starter–Generator for Aircraft Application. Energies 2021, 14, 113. [Google Scholar] [CrossRef]
  15. Reshetnikov, A.N.; Khlebnikov, A.S. Modeling of integrated starter-generator in generator mode. In Proceedings of the 15th International Conference of Young Specialists on Micro/Nanotechnologies and Electron Devices (EDM), Novosibirsk, Russia, 30 June–4 July 2014; pp. 453–455. [Google Scholar] [CrossRef]
  16. Wang, C.; Zhang, Z.; Han, J. Multiobjective Optimization of High Power Density Outer Rotor PM Starter Generator Considering Electromagnetic and Temperature Characteristics. IEEE Trans. Ind. Electron. 2024, 71, 8339–8350. [Google Scholar] [CrossRef]
  17. La Rocca, A.; Xu, Z.; Arumugam, P.; Pickering, S.J.; Eastwick, C.N.; Gerada, C. Thermal management of a high speed permanent magnet machine for an aeroengine. In Proceedings of the 2016 12th International Conference on Electrical Machines (ICEM), Lausanne, Switzerland, 4–7 September 2016; pp. 2732–2737. [Google Scholar] [CrossRef]
  18. Mazur, D. Thermal analysis of the permanent magnet synchronous generator with the use of Ansys Fluent. In Proceedings of the 2013 International Symposium on Electrodynamic and Mechatronic Systems (SELM), Opole-Zawiercie, Poland, 15–18 May 2013; pp. 75–76. [Google Scholar] [CrossRef]
  19. Liu, F.; Hu, J.; Li, Y.; Wang, Q. Improved thermal model of forced air-cooled motors considering heat transfer in wire-wound winding and end region. IET Electr. Power Appl. 2020, 14, 943–950. [Google Scholar] [CrossRef]
  20. Wang, C.-F.; Jin, M.-J.; Shen, J.-X.; Yuan, C. A Permanent Magnet Integrated Starter Generator for Electric Vehicle Onboard Range Extender Application. IEEE Trans. Magn. 2012, 48, 1625–1628. [Google Scholar] [CrossRef]
  21. Kaarthik, R.S.; Amitkumar, K.S.; Pillay, P. Emulation of a Permanent-Magnet Synchronous Generator in Real-Time Using Power Hardware-in-the-Loop. IEEE Trans. Transp. Electrif. 2018, 4, 474–482. [Google Scholar] [CrossRef]
  22. Zhang, F.; Gerada, D.; Xu, Z.; Zhang, X.; Tighe, C.; Zhang, H.; Gerada, C. Back-iron extension thermal benefits for electrical machines with concentrated windings. IEEE Trans. Ind. Electron. 2020, 67, 1728–1738. [Google Scholar] [CrossRef]
  23. Geng, W.; Zhu, T.; Li, Q.; Zhang, Z. Windings indirect liquid cooling method for a compact outer-rotor pm starter/generator with concentrated windings. IEEE Trans. Energy Convers. 2021, 36, 3282–3293. [Google Scholar] [CrossRef]
  24. Zhang, F.; Gerada, D.; Xu, Z.; Tighe, C.; Zhang, H.; Yan, L.; Gerada, C. Electrical machine slot thermal condition effects on back-iron extension thermal benefits. IEEE Trans. Transp. Electrif. 2021, 7, 2927–2938. [Google Scholar] [CrossRef]
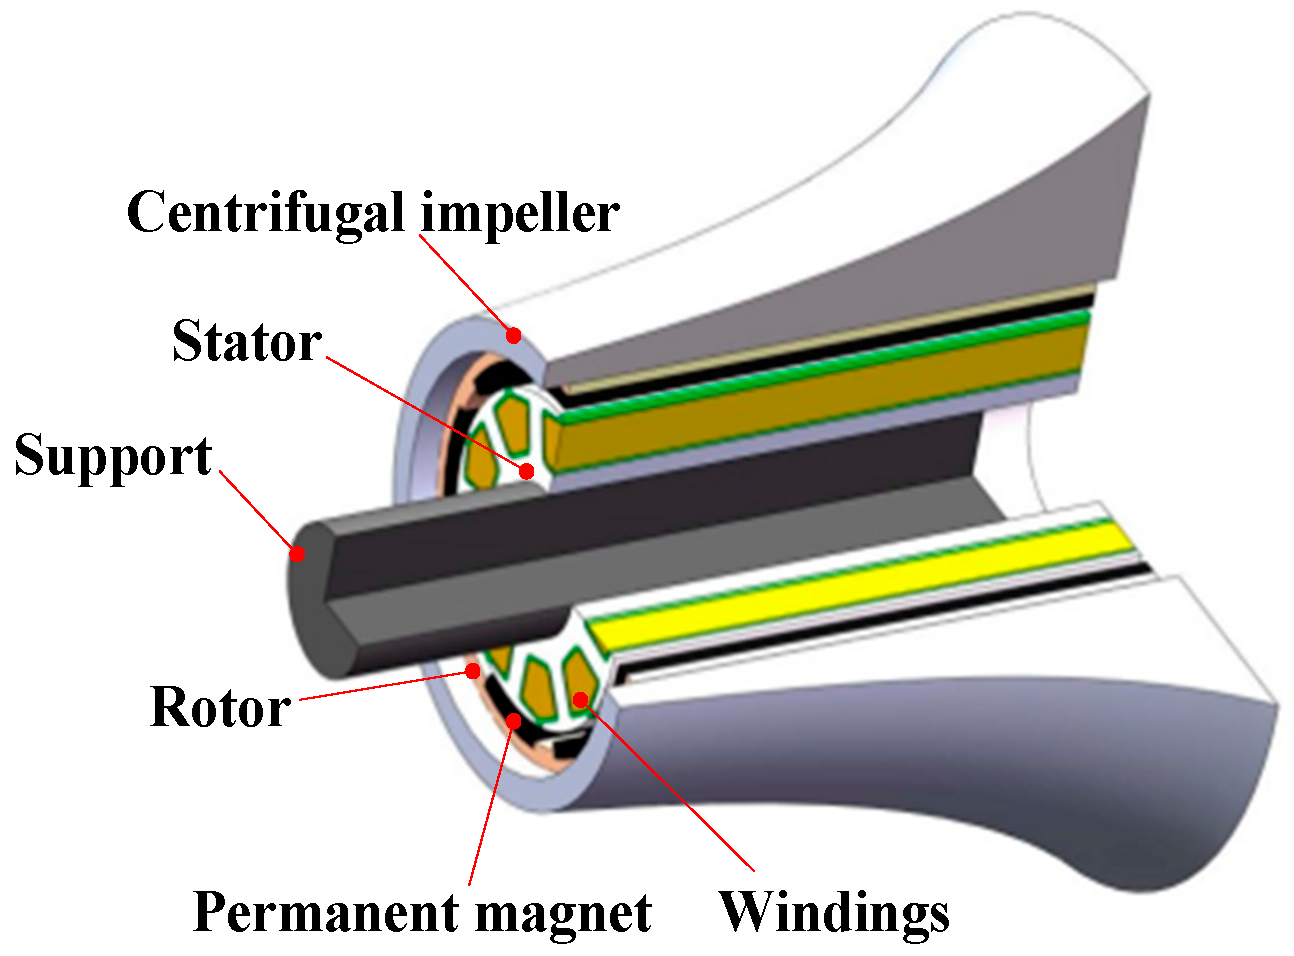
Figure 1. Configuration of motor in air compressor.
Energies 17 05049 g001
Figure 2. Structure of motor.
Energies 17 05049 g002
Figure 3. Field distribution of starter generator: (a) Magnetic flux density; (b) magnetic flux lines.
Energies 17 05049 g003
Figure 4. Loss waveform. (a) Iron loss; (b) eddy loss.
Energies 17 05049 g004
Figure 5. Line current waveform.
Energies 17 05049 g005
Figure 6. Fluid domain model for temperature simulation of the starter generator. (a) Inside of the centrifugal impeller; (b) outer surface of the centrifugal impeller (blue color part).
Energies 17 05049 g006
Figure 7. Fluid boundary layer meshing. (a) Air boundary layer outside the motor; (b) air boundary layer in the air gap.
Energies 17 05049 g007
Figure 8. Steady-state temperature field distribution.
Energies 17 05049 g008
Figure 9. Temperature cloud view of the impeller and support. (a) Impeller component; (b) support component.
Energies 17 05049 g009
Figure 10. Stator temperature diagram. (a) Stator iron core; (b) equivalent insulation; (c) windings.
Energies 17 05049 g010
Figure 11. Temperature field distribution of protective sleeve and PM.
Energies 17 05049 g011
Figure 12. Variation curve of motor temperature.
Energies 17 05049 g012
Figure 13. Temperature variation curve of the motor with the cooling air.
Energies 17 05049 g013
Figure 14. Curve of the motor temperature with the speed.
Energies 17 05049 g014
Figure 15. Photo of SG test platform.
Energies 17 05049 g015aEnergies 17 05049 g015b
Figure 16. Test results of power and efficiency.
Energies 17 05049 g016
Figure 17. Test results of temperature.
Energies 17 05049 g017
Table 1. Design variables of motor optimization.
NameValueNameValue
Poles and slots8P9SPitch 1
Outer diameter of stator (mm)30.7Conductors per slot10
Inner diameter of stator (mm) 13.8Polar arc coefficient0.72
Inner diameter of PM (mm) 32.5Core length (mm) 57
Outer diameter of PM (mm)35.5Sleeve material 4Cr13
Number of parallel branches1PM materialN35UH
Outer diameter of protective sleeve (mm) 38Silicon steel sheet 10JNEX900
Table 2. Heat generation rate.
Heat SourceLoss (W)Volume (mm3)Heat Generation Rate
Windings14.7 1.19 × 10 5 1.24 × 10 6
Stator iron43.8 1.69 × 10 5 2.59 × 10 6
PM and sleeve16.4 1.61 × 10 5 1.02 × 10 6
Table 3. Comparison of simulation and experimental values of winding temperature.
Load Torque
(N·m)
Simulation Value (°C)Experimental Value (°C)Relative Error
(%)
0.122.3 24.1 8.07
0.226.5 28.4 7.17
0.331.833.5 5.35
0.443.145.5 5.57
0.551.354.7 6.63
0.657.9 61.3 5.87
Disclaimer/Publisher’s Note: The statements, opinions and data contained in all publications are solely those of the individual author(s) and contributor(s) and not of MDPI and/or the editor(s). MDPI and/or the editor(s) disclaim responsibility for any injury to people or property resulting from any ideas, methods, instructions or products referred to in the content.