Article

Enhancing PV Hosting Capacity of Electricity Distribution Networks Using Deep Reinforcement Learning-Based Coordinated Voltage Control

Australian Power Quality Research Centre, University of Wollongong, Wollongong 2522, Australia
*
Author to whom correspondence should be addressed.
Energies 2024, 17(20), 5037; https://doi.org/10.3390/en17205037
Submission received: 9 September 2024 / Revised: 26 September 2024 / Accepted: 2 October 2024 / Published: 10 October 2024
(This article belongs to the Special Issue Power Quality and Hosting Capacity in the Microgrids)

Abstract

:
Coordinated voltage control enables the active management of voltage levels throughout electricity distribution networks by leveraging the voltage support capabilities of existing grid-connected PV inverters. The efficient management of power flows and precise voltage regulation through coordinated voltage control schemes facilitate the increased adoption of rooftop PV systems and enhance the hosting capacity of electricity distribution networks. The research work presented in this paper proposes a coordinated voltage control scheme and evaluates the enhanced hosting capacity utilizing a deep reinforcement learning-based approach. A comparative analysis of the proposed algorithm is presented, and the performance is benchmarked against existing local voltage control schemes. The proposed coordinated voltage control scheme in this paper is evaluated using simulations on a real-world low-voltage electricity distribution network. The evaluation involves quasi-static time series power flow simulations for assessing performance. Furthermore, a discussion is presented that reflects on the strengths and limitations of the proposed scheme based on the results observed from the case study.

1. Introduction

Surging rates of rooftop PV system integration into electricity distribution networks play a crucial part in the decarbonization of the energy sector and its transition toward a greener and more sustainable system. Despite the benefits of adopting PV systems, such as reduced costs of electricity for customers and lesser reliance on fossil fuels, they can cause various challenges to the electricity distribution system if suitable planning and management approaches are not adopted. Some of the adverse impacts of high PV penetration are overvoltage, revenue loss due to excessive curtailments, increased network unbalance, and thermal overloading of feeders and transformers. The term hosting capacity (HC) is commonly defined as the maximum PV generation capacity that can be accommodated on a specific electricity distribution network without resulting in any adverse impacts [1]. An accurate assessment of HC can guide distribution network service providers (DNSPs) and various stakeholders to make investment decisions for future grid reinforcements or expansions while minimizing economic costs and ensuring network reliability.
Before undertaking an HC assessment, performance indices are defined to provide quantitative measures to evaluate the HC of networks. In [2], the performance indices most commonly used in the literature are categorized as overvoltage problems, power quality problems, protection problems, and overloading/power loss problems. The operational constraint violations of the performance indices restrict the HC of a network. Typically, for low-voltage (LV) distribution networks, the overvoltage and thermal capacity of network elements are the most restrictive performance indices in HC assessments [3].
Numerous distinct methods are proposed across various literature sources for the assessment of HC in electricity distribution networks [4,5,6]. HC quantification methods are classified into three groups in [7]: deterministic methods, probabilistic load flow methods, and quasi-static time series (QSTS) methods. Deterministic methods do not require high computational capabilities and offer a quick rough estimate for HC, utilizing fixed-input data models such as customer power consumption and PV generation [8,9,10,11,12]. Probabilistic load flow methods use the probability density functions of stochastic input variables to model the uncertainties of the distribution network and estimate the HC [13,14,15,16,17]. The QSTS methods proposed in various research works utilize a sequence of steady-state power flow simulations to accurately quantify the HC [18,19,20]. QSTS approaches are considered the most accurate method since they incorporate the system dynamics of voltage regulation devices into the HC assessment. The accuracy of the HC quantified using a QSTS simulation depends on factors such as simulation time step resolution, simulation length, and input data resolution [21]. A higher time step resolution guarantees a higher accuracy for the evaluated HC, but the computational burden of the QSTS simulation is significantly increased. Most QSTS simulations proposed in the literature are static methods that consider only the infrequent worst-case snapshots in time to evaluate the HC. These traditional approaches often underestimate the HC, since they do not consider the instances in which operational constraint violations are temporarily acceptable. The study presented in [22] proposes a QSTS simulation with time-aware metrics to evaluate the HC considering the durations of operational constraint violations and dynamic events such as the control actions of Volt-VAr response modes.
In most literature, the HC is evaluated as the aggregate PV generation capacity of a LV feeder and the HC is assumed to be evenly distributed among the integrated PV systems of the LV feeder. The individual HC of each PV system connected to a LV feeder depends on various factors such as the distance from the distribution transformer, type of phase connection, and network unbalance. HC assessment of individual PV systems provides a more accurate estimation of the HC of LV distribution networks even though it has not been extensively studied in the recent literature. Therefore, the HC assessment methodology presented in this paper evaluates the HC of individual PV systems for a 100% PV penetration scenario to arrive at the most accurate HC estimate. Furthermore, HC assessments in most literature using yearlong QSTS simulations define the HC of a LV distribution network as a single value despite the actual HC varying at each time step. The HC assessment presented in this study evaluates the HC in real time at each time step of the yearlong QSTS simulation, showcasing all possible HC values for each individual PV system throughout the year. Such an assessment of HC is more useful for PV systems that are able to regulate their power output to the grid, as it provides operational limits for the PV inverter power output at each time step.
The implementation of effective voltage regulation techniques can significantly enhance the HC of electricity distribution networks since HC is mostly restricted by overvoltage [6]. Coordinated voltage control schemes with sophisticated communication infrastructure are widely recognized to be more efficient in voltage regulation than traditional local voltage control schemes. In [23], several coordinated control schemes proposed in the recent literature are classified into groups based on their communication structure: local control, centralized control, distributed control, and decentralized control.
Optimal power flow (OPF) is at the heart of every coordinated voltage control problem. Some of the widely used algorithms in the recent literature to solve OPF and implement coordinated voltage control include rule-based algorithms [24,25,26], analytical methods for OPF [27,28,29], heuristic algorithms [30,31,32], model-predictive control [33,34,35], and deep reinforcement learning (DRL) algorithms [36,37,38]. Due to the recent advancements in the fields of artificial intelligence and machine learning, DRL algorithms for coordinated voltage control have garnered heightened interest from researchers in recent years. DRL algorithms offer model-free control and exhibit superior performance beyond traditional algorithms, such as model-predictive control, due to their ability to learn and adapt to complex systems with high-dimensional control spaces [39].
Prevalent DRL algorithms utilized for coordinated voltage control in the majority of the literature can be classified into three distinct categories: value-based methods, policy-based methods, and actor–critic algorithms. Value-based methods are primarily Q-learning-based algorithms such as deep Q-networks (DQN) that learn the optimal policy indirectly by optimizing the action-value function (Q-function). In [40], a DQN-based algorithm is utilized to control the reactive power outputs of smart inverters and the switching of capacitor banks to regulate voltage. One of the limitations of such DQN-based algorithms is that they can only perform discrete control actions which may lead to suboptimal performance levels when applied to a continuous control problem such as inverter reactive power control. Policy-based methods optimize the control policy directly in contrast to the value-based methods. Proximal policy optimization (PPO) algorithms are the most commonly used policy-based method for coordinated voltage control in the recent literature [41,42]. PPO algorithms are generally more stable and are well suited for continuous control problems. However, such policy-based algorithms suffer from low sample efficiency since the policy updates are performed using the learning samples generated by following the current policy. Actor–critic algorithms offer a powerful and flexible framework for DRL combining the merits of value-based and policy-based algorithms. Commonly used actor–critic methods for coordinated voltage control include deep deterministic policy gradient (DDPG) [39,43], twin delayed deep deterministic policy gradient (TD3) [44], and soft actor–critic (SAC) [45,46]. High sample efficiency, stability, and efficient exploration–exploitation balance are some of the advantageous characteristics of actor–critic algorithms. In [39] and [47], model-free coordinated voltage control schemes are proposed, utilizing the DDPG algorithm to realize the optimal control policies for network elements such as PV inverters, static VAr compensator (SVC) systems, and smart transformers. However, the proposed schemes are evaluated using only balanced medium-voltage (MV) distribution networks and the performance of such schemes may vary when tested on LV distribution networks where a higher degree of network unbalance exists. Furthermore, the TD3 algorithm [48] may yield superior performance for deterministic policies since it is an enhanced version of the DDPG algorithm with improved stability, and better exploitation and efficient utilization of training samples. The coordinated Volt-VAr control schemes proposed in [45] and [46] utilize the SAC algorithm that trains a stochastic policy to realize optimal control actions. An advantage of the SAC algorithm is that it is less sensitive to hyperparameters and generally less brittle than the TD3 algorithm. However, any persistent exploration noise of stochastic algorithms such as SAC may lead to undesirable outcomes and increase costs for DNSPs. Therefore, deterministic policy algorithms such as TD3 with properly tuned hyperparameters are identified to be more suited for power system applications and are utilized in this paper.
Deep learning methods for HC quantification have recently become a hot topic among researchers as they provide real-time HC assessments for large electricity distribution systems in contrast to traditional HC quantification techniques. In [49], long short-term memory (LSTM) networks were utilized to develop a deep learning-based real-time HC assessment method. The proposed method, namely spatial–temporal LSTM, is a regression model that identifies the mapping rule from the power flow data to the HC data and it does not specifically consider the control elements of the distribution network for the HC assessment. In [50], a cooperative multi-agent deep reinforcement learning algorithm is proposed for the analysis of dynamic HC in distribution networks which also considers network control elements such as SVCs, on-load tap changers (OLTCs), and renewable energy generators in the HC assessment.
An HC assessment is essential before deploying any coordinated voltage control scheme to accurately present a cost–benefit analysis to investors and stakeholders [51]. Therefore, a key feature of the work presented in this paper is the quantification of the enhanced HC due to the proposed coordinated voltage control scheme, which has frequently been overlooked in many of the scholarly publications identified in this paper. Several other crucial attributes of the current work are summarized and compared with past research works in Table 1.
The research work undertaken in this paper proposes a coordinated voltage control scheme and a methodology to quantify the real-time HC of LV electricity distribution using the TD3 DRL algorithm. The key contributions of the research work presented in this paper are summarized as flows:
  • A methodology to implement coordinated voltage control using the TD3 algorithm.
  • Quantification of enhanced HC due to the proposed TD3-based coordinated voltage control scheme.
  • Performance evaluation of the proposed scheme using a model of a real-world unbalanced LV distribution network.
  • Comparative analysis with other control algorithms such as Volt-VAr/Volt-Watt and DRL algorithms such as DDPG and SAC.
  • A discussion detailing the implementation safety, scalability, sample efficiency, and constraint satisfaction of the proposed coordinated control scheme.
The remaining sections of this paper are structured as follows. Section 2 provides a detailed explanation of the formulation of the TD3 algorithm with a brief introduction to the basic concepts behind voltage control and deep reinforcement learning. Section 3 presents the application of the TD3 algorithm for HC assessment and the coordinated voltage control problem. In Section 4, a numerical study is undertaken and a comparative performance evaluation of the proposed scheme is presented. Finally, the critical discussion and conclusions are presented in Section 5 and Section 6, respectively.

2. Problem Formulation

This section introduces the key concepts of voltage regulation and deep reinforcement learning. A brief description of the formulation of the TD3 algorithm is provided with the aid of a diagrammatic representation and the pseudo-code.

2.1. Preliminaries

Voltage is a critical factor when assuring the power quality and reliability of electricity distribution networks. Hence, voltage control is regarded as one of the basic operational requirements at the LV distribution level where uncertainties in load and power generation can cause significant voltage fluctuations. The high resistivity of LV feeder conductors and voltage rises due to high PV generation make the voltage control problem in LV networks distinct from transmission networks. Consider a simplified radial N-bus LV feeder as illustrated in Figure 1, in which the voltage drop Δ V j , j + 1 = ( V j + 1 V j ) from bus j to bus j + 1 can be described according to Equation (1).
Δ V j , j + 1 = ( i = j + 1 N ( P i ) j   i = j + 1 N ( Q i ) ) V j + 1   ·   ( R · L j , j + 1 + j   X ·   L j , j + 1 )
where R and X are the resistance and reactance of the LV feeder per metre, respectively. A further simplification of Equation (1) is expressed in Equation (2).
Δ V j , j + 1 = ( i = j + 1 N ( P i ) · R ·   L j , j + 1 + i = j + 1 N ( Q i ) · X ·   L j , j + 1 ) V j + 1 + j   ( i = j + 1 N ( P i ) · X ·   L j , j + 1 i = j + 1 N ( Q i ) · R ·   L j , j + 1 ) V j + 1
In LV distribution networks, the X/R ratio is low and the voltage drop can be further simplified and expressed according to Equation (3) by ignoring the imaginary component in Equation (2).
Δ V j , j + 1 = ( i = j + 1 N ( P i ) · R ·   L j , j + 1 + i = j + 1 N ( Q i ) · X ·   L j , j + 1 ) V j + 1
It is evident from Equation (3) that an increase in active power injection ( P j + 1 ) would automatically increase the voltage difference, Δ V j , j + 1 . Conversely, an application of the negative reactive power increment ( Q j + 1 ) , i.e., the absorption of reactive power, would reduce the voltage magnitude difference between bus j and bus j + 1 . Therefore, voltage regulation can be performed locally at the customer point of connection (POC) busbar by active power curtailments and the absorption of reactive power using customer PV inverters. This method of voltage regulation utilizes the existing resources of the distribution network without the burden of installation and maintenance costs of voltage regulation devices for the DNSP.
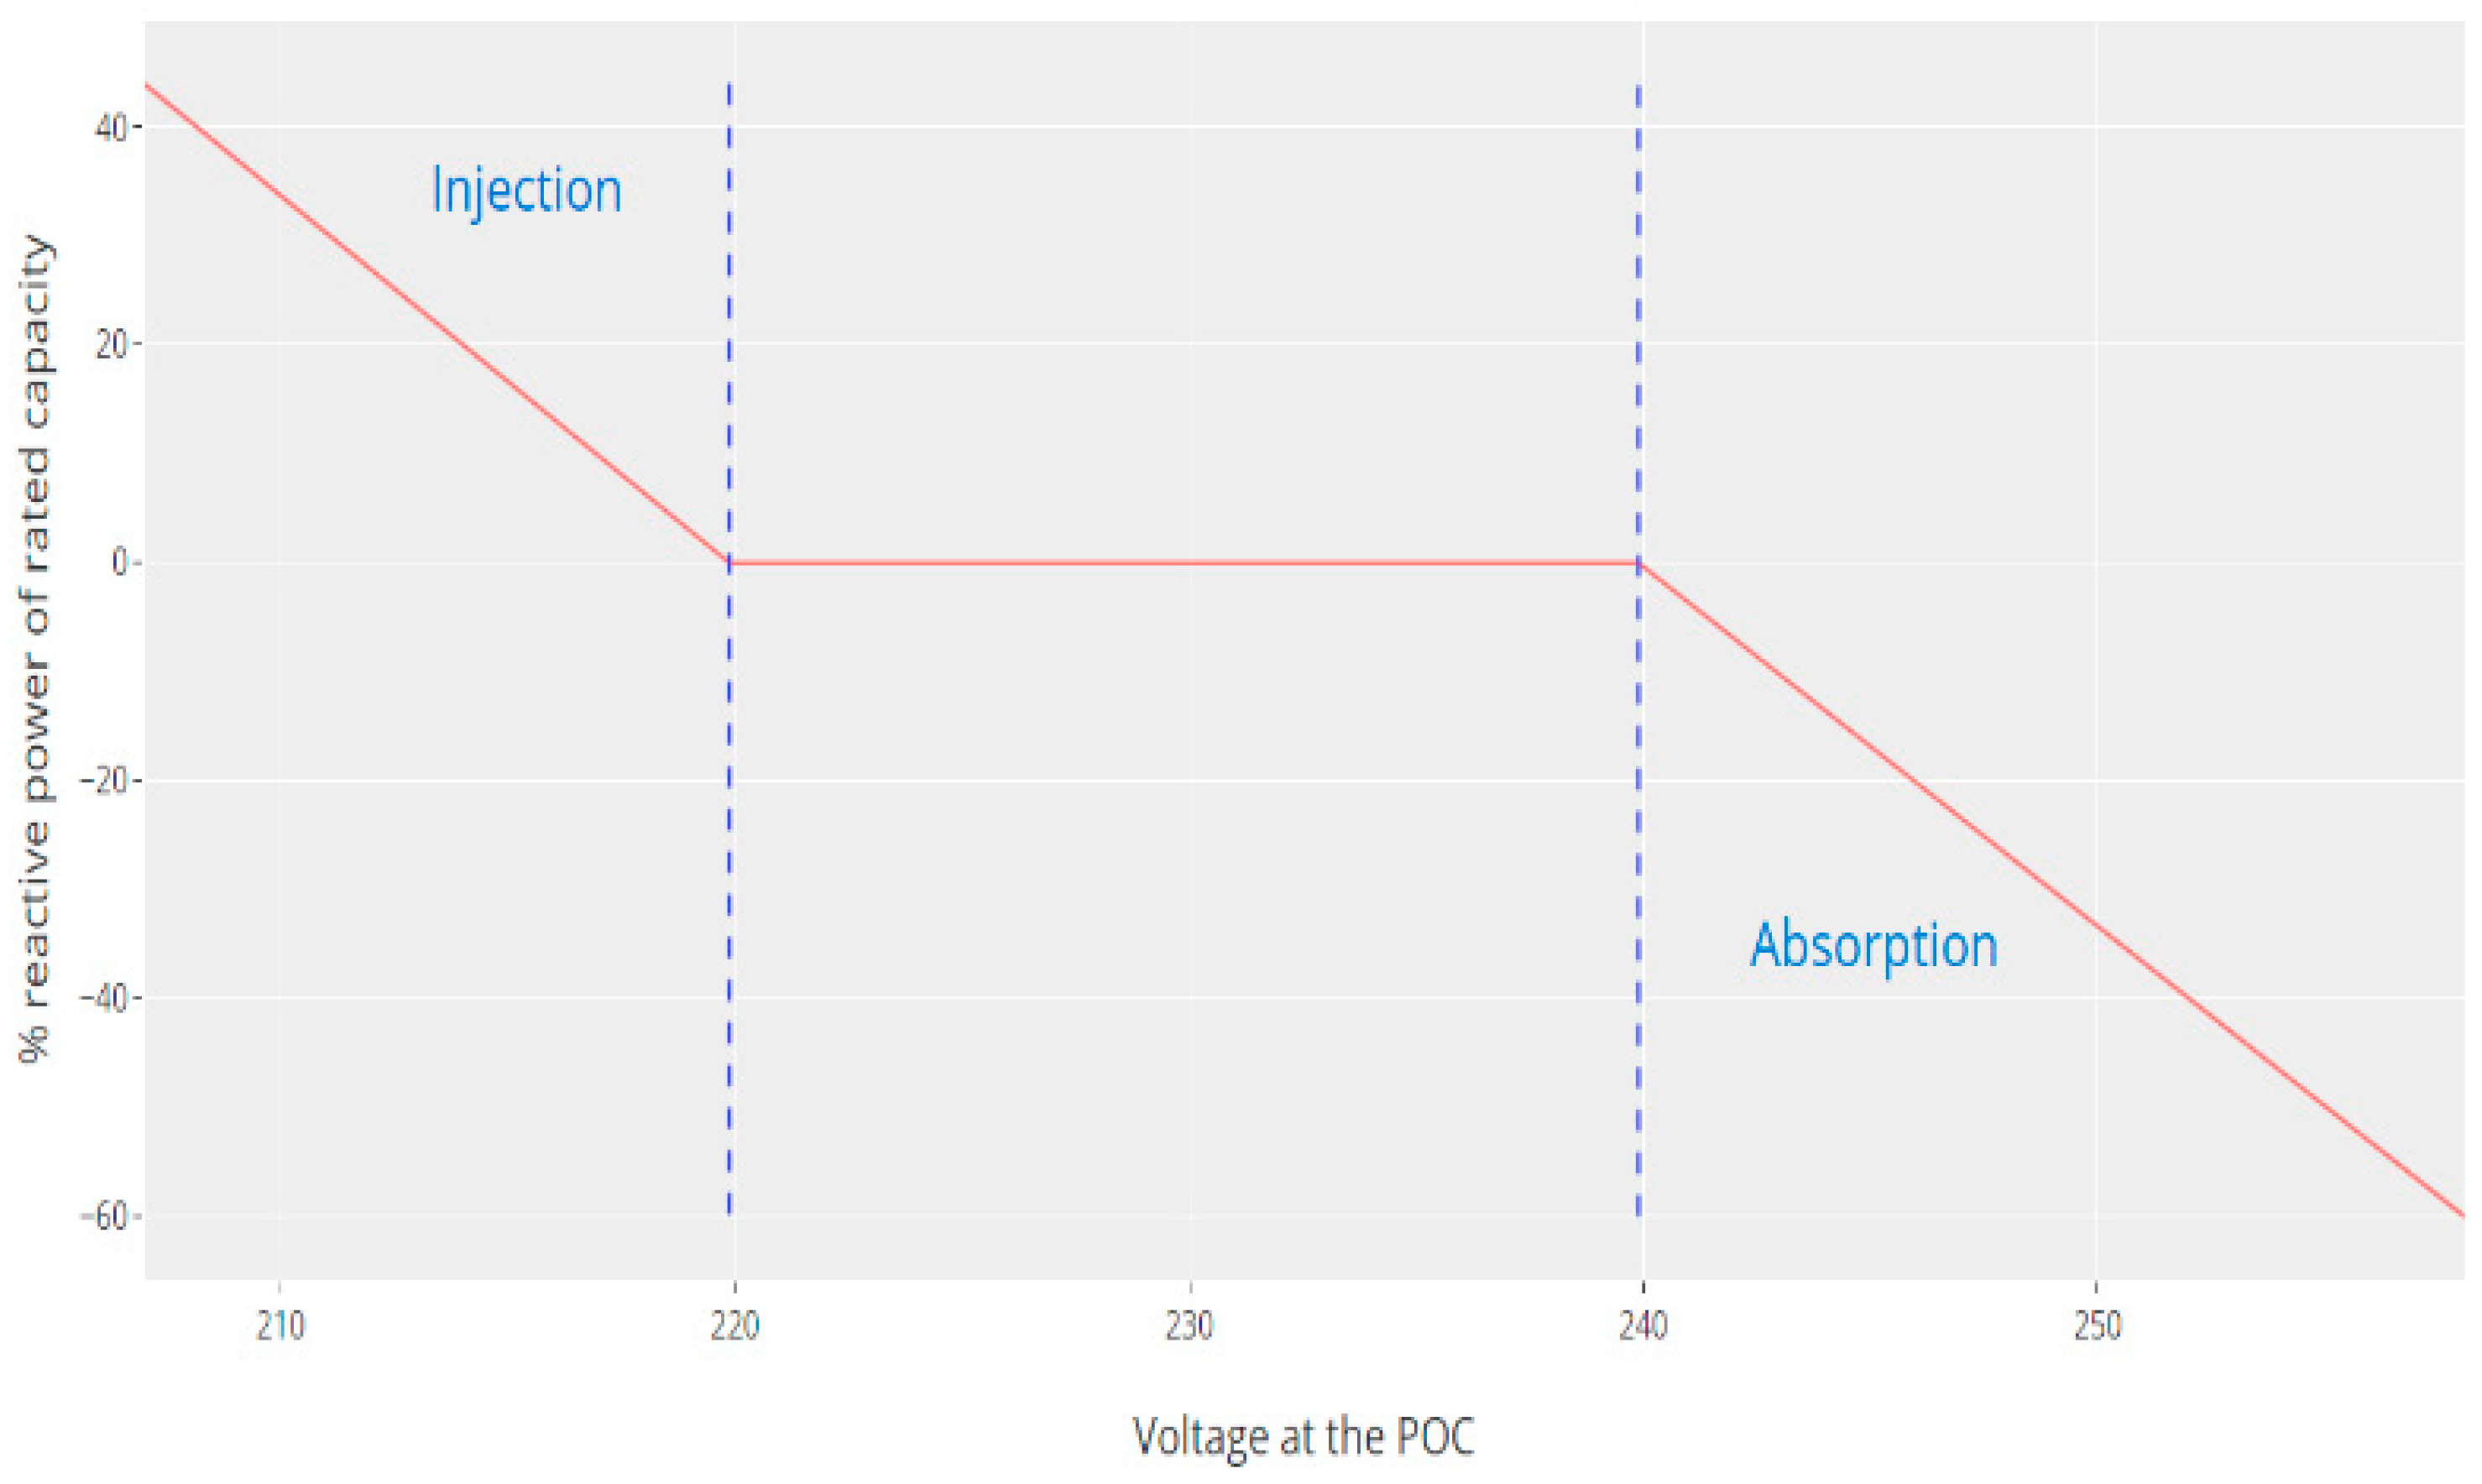
It is recommended that the PV inverter systems connecting to the Australian LV distribution networks must be capable of Volt-Watt and Volt-VAr response modes with VAr priority for voltage regulation. The AS/NZS 4777.2:2020 standard [52] provides the recommended Volt-Watt and Volt-VAr control function settings as illustrated in Figure 2 and Figure 3, respectively.
Local voltage control functions, such as Volt-VAr and Volt-Watt, regulate the voltage at the POC based on the principles outlined in Equation (3). However, Equation (3) does not account for phase unbalance in LV distribution networks. As a result, these traditional voltage control methods, while effective in regulating voltage at the POC, may lead to suboptimal outcomes when applied across the entire LV network. The phase unbalance of the network can be described by the percentage voltage unbalance factor ( V U R % ) as defined in Equation (4) according to the IEC/TR 61000-3-14 standard [53], where U _ 2 and U _ 1 are the negative and positive sequence voltages, respectively. The compatibility level of V U R % is below 2% for LV distribution networks.
V U R % = U _ 2 U _ 1 × 100
Coordinated voltage control offers a host of benefits in contrast to local voltage control schemes when it comes to the management of operational constraints in LV power distribution networks. Coordinated voltage control takes a holistic approach by maintaining a desired voltage profile throughout the power system by optimizing the reactive power flow and active power generation. The work presented in this paper proposes a coordinated voltage control scheme using deep reinforcement learning. A Markov decision process provides the basis for the DRL algorithm implemented in this paper and the following subsections provide a brief introduction to the key concepts of the TD3 DRL algorithm utilized to solve the coordinated voltage control problem.

2.2. Markov Decision Process

A Markov decision process (MDP) is a mathematical framework used to formalize the sequential decision-making process of a decision maker or an agent in an uncertain environment. A MDP can be defined as a 5-tuple { S ,   A , P ,   R ,   γ } where
  • S represents the state space s S .
  • A represents the action space a A .
  • P : S × A × S R + is the transition probability function, with P s s , a being the probability of transitioning into the next state s due to an action a taken in the current state s .
  • R : S × A × S R is the reward function, with r s , a , s being the immediate reward received by an agent after transitioning to the state s from the state s due to an action a .
  • γ is the discount factor γ 0 , 1 .
Given the current state of the environment s t in a standard MDP setting, an agent interacts with the environment at each time step t = { 0 ,   1 , } by taking an action a t . Consequently, the agent receives an immediate reward r s t , a t , s t + 1 and the environment is then transitioned into the next state s t + 1 . The trajectory τ of an agent is the sequence of states and actions due to its interactions with the environment. The sum of discounted rewards G t = 0 T that an agent receives for a trajectory τ of episode length T is given in Equation (5).
G t = 0 T = t = 0 T γ t r s t , a t , s t + 1 = R τ
The policy function π represents the behaviour of an agent based on its observations in the environment. The policy π of an agent can be either stochastic or deterministic. A stochastic policy maps each state s S and action a A to the probability distribution π a s . A deterministic policy maps each state to an action directly, which implies that a = π s . Deterministic policies were adopted for the work undertaken in this paper. The expected return J π defined in Equation (6) is the expectation of the total reward that an agent receives over all possible trajectories under a policy. In deep reinforcement learning, the goal of an agent is to maximize its expected return by optimizing the policy. Therefore, the optimal policy π of an agent can be expressed according to Equation (7).
J π = E τ ~ π R τ
π = arg max π J π
The action value function Q π s , a given in Equation (8) represents the expected return that an agent can receive under a state s taking an action a , following a policy π . According to the Bellman theorem and by leveraging the Markov property which states that future events are only dependent on the current state and not past events, the action value function can be recursively derived as in Equation (9).
Q π s , a = E τ ~ π t = 0 T γ t r s t , a t , s t + 1 | s 0 = s ,     a 0 = a
Q π s , a = E r s , a , s + γ   E Q π s , a

2.3. Twin Delayed Deep Deterministic Policy Gradient Algorithm

TD3 is a state-of-the-art off-policy RL algorithm that can be used to solve MDPs with continuous action spaces. It is implemented in the actor–critic framework that simultaneously optimizes a deterministic policy π s represented by the actor and two action value functions Q s , a represented by two critics. The policy function maps the state s t of the environment to the desired action a t . The action value function maps the state action pairs s t , a t to the expected cumulative reward. In TD3, deep neural networks (DNNs) are used to approximate the policy function and the two action value functions with the parameters ϕ , θ 1 , and θ 2 , respectively. To enhance the stability of learning, TD3 employs a target actor function and the two target critic functions approximated by DNNs with the parameters ϕ , θ 1 , and θ 2 , respectively. A total of six DNNs are used in the TD3 algorithm. All standard RL algorithms, including TD3, which employs DNNs as function approximators, make use of an experience replay buffer B . Training the TD3 agent using randomly sampled past experiences stored in the replay buffer breaks any correlations between consecutive experiences, preventing overfitting to a specific experience sequence.
Since the TD3 algorithm trains a deterministic policy, noise ϵ ~ N ( 0 , σ ) is added to the action a taken by the policy function   π ϕ s to encourage exploration. After the addition of noise, the action needs to be clipped to lie in the valid action range ( a L o w a a H i g h ) as given in Equation (10).
a   c l i p   π ϕ s + ϵ , a L o w ,     a H i g h ,                                 ϵ ~ N ( 0 , σ )
To minimize the exploitation of action value function approximation errors by the policy function, the TD3 algorithm employs the trick of target policy smoothening, in which clipped noise is added to the target action a ~ given by the target policy function π ϕ s . The target action is then clipped to lie in the valid action range as given in Equation (11).
a ~   c l i p   π ϕ s + ϵ , a L o w ,     a H i g h ,               ϵ   ~   c l i p ( N 0 , σ ~ , c ,   c )
The parameters of the two critic functions are optimized by using gradient descent to minimize their respective loss functions as given in Equations (12) and (13), where D is a batch of experiences sampled from the replay buffer B . To address the overestimation bias that generally persists in all DRL algorithms, TD3 employs the clipped double-Q learning trick that uses a single target y r , s to calculate the loss functions of both critic functions. The target y r , s is calculated using the minimum of two target critics Q θ 1 and Q θ 2 as given in Equation (14).
L θ 1 = E s ,   a ,   r ,     s ~ D Q θ 1 s , a y r , s 2
L θ 2 = E s ,   a ,   r ,     s ~ D Q θ 2 s , a y r , s 2
where
y r , s = r s , a + γ min i = 1,2 Q θ i ( s , a ~ )
The parameterized policy network π ϕ can be updated by taking the gradient of the expected return J ϕ according to Equation (15), where P π is the discounted state distribution. Another trick adopted by the TD3 algorithm is the delayed policy update, in which the policy and the target networks are updated less frequently than the critic networks. This improves stability and reduces the variance of the policy updates, leading to faster convergence and better performance. The policy and the target networks are generally updated once for every two critic network updates.
ϕ   J ϕ = E s ~ P π a Q θ 1 π s , a | a = π ϕ s ϕ π ϕ s
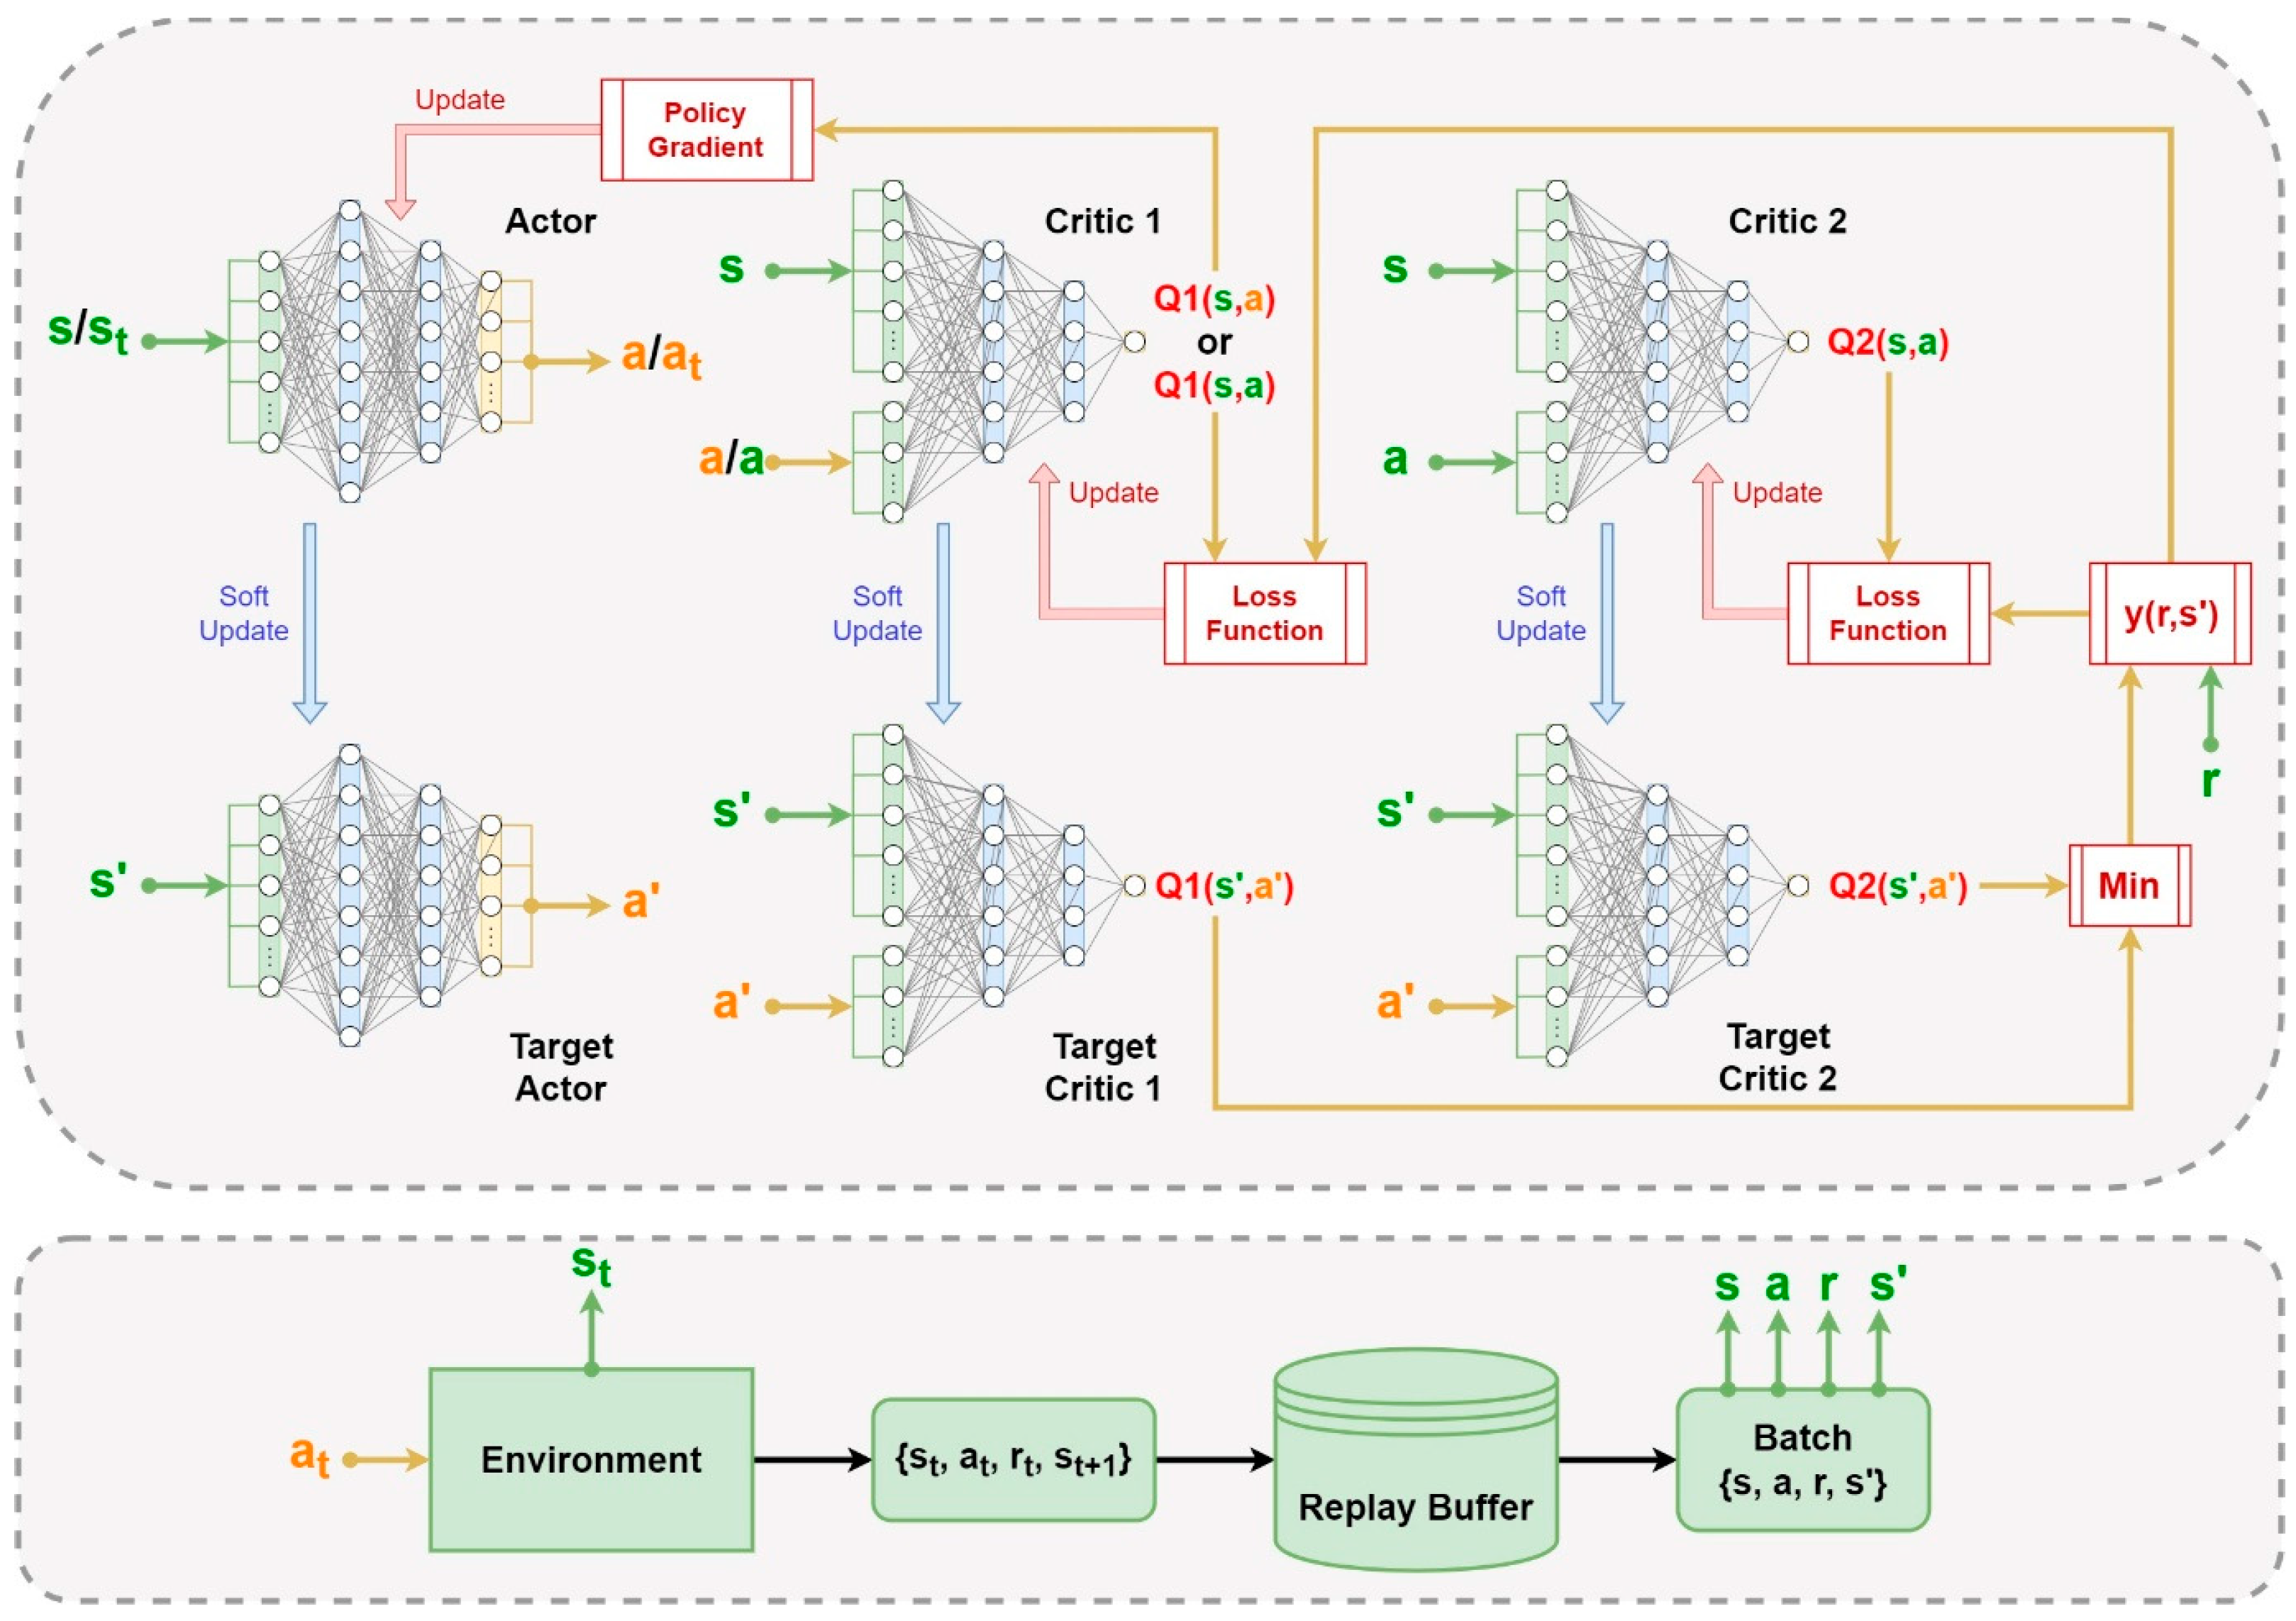
The parameters of the target critic networks and target actor network are updated according to the soft update rules given in Equations (16) and (17), respectively. Rather than directly copying the parameters of the main networks to the target networks, the hyperparameter ρ 1 ensures that the target networks are updated slowly and smoothly, which improves the learning stability and overall performance of the algorithm. The TD3 algorithm is summarized in Algorithm 1 and a diagrammatic illustration is given in Figure 4.
θ i ρ θ i + ( 1 ρ ) θ i
ϕ ρ ϕ + ( 1 ρ ) ϕ
Algorithm 1. TD3 Algorithm-Twin delayed deep deterministic policy gradient.
1: Initialize   critic   networks   Q θ 1 ,   Q θ 2   and   actor   network   π ϕ   with   random   parameters   θ 1 , θ 2   and   ϕ respectively.
2: Initialize   target   networks   Q θ 1 ,   Q θ 2   and   π ϕ   setting   target   parameters   equal   to   main   network   parameters   θ 1 θ 1 ,   θ 2 θ 2   and   ϕ ϕ
3: Initialize   the   empty   replay   buffer   B ,   set   u p d a t e _ d e l a y = 2 ,   set   b a t c h _ s i z e = s i z e D = N
4:for  t = 1  to  T  do:
5:  Observe state s   and   select   action   a   c l i p   π ϕ s   ϵ , a L o w ,     a H i g h   with   exploration   noise   ϵ ~ N ( 0 , σ )
6:  Execute action a in the environment. Then attain   reward   r   and   observe   new   state   s
7:  Store experience tuple { s ,     a ,     r ,     s }   in   replay   buffer   B
8:  if  n u m b e r _ o f _ t r a n s i t i o n s _ i n _ B s i z e D :
9:   Randomly sample a batch D   of   N   transitions   { s ,     a ,     r ,     s }   from   B
10:   Calculate target actions a ~ with clipped noise ϵ   ~   c l i p ( N 0 , σ ~ , c ,   c )
    a ~   c l i p   π ϕ s + ϵ , a L o w ,     a H i g h
11:   Calculate the target y r , s for the critic update
    y r , s = r s , a + γ min i = 1,2 Q θ i ( s , a ~ )
12:   Update critics Q θ 1 and Q θ 2   by   gradient   decent   using   L θ 1   and   L θ 2 respectively
    L θ i = E s ,   a ,   r ,     s ~ D Q θ i s , a y r , s 2               for   i = 1 ,   2
13:   if  t   m o d   u p d a t e _ d e l a y = 0  then:
14:    Update ϕ by the deterministic policy gradient:
     ϕ J ϕ = E s ~ P π a Q θ 1 π s , a | a = π ϕ s ϕ π ϕ s
15:    Update target networks with ρ 1 :
     θ i ρ θ i + ( 1 ρ ) θ i             for   i = 1 ,   2
     ϕ ρ ϕ + ( 1 ρ ) ϕ
16:   end if
17:  end if
18:end for

3. Design of the TD3 Agent

In this paper, two different TD3 agents were developed: one to assess the network HC, and another one to perform coordinated voltage control in the electricity distribution network. This section details the application of DRL for coordinated voltage control and the parameters of the two TD3 agents, including their state space, action space, and reward function.

3.1. Hosting Capacity Assessment

The main objective of the TD3 agent used for the HC assessment is to identify the maximum possible PV rating for each customer allowed to operate in the electricity distribution network without any constraint violations under a coordinated voltage control scheme.
Environment: The environment that the TD3 agent interacts with is the actual electricity distribution network. A modified DIgSILENT PowerFactory model of a real LV distribution network is used as the environment for the agent to interact with. For the HC assessment, 100% PV penetration is assumed in terms of number of customers.
State: The TD3 agent for the hosting capacity assessment makes the following set of two observations at each time step for each of the N number of customers connected to the LV network.
  • G H I i i N   = global horizontal irradiance ( G H I 0 ,   1 ) at customer i ;
  • V i   i N C C P = voltage at the customer connection point (CCP) of customer i .
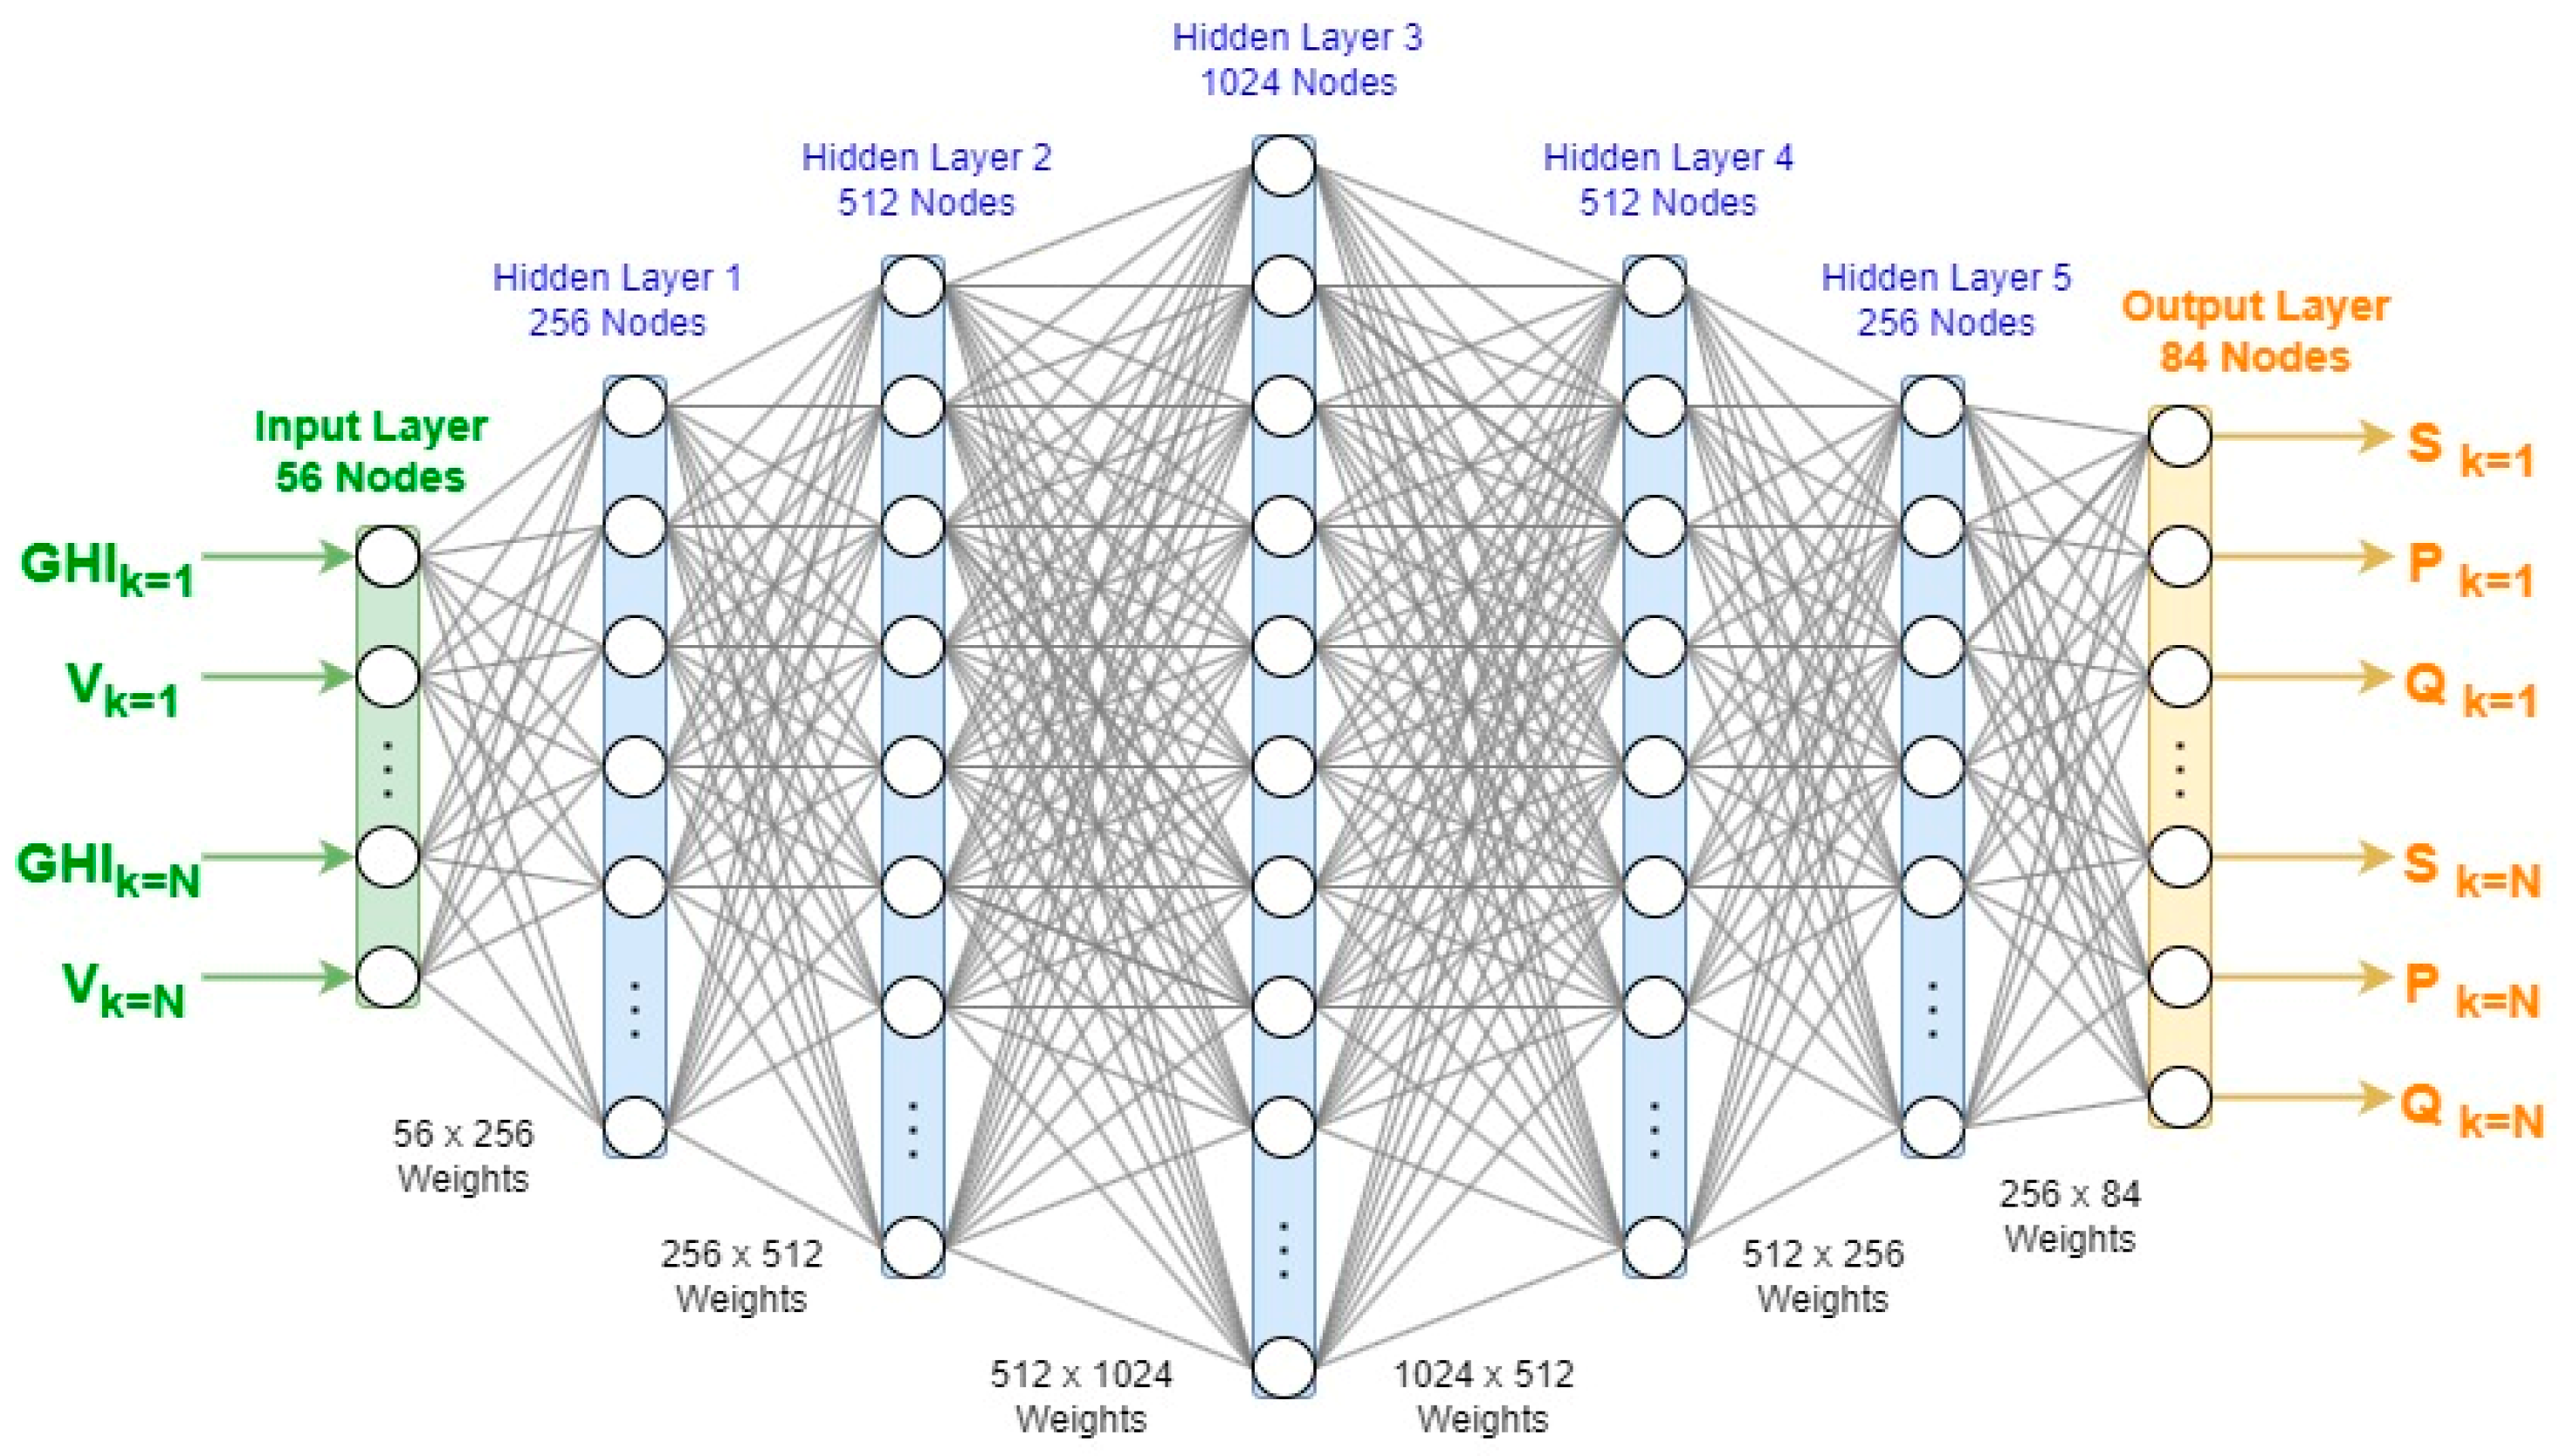
The total number of states observed by the TD3 agent at each time step is determined to be 2 N . Solar irradiation data are essential for calculating the available active power of each customer inverter at each time step. If the modelled network only covers a small geographical area, the global horizontal irradiance (GHI) can be assumed to be the same for all the customers. The forecasted GHI data are used as input states for the HC assessment. The voltage V i C C P at the CCP of customer i is acquired from the load flow simulation of the modelled network. The states are given as inputs to the actor and the critic networks as illustrated in Figure 5 and Figure 6, respectively.
Action: The actions are approximated by the actor network of the TD3 agent. At each time step, for each of the N numbers of PV inverters connected to the LV network, the actor network approximates three sets of actions a = a s , a P ,   a Q described below:
  • a s actor network output to determine the maximum PV inverter rating for customers a s = a s 1 , a s 2 , a s 3 , , a s N | a s i R , 0 a s i 1 , f o r   i = 1,2 , 3 , , N ;
  • a P actor network output to determine the active power output of the inverters a P = a P 1 , a P 2 , a P 3 , , a P N | a P i R , 1 a P i 1 , f o r   i = 1,2 , 3 , , N ;
  • a Q actor network output to determine the reactive power output of the inverters a Q = a Q 1 , a Q 2 , a Q 3 , , a Q N | a Q i R , 1 a Q i 1 , f o r   i = 1,2 , 3 , , N .
At each time step, the TD3 agent takes 3 N actions, where each action is designed to individually control the active power injection and reactive power absorption/injection. These actions aim to regulate the voltage at the respective POCs based on the principles outlined in Equation (3), while simultaneously ensuring an optimal coordinated voltage control outcome across the entire LV network. As illustrated in Figure 5 and Figure 6, actions are the outputs of the actor network and are given as inputs to the critic network along with the states to approximate the Q-value or the expected cumulative reward.
The maximum PV inverter ratings of customers S P V can be determined by using the action set a s and the scaling factor H C m a x given in Equation (18). The scaling factor H C m a x can be an extremely high estimate for a PV inverter rating of a customer that is unlikely to be reached at any point in time in the future.
S P V = H C m a x × a s
To ensure fairness for all customers when determining their maximum PV inverter ratings S P V and the active power outputs P o u t in the hosting capacity assessment, two fairness parameters, λ 1 and λ 2 , were introduced. The PV inverter ratings of customers are fairly allocated by the TD3 algorithm by clipping S P V using λ 1 0 ,   1 according to the range specified in Equation (19), where μ S P V is the mean PV inverter rating of N customers as given in Equation (20). A low λ 1 value assigns similar PV ratings for all customers with a high degree of fairness and a high λ 1 value means an unfair assignment with high variation between the allocated PV inverter ratings for customers.
1 λ 1 · μ S P V   S P V 1 + λ 1 ·   μ S P V
μ S P V = 1 N i = 1 N S P V i
The available active power P a v a i l a b l e for an inverter i is calculated according to Equation (21). The active power outputs P o u t of customer inverters are derived using the parameter λ 2 0 ,   1 as given in Equation (22).
P a v a i l a b l e = S P V × G H I
P o u t = P a v a i l a b l e ( 1 λ 2 ) + ( λ 2 · a P )
The parameter λ 2 dictates the fairness of the assigned P o u t values by clipping the minimum possible P o u t assigned to any customer to be P a v a i l a b l e 1 λ 2 . A lower value for λ 2 means that the variance in P o u t between customers is lower and a fair opportunity is given to all the customers to export active power to the electricity distribution grid. A higher λ 2 value may cause the TD3 algorithm to determine the P o u t of customers in a more unfair manner, giving precedence to maximizing the aggregate active power output of the LV network rather than the individual active power outputs of the customers. For example, a higher λ 2 may cause the customers that are electrically located further from the distribution transformer to export significantly less active power than the customers that are located electrically closer to the distribution transformer.
The reactive power output Q o u t of the customer inverters is determined according to Equation (23). Before undertaking the HC assessment, the parameters λ 1 ,   λ 2 , and H C m a x must be defined in a way that leads to fair monetary gain for all the customers and the DNSP participating in the proposed coordinated voltage control scheme.
Q o u t = a Q × S P V 2 P o u t 2
Actor and critic networks: As illustrated in Figure 4, the TD3 algorithm utilizes a total of six feed-forward neural networks with two actor networks and four critic networks. Diagrammatic illustrations of the actor and critic networks are given in Figure 5 and Figure 6, respectively. Both the actor and critic networks consist of an input layer followed by five hidden layers, containing {256, 512, 1024, 512, 256} neurons, respectively, each utilizing ReLU activation functions. The output layer employs a tanh activation function to introduce nonlinearity into the model. A summary of the TD3 algorithm parameter settings for HC assessment is given in Table 2. The learning rates for both the actor and critic, along with the batch size, were optimized through exhaustive testing of various combinations.
Reward: The reward function is a core component of the TD3 algorithm that provides clear informative signals to guide the agent’s learning process effectively. An intuitive design of a reward function requires a cautious analysis of an agent’s objectives, environment dynamics, operational constraints, and potential trade-offs. The reward function should assign higher rewards to the actions that lead to the desired outcomes while penalizing actions that lead to undesirable outcomes. The reward function R H C of the HC assessment for action a at time step t is formulated as given in Equation (24).
R H C =   δ N i = 1 N   P c u r t a i l e d i , t H C m a x × G H I i , t   + V m a x t V N o m + V m i n t V N o m + η  
where
P c u r t a i l e d i , t = H C m a x × G H I i , t P o u t i , t
V N o m = nominal bus voltage of the LV distribution network;
V m a x t = maximum voltage of the voltages observed at the PCCs of customers at time t ;
V m i n t = minimum voltage of the voltages observed at the PCCs of customers at time t .
The parameter δ R + of Equation (24) is the weight that regulates the degree of reward given between voltage regulation and minimizing active power curtailment. A higher value for δ results in a higher reward given for minimizing active power curtailment over voltage regulation and a lower value for δ results in a higher reward given for voltage regulation over minimizing active power curtailment. The parameter η is the penalty factor that determines the reward in an instance of operational constraint violation. The voltage constraint violations for this study are defined in Equations (25) and (26). The distribution transformer loading constraint is defined in Equation (27). The parameter η typically takes a very large value in the event of operational constraint violations and η = 0 in the event of no operational constraint violations.
V m a x t < V m a x _ l i m i t
V m i n t > V m i n _ l i m i t
S T r f t < S T r f _ r a t e d
where
V m a x _ l i m i t = maximum voltage limit (typically, the voltage that an inverter trips);
V m i n _ l i m i t = minimum voltage limit;
S T r f _ r a t e d = rated capacity of the distribution transformer;
S T r f t = distribution transformer load at time t .

3.2. Coordinated Voltage Control

A separate TD3 agent is required to be designed, and its parameters must be fine-tuned to attain the best performance for coordinated voltage control. The main objective of the TD3 agent for coordinated voltage control is to determine the active and reactive power outputs of the customer PV inverters. The design of the TD3 agent for coordinated voltage control is similar to the HC assessment with several alterations.
Environment: The environment used for training the TD3 agent is the same as the HC assessment, which is a modified DIgSILENT PowerFactory model of a real LV distribution network. The customer PV ratings and the percentage PV penetration in the LV distribution network must be identified before training the TD3 algorithm. Once the training using the simulation model is complete, the TD3 agent can be implemented in the real LV distribution network for coordinated voltage control.
State: The TD3 agent makes a set of four observations described below at every time step for each of the N number of customers. Therefore, the total number of states observed at each time step is 4 N .
  • G H I i i N = global horizontal irradiance ( G H I 0 ,   1 ) at customer i ;
  • V i   i N C C P = voltage at CCP of customer i ;
  • P i   i N C C P = active power at CCP of customer i ;
  • Q i   i N C C P = reactive power at CCP of customer i .
For training, either forecasted or historical GHI data can be used, and for online implementation, it is recommended that real-time GHI data are used as inputs to the TD3 agent. During training, the states V i C C P , P i C C P , and Q i C C P are acquired by the load flow software, but for online implementation these inputs can be procured by real-time smart meter measurements.
Action: At each time step, for each of the N number of PV inverters, the actor network approximates two sets of actions a = a P ,   a Q as described below. The total number of actions taken by the TD3 agent at each time step is 2 N .
  • a P actor network output to determine the active power output of the inverters a P = a P 1 , a P 2 , a P 3 , , a P N | a P i R , 1 a P i 1 , f o r   i = 1,2 , 3 , , N ;
  • a Q actor network output to determine the reactive power output of the inverters a Q = a Q 1 , a Q 2 , a Q 3 , , a Q N | a Q i R , 1 a Q i 1 , f o r   i = 1,2 , 3 , , N .
The active power output P o u t of customers is calculated according to Equations (21) and (22). However, the rated capacity of the customer PV inverters S P V in Equation (21) is a fixed value, unlike for the HC assessment. The reactive power outputs of the PV inverters are calculated similar to the HC assessment, which is given in Equation (23). It should be noted that in the proposed coordinated voltage control scheme, priority is given to the active power output of the PV inverters over the reactive power output.
Actor and critic networks: The hidden layers of the actor and critic networks for coordinated voltage control are similar in design to the TD3 agent of the HC algorithm. The input and output layers of the actor and critic networks are modified according to the actions and states defined in the above section. To maintain a certain level of consistency for the HC assessment and the proposed coordinated voltage control method, both TD3 agents must be designed with more or less similar parameters. Table 3 provides a summary of the parameter settings for the TD3 agent. Similarly to the hosting capacity assessment, these parameters were optimized through exhaustive testing of various combinations, considering performance, memory efficiency, and computation time.
Reward: The reward function for coordinated voltage control R V C follows a similar design to the HC assessment with slight deviations and is given in Equation (28). The values for parameters δ and η need to be redefined for coordinated voltage control to guarantee peak performance in voltage regulation and the optimal minimization of curtailments by the TD3 agent.
R V C =   δ N i = 1 N   P c u r t a i l e d i , t S P V i × G H I i , t   + V m a x t V N o m + V m i n t V N o m + η  
where
P c u r t a i l e d i , t = S P V i × G H I i , t P o u t i , t

4. Case Study

Simulations were carried out on a DIgSILENT PowerFactory model of a real 3-phase LV distribution network that supplies electricity to 28 customers. In this section, the extent of HC enhancement of the modelled LV network due to the proposed TD3 coordinated voltage control scheme is quantified and comparative results with various benchmark voltage control methods are presented.

4.1. Experimental Setup

A schematic diagram of the modelled LV distribution network is given in Figure 7. The MV section of the network was modelled as an equivalent impedance and a variable voltage source. The main feeders of the network were 3-phase and the service feeders that connect to the CCP were single-phase. This particular LV network was selected for the case study as it represents a typical LV distribution network with a significant level of phase unbalance. The electrical characteristics and operational constraints of the modelled LV network are given in Table 4.
To simulate the maximum level of PV penetration, every customer was assumed to own a PV system that connects to the LV distribution network. Customer load data were acquired from historical smart meter measurements and each customer load was modelled with a constant power factor of 0.95. Historical and forecasted GHI data were attained through data providers such as Solcast. For training and evaluation of the TD3 agents, 3 separate load and GHI time series data sets were used as given in Table 5. Data Set 1 consisted of time series data of 120 days at 30 min time steps that equally captured all seasonal variations from the past year. Data Set 2 was similar in size and resolution to Data Set 1 but consisted of time series data for the forecasted year. The TD3 agents for the HC assessment and coordinated voltage control were trained using Data Set 1. The HC of the LV network was evaluated using Data Set 2 and the performance of the trained TD3 voltage control agent was evaluated using Data Set 3, which consisted of the time series data of a single day at 5 s resolution.
The proposed TD3 agents were built in Python using TensorFlow 2 and due to the relatively small size of the TD3 networks, only the CPU was utilized for training instead of a GPU that may suit larger networks. The hyperparameters of the TD3 algorithms were optimized through a series of exhaustive simulations and only the tuned hyperparameters were used to demonstrate the results.

4.2. Quantification of the Enhanced HC

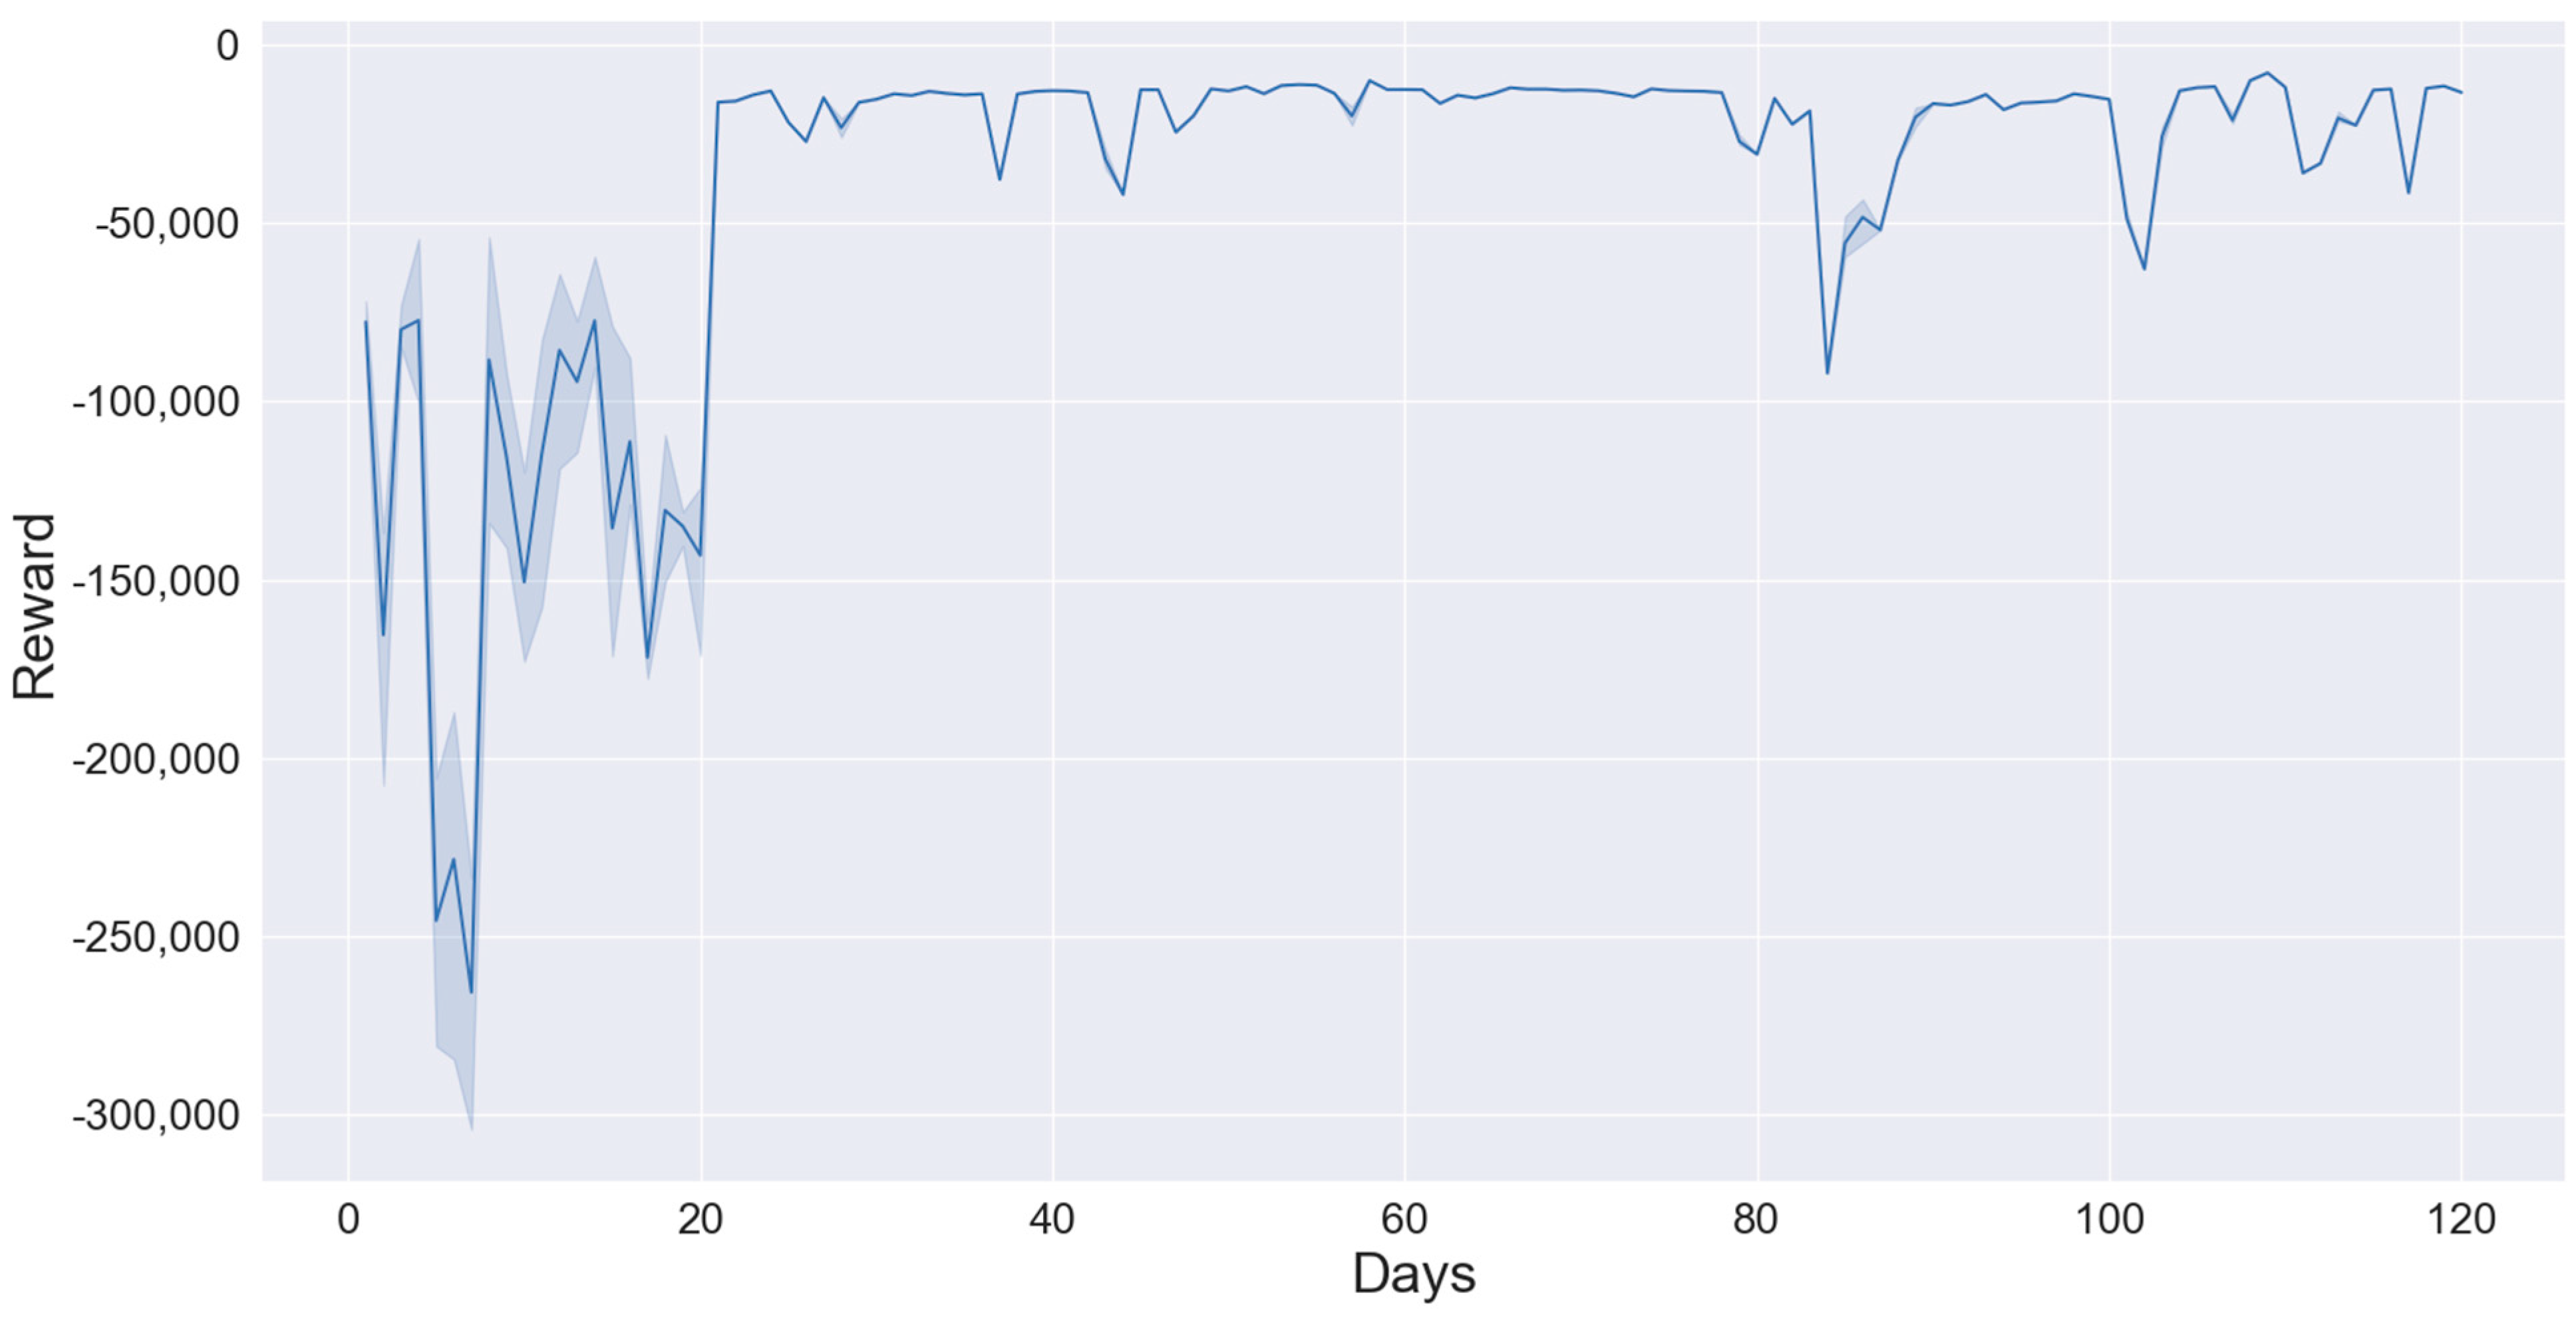
The HC assessed in this section indicates the extent of HC enhancement through coordinated voltage control. The proposed methodology to quantify the enhanced HC is summarized in Algorithm 2. The TD3 agent for HC assessment was trained using the time series Data Set 1 that consisted of 5760 time steps. For each time step, 5 episodes were evaluated, resulting in a total of 28,800 learning episodes. Upon successful training of the TD3 agent, the cumulative reward of every 48 time steps (1 day) converged to a high value. Once the agent learned an optimal policy at the end of the learning process, the weight parameters of the TD3 networks were saved. The learning curve of the TD3 agent used for the HC assessment is given in Figure 8.
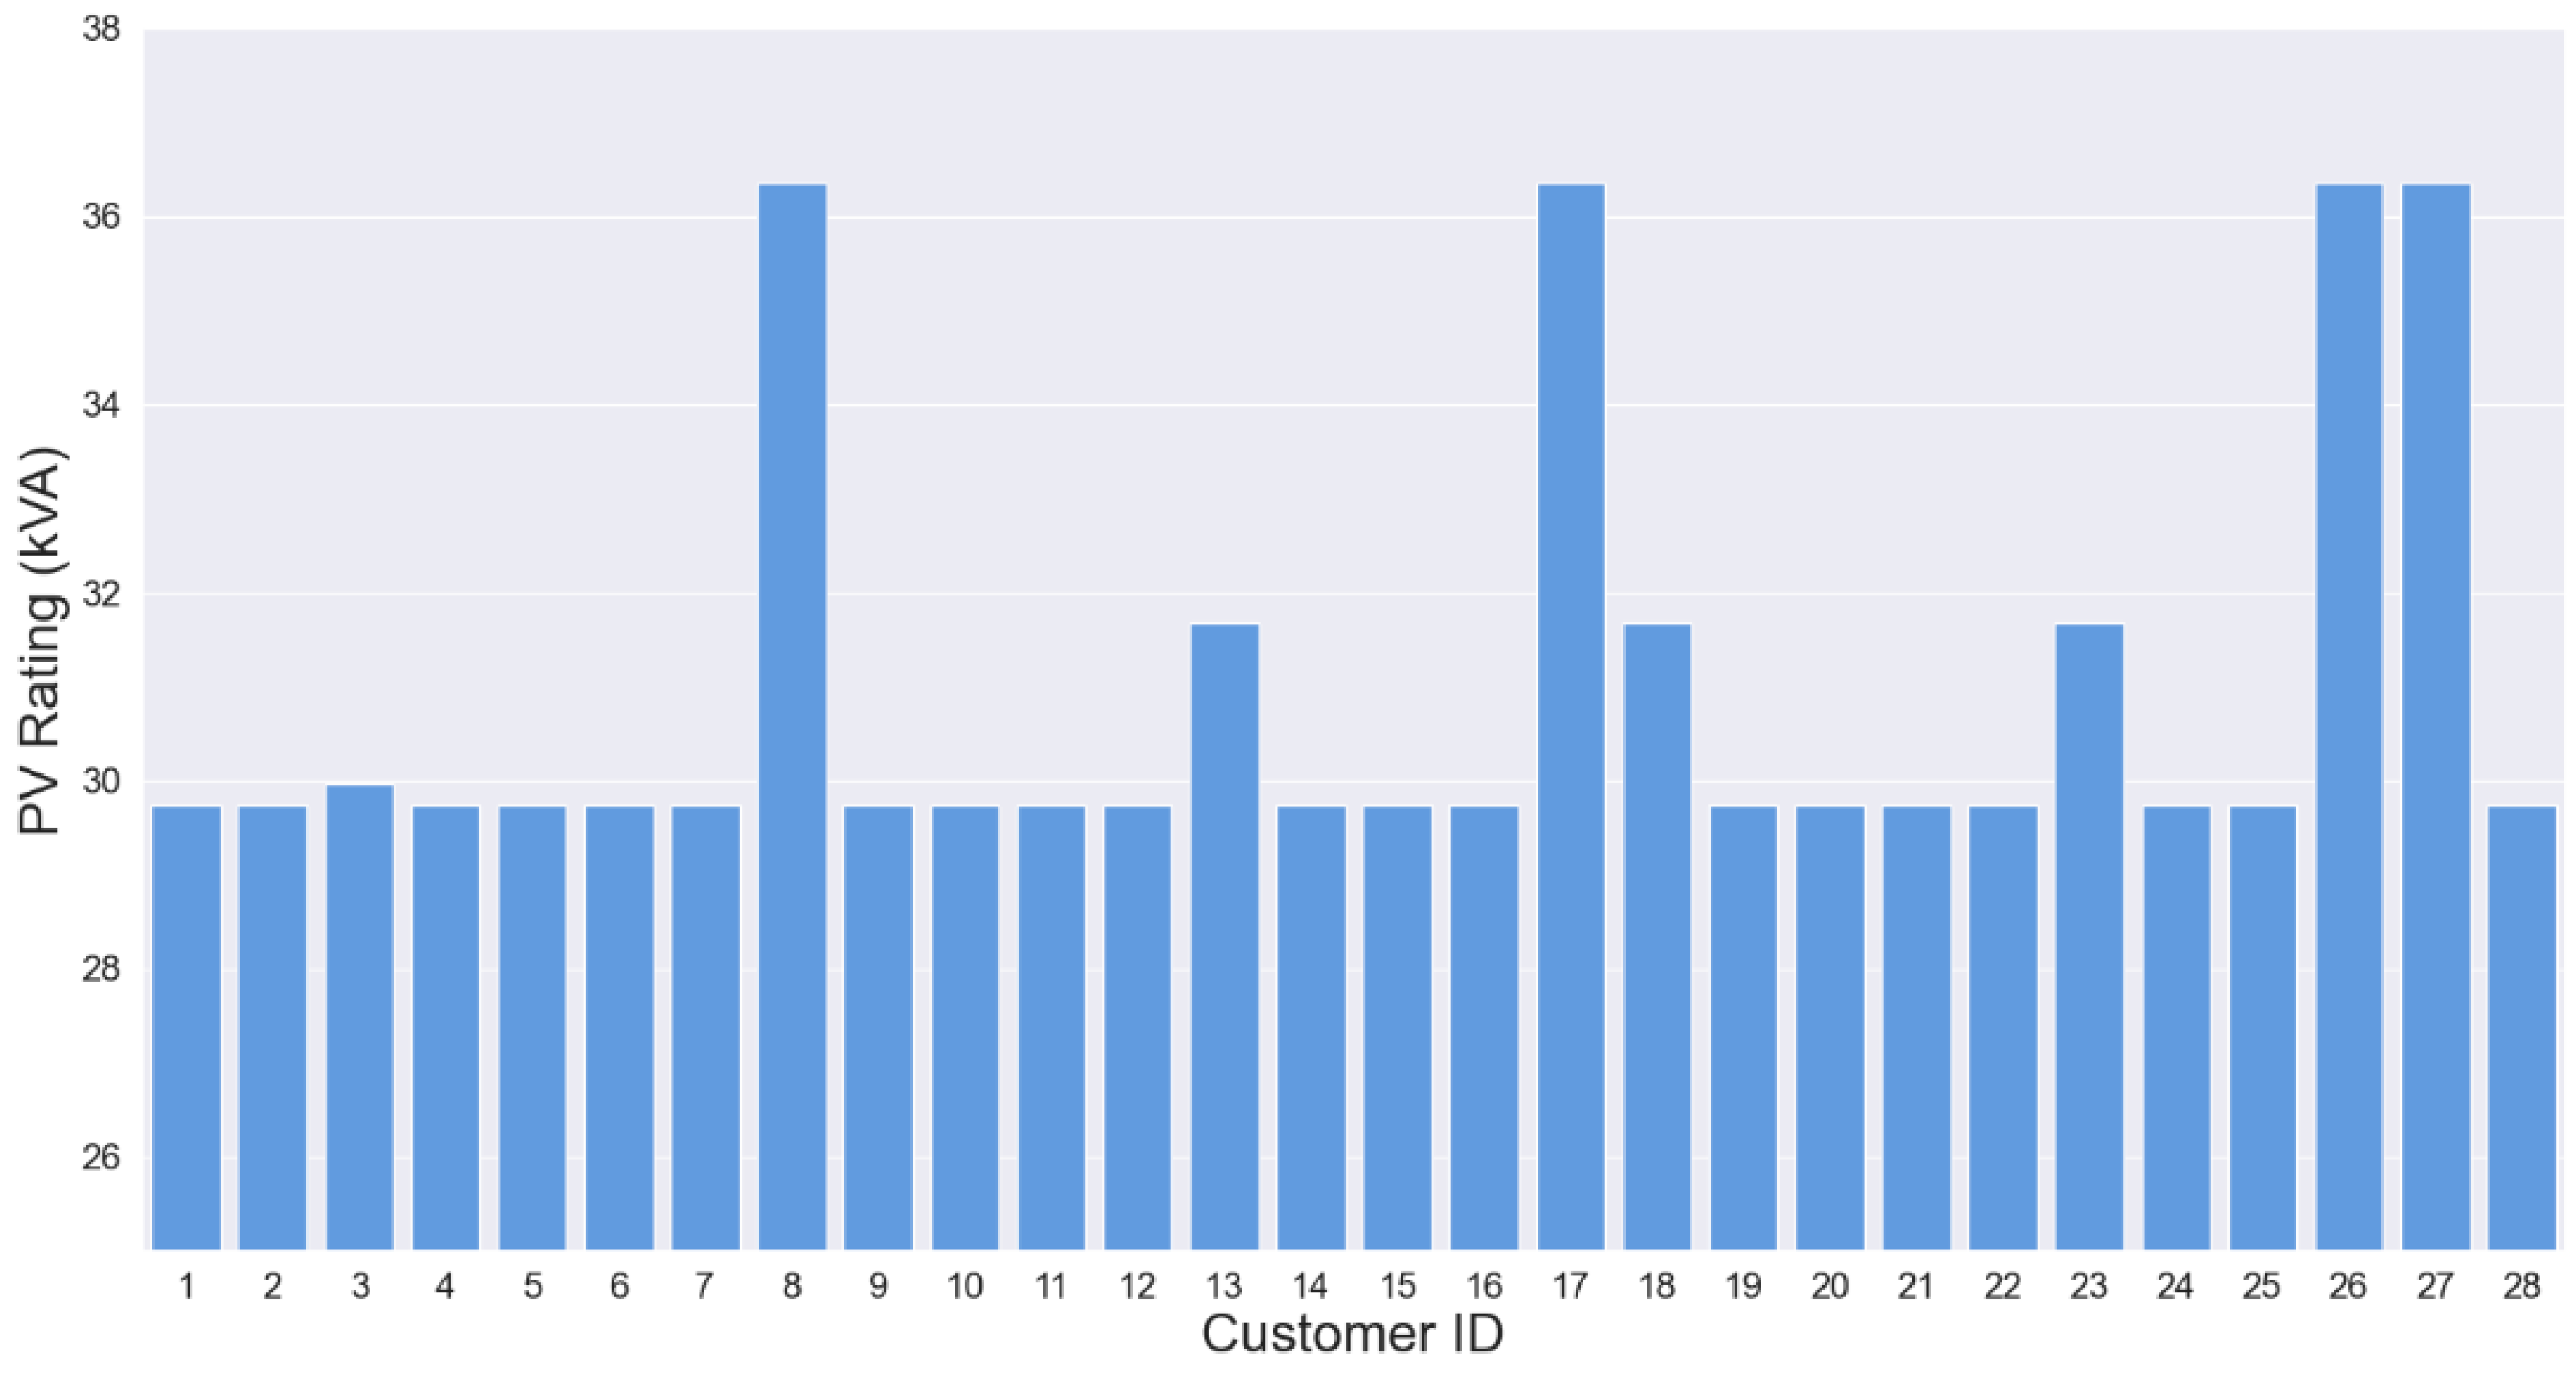
The HC for this study was evaluated individually for each customer at every time step. In other terms, the HC for a customer was defined as the maximum PV inverter rating that a customer is allowed to connect to the network without causing any network operational constraint violations. To evaluate the HC of all the customers, a time series power flow simulation was undertaken using Data Set 2, which consisted of forecasted data, and the TD3 agent was initialized with the saved weight parameters from the learning process. At every 30 min time step of the simulation, the actor network of the TD3 agent predicted the PV inverter rating, active power output, and reactive power output of all the customers. The PV inverter rating predicted by the TD3 agent was identified as the HC of a particular customer at a given instance of time. For the simplicity of analysis, the minimum of the set of PV inverter rating sizes decided by the TD3 agent throughout the time series simulation can be taken as a single quantified HC value for a customer. The identified HC values for each customer by taking the minimum of the PV ratings throughout the time series simulation are given in Figure 9.
Algorithm 2. Summary of the enhanced HC assessment methodology-Training and evaluation process of TD3 agent for HC assessment
1:Collect data sets 1 and 2. Define λ 1 , λ 2 = 0.1
2:Define the values for reward parameters { δ , η } and hyperparameters { α , β , γ , σ , ρ , B a t c h   s i z e }
3:Initialize T D 3 H C agent for HC assessment with random weights w H C = { θ 1 , θ 2 , ϕ }
4:Using Data Set 1: for t = 1   to   T do:
5:   Take action a     π ϕ s and execute power flow calculation for time step t
6:   Train the T D 3 H C agent (steps 6 to 17 in Algorithm 1)
7:end for
8: Save   trained   weights   w H C
9: Initialize   a   new   T D 3 H C   agent   with   trained   weights   w H C for HC evaluation
10: Using   Data   Set   2 :   for   t = 1   to   T  do:
11:   Take action a     π ϕ s and execute power flow calculation for time step t
12: Check   for   operational   constraint   violations   and   save   S P V i , t   where ;   i = 1 ,   2 ,   3 , , N
13:end for
14:if total operational constraint violations = 0 then:
15:   Identify the   hosting   capacity   for   each   customer   i H C i = min t [ 1 , T ] S P V i , t
16:else: go back to step 2
17:end if
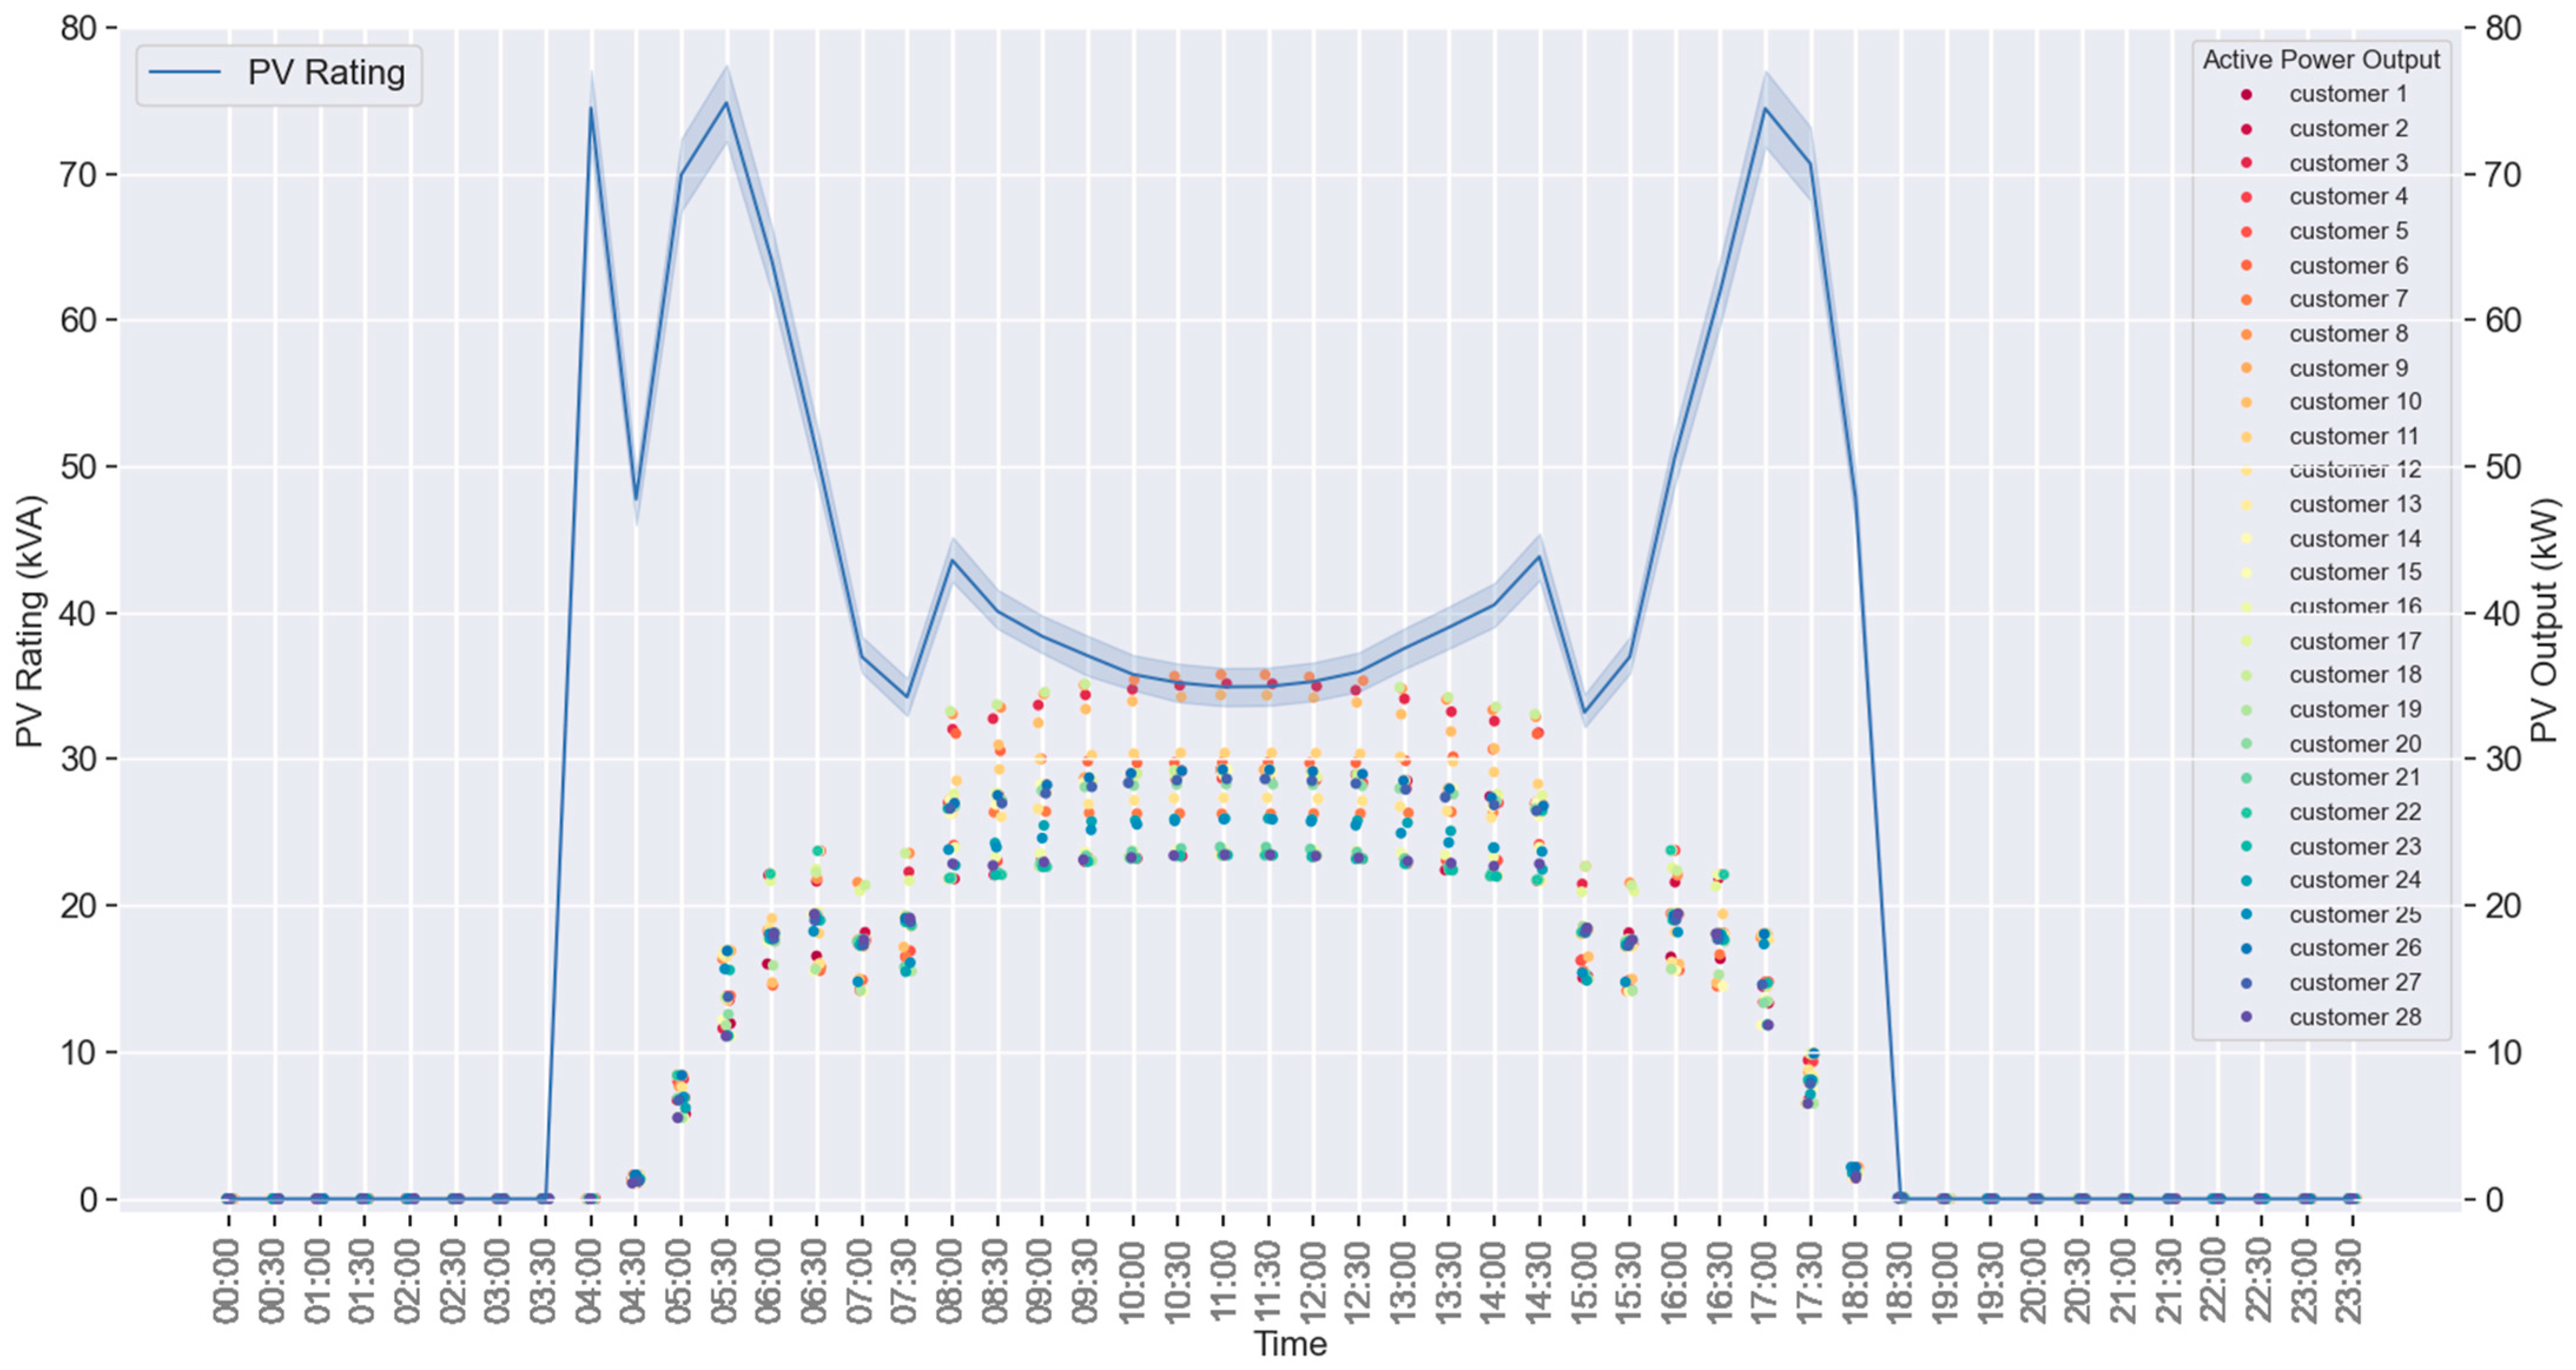
For this case study, the two fairness parameters λ 1 and λ 2 were both defined as 0.1, which ensures that the PV ratings of customers did not vary more than 10% from the mean of all customer PV ratings, and the minimum possible active power output of the PV inverters was clipped to 90% of the available active power. The PV ratings and the active power outputs of the customers estimated by the TD3 algorithm for a single day are illustrated in Figure 10. It should be noted that during periods of low solar irradiation, the PV ratings estimated by the TD3 agent reach the H C m a x value defined in the reward function. The H C m a x parameter prevents the TD3 agent from estimating unrealistically high PV ratings during periods of low solar irradiation to maximize its active power output. The enhanced HC quantified in this study with coordinated voltage control is defined by the first violation of operational constraints. The TD3 agent attempts to learn a policy that does not violate any operational constraints at any given instance of time. The evaluation of the trained TD3 agent was performed by checking for any operational constraint violations throughout the time series simulation that used Data Set 2. If no operational constraint violations were observed, the TD3 agent was considered to be trained successfully. If the actions taken by the TD3 agent led to one or more operational constraint violations, the training procedure had to be performed again with different parameters.

4.3. Training and Performance Testing of the TD3 Agent Used for Coordinated Voltage Control

Another TD3 agent was developed to accurately simulate the performance of the proposed coordinated voltage control scheme in a real-world LV distribution network. For the simulations performed in this section, the PV inverter ratings of customers identified through the HC assessment in Section 4.2 are used to further demonstrate the performance of the proposed algorithm when the LV network is operating at its HC limit. A summary of the methodology used for the training and evaluation process of the proposed TD3 agent for coordinated voltage control is given in Algorithm 3.
Algorithm 3. Summary of the training and performance evaluation methodology for the proposed coordinated voltage control scheme-Training and evaluation process of TD3 agent for coordinated voltage control
1: Collect   data   sets   1   and   3 .   Define   λ 2 = 0.1
2:Set the PV ratings of customers to their HC limit identified in step 15 of algorithm 2
3: Define   the   values   for   reward   parameters   { δ , η }   and   hyperparameters   { α , β , γ , σ , ρ , B a t c h   s i z e }
4: Initialize   T D 3 V C   agent   for   coordinated   voltage   control   with   random   weights   w V C = { θ 1 , θ 2 ,   ϕ }
5: Using   Data   Set   1 :   for   t = 1   to   T  do:
6:   Take action a     π ϕ s   and   execute   power   flow   calculation   for   time   step   t
7:   Train the T D 3 V C agent (steps 6 to 17 in Algorithm 1)
8:end for
9: Save   trained   weights   w V C
10: Initialize   a   new   T D 3 V C   agent   with   trained   weights   w V C for performance evaluation
11: Using   Data   Set   3 :   for   t = 1   to   T  do:
12:   Take action a     π ϕ s   and   execute   power   flow   calculation   for   time   step   t
13:   Check for operational constraint violations
14:end for
15:if total operational constraint violations 0, then: go back to step 3, end if
To attain the optimal performance for coordinated voltage control, the values for the TD3 hyperparameters { α , β , γ , σ , ρ , B a t c h   s i z e } and the reward function parameters { δ , η } were reconfigured. The TD3 agent was trained using Data Set 1, as it is essential to experience a wide range of states that includes seasonal variations in customer loads and solar irradiation to learn a robust and an optimal policy. The neural network weights of the TD3 agent were saved once the training simulation was completed. A new TD3 agent was initialized using the saved neural network weights to evaluate the performance of the learned policy by undertaking a time series simulation using Data Set 3. A real-world implementation of the proposed coordinated voltage control scheme requires control actions at a very high time step resolution. However, undertaking a time series simulation with a high time step resolution is often associated with a heavy computational burden. Therefore, a compromise was reached between computational capabilities and simulation accuracy by selecting Data Set 3 with a 5 s time step resolution to analyze the performance. If no operational constraint violations were observed throughout the time series simulation, the training process of the TD3 agent was determined to be successful. If one or more operational constraint violations existed throughout the time series simulation, the TD3 agent had to be trained again with a different set of values for hyperparameters and reward function parameters.

4.4. Comparative Analysis of Different Voltage Control Methods

In this section, a comparative analysis of the TD3 algorithm with several other control algorithms is presented using the HC limits defined in Section 4.2. The performance of the proposed TD3-based coordinated voltage control scheme is compared with the following five cases:
Base case: The base case considered in this analysis represents a hypothetical scenario in which PV inverters are operated without any control mechanisms. The PV inverters were allowed to output all available active power without considering any operational constraint violations. The base-case scenario was used to benchmark the TD3 algorithm and other control algorithms presented in the comparative study.
Base case with inverter trip enabled: The control method implemented for this scenario is the tripping action of the PV inverters when the average voltage of any 10 min window reaches higher than the overvoltage limit at the POC. The inverter trip timeout delay was considered to be 2 min. At normal conditions, the inverter outputs maximum available active power.
Local Volt-Watt and Volt-VAr control: Volt-Watt and Volt-VAr controls were implemented with settings from the AS/NZS 4777.2:2020 standard. In this case, the local voltage control was set to reactive power priority mode. In essence, the Volt-VAr function is prioritized over the Volt-Watt function during periods of high solar irradiation.
Coordinated voltage control using DDPG: A deep deterministic policy gradient (DDPG) is an RL algorithm that employs a deterministic policy to find the optimal solutions. DDPG is an actor–critic algorithm that consists of a total of 4 neural networks: actor, target actor, critic, and target critic.
Coordinated voltage control using SAC: Soft actor critic (SAC) is a state-of-the-art RL algorithm that is used to perform continuous control in various domains. SAC learns a stochastic policy which outputs a probability distribution over actions given a state. Entropy regularization is a key feature of SAC which encourages more diverse exploratory actions, in contrast to the DDPG and TD3 algorithms, which encourage exploration by adding noise to the actions. The SAC algorithm used for this study consisted of a total of 5 feed-forward neural networks, each representing actor, critic-1, critic-2, the value network, and the target value network.
A time series simulation using Data Set 3 was carried out to evaluate the performance of the above-mentioned algorithms. The RL algorithms SAC and DDPG were trained using Data Set 1 to capture all seasonal variations in the environment. The learning curves of RL algorithms can be used to analyze their performance level given that the reward function has been strongly formulated. The learning curves for the TD3, DDPG, and SAC algorithms are given in Figure 11, demonstrating the progression of the daily reward received by the agent due to its control actions. The DDPG algorithm gives the worst performance of the three RL algorithms as it converges to a significantly lower reward at the end of the training simulation. The algorithms SAC and TD3 show a better performance, with TD3 converging to a slightly higher reward than SAC at the end of the training simulation.
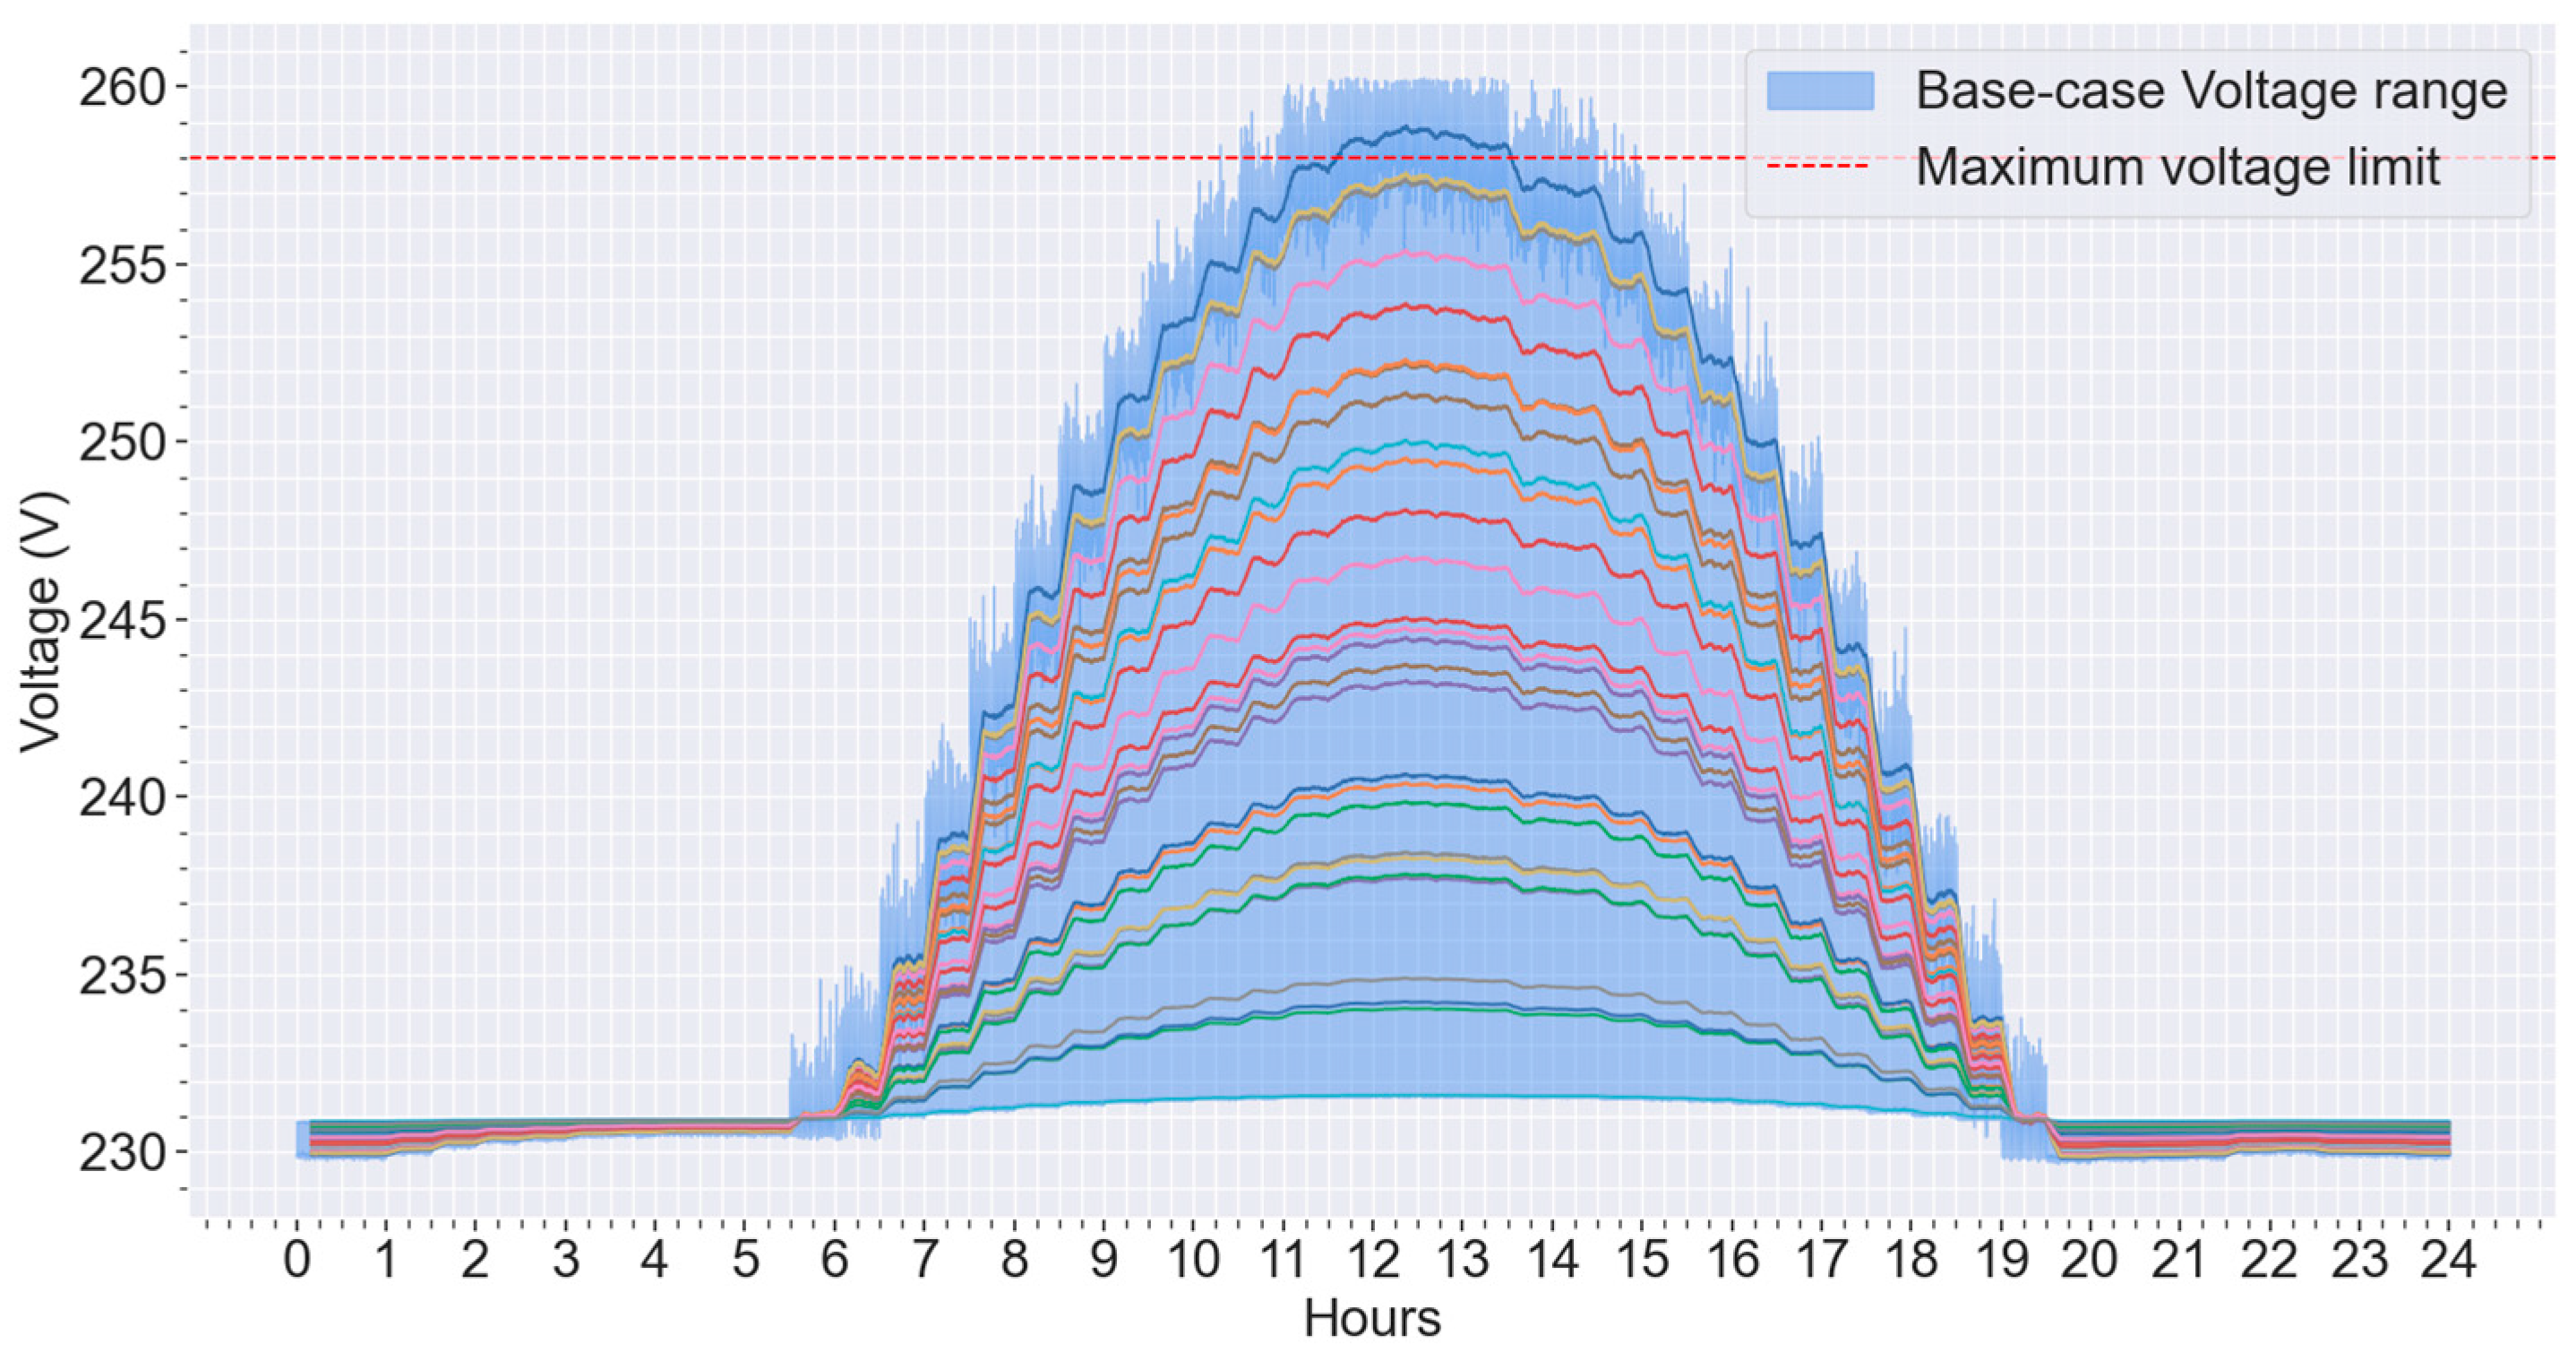
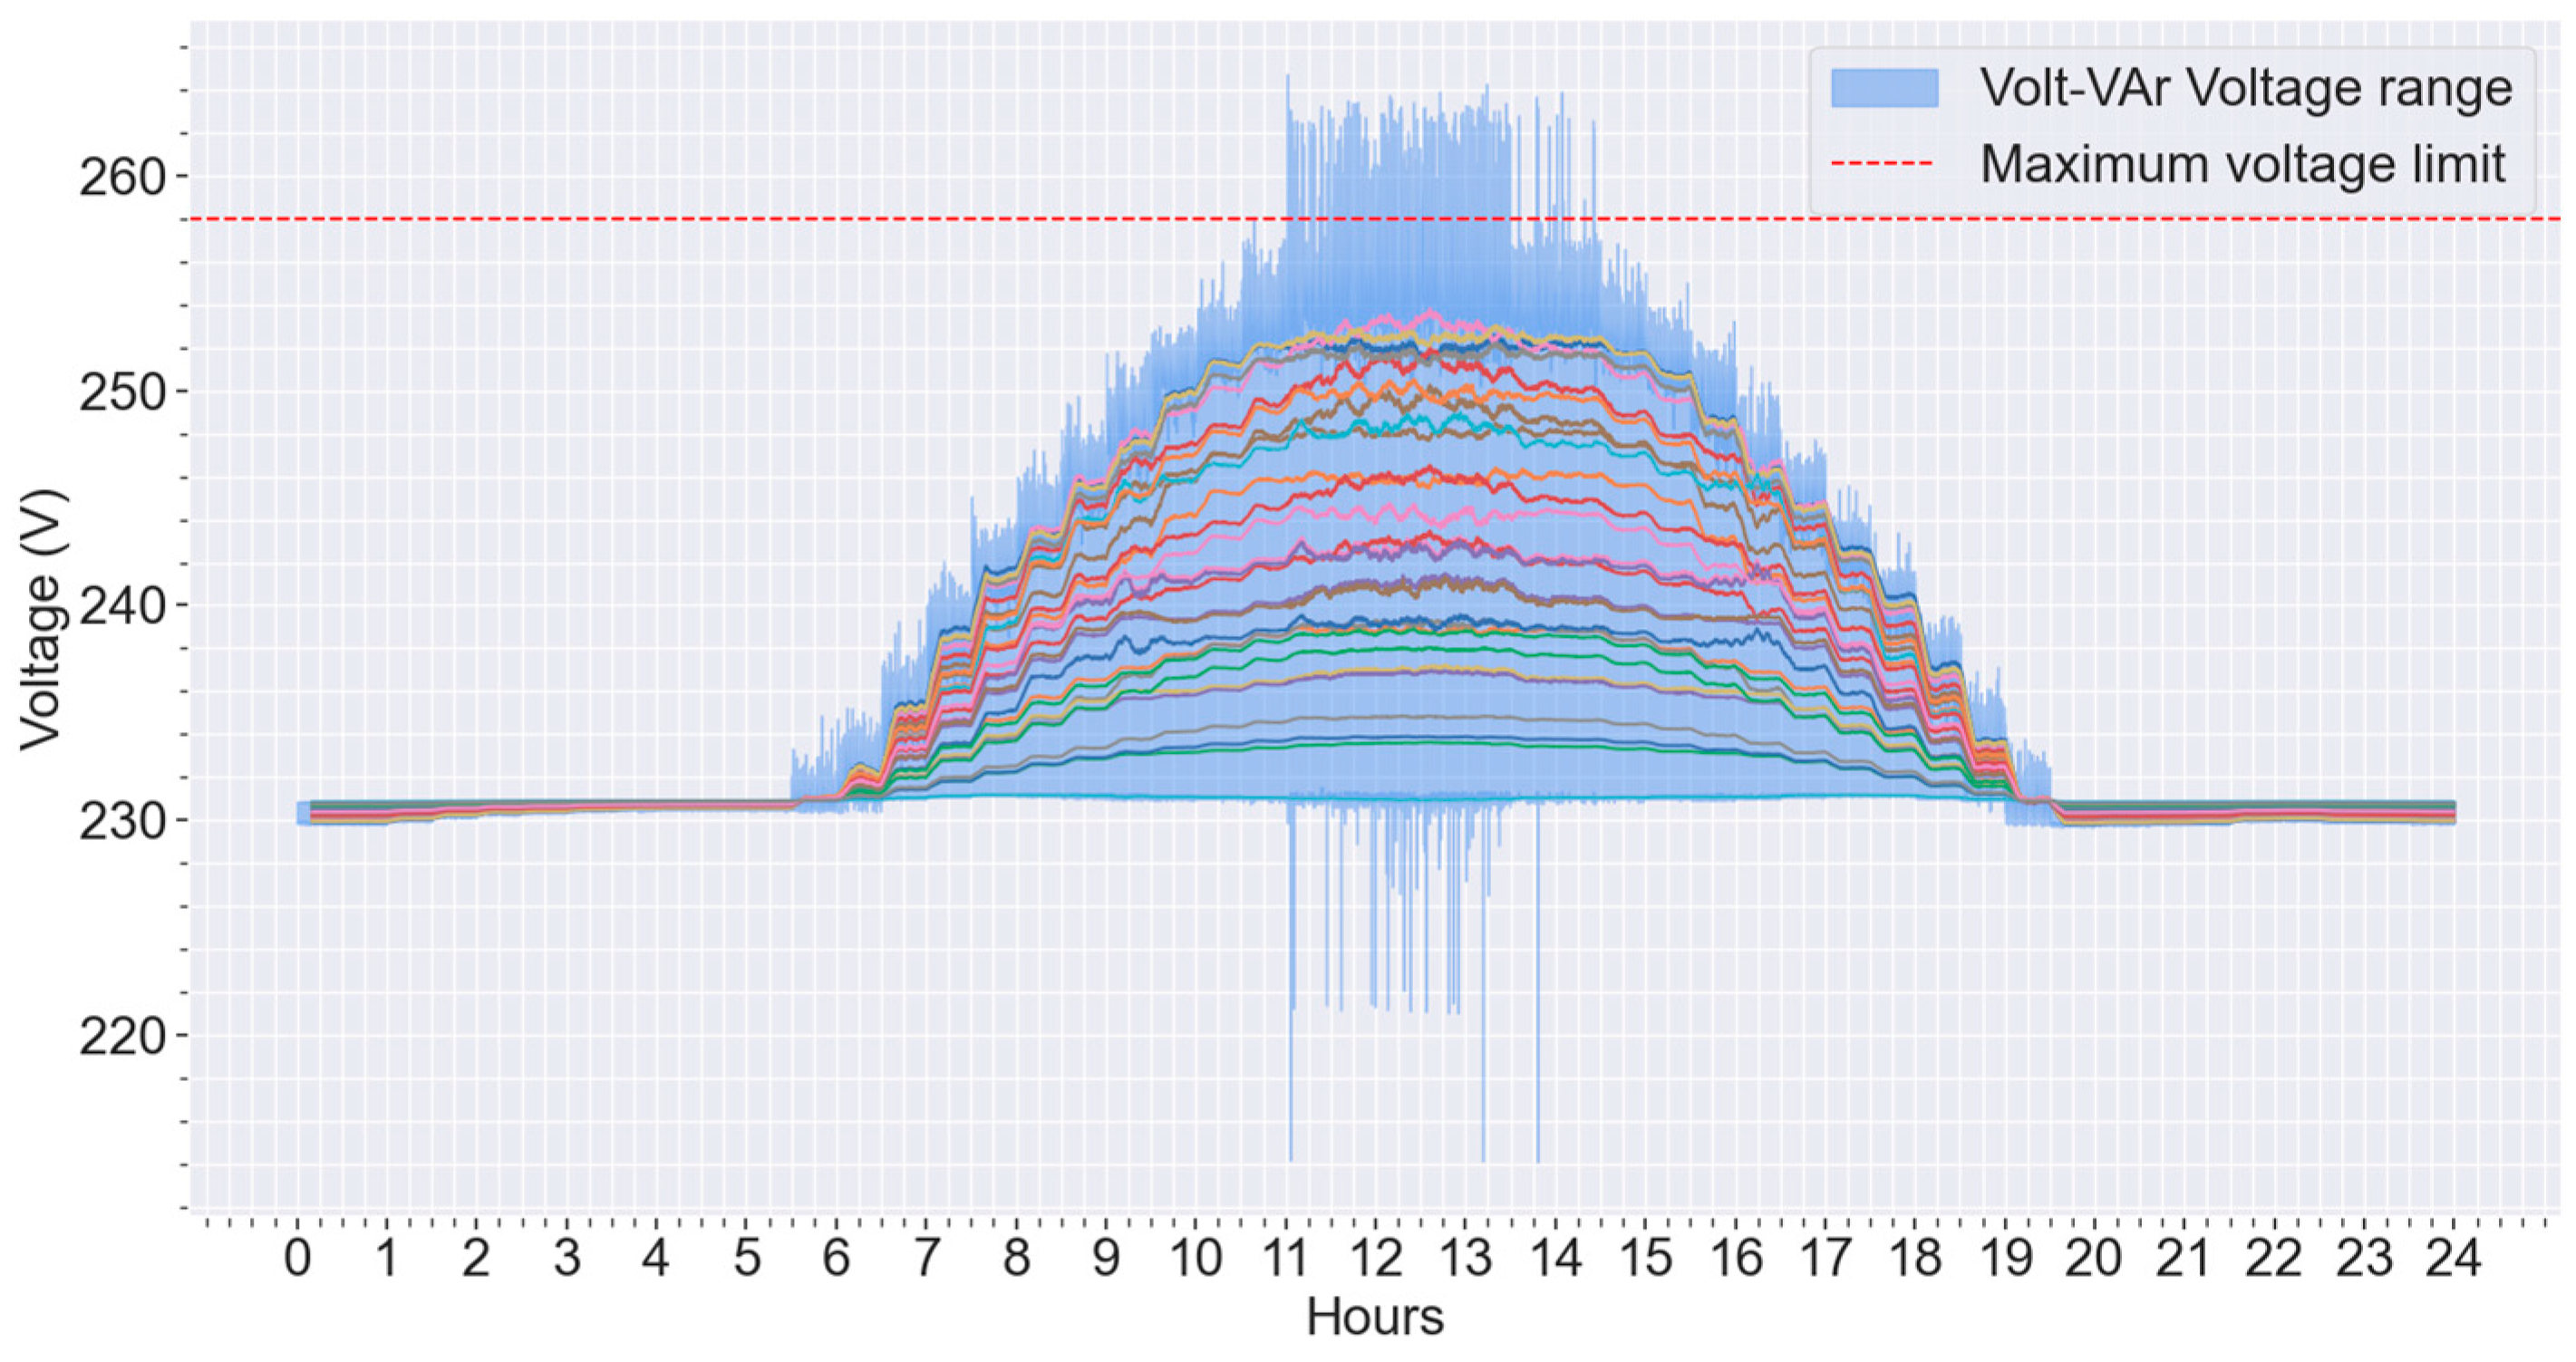
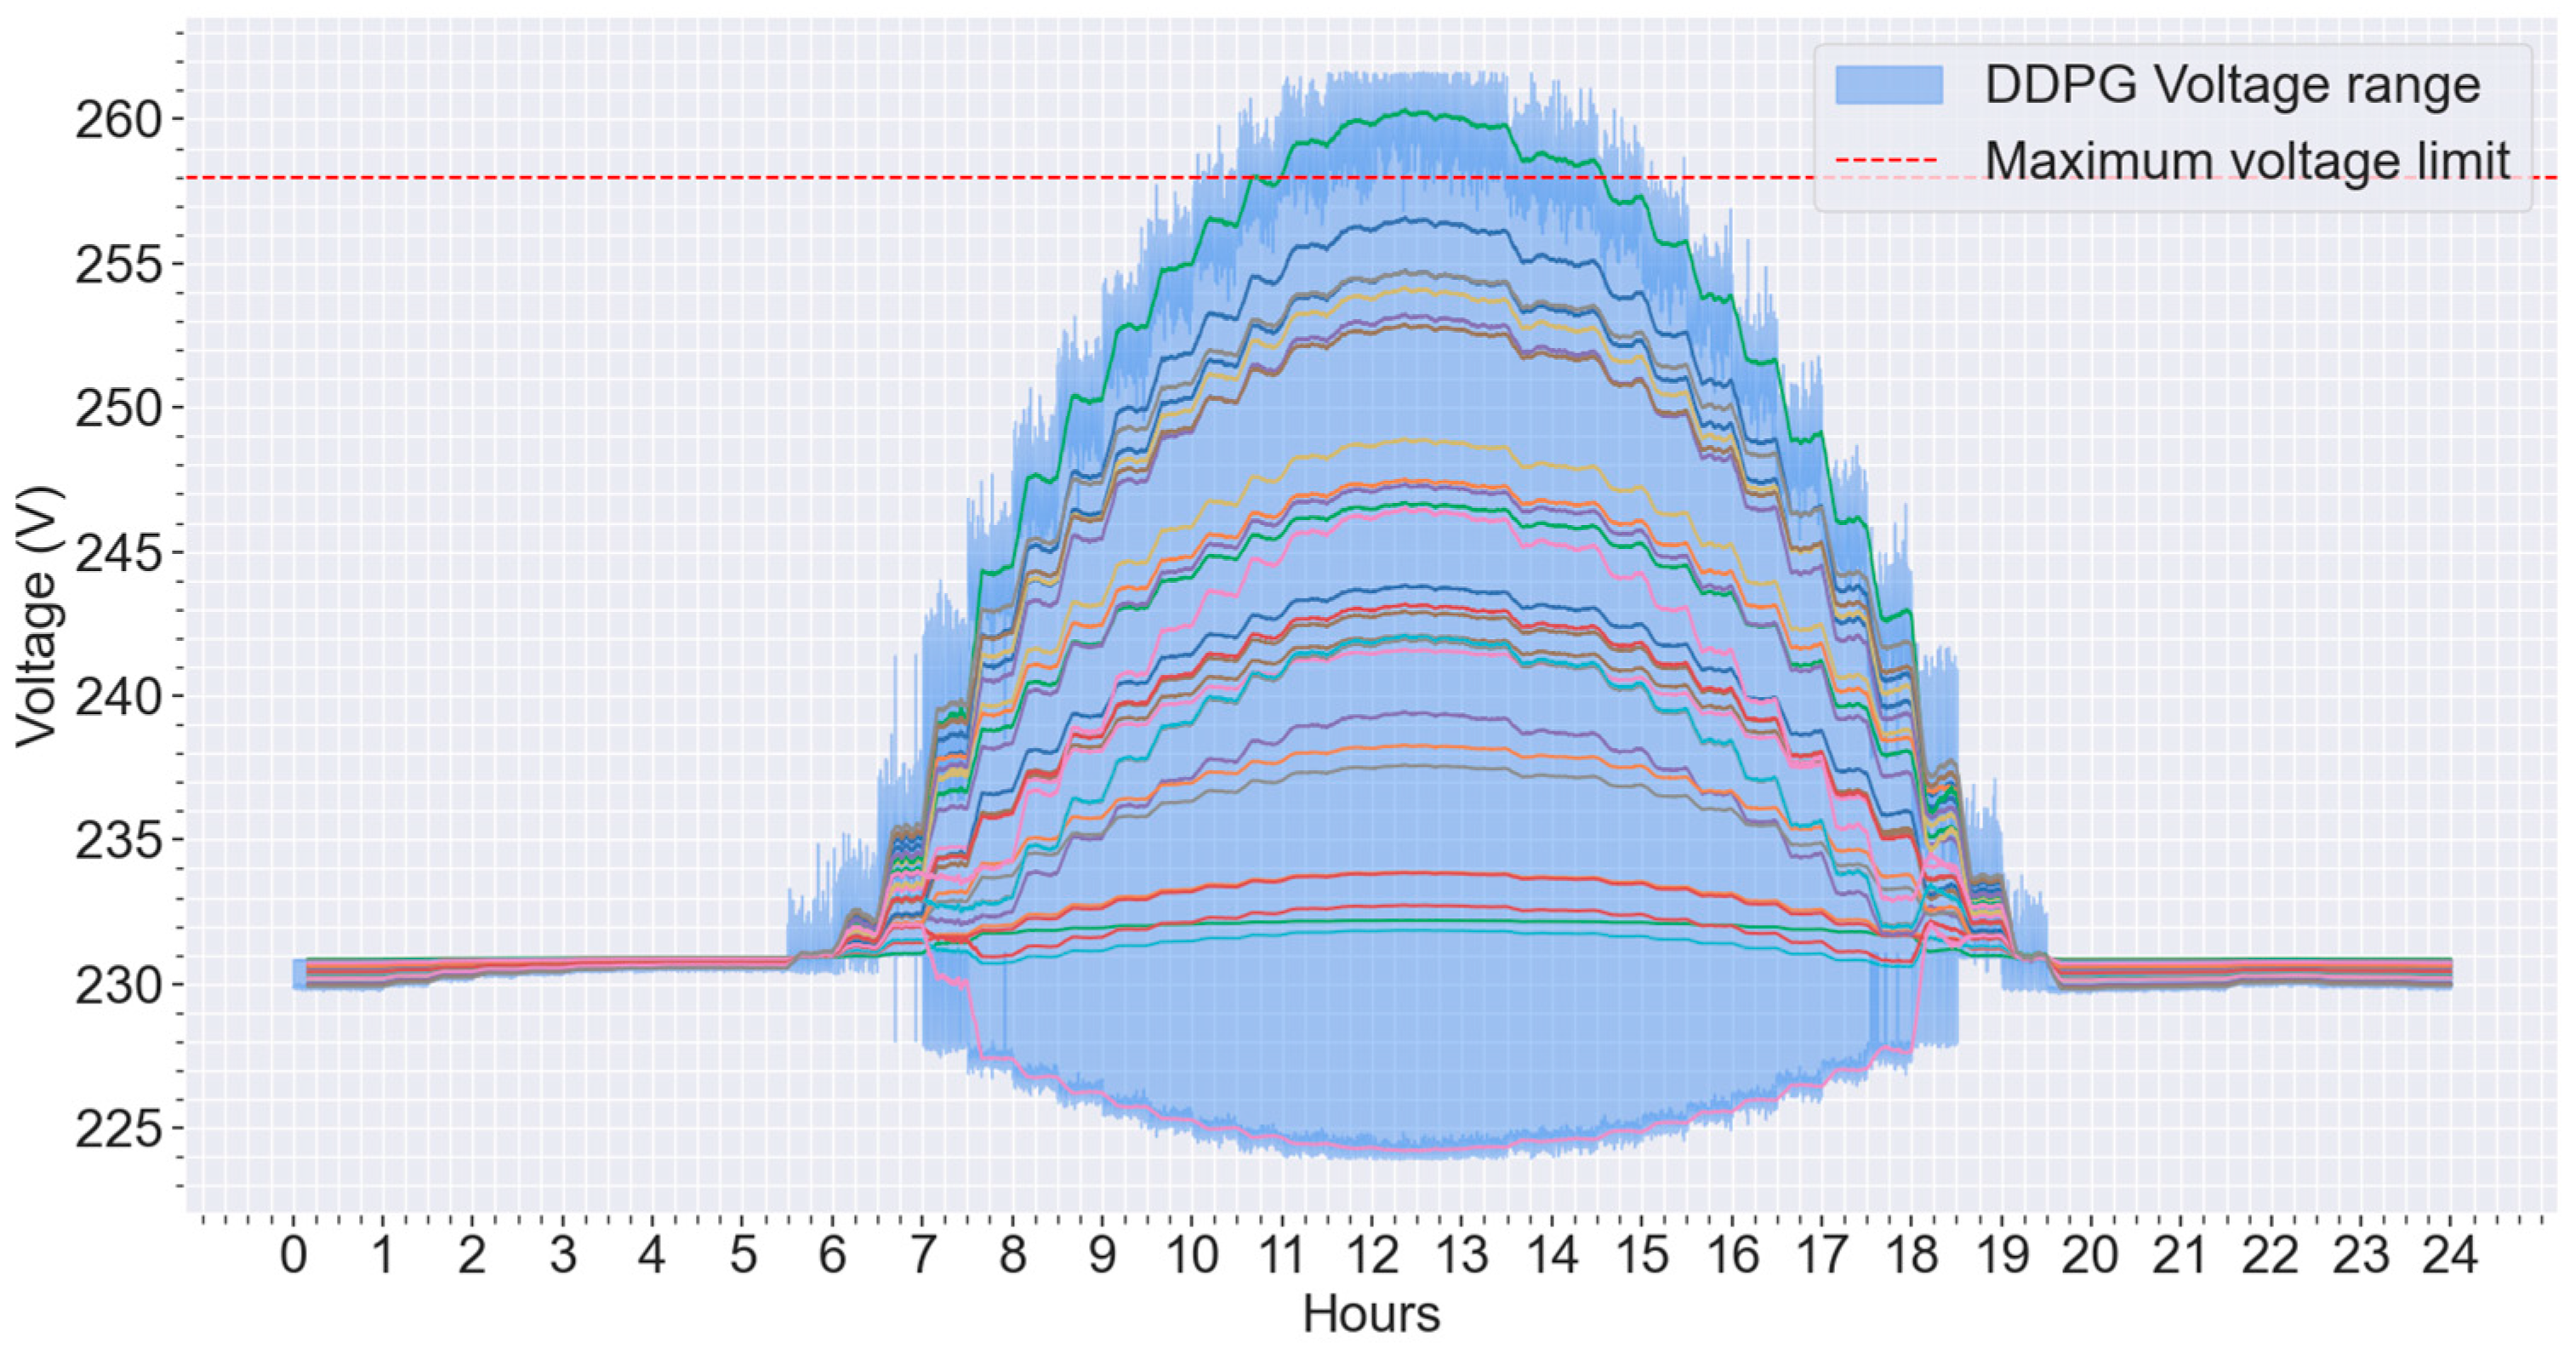
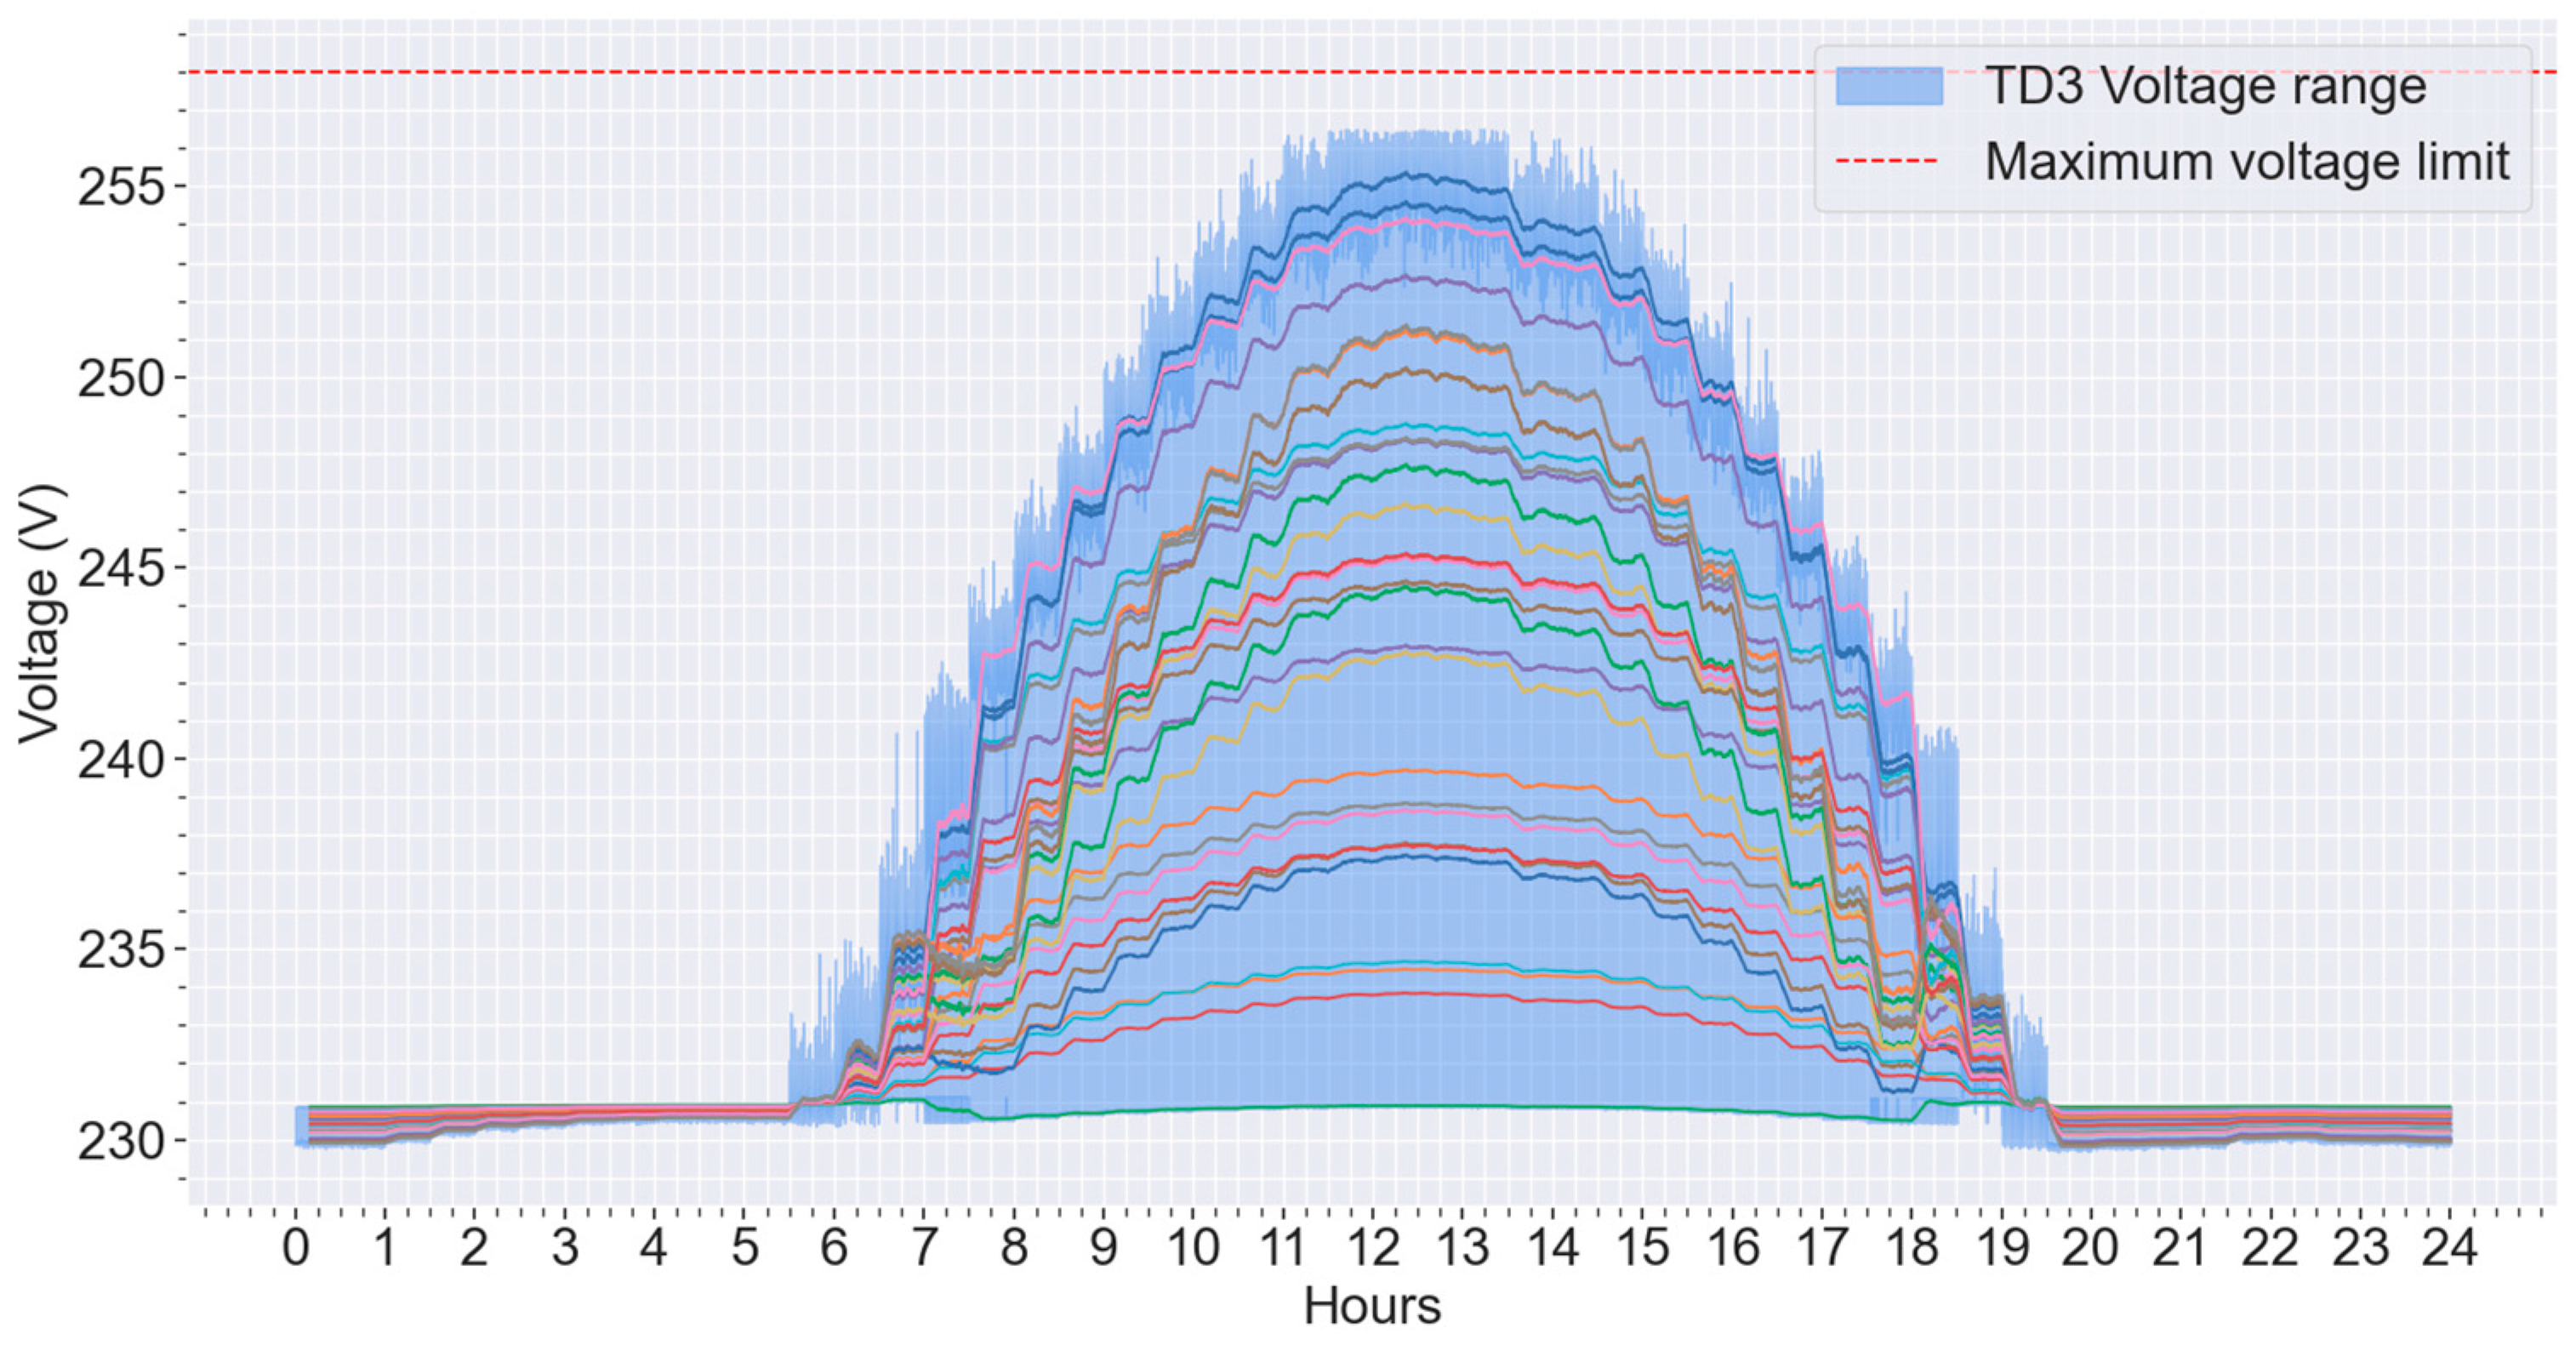
The customer voltage profiles of the time series simulations given in Figure 12, Figure 13, Figure 14, Figure 15, Figure 16 and Figure 17 illustrate which control algorithms are more effective at voltage regulation. The red dotted line indicates the maximum voltage limit of 258 V, the continuous lines correspond to each customer 10 min moving average voltage, and the blue hue represents the instantaneous voltage spread among customers. The remaining coloured lines in Figure 12, Figure 13, Figure 14, Figure 15, Figure 16 and Figure 17 are the voltage profiles of each individual customer. The base case, base case with inverter tripping enabled, Volt-VAr/Volt-Watt control, and DDPG control scenarios resulted in voltage constraint violations during periods of high solar irradiation. The inverter tripping can be seen in the voltage profile of the scenario of the base case with the inverter trip enabled. It can clearly be seen from the Volt-VAr/Vol-Watt scenario voltage profile that local voltage control becomes less effective during periods of high PV generation due to its inability to prevent the tripping of inverters, leading to significant curtailments. The SAC and TD3 DRL algorithms did not cause any overvoltage conditions and managed to reduce the deviation of voltage from its nominal value as compared to the base case scenario. The TD3 control scenario has the best voltage profile out of the six algorithms. The maximum instantaneous customer voltage reached for the TD3 control scenario was approximately 256 V, which is well below the overvoltage limit of 258 V.
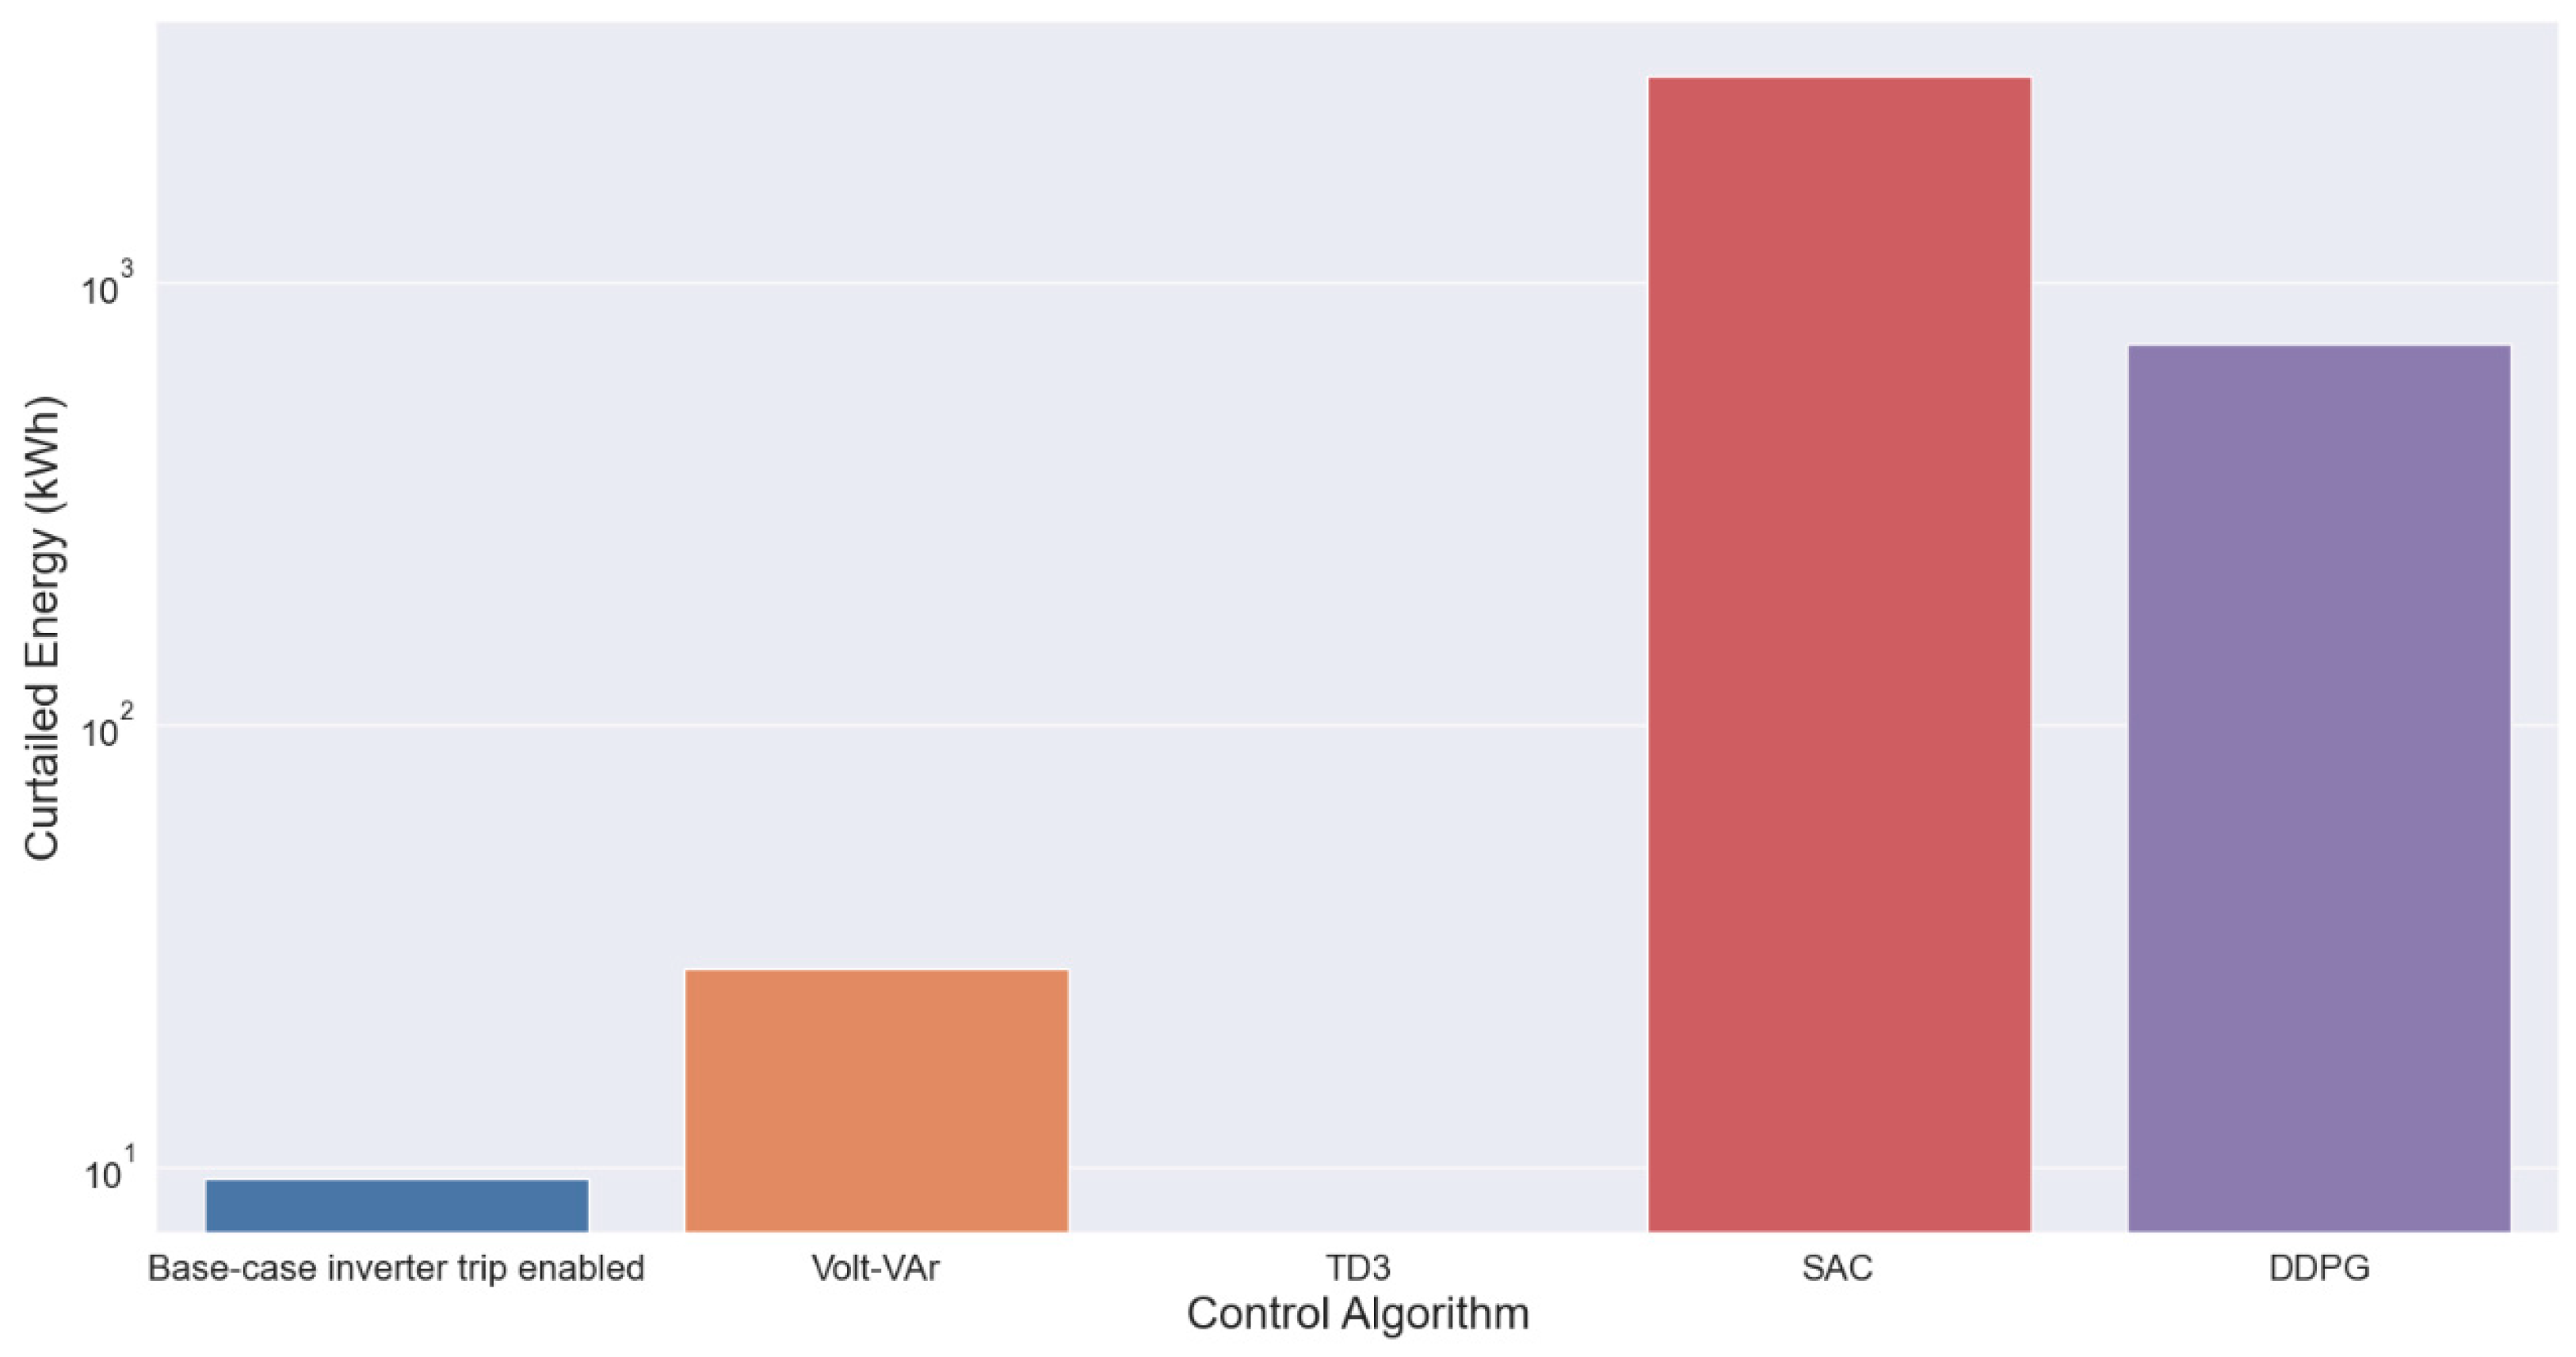
The magnitude of total active power curtailments provides another indication for evaluating the performance of algorithms. Figure 18 illustrates the total energy curtailed for all scenarios throughout the time series simulation. It shows that the TD3 algorithm outperforms other control algorithms, resulting in zero energy curtailed throughout the day. The SAC algorithm results in the maximum amount of energy curtailed despite having no instances of inverter tripping. The DDPG algorithm also results in significantly high curtailments followed by the Volt-VAr/Volt-Watt control functions.
Voltage unbalance is a vital aspect of the power quality of the distribution network which must be scrutinized in the time series simulations for each scenario. The 10 min moving average of the maximum percentage voltage unbalance ( V U R % ) throughout the LV distribution network for the time series simulation of each scenario is given in Figure 19. Each control algorithm significantly increases the network unbalance compared with the base-case scenario. The maximum V U R % appears to occur for the TD3 control scenario; however, it is lower than the compatibility limit of 2% specified by the IEC/TR 61000-3-14 standard [53]. It is desirable to explicitly factor in network unbalance for the proposed coordinated voltage control approach. However, data on the phase connections of customers in every feeder are not always readily available when implementing such control schemes in real-world electricity distribution networks. Therefore, further research is needed to develop effective solutions that address this limitation and ensure that the V U R % is maintained within acceptable limits.

5. Discussion

The TD3 algorithm presented in this paper has been subjected to rigorous tuning of hyperparameters and different formulations of the reward function to achieve the performance level presented in the above section. Deterministic algorithms such as DDPG and TD3 are sensitive to hyperparameters and incorrect assignments of hyperparameters will cause divergence in the learning process. Contrarily, algorithms that train stochastic policies such as SAC are less sensitive to hyperparameters and experience faster convergence. However, the SAC algorithm excels primarily in domains that require a high degree of exploration with control actions leading to sparse rewards. In power distribution systems, the cost of suboptimal control actions is significantly high and deterministic algorithms such as TD3 outperform SAC in the aspects of control action precision and fine-tuning capabilities.
The reward function parameter δ that regulates the balance between voltage regulation and active power curtailments, and the parameter η , which is the penalty factor for operational constraint violations, are fine-tuned for the TD3 algorithm to ensure convergence to a higher reward during the learning process. It should be noted that the reward function parameters δ and η were not finely tuned specifically for the SAC and DDPG algorithms, but rather the tuned values for the TD3 algorithm were used instead to represent a fair comparison between the learning curves of each DRL algorithm. The inclusion of the penalty factor η in the reward function generally caused the DRL algorithms to converge to a more conservative policy, as seen in the performance results of SAC and DDPG algorithms. However, this effect can be minimized by fine tuning of the parameter δ , which is evident from the performance results of TD3 that led to zero active power curtailments and zero operational constraint violations. Provided that the reward function parameters are finely tuned, the SAC and DDPG algorithms may result in better voltage regulation and minimal active power curtailments than the results presented in Section 4.
The main advantage of off-policy algorithms such as TD3 is their high sample efficiency, since the training samples are generated from a different behavioural policy rather than the current policy. A high sample efficiency leads to reduced training data requirements, faster convergence, and improved generalization, capturing the dynamics of the environment more effectively. The data from smart meter measurements are not always possible to obtain without any gaps in the time series data. The impact of missing time series data points is minimized by experience replay in DRL algorithms. Experience replay is a commonly used technique in almost every DRL algorithm that eliminates the temporal correlations present in consecutive training data sets. Prioritized experience replay is an improvement of the traditional experience replay technique that enhances learning efficiency by assigning a high probability to important training samples in the replay buffer. However, the case study presented in this paper only considered a relatively small training data set and prioritized experience replay did not result in any significant improvements to the learning process.
Coordinated voltage control approaches such as the one proposed in this paper offer numerous advantages for distribution networks. However, they face challenges in implementation and operation stages, including the need for communication infrastructure, and possible communication breakdowns or interruptions that may lead to unnecessary curtailments and operational constraint violations. Also, a real-world implementation of coordinated voltage control is dependent on the accuracy of smart meter measurements.

6. Conclusions

The research work presented in this paper consists of two components: a coordinated voltage control scheme implemented using the TD3 algorithm and the quantification of the enhanced HC due to the proposed coordinated voltage control scheme. The presented methodology for HC assessment utilizes a TD3 agent to evaluate the enhanced HC in real time for each individual PV customer connected to the electricity distribution network. The proposed TD3 agent for coordinated voltage control is rigorously tuned to achieve its maximum performance level and follows a different design from that of the HC assessment. The performance of the proposed TD3 algorithm is evaluated using a QSTS simulation of a 28-customer LV distribution network with 100% PV penetration. A comparative analysis of six different voltage control schemes is presented featuring other DRL algorithms, existing local voltage control functions, and the scenarios in which no voltage regulation is performed. In the comparative analysis, a QSTS simulation is utilized to evaluate the customer voltage profiles, total active power curtailments, and maximum percentage of voltage unbalance of each algorithm.
Evaluating the enhanced HC due to a coordinated voltage control scheme provides a deeper perspective on the techno-economic benefits of such schemes. Future work for the research presented in this paper will include a case study of a larger combined MV and LV distribution network. This study will incorporate additional control elements of the distribution network, such as OLTCs, battery energy storage systems, and static VAR systems, into the proposed coordinated voltage control scheme.

Author Contributions

Conceptualization, J.S., D.A.R. and A.R.; methodology, J.S. and A.R.; software, J.S.; validation, D.A.R. and A.R.; writing—original draft preparation, J.S.; writing—review and editing, A.R. and D.A.R. All authors have read and agreed to the published version of the manuscript.

Funding

This research received no external funding.

Data Availability Statement

The Python scripts, neural network models, and the DIgSILENT PowerFactory LV network model that were developed can be accessed and downloaded from URL (accessed on 31 August 2024): https://github.com/suchithra-jude/HC-enhancement-through-coordinated-voltgae-control--TD3.git.

Acknowledgments

The authors gratefully acknowledge the support of Endeavour Energy, through the Australian Power Quality Research Centre, for providing the resources and data that enabled this research.

Conflicts of Interest

Amin Rajabi was previously employed by the company DIgSILENT Pacific. The remaining authors declare that the research was conducted in the absence of any commercial or financial relationships that could be construed as potential conflicts of interest.

References

  1. Ding, F.; Mather, B.; Gotseff, P. Technologies to Increase PV Hosting Capacity in Distribution Feeders. In Proceedings of the 2016 IEEE Power and Energy Society General Meeting (PESGM), Boston, MA, USA, 17–21 July 2016. [Google Scholar] [CrossRef]
  2. Ismael, S.M.; Abdel Aleem, S.H.E.; Abdelaziz, A.Y.; Zobaa, A.F. State-of-the-Art of Hosting Capacity in Modern Power Systems with Distributed Generation. Renew Energy 2019, 130, 1002–1020. [Google Scholar] [CrossRef]
  3. Torquato, R.; Salles, D.; Pereira, C.O.; Meira, P.C.M.; Freitas, W. A Comprehensive Assessment of PV Hosting Capacity on Low-Voltage Distribution Systems. IEEE Trans. Power Deliv. 2018, 33, 1002–1012. [Google Scholar] [CrossRef]
  4. Kharrazi, A.; Sreeram, V.; Mishra, Y. Assessment Techniques of the Impact of Grid-Tied Rooftop Photovoltaic Generation on the Power Quality of Low Voltage Distribution Network—A Review. Renew. Sustain. Energy Rev. 2020, 120, 109643. [Google Scholar] [CrossRef]
  5. Zubo, R.H.A.; Mokryani, G.; Rajamani, H.S.; Aghaei, J.; Niknam, T.; Pillai, P. Operation and Planning of Distribution Networks with Integration of Renewable Distributed Generators Considering Uncertainties: A Review. Renew. Sustain. Energy Rev. 2017, 72, 1177–1198. [Google Scholar] [CrossRef]
  6. Rajabi, A.; Elphick, S.; David, J.; Pors, A.; Robinson, D. Innovative Approaches for Assessing and Enhancing the Hosting Capacity of PV-Rich Distribution Networks: An Australian Perspective. Renew. Sustain. Energy Rev. 2022, 161, 112365. [Google Scholar] [CrossRef]
  7. Mulenga, E.; Bollen, M.H.J.; Etherden, N. A Review of Hosting Capacity Quantification Methods for Photovoltaics in Low-Voltage Distribution Grids. Int. J. Electr. Power Energy Syst. 2020, 115, 105445. [Google Scholar] [CrossRef]
  8. Carollo, R.; Chaudhary, S.K.; Pillai, J.R. Hosting Capacity of Solar Photovoltaics in Distribution Grids under Different Pricing Schemes. In Proceedings of the 2015 IEEE PES Asia-Pacific Power and Energy Engineering Conference (APPEEC), Brisbane, QLD, Australia, 15–18 November 2015. [Google Scholar] [CrossRef]
  9. Heslop, S.; Macgill, I.; Fletcher, J.; Lewis, S. Method for Determining a PV Generation Limit on Low Voltage Feeders for Evenly Distributed PV and Load. Energy Procedia 2014, 57, 207–216. [Google Scholar] [CrossRef]
  10. Ebe, F.; Idlbi, B.; Morris, J.; Heilscher, G.; Meier, F. Evaluation of PV Hosting Capacities of Distribution Grids with Utilisation of Solar Roof Potential Analyses. CIRED Open Access Proc. J. 2017, 2017, 2265–2269. [Google Scholar] [CrossRef]
  11. Ebe, F.; Idlbi, B.; Morris, J.; Heilscher, G.; Meier, F. Evaluation of PV Hosting Capacity of Distribution Grids Considering a Solar Roof Potential Analysis—Comparison of Different Algorithms. In Proceedings of the 2017 IEEE Manchester PowerTech, Powertech 2017, Manchester, UK, 18–22 June 2017. [Google Scholar] [CrossRef]
  12. Heslop, S.; MacGill, I.; Fletcher, J. Maximum PV Generation Estimation Method for Residential Low Voltage Feeders. Sustain. Energy Grids Netw. 2016, 7, 58–69. [Google Scholar] [CrossRef]
  13. Bracale, A.; Caramia, P.; Carpinelli, G.; Di Fazio, A.R.; Varilone, P. A Bayesian-Based Approach for a Short-Term Steady-State Forecast of a Smart Grid. IEEE Trans. Smart Grid 2013, 4, 1760–1771. [Google Scholar] [CrossRef]
  14. Panigrahi, B.K.; Sahu, S.K.; Nandi, R.; Nayak, S. Probabilistic Load Flow of a Distributed Generation Connected Power System by Two Point Estimate Method. In Proceedings of the 2017 International Conference on Circuit, Power and Computing Technologies (ICCPCT), Kollam, India, 20–21 April 2017; pp. 1–5. [Google Scholar]
  15. Aien, M.; Fotuhi-Firuzabad, M.; Aminifar, F. Probabilistic Load Flow in Correlated Uncertain Environment Using Unscented Transformation. IEEE Trans. Power Syst. 2012, 27, 2233–2241. [Google Scholar] [CrossRef]
  16. Schwippe, J.; Krause, O.; Rehtanz, C. Extension of a Probabilistic Load Flow Calculation Based on an Enhanced Convolution Technique. In Proceedings of the 2009 IEEE PES/IAS Conference on Sustainable Alternative Energy (SAE), Valencia, Spain, 28–30 September 2009; pp. 1–6. [Google Scholar] [CrossRef]
  17. Schellenberg, A.; Rosehart, W.; Aguado, J. Cumulant-Based Probabilistic Optimal Power Flow (P-OPF) with Gaussian and Gamma Distributions. IEEE Trans. Power Syst. 2005, 20, 773–781. [Google Scholar] [CrossRef]
  18. Deboever, J.; Grijalva, S.; Reno, M.J.; Broderick, R.J. Fast Quasi-Static Time-Series (QSTS) for Yearlong PV Impact Studies Using Vector Quantization. Sol. Energy 2018, 159, 538–547. [Google Scholar] [CrossRef]
  19. López, C.D.; Idlbi, B.; Stetz, T.; Braun, M. Shortening Quasi-Static Time-Series Simulations for Cost-Benefit Analysis of Low Voltage Network Operation with Photovoltaic Feed-In. In Proceedings of the Power and Energy Student Summit (PESS) 2015, Dortmund, Germany, 13–14 January 2015. [Google Scholar] [CrossRef]
  20. Qureshi, M.U.; Grijalva, S.; Reno, M.J.; Deboever, J.; Zhang, X.; Broderick, R.J. A Fast Scalable Quasi-Static Time Series Analysis Method for PV Impact Studies Using Linear Sensitivity Model. IEEE Trans. Sustain Energy 2019, 10, 301–310. [Google Scholar] [CrossRef]
  21. Reno, M.J.; Deboever, J.; Mather, B. Motivation and Requirements for Quasi-Static Time Series (QSTS) for Distribution System Analysis. In Proceedings of the 2017 IEEE Power & Energy Society General Meeting, Chicago, IL, USA, 16–20 July 2017; pp. 1–5. [Google Scholar]
  22. Jain, A.K.; Horowitz, K.; Ding, F.; Sedzro, K.S.; Palmintier, B.; Mather, B.; Jain, H. Dynamic Hosting Capacity Analysis for Distributed Photovoltaic Resources—Framework and Case Study. Appl. Energy 2020, 280, 115633. [Google Scholar] [CrossRef]
  23. Antoniadou-Plytaria, K.E.; Kouveliotis-Lysikatos, I.N.; Georgilakis, P.S.; Hatziargyriou, N.D. Distributed and Decentralized Voltage Control of Smart Distribution Networks: Models, Methods, and Future Research. IEEE Trans. Smart Grid 2017, 8, 2999–3008. [Google Scholar] [CrossRef]
  24. Pippi, K.D.; Kryonidis, G.C.; Nousdilis, A.I.; Papadopoulos, T.A. A Unified Control Strategy for Voltage Regulation and Congestion Management in Active Distribution Networks. Electr. Power Syst. Res. 2022, 212, 108648. [Google Scholar] [CrossRef]
  25. Xu, T.; Wade, N.S.; Davidson, E.M.; Taylor, P.C.; McArthur, S.D.J.; Garlick, W.G. Case-Based Reasoning for Coordinated Voltage Control on Distribution Networks. Electr. Power Syst. Res. 2011, 81, 2088–2098. [Google Scholar] [CrossRef]
  26. Jabr, R.A. Linear Decision Rules for Control of Reactive Power by Distributed Photovoltaic Generators. IEEE Trans. Power Syst. 2018, 33, 2165–2174. [Google Scholar] [CrossRef]
  27. Li, P.; Zhang, C.; Wu, Z.; Xu, Y.; Hu, M.; Dong, Z. Distributed Adaptive Robust Voltage/VAR Control with Network Partition in Active Distribution Networks. IEEE Trans. Smart Grid 2020, 11, 2245–2256. [Google Scholar] [CrossRef]
  28. Li, J.; Liu, C.; Khodayar, M.E.; Wang, M.H.; Xu, Z.; Zhou, B.; Li, C. Distributed Online VAR Control for Unbalanced Distribution Networks with Photovoltaic Generation. IEEE Trans. Smart Grid 2020, 11, 4760–4772. [Google Scholar] [CrossRef]
  29. Liu, H.J.; Shi, W.; Zhu, H. Distributed Voltage Control in Distribution Networks: Online and Robust Implementations. IEEE Trans. Smart Grid 2018, 9, 6106–6117. [Google Scholar] [CrossRef]
  30. Papadimitrakis, M.; Kapnopoulos, A.; Tsavartzidis, S.; Alexandridis, A. A Cooperative PSO Algorithm for Volt-VAR Optimization in Smart Distribution Grids. Electr. Power Syst. Res. 2022, 212, 108618. [Google Scholar] [CrossRef]
  31. Nayeripour, M.; Fallahzadeh-Abarghouei, H.; Waffenschmidt, E.; Hasanvand, S. Coordinated Online Voltage Management of Distributed Generation Using Network Partitioning. Electr. Power Syst. Res. 2016, 141, 202–209. [Google Scholar] [CrossRef]
  32. Zhao, B.; Xu, Z.; Xu, C.; Wang, C.; Lin, F. Network Partition-Based Zonal Voltage Control for Distribution Networks with Distributed PV Systems. IEEE Trans. Smart Grid 2018, 9, 4087–4098. [Google Scholar] [CrossRef]
  33. Li, Z.; Wu, Q.; Chen, J.; Huang, S.; Shen, F. Double-Time-Scale Distributed Voltage Control for Unbalanced Distribution Networks Based on MPC and ADMM. Int. J. Electr. Power Energy Syst. 2023, 145, 108665. [Google Scholar] [CrossRef]
  34. Li, P.; Ji, H.; Yu, H.; Zhao, J.; Wang, C.; Song, G.; Wu, J. Combined Decentralized and Local Voltage Control Strategy of Soft Open Points in Active Distribution Networks. Appl. Energy 2019, 241, 613–624. [Google Scholar] [CrossRef]
  35. Farina, M.; Guagliardi, A.; Mariani, F.; Sandroni, C.; Scattolini, R. Model Predictive Control of Voltage Profiles in MV Networks with Distributed Generation. Control. Eng. Pract. 2015, 34, 18–29. [Google Scholar] [CrossRef]
  36. Zhang, Y.; Wang, X.; Wang, J.; Zhang, Y. Deep Reinforcement Learning Based Volt-VAR Optimization in Smart Distribution Systems. IEEE Trans. Smart Grid 2021, 12, 361–371. [Google Scholar] [CrossRef]
  37. El Helou, R.; Kalathil, D.; Xie, L. Fully Decentralized Reinforcement Learning-Based Control of Photovoltaics in Distribution Grids for Joint Provision of Real and Reactive Power. IEEE Open Access J. Power Energy 2021, 8, 175–185. [Google Scholar] [CrossRef]
  38. Liu, H.; Wu, W. Federated Reinforcement Learning for Decentralized Voltage Control in Distribution Networks. IEEE Trans. Smart Grid 2022, 13, 3840–3843. [Google Scholar] [CrossRef]
  39. Kou, P.; Liang, D.; Wang, C.; Wu, Z.; Gao, L. Safe Deep Reinforcement Learning-Based Constrained Optimal Control Scheme for Active Distribution Networks. Appl. Energy 2020, 264, 114772. [Google Scholar] [CrossRef]
  40. Yang, Q.; Wang, G.; Sadeghi, A.; Giannakis, G.B.; Sun, J. Two-Timescale Voltage Control in Distribution Grids Using Deep Reinforcement Learning. IEEE Trans. Smart Grid 2020, 11, 2313–2323. [Google Scholar] [CrossRef]
  41. Lee, X.Y.; Sarkar, S.; Wang, Y. A Graph Policy Network Approach for Volt-Var Control in Power Distribution Systems. Appl. Energy 2022, 323, 119530. [Google Scholar] [CrossRef]
  42. Cao, D.; Hu, W.; Xu, X.; Wu, Q.; Huang, Q.; Chen, Z.; Blaabjerg, F. Deep Reinforcement Learning Based Approach for Optimal Power Flow of Distribution Networks Embedded with Renewable Energy and Storage Devices. J. Mod. Power Syst. Clean Energy 2021, 9, 1101–1110. [Google Scholar] [CrossRef]
  43. Xing, Q.; Chen, Z.; Zhang, T.; Li, X.; Sun, K.H. Real-Time Optimal Scheduling for Active Distribution Networks: A Graph Reinforcement Learning Method. Int. J. Electr. Power Energy Syst. 2023, 145, 108637. [Google Scholar] [CrossRef]
  44. Qi, Y. TD3-Based Voltage Regulation for Distribution Networks with PV and Energy Storage System. In Proceedings of the 2023 Panda Forum on Power and Energy (PandaFPE), Chengdu, China, 27–30 April 2023; pp. 505–509. [Google Scholar] [CrossRef]
  45. Liu, Q.; Guo, Y.; Deng, L.; Tang, W.; Sun, H.; Huang, W. Robust Offline Deep Reinforcement Learning for Volt-Var Control in Active Distribution Networks. In Proceedings of the 5th IEEE Conference on Energy Internet and Energy System Integration: Energy Internet for Carbon Neutrality, EI2 2021, Taiyuan, China, 22–24 October 2021; pp. 442–448. [Google Scholar] [CrossRef]
  46. Liu, H.; Wu, W.; Wang, Y. Bi-Level Off-Policy Reinforcement Learning for Two-Timescale Volt/VAR Control in Active Distribution Networks. IEEE Trans. Power Syst. 2022, 38, 385–395. [Google Scholar] [CrossRef]
  47. Cao, D.; Zhao, J.; Hu, W.; Ding, F.; Yu, N.; Huang, Q.; Chen, Z. Model-Free Voltage Control of Active Distribution System with PVs Using Surrogate Model-Based Deep Reinforcement Learning. Appl. Energy 2022, 306, 117982. [Google Scholar] [CrossRef]
  48. Fujimoto, S.; Van Hoof, H.; Meger, D. Addressing Function Approximation Error in Actor-Critic Methods. In Proceedings of the 35th International Conference on Machine Learning, PMLR, Stockholm, Sweden, 10–15 July 2018. [Google Scholar]
  49. Wu, J.; Yuan, J.; Weng, Y.; Ayyanar, R. Spatial-Temporal Deep Learning for Hosting Capacity Analysis in Distribution Grids. IEEE Trans. Smart Grid 2022, 14, 354–364. [Google Scholar] [CrossRef]
  50. Xu, X.; Chen, X.; Wang, J.; Fang, L.; Xue, F.; Lim, E.G. Cooperative Multi-Agent Deep Reinforcement Learning Based Decentralized Framework for Dynamic Renewable Hosting Capacity Assessment in Distribution Grids. Energy Rep. 2023, 9, 441–448. [Google Scholar] [CrossRef]
  51. Yao, Y.; Ding, F.; Horowitz, K.; Jain, A. Coordinated Inverter Control to Increase Dynamic PV Hosting Capacity: A Real-Time Optimal Power Flow Approach. IEEE Syst. J. 2022, 16, 1933–1944. [Google Scholar] [CrossRef]
  52. AS/NZS 4777.2:2020; Grid Connection of Energy Systems via Inverters, Part 2: Inverter Requirements. Standards New Zealand: Wellington, New Zealand, 2020.
  53. IEC/TR 61000-3-14:2011; Electromagnetic Compatibility (EMC) Part 3.14: Limits-Assessment of Emission Limits for Harmonics, Interharmonics, Voltage Fluctuations and Unbalance for the Connection of Disturbing Installations to LV Power Systems. International Electrotechnical Commission: Geneva, Switzerland, 2011.
Figure 1. A simple LV distribution feeder.
Energies 17 05037 g001
Figure 2. Volt-Watt control settings according to AS/NZS 4777.2:2020.
Energies 17 05037 g002
Figure 3. Volt-VAr control settings according to AS/NZS 4777.2:2020.
Energies 17 05037 g003
Figure 4. Twin delayed deep deterministic policy gradient.
Energies 17 05037 g004
Figure 5. Actor network for the hosting capacity assessment.
Energies 17 05037 g005
Figure 6. Critic network for the hosting capacity assessment.
Energies 17 05037 g006
Figure 7. LV distribution network of 28 customers.
Energies 17 05037 g007
Figure 8. TD3 agent learning curve for HC assessment.
Energies 17 05037 g008
Figure 9. Enhanced HC of customers by the TD3 algorithm through coordinated voltage control.
Energies 17 05037 g009
Figure 10. PV ratings and active power outputs of customers estimated by the TD3 algorithm.
Energies 17 05037 g010
Figure 11. Comparison of learning curves for RL algorithms.
Energies 17 05037 g011
Figure 12. Customer voltage profiles for the base-case time series simulation.
Energies 17 05037 g012
Figure 13. Customer voltage profiles for the base-case with inverter tripping enabled time series simulation.
Energies 17 05037 g013
Figure 14. Customer voltage profiles for the Volt-VAr/Volt-Watt time series simulation.
Energies 17 05037 g014
Figure 15. Customer voltage profiles for the DDPG time series simulation.
Energies 17 05037 g015
Figure 16. Customer voltage profiles for the TD3 time series simulation.
Energies 17 05037 g016
Figure 17. Customer voltage profiles for the SAC time series simulation.
Energies 17 05037 g017
Figure 18. Total energy curtailed throughout the time series simulation.
Energies 17 05037 g018
Figure 19. Maximum percentage voltage unbalance factor.
Energies 17 05037 g019
Table 1. Key features that differentiate the current work from past research works.
Features[39,45,46,47][37][49][50][51]Current Work
DRL-based coordinated voltage control××
Comparative analysis with other voltage control algorithms×
Implementation on real-world unbalanced LV network models×××
Deep learning-based real-time HC assessment×××
Quantification of enhanced HC××××
A discussion on performance level and limitations
✓: included, ×: not included.
Table 2. Parameter settings of the TD3 algorithm used for the HC assessment.
Actor learning rate ( α ) 0.001
Critic learning rate ( β ) 0.001
Discount factor ( γ ) 0.99
Batch size750
Standard deviation of the added Gaussian noise for σ   a n d   σ ~ 0.01
Target network update rate ( ρ ) 0.005
Activation function of hidden layersReLU
Activation function of output layertanh
Input layer size2 N
Output layer size3 N
Size of hidden layers{256, 512, 1024, 512, 256}
Table 3. Parameter settings of the TD3 algorithm used for coordinated voltage control.
Actor   learning   rate   ( α ) 0.001
Critic   learning   rate   ( β ) 0.001
Discount   factor   ( γ ) 0.99
Batch size500
Standard   deviation   of   the   added   Gaussian   noise   for   σ   a n d   σ ~ 0.1
Target   network   update   rate   ( ρ ) 0.005
Activation function of hidden layersReLU
Activation function of output layertanh
Input layer size 4 N
Output layer size 2 N
Size of hidden layers{256, 512, 1024, 512, 256}
Table 4. LV network electrical characteristics.
R1
Ω/km
X1
Ω/km
R0
Ω/km
X0
Ω/km
Main Feeder0.2985570.2596331.1325080.945961
Service Feeder1.4800030.088--
Network Constraints
V N o m = 230   V V m a x _ l i m i t = 258   V V m i n _ l i m i t = 218   V S T r f _ r a t e d = 1   M V A
Table 5. Simulation data sets.
Data Set No.Number of DaysTime Step ResolutionTotal Time StepsSimulation
112030 min5760Training of HC and VC agents
212030 min5760Evaluation of HC agent
315 s17,280Evaluation of VC agent
Disclaimer/Publisher’s Note: The statements, opinions and data contained in all publications are solely those of the individual author(s) and contributor(s) and not of MDPI and/or the editor(s). MDPI and/or the editor(s) disclaim responsibility for any injury to people or property resulting from any ideas, methods, instructions or products referred to in the content.