Article

Two-Stage Robust Resilience Enhancement of Distribution System against Line Failures via Hydrogen Tube Trailers

1
Economic and Technological Research Institute of State Grid Qinghai Electric Power Company, Xining 810016, China
2
Clean Energy Development Research Institute of State Grid Qinghai Electric Power Company, Xining 810016, China
3
Qinghai Key Lab of Efficient Utilization of Clean Energy, School of Energy and Electrical Engineering, University of Qinghai, Xining 810016, China
*
Author to whom correspondence should be addressed.
Energies 2024, 17(20), 5028; https://doi.org/10.3390/en17205028
Submission received: 5 September 2024 / Revised: 1 October 2024 / Accepted: 4 October 2024 / Published: 10 October 2024
(This article belongs to the Special Issue Big Data Analysis and Application in Power System)

Abstract

:
Due to the properties of zero emission and high energy density, hydrogen plays a significant role in future power system, especially in extreme scenarios. This paper focuses on scheduling hydrogen tube trailers (HTTs) before contingencies so that they can enhance resilience of distribution systems after contingencies by emergency power supply. The whole process is modeled as a two-stage robust optimization problem. At stage 1, the locations of hydrogen tube trailers and their capacities of hydrogen are scheduled before the contingencies of distribution line failures are realized. After the line failures are observed, hydrogen is utilized to generate power by hydrogen fuel cells at stage 2. To solve the two-stage robust optimization problem, we apply a column and constraint generation (C&CG) algorithm, which divided the problem into a stage-1 scheduling master problem and a stage-2 operation subproblem. Finally, experimental results show the effectiveness of enhancing resilience of hydrogen and the efficiency of the C&CG algorithm in scheduling hydrogen tube trailers.

1. Introduction

Due to the properties of zero emission and high energy density, hydrogen is playing a more and more significant role in energy and power system. Since the power-to-hydrogen technology is rapidly developed [1], it is convenient to consume renewable energy like wind power [2] and solar power [3] to produce hydrogen. It is expected that the hydrogen price will be extremely low in the future, which further promote the utilization of hydrogen [4]. In power systems, hydrogen has been applied for peak-regulation [5], frequency control [6], and economy dispatch [7]. Hydrogen is also recognized as the replacement of fossil energy in the field of transportation [8]. Hydrogen fuel cell vehicles have been extensively studied, which may make a difference in the future energy and transportation fields [9]. Since hydrogen is convenient to store and transport, hydrogen will contribute a greater amount to the future high-proportion renewable-energy power system.
A significant scenario that hydrogen can make a huge difference is the resilience enhancement of distribution systems. Resilience is defined as the ability of a power system to maintain power supply under highly disruptive contingencies, while resilience enhancement is referred to improving the resilience of power system [10,11,12]. With the rapidly increasing climate warming, the extreme weather events become more and more frequent [13]. Extreme contingencies, e.g., earthquake [14], ice storm [15], typhoon [16], and wildfire [17], may cause a large scale of blackouts.
To guarantee the power supply, distribution systems develop a series of measures. In the grid side, hardening lines is an important action. Ref. [18] proposes a line hardening planing problem under the probabilistic power flow model with high penetration of renewable energy, while ref. [19] utilizes two grid hardening techniques, upgrading poles and vegetation management, to enhance the distribution system resilience. Network reconfiguration is another effective method. Ref. [20] co-optimizes the decisions of network reconfiguration and line repair to minimize the accumulative operating cost. In the device side, there are a plenty of flexibility resources to be leveraged. Ref. [21] pre-allocates diesel oil to support distributed generators (DGs) in the pre-hurricane stage so that critical loads can be sufficiently supplied in the post-hurricane stage. Ref. [22] combines the decisions of DGs and distribution line hardening before the natural disasters happen. Besides DGs, various types of energy storage are also widely concerned. Battery energy storage is much accounted of as a key device to promote distribution system resilience [23,24], while in current distribution systems, the capacity of battery may be insufficient.
Besides the above conventional measures, mobile power sources (MPSs), as known as “energy on wheel”, have recently attracted much attention. Exiting literature focus on MPSs including mobile emergency generators, electric buses and family vehicles, mobile energy storage, and liquefied natural gas (LNG) tube trailers. Ref. [25] points out that the benefit of MPSs is flexibly moving to the most emergent regions. Ref. [26] reveals that under extreme contingencies, electric buses can supply critical electricity injecting to the distribution system. Ref. [27] applied LNG tube trailers to restore the resilience of a multi-energy power-gas distribution system. In ref. [28], the investment of mobile energy storage in normal and contingency scenarios is considered, which also decides the transportation routes of MPSs. In ref. [29], electric vehicles (EVs) are organized for multi-period distribution system restoration, where the travel and repair time constraints are carefully considered. Ref. [30] studies generic mobile emergency resources model in the critical service restoration of micro-grids in extreme conditions. In ref. [31], mobile emergency generators are studied to play an important role in distribution system resilience enhancement with the help of remote-control and manual switches to reconfigure the network. To sum up, the utilization of energy storage and EVs is too expensive, while mobile emergency generators and LNG tube trailers have the issue of greenhouse gas emission. Besides, most of MPSs are not able to provide sufficiently long-term power supply due to the low energy density.
Hydrogen tube trailers (HTTs) is a future-oriented new mobile energy storage device. Compared to LNG, hydrogen is easier and cheaper to produce. Hydrogen production modules play a crucial role in the hydrogen industry. In the power-to-hydrogen technique, the only raw material is water and the power supply can be easily satisfied by rapidly increasing renewable energy, e.g., photovoltaic panels and wind generators. Under normal conditions, redundant renewable energy is utilized to produce hydrogen by hydrogen production modules. Produced hydrogen can be sold to chemical plants for benefit or be stored for future usage. Stored hydrogen can be consumed by hydrogen fuel cells to generate power for reasons like peak load shifting, voltage control, and frequency regulation. Besides, before extreme contingencies, hydrogen can be transport to where power is with most deficit by HTTs to enhance resilience of distribution systems. However, the strategy of using HTTs to promote resilience has been still an open question recently. It is unclear how to maximize the effectiveness of HTTs to support critical loads.
According to the research gap regarding the site selection and capacity determination of HTTs against contingencies, this work aims to address these issues. The main contributions of this paper are as follows:
(1)
A two-stage robust resilience enhancement model via HTTs is proposed in this paper. At stage-1, the decisions of location and hydrogen weight of HTTs are made considering upcoming distribution line failures. Then at stage 2, after the contingencies are observed, hydrogen is consumed to supply critical loads with the assistance of DGs.
(2)
In order to solve the complex two-stage robust resilience enhancement model, a column and constraint generation (C&CG) based solution algorithm is proposed. Besides, to deal with the bilinear nonconvex terms in this model, the big-M method is utilized to simplify it so that the whole problem can be solved by commercial solvers.
The rest of this paper is organized as follows. In Section 2, the two-stage robust resilience enhancement model via HTTs is formulated. Section 3 proposes the C&CG-based algorithm to deal with this model embedded by the big-M method. Section 4 verifies the effectiveness of resilience enhancement of HTTs and the efficiency of the C&CG-based algorithm, while Section 5 concludes this paper.

2. Two-Stage Robust Resilience Enhancement Model

In this section, we will develop the two-stage robust scheduling model of HTTs to enhance the resilience of the distribution system against uncertain line failures. At stage 1, the distribution system operator will purchase hydrogen and distribute it to HTTs and then schedule the target locations of HTTs to enhance key nodes of the distribution network. Then the uncertain contingency will be observed, which will lead to several line failures. At stage 2, hydrogen is consumed to generate power to support the power supply. The whole objective of the two-stage robust resilience enhancement problem is to minimize the purchase cost plus the load curtailment penalty.

2.1. Stage-1 HTT Scheduling Model

Before the contingency happens, the distribution system operator will pre-dispatch the HTTs. First, it will purchase hydrogen, whose weight is denoted by H.

2.1.1. Hydrogen Purchase and Distribution

Suppose the hydrogen purchasing price is π H > 0 . Then the hydrogen purchasing cost is defined by
C H = π H H
where H is the purchased before the contingency.
Before the contingency, the maximal weight of purchased hydrogen is limited, i.e.,
0 H H ¯
where H ¯ is the practical upper bound of hydrogen.
Assume that there are M HTTs can be dispatched. The capacity of HTT m is denoted by H ¯ m . Define the real weight of hydrogen that HTT m is distributed by H m . Then the pre-dispatch decision is limited by the hydrogen balance constraint
m = 1 M H m H
and the HTT capacity constraint
0 H m H ¯ m , m = 1 , 2 , , M
where H ¯ m is the maximal hydrogen capacity.

2.1.2. HTT Siting Model

The HTTs freight hydrogen to distribution network nodes with hydrogen fuel cells to generate power. Define the set of nodes by N = 1 , 2 , , N . There are only a subset of nodes equipped by hydrogen fuel cells, which is defined by N c N .
Define the 0/1 variable z i , m , which is one if the HTT m is located at node i and zero if not. The HTT siting rule is define by
z i , m 0 , 1 , i = 1 , 2 , , N , m = 1 , 2 , , M
m = 1 M i = 1 N z i , m = M
m = 1 M z i , m 1 , i = 1 , 2 , , N
i = 1 N z i , m = 1 , m = 1 , 2 , , M
z i , m = 0 , i N c
Constraint (5b) makes sure that every HTT is dispatched. Constraint (5c) means that at most one HTT is served by a hydrogen fuel cell. Constraint (5d) indicates that each HTT must be dispatched to a node. By constraint (5e), HTTs can be only located at nodes with hydrogen fuel cells.

2.2. Uncertain Contingency Model

In this paper, we consider the contingency of distribution line failures caused by extreme weather. Denote by L the set of distribution lines. Let binary variable v i j , ( i , j ) L denote the state of distribution line ( i , j ) . v i j is one if the line ( i , j ) is intact and zero if damaged. Then the uncertainty set of distribution line failures is modeled as
v i j 0 , 1 , ( i , j ) L
( i , j ) L ( 1 v i j ) Γ v
where Γ v describes the maximal scale of the line failures.

2.3. Stage-2 Operation Model

After the distribution lines are damaged, the distribution network is divided into several self-organization subnetworks. To restore the loads, hydrogen fuel cells as well as distributed generators will generate power to support the subnetworks. The objective of stage 2 is to maximize the power supply after the extreme event. Denote by T the duration time of the extreme event.

2.3.1. Hydrogen Fuel Cell Model

Only the hydrogen fuel cells connected to a HTT can provide electricity. It is revealed that the generated power is proportional to the consumed hydrogen. Define the hydrogen consumed by the hydrogen fuel cell at node i at time t as H i , t . Then the generated power p i , t H is given by
p i , t H = n i H i , t
where n i > 0 is the generation rate of the hydrogen fuel cell at node i.
A hydrogen fuel cell has a physical limitation on its consumed hydrogen, i.e.,
0 H i , t H ¯ i , t = 1 , 2 , , T
where H ¯ i is the upper bound.
Meanwhile, the total hydrogen consumption is limited by the HTT provision, which is
0 t = 1 T H i , t m = 1 M z i , m H m
Note that in the above inequality, z i , m and H m are both variables, whose product is a non-convex term. To deal with it, we apply the big-M method and replace the original inequality with
0 t = 1 T H i , t m = 1 M H i , m
M big z i , m H i , m M big z i , m
M big ( 1 z i , m ) H i , m H m M big ( 1 z i , m )
where H i , m is an auxiliary variable and M big > 0 is a sufficiently large constant. Using the big-M method, the non-convex inequality becomes linear.
Assume that there is an operation cost when using a hydrogen fuel cell, which is defined as
C i H F C = π i H F C t = 1 T p i , t H
where π i H F C is the marginal cost.

2.3.2. Distributed Generator Model

Suppose that there are several DGs in the distribution system. Their capacities are not sufficient so that hydrogen fuel cells have to help. The operational constraint of DG at node i is
0 p i , t G P ¯ i G , t = 1 , 2 , , T
0 q i , t G Q ¯ i G , t = 1 , 2 , , T
where P ¯ i G and Q ¯ i G are the upper bound of active and reactive power generation, respectively.
The operational cost of DG at node i is
C i G = π i G t = 1 T p i , t G
where π i G is the unit cost.

2.3.3. Power Flow Model

The linearized distribution flow model is used to describe the distribution system [32], i.e.,
( i , j ) L P i j , t ( j , k ) L P j k , t = P j , t , j = 1 , 2 , , N , t = 1 , 2 , , T
( i , j ) L Q i j , t ( j , k ) L Q j k , t = Q j , t , j = 1 , 2 , , N , t = 1 , 2 , , T
M big ( v i j 1 ) V i , t V j , t r i j P i j , t x i j Q i j , t M big ( 1 v i j ) , t = 1 , 2 , , T
where P i j , t and Q i j , t are the distribution line active and reactive power, P j , t and Q j , t are the node net active and reactive loads, V j , t is the node voltage amplitude, r i j and x i j are the resistance and reactance of the distribution line, respectively.
Distribution network constraints are highly considered in the restoration stage. The node voltage and the line power should be maintained [33], i.e.,
V ̲ i V i , t V ¯ i , t = 1 , 2 , , T
v i j P ¯ i j P i j , t v i j P ¯ i j , t = 1 , 2 , , T
v i j Q ¯ i j Q i j , t v i j Q ¯ i j , t = 1 , 2 , , T
where V ̲ i and V ¯ i are the lower and upper bounds of node voltage, P ̲ i j and P ¯ i j are the lower and upper bounds of distribution line active power, and  Q ̲ i j and Q ¯ i j are the lower and upper bounds of distribution line reactive power. Note that, if the distribution line is damaged, i.e.,  v i j = 0 , the active and reactive power cannot transmit through this line.
The node net loads are defined as
P i , t = p i , t D p i , t G p i , t H , t = 1 , 2 , , T
Q i , t = q i , t D q i , t G , t = 1 , 2 , , T
where p i , t D and q i , t D are the real active and reactive loads, respectively. When the power supply is deficient, the loads have to be cut down, i.e.,
0 p i , t D P ¯ i , t D , t = 1 , 2 , , T
0 q i , t D Q ¯ i , t D , t = 1 , 2 , , T
q i , t D = p i , t D tan φ i D , t = 1 , 2 , , T
where P ¯ i , t D and Q ¯ i , t D are the expected active and reactive loads and φ i D is the power factor.
The load curtailment cost is defined as
C i D = π i D t = 1 T ( P ¯ i , t D p i , t D )
where π i D is the unit penalty parameter.

2.4. Overall Model

Define the compact vector of stage-1 decision variable x : = H , H m , z i , m , the compact vector of uncertainty w : = v i j , and the compact vector of stage-2 decision variable y : = p i , t H , H i , t , H i , m , p i , t G , q i , t G , p i , t D , q i , t D , P i j , t , Q i j , t , P i , t , Q i , t , V i , t .
The two-stage robust optimization model is used for the resilience enhancement problem via HTTs. Then we get the compact form of the resilience enhancement problem
min x X a T x + max w W min y Y ( x , w ) c T y
where the feasible region of stage-1 decision variable X is formulated by constraints (2)–(5), the objective function a T x is the hydrogen purchasing cost (1) with the constant vector a , the uncertainty set W is constructed by constraint (6), the feasible region of stage-2 decision variable Y ( x , w ) is formulated by constraints (7), (8), (10), (12) and (14)–(17), and the objective function c T y is the sum of operational costs of hydrogen fuel cells (11), DGs (13) and load curtailments (18) with the constant vector c .
The objective of the two-stage robust optimization problem (19) can be divided into two parts: the stage-1 cost a T x meaning the hydrogen purchasing cost before contingencies, and the stage-2 cost max w W min y Y ( x , w ) c T y indicating the operational cost under the worst-case scenario of distribution line failures. The whole two-stage robust optimization problem (19) can be regarded as a sequential decision process. The distribution system operator firstly decides the pre-disaster scheduling. Then after the real distribution line failures are observed, the operator makes the operational decisions of hydrogen fuel cells, DGs, and load curtailments. In the robust optimization problem framework, the worst-case scenario of distribution line failures is considered. Therefore, there is a max w before the stage-2 decision.
Since the constraints that formulates the feasible region Y ( x , w ) are all linearized, the constraints can be replaced with
A x + B w + C y d
which is the compact form of constraints (7), (8), (10), (12) and (14)–(17). A , B and C are constant matrices and d is a constant vector.
Note that the feasible region of stage-2 decision variable Y ( x , w ) depends on the stage-1 decision variable x and the uncertainty variable w . It is remarkably difficult to solve the two-stage robust optimization problem (19).

3. Column-and-Constraint Generation Based Solution Algorithm

The two-stage resilience enhancement problem (19) owns a complex min max min mathematical structure, making it intractable. In this section, we will proposed a C&CG-based solution algorithm. The main idea of the C&CG algorithm is to divide the original problem into a min master problem and a max min subproblem. The master problem makes the stage-1 decision, i.e., the hydrogen weight and position of HTTs, while the subproblem checks the most dangerous contingency scenario of distribution line failures (often called worst-case scenario), given the stage-1 decision. After solving both problems, the master problem should additionally considers the latest worst-case scenario. Then iteratively solve the master problem and the subproblem, until no more worst-case scenario is identified.

3.1. Master Problem

Suppose that there has been a set of worst-case scenarios denoted by K after k iterations. The master problem aims to find the optimal strategy to deal with the set of worst-case scenarios, which is formulated as
min x , y κ , θ a T x + θ
s . t . x X
A x + B w * + C y κ d , w * K
θ c T y κ , κ K
where y κ is an auxiliary variable and w * is a constant worst-case scenario.
Noting that there are some binary variables in x , the master problem (21) belongs to mixed-integer linear program (MILP). It is tractable since many commercial solver can solve MILP and attain a global optimal solution. The optimal stage-1 decision of the master problem after k iterations is denoted by x k + 1 * .

3.2. Subproblem

Suppose that the stage-1 decision is updated to x k + 1 * after k iterations. The subproblem aims to find the worst-case scenario of distribution line failures under the latest stage-1 decision, which is formulated as
max w W min y Y ( x k + 1 * , w ) c T y
Note that the max-min subproblem is still difficult to solve. First of all, we focus on the inner minimization problem, i.e.,
min y c T y
s . t . A x k + 1 * + B w + C y d
Instead of directly solving the inner problem, we replace it with its dual problem. Define μ the Lagrangian multiplier of constraint (23b). Then the dual problem is given by
max μ ( A x k + 1 * + B w d ) T μ
s . t . μ 0
C T μ + c = 0
According to the duality theory and the Slater’s condition, the duality gap of problem (23) is zero, i.e., the optimal values of the primal problem (23) and the dual problem (24) equals. Therefore, we can replace the inner minimization problem (23) in (22) with its dual problem (24). Then the max min subproblem is simplified by
max w , μ ( A x k + 1 * + B w d ) T μ
s . t . w W , μ 0
C T μ + c = 0
Note that there is a bilinear term μ T B w in the objective (25a), making the problem (25) intractable. Since w is a vector of binary variables, we can use the big-M method to simplify the problem.
Define the auxiliary variable vector λ : = μ ( B w ) , where the sign ∘ means the element by element multiplication. Then the bilinear term μ T B w equals to 1 T λ . From the element-by-element perspective, if an element of μ is one, that of λ equals to that of B w ; otherwise, it equals zero. The above logic can be described by the following inequalities
M big μ λ M big μ
M big ( 1 μ ) λ B w M big ( 1 μ )
Hence the problem (25) can be further simplified by
max w , μ , λ ( A x k + 1 * d ) T μ + 1 T λ
s . t . ( 25 b ) , ( 25 c ) , ( 26 )
The final version (27) belongs to MILP, whose solution method is quite mature. Therefore, we can solve it and attain a worst-case scenario denoted by w k + 1 * . The latest scenario is added to the set of worst-case scenario K for the next master problem.

3.3. Overall Algorithm

According to the following transformation, we formulate the C&CG-based solution algorithm for the two-stage robust resilience enhancement problem via HTT. The whole algorithm is presented as Algorithm 1, while the detailed flowchart can be seen in Figure 1. Due to constraint (6), the set of all possible scenarios of distribution line failures is bounded. The C&CG algorithm is bound to converge since the worst condition is counting all possible scenarios.
Algorithm 1 C&CG algorithm for Robust Resilience Enhancement via HTT
Input: Set K = , k = 0 , U B = + , L B = , and  ε > 0 .
Output: Optimal decisions of hydrogen weight and location of HTTs.
S1 (Master problem): Update the stage-1 decisions of hydrogen weight and location of
 HTTs, x k + 1 * , by solving the master problem (21). Use the corresponding optimal θ k + 1 * to
 update the lower bound, i.e.,  L B = θ k + 1 * .
S2 (Subproblem): Obtain the worst-case scenario of distribution line failures, w k + 1 * ,
 by solving the simplified subproblem (27). Use the corresponding optimal value denoted
 by δ k + 1 * to update the upper bound, i.e.,  U B = min U B , a T x k + 1 * + δ k + 1 * .
S3 (Judgment): If U B L B ε , the algorithm terminates and the latest x k + 1 * is the
 optimal decisions of hydrogen weight and location of HTTs. Otherwise, set
K K w k + 1 * , k k + 1 and go to S1.

4. Case Study

4.1. Set Up

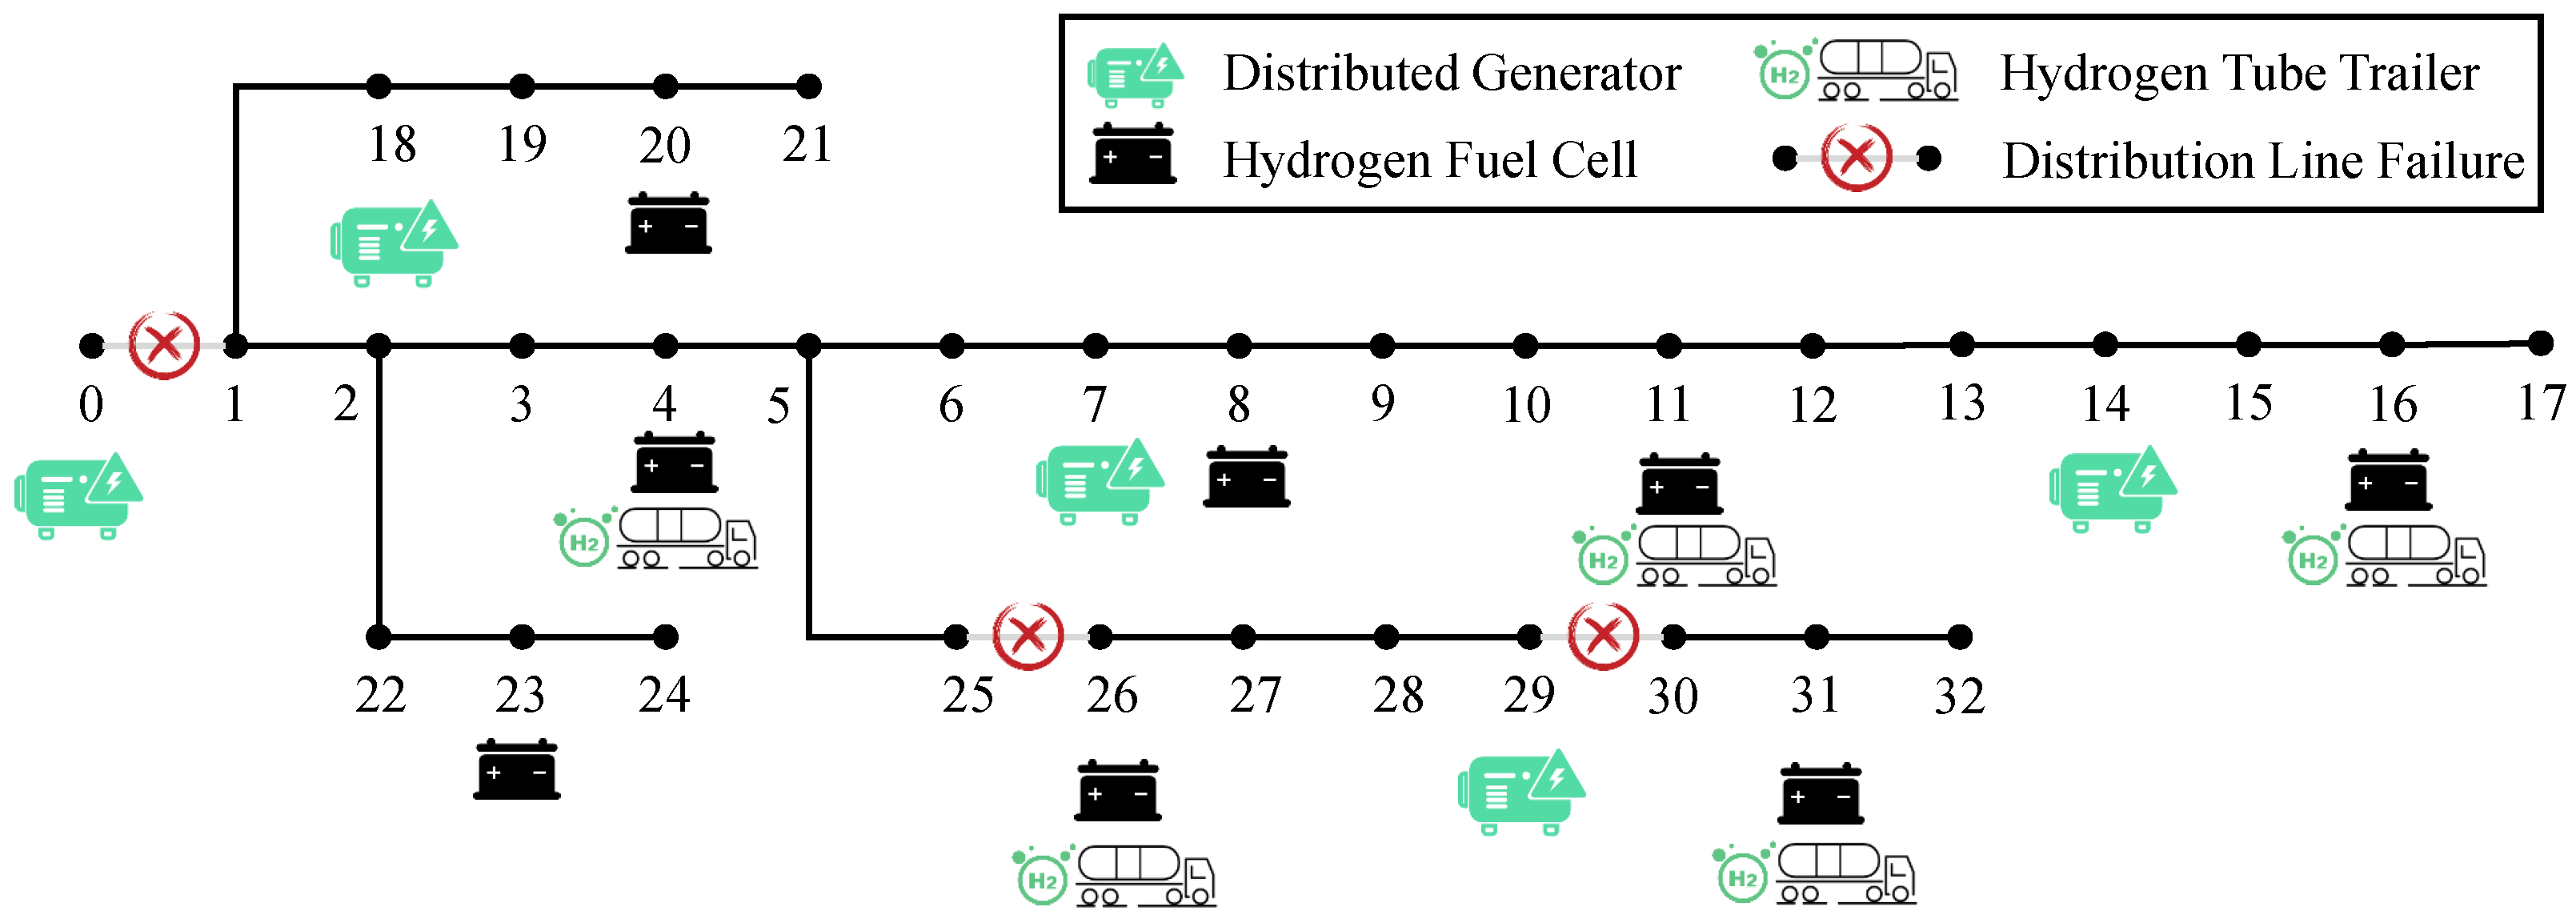
The proposed model and algorithm are verified in the IEEE 33-bus distribution system with 5 DGs and 8 HFCs. The configuration of the IEEE 33-bus distribution network can be seen in Figure 2. Suppose that there are 5 prepared HTTs for emergency power supply. It means that the distribution system operator has to choose 5 locations of HFCs from 8 alternatives for HTTs. Here we consider a 12-time-interval contingency of line failures. The normalized load profile is shown in Figure 3. In the C&CG algorithm, the error tolerance is set to ε = 10 6 . The parameter M big in the big-M method is set to 10 6 . The maximal hydrogen capacity of these HTT is set to 200 kg.

4.2. Main Result

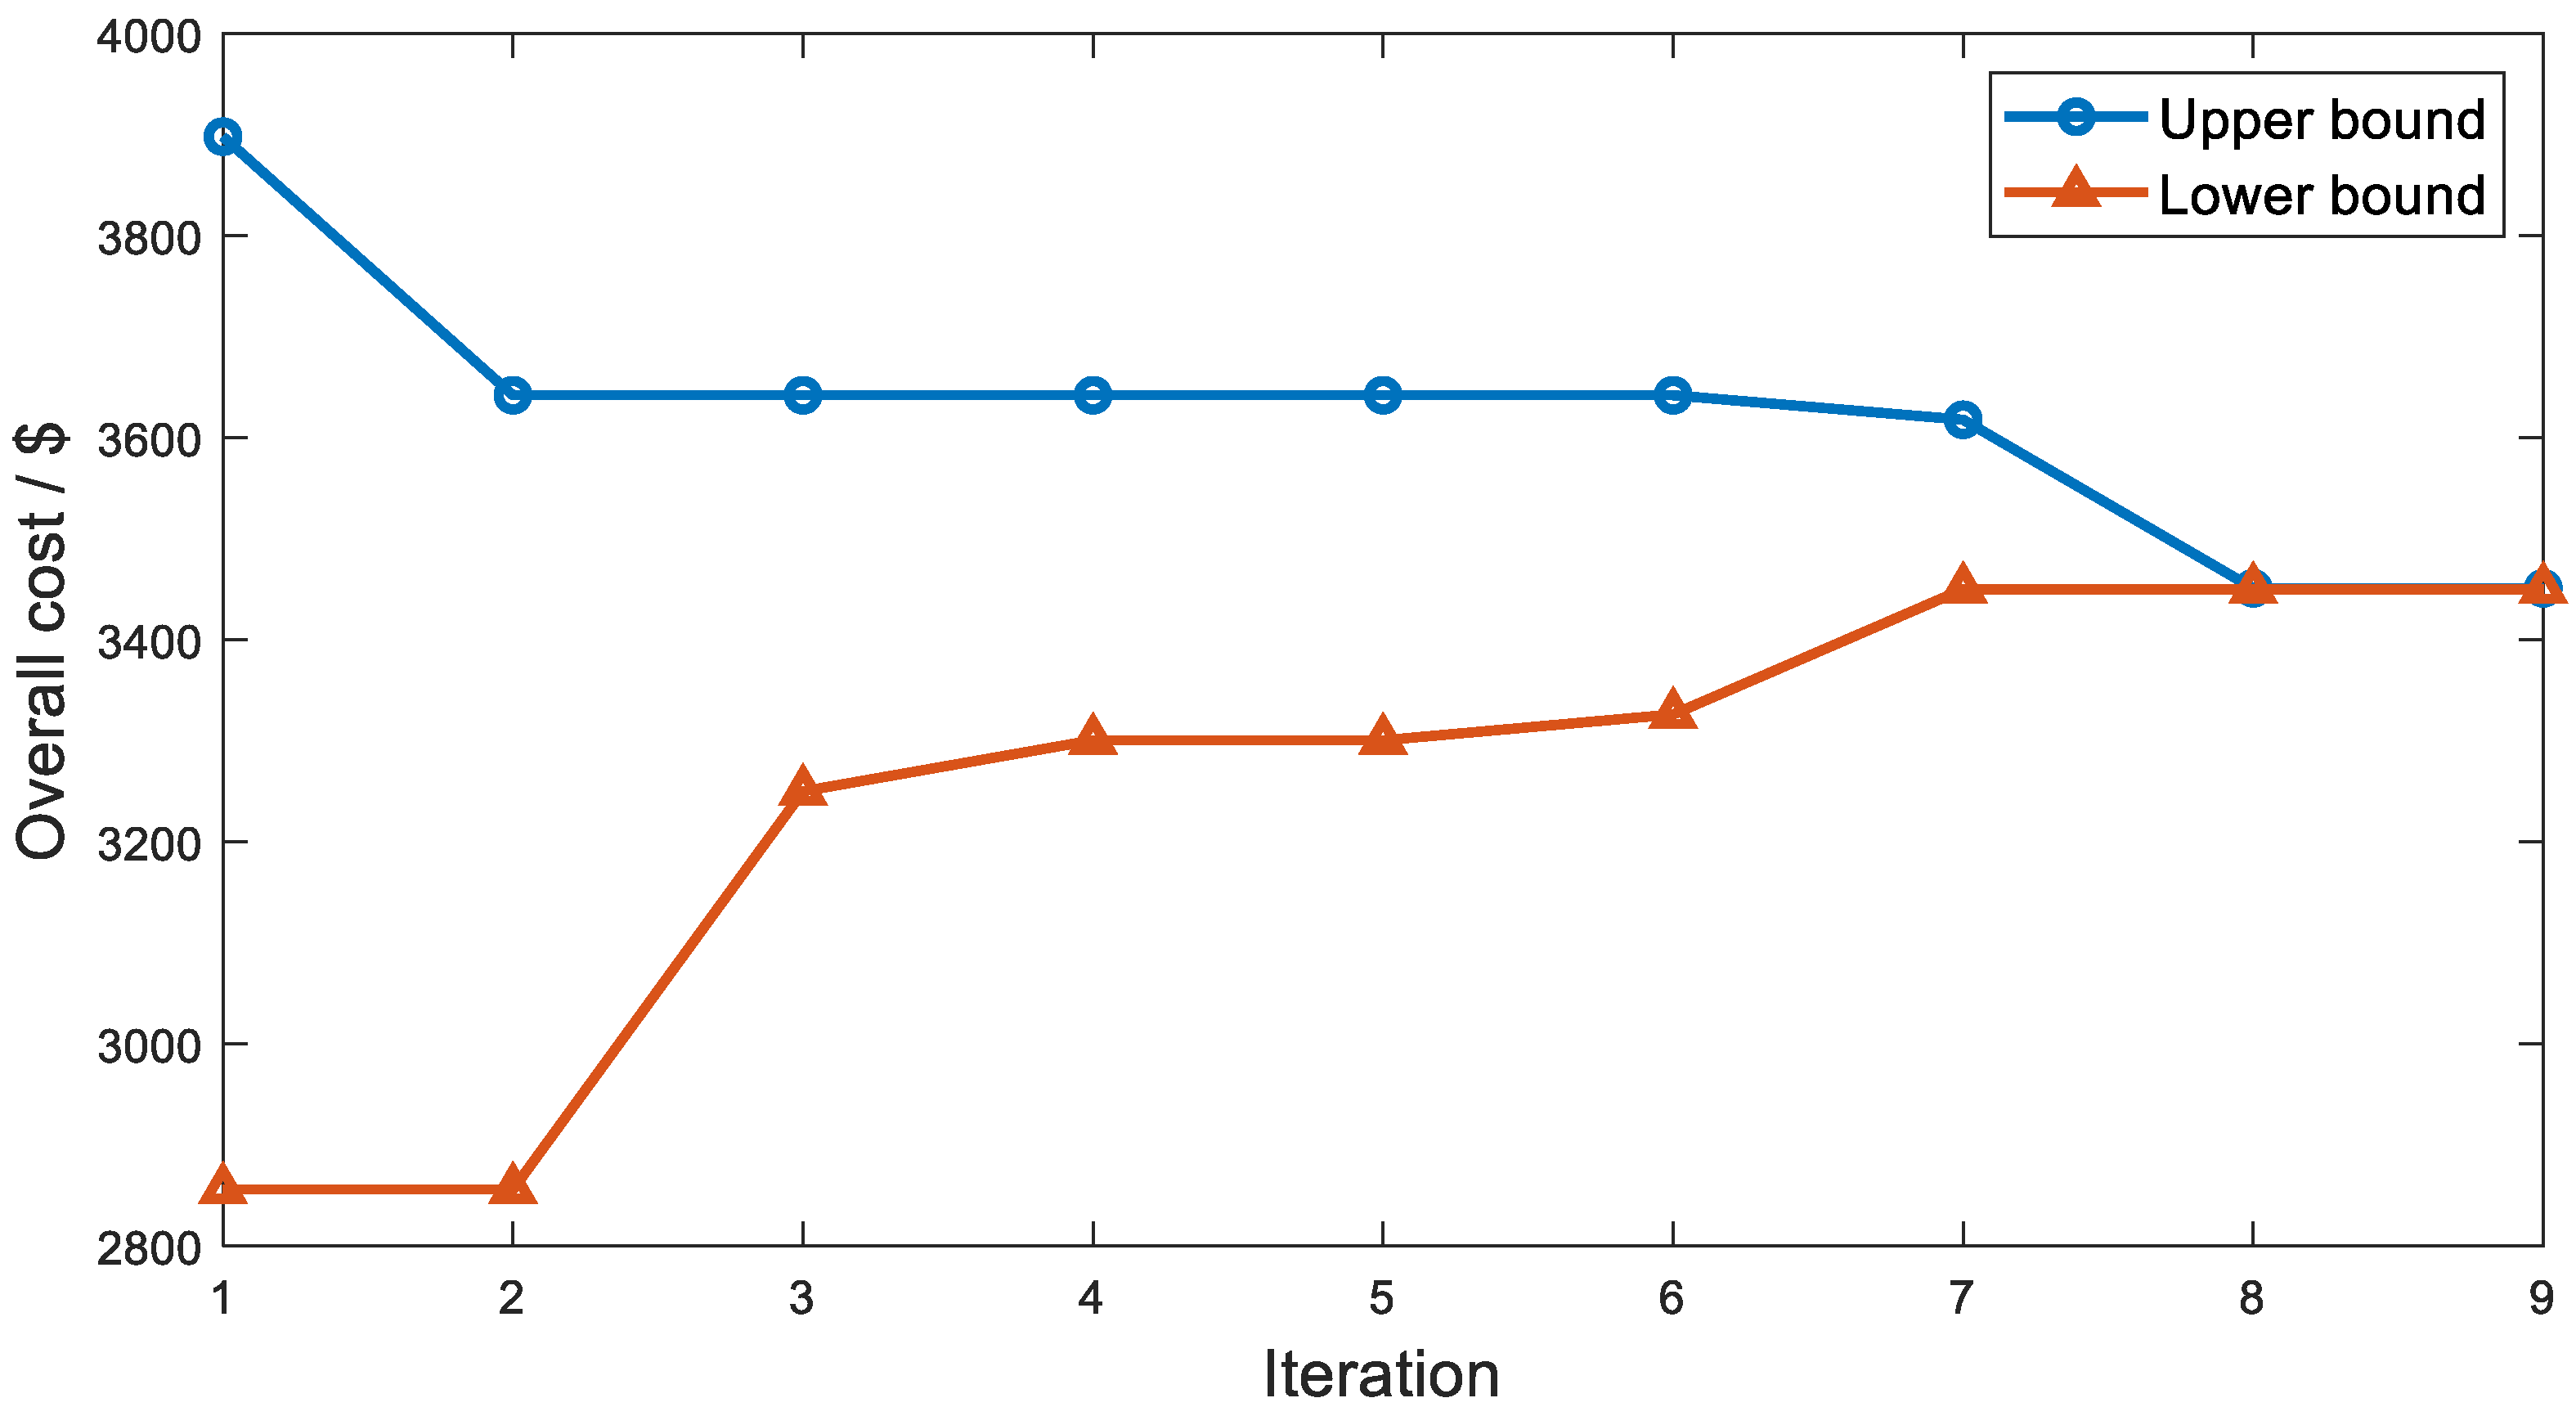
We first consider the scenario of 3 line failures, e.g., Γ v = 3 . Apply the C&CG algorithm to solve the two-stage resilience enhancement problem. The iteration process can be seen in Figure 4. It is revealed that the algorithm terminates after 9 iteration steps when the upper and lower bounds overlap. The upper and lower bounds are calculated by Algorithm 1 during iterations. The upper bound is the maximal operational cost by solving the subproblem (27) under given decisions of hydrogen weight and location of HTTs. It should be noted that along with the gradual optimization of HTT decisions, the maximal operational cost of the subproblem is reduced. Thus the curve of the upper bound declines. The lower bound is the minimal operational cost by solving the master problem (21) subject to limitations on the set of worst-case scenarios. During iterations, this set gradually expands, leading to an increasing lower bound. When the subproblem cannot pick up a more worse case, the upper and lower bounds equals, indicating that the latest scheduling decision of HTTs converges to an optimal one.
The optimal solution can be seen in Figure 5. The optimal location decisions of HTTs are commanding them moving to buses 4, 11, 16, 26, and 31, where there is a HFC. Under this stage-1 decision, the worst-case scenario of line failures are damaging distribution line ( 0 , 1 ) , ( 25 , 26 ) , and ( 29 , 30 ) . The feeder between the distribution and transmission systems is cut off, while the remaining distribution network is divided into 3 subnetworks. The optimal weight of hydrogen that the HTTs freight are 200, 200, 30.8, 200, and 169.2 kg, respectively. Benefiting from the optimal location decisions of HTTs, there is at least one HTT for emergency power supply in each subnetwork.
The detailed balance sheet of the distribution system under the worst-case scenario of line failures is shown in Table 1. Note that the power supply rate is the sum of the real power supply after load curtailment divided by the sum of the expected load without contingencies, i.e.,
t = 1 T i = 1 N p i , t D t = 1 T i = 1 N P ¯ i , t D × 100 %
The power supply rate is 49.03%, while the overall cost of the distribution system is 3450.0$. We also calculate the balance sheet of the distribution system under the worst-case scenario of line failures when there is no HTT for resilience enhancement, which is also shown in Table 1.
The power supply rate is only 22.73%, which means that up to 26.30% load has to be curtailed. Meanwhile, the overall cost of the distribution system increases to 3855.8$, which is a relative loss growth of 11.76%. The comparison of balance sheets with or without HTT convincingly demonstrates the remarkable effectiveness of HTT in resilience enhancement of distribution systems under line failures.

4.3. Sensitivity Analysis

In order to further study the impact of the scale of distribution line failures, Γ v , we change its value from 0 to 5 and list the corresponding balance sheet under the optimal scheduling strategies in Table 2. It is revealed that the overall cost increase with Γ v increasing. Meanwhile, as the network configuration is more and more severely damaged, the effectiveness of HFCs and DGs becomes feeble. It inspire us that distribution line hardening and network reconfiguration are also important under extremely severe contingencies.

4.4. Model Comparison

The effectiveness and robustness of the proposed two-stage robust optimization model are verified. Besides the robust one, the two-stage stochastic optimization model is also widely utilized. Hence we use the two-stage stochastic model as a comparison [34]. The Monte Carlo sampling method is applied to compare the effectiveness and robustness of the proposed two-stage robust model and the standard two-stage stochastic model. 5000 samplings are carried out under these two models, whose results are shown in Table 3. The minimal and averaged overall cost of the stochastic model is lightly smaller than that of the robust one, while the power supply rate of the stochastic model is larger than that of the robust one. It means that the robust model remarkably enhances the resilience, while only tiny cost is taken. On the other hand, under the worst-case scenarios, i.e., the maximal values in Table 3, the overall cost (power supply rate) of the stochastic model is highly larger (smaller) than that of the robust model. It reveals the robustness of the proposed model in real scenarios.

5. Conclusions

This paper proposes a two-stage robust resilience enhancement model of distribution systems via hydrogen tube trailers. This model aims to scheduling hydrogen tube trailers to key nodes of the distribution network to supply hydrogen for power generation. Hydrogen transported by hydrogen tube trailers is consumed by hydrogen fuel cells to support key loads when extreme contingencies damage distribution lines. Since the real distribution line failures are unknown before they happen, the robust optimization is utilized in the model to consider all possible scenarios. A C&CG-based algorithm is proposed to efficiently solve the two-stage robust resilience enhancement model. It divides the whole problem into a scheduling master problem of hydrogen tube trailers and a subproblem of searching for the worst-case distribution line failure scenario. Numerical experiment results verify the resilience enhancement effectiveness of hydrogen tube trailers and the solution efficiency of the C&CG-based algorithm.
There is still some limitations in the proposed model and method. On the one hand, the robust optimization model is kind of overly conservative in estimating contingencies. It is recommended to combine the advantages of stochastic and robust models. On the other hand, the proposed algorithm has to be revised to deal with the binary variables in stage 2. It means that some discrete decisions, e.g., redispatch of hydrogen tube trailers, is difficult to consider in this paper. It is expected that the above limitations could be solved in our future works.

Author Contributions

Conceptualization, Y.S. and L.Y.; methodology, L.Y. and Z.L.; software, T.L.; validation, N.A.; writing—original draft preparation, L.Y. and Y.S.; writing—review and editing, W.Z. and N.A.; supervision, Y.S. and W.Z.; project administration, L.Y. and Z.L.; funding acquisition, Y.S. All authors have read and agreed to the published version of the manuscript.

Funding

This study was supported by QingHai Province Key Laboratory of Photovoltaic grid connected power generation technology (Grant No. SGTYHT/23-JS-004 SGQHJY00NYJS2400312).

Data Availability Statement

Data are contained within the article.

Conflicts of Interest

Authors Libin Yang, Zhengxi Li, Tingxiang Liu, Na An and Wanpeng Zhou were employed by the Economic and Technological Research Institute of State Grid Qinghai Electric Power Company and Clean Energy Development Research Institute of State Grid Qinghai Electric Power Company. The remaining authors declare that the research was conducted in the absence of any commercial or financial relationships that could be construed as a potential conflict of interest.

References

  1. Ozturk, M.; Dincer, I. A comprehensive review on power-to-gas with hydrogen options for cleaner applications. Int. J. Hydrogen Energy 2021, 46, 31511–31522. [Google Scholar] [CrossRef]
  2. Apostolou, D.; Enevoldsen, P. The past, present and potential of hydrogen as a multifunctional storage application for wind power. Renew. Sustain. Energy Rev. 2019, 112, 917–929. [Google Scholar]
  3. Fereidooni, M.; Mostafaeipour, A.; Kalantar, V.; Goudarzi, H. A comprehensive evaluation of hydrogen production from photovoltaic power station. Renew. Sustain. Energy Rev. 2018, 82, 415–423. [Google Scholar]
  4. Ishaq, H.; Dincer, I.; Crawford, C. A review on hydrogen production and utilization: Challenges and opportunities. Int. J. Hydrogen Energy 2022, 47, 26238–26264. [Google Scholar]
  5. Chen, S.; Zhang, K.; Liu, N.; Xie, Y. Unlock the aggregated flexibility of electricity-hydrogen integrated virtual power plant for peak-regulation. Appl. Energy 2024, 360, 122747. [Google Scholar]
  6. Lee, G.H.; Park, J.Y.; Ban, J.; Kim, Y.J.; Catalão, J.P. Data-driven modeling and optimal control of hydrogen energy storage for frequency regulation. IEEE Trans. Energy Convers. 2022, 38, 1231–1245. [Google Scholar]
  7. Wang, X.; Huang, W.; Wei, W.; Tai, N.; Li, R.; Huang, Y. Day-ahead optimal economic dispatching of integrated port energy systems considering hydrogen. IEEE Trans. Ind. Appl. 2021, 58, 2619–2629. [Google Scholar]
  8. Fayaz, H.; Saidur, R.; Razali, N.; Anuar, F.S.; Saleman, A.; Islam, M. An overview of hydrogen as a vehicle fuel. Renew. Sustain. Energy Rev. 2012, 16, 5511–5528. [Google Scholar]
  9. Aminudin, M.; Kamarudin, S.; Lim, B.; Majilan, E.; Masdar, M.; Shaari, N. An overview: Current progress on hydrogen fuel cell vehicles. Int. J. Hydrogen Energy 2023, 48, 4371–4388. [Google Scholar]
  10. Mishra, D.K.; Ghadi, M.J.; Azizivahed, A.; Li, L.; Zhang, J. A review on resilience studies in active distribution systems. Renew. Sustain. Energy Rev. 2021, 135, 110201. [Google Scholar]
  11. Bie, Z.; Lin, Y.; Li, G.; Li, F. Battling the extreme: A study on the power system resilience. Proc. IEEE 2017, 105, 1253–1266. [Google Scholar] [CrossRef]
  12. Jena, R.; Pradhan, B. Integrated ANN-cross-validation and AHP-TOPSIS model to improve earthquake risk assessment. Int. J. Disaster Risk Reduct. 2020, 50, 101723. [Google Scholar] [CrossRef]
  13. National Academies of Sciences; Division on Earth, Life Studies; Board on Atmospheric Sciences; Committee on Extreme Weather Events; Climate Change Attribution. Attribution of Extreme Weather Events in the Context of Climate Change; National Academies Press: Washington, DC, USA, 2016. [Google Scholar]
  14. Saini, D.K.; Sharma, M. Techno-economic hardening strategies to enhance distribution system resilience against earthquake. Reliab. Eng. Syst. Saf. 2021, 213, 107682. [Google Scholar]
  15. Yan, M.; Shahidehpour, M.; Paaso, A.; Zhang, L.; Alabdulwahab, A.; Abusorrah, A. Distribution system resilience in ice storms by optimal routing of mobile devices on congested roads. IEEE Trans. Smart Grid 2020, 12, 1314–1328. [Google Scholar] [CrossRef]
  16. Yang, Y.; Tang, W.; Liu, Y.; Xin, Y.; Wu, Q. Quantitative resilience assessment for power transmission systems under typhoon weather. IEEE Access 2018, 6, 40747–40756. [Google Scholar] [CrossRef]
  17. Trakas, D.N.; Hatziargyriou, N.D. Optimal distribution system operation for enhancing resilience against wildfires. IEEE Trans. Power Syst. 2017, 33, 2260–2271. [Google Scholar] [CrossRef]
  18. Bagheri, A.; Zhao, C.; Qiu, F.; Wang, J. Resilient transmission hardening planning in a high renewable penetration era. IEEE Trans. Power Syst. 2018, 34, 873–882. [Google Scholar] [CrossRef]
  19. Ma, S.; Chen, B.; Wang, Z. Resilience enhancement strategy for distribution systems under extreme weather events. IEEE Trans. Smart Grid 2016, 9, 1442–1451. [Google Scholar] [CrossRef]
  20. Shi, Q.; Li, F.; Dong, J.; Olama, M.; Wang, X.; Winstead, C.; Kuruganti, T. Co-optimization of repairs and dynamic network reconfiguration for improved distribution system resilience. Appl. Energy 2022, 318, 119245. [Google Scholar] [CrossRef]
  21. Gao, H.; Chen, Y.; Mei, S.; Huang, S.; Xu, Y. Resilience-oriented pre-hurricane resource allocation in distribution systems considering electric buses. Proc. IEEE 2017, 105, 1214–1233. [Google Scholar] [CrossRef]
  22. Yuan, W.; Wang, J.; Qiu, F.; Chen, C.; Kang, C.; Zeng, B. Robust optimization-based resilient distribution network planning against natural disasters. IEEE Trans. Smart Grid 2016, 7, 2817–2826. [Google Scholar] [CrossRef]
  23. Mukhopadhyay, B.; Das, D. Multi-objective dynamic and static reconfiguration with optimized allocation of PV-DG and battery energy storage system. Renew. Sustain. Energy Rev. 2020, 124, 109777. [Google Scholar] [CrossRef]
  24. Akaber, P.; Moussa, B.; Debbabi, M.; Assi, C. Automated post-failure service restoration in smart grid through network reconfiguration in the presence of energy storage systems. IEEE Syst. J. 2019, 13, 3358–3367. [Google Scholar] [CrossRef]
  25. Lei, S.; Chen, C.; Zhou, H.; Hou, Y. Routing and scheduling of mobile power sources for distribution system resilience enhancement. IEEE Trans. Smart Grid 2018, 10, 5650–5662. [Google Scholar] [CrossRef]
  26. Li, B.; Chen, Y.; Wei, W.; Huang, S.; Mei, S. Resilient restoration of distribution systems in coordination with electric bus scheduling. IEEE Trans. Smart Grid 2021, 12, 3314–3325. [Google Scholar] [CrossRef]
  27. Li, B.; Chen, Y.; Wei, W.; Wang, Z.; Mei, S. Online coordination of LNG tube trailer dispatch and resilience restoration of integrated power-gas distribution systems. IEEE Trans. Smart Grid 2022, 13, 1938–1951. [Google Scholar] [CrossRef]
  28. Kim, J.; Dvorkin, Y. Enhancing distribution system resilience with mobile energy storage and microgrids. IEEE Trans. Smart Grid 2018, 10, 4996–5006. [Google Scholar] [CrossRef]
  29. Ding, T.; Wang, Z.; Jia, W.; Chen, B.; Chen, C.; Shahidehpour, M. Multiperiod distribution system restoration with routing repair crews, mobile electric vehicles, and soft-open-point networked microgrids. IEEE Trans. Smart Grid 2020, 11, 4795–4808. [Google Scholar] [CrossRef]
  30. Che, L.; Shahidehpour, M. Adaptive formation of microgrids with mobile emergency resources for critical service restoration in extreme conditions. IEEE Trans. Power Syst. 2018, 34, 742–753. [Google Scholar] [CrossRef]
  31. Taheri, B.; Safdarian, A.; Moeini-Aghtaie, M.; Lehtonen, M. Distribution system resilience enhancement via mobile emergency generators. IEEE Trans. Power Deliv. 2020, 36, 2308–2319. [Google Scholar] [CrossRef]
  32. Zhu, H.; Liu, H.J. Fast local voltage control under limited reactive power: Optimality and stability analysis. IEEE Trans. Power Syst. 2015, 31, 3794–3803. [Google Scholar] [CrossRef]
  33. Babaei, S.; Jiang, R.; Zhao, C. Distributionally robust distribution network configuration under random contingency. IEEE Trans. Power Syst. 2020, 35, 3332–3341. [Google Scholar] [CrossRef]
  34. Liu, C.; Fan, Y.; Ordóñez, F. A two-stage stochastic programming model for transportation network protection. Comput. Oper. Res. 2009, 36, 1582–1590. [Google Scholar] [CrossRef]
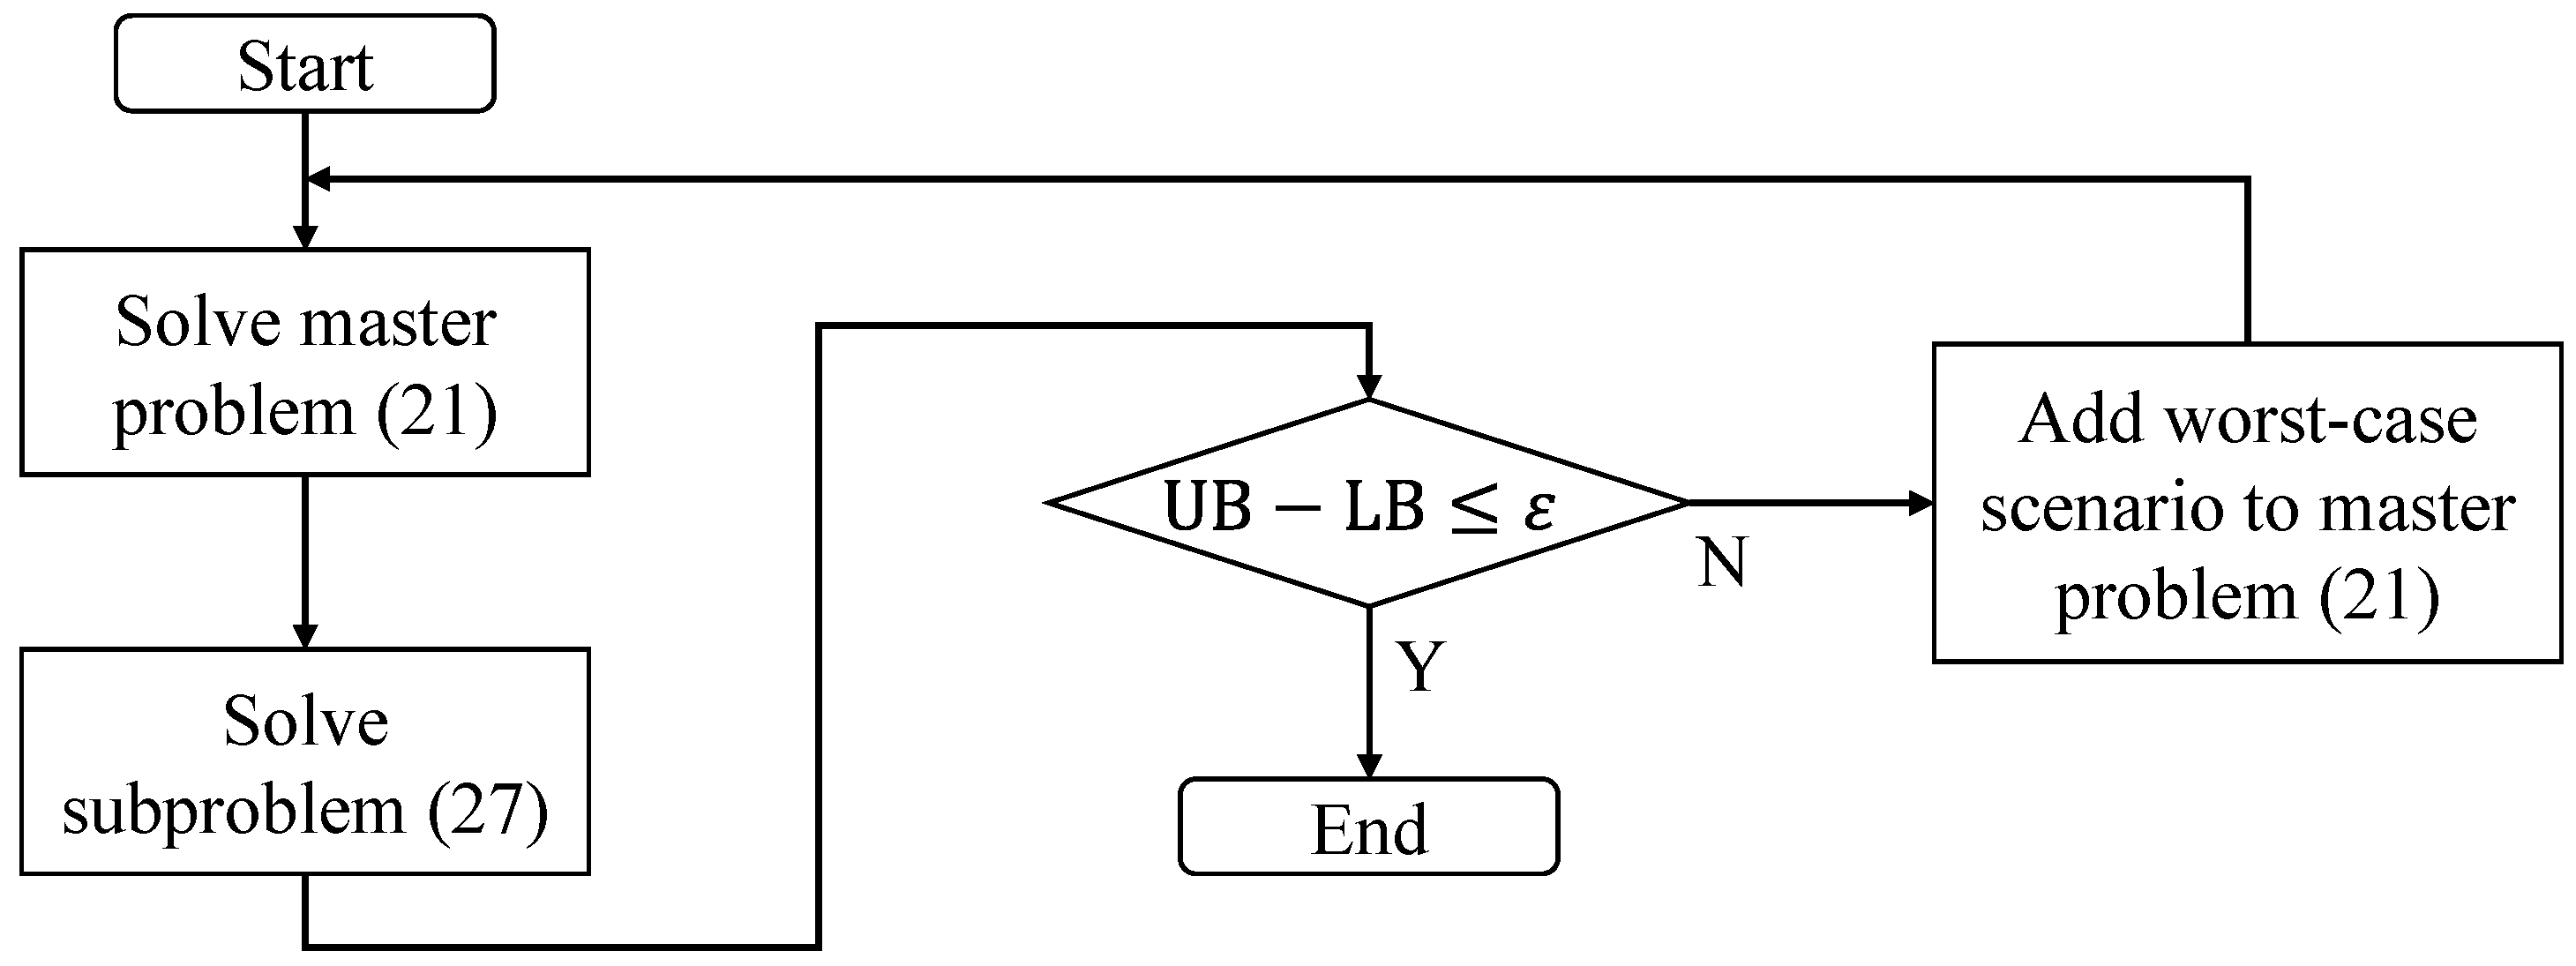
Figure 1. The flowchart of the proposed algorithm.
Energies 17 05028 g001
Figure 2. The topology of the IEEE 33-bus distribution system.
Energies 17 05028 g002
Figure 3. The normalized load profile.
Energies 17 05028 g003
Figure 4. The iteration process of the C&CG algorithm.
Energies 17 05028 g004
Figure 5. Main result of hydrogen tube trailers siting.
Energies 17 05028 g005
Table 1. The balance sheet with/without HTT.
ScenarioOverall Cost Hydrogen Purchase Cost Generation Cost Load Curtailment Cost Power Supply Rate
w/HTT3450.0800.0534.82115.249.03%
w/o HTT3855.80649.23206.622.73%
The unit of cost is $.
Table 2. The balance sheet under different scales of line failures.
Γ v Overall Cost Hydrogen Purchase Cost Generation Cost Load Curtailment Cost Power Supply Rate
02370.31000.01370.30100.0%
12850.21000.0660.21190.071.33%
23096.8846.6468.21782.057.06%
33450.0800.0534.82115.249.03%
43709.1902.4588.52218.246.55%
53895.2124.6462.53308.120.29%
The unit of cost is $.
Table 3. Overall Cost and Power Supply Rate Under Two-Stage Robust and Stochastic Models.
ModelOverall Cost/$Power Supply Rate
min.avg.max.min.avg.max.
Robust2950.33175.83450.049.03%59.86%68.25%
Stochastic2941.23112.03788.434.29%55.82%68.72%
Disclaimer/Publisher’s Note: The statements, opinions and data contained in all publications are solely those of the individual author(s) and contributor(s) and not of MDPI and/or the editor(s). MDPI and/or the editor(s) disclaim responsibility for any injury to people or property resulting from any ideas, methods, instructions or products referred to in the content.