
The Impact of Priority in Coordinated Traffic Lights on Tram Energy Consumption


Abstract
1. Introduction
- -
- The impact of the use of priority algorithms on the electricity consumption for tram traction needs;
- -
- The impact of parameterization of priority control algorithms on electricity consumption for tram traction needs;
- -
- The impact of tram traffic volume on electricity consumption on a route controlled by a priority algorithm.
2. Materials and Methods
3. Results
3.1. Experimental Run and Model Verification
3.2. Impact of the Use of Prioritized Algorithms on Electricity Consumption for Tram Traction Needs
3.3. Influence of Parameterization of Control Algorithms with Priority on Electricity Consumption for Tram Traction Needs
3.4. Influence of Tram Traffic Volume on Electricity Consumption on a Route Controlled by a Priority Algorithm
4. Discussion
5. Comparative Analysis
6. Conclusions
Author Contributions
Funding
Data Availability Statement
Conflicts of Interest
References
- Desta, R.; Tesfaye, D.; Tóth, J. Microscopic Traffic Characterization of Light Rail Transit Systems at Level Crossings. Adv. Civ. Eng. 2021, 2021, 1–11. [Google Scholar] [CrossRef]
- Leitner, D.; Meleby, P.; Miao, L. Recent Advances in Traffic Signal Performance Evaluation. J. Traffic Transp. Eng. Engl. Ed. 2022, 9, 507–531. [Google Scholar] [CrossRef]
- Li, J.; Liu, Y.; Yang, H.; Chen, B. Bus Priority Signal Control Considering Delays of Passengers and Pedestrians of Adjacent Intersections. J. Adv. Transp. 2020, 2020, 1–12. [Google Scholar] [CrossRef]
- Naznin, F.; Currie, G.; Sarvi, M.; Logan, D. An Empirical Bayes Safety Evaluation of Tram/Streetcar Signal and Lane Priority Measures in Melbourne. Traffic Inj. Prev. 2016, 17, 91–97. [Google Scholar] [CrossRef] [PubMed]
- de Oliveira, G.G.; Iano, Y.; Vaz, G.C.; Negrete, P.D.M.; Negrete, J.C.M.; Chuma, E.L. Intelligent Mobility: A Proposal for Modeling Traffic Lights Using Fuzzy Logic and IoT for Smart Cities. In Proceedings of the Soft Computing and its Engineering Applications; Patel, K.K., Doctor, G., Patel, A., Lingras, P., Eds.; Springer International Publishing: Cham, Switzerland, 2022; Volume 1572, pp. 302–311. [Google Scholar]
- Zhang, X.; Blokpoel, R.; Lu, M. Adaptive Green Wave with Speed Advice for Automated Vehicles. In Proceedings of the ITS Europe congress, Eindhoven, The Netherlands, 3–6 June 2019. [Google Scholar]
- Ito, H.; Kawazoe, N. Promoting Urban Light Rail Transit in a Compact City Context: The Case of Toyama City, Japan. Reg. Stud. Reg. Sci. 2022, 9, 776–793. [Google Scholar] [CrossRef]
- Gadziński, J.; Radzimski, A. The First Rapid Tram Line in Poland: How Has It Affected Travel Behaviours, Housing Choices and Satisfaction, and Apartment Prices? J. Transp. Geogr. 2016, 54, 451–463. [Google Scholar] [CrossRef]
- Rabay, L.; Meira, L.H.; de Andrade, M.O.; de Oliveira, L.K. A Portrait of the Crisis in the Brazilian Urban Bus System: An Analysis of Factors Influencing the Reduction in Usage. Case Stud. Transp. Policy 2021, 9, 1879–1887. [Google Scholar] [CrossRef]
- Czerepicki, A.; Górka, A.; Szustek, J. Analysis of Trams’ Consumption Depending on the Type of Traffic Light Used. Nauka Teh. 2019, 18, 490–494. [Google Scholar] [CrossRef]
- Nellore, K.; Hancke, G.P. Traffic Management for Emergency Vehicle Priority Based on Visual Sensing. Sensors 2016, 16, 1892. [Google Scholar] [CrossRef]
- Sundar, R.; Hebbar, S.; Golla, V. Implementing Intelligent Traffic Control System for Congestion Control, Ambulance Clearance, and Stolen Vehicle Detection. IEEE Sens. J. 2015, 15, 1109–1113. [Google Scholar] [CrossRef]
- Chakraborty, P.S.; Tiwari, A.; Sinha, P.R. Adaptive and Optimised Emergency Vehicle Dispatching Algorithm for Intelligent Traffic Management System. Procedia Comput. Sci. 2015, 57, 1384–1393. [Google Scholar] [CrossRef]
- Huang, Y.-S.; Shiue, J.-Y.; Luo, J. A Traffic Signal Control Policy for Emergency Vehicles Preemption Using Timed Petri Nets. IFAC Pap. 2015, 48, 2183–2188. [Google Scholar] [CrossRef]
- Louati, A.; Elkosantini, S.; Darmoul, S.; Louati, H. Multi-Agent Preemptive Longest Queue First System to Manage the Crossing of Emergency Vehicles at Interrupted Intersections. Eur. Transp. Res. Rev. 2018, 10, 52. [Google Scholar] [CrossRef]
- Parthasarathi, V.; Surya, M.; Akshay, B.; Murali Siva, K.; Vasudevan, S.K. Smart Control of Traffic Signal System Using Image Processing. Indian J. Sci. Technol. 2015, 8, 1–5. [Google Scholar] [CrossRef]
- Madrjas, G.; Szustek, J.; Górka, A.; Guralski, B.; Stasiak, M. Dziesięć lat wdrażania priorytetu tramwajowego w Warszawie.(eng. Ten years of implementing tramway priority in Warsaw). In Proceedings of the Krakowskie Dni Bezpieczeństwa w Miastach, Kraków, Poland, 12–14 October 2022. [Google Scholar]
- Dera, P. Stosowanie priorytetów dla pojazdów transportu zbiorowego w szczególności w zakresie wspólnych pasów autobusowo-tramwajowych w Krakowie. (The use of priority for public transport vehicles, especially in terms of shared tram-bus lanes in Kraków). Transp. Miej. I Reg. 2013, 6, 20–25. [Google Scholar]
- Estrada, M.; Mension, J.; Salicrú, M. Operation of Transit Corridors Served by Two Routes: Physical Design, Synchronisation, and Control Strategies. Transp. Res. Part C Emerg. Technol. 2021, 130, 103283. [Google Scholar] [CrossRef]
- Zhou, W.; Bai, Y.; Li, J.; Zhou, Y.; Li, T. Integrated Optimization of Tram Schedule and Signal Priority at Intersections to Minimise Person Delay. J. Adv. Transp. 2019, 2019, 4802967. [Google Scholar] [CrossRef]
- Lehtonen, M.; Kulmala, R. Benefits of Pilot Implementation of Public Transport Signal Priorities and Real-Time Passenger Information. Transp. Res. Rec. 2002, 1799, 18–25. [Google Scholar] [CrossRef]
- Akgüngör, A.P.; Mercan, E.Z. An Analysis of Type I Dilemma Zone at Signalised Intersections. Sci. J. Silesian Univ. Technol. Ser. Transp. 2021, 112, 5–16. [Google Scholar] [CrossRef]
- Carvalho Barbosa, R.; Shoaib Ayub, M.; Lopes Rosa, R.; Zegarra Rodríguez, D.; Wuttisittikulkij, L. Lightweight PVIDNet: A Priority Vehicles Detection Network Model Based on Deep Learning for Intelligent Traffic Lights. Sensors 2020, 20, 6218. [Google Scholar] [CrossRef]
- Górka, A.; Szustek, J. Wdrożenie priorytetu dla tramwajów na rondzie Zgrupowania AK „Radosław” w Warszawie metodą dekompozycji na podskrzyżowania częściowe. (Implementation of the priority for trams on the “Zgrupowanie AK Radosław” roundabout in Warsaw using the partial intersections division method). Transp. Miej. I Reg. 2018, 12, 17–21. [Google Scholar]
- Molecki, A. Dostosowywanie układu drogowego w kontekście funkcjonalności sieci tramwajowe. (Adaptation of the road system in the context of the tram network functionality). TTS Tech. Transp. Szyn. 2020, 5–6, 29–34. [Google Scholar]
- Chentoufi, M.A.; Ellaia, R. A Novel Metaheuristic for Adaptive Signal Timing Optimization Considering Emergency Vehicle Preemption and Tram Priority. SAE Int. J. Transp. Saf. 2019, 7, 129–151. [Google Scholar] [CrossRef]
- Hounsell, N.B.; McLeod, F.N.; Shrestha, B.P. Bus Priority at Traffic Signals: Investigating the Options. In Proceedings of the 12th IEE International Conference on Road Transport Information and Control 2004 (RTIC 2004), London, UK, 20–22 April 2004; Institute of Electrical and Electronics Engineers: Piscataway, NJ, USA; pp. 287–294. [Google Scholar]
- Qiu, Y.; Zheng, L.; Du, Y.; Jiang, S. Performance Evaluation of Transit Signal Priorities on Bus Transit Corridor Based on Data Envelopment Analysis. Int. J. Transp. Sci. Technol. 2020, 9, 322–333. [Google Scholar] [CrossRef]
- Li, Y.; Cai, Q.; Xu, Y.; Shi, W.; Chen, Y. Design of Real-Time Actuated Control System for Modern Tram at Arterial Intersections Based on Logic Rules. Adv. Mech. Eng. 2018, 10, 168781401881542. [Google Scholar] [CrossRef]
- Yan, H.; Ou, D.; Chen, Z.; Yang, Y. Research on Tram Detector Location Based on Vehicle–Infrastructure Communication. In Proceedings of the 3rd International Conference on Electrical and Information Technologies for Rail Transportation (EITRT) 2017; Springer: Singapore, 2018; pp. 915–925. [Google Scholar]
- Koehler, L.A.; Seman, L.O.; Kraus, W.; Camponogara, E. Real-Time Integrated Holding and Priority Control Strategy for Transit Systems. IEEE Trans. Intell. Transport. Syst. 2019, 20, 3459–3469. [Google Scholar] [CrossRef]
- Mirchandani, P.; Head, L. A Real-Time Traffic Signal Control System: Architecture, Algorithms, and Analysis. Transp. Res. Part C Emerg. Technol. 2001, 9, 415–432. [Google Scholar] [CrossRef]
- Celtek, S.A.; Durdu, A.; Ali, M.E.M. Real-Time Traffic Signal Control with Swarm Optimization Methods. Measurement 2020, 166, 108206. [Google Scholar] [CrossRef]
- Gao, J.; Shen, Y.; Liu, J.; Ito, M.; Shiratori, N. Adaptive Traffic Signal Control: Deep Reinforcement Learning Algorithm with Experience Replay and Target Network. arXiv 2017, arXiv:1705.02755. [Google Scholar] [CrossRef]
- Suthaputchakun, C.; Sun, Z. A Novel Traffic Light Scheduling Based on TLVC and Vehicles’ Priority for Reducing Fuel Consumption and CO2 Emission. IEEE Syst. J. 2018, 12, 1230–1238. [Google Scholar] [CrossRef]
- Li, M.; Wu, G.; Li, Y.; Bu, F.; Zhang, W. Active Signal Priority for Light Rail Transit at Grade Crossings. Transp. Res. Rec. 2007, 2035, 141–149. [Google Scholar] [CrossRef]
- Aleksandrowicz, J.; Stróżek, A. Priorytet dla pojazdów transportu zbiorowego w programie sygnalizacji świetlnej na podstawie liczby pasażerów. (Priority for public transport vehicles in a traffic light control plan based on number of passengers). Transp. Miej. I Reg. 2021, 3, 14–18. [Google Scholar]
- Chow, A.H.F.; Sha, R.; Li, S. Centralised and Decentralised Signal Timing Optimisation Approaches for Network Traffic Control. Transp. Res. Part C Emerg. Technol. 2020, 113, 108–123. [Google Scholar] [CrossRef]
- Molecki, A. Kształtowanie priorytetu tramwajowego w procesie wdrażania ITS we Wrocławiu. (Shaping tram priority in the process of ITS implementation in Wroclaw). Przegląd Komun. 2015, 22, 20–22. [Google Scholar]
- Vujičić, M.; Prester, J. Assessing Service Quality of Public Tram Transport in Zagreb City Using P-Transqual Model. Zb. Ekon. Fak. U Zagreb 2019, 17, 19–31. [Google Scholar] [CrossRef]
- Xu, Z.; Lv, S.; Li, D.; Quan, M. Coordinated Control Method for Trams on Urban Arterial. IOP Conf. Ser. Earth Environ. Sci. 2020, 587, 012092. [Google Scholar] [CrossRef]
- Lin, Y.; Yang, X.; Zou, N. Passive Transit Signal Priority for High Transit Demand: Model Formulation and Strategy Selection. Transp. Lett. 2019, 11, 119–129. [Google Scholar] [CrossRef]
- Jeong, Y.; Kim, Y. Tram Passive Signal Priority Strategy Based on the MAXBAND Model. KSCE J. Civ. Eng. 2014, 18, 1518–1527. [Google Scholar] [CrossRef]
- Bai, Y.; Li, J.; Li, T.; Yang, L.; Lyu, C. Traffic Signal Coordination for Tramlines with Passive Priority Strategy. Math. Probl. Eng. 2018, 2018, 1–14. [Google Scholar] [CrossRef]
- Kaczmarek, M. Zintegrowana Koordynacja Tramwajów i Pojazdów Indywidualnych w Korytarzach Transportowych (Integrated Coordination of Trams and Individual Vehicles in Transportation Corridors). In Proceedings of the VIII Konferencja Naukowo, Techniczna, Rosnówko, 15–17 June 2011; SITK: Poznań, Poland, 2011. [Google Scholar]
- Górka, A.; Szustek, J. Związek Priorytetu Dla Tramwajów w Sygnalizacji Świetlnej z Zużyciem Energii Elektrycznej (Relation of Priority for Trams in Traffic Signals to Electricity Consumption). Plan. Ruchu A Wyzwania Glob. Annały Inżynierii Ruchu I Badań Transp. 2019, 3, 383–394. [Google Scholar]
- OpenStreetMap. Available online: https://www.openstreetmap.org (accessed on 10 January 2023).
- Vissim 21 User Manual; PTV Planung Transport Verkehr AG: Karlsruhe, Germany, 2021.
- Wiedemann, R. Simulation Des Straßenverkehrsflusses (Traffic Flow Simulations); Publication series of the Institute for Traffic, University of Karlsruhe; Institute for Traffic, University of Karlsruhe: Karlsruhe, Germany, 1974. [Google Scholar]
- Papageorgiou, G.; Ioannou, P.; Pitsillides, A.; Aphamis, T.; Maimaris, A. Development and Evaluation of Bus Priority Scenarios via Microscopic Simulation Models. IFAC Proc. Vol. 2009, 42, 434–441. [Google Scholar] [CrossRef]
- Ejercito, P.M.; Nebrija, K.G.E.; Feria, R.P.; Lara-Figueroa, L.L. Traffic Simulation Software Review. In Proceedings of the 2017 8th International Conference on Information, Intelligence, Systems & Applications (IISA), Larnaca, Cyprus, 27–30 August 2017; pp. 1–4. [Google Scholar]
- Bandi, M.M.; George, V. Microsimulation Modelling in VISSIM on Short-Term and Long-Term Improvements for Mangalore City Road Network. Transp. Res. Procedia 2020, 48, 2725–2743. [Google Scholar] [CrossRef]
- Ahuja, S.; van Vuren, T.; MacDonald, M.; Priest, N. Public Transport Priority Schemes–Comparing Microsimulation with Traditional TRANSYT and LINSIG Models. In Proceedings of the European Transport Conference (Etc) 2003, Strasbourg, France, 8–10 October 2003. [Google Scholar]
- Shastry, K. Code Icon–Free PNG & SVG 2187377–Noun Project. Available online: https://thenounproject.com/icon/code-2187377/ (accessed on 14 April 2023).
- SAM Designs. Performance Icon–Free PNG & SVG 5329663–Noun Project. Available online: https://thenounproject.com/icon/performance-5329663/ (accessed on 14 April 2023).
- Map of Warsaw. Available online: https://mapa.um.warszawa.pl/mapaApp1/mapa?service=mapa&L=pl (accessed on 10 January 2023).
- Timetables–Warsaw Public Transport. Available online: https://www.wtp.waw.pl/rozklady-jazdy/ (accessed on 13 April 2023).
- Zarząd Transportu Miejskiego. Raport Roczny 2022; Annual Report; Public Transport Authority: Warszawa, Poland, 2022.
- Miyatake, M.; Ko, H. Optimization of Train Speed Profile for Minimum Energy Consumption. IEEJ Trans. Elec Engng. 2010, 5, 263–269. [Google Scholar] [CrossRef]
- Sicre, C.; Cucala, P.; Fernández, A.; Jiménez, J.A.; Ribera, I.; Serrano, A. A Method to Optimise Train Energy Consumption Combining Manual Energy Efficient Driving and Scheduling. In Proceedings of the 12th International Conference on Computer System Design and Operation in Railways and Other Transit Systems, Beijing, China, 4 August 2010; pp. 549–560. [Google Scholar]
- Liu, J.; Guo, H.; Yu, Y. Research on the Cooperative Train Control Strategy to Reduce Energy Consumption. IEEE Trans. Intell. Transport. Syst. 2017, 18, 1134–1142. [Google Scholar] [CrossRef]
- Domínguez, M.; Fernández, A.; Cucala, A.P.; Lukaszewicz, P. Optimal Design of Metro Automatic Train Operation Speed Profiles for Reducing Energy Consumption. Proc. Inst. Mech. Eng. Part F J. Rail Rapid Transit 2011, 225, 463–474. [Google Scholar] [CrossRef]
- He, D.; Yang, Y.; Chen, Y.; Deng, J.; Shan, S.; Liu, J.; Li, X. An Integrated Optimization Model of Metro Energy Consumption Based on Regenerative Energy and Passenger Transfer. Appl. Energy 2020, 264, 114770. [Google Scholar] [CrossRef]
- Feng, Z.; Chen, W.; Liu, Y.; Chen, H.; Skibniewski, M.J. Long-Term Equilibrium Relationship Analysis and Energy-Saving Measures of Metro Energy Consumption and Its Influencing Factors Based on Cointegration Theory and an ARDL Model. Energy 2023, 263, 125965. [Google Scholar] [CrossRef]
- Mwambeleko, J.J.; Kulworawanichpong, T.; Greyson, K.A. Tram and Trolleybus Net Traction Energy Consumption Comparison. In Proceedings of the 2015 18th International Conference on Electrical Machines and Systems (ICEMS), Pattaya, Thailand, 25–28 October 2015; pp. 2164–2169. [Google Scholar]
- Kubin, J.; Ferkova, Z. Influnce of Driving Style of a Tram Driver on the Tram’s Energy Consumption. In Proceedings of the 2015 International Conference on Electrical Drives and Power Electronics (EDPE), Tatranska Lomnica, Slovakia, 21–23 September 2015; pp. 417–421. [Google Scholar]
- Zhang, T.; Mao, B.; Xu, Q.; Feng, J. Timetable Optimization for a Two-Way Tram Line with an Active Signal Priority Strategy. IEEE Access 2019, 7, 176896–176911. [Google Scholar] [CrossRef]
- He, J.; Li, Y.; Long, S.; Xu, Y.; Chen, J. Energy-Efficient Tram Speed Trajectory Optimization Considering the Influence of the Traffic Light. Front. Energy Res. 2022, 10, 963275. [Google Scholar] [CrossRef]
- Xing, Z.; Zhu, J.; Zhang, Z.; Qin, Y.; Jia, L. Energy Consumption Optimization of Tramway Operation Based on Improved PSO Algorithm. Energy 2022, 258, 124848. [Google Scholar] [CrossRef]
- Yan, Y.; Li, Q.; Huang, W.; Chen, W. Operation Optimization and Control Method Based on Optimal Energy and Hydrogen Consumption for the Fuel Cell/Supercapacitor Hybrid Tram. IEEE Trans. Ind. Electron. 2021, 68, 1342–1352. [Google Scholar] [CrossRef]
- Chen, L.; Wang, D. Energy Consumption Modeling and Energy Saving Analysis of Supercapacitor Tramcar. In Proceedings of the 2018 IEEE International Conference of Intelligent Robotic and Control Engineering (IRCE), Lanzhou, China, 24–27 August 2018; pp. 79–84. [Google Scholar]
- Yan, Y.; Li, Q.; Chen, W.; Huang, W.; Liu, J. Hierarchical Management Control Based on Equivalent Fitting Circle and Equivalent Energy Consumption Method for Multiple Fuel Cells Hybrid Power System. IEEE Trans. Ind. Electron. 2020, 67, 2786–2797. [Google Scholar] [CrossRef]
- Moskowitz, J.-P.; Cohuau, J.-L. STEEM: ALSTOM and RATP Experience of Supercapacitors in Tramway Operation. In Proceedings of the 2010 IEEE Vehicle Power and Propulsion Conference, Lille, France, 1–3 September 2010; pp. 1–5. [Google Scholar]
- Yan, Y.; Li, Q.; Chen, W.; Su, B.; Liu, J.; Ma, L. Optimal Energy Management and Control in Multimode Equivalent Energy Consumption of Fuel Cell/Supercapacitor of Hybrid Electric Tram. IEEE Trans. Ind. Electron. 2019, 66, 6065–6076. [Google Scholar] [CrossRef]
- Liu, J.; Wu, X.; Li, H.; Qi, L. An Optimal Method of the Energy Consumption for Fuel Cell Hybrid Tram. Int. J. Hydrog. Energy 2020, 45, 20304–20311. [Google Scholar] [CrossRef]
- Zhaolu, S.; Liwei, D. Prediction of Tram Energy Consumption Based on Modified Regression Model. In Proceedings of the 2019 2nd International Conference on Safety Produce Informatization (IICSPI), Chongqing, China, 28–30 November 2019; pp. 188–193. [Google Scholar]
- Kolat, M.; Kővári, B.; Bécsi, T.; Aradi, S. Multi-Agent Reinforcement Learning for Traffic Signal Control: A Cooperative Approach. Sustainability 2023, 15, 3479. [Google Scholar] [CrossRef]
- Zeinaly, Z.; Sojoodi, M.; Bolouki, S. A Resilient Intelligent Traffic Signal Control Scheme for Accident Scenario at Intersections via Deep Reinforcement Learning. Sustainability 2023, 15, 1329. [Google Scholar] [CrossRef]
- SUMO User Documentation. Available online: https://eclipse.dev/sumo/ (accessed on 7 January 2024).
- Rozporządzenie Ministra Infrastruktury z Dnia 3 Lipca 2003 r. w Sprawie Szczegółowych Warunków Technicznych Dla Znaków i Sygnałów Drogowych Oraz Urządzeń Bezpieczeństwa Ruchu Drogowego i Warunków ich Umieszczania na Drogach (t.j. Dz. U. z 2019 r. poz. 2311 z późn. zm.). poz. 2311 z późn. zm.). Available online: https://isap.sejm.gov.pl/isap.nsf/DocDetails.xsp?id=WDU20190002311 (accessed on 7 January 2024).


| Variant | Short Description |
|---|---|
| A | Fixed time programs |
| B | Accommodation programs without tram priority |
| C | Accommodation programs with tram priority (real) |
| D | Accommodation programs without tram |
| E | Accommodation programs with lack of tram detection |
| F | Accommodation with limited cycle regeneration |
| G | Accommodation with extended cycle regeneration |
| H | Accommodation with limited tram phase extension |
| I | Accommodation with extended tram phase extension |
| Route (Stops) | Average Travel Time from Model [min] | Average Travel Time from Timetable, [min] |
|---|---|---|
| Cm. Włoski 03—Park Kaskada 03 | 8.21 | 8.00 |
| Park Kaskada 04—Cm. Włoski 04 | 7.93 | 7.00 |
| Wiatraczna 05—Al. Zieleniecka 05 | 7.85 | 8.00 |
| Al. Zieleniecka 06—Wiatraczna 04 | 7.66 | 7.00 |
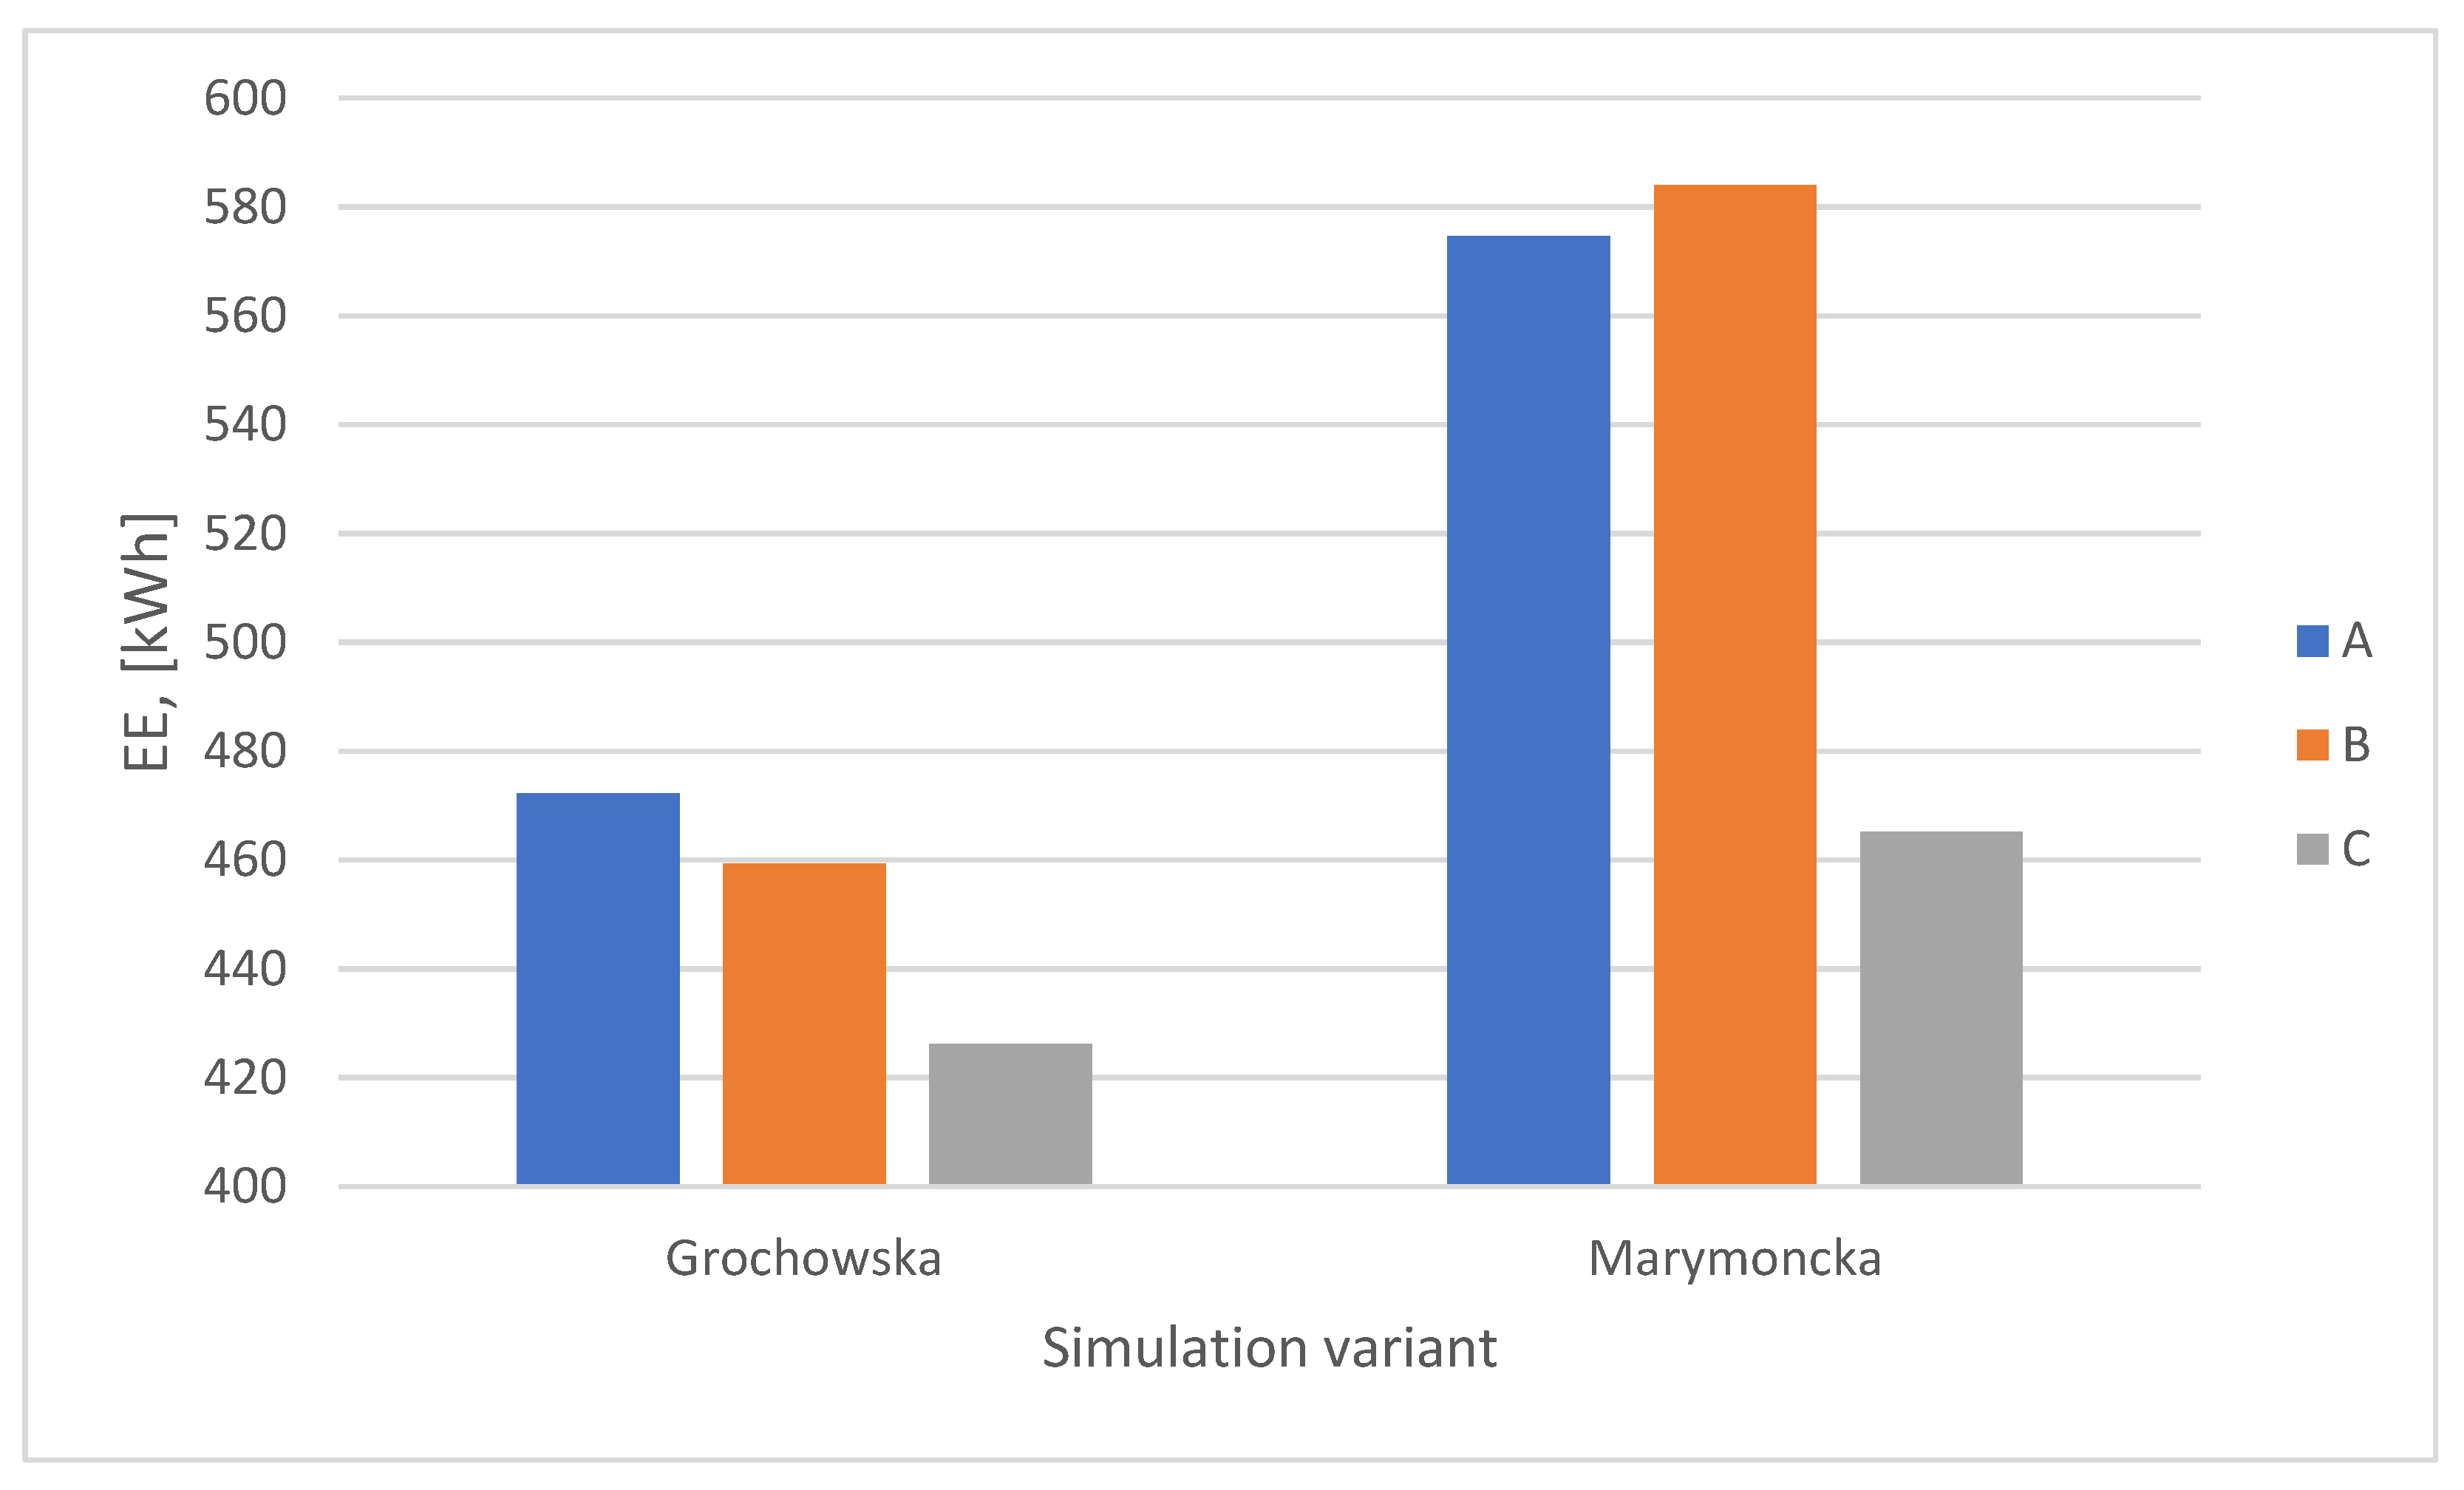
| Street | Variant | Algorithm | Pearson Test p-Value | Normal Distribution | Sum, [Wh] | Avg, [Wh] | Std Dev [Wh] |
|---|---|---|---|---|---|---|---|
| Grochowska | A | Fixed time programs | 0.001 | false | 472,263 | 4541 | 517 |
| B | Real algorithms | 0.132 | true | 459,313 | 4416 | 497 | |
| C | Lack of detection | 0.012 | false | 426,107 | 4058 | 501 | |
| Marymoncka | A | Fixed time programs | 0.863 | true | 574,615 | 5804 | 474 |
| B | Real algorithms | 0.703 | true | 583,997 | 5899 | 448 | |
| C | Lack of detection | 0.179 | true | 465,166 | 4652 | 390 |
| Street | Variant | Algorithm | Pearson Test p-Value | Standard Deviation | Sum, [Wh] | Avg, [Wh] | Std Dev [Wh] |
|---|---|---|---|---|---|---|---|
| Grochowska | A | Fixed time programs | <0.001 | false | 472,263 | 4241 | 517 |
| C | Real algorithms | 0.012 | false | 426,106 | 4058 | 501 | |
| E | Lack of detection | 0.483 | true | 462,948 | 4409 | 473 | |
| F | Limited cycle regeneration | 0.198 | true | 426,106 | 4058 | 484 | |
| G | Extended cycle regeneration | 0.052 | true | 425,385 | 4051 | 475 | |
| H | Limited tram phase extension | 0.238 | true | 427,574 | 4072 | 462 | |
| I | Extended tram phase extension | 0.008 | false | 424,226 | 4040 | 490 | |
| Marymoncka | A | Fixed time programs | 0.863 | true | 574,614 | 5804 | 473 |
| C | Real algorithms | 0.179 | true | 465,166 | 4651 | 390 | |
| E | Lack of detection | 0.059 | true | 539,566 | 5395 | 458 | |
| F | Limited cycle regeneration | 0.398 | true | 463,990 | 4639 | 399 | |
| G | Extended cycle regeneration | 0.317 | true | 463,662 | 4636 | 381 | |
| H | Limited tram phase extension | 0.281 | true | 484,905 | 4849 | 397 | |
| I | Extended tram phase extension | 0.00 | false | 461,625 | 4616 | 364 |
| Street | Volume [tram/h] | Pearson Test p-Value | Normal Distribution | Sum, [Wh] | Avg, [Wh] | Std Dev [Wh] |
|---|---|---|---|---|---|---|
| Grochowska | 6 | 0.153894 | true | 161,261 | 4243 | 295 |
| 10 | 0.144151 | true | 256,706 | 4140 | 253 | |
| 12 | 0.001301 | False | 307,288 | 4152 | 263 | |
| 15 | 0.070233 | True | 398,427 | 4238 | 275 | |
| 20 | 0.015014 | false | 500,465 | 4170 | 266 | |
| 24 | 0.057677 | true | 596,828 | 4173 | 268 | |
| 30 | 0.007429 | false | 732,581 | 4186 | 279 | |
| 36 | 0.062859 | true | 913,610 | 4210 | 270 | |
| Marymoncka | 6 | 0.179585 | true | 174,061 | 4580 | 377 |
| 10 | 0.554131 | true | 291,724 | 4705 | 475 | |
| 12 | 0.465158 | true | 347,878 | 4701 | 446 | |
| 15 | 0.042196 | false | 434,021 | 4617 | 384 | |
| 20 | 0.036616 | false | 557,339 | 4644 | 396 | |
| 24 | 0.000018 | false | 675,019 | 4720 | 403 | |
| 30 | 0.013682 | false | 800,710 | 4655 | 390 | |
| 36 | 0.778498 | true | 1,001,257 | 4657 | 355 |
Disclaimer/Publisher’s Note: The statements, opinions and data contained in all publications are solely those of the individual author(s) and contributor(s) and not of MDPI and/or the editor(s). MDPI and/or the editor(s) disclaim responsibility for any injury to people or property resulting from any ideas, methods, instructions or products referred to in the content. |
© 2024 by the authors. Licensee MDPI, Basel, Switzerland. This article is an open access article distributed under the terms and conditions of the Creative Commons Attribution (CC BY) license (https://creativecommons.org/licenses/by/4.0/).
Share and Cite
Górka, A.; Czerepicki, A.; Krukowicz, T. The Impact of Priority in Coordinated Traffic Lights on Tram Energy Consumption. Energies 2024, 17, 520. https://doi.org/10.3390/en17020520
Górka A, Czerepicki A, Krukowicz T. The Impact of Priority in Coordinated Traffic Lights on Tram Energy Consumption. Energies. 2024; 17(2):520. https://doi.org/10.3390/en17020520
Chicago/Turabian StyleGórka, Anna, Andrzej Czerepicki, and Tomasz Krukowicz. 2024. "The Impact of Priority in Coordinated Traffic Lights on Tram Energy Consumption" Energies 17, no. 2: 520. https://doi.org/10.3390/en17020520
APA StyleGórka, A., Czerepicki, A., & Krukowicz, T. (2024). The Impact of Priority in Coordinated Traffic Lights on Tram Energy Consumption. Energies, 17(2), 520. https://doi.org/10.3390/en17020520