Article

Prospects of Hydrogen Application as a Fuel for Large-Scale Compressed-Air Energy Storages

by
Iliya K. Iliev
1,*,
Alexander V. Fedyukhin
2,
Daniil V. Semin
2,
Yulia S. Valeeva
3,
Stanislav A. Dronov
2 and
Ivan H. Beloev
4
1
Department of Heat, Hydraulics and Environmental Engineering, “Angel Kanchev” University of Ruse, 7017 Ruse, Bulgaria
2
Department of Energy Efficiency and Hydrogen Technology, National Research University Moscow Power Engineering Institute, Moscow 111250, Russia
3
Department of Economics and Enterprise Management, Russian University of Cooperation, Kazan 420034, Russia
4
Department of Transport, “Angel Kanchev” University of Ruse, 7017 Ruse, Bulgaria
*
Author to whom correspondence should be addressed.
Energies 2024, 17(2), 518; https://doi.org/10.3390/en17020518
Submission received: 20 December 2023 / Revised: 9 January 2024 / Accepted: 19 January 2024 / Published: 20 January 2024
(This article belongs to the Special Issue Advanced Engineering and Green Energy)

Abstract

:
A promising method of energy storage is the combination of hydrogen and compressed-air energy storage (CAES) systems. CAES systems are divided into diabatic, adiabatic, and isothermal cycles. In the diabatic cycle, thermal energy after air compression is discharged into the environment, and the scheme implies the use of organic fuel. Taking into account the prospects of the decarbonization of the energy industry, it is advisable to replace natural gas in the diabatic CAES scheme with hydrogen obtained by electrolysis using power-to-gas technology. In this article, the SENECA-1A project is considered as a high-power hybrid unit, using hydrogen instead of natural gas. The results show that while keeping the 214 MW turbines powered, the transition to hydrogen reduces carbon dioxide emissions from 8.8 to 0.0 kg/s, while the formation of water vapor will increase from 17.6 to 27.4 kg/s. It is shown that the adiabatic CAES SENECA-1A mode, compared to the diabatic, has 0.0 carbon dioxide and water vapor emission with relatively higher efficiency (71.5 vs. 62.1%). At the same time, the main advantage of the diabatic CAES is the possibility to produce more power in the turbine block (214 vs. 131.6 MW), having fewer capital costs. Thus, choosing the technology is a subject of complex technical, economic, and ecological study.

1. Introduction

Reducing availability of fossil fuels coupled with their environmental impact are the main drivers to introduce sustainable energy source exploitation [1,2].
Therefore, renewable energy sources such as solar radiation and wind energy plants are spreading more and more in the electricity market, also thanks to economic concessions introduced by policies and governments. However, some renewable energy sources, e.g., wind energy, are gifted with a stochastic nature, so their energy and power production cannot be foreseen or planned both in time and space [3,4]. This is a major issue for renewable energy introduction in the electricity grid because, at each time instant and each spatial position, energy demand and supply must be balanced to not make the grid collapse. Because renewable energy sources will be used more and more in the future to have a world electrical grid without fossil fuel thermal energy plants, it is necessary to introduce effective technologies for storing different forms of energy, such as electrical or thermal [5,6,7]. If storing technology is widely used, renewable energy sources can penetrate into the electricity market without compromising the stability of the grid. The coupling of storing technologies with renewable energy sources allows for the energy demand and supply to be independent of each other; i.e., it allows for the flexible management of power networks [8].
Different energy storing methods have attracted the attention of researchers all over the world, and they offer different performances in energy applications due to differences in size, required flexibility, efficiency, costs, environmental impact, reliability, safety, lifetime, and characteristic time constant in the storing process [9]. We consider the following concepts of large-scale energy storage systems:
  • Mechanical energy storage:
    • Pumped hydropower storage;
    • Compressed-air energy storage;
    • Flywheels.
  • Electrical energy storage:
    • Batteries;
    • Hydrogen.
  • Thermal energy storage:
    • Sensible heat storage;
    • Latent heat storage;
    • Thermochemical energy storage.
A generic energy storage system can be characterized by a few fundamental qualities:
  • Capacity: it indicates how much energy can be stored and it is directly linked to the size of the storage system and thermophysical properties of the storage medium.
  • Power: it represents the rate at which energy can be charged to or discharged from the storage.
  • Efficiency: it is defined as the ratio of discharged energy to charged energy and it quantifies how much energy is lost during storage or charging–discharging operating conditions.
  • Storage period: it represents how long energy can be stored without losing usefulness.
  • Charge and discharge time: the time needed to charge or discharge the energy storage. It can last from a few hours to many months for daily or seasonal storage, respectively.
  • Cost: it is the sum of the capital and operating costs of the energy storage system. Operating costs strongly depend on the maintenance and lifetime of storage, i.e., they depend on how many operating cycles the storage and the medium can support. Costs for energy storage systems can be expressed in EUR/kWh or EUR/kW if the focus is on the capacity or power of the storage, respectively.
  • Environmental impact: energy storage systems are suitable to be coupled with renewables to increase their penetration into the electricity market and reduce environmental impact.
  • Primary energy consumption. A storage system must necessarily have a very low environmental impact to not lose its main purpose when it is coupled with renewables.
Electricity production by renewable energy sources is quite difficult to predict, and when it is available, it has to be used to not waste it. The electrical energy produced by wind or solar energy sources can be usefully coupled with electrochemical energy storage systems, allowing many grid functions that are fundamental to increase the penetration of renewable sources into the energy market: peak-shaving, damping energy oscillations, and frequency regulation. If renewable energy is used to produce hydrogen, fuel cells are necessary to convert hydrogen into electricity and heat with high efficiency. Electrochemical energy storage systems are usually classified considering their own energy density and power density.
Energy density corresponds to the energy accumulated in a unit volume or mass: it takes into account the dimensions of an electrochemical energy storage system and its ability to store large amounts of energy [10]. On the other hand, power density indicates how an electrochemical energy storage system is suitable for fast charging and discharging processes: renewable energy must be quickly stored when it is available and quickly released to perform frequency regulation of the grid, so this is a fundamental property for the integration of renewable sources into the electrical power network [11,12].

2. Relevance of the Research

Promising areas of energy storage are hydrogen storage and compressed-air energy storage (CAES) [13]. Hydrogen energy storage systems consist of a hydrogen generation unit (except for water electrolysis, such a unit includes water treatment, electrolysis cells, hydrogen purification, and drying), a storage unit (tanks or receivers with hydrogen compressed to a pressure of 35–900 bar are usually used), and an electrochemical energy generator (in the case of solid polymer fuel cells, the output is 50–55% of electricity and up to 35% of heat). Technologies such as flywheels and flow elevators of solid loads exist only in the form of laboratory samples and their widespread use is still in question. Therefore, the use of compressed-air energy storage, which is quite simple in design and has been operating for several decades, is a promising solution. Several research teams from the USA, Germany, India, and China are actively developing various thermal schemes of CAES [14,15,16,17]. The global experience of operating CAES (mainly in Germany and the USA), coupled with a noticeable trend towards the development of this area, shows a great interest in using such peak or near-peak units [18,19,20]. The purpose of this publication is to analyze the experience of application, potential, and prospects for the creation of energy storage devices based on compressed-air energy storage and hydrogen [21,22].
There is a considerable amount of different CAES cycles that are developed, and each has its own technical and design features. The stations are divided into diabatic (D-CAES), adiabatic (A-CAES), and isothermal cycles (I-CAES) [23,24,25,26]. In the diabatic cycle, thermal energy after air compression is discharged into the environment, and the flowsheet implies the use of organic fuel. In the adiabatic systems, the thermal energy of compression is stored in intermediate devices—thermal energy storage devices. There are known concepts without the use of thermal energy storage. Unlike D-CAES and A-CAES, in I-CAES, the formation of thermal energy during compression should be minimized or absent [27,28].
The leading countries in the integration of large electric network storage include the USA, China, and Germany. Currently, the main technology for storing energy in large volumes is hydroaccumulation. In the USA, the first pumped hydropower storage (PHS) was commissioned in the late 1960s; today, the total capacity of the PHS in this country is 20 GW. Germany’s power grid has over 6 GW of PHS capacity, while the country’s largest CAES systems (Huntorf and Stassfurt) have an installed capacity of 290 and 200 MW, respectively. In 2022, a CAES system with a capacity of 100 MW was launched in the Zhangjiakou City District in northern China. Notably, the station is positioned as adiabatic (A-CAES), i.e., in which fuel is not burned as it is implemented in the fuel schemes of large diabatic CAES (D-CAES) systems. The world’s largest CAES (350 MW) system is planned to be built in 2024 in the Shandong Province. It is reported that there are plans to build several dozen CAES systems in China with a total capacity of about 40 GW by 2030.
The purpose of the current study is to model and compare the technical parameters of a few D-CAES projects, as well as to conduct a prospect analysis of hydrogen’s application as a fuel for large-scale D-CAES.

3. Materials and Methods

3.1. Comparison of the D-CAES Technological Scheme

It is proposed to consider D-CAES for storing energy in large volumes, since there are lower capital costs for basic equipment compared to A-CAES with the same power. Typical D-CAES projects represented in technical literature will be considered below: United Technologies (UT) [29], Matagorda [29], SENECA-1A [30], Huntorf [29], and McIntosh [29].
CAES project developed by United Technologies (UT) proposed the concept of underground storage operating with constant air pressure (Figure 1). The capacity of the system is designed to work for 20 h in generation mode. The constant pressure storage is 67 bar, and it is maintained by the pressure of the water column. To do this, stone dams 9 m high formed a surface pond reservoir, the volume of which was slightly larger than the volume of the accumulator (by 10–15%). The pond is connected to an underground reservoir, the depth of which is chosen so that the pressure of the water column is equal to the air pressure. The water from the pond fills the battery and changes its volume as the air is discharged and is forced back into the pond when it is charged. In principle, the scheme is similar to the CAES McIntosh project: low- and high-pressure axial compressors and turbines are located on the same shaft as the main electric generator. According to the project, the installation is situated in a machine room about 150 m long. The entire CAES system with a pond and fuel storage is situated on a site 360 × 540 m.
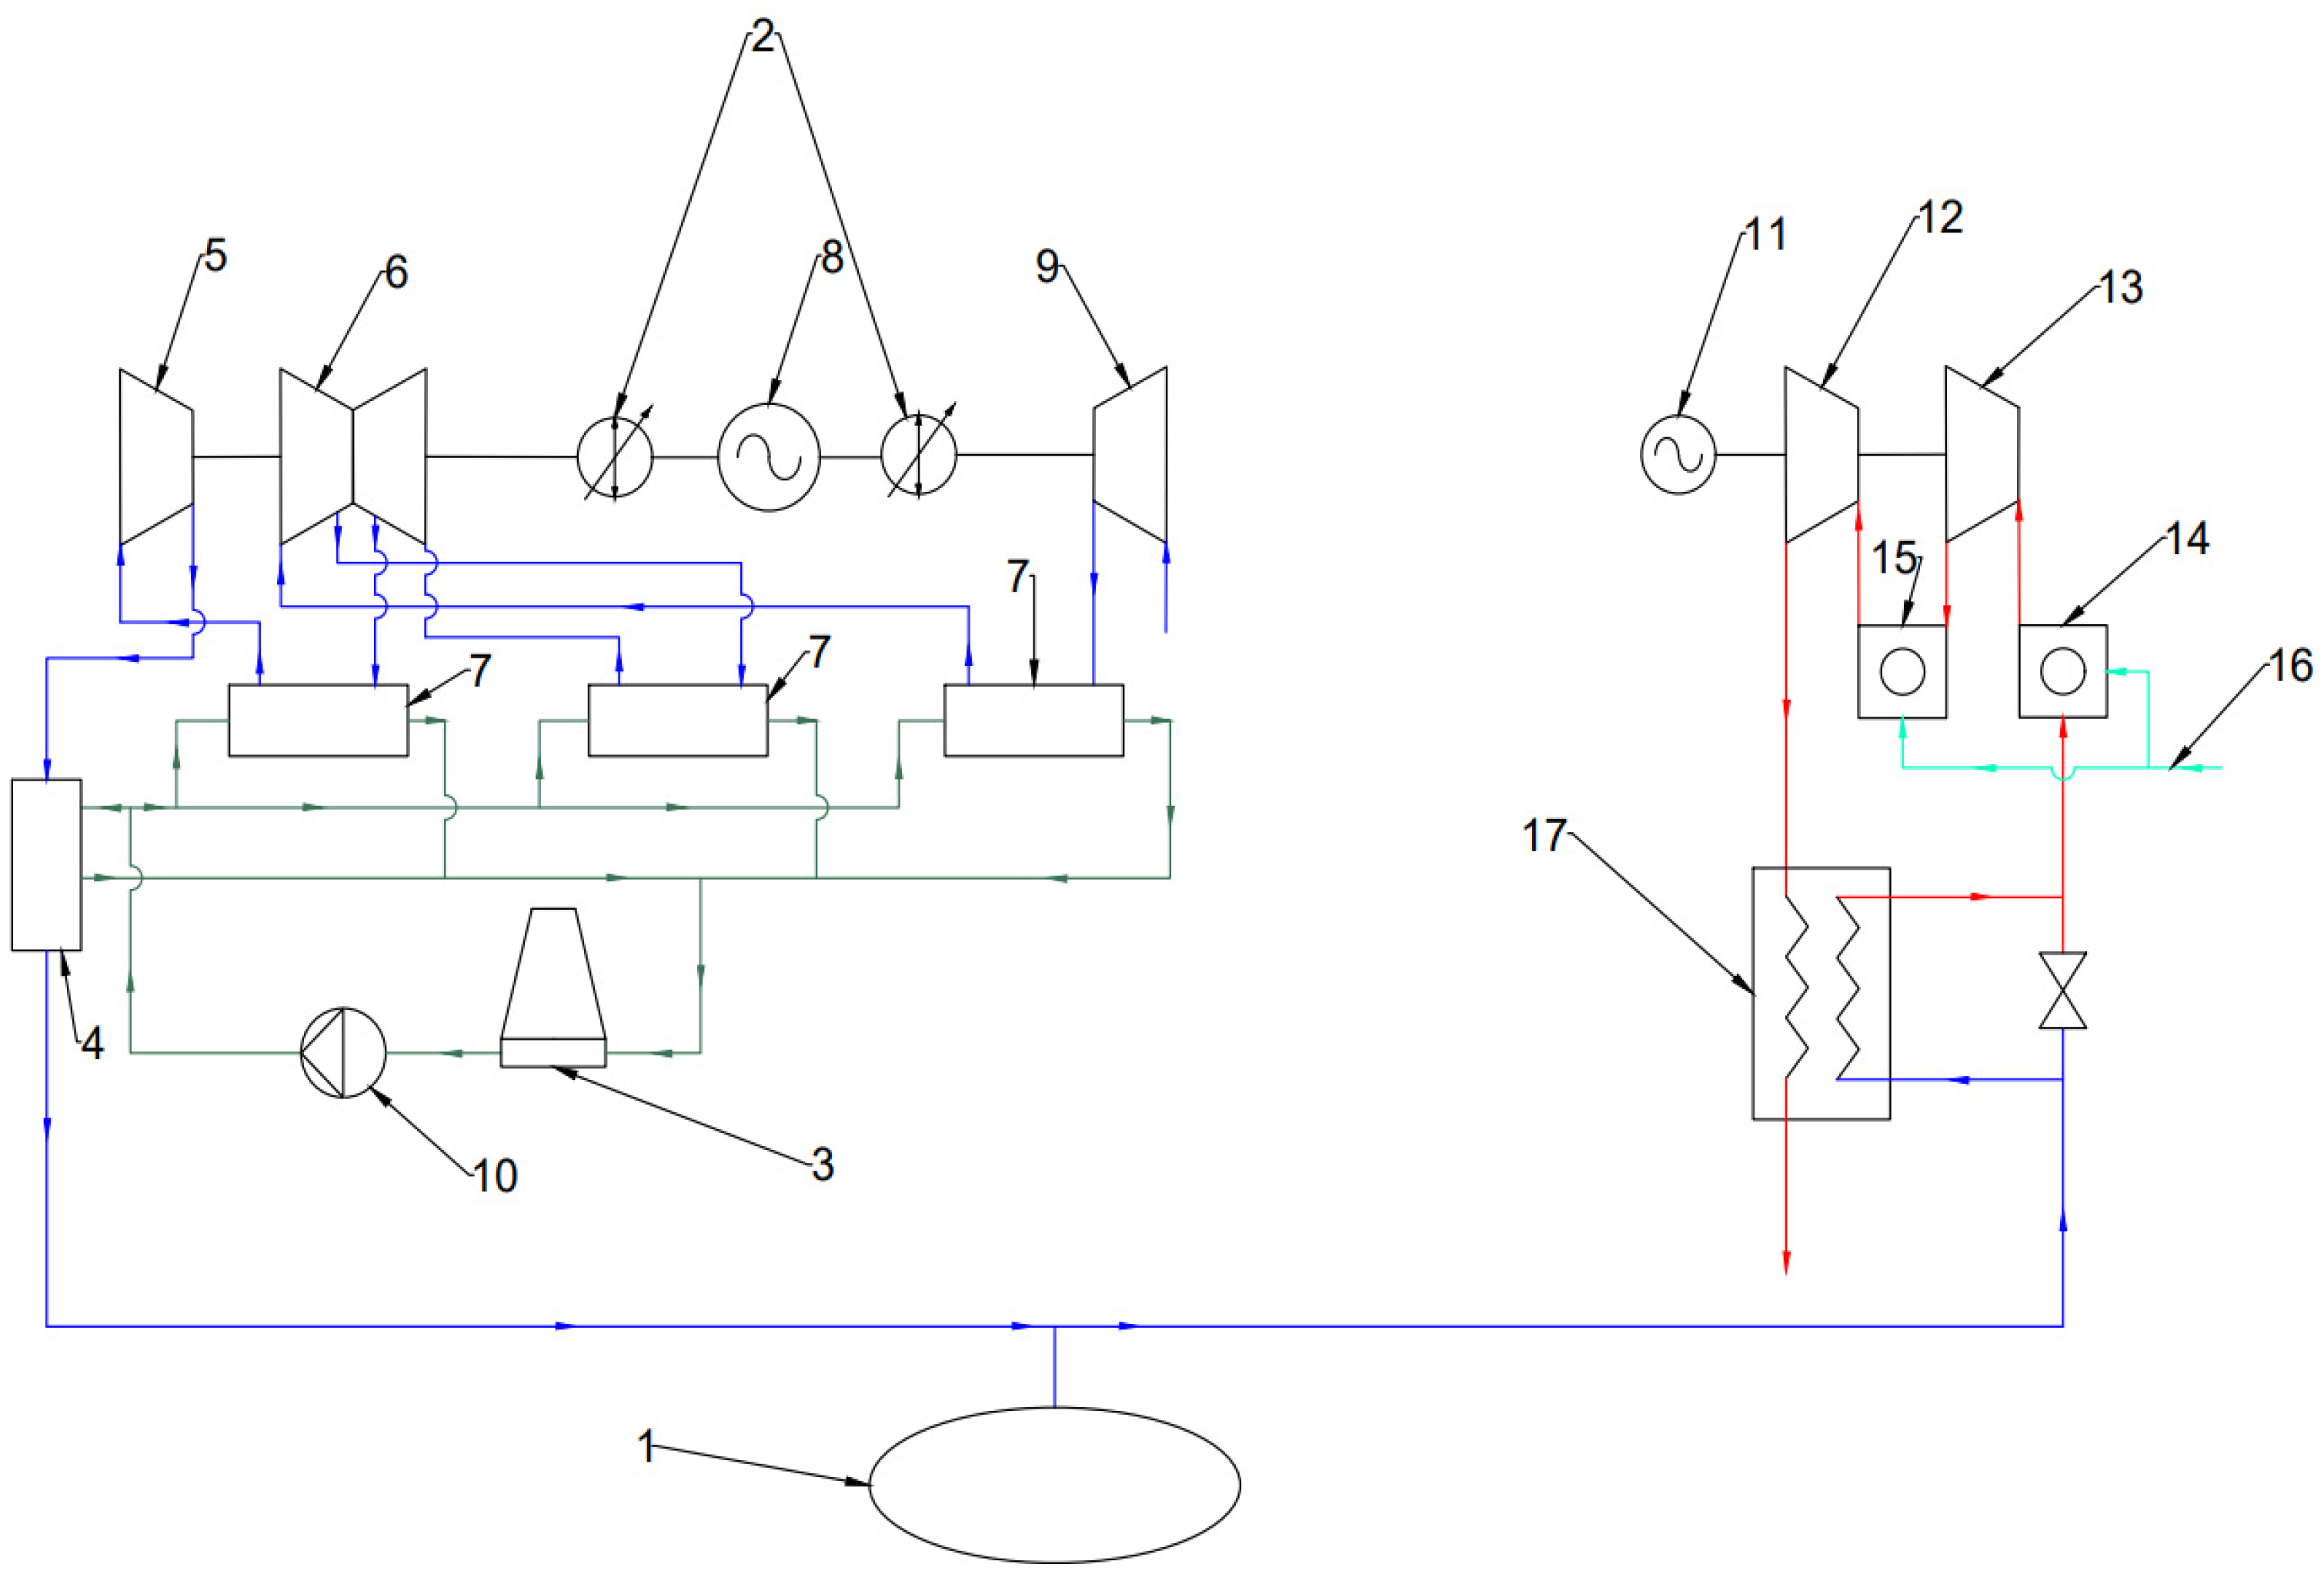
Matagorda CAES system is an example of a project in which the compressor and turbine blocks are separate (Figure 2). This solution increased the flexibility of the CAES in conditions of changing load schedules. The air from the atmosphere is compressed in low-, medium-, and high-pressure compressors with three intermediate and final air cooling. The compressors are driven by their electric motor. Additional heat is removed by circulating water. The turbines and the electric generator are located on a separate shaft. The scheme includes heat regeneration as well as UT CAES. In addition, the combustion chambers were technically simplified, which made it possible to abandon the use of liquid fuel.
The unit of the American NYSEG SENECA project can be considered a high-power CAES priority scheme [30]. The project was commissioned by the US Department of Energy from NYSEG for subsequent construction in New York State. At the stage of the pre-design study, specialists developed 2 technological schemes that differ in the composition and nominal characteristics of the included equipment. The SENECA-1 scheme was nominally designed for 136 MW of electrical power during unloading, and the SENECA-1A scheme was designed for 210—220 MW. Both SENECA 1/1A technologies were developed by Dresser-Rand Corporation engineers and conceptually represent a significantly upgraded McIntosh CAES system built in Alabama in 1991. NYSEG evaluated two scheme solutions, and the SENECA-1A scheme was considered the priority according to technical and economic indicators (Figure 3).
Among the features of the scheme, the developers noted the following: the possibility of starting compressors using a frequency-controlled drive to minimize the impact of the starting load on the power supply system; high mobility of the installation (the ability to switch operating modes, i.e., from compression mode to generation or vice versa within 10 min); and the use of upgraded steam turbines capable of operating on compressed air. Unfortunately, to date, this decision has not been physically implemented due to the economic difficulties of the project’s investments. Table 1 shows the calculation results of different D-CAES schemes.

3.2. Fundamentals of Power-to-Gas Technology and Hydrogen Integration into CAES

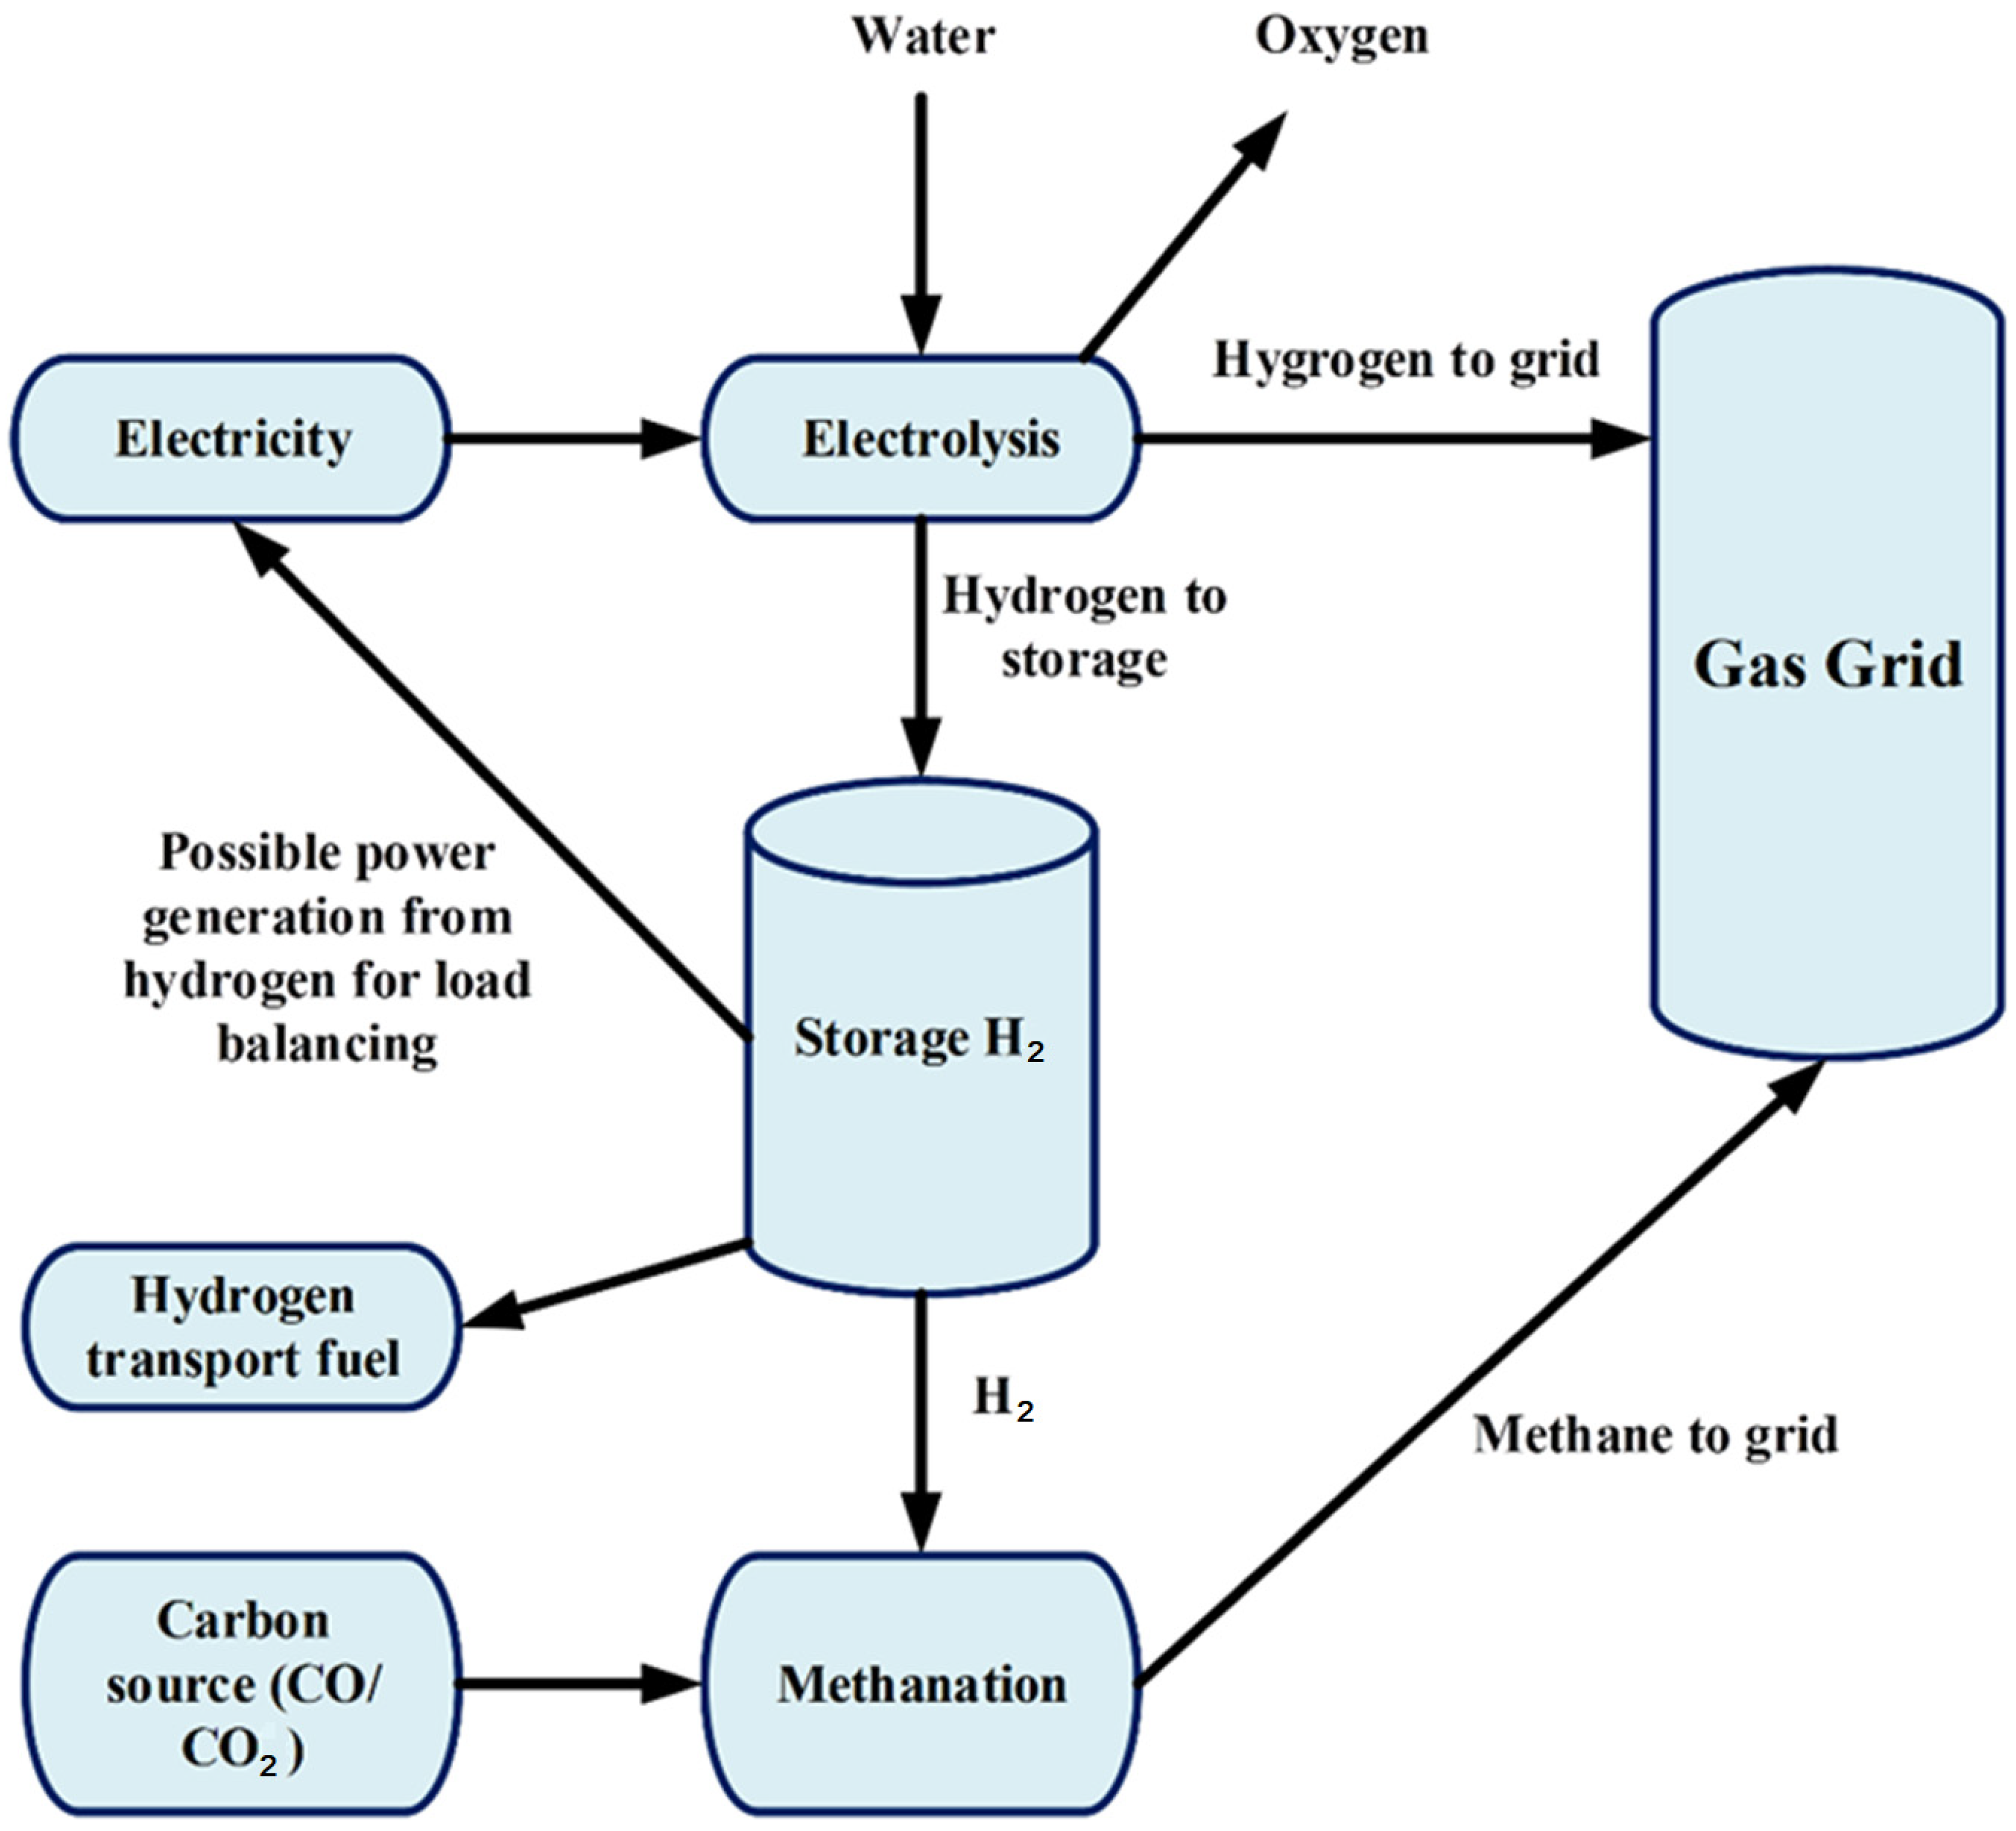
The article will present the results of the calculation of the CAES SENECA-1A scheme in the basic and prospective versions with the combustion of natural gas and hydrogen, respectively. Power-to-gas (abbreviated P2G) is a technology that uses electricity to produce gaseous fuels [31]. Most P2G systems use electrolysis to produce hydrogen. Hydrogen can be used directly, or further stages (known as two-stage P2G systems) can convert hydrogen into methane [32,33]. The scheme of the methane–hydrogen mixture production technology is shown in Figure 4.
First of all, the starting point for P2G is the use of excess electricity to produce hydrogen together with oxygen as a by-product. The electrolysis process on which the technology in question is based is, in fact, the reverse process of generating electricity in a fuel cell.
Several ways of implementing the process of water electrolysis are considered:
  • Alkaline electrolysis;
  • Polymer electrolyte membrane electrolysis;
  • Solid oxide electrolyzer cell.
A mathematical model was created for analyzing the technological features of P2G [34,35,36]. Modeling of this technology was carried out in the Aspen Plus software package, since modeling of the electrolysis process in Aspen HYSYS V10.0 is not possible [37]. The basics of mathematical modeling imply the division of a complex system into smaller simple systems, so the electrolysis process and the methanation process are considered separately [38,39].
P2G technology of developed model is based on the process of alkaline electrolysis, since this is the most mature technology of electrolysis, and, accordingly, the most accessible on any production scale. Analysis of the calculation results shows that for the production of about 3500 kg/h of methane–hydrogen mixture (in a percentage of 80% methane and 20% hydrogen), about 7680 kg/h of carbon dioxide and 2310 kg/h of hydrogen produced by the electrolysis process will be required. Moreover, 700 kg/h of this hydrogen will go directly to mixing into the gas transmission network, and the remaining 1610 kg/h will go to the methanation reaction to produce methane in the amount of 2800 kg/h. According to average data, the production of hydrogen by electrolysis requires 9 L of water per kilogram of hydrogen, while electricity will be required at about 5 kWh per cubic meter of H2 or 55 kWh per kilogram of H2. Thus, based on the calculation results, it can be determined that such a unit will require about 127 MWh of electrical energy and more than 20 tons of water for hydrogen production [37].
It is supposed that the hydrogen for CAES can be totally produced by electrolysis, using renewable energy sources to minimize carbon dioxide emissions.
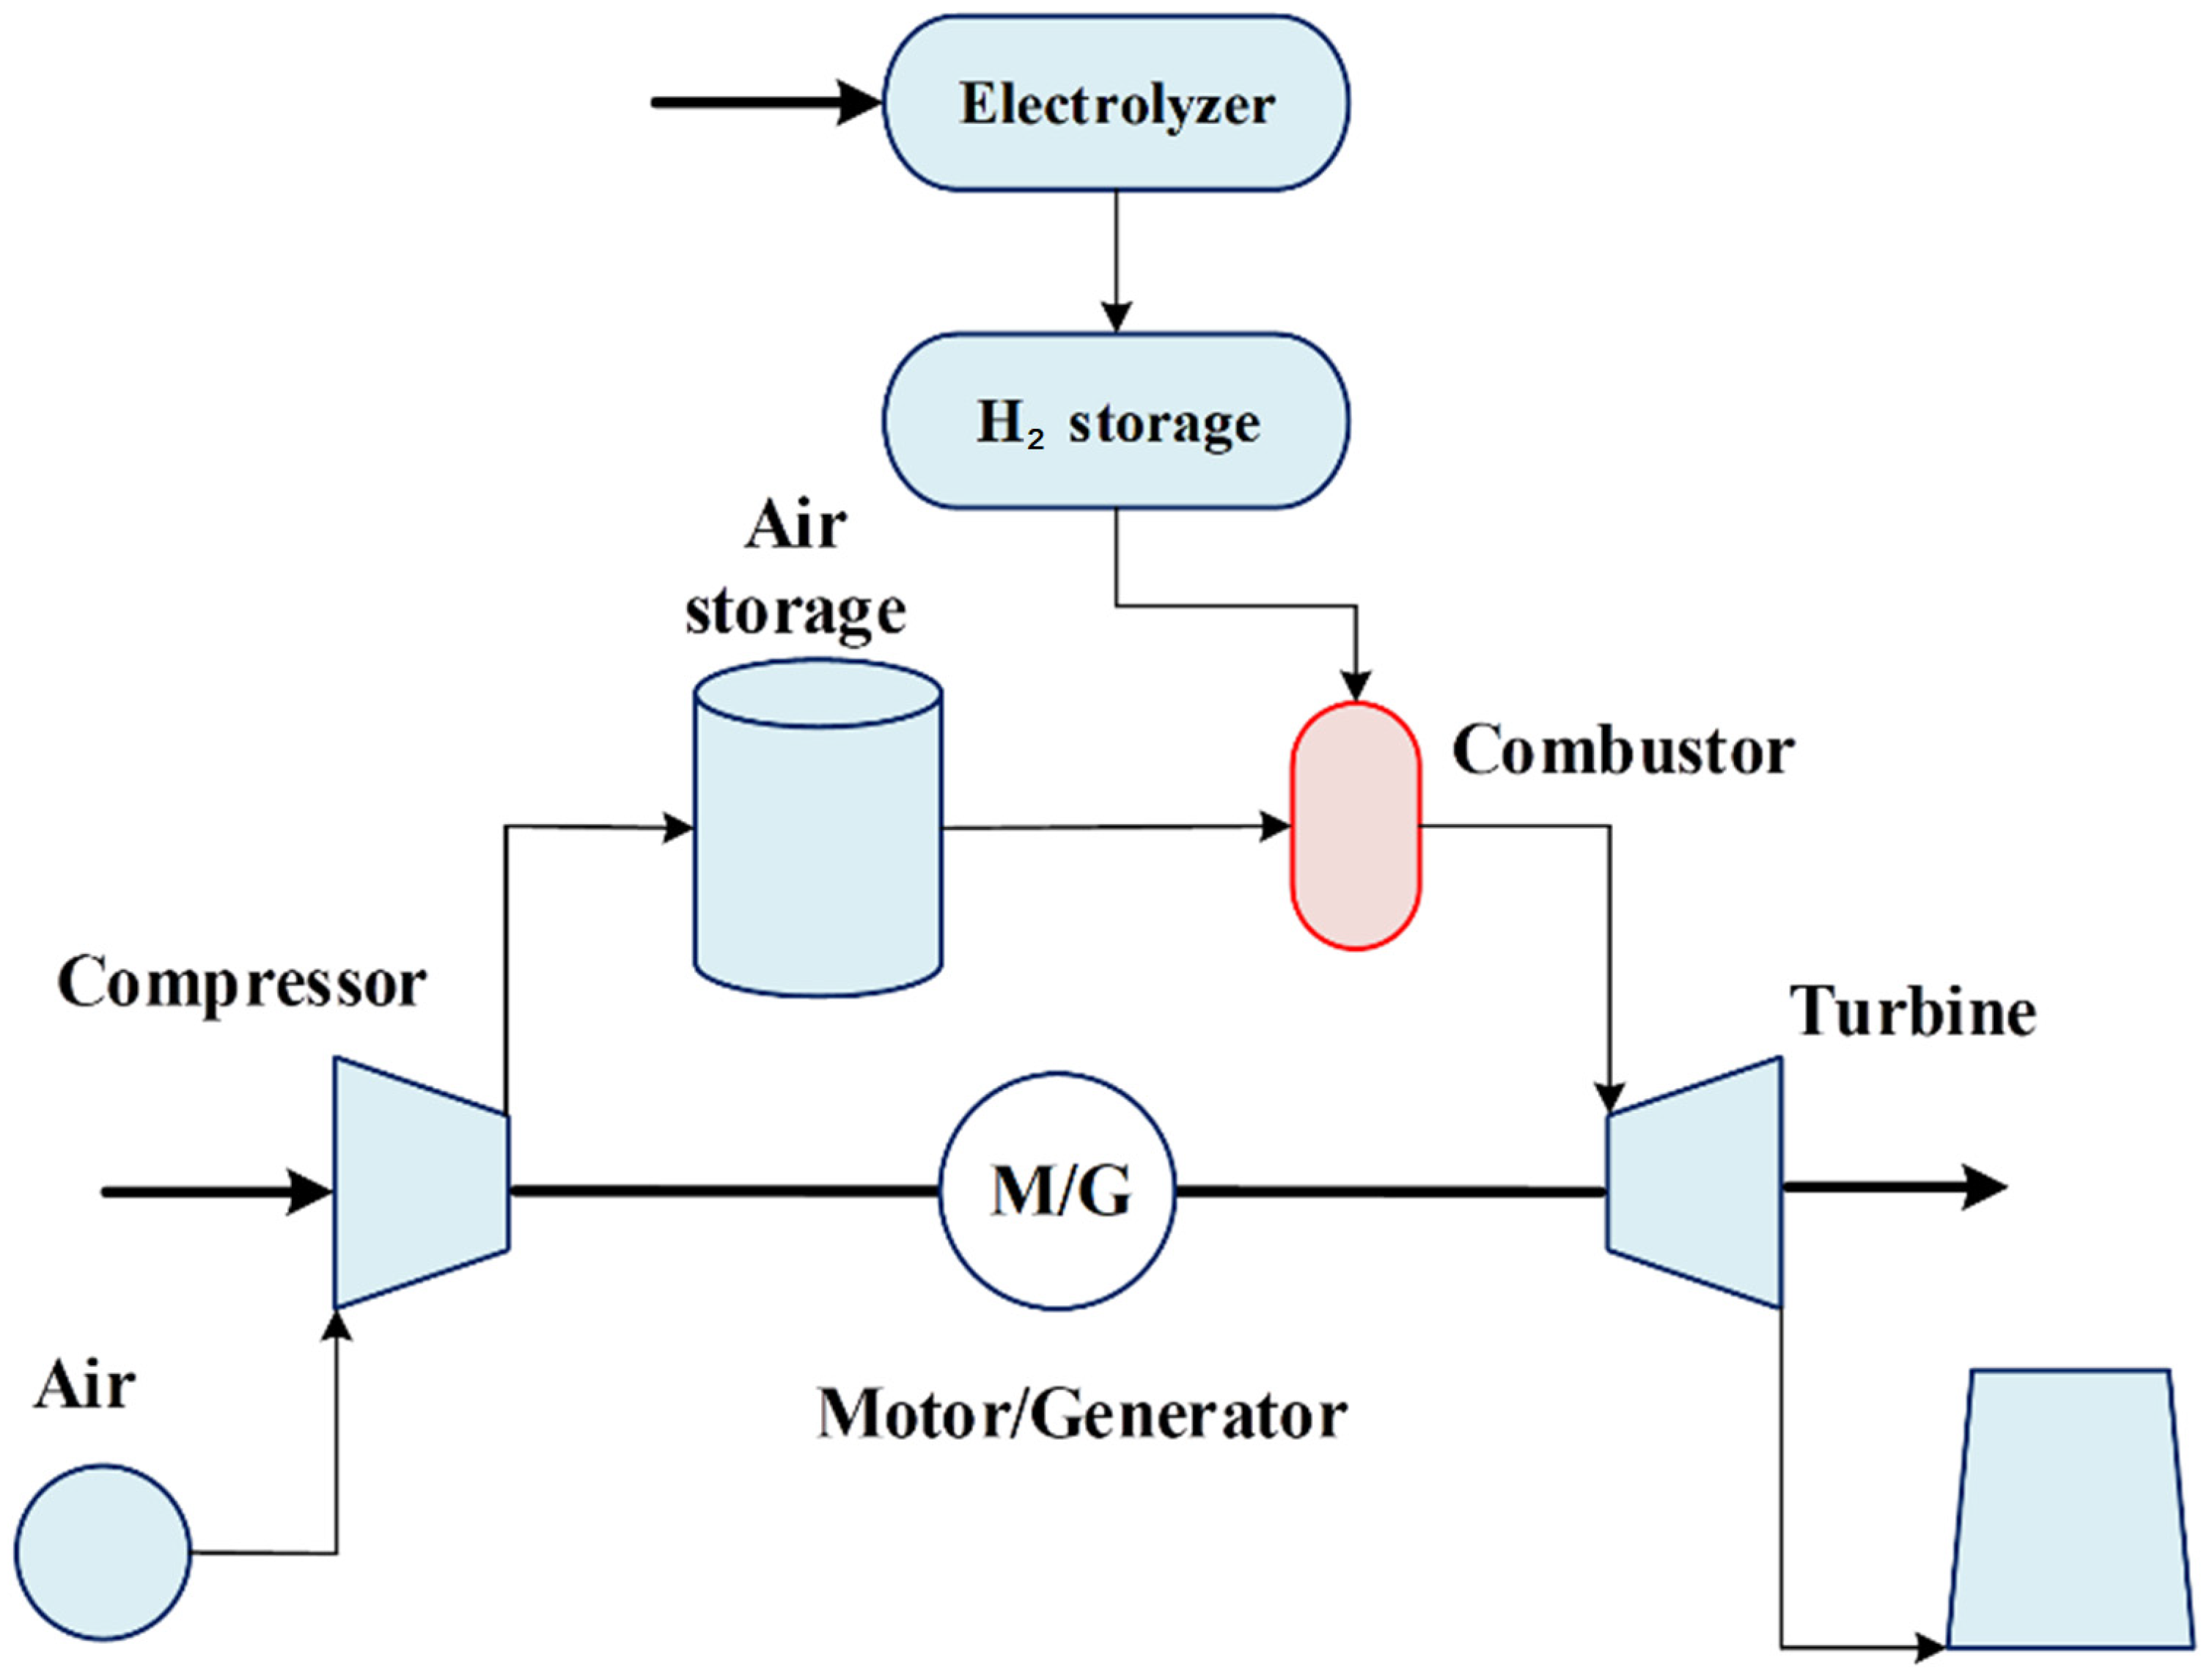
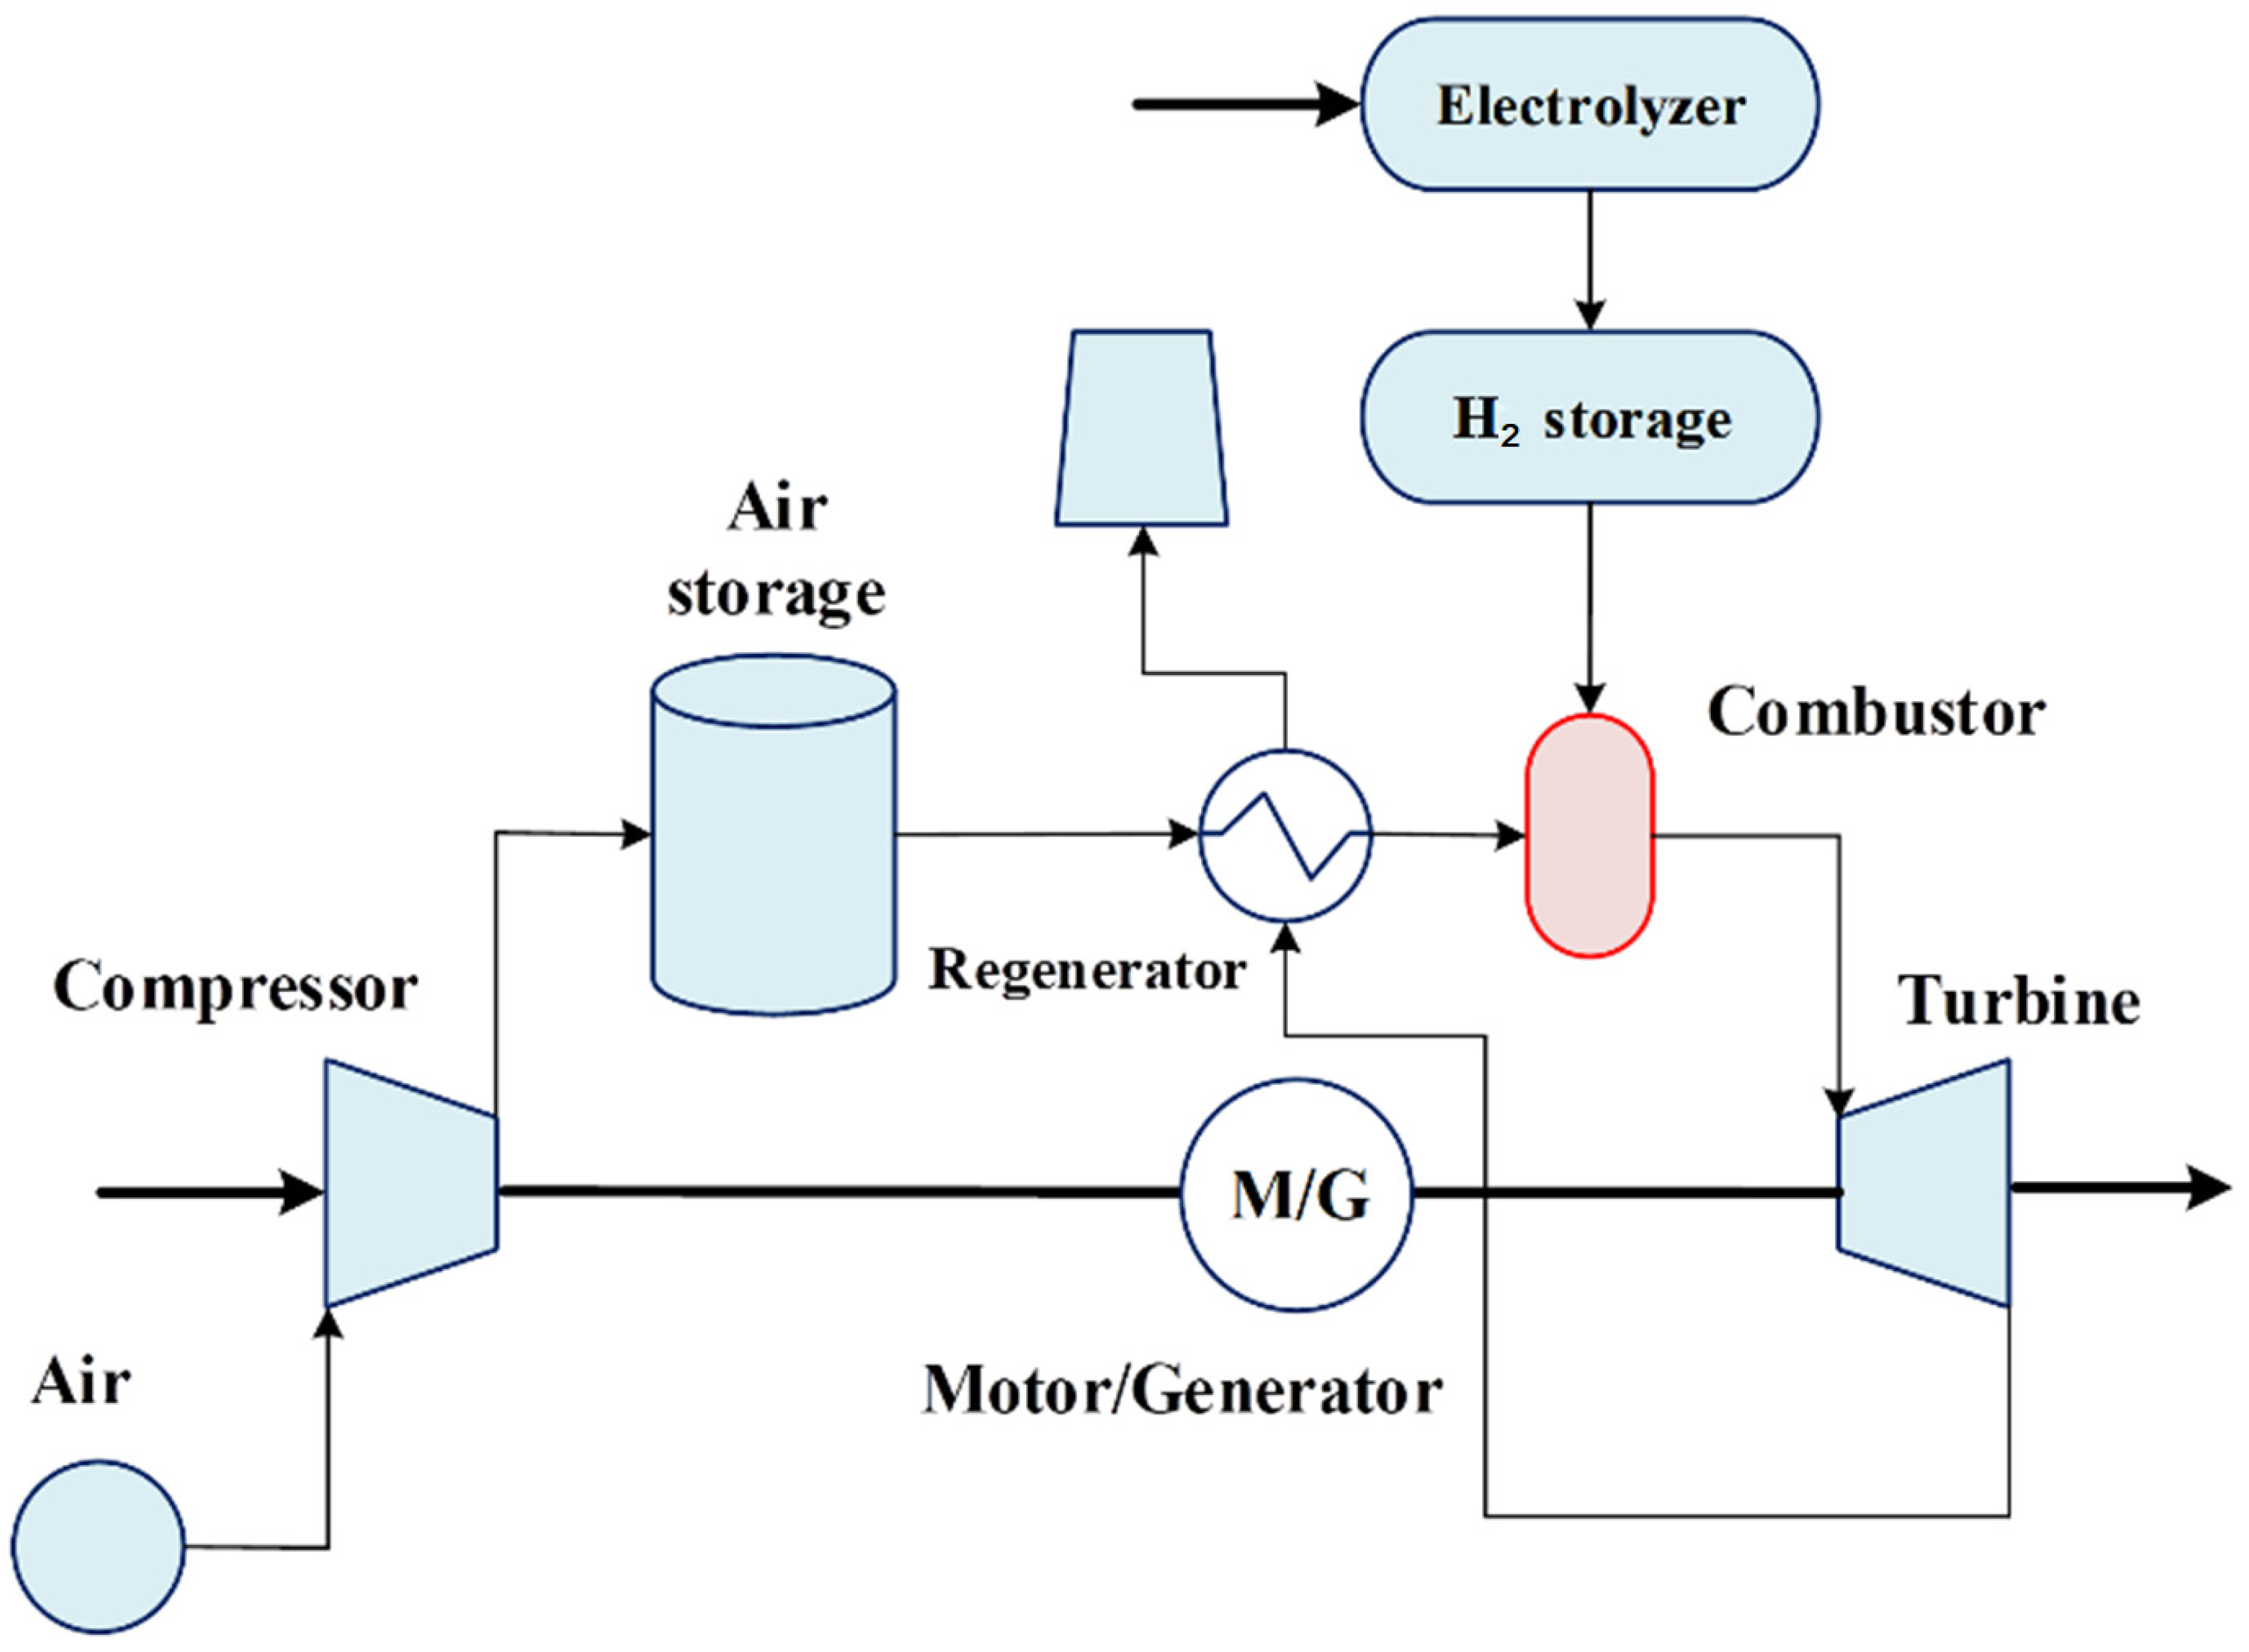
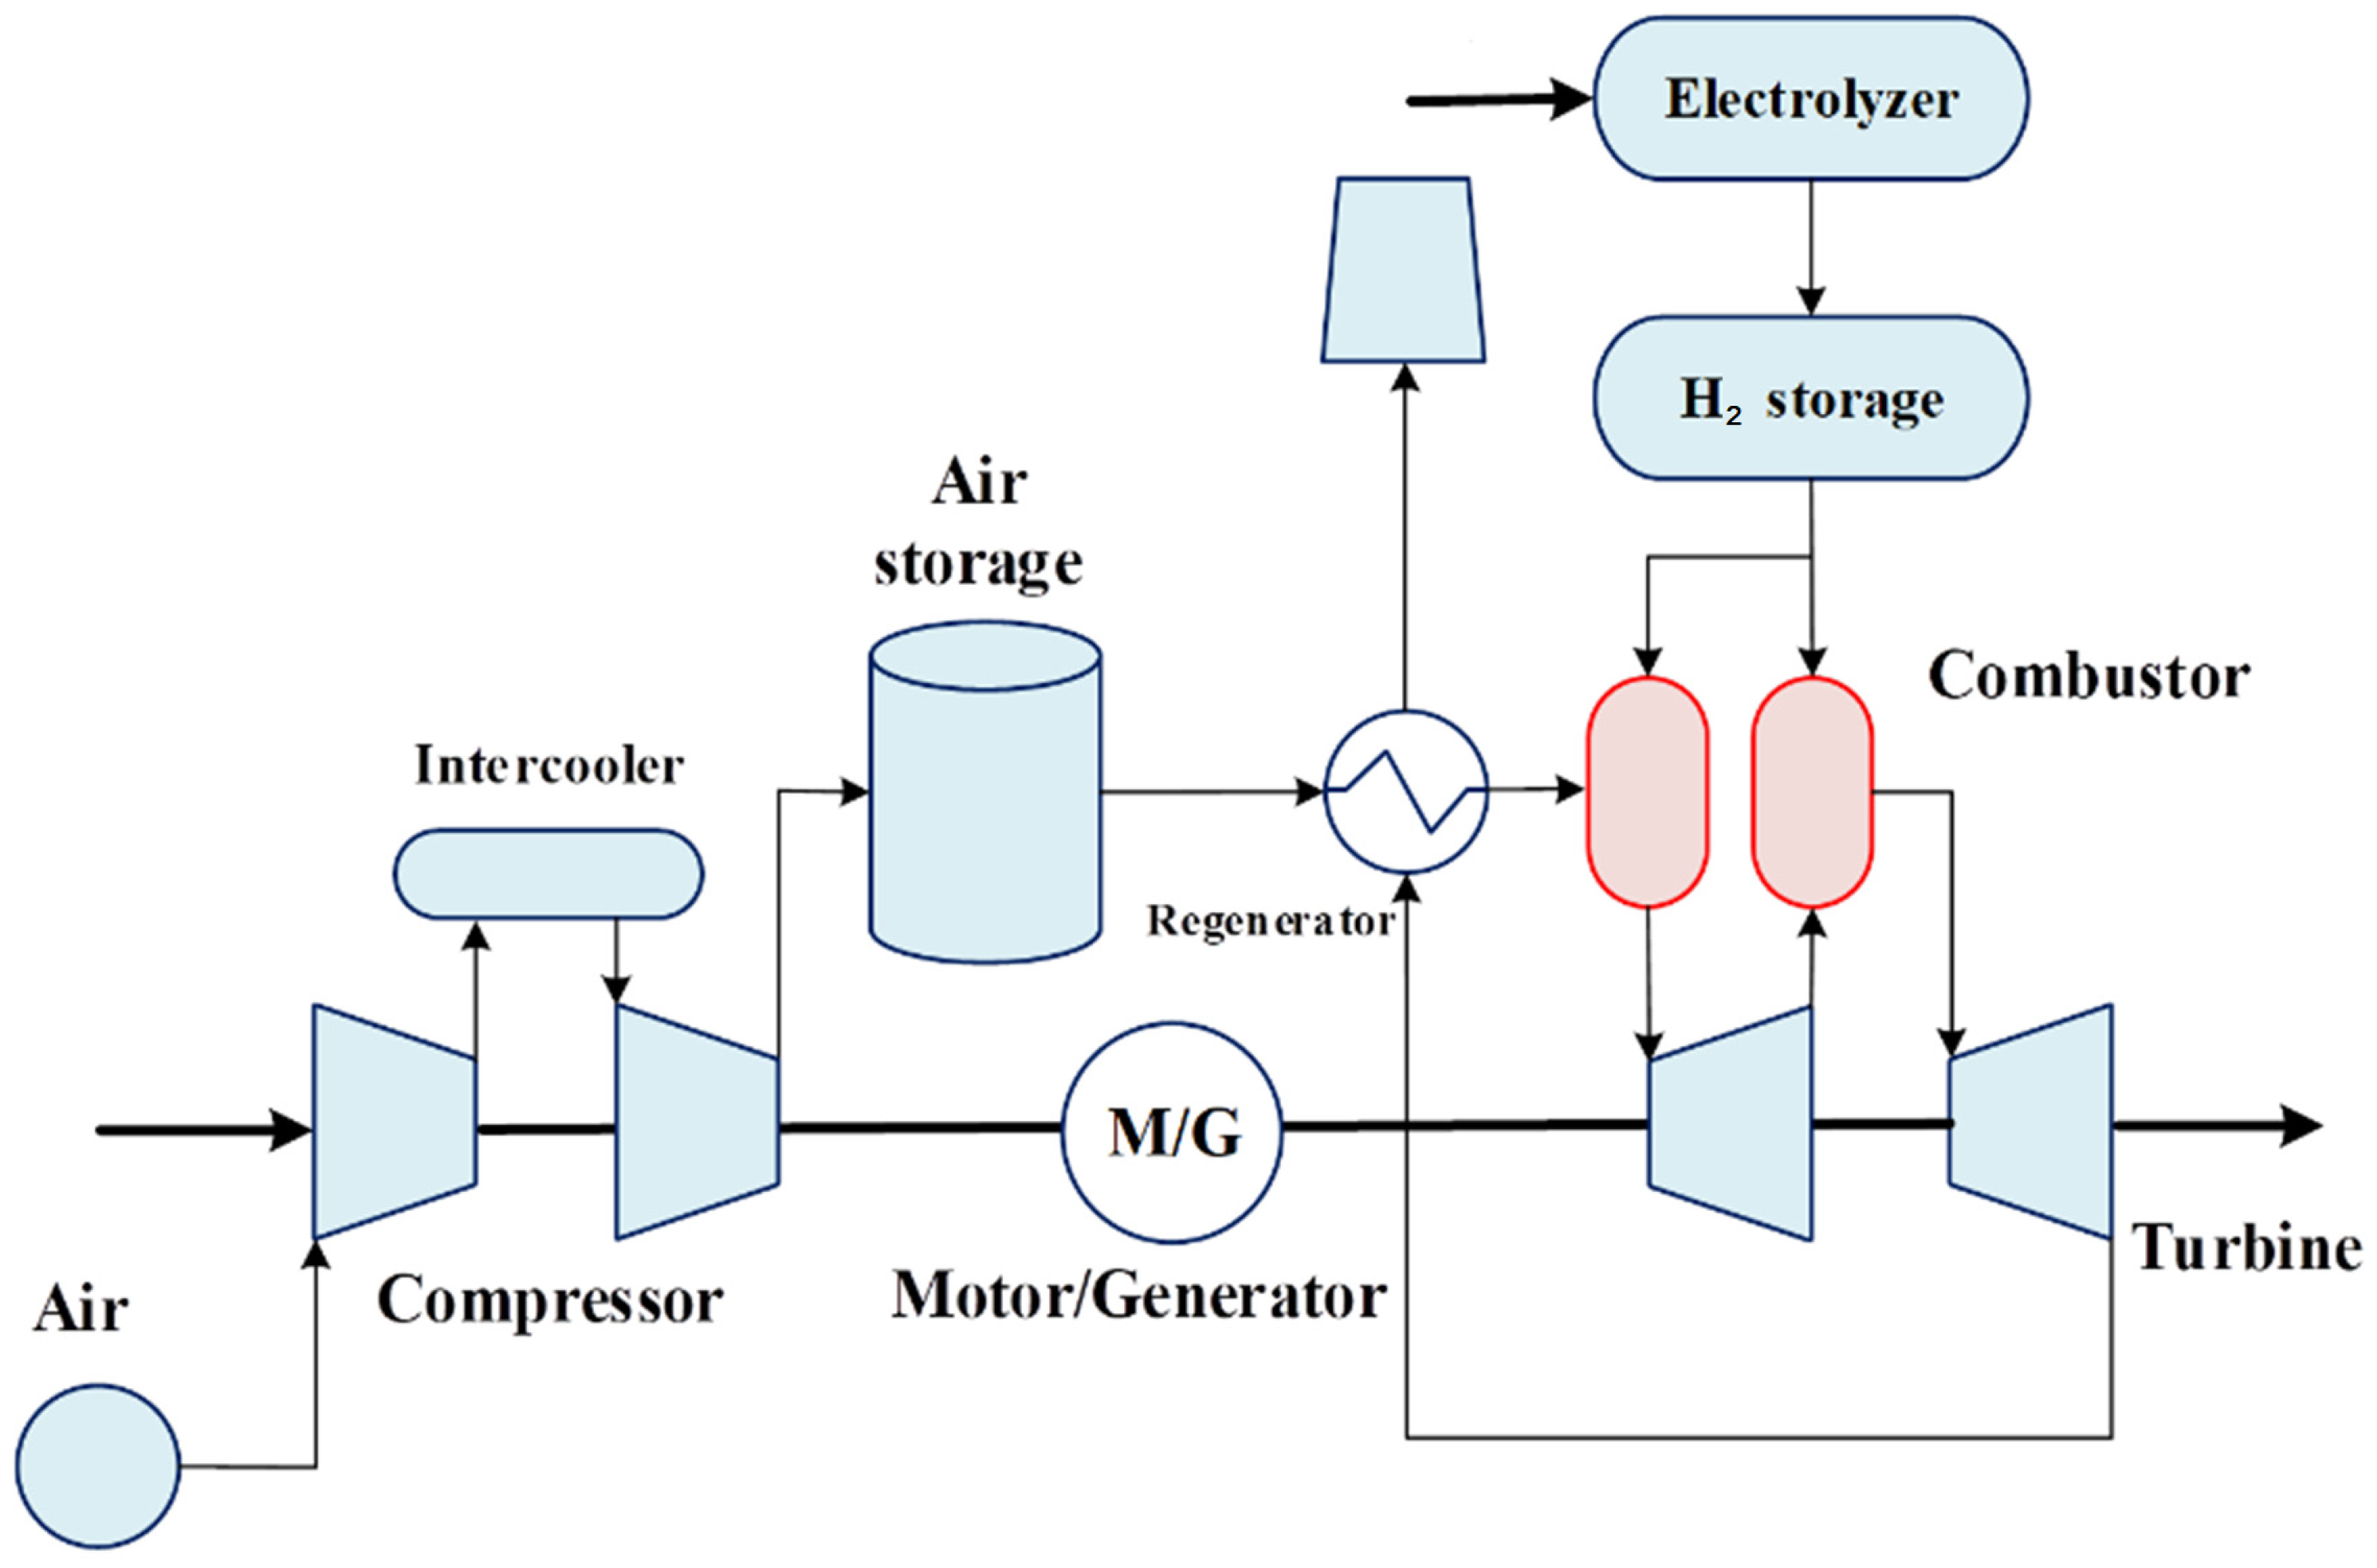
Taking into account the prospects of decarbonization of the energy industry, it is advisable to replace natural gas in the D-CAES scheme with hydrogen obtained by electrolysis using power-to-gas technology. Figure 5, Figure 6 and Figure 7 show the basic configurations of hybrid energy storage systems combining D-CAES and hydrogen.
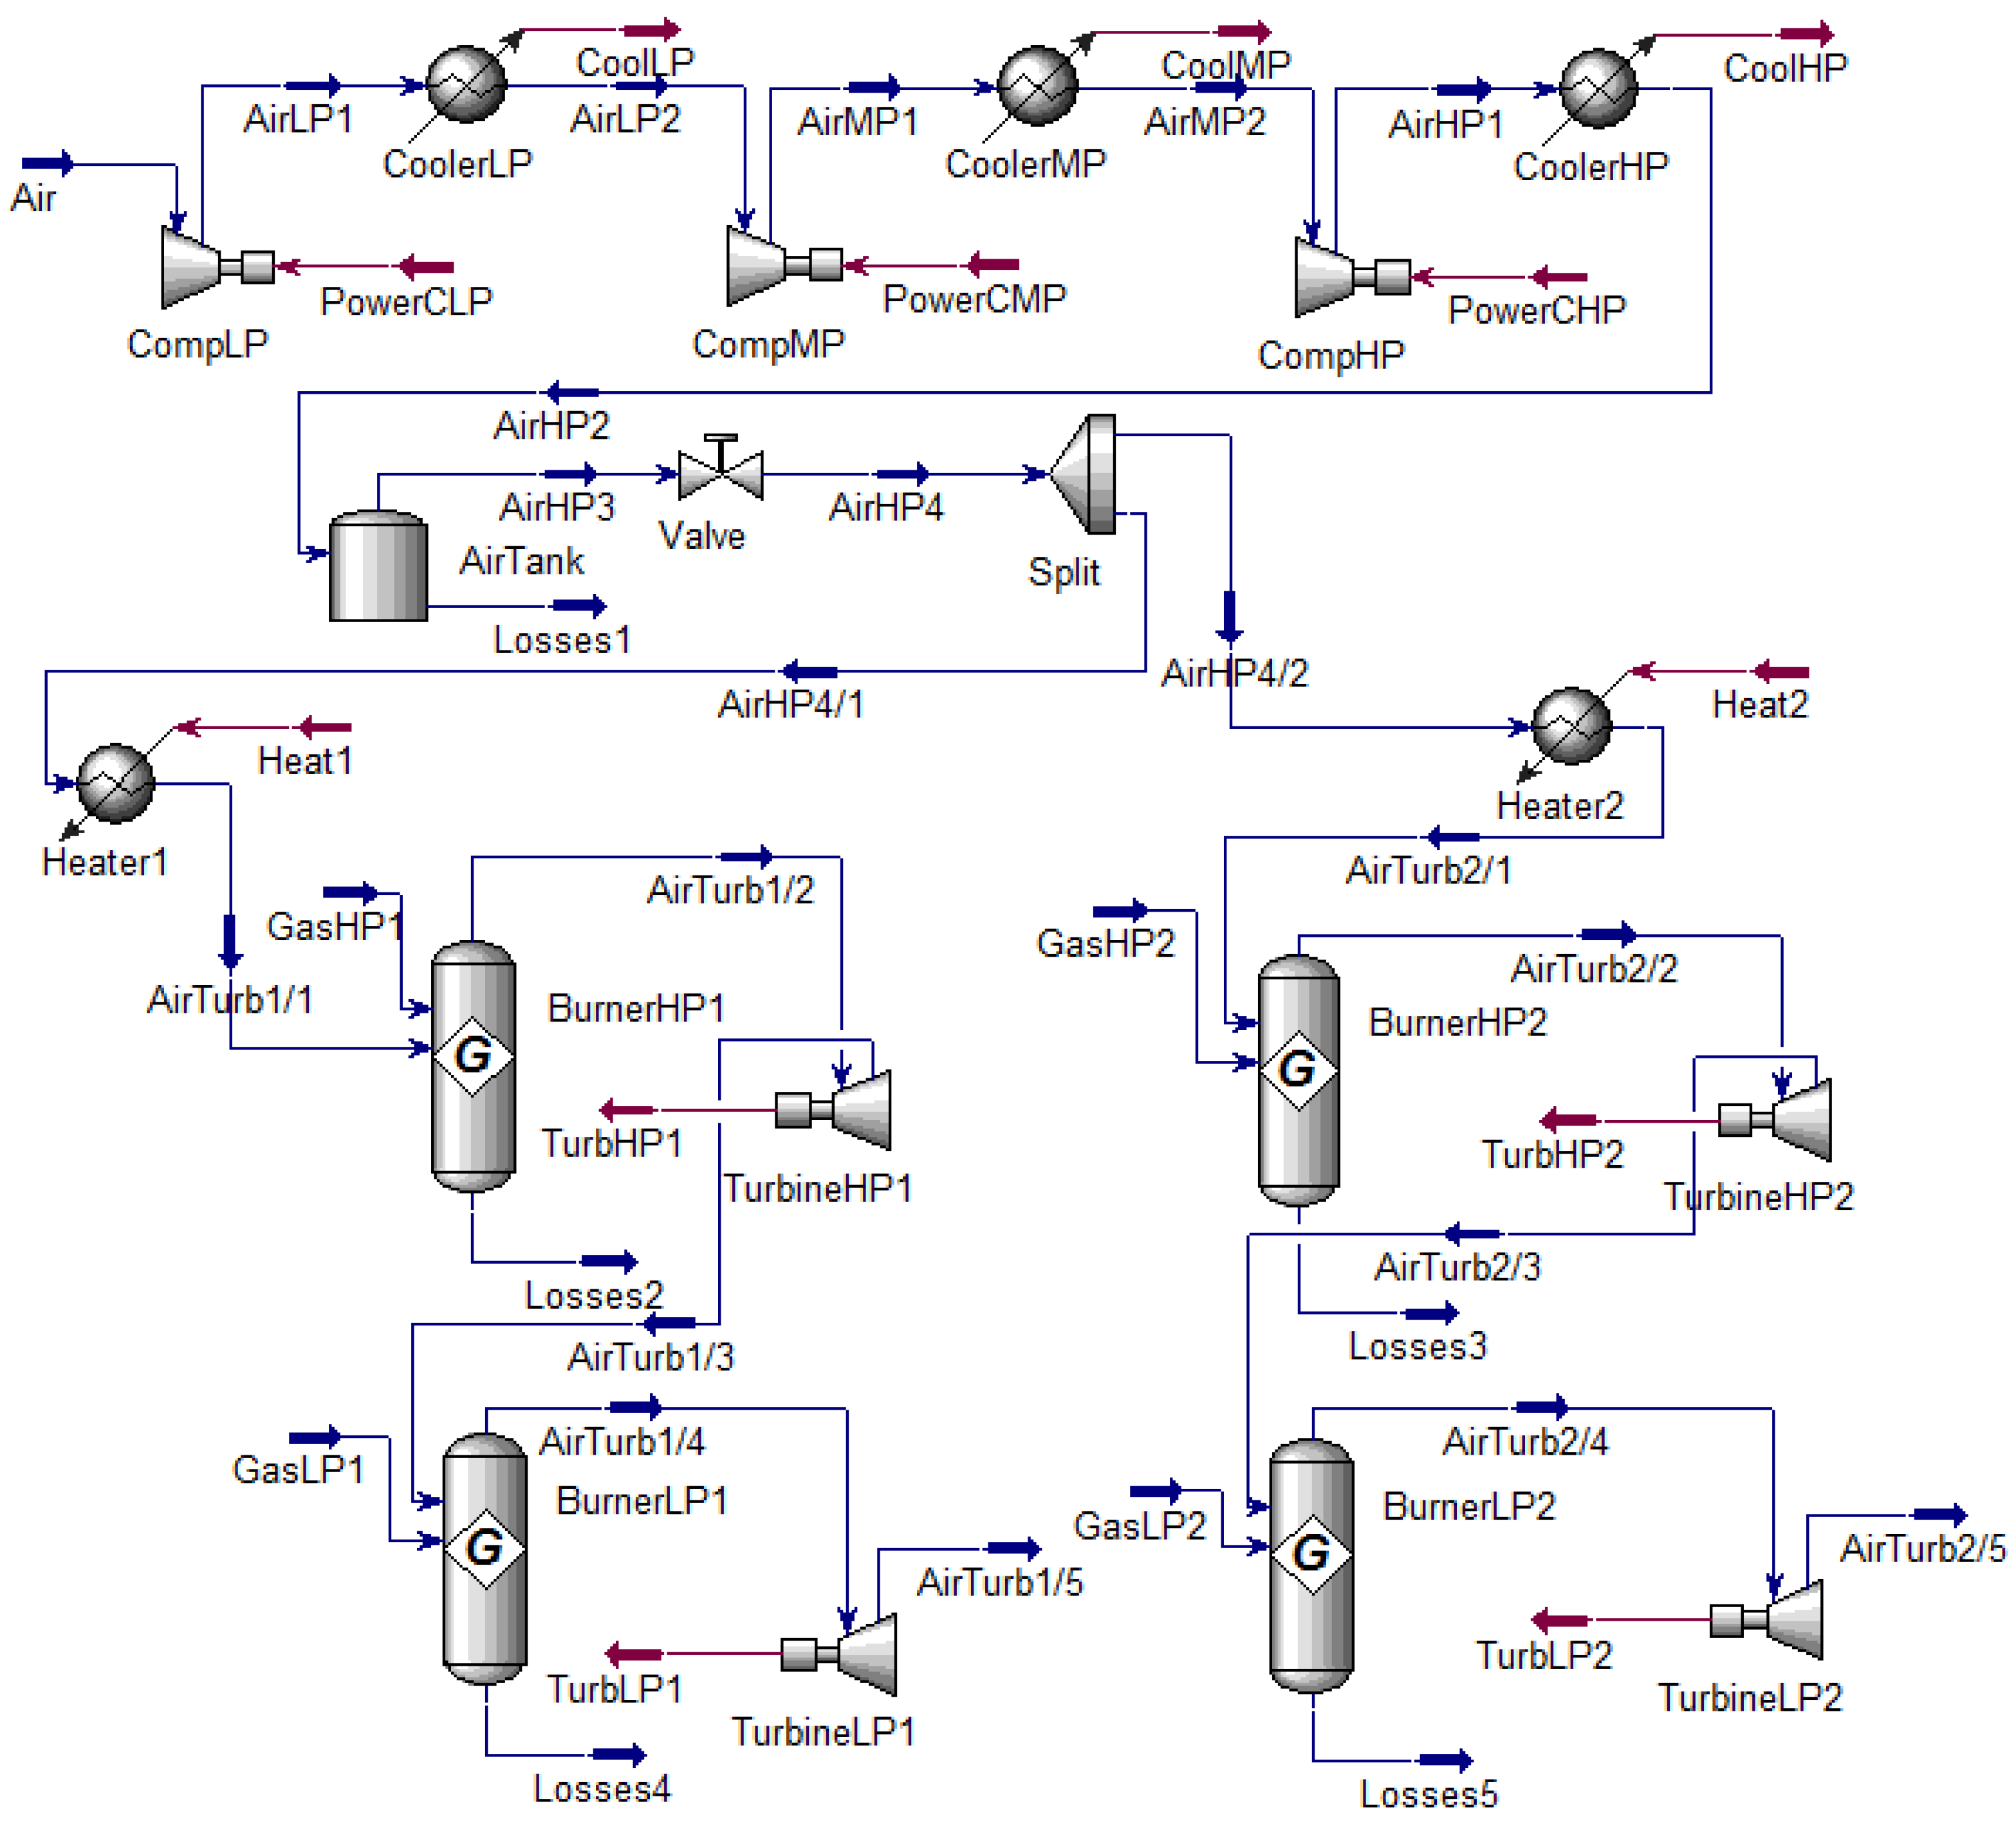
A concept analysis shows that the scheme in Figure 7 should have the highest efficiency because of regeneration, intercooled compression, and reheated expansion. This concept is realized in CAES SENECA-1A (Figure 8).

3.3. Modeling of the CAES SENECA-1A

Figure 8 shows the technological scheme of CAES SENECA-1A in the Aspen HYSYS V10.0 computer program. The calculation model was developed for the analysis and verification of project data. Energy flows (thermal energy or mechanical power on the compressor/turbine shaft) are indicated as red on the diagram, and material flows (air, natural gas, exhaust gases) are indicated as blue. The components in the diagram have the following designations: compressors—CompLP, CompMP, and CompHP; turbines—TurbineHP1, TurbineHP2, TurbineLP1, and TurbineLP2; air coolers—CoolerLP, CoolerMP, and CoolerHP; recuperators—Heater1 and Heater2; and compressed air storage—AirTank.
This scheme assumes the use of a constant volume air storage with a capacity of 450,000 m3, while the air pressure at the inlet to the high-pressure turbine unit is regulated by a throttle located at the outlet of the storage and is maintained at a level not higher than 80 bar. It is worth noting that the exhaust gases have a significant temperature potential (445–450 °C) for connecting an external heat load or heat energy recovery inside the CAES cycle.
Taking into account the prospects of decarbonization of the energy industry, it is advisable to replace natural gas in D-CAES with hydrogen obtained by electrolysis using power-to-gas technology. Further, the article will present the results of the calculation of the CAES SENECA-1A scheme in the basic and prospective versions with the combustion of natural gas and hydrogen, respectively.

4. Results and Discussion

Table 2 shows the results of the CAES technological scheme calculation for the SENECA-1A project in the Aspen HYSYS V10.0 program using natural gas and hydrogen with equal turbine and compressor energy indicators.
The results presented in Table 1 show that, while keeping the 214 MW turbines powered, the transition to hydrogen reduces carbon dioxide emissions from 8.8 to 0.0 kg/s, while the formation of water vapor will increase from 17.6 to 27.4 kg/s.
One of the key parameters is the efficiency of the CAES electricity supply. In this calculation, this value amounted to 62.1%. It is worth recalling that for the McIntosh CAES system, which is considered a prototype of the CAES SENECA-1A project, the efficiency reaches 55%. The formula for evaluating the efficiency of D-CAES is given in Equation (1):
  η = N t u r b N c o m p + Q g a s × B g a s ,
where N t u r b is the total turbine power, MW; N c o m p is the total compressor power, MW; Q g a s is the heat of combustion of natural gas/hydrogen, and MJ/kg; B g a s is the total consumption of natural gas/hydrogen, kg/s.
At the same time, this formula is applicable only for CAES with equal charging and discharging periods. For compressed-air energy storage with different operating times of compressors and turbines, it is necessary to consider the ratio not of mechanical/thermal capacities, but of the compression/expansion works performed and the chemical energy of the fuel burned within one cycle. The charging time and the discharge time of CAES, due to system electrical power factors, can be very different. In this case, the power of compressors and turbines may differ proportionally. Therefore, when calculating the cycle efficiency, a direct comparison of capacities or peak loads is incorrect; it is necessary to take into account the ratio of electrical energy consumed in one compression cycle and generated in one expansion cycle.
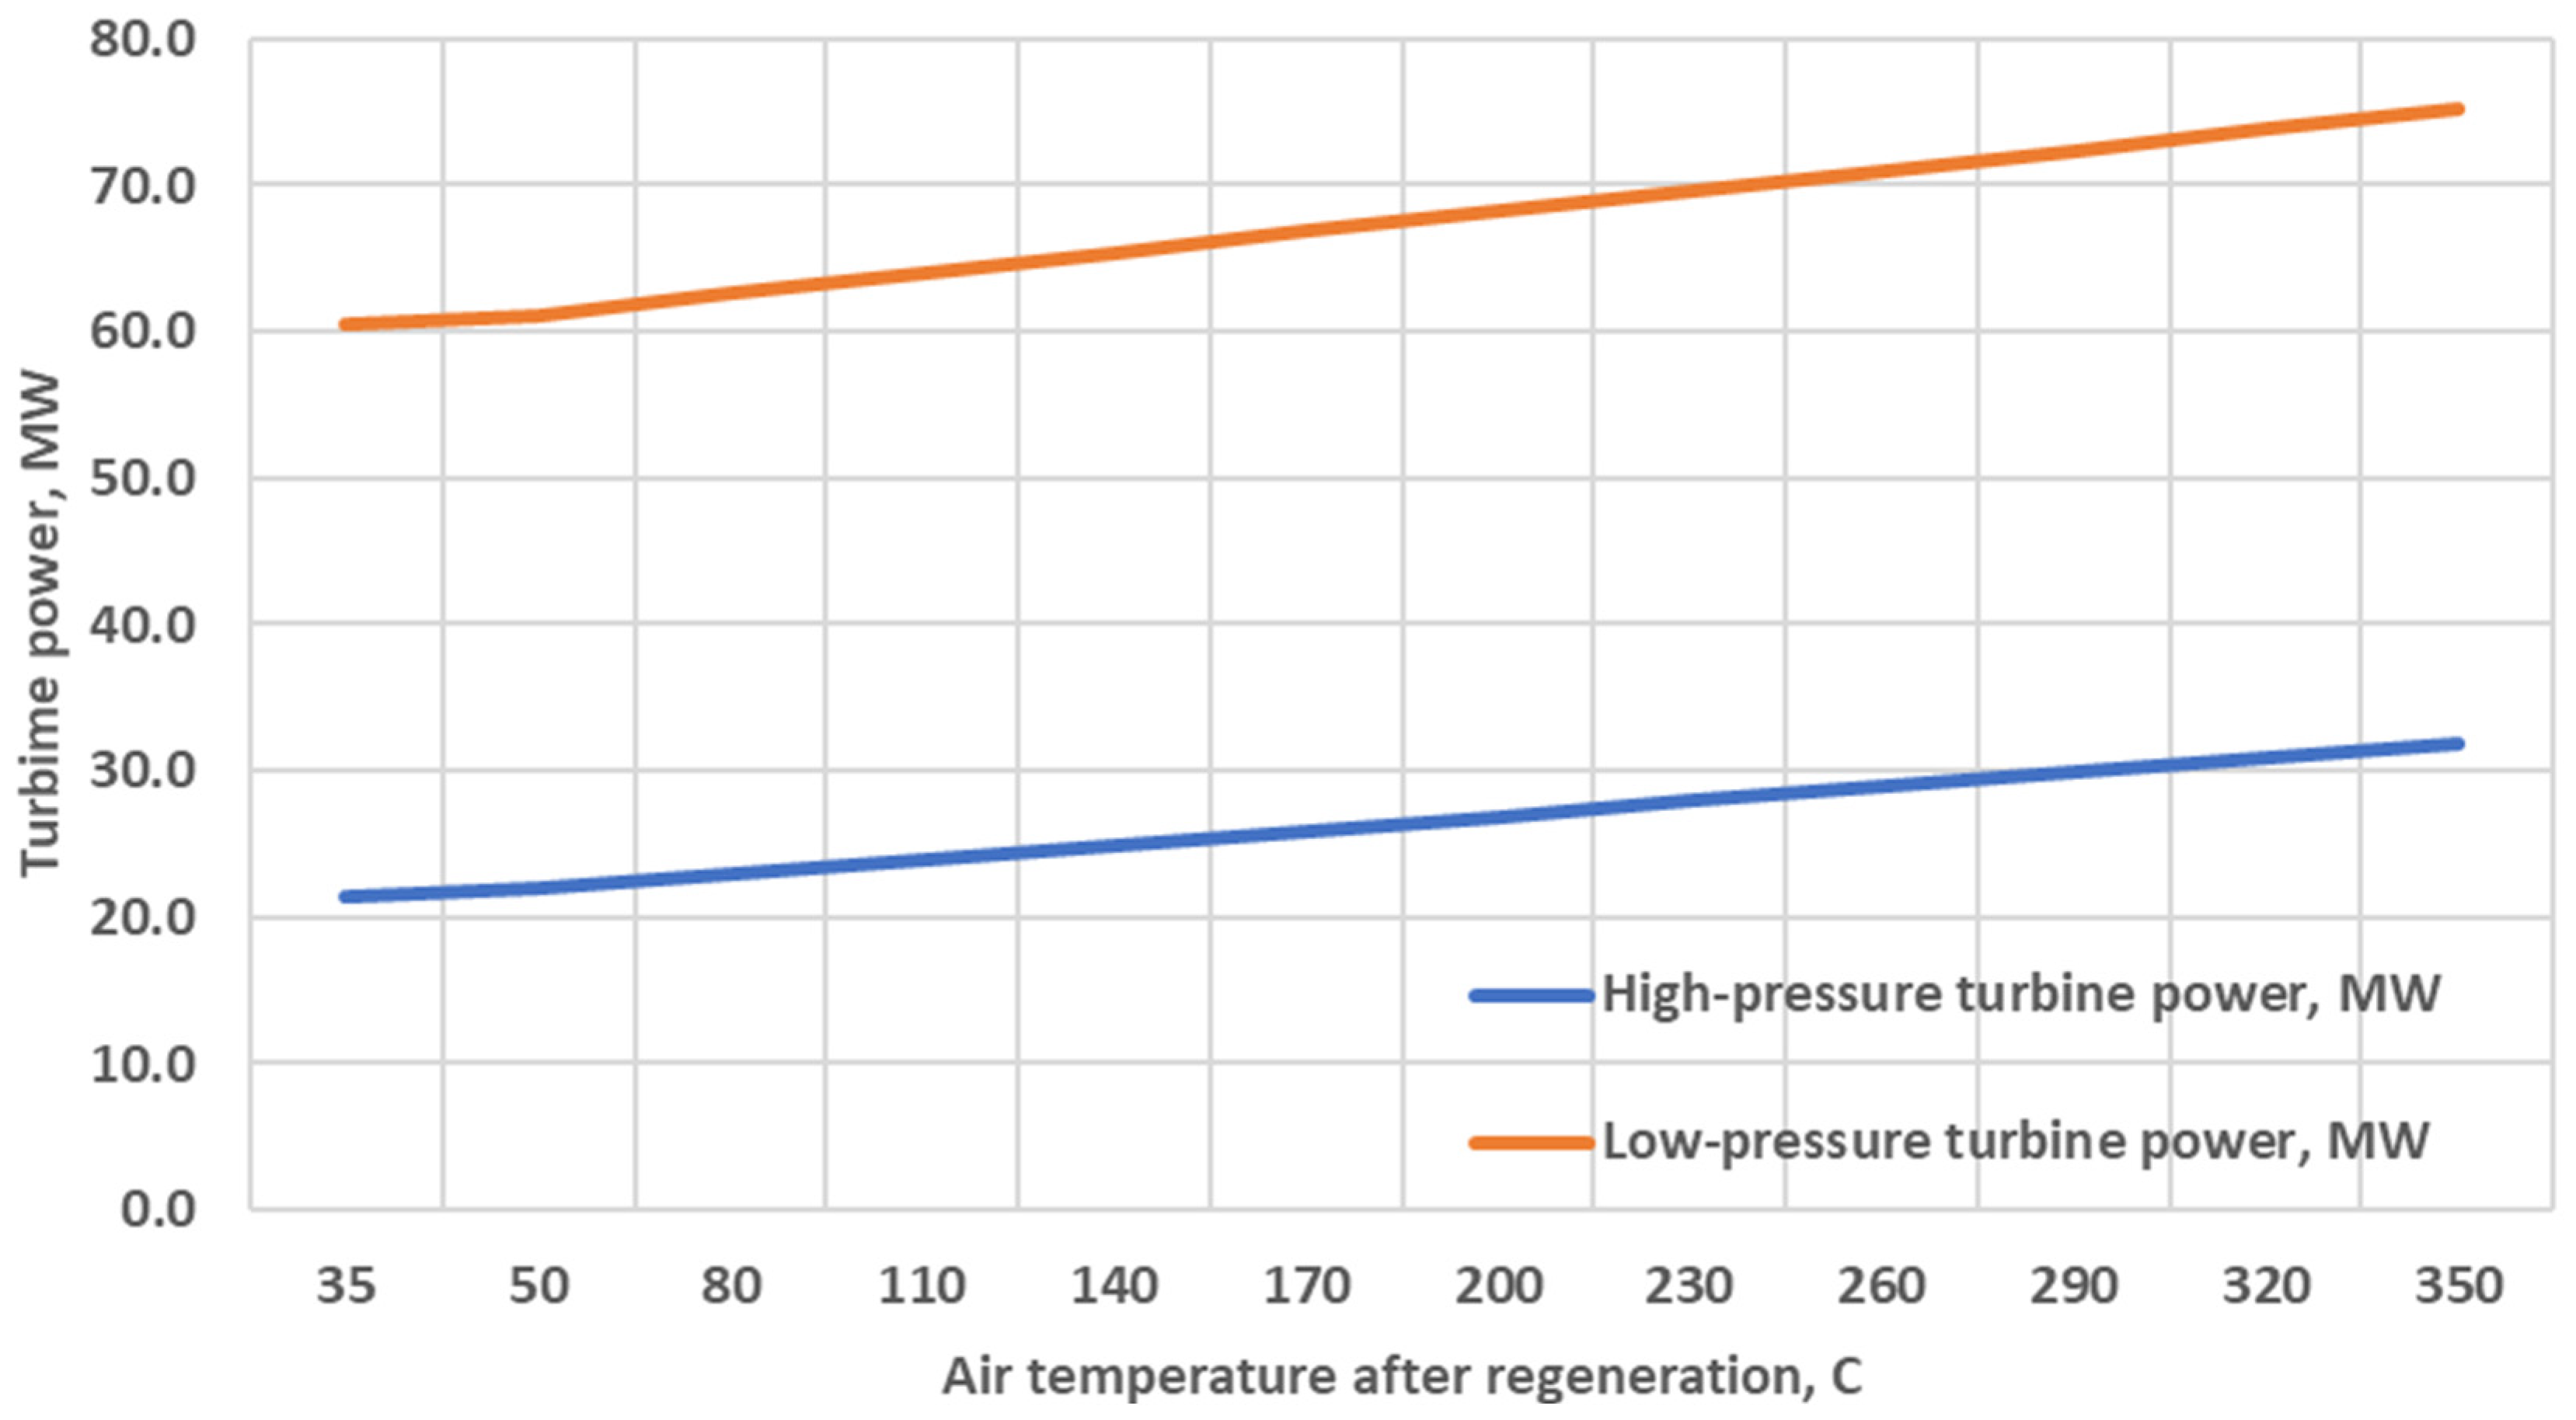
Figure 9 shows the regeneration effect for CAES SENECA-1A with nominal hydrogen mass flow, calculated by the Case Studies utility in Aspen HYSYS V10.0. The Heater1 (Figure 8) load varied from 0 to maximum, available with a temperature interval from 35 to 350 °C for outlet air. It is shown that regeneration helps to increase high-pressure turbine power from 21.4 to 31.8 MW and low-pressure turbine power from 60.4 to 75.2 MW. Total regeneration helps to increase the CAES turbine power by nearly 30% (from 163.6 to 214 MW).
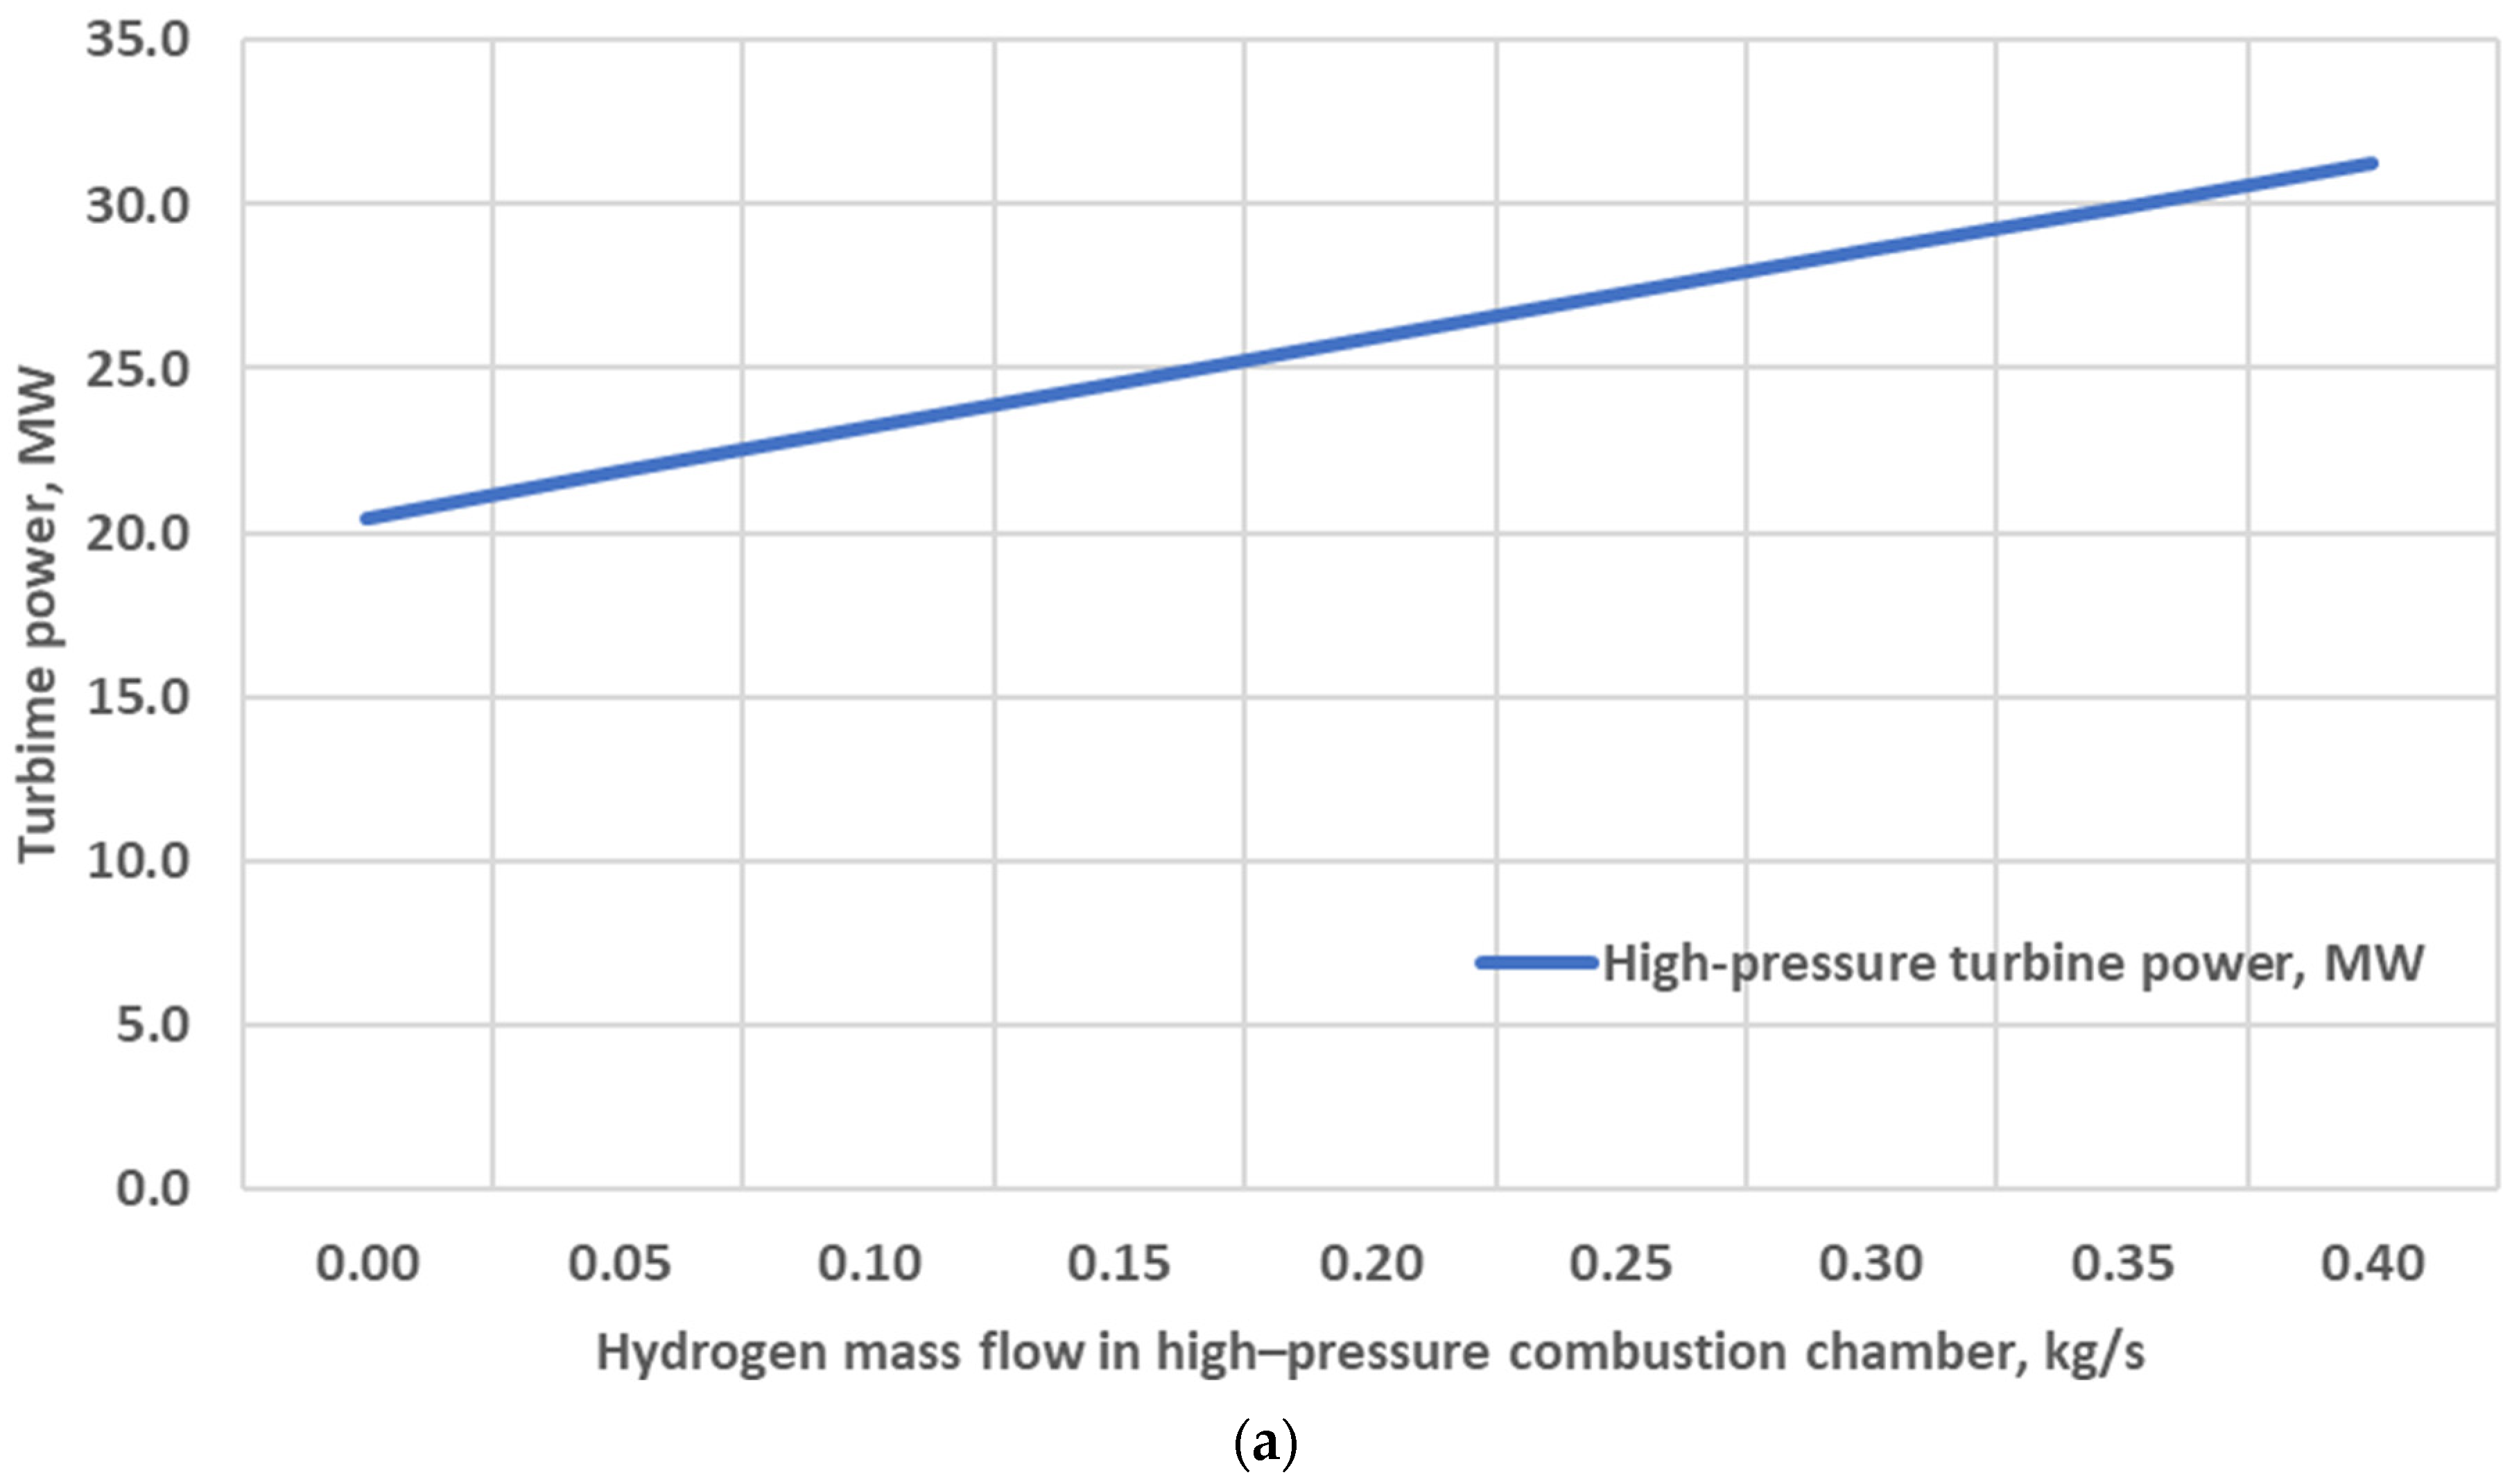
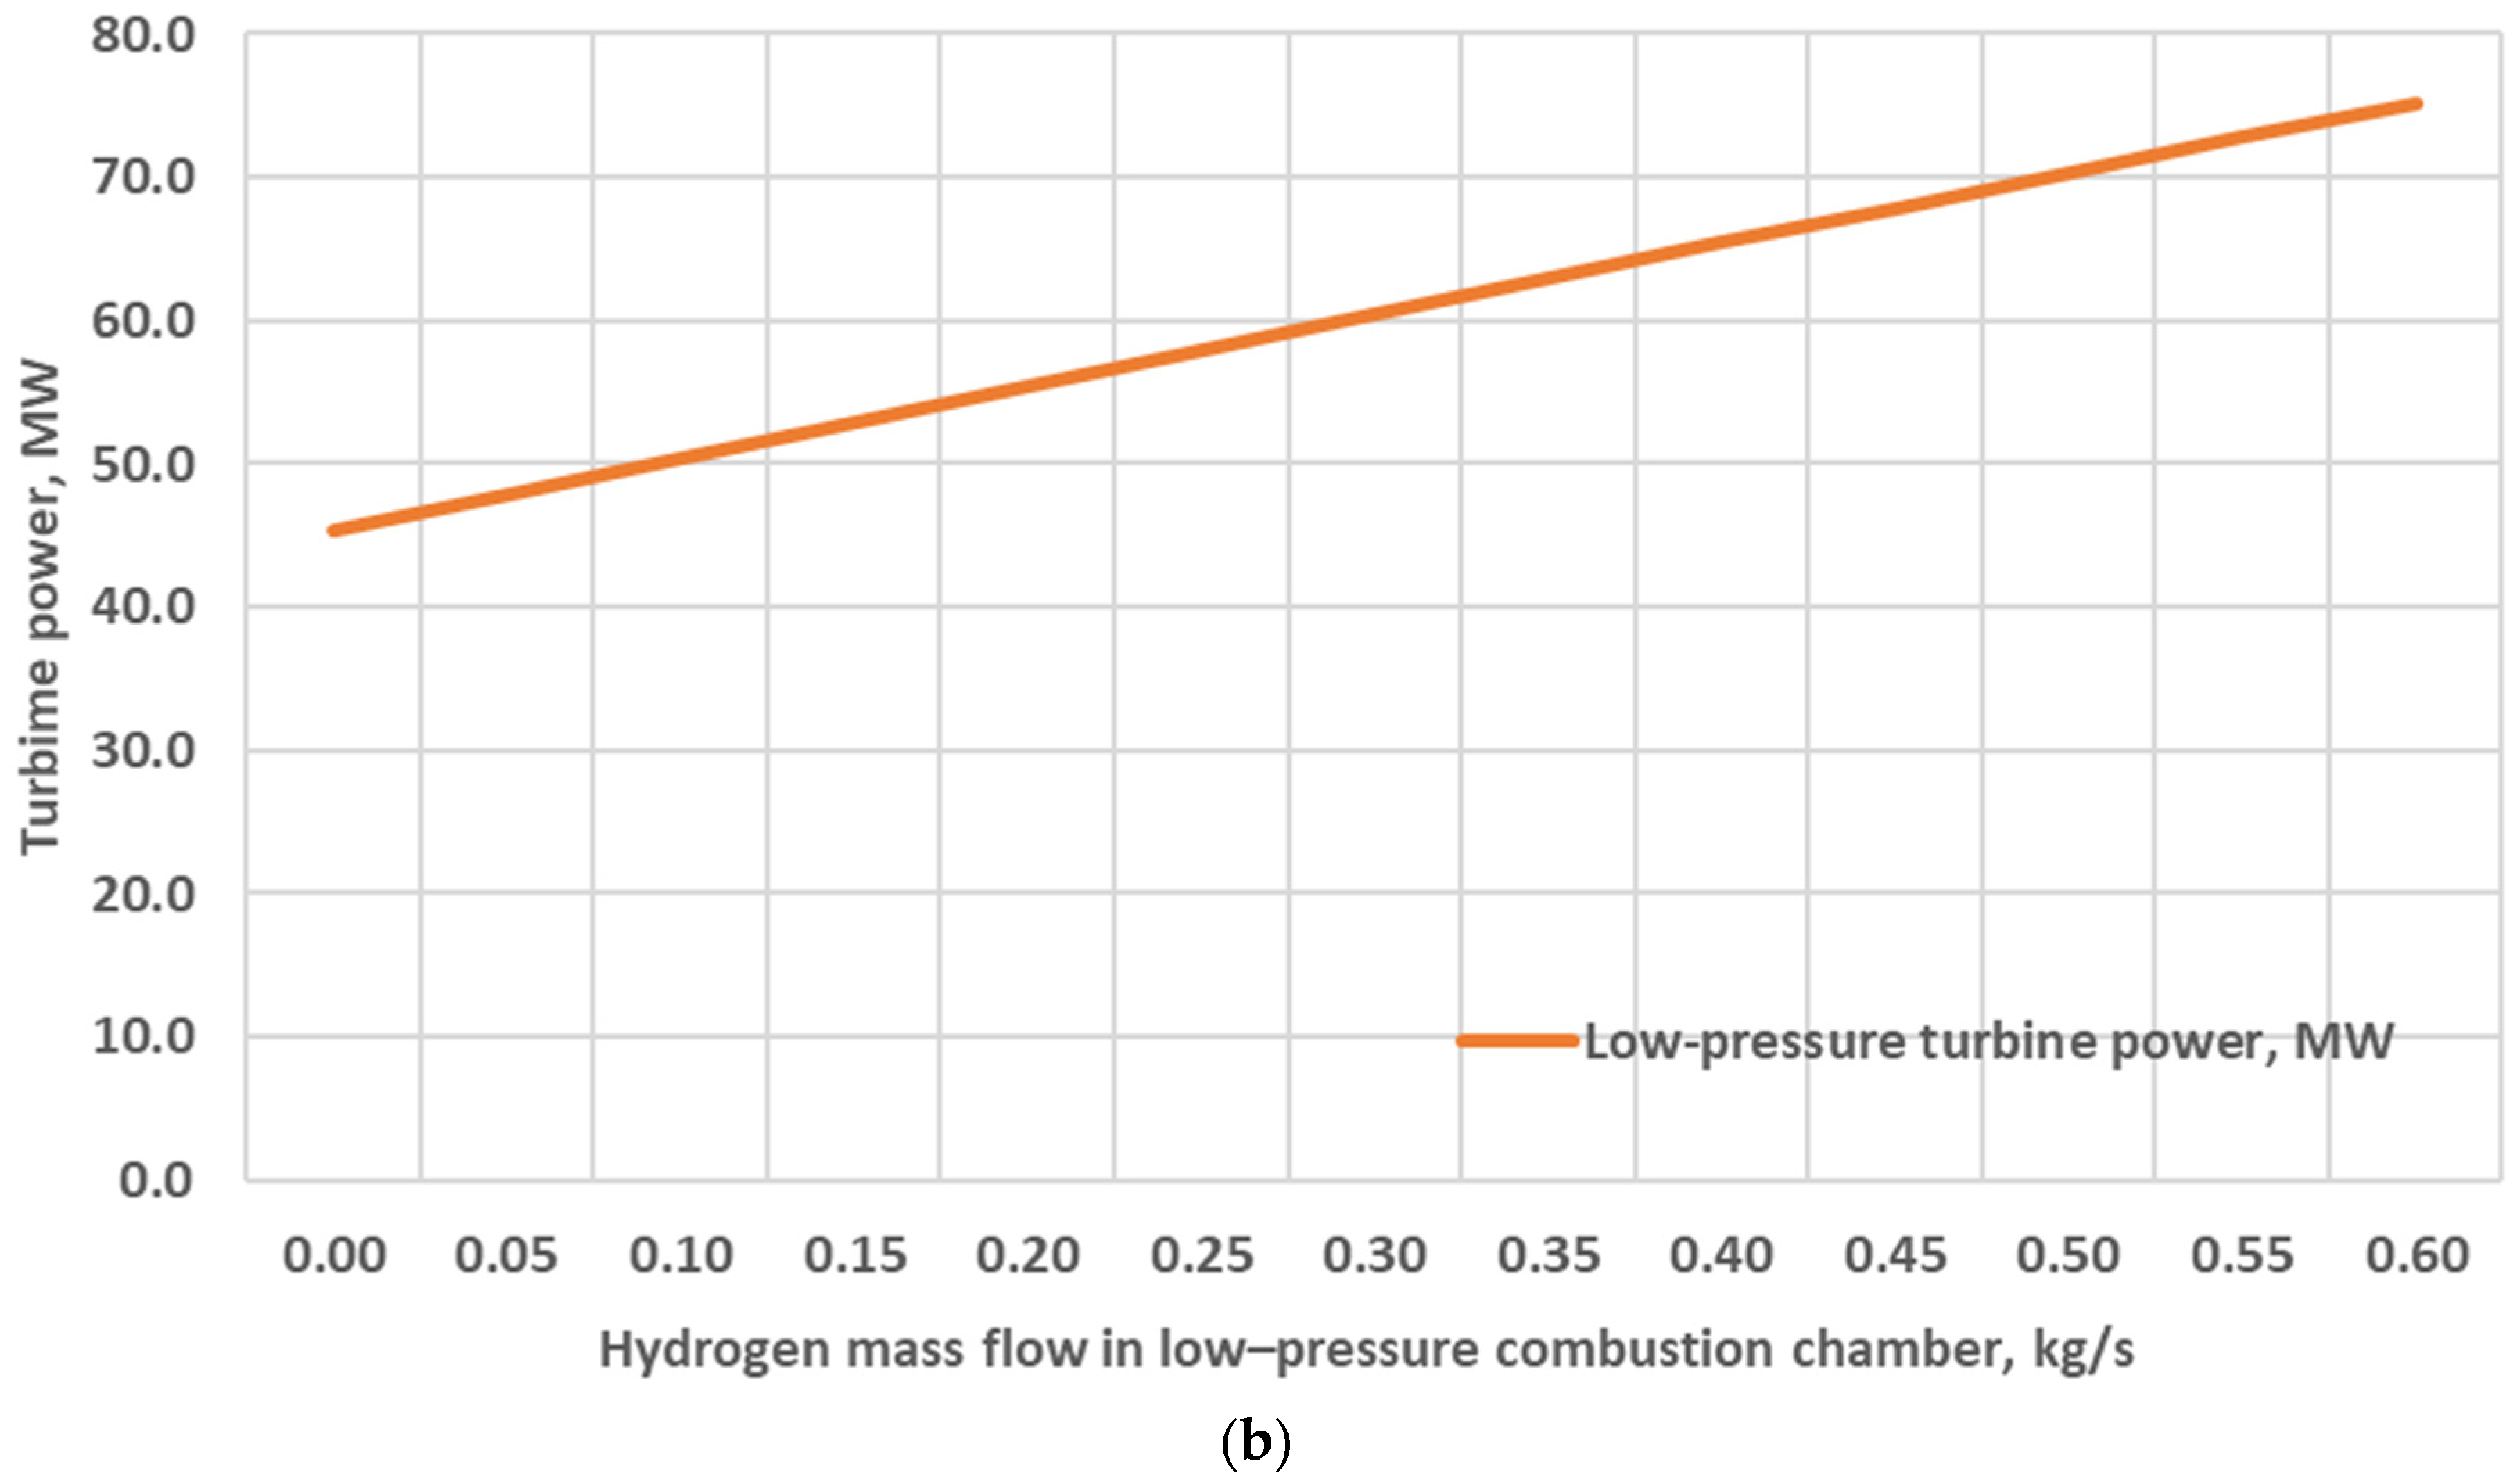
Figure 10 shows the hydrogen burning effect calculated by the Case Studies utility in Aspen HYSYS V10.0. The hydrogen mass flow varied from 0 to nominal values, 0.4 and 0.6 kg/s for high and low-pressure combustion chambers, accordingly. It is shown that fuel burning helps to increase high-pressure turbine power from 20.4 to 31.8 MW and low-pressure turbine power from 45.4 to 75.2 MW. Total hydrogen application helps to increase CAES turbine power by nearly 63% (from 131.6 to 214 MW). It is obvious that while hydrogen mass flow for the chambers is equal to 0.0 m/s, D-CAES conceptually transforms to A-CAES.
The results of the CAES SENECA-1A mode comparison are represented in Table 3. Both D-CAES (with fuel) and A-CAES (no fuel) include regeneration. It is shown that the A-CAES mode has 0.0 carbon dioxide and water vapor emissions with relatively higher efficiency (71.5 vs. 62.1%). At the same time, the main advantage of the D-CAES mode is the possibility to produce more power in the turbine block (214 vs. 131.6 MW), having fewer capital costs. Thus, the choice of technology is subject to complex technical, economic, and ecological study.

5. Conclusions

In the technological scheme under consideration, the estimated charging time of the storage with a volume of 450,000 m3 from a pressure of 80 bar to 103 bar with an air flow rate of 270 kg/s through compressors is 12 h. The storage discharge period from a pressure of 103 bar to 80 bar is also estimated at 12 h, which makes it possible to use a CAES system of this configuration to maintain the daily peak modes of the power system in the power range from 0 to 220 MW. In our opinion, the SENECA-1A project can be one of the prototypes for the development of a large CAES system due to the high estimated efficiency of the electricity supply (62.1%). At the same time, the transition to hydrogen will further reduce carbon dioxide emissions in the energy sector and balance the operating modes of the plant operating on power-to-gas technology. Promising research tasks in the industry are the optimization of the schemes and operation modes of the hybrid energy storage system in combination with hydrogen generators.
We have carried out the modeling of priority CAES schemes: Seneca-1A, UT, Matagorda, and others. The task of modeling was to compile material and heat balances in order to determine the key parameters of various CAES systems. Based on the results of modeling in the Aspen HYSYS computer program, the key parameters were determined, including the following: the total power of the compressors, the air flow through the compressors, the estimated volume of the storage, the estimated temperature in the storage, the maximum pressure in the storage, the total power of the turbines, the flow rate of the working fluid through one high-pressure turbine and low-pressure turbine, the inlet air pressure of the high- and low-pressure turbine, the full charge/discharge period, the total fuel consumption, the flue gas temperature, and the efficiency.

Author Contributions

A.V.F. and D.V.S. worked on all the tasks, Y.S.V. and S.A.D. worked on the literature review, I.K.I. and I.H.B. performed the supervision, and all authors analyzed the results. All authors have read and agreed to the published version of the manuscript.

Funding

This research received no external funding.

Data Availability Statement

All data can be used on request.

Conflicts of Interest

Author Yulia S. Valeeva was employed by the Russian University of Cooperation. The remaining authors declare that the research was conducted in the absence of any commercial or financial relationships that could be construed as a potential conflict of interest.

References

  1. Stadler, I. Power grid balancing of energy systems with high renewable energy penetration by demand Response. Util. Policy 2008, 16, 90–98. [Google Scholar] [CrossRef]
  2. Bloess, A.; Schill, W.; Zerrahn, A. Power-to-heat for renewable energy integration: A review of technologies, modeling approaches, and flexibility potentials. Appl. Energy 2018, 212, 1611–1626. [Google Scholar] [CrossRef]
  3. Rogalev, N.; Rogalev, A.; Kindra, V.; Naumov, V.; Maksimov, I. Comparative Analysis of Energy Storage Methods for Energy Systems and Complexes. Energies 2022, 15, 9541. [Google Scholar] [CrossRef]
  4. Hasan, K.N.; Preece, R.; Milanovic, J.V. Existing approaches and trends in uncertainty modelling and probabilistic stability analysis of power systems with renewable generation. Renew. Sustain. Energy Rev. 2019, 101, 168–180. [Google Scholar] [CrossRef]
  5. Steffen, B.; Weber, C. Efficient storage capacity in power systems with thermal and renewable generation. Energy Econ. 2013, 36, 556–567. [Google Scholar] [CrossRef]
  6. Beccali, M.; Cellura, M.; Mistretta, M. Environmental effects of energy policy in Sicily: The role of renewable energy. Renew. Sustain. Energy Rev. 2007, 11, 282–298. [Google Scholar] [CrossRef]
  7. Hsieh, E.; Anderson, R. Grid flexibility: The quiet revolution. Electr. J. 2017, 30, 1–8. [Google Scholar] [CrossRef]
  8. Huber, M.; Dimkova, D.; Hamacher, T. Integration of wind and solar power in Europe: Assessment of flexibility requirements. Energy 2014, 69, 236–246. [Google Scholar] [CrossRef]
  9. Denholm, P.; Margolis, R.M. Evaluating the limits of solar photovoltaics (PV) in traditional electric power systems. Energy Policy 2007, 35, 2852–2861. [Google Scholar] [CrossRef]
  10. De Cesaro, J.; Porter, K.; Milligan, M. Wind Energy and Power System Operations: A Review of Wind Integration Studies to Date. Electr. J. 2009, 22, 34–43. [Google Scholar] [CrossRef]
  11. Lund, P.D.; Lindgren, J.; Mikkola, J.; Salpakari, J. Review of energy system flexibility measures to enable high levels of variable renewable electricity. Renew. Sustain. Energy Rev. 2015, 45, 785–807. [Google Scholar] [CrossRef]
  12. Salpakari, J.; Mikkola, J.; Lund, P.D. Improved flexibility with large-scale variable renewable power in cities through optimal demand side management and power-to-heat conversion. Energy Convers. Manag. 2016, 126, 649–661. [Google Scholar] [CrossRef]
  13. Ubertini, S.; Facci, A.L.; Andreassi, L. Hybrid Hydrogen and Mechanical Distributed Energy Storage. Energies 2017, 10, 2035. [Google Scholar] [CrossRef]
  14. Han, Z.; Guo, S. Investigation of operation strategy of combined cooling, heating and power (CCHP) system based on advanced adiabatic compressed air energy storage. Energy 2018, 160, 290–308. [Google Scholar] [CrossRef]
  15. Borri, E.; Tafone, A.; Comodi, G.; Romagnoli, A.; Cabeza, L.F. Compressed Air Energy Storage—An Overview of Research Trends and Gaps through a Bibliometric Analysis. Energies 2022, 15, 7692. [Google Scholar] [CrossRef]
  16. Briola, S.; Gabbrielli, R.; Delgado, A. Energy and economic performance assessment of the novel integration of an advanced configuration of liquid air energy storage plant with an existing large-scale natural gas combined cycle. Energy Convers. Manag. 2020, 205, 112434. [Google Scholar] [CrossRef]
  17. Budt, M.; Wolf, D.; Span, R.; Yan, J. A review on compressed air energy storage: Basic principles, past milestones and recent developments. Appl. Energy 2016, 170, 250–268. [Google Scholar] [CrossRef]
  18. King, M.; Jain, A.; Bhakar, R.; Mathur, J.; Wang, J. Overview of current compressed air energy storage projects and analysis of the potential underground storage capacity in India and the UK. Renew. Sustain. Energy Rev. 2021, 139, 110705. [Google Scholar] [CrossRef]
  19. Li, P.; Hu, Q.; Han, Z.; Wang, C.; Wang, R.; Han, X.; Wang, Y. Thermodynamic analysis and multi-objective optimization of a trigenerative system based on compressed air energy storage under different working media and heating storage media. Energy 2022, 239, 122252. [Google Scholar] [CrossRef]
  20. Soltani, M.; Kashkooli, F.M.; Jafarizadeh, H.; Hatefi, M.; Fekri, H.; Gharali, K.; Nathwani, J. Diabatic Compressed Air Energy Storage (CAES) Systems: State of the Art. In Encyclopedia of Energy Storage; Elsevier: Amsterdam, The Netherlands, 2022; pp. 173–187. [Google Scholar] [CrossRef]
  21. Mucci, S.; Bischi, A.; Briola, S.; Baccioli, A. Small-scale adiabatic compressed air energy storage: Control strategy analysis via dynamic modelling. Energy Convers. Manag. 2021, 243, 114358. [Google Scholar] [CrossRef]
  22. Salvini, C.; Giovannelli, A. Techno-Economic Comparison of Utility-Scale Compressed Air and Electro-Chemical Storage Systems. Energies 2022, 15, 6644. [Google Scholar] [CrossRef]
  23. Zhou, Q.; Du, D.; Lu, C.; He, Q.; Liu, W. A review of thermal energy storage in compressed air energy storage system. Energy 2019, 188, 115993. [Google Scholar] [CrossRef]
  24. Mousavi, S.B.; Adib, M.; Soltania, M.; Razmi, A.R.; Nathwani, J. Transient thermodynamic modeling and economic analysis of an adiabatic compressed air energy storage (A-CAES) based on cascade packed bed thermal energy storage with encapsulated phase change materials. Energy Convers. Manag. 2021, 243, 114379. [Google Scholar] [CrossRef]
  25. Li, J.; Lu, W.; Luo, Z.; Zeng, Y. Synthesis and thermal properties of novel sodium nitrate microcapsules for high-temperature thermal energy storage. Sol. Energy Mater. Sol. Cells 2017, 159, 440–446. [Google Scholar] [CrossRef]
  26. Chen, L.; Wang, Y.; Xie, M.; Ye, K.; Mohtaram, S. Energy and exergy analysis of two modified adiabatic compressed air energy storage (A-CAES) system for cogeneration of power and cooling on the base of volatile fluid. J. Energy Storage 2021, 42, 103009. [Google Scholar] [CrossRef]
  27. Zhao, P.; Lai, Y.; Xu, W.; Zhang, S.; Wang, P.; Wang, J. Performance investigation of a novel near-isothermal compressed air energy storage system with stable power output. Energy Res. 2020, 44, 11135–11151. [Google Scholar] [CrossRef]
  28. Sarmast, S.; Fraser, R.A.; Dusseault, M.B. Performance and cyclic heat behavior of a partially adiabatic Cased-Wellbore Compressed Air Energy Storage system. J. Energy Storage 2021, 44, 103279. [Google Scholar] [CrossRef]
  29. Olkhovsky, G.G.; Kazaryan, V.A.; Stolyarevsky, A.Y. Compressed-Air and Gas Turbine Power Plants (CAGTPP); Institute of Computer Research: Izhevsk, Russia, 2011; p. 360. (In Russian) [Google Scholar]
  30. NYSEG. Seneca Compressed Air Energy Storage (CAES) Demonstration Project; Final Phase 1 Technical Report; UNT: Denton, TX, USA, 2012; p. 66. Available online: https://digital.library.unt.edu/ark:/67531/metadc841509/m1/1 (accessed on 1 August 2023).
  31. Buttler, A.; Spliethoff, H. Current status of water electrolysis for energy storage, grid balancing and sector coupling via power-to-gas and power-to-liquids: A review. Renew. Sustain. Energy Rev. 2018, 82, 2440–2454. [Google Scholar] [CrossRef]
  32. Sanchez, M.; Amores, E.; Abad, D.; Rodriguez, L.; Clemente-Jul, C. Aspen Plus model of an alkaline electrolysis system for hydrogen production. Int. J. Hydrog. Energy 2020, 45, 3916–3929. [Google Scholar] [CrossRef]
  33. Rivera-Tinoco, R.; Farran, M.; Bouallou, C.; Aupretre, F.; Valentin, S.; Millet, P.; Ngameni, J.R. Investigation of power-to-methanol processes coupling electrolytic hydrogen production and catalytic CO2 reduction. Int. J. Hydrog. Energy 2016, 41, 4546–4559. [Google Scholar] [CrossRef]
  34. Er-Rbib, H.; Bouallou, C. Modeling and simulation of methanation catalytic reactor for renewable electricity storage. Chem. Eng. Trans. 2013, 35, 541–546. [Google Scholar] [CrossRef]
  35. Sharifian, S.; Harasek, M. Simulation of COx methanation reactor for the production of natural gas. Chem. Eng. Trans. 2015, 45, 1003–1008. [Google Scholar] [CrossRef]
  36. Sharifian, S.; Miltner, M.; Harasek, M. Thermodynamic and Kinetic Based Simulation Approach to CO2 and CO Methane Hydrogenation. Chem. Eng. Trans. 2016, 52, 565–570. [Google Scholar] [CrossRef]
  37. Semin, D.V.; Fedyukhin, A.V.; Dronov, S.A.; Panarin, V.E.; Savostikov, A.E. Aspen Plus model of a Power-to-Gas technology for methane-hydrogen mixture production. In Proceedings of the 4th International Youth Conference on Radio Electronics, Electrical and Power Engineering, REEPE, Moscow, Russia, 17–19 March 2022. [Google Scholar] [CrossRef]
  38. Genbach, A.A.; Bondartsev, D.Y.; Iliev, I.K. Modelling of capillary coatings and heat exchange surfaces of elements of thermal power plants. Bulg. Chem. Commun. 2018, 50, 133–139. [Google Scholar]
  39. Genbach, A.A.; Bondartsev, D.Y.; Iliev, I.K.; Georgiev, A.G. Scientific method of creation of ecologically clean capillary-porous systems of cooling of power equipment elements of power plants on the example of gas turbines. Energy 2020, 199, 117458. [Google Scholar] [CrossRef]
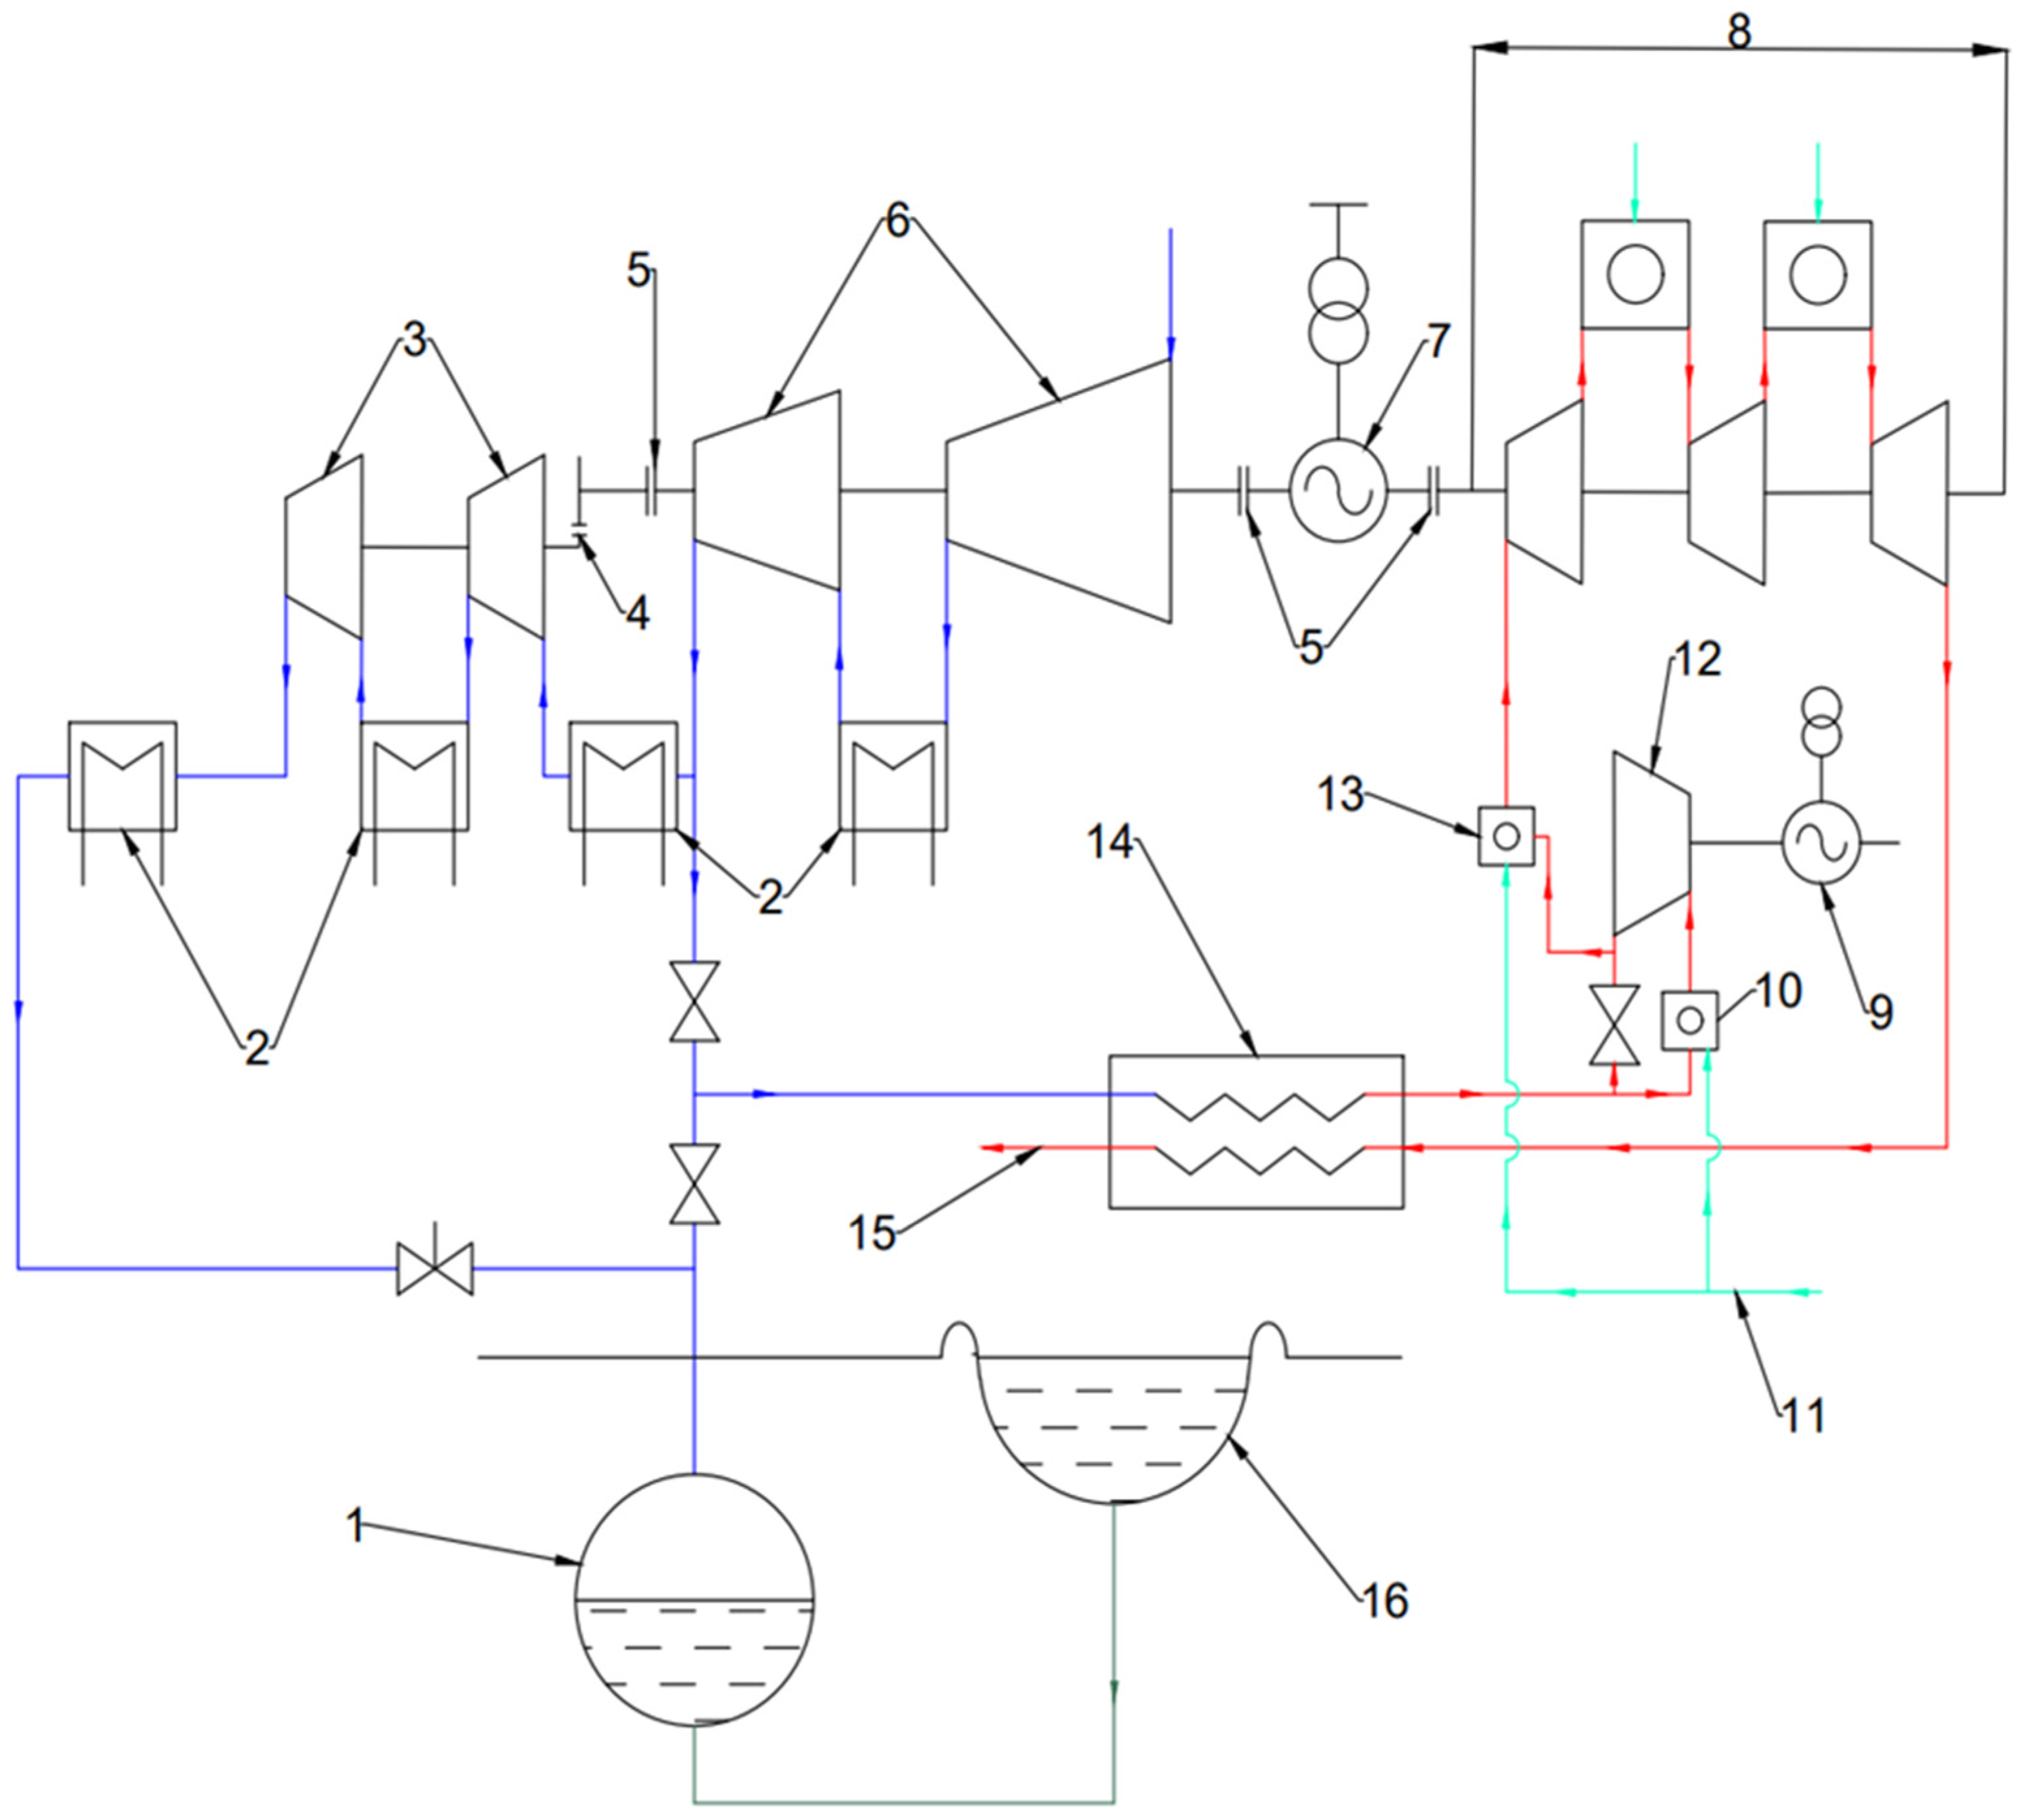
Figure 1. Technological scheme of CAES UT: 1—compressed air storage, 2—air coolers, 3—high-pressure compressors, 4—gear box, 5—flexible couplin g, 6—low-pressure compressors, 7—electric generator/motor, 8—low-pressure turbines, 9—electric generator, 10—high-pressure combustion chamber, 11—fuel pipeline, 12—high-pressure turbines, 13—low-pressure combustion chamber, 14—regenerator, 15—flue gas pipeline, and 16—pond, light green line—fuel, blue/red line—air in compressor/turbine unit, dark green light—water.
Energies 17 00518 g001
Figure 2. Technological scheme of CAES Matagorda: 1—compressed air storage, 2—adjustable hydraulic coupling, 3—cooling tower, 4—air cooler, 5—high-pressure compressor, 6—medium-pressure compressor, 7—air intercooler, 8—electric motor, 9—low-pressure compressor, 10—water pump, 11—electric generator, 12—high-pressure turbine, 13—low-pressure turbine, 14—high-pressure combustion chamber, 15—low-pressure combustion chamber, 16—fuel pipeline, and 17—regenerator, light green line—fuel, blue/red line—air in compressor/turbine unit, dark green light—water.
Energies 17 00518 g002
Figure 3. Technological scheme of CAES SENECA-1A: 1—compressors, 2—air coolers, 3—adjustable hydraulic coupling, 4.1—electric motor, 4.2—electric generator, 5—compressed air storage, 6—throttle, 7—regenerator, 8.1—high–pressure combustion chamber, 8.2—low-pressure combustion chamber, 9—high-pressure turbine, and 10—low-pressure turbine, light green line—fuel, blue/red line—air in compressor/turbine unit.
Energies 17 00518 g003
Figure 4. Power-to-gas flow diagram.
Energies 17 00518 g004
Figure 5. Simple hybrid energy storage system.
Energies 17 00518 g005
Figure 6. Regenerated hybrid energy storage system.
Energies 17 00518 g006
Figure 7. Hybrid energy storage system with regeneration, intercooled compression, and reheated expansion.
Energies 17 00518 g007
Figure 8. Block diagram of CAES SENECA-1A in the ASPEN HYSYS V10.0 computer program.
Energies 17 00518 g008
Figure 9. Effect of air temperature after regeneration on turbine power for CAES SENECA-1A.
Energies 17 00518 g009
Figure 10. (a) High-pressure turbine, (b) Low-pressure turbine.
Energies 17 00518 g010aEnergies 17 00518 g010b
Table 1. Technical parameters of different D-CAES.
Parameter/CAESHuntorfMcIntoshUTMatagordaSeneca
StatusIn operationIn operationProjectProjectProject
Charging time, hours88-88
Discharge time, hours28201610
Total turbine power290110250135214
Total compressor power6050203- *184
Outlet pressure of low-pressure compressor, bar6- *16- *46.9
Outlet pressure of high-pressure compressor, bar606067.564103.4
Airflow through compressors, kg/s10891- *- *270
Inlet pressure of high-pressure turbine, bar4342664973
The inlet temperature of high-pressure turbine, °C550540540- *620
Flow through one high-pressure turbine, kg/s417155- *185136
Inlet pressure of low-pressure turbine, bar111511- *18
The inlet temperature of the low-pressure turbine, °C8258701095- *850
Exhaust gas temperature, °C390370- *- *447
Heat regenerationnoyesyesyesyes
*- data is not available in open-access.
Table 2. Technical parameters of the CAES SENECA-1A.
ParameterUnitsValue
Total compressor powerMW184
Airflow through compressorskg/s270
Estimated storage capacitym3450,000
Estimated storage temperature°C35
Maximum storage pressurebar103
Total turbine powerMW214
Flow rate through one high-pressure turbine for natural gas/hydrogenkg/s136/135.4
Flow through one low-pressure turbine for natural gas/hydrogenkg/s137.5/136.0
Inlet pressure of high-pressure turbinebar75
Inlet pressure of low-pressure turbinebar20
Full charge/discharge periodh12
Total consumption of natural gas/hydrogenkg/s5.0/2.0
Carbon dioxide emissions for natural gas/hydrogenkg/s8.8/0.0
Water vapor emission for natural gas/hydrogenkg/s17.6/27.4
Exhaust gas temperature°C447
Efficiency%62.1
Table 3. Technical parameters of the CAES SENECA-1A in D-CAES and A-CAES mode.
ParameterUnitsD-CAESA-CAES
Total consumption of natural gas/hydrogenkg/s5.0/2.00.0
Carbon dioxide emissions for natural gas/hydrogenkg/s8.8/0.00.0
Water vapor emission for natural gas/hydrogenkg/s17.6/27.40.0
Total compressor powerMW184184
Airflow through compressorskg/s270270
Total turbine powerMW214131.6
Flow rate through one high-pressure turbine for natural gas/hydrogenkg/s136/135.4135.0
Flow through one low-pressure turbine for natural gas/hydrogenkg/s137.5/136.0135.0
Carbon dioxide emissions for natural gas/hydrogenkg/s8.8/0.00.0
Water vapor emission for natural gas/hydrogenkg/s17.6/27.40.0
Efficiency%62.171.5
Disclaimer/Publisher’s Note: The statements, opinions and data contained in all publications are solely those of the individual author(s) and contributor(s) and not of MDPI and/or the editor(s). MDPI and/or the editor(s) disclaim responsibility for any injury to people or property resulting from any ideas, methods, instructions or products referred to in the content.