Article

LPG, Gasoline, and Diesel Engines for Small Marine Vessels: A Comparative Analysis of Eco-Friendliness and Economic Feasibility

1
Division of Marine Engineering, Korea Maritime and Ocean University, Busan 49112, Republic of Korea
2
Interdisciplinary Major of Maritime and AI Convergence, Korea Maritime and Ocean University, Busan 49112, Republic of Korea
3
Division of Coast Guard, Mokpo National Maritime University, Mokpo 58628, Republic of Korea
4
Division of Marine System Engineering, Korea Maritime and Ocean University, Busan 49112, Republic of Korea
*
Author to whom correspondence should be addressed.
Energies 2024, 17(2), 450; https://doi.org/10.3390/en17020450
Submission received: 7 December 2023 / Revised: 6 January 2024 / Accepted: 15 January 2024 / Published: 17 January 2024
(This article belongs to the Special Issue Internal Combustion Engine Performance 2023)

Abstract

:
As an escalating global concern for environmentally sustainable marine fuels, liquefied petroleum gas (LPG) is attracting attention as an eco-friendly and economical alternative. This study explored LPG utilization in small marine vessels, focusing on its eco-friendliness and economic feasibility. To assess its environmental implications, the AVL FIRE simulation program was used to compare CO2, CO, NO, and soot emissions from LPG engines with those from conventional gasoline and diesel engines. The LPG engine model relied on data from a pioneering type-approved experimental LPG engine designed for small South Korean marine vessels, while parameters for gasoline and diesel engines were adjusted to suit their distinctive features. Regarding long-term economic feasibility, assuming a 30-year ship lifespan, incorporating 2022 annual average prices, average annual price growth rates, and annual fuel consumption data of each fuel, results indicate that LPG engines exhibited lower CO2, CO, NO, and soot emissions than conventional engines, except that NO emissions were higher than gasoline engines. Evaluating LPG’s economic feasibility over a 30-year ship life cycle for an individual vessel revealed varying fuel cost savings, with the greatest savings observed in gasoline–other (KRW 2220.7 million) and the least in gasoline–coastal (KRW 1152.5 million). These findings offer vital insights for ship operators and policymakers seeking a balance between eco-friendliness and cost-effectiveness, as well as LPG engine technology emerging as pivotal for a sustainable future, harmonizing environmental protection and economic viability.

1. Introduction

With growing concerns over environmental issues and energy efficiency, there is a heightened interest in environmentally friendly fuels. Currently, liquefied petroleum gas (LPG) is employed globally for various applications such as transportation and heating [1,2,3,4,5]. As LPG is an eco-friendly and cost-effective fuel, its application in various fields has been explored, notably in automotive engines [6,7,8,9,10]. Despite these advantages, a significant gap persists in comprehensive research on the feasibility and potential of marine LPG engines, particularly in assessing their eco-friendliness and economic feasibility. This study aims to address this gap by focusing on the eco-friendliness and economic feasibility of marine LPG engines, representing the first consideration for the type approval of small ships in South Korea.
LPG, classified as a fossil fuel, comprises gases produced in the extraction and refining of natural gas and crude oil. With a carbon count as low as that of liquefied natural gas (LNG), LPG serves as an environmentally friendly alternative, contributing to the mitigation of air pollution and greenhouse gas (GHG) emissions and exhibiting better performance compared to LNG [11,12]. Moreover, from an economic standpoint, LPG is more efficient than gasoline or diesel in alleviating the financial burden on users by reducing fuel costs [13,14].
In contrast to the extensive LPG research in terrestrial applications, a notable research gap exists concerning its utilization in marine environments. While previous studies explored the potential of LPG as a marine fuel, this investigation focused on assessing the adaptability of conventional vehicle LPG engine technologies for larger marine engines [15]. Although the integration of an LPG engine as a generator for electric propulsion ships has been reported in a study, its primary focus was on the application of LPG in the context of environmentally friendly propulsion methods [16]. Additionally, the economic and environmental benefits of employing LPG as a marine fuel have been explored; however, the research was limited by its lack of long-term perspectives for drawing conclusions [17]. The aim of this current study is to determine the eco-friendliness and economic feasibility of LPG engines by addressing the shortcomings of prior research.
The eco-friendliness assessment of LPG entailed a comparative analysis of its exhaust emissions with those of gasoline and diesel engines, which are commonly used in small fishing boats. Although previous studies have compared the exhaust emissions of LPG engines with those of either gasoline or diesel engines, they often focused solely on vehicle engines and lacked a simultaneous comparison of all three engine types [18,19]. This study addresses these limitations and conducts a comprehensive comparison of CO2, CO, NO, and soot emissions from marine LPG, gasoline, and diesel engines. This analysis is based on the AVL FIRE simulation program, which is a reliable tool validated in various studies [20,21,22,23,24]. The modeling of the simulated LPG engine, that is, the reference engine model in this study, is conducted based on the information of the marine LPG engine, which is the first candidate for type approval for small ships in Korea. The modeling of the gasoline and diesel engines involved minimal adjustments or additions to the parameters to align with the unique characteristics of each engine from the simulated LPG engine.
The economic feasibility of LPG involves utilizing standard prices for LPG, gasoline, and diesel, along with data on annual fuel consumption and the average annual price growth rate of each fuel. Existing studies on the economic feasibility of LPG often fall short of focusing on marine applications or considering a long-term perspective [8,13,14,17,25]. To address these limitations, this study seeks to ascertain the long-term economic feasibility of LPG through a comparative analysis of a ship’s anticipated 30-year lifecycle. Furthermore, considering the variable annual operation hours and engine load of small fishing boats based on engine types and fishing zones, this study classified existing fishing vessels equipped with gasoline and diesel engines by fishing zone. Subsequently, assuming the conversion of the conventional engines to LPG engines for vessels classified by engine types and fishing zones enables the comparison of the fuel costs.
To achieve the goal of eco-friendliness of LPG, Section 2 compares the exhaust emissions of three engines through a simulation. This involves the modeling of a simulated LPG engine, validation through a comparison of the simulated LPG engine with experimental results, and simulation modeling of gasoline and diesel engines, followed by a comparative analysis of the exhaust emission outcomes from each simulated engine. In Section 3, to achieve the goal of economic feasibility of LPG, a comparison of fuel costs for the three engines is conducted over a 30-year ship life cycle, encompassing standard fuel prices, annual fuel consumption based on engine types and fishing zones, and the average annual price growth rate of the fuel. This section presents the fuel cost outcomes corresponding to the utilization of each engine by fishing zone. Section 4 presents the comprehensive conclusions drawn from this study. This study emphasized the importance of adopting LPG engines for small ships in terms of both eco-friendliness and economic feasibility, underscoring LPG engine technology as a pivotal solution for fostering a sustainable future.

2. Eco-Friendliness of LPG Engine

LPG engines have gained recognition as environmentally friendly alternatives, showcasing reduced exhaust emissions compared to gasoline and diesel engines, and have been employed in terrestrial applications for several decades. To verify the eco-friendliness of LPG engines, this study modeled a simulated LPG engine based on a single-cylinder output under 100% load conditions of an experimental LPG engine (38.8 kW based on the indicated power). Simultaneously, models of gasoline and diesel engines with the same output were generated, and a comparative analysis of exhaust emissions was conducted through modeling.

2.1. Experiment Set-Up

The experimental LPG engine was a Hyundai Motor C6AF model engine, as shown in Table 1, indicating the LPG engine specifications used in the experiment.
Various measurement instruments were employed to gather operational data from the experimental LPG engine to facilitate the measurement and analysis of its characteristics, performance, and exhaust gas emissions. Figure 1 illustrates a block diagram of the installed experimental measurement instruments.

2.2. Numerical Set-Up

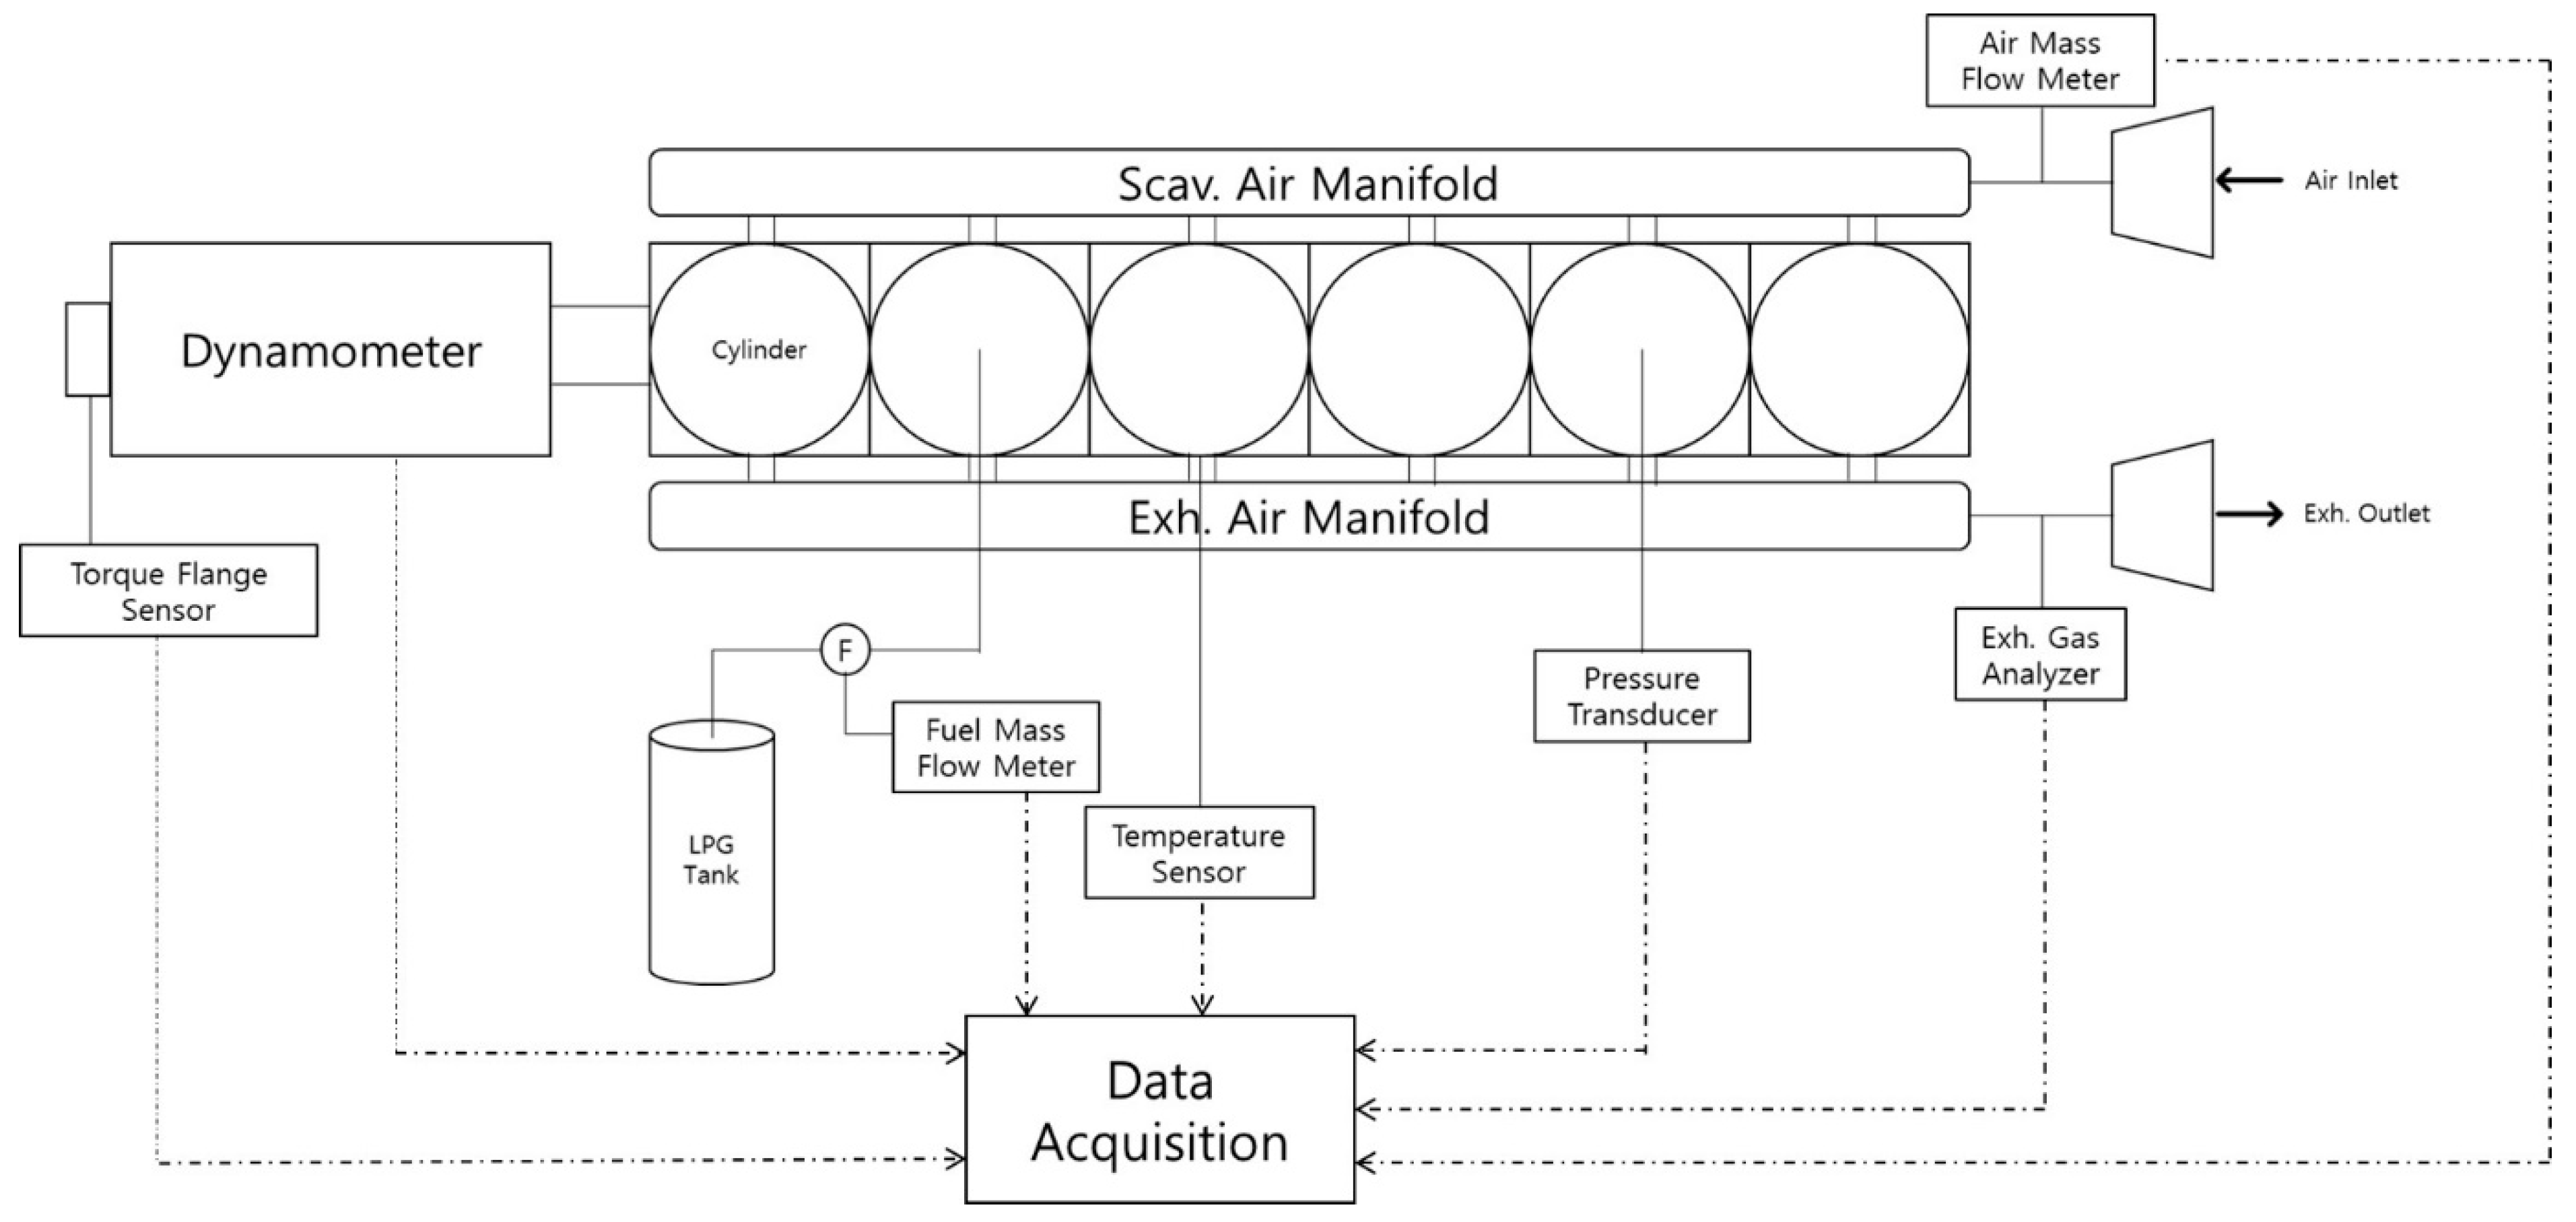
In this study, the AVL FIRE ESE program was used for simulations to validate the eco-friendliness of LPG engines through a comparative analysis of exhaust emissions from gasoline and diesel engines. AVL FIRE ESE (2022 R1) is specialized software dedicated to modeling and simulating engine performance, combustion, and emission characteristics. It replicates a range of physical phenomena, including heat, flow, chemical reactions, and combustion processes, occurring within the engine, while predicting both engine performance and emission characteristics. Moreover, this program saves time and cost in the design process by predicting minute phenomena inside the engine that cannot be obtained experimentally, thereby aiding in engine optimization, performance enhancement, and compliance with emission standards. Furthermore, this software enables the prediction and analysis of engine operations using several modeling techniques employed in the simulation of various types of four-stroke engines. For an accurate prediction and analysis, establishing a simulation engine is essential to replicate the characteristics of the experimental engine.
Various information is required to configure the simulation engine, including geometric information, boundary conditions, initial conditions, and numerical models. Geometric information encompasses crucial data influencing engine operation, performance, durability, and thermal and fluid characteristics. This includes specifics, such as the shape and size of the piston and the location of the spark plug or injector. As it is desirable to use experimental information if an experimental engine is presented, the LPG simulation engine has been modeled using the geometric information of the experimental LPG engine. Table 2 lists the geometric information used to simulate the LPG engine modeling.
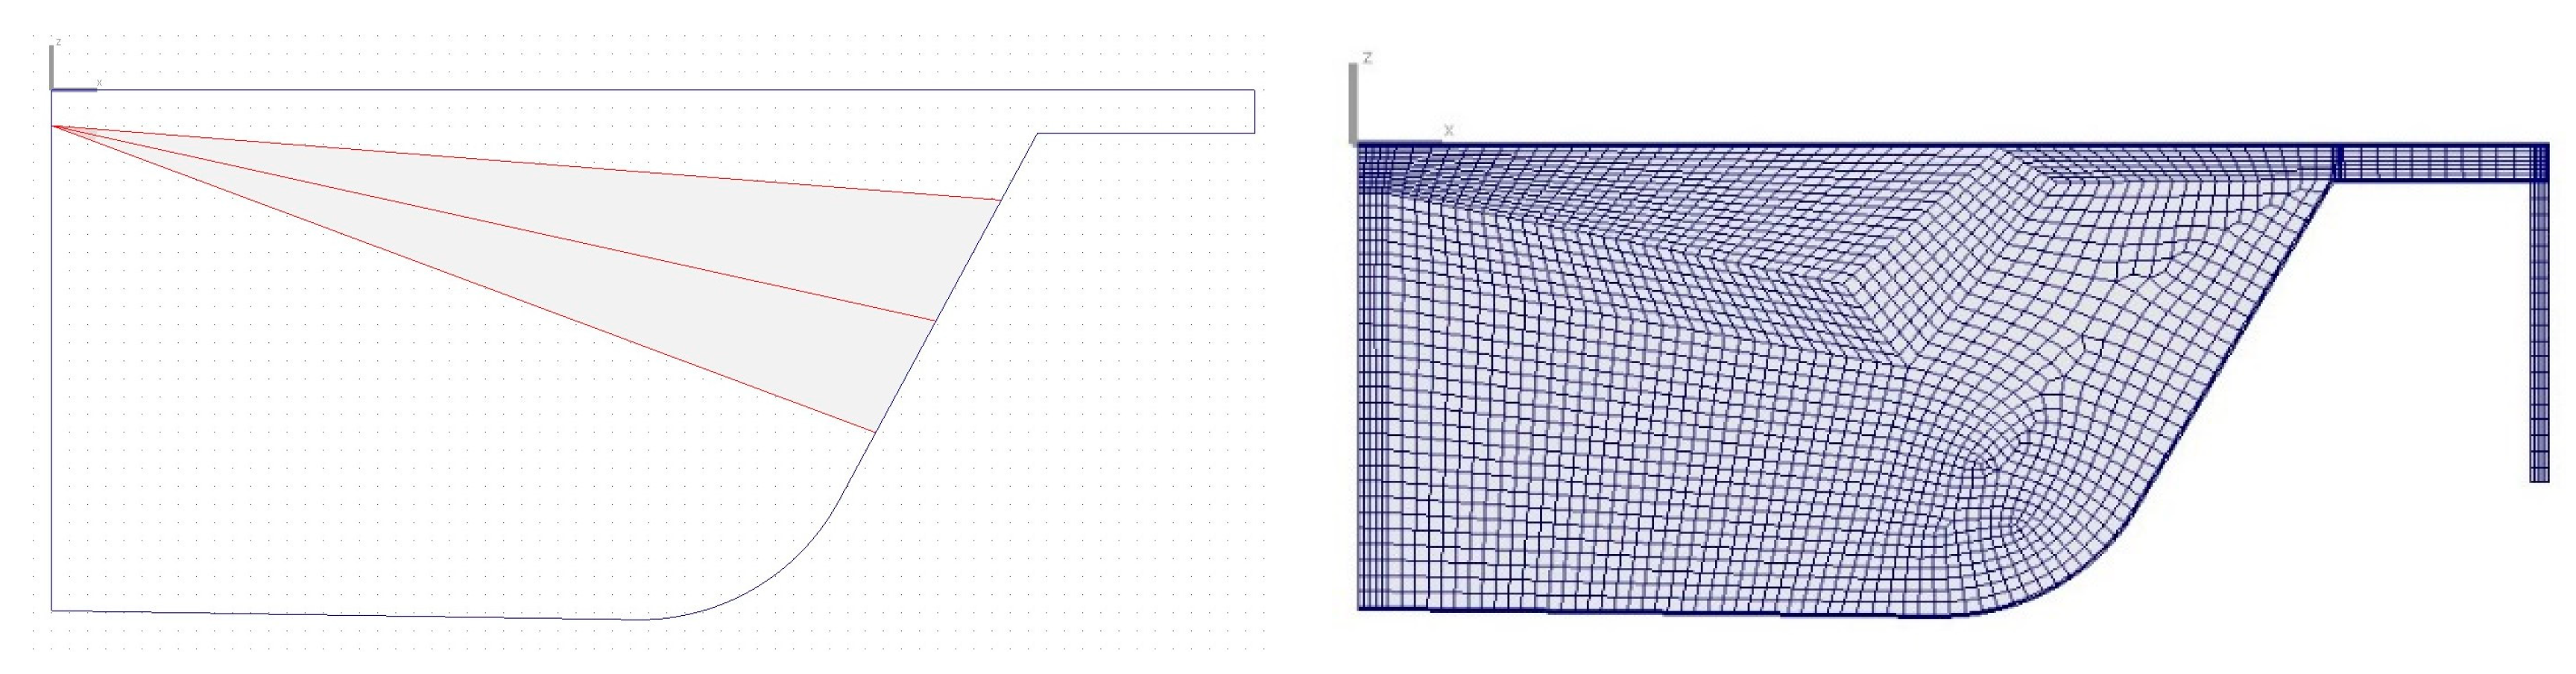
The modeling of simulation engines utilizing geometric information primarily relies on three-dimensional (3D) computer-aided design (CAD) modeling of the engine and its adjacent components. This includes the size, shape, and location of the engine components. AVL FIRE ESE can directly load the shapes of the pistons and injectors in various forms, and users can model the actual engine shape accordingly by adding or modifying detailed information pertaining to the engine components within the loaded model. Figure 2 illustrates the two-dimensional (2D) piston shape of the LPG engine modeled using AVL FIRE ESE.
Boundary conditions play an important role in controlling the behavior of the simulation model and defining the interaction between the modeling domain and the external environment. The boundary conditions required for the engine simulation are related to the main components that form the boundaries of the combustion process within the cylinder: the piston, cylinder liner, and cylinder head. These boundary conditions ensure the accuracy of the simulation and the validity of the results and are essential for modeling and predicting LPG engine operation. The boundary conditions for the simulation LPG engine modeling have been used in the experimental engine information, and Table 3 indicates the type and input value of boundary conditions.
The initial condition is important information that defines the initial state of the simulation model and affects the accuracy of the simulation and the reliability of the results. The initial conditions for the engine simulation include variables such as cylinder supply air pressure and temperature, opening and closing timing of the intake and exhaust valves, ignition timing, and amount of fuel supplied to the cylinder. A precise setting of the initial conditions is important for ensuring the accuracy, predictability, stability, and reliability of the results and optimization of the design of the simulation model. The initial conditions for the simulation LPG engine modeling have been used in the experimental engine, and Table 4 represents the initial conditions and their input value.
To conduct engine simulations using AVL FIRE ESE, various models must be accurately defined; these include turbulence, combustion, NOX emissions, soot, ignition, and atomization models.
The selection of a turbulence model is significant for ensuring precise outcomes because the fluid flow within an engine cylinder during simulation is inherently irregular and challenging to predict. Among the turbulence models available in AVL FIRE ESE, this study used the k-ζ-f model. This model, grounded in the Reynolds-averaged Navier (RANS) equation, is an improved model that obtains more accurate results near walls [26]. This model demonstrates accuracy even in scenarios with high Reynolds numbers, such as fast flows, and offers the advantage of applicability even at extremely low turbulence numbers. In particular, it has the advantage of being more robust and less sensitive in calculating turbulence effects near walls with high non-uniformity. Considering these merits, it was employed to predict the turbulence, dispersion, turbulence energy loss, and turbulence resistance generated at the wall.
Given that the combustion model can forecast post-combustion attributes, including the type and concentration of chemicals produced throughout the combustion process as well as factors such as heat, pressure, and noise, the program seeks to simulate the combustion process occurring within the engine by incorporating diverse chemical reaction equations and combustion mechanisms. This study employed the Extended Coherent Flame Model-3 Zones (ECFM-3Z) among the five Coherent Flame Model (CFM) from the combustion models available in the AVL FIRE ESE [27]. This model distinguishes itself by partitioning the combustion zone into pre-flame, flame, and post-flame zones and applying distinct combustion reaction rates to each zone. Owing to the different reaction rates in each zone, the speed and nature of the combustion are more realistic and enhance the overall precision of the simulation results.
The NOX emission model in the simulation program is a crucial element in the combustion process since NOX is generated through the reaction of atmospheric nitrogen and oxygen during high-temperature combustion. Its production is contingent upon combustion environmental conditions, such as fuel type, fuel injection timing, chemical reactions, and airflow, and these conditions are subject to change. In this study, the Extended Zeldovich model was employed as the NOX emission model [28,29,30]. This model overcomes the disadvantage of being unable to accurately calculate NOX production because of the lack of oxygen in a rich combustion environment. Furthermore, the model incorporates advanced functionalities, including the generation and depletion of NOX, the reaction of NOX with oxygen, and chemical decomposition.
Soot is a byproduct of combustion and is generated as a result of incomplete combustion in engines. It is classified as an air pollutant and is recognized as an important factor in modeling simulation engines in that it affects engine performance and durability. Although various soot models exist for predicting the total mass, size distribution, and composition generated during the fuel injection and combustion processes, this study employed the kinetic model [28,29]. The kinetic model involves four steps, involving the calculation of the reaction thermodynamics and particle motion to estimate the size distribution and transport speed of the generated soot particles. This model considers various chemical reactions depending on the engine operating conditions and can accurately model the amount and characteristics of emissions by efficiently calculating and estimating all the chemical reactions, particle growth, and particle combustion processes.
The ignition model, which is crucially dependent on fuel characteristics, plays a significant role in modeling the simulations. In this study, a spark-ignition model was used to simulate an LPG engine. This model replicates the process through which a spark plug initiates a flame within a compressed cylinder containing a fuel–air mixture. Moreover, by considering various parameters, the shape, density, and temperature of the flame are predicted, and the combustion characteristics and performance of the fuel are analyzed.
The atomization model of AVL FIRE ESE includes breakup, evaporation, and droplet–wall interaction models. In this study, the wave, Dukowicz, and Walljet1 models were used for breakup, evaporation, and droplet–wall interactions, respectively [28,31]. The breakup is a model that explains the process of dispersing fuel particles into smaller fragments. The wave model, which is one of the breakup models, calculates and predicts the size, speed, and density of particles during the fuel injection process through detailed fuel particle modeling at the molecular level. The evaporation model predicts and explains how the atomized fuel particles are evaporated in fuel and air environments after injection. The Dukowicz model considers the heat and mass characteristics of the particles and predicts changes in the particle size, speed, and density, thereby enabling accurate modeling and prediction of the evaporation rate and particulate behavior. The Walljet1 model, one of the droplet–wall interaction models, forecasts particulate interactions with the engine wall. This model tracks and predicts particulate movement and distribution based on wall characteristics, thereby enabling collisions with or movement along the wall to be accurately modeled and predicted. Table 5 details the simulation models applied in this study.
To compare the exhaust emissions of LPG engines with gasoline and diesel engines using simulation, additional modeling for gasoline and diesel engines is required. In this study, LPG engine modeling parameters were used, except for the parameters that needed to be changed to suit the characteristics of gasoline and diesel engines. Since the gasoline engine is the same spark-ignition engine as the LPG engine, the LPG engine simulation modeling parameters were used, and only the equivalent ratio was changed for comparison under the same power conditions. For the diesel engine, the compression ratio, injection nozzle, ignition model, and fuel injection parameters were changed. The compression ratio was increased from 9.5:1, the LPG engine compression ratio, to 18.0:1. For the injector, the angle of the nozzle was set to 155°, and the number of nozzle holes was set to five [32,33,34]. The charging air pressure of a diesel engine can affect emission at the same power and is determined during the engine optimization process. Since the air intake pressure of the experimental LPG engine was 135 kPa, which is within the inlet manifold pressure range of 100 to 250 kPa for a typical turbocharged diesel engine, it was not considered a modified parameter. Additionally, the ignition model was changed from spark ignition to auto-ignition, and the fuel injection amount was adjusted for comparison under the same power conditions. Table 6 lists the modified parameters for gasoline and diesel engine modeling.
Additionally, revealing the properties of each fuel is essential for comparing the exhaust emissions of the fuels used in LPG, gasoline, and diesel engines. Table 7 presents the properties of the fuels used in this study.

2.3. Validation of Simulation Model and Mesh Independence Analysis

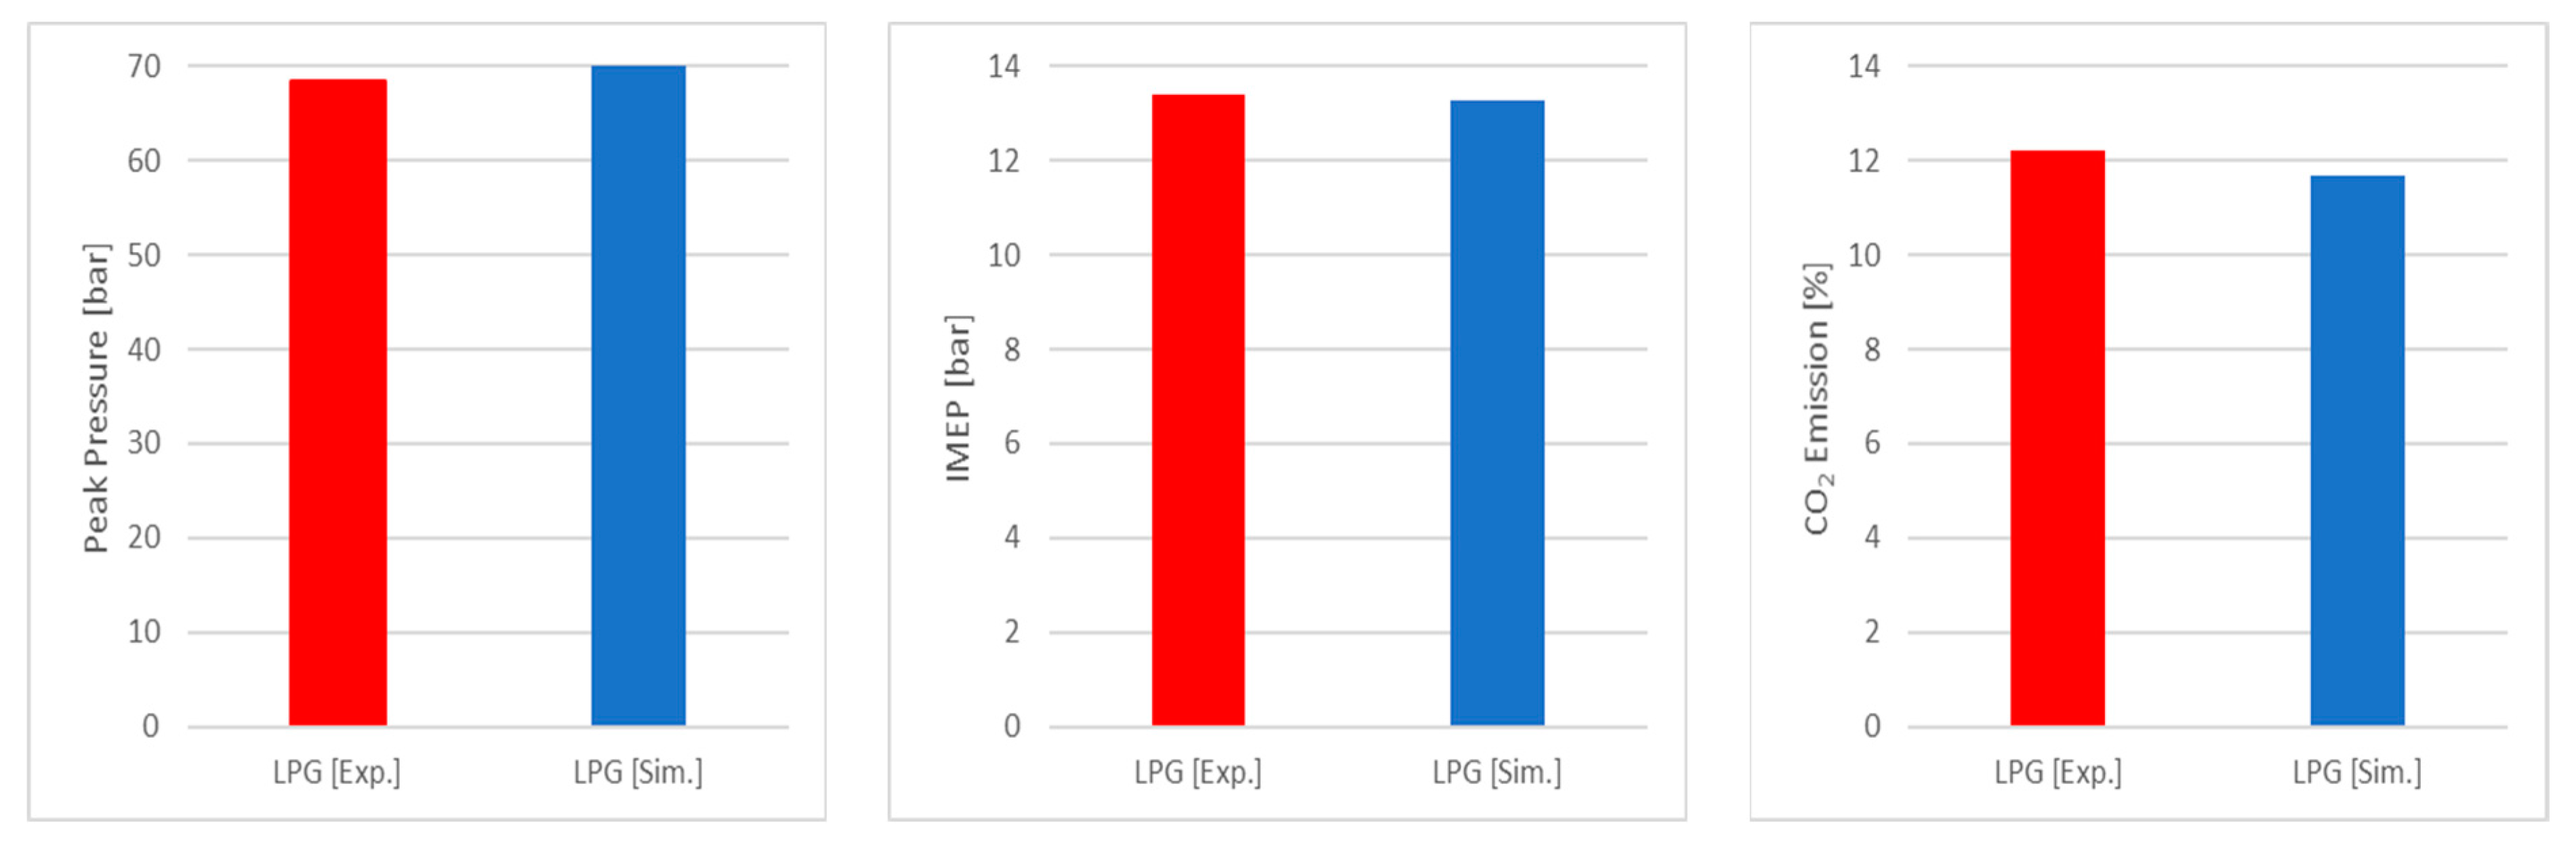
In this study, three parameters—maximum pressure, indicated mean effective pressure (IMEP), and CO2—were compared between the experimental and simulation results to verify the accuracy and reliability of the simulation LPG model. This aimed to use the validated simulation LPG engine to assess the exhaust emissions comparison with gasoline and diesel engines. NO emissions were excluded from the parameters because of the three-way catalyst device installed at the rear of the experimental engine exhaust. The results of the validation are shown in Figure 3 by comparing the experimental and simulation outcomes.
The comparison results show deviations of 3.6%, 0.7%, and 4.3% in the maximum pressure, IMEP, and CO
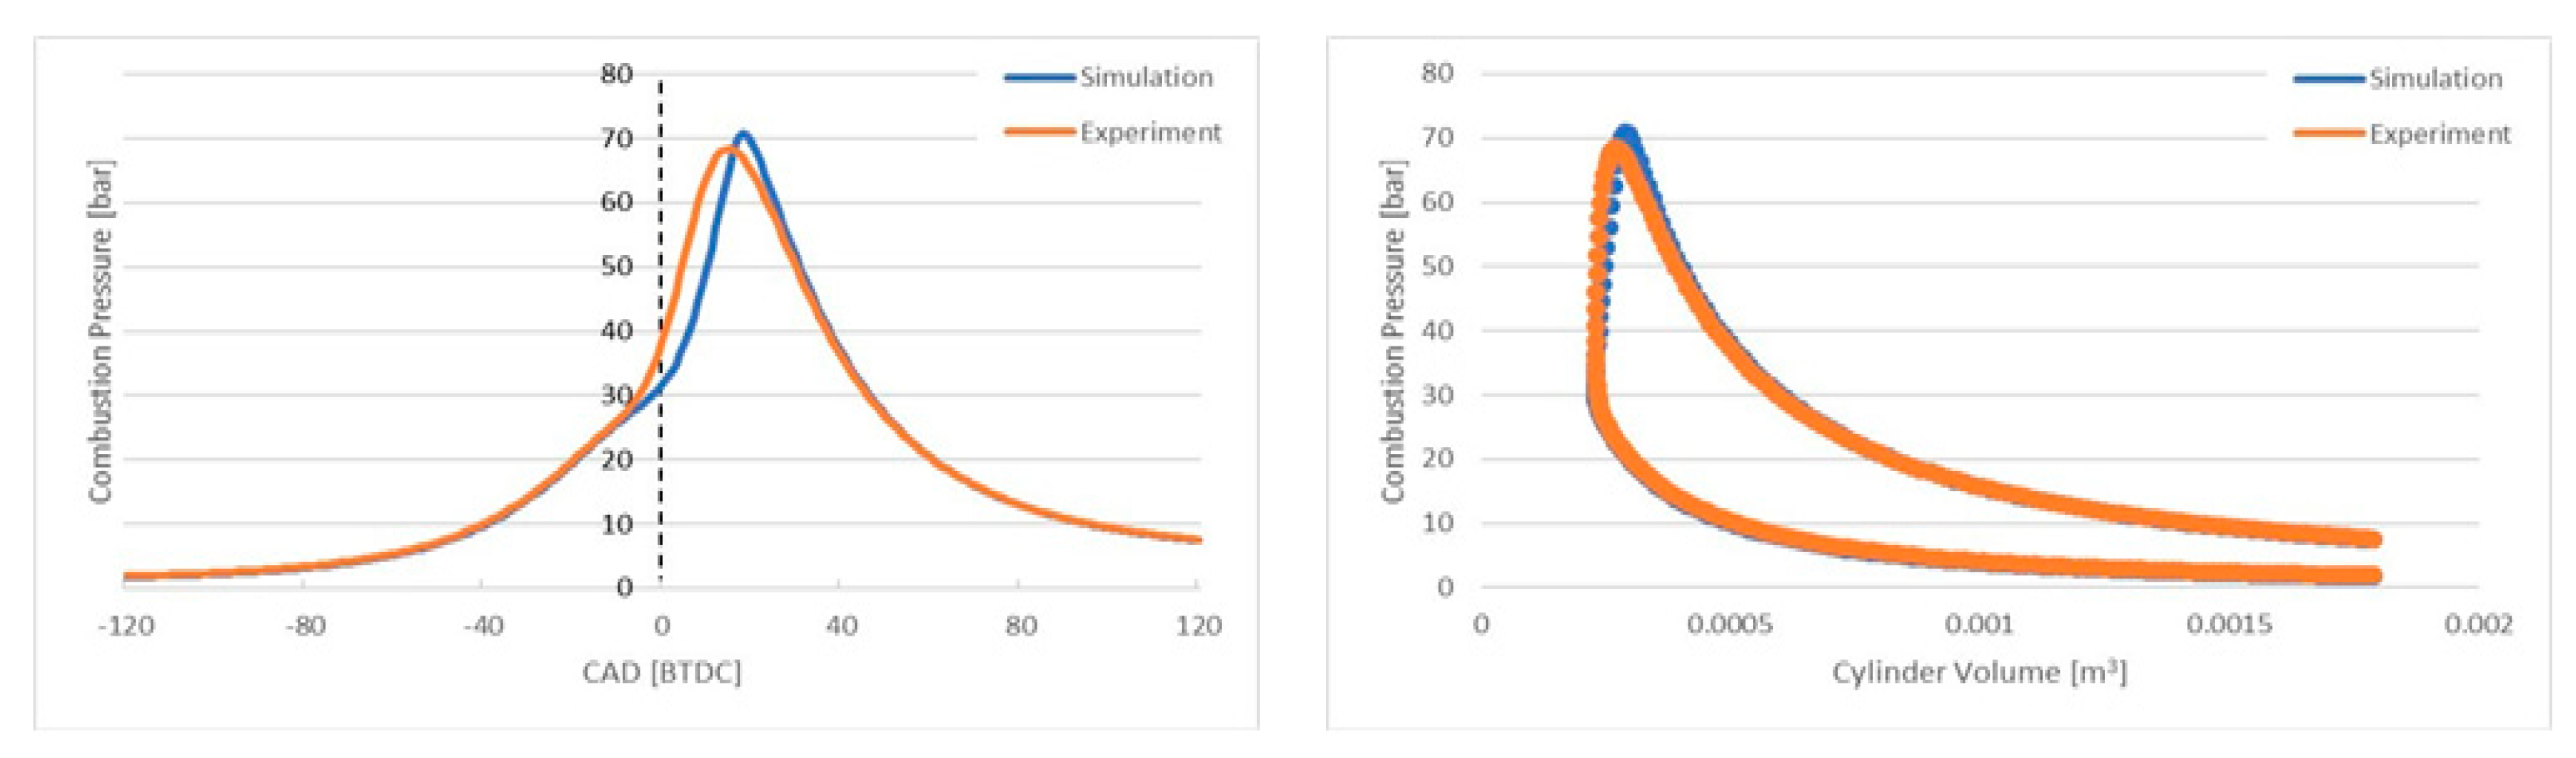
2 emissions, respectively. In addition, the overall operating state of the simulated LPG engine was verified using the P–θ and P–V diagrams. Figure 4 compares the P–θ and P–V diagrams of simulation and experiment.
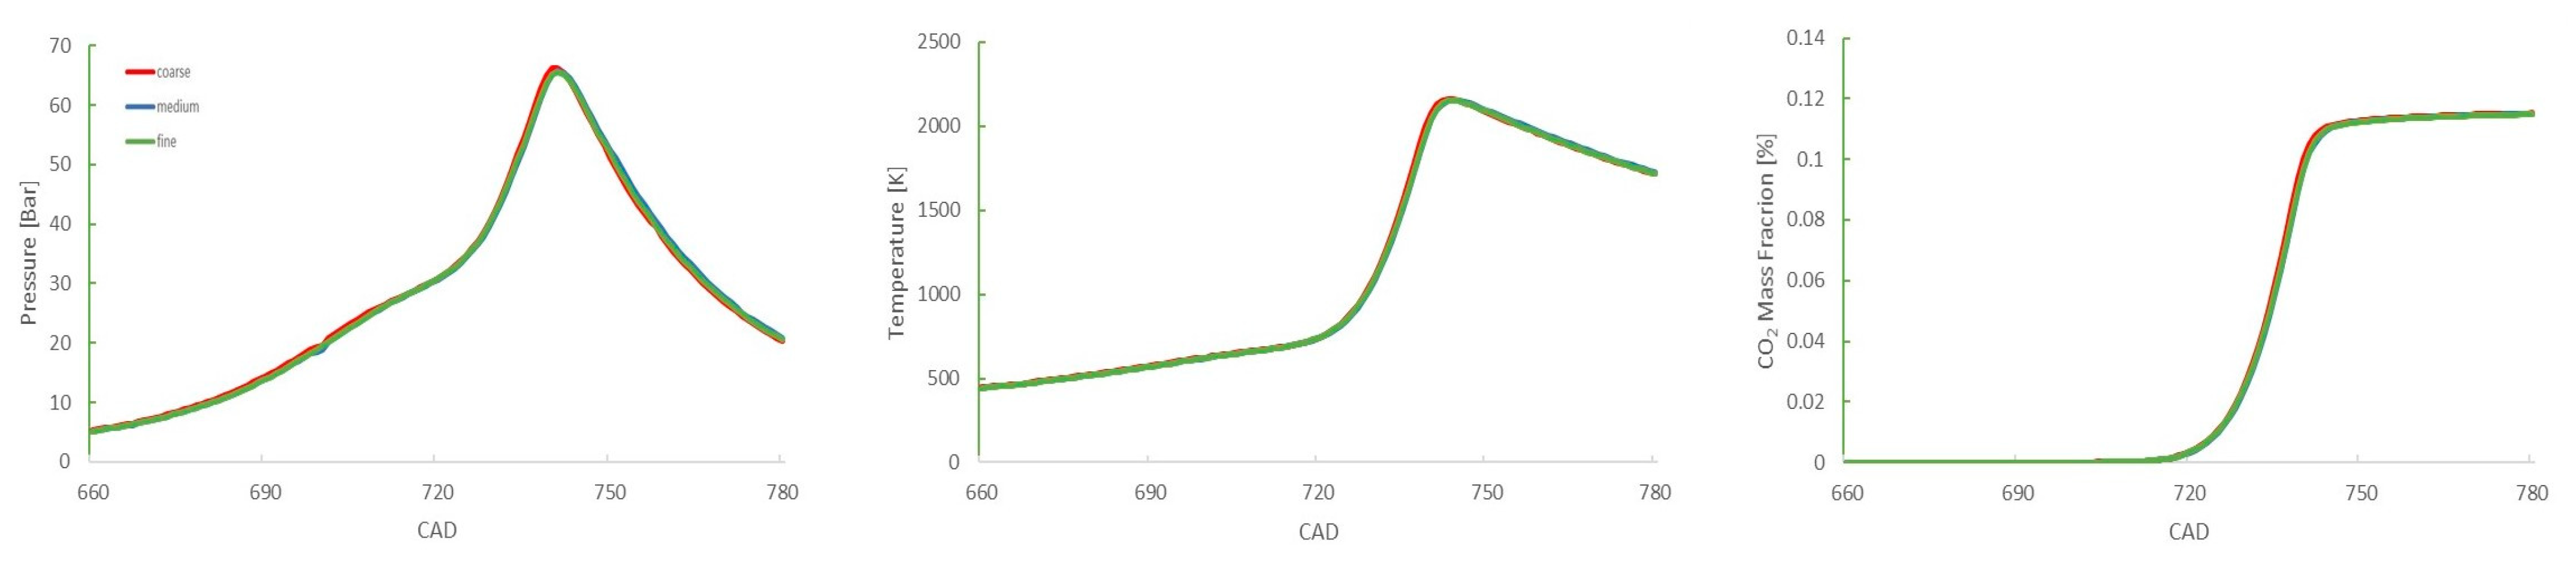
To implement the combustion chamber shape of the simulation engine as a 3D shape, a computational mesh must be created. When using a high-resolution mesh, the accuracy of the simulation results is high, but the calculation time increases, and vice versa. Therefore, a mesh independence analysis must be performed to ensure the accuracy of the simulation results and a reasonable calculation time. This strategy allows the selection of an appropriate mesh resolution that can calculate accurate simulation results in a short period. In this study, a mesh independence analysis was conducted considering three cases, wherein the cell size was altered by ±10%, with the intermediate mesh serving as a reference. Table 8 lists the mesh properties and calculation times for each mesh resolution and Figure 5 shows the mesh independence analysis results.
The mesh independence analysis of the simulation LPG engine using three mesh resolutions revealed that it does not depend on the mesh resolution. In this study, the intermediate mesh was selected for the simulation in that it provides independent calculation results using the mesh and has an appropriate density for good contour analysis in the next step, along with a reasonable time for the calculation process.

2.4. Results on Eco-Friendliness

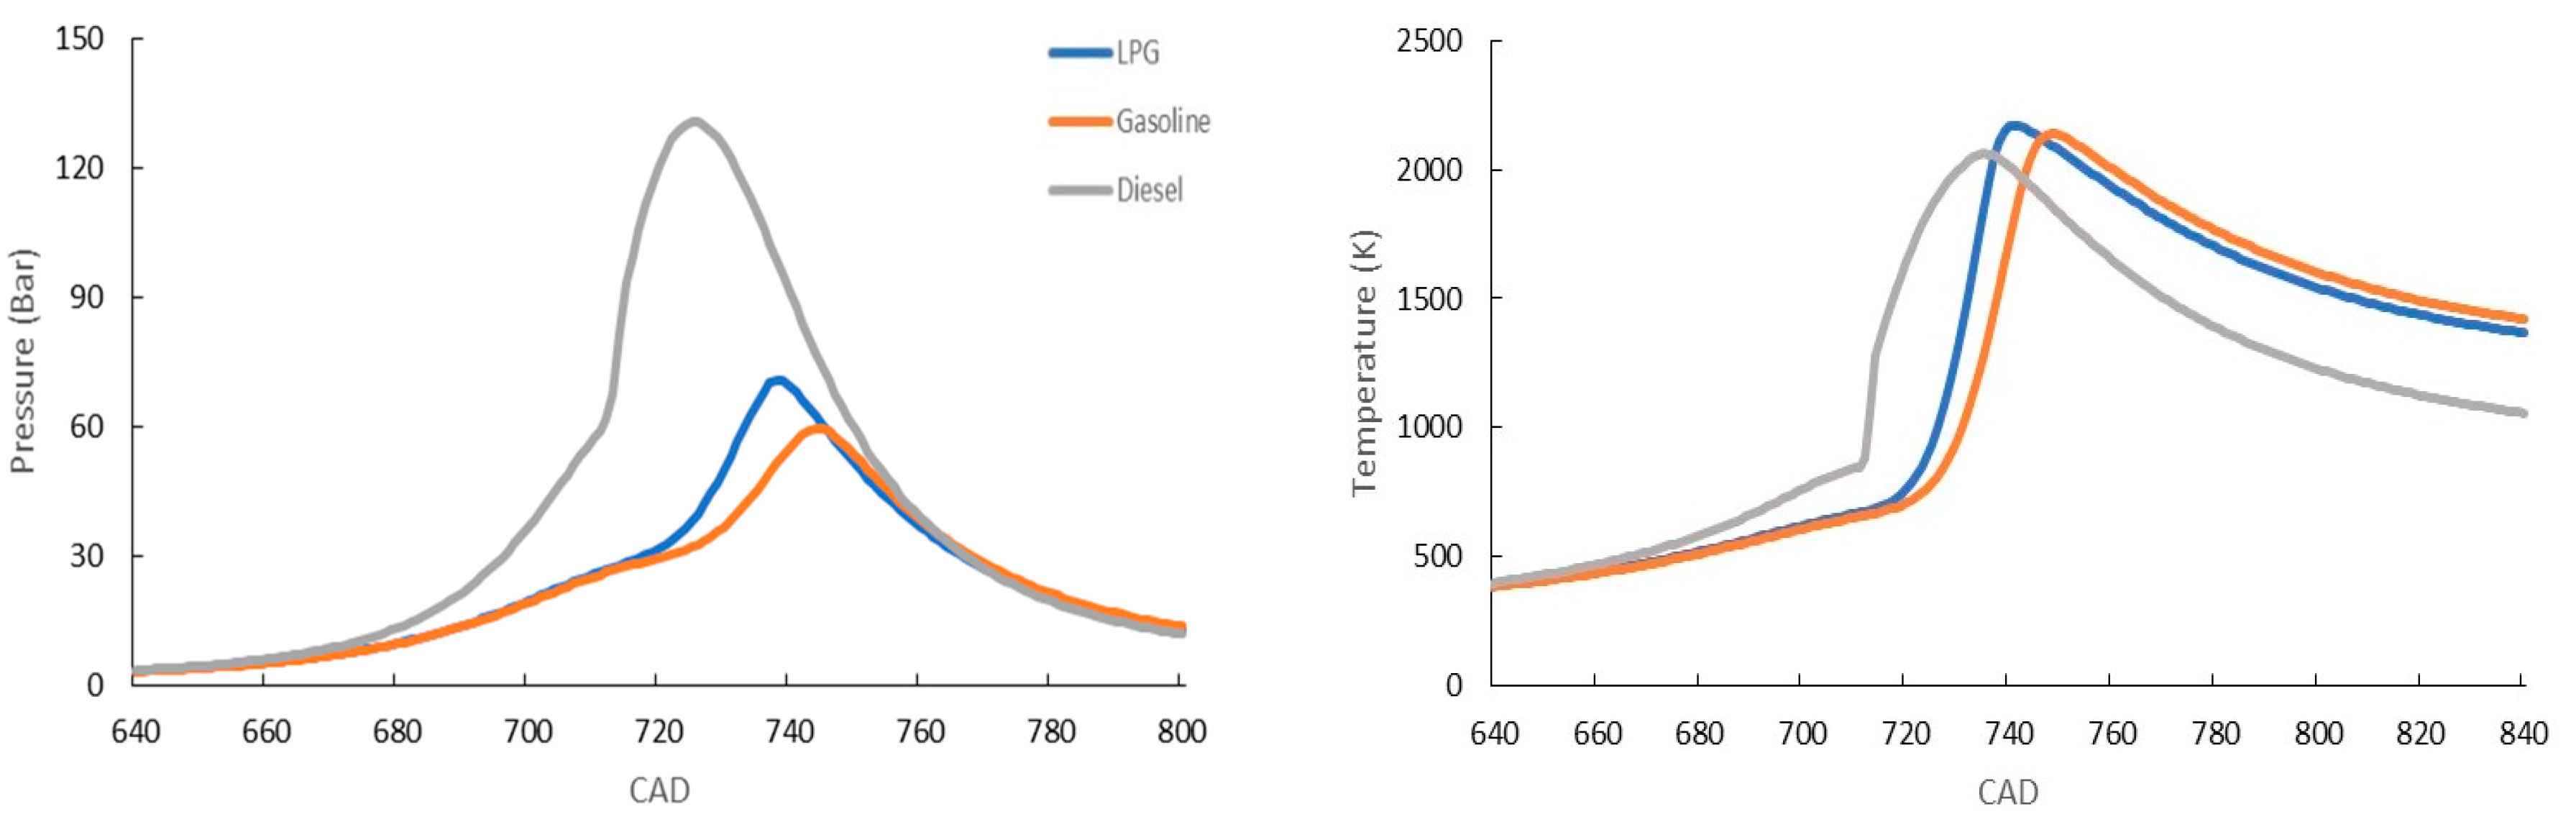
Since an engine’s emission is affected by cylinder pressure and temperature, comparing the cylinder pressure and temperature of each engine can be important prior to comparing the emission results. Figure 6 presents the comparison of cylinder pressure and temperature of LPG, gasoline, and diesel engines at the same output.
To assess the eco-friendliness of LPG engines, the CO2, CO, NO, and soot emissions of the simulation LPG, gasoline, and diesel engines were compared under the same output conditions. Table 9 presents the output (100% load), fuel consumption, mean mass per cycle of each engine, emission mass fraction of each engine, and the amount of emission in g/kWh of each engine.
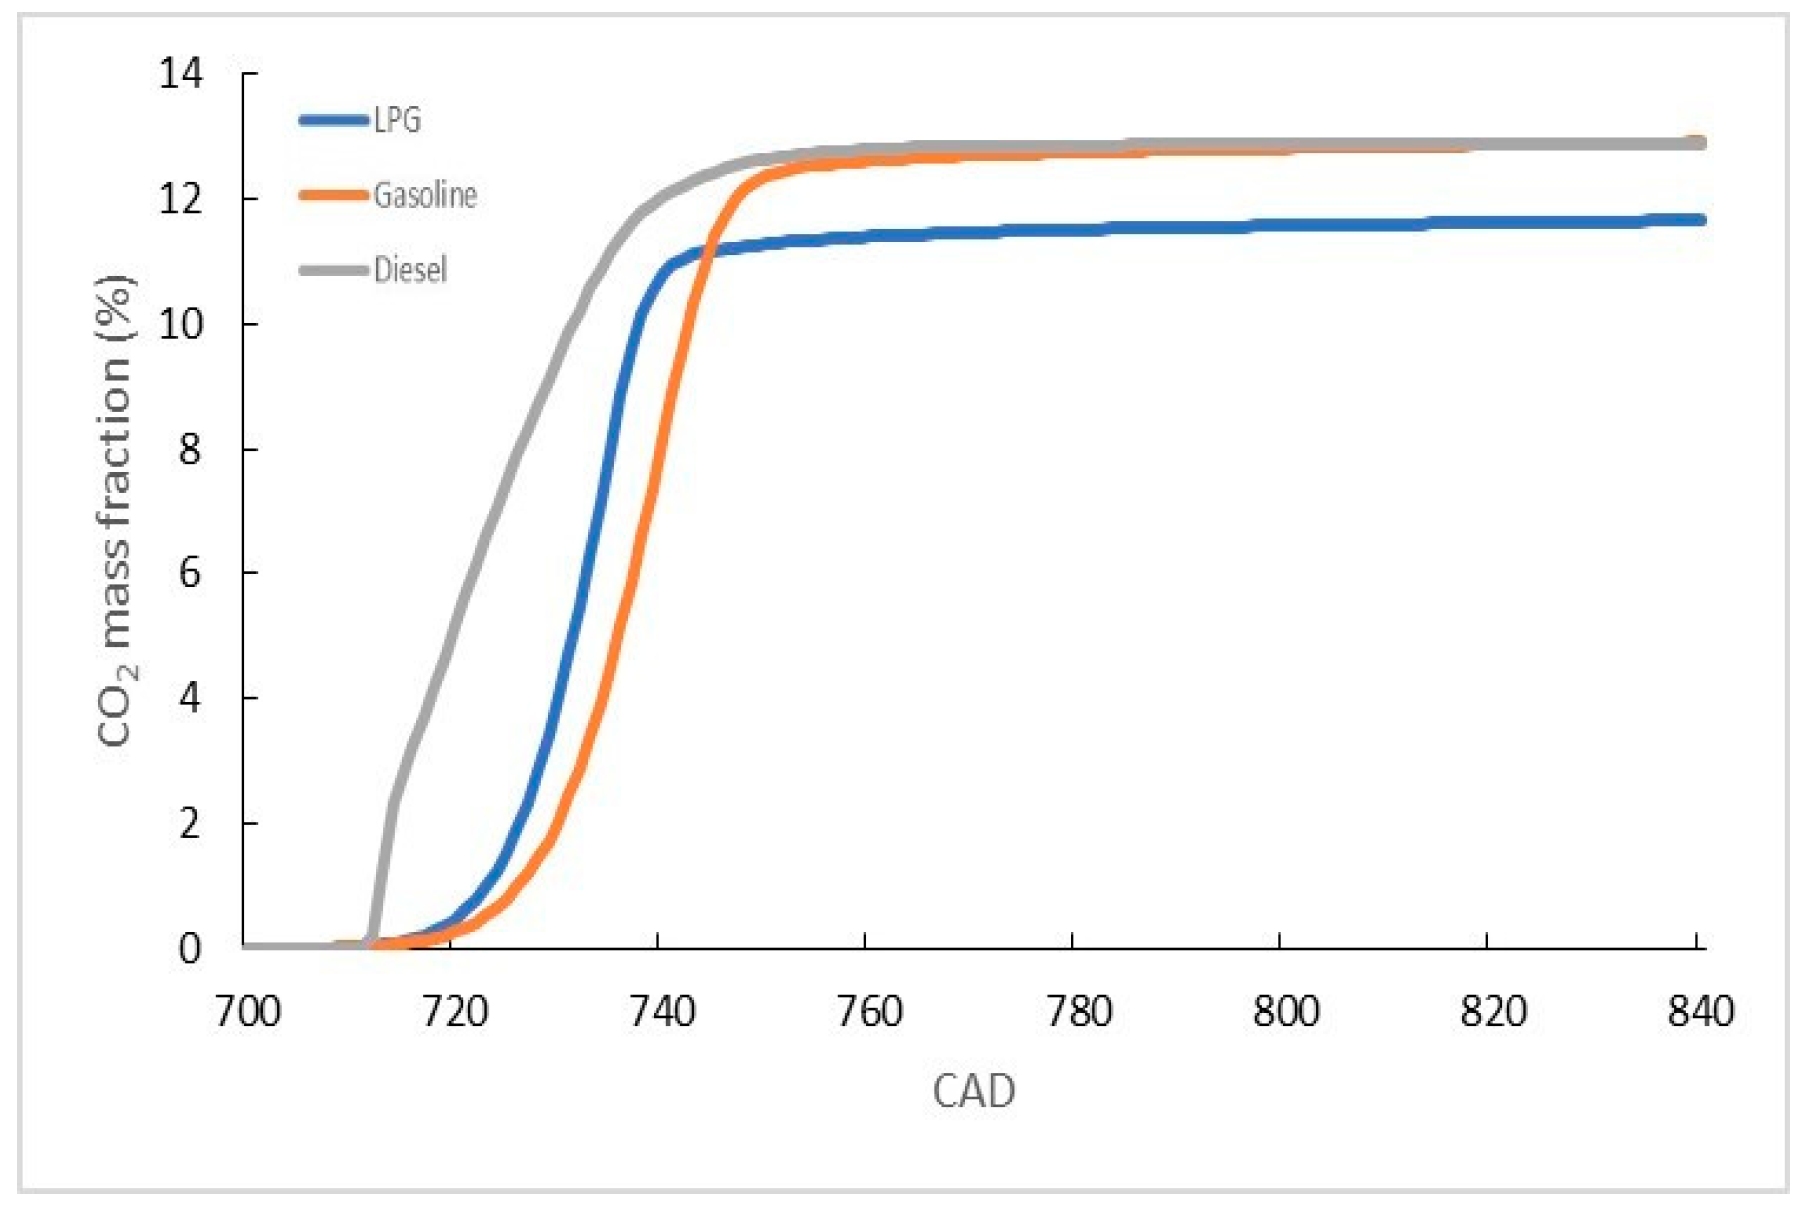
Figure 7 presents the comparison results of CO2 emissions at the same output.
CO2 emissions were similar for the gasoline and diesel engines, and the LPG engine showed 11.35% and 4.59% lower CO2 emissions compared to gasoline and diesel engines, respectively. CO2 is an air pollutant that causes GHG emissions, and massive efforts are underway to reduce emissions. Based on the CO2 emissions comparison results, the conversion of gasoline and diesel engines into LPG engines in small fishing boats can be considered an alternative for reducing GHG emissions.
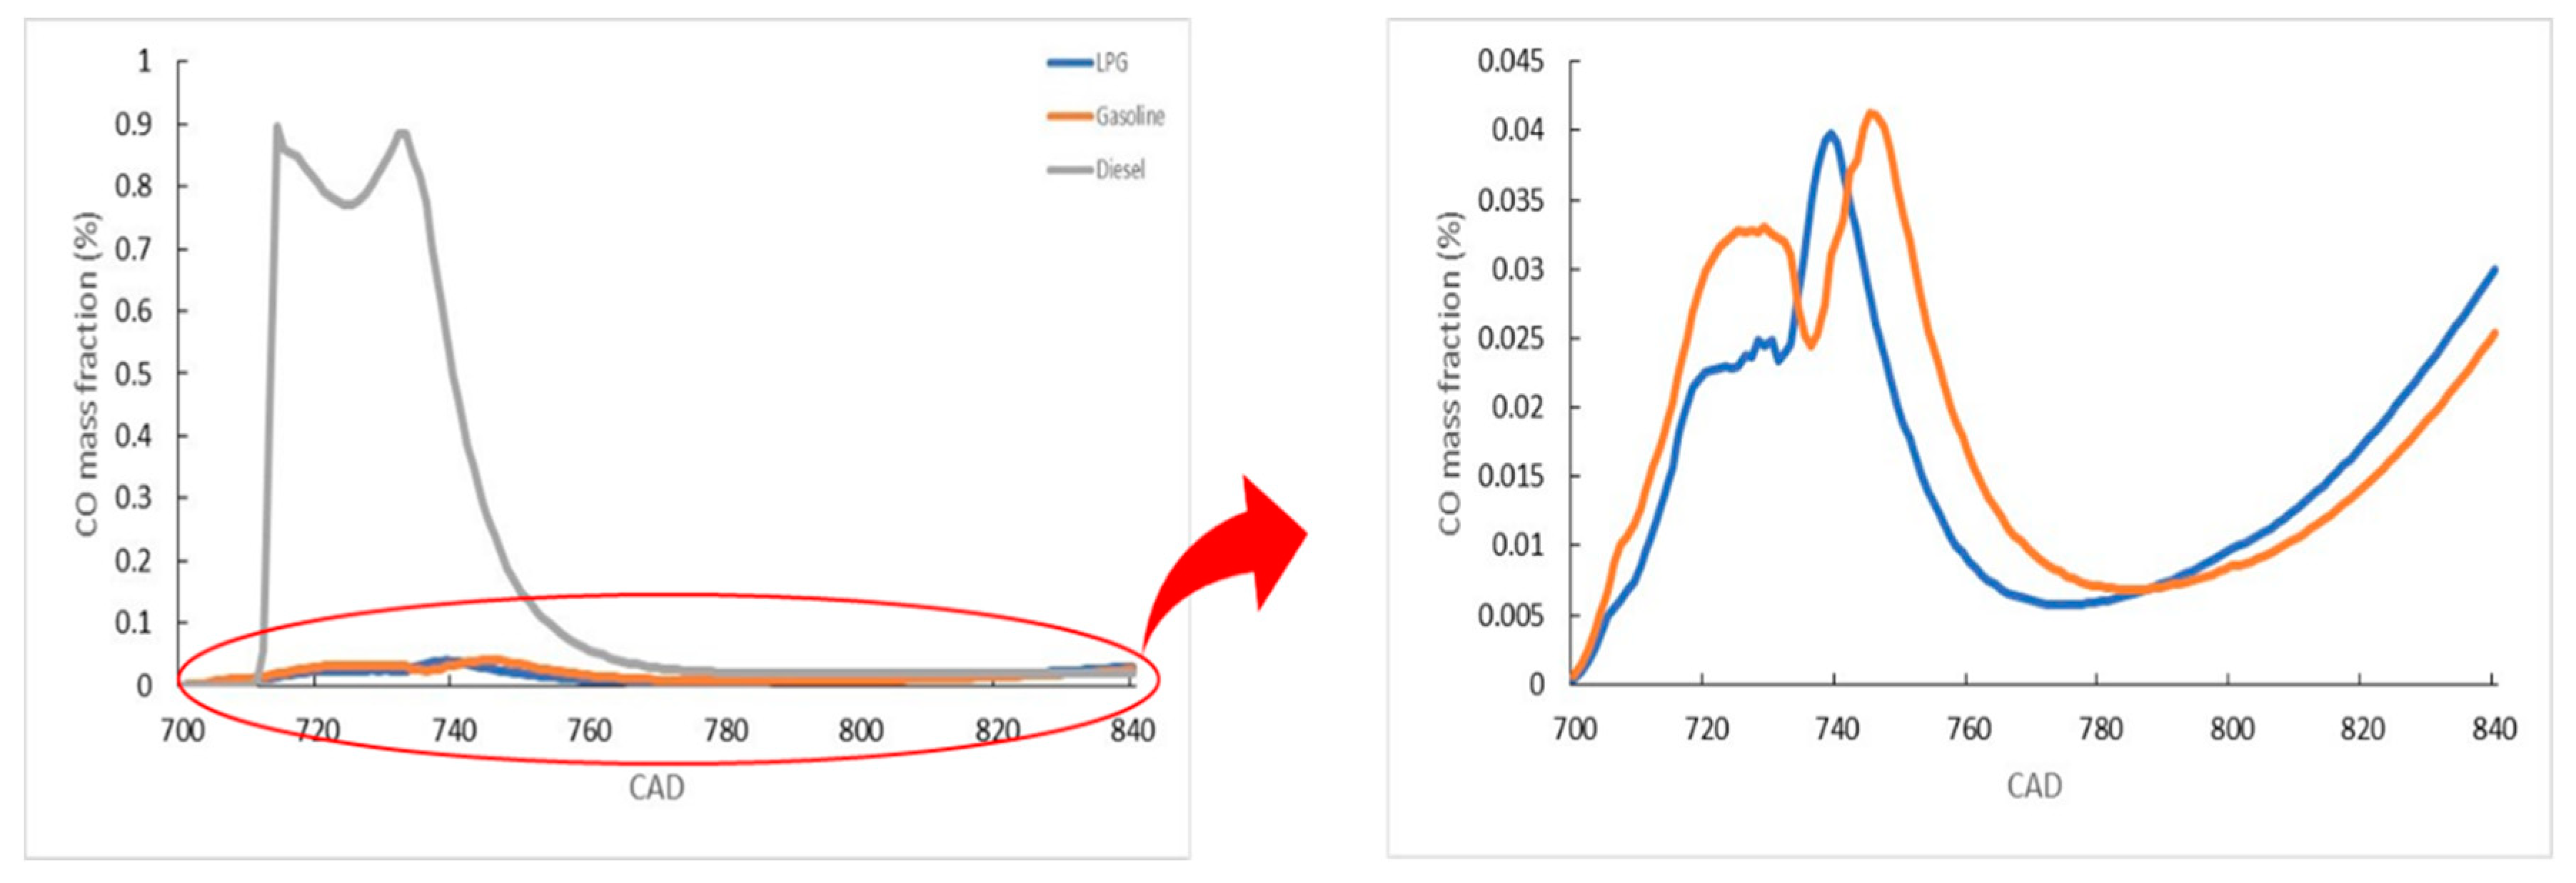
Figure 8 compares CO emissions at the same output of the LPG, gasoline, and diesel engines.
The comparison reveals that CO emissions from diesel engines surpass those from LPG and gasoline engines. This arises from differences in combustion processes, fuel injection and mixing methods, and fuel characteristics. Unlike LPG and gasoline engines that employ spark ignition, diesel engines employ compression ignition. This relies on the spontaneous ignition of fuel due to the heat generated by compressed air, which increases CO generation if the air temperature is insufficient during compression. In addition, unlike LPG and gasoline engines, which premix air and fuel before supplying the mixture to the cylinder, diesel engines directly inject fuel into the cylinder. This may lead to insufficient or irregular mixing of air and fuel, which is attributed to the inherent fuel injection and mixing characteristics of diesel engines. Furthermore, the higher carbon content of diesel fuel, in comparison to LPG and gasoline, heightens CO generation owing to incomplete combustion. The LPG engine exhibited 5.17% and 95.31% lower CO emissions than the gasoline and diesel engines, respectively.
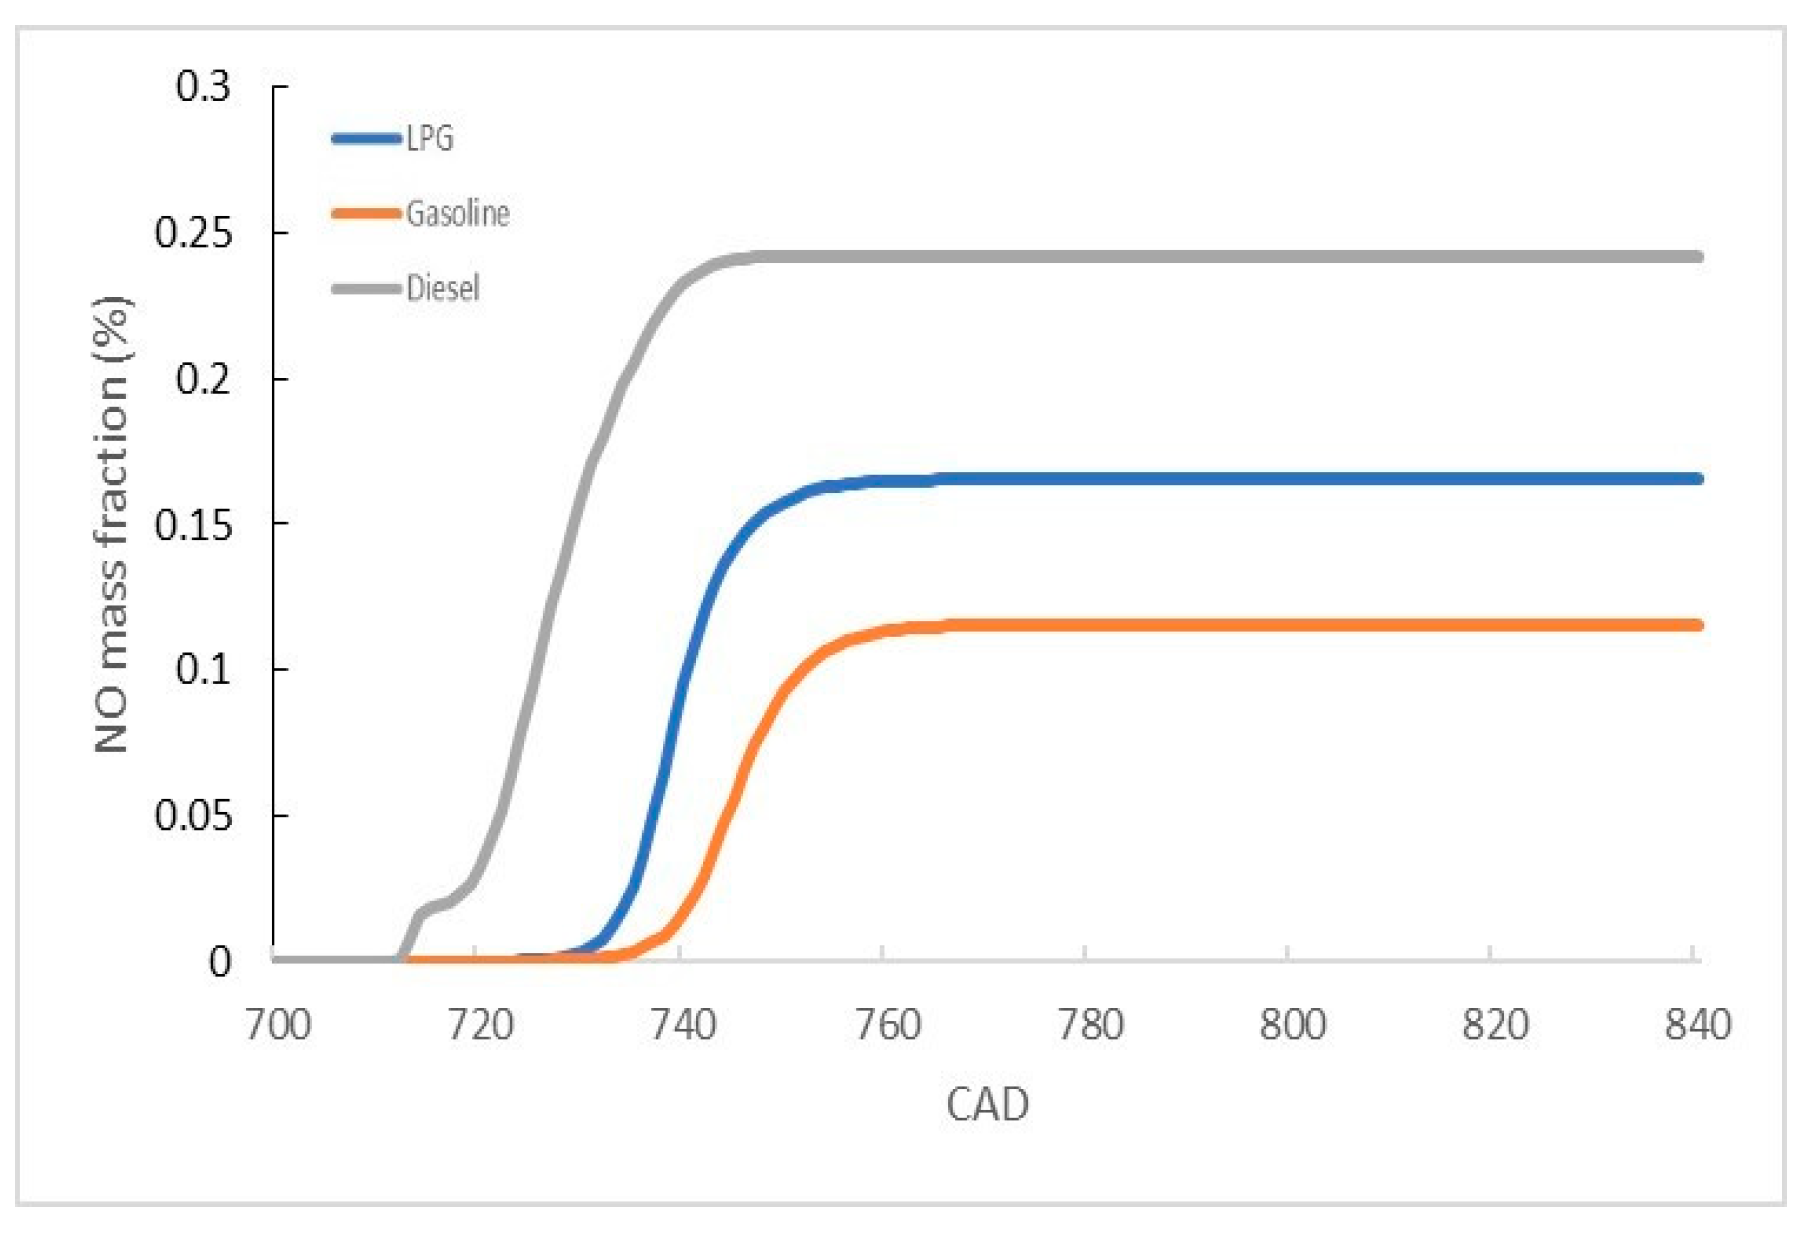
Figure 9 presents a comparison of NO emissions at the same output for the LPG, gasoline, and diesel engines.
The comparison of NO emissions reveals the order of diesel > LPG > gasoline, with the LPG engine exhibiting 39.63% higher emissions than the gasoline engine and 28.19% lower emissions than the diesel engine. Generally, NO emissions arise from atmospheric nitrogen and oxygen supplied to the engine, which undergoes a chemical reaction and produces NO during the combustion process. For diesel engines, higher NO emissions are attributed to the characteristics of the surcharging air. For LPG and gasoline engines, the higher NO emissions from LPG can be attributed to the air–fuel mixing ratio. The equivalence ratios for LPG and gasoline at the same output are 0.652 and 0.669, respectively. This implies that the LPG engine has a higher air ratio in the air–fuel mixture compared to the gasoline engine, leading to higher NO generation in the LPG engine.
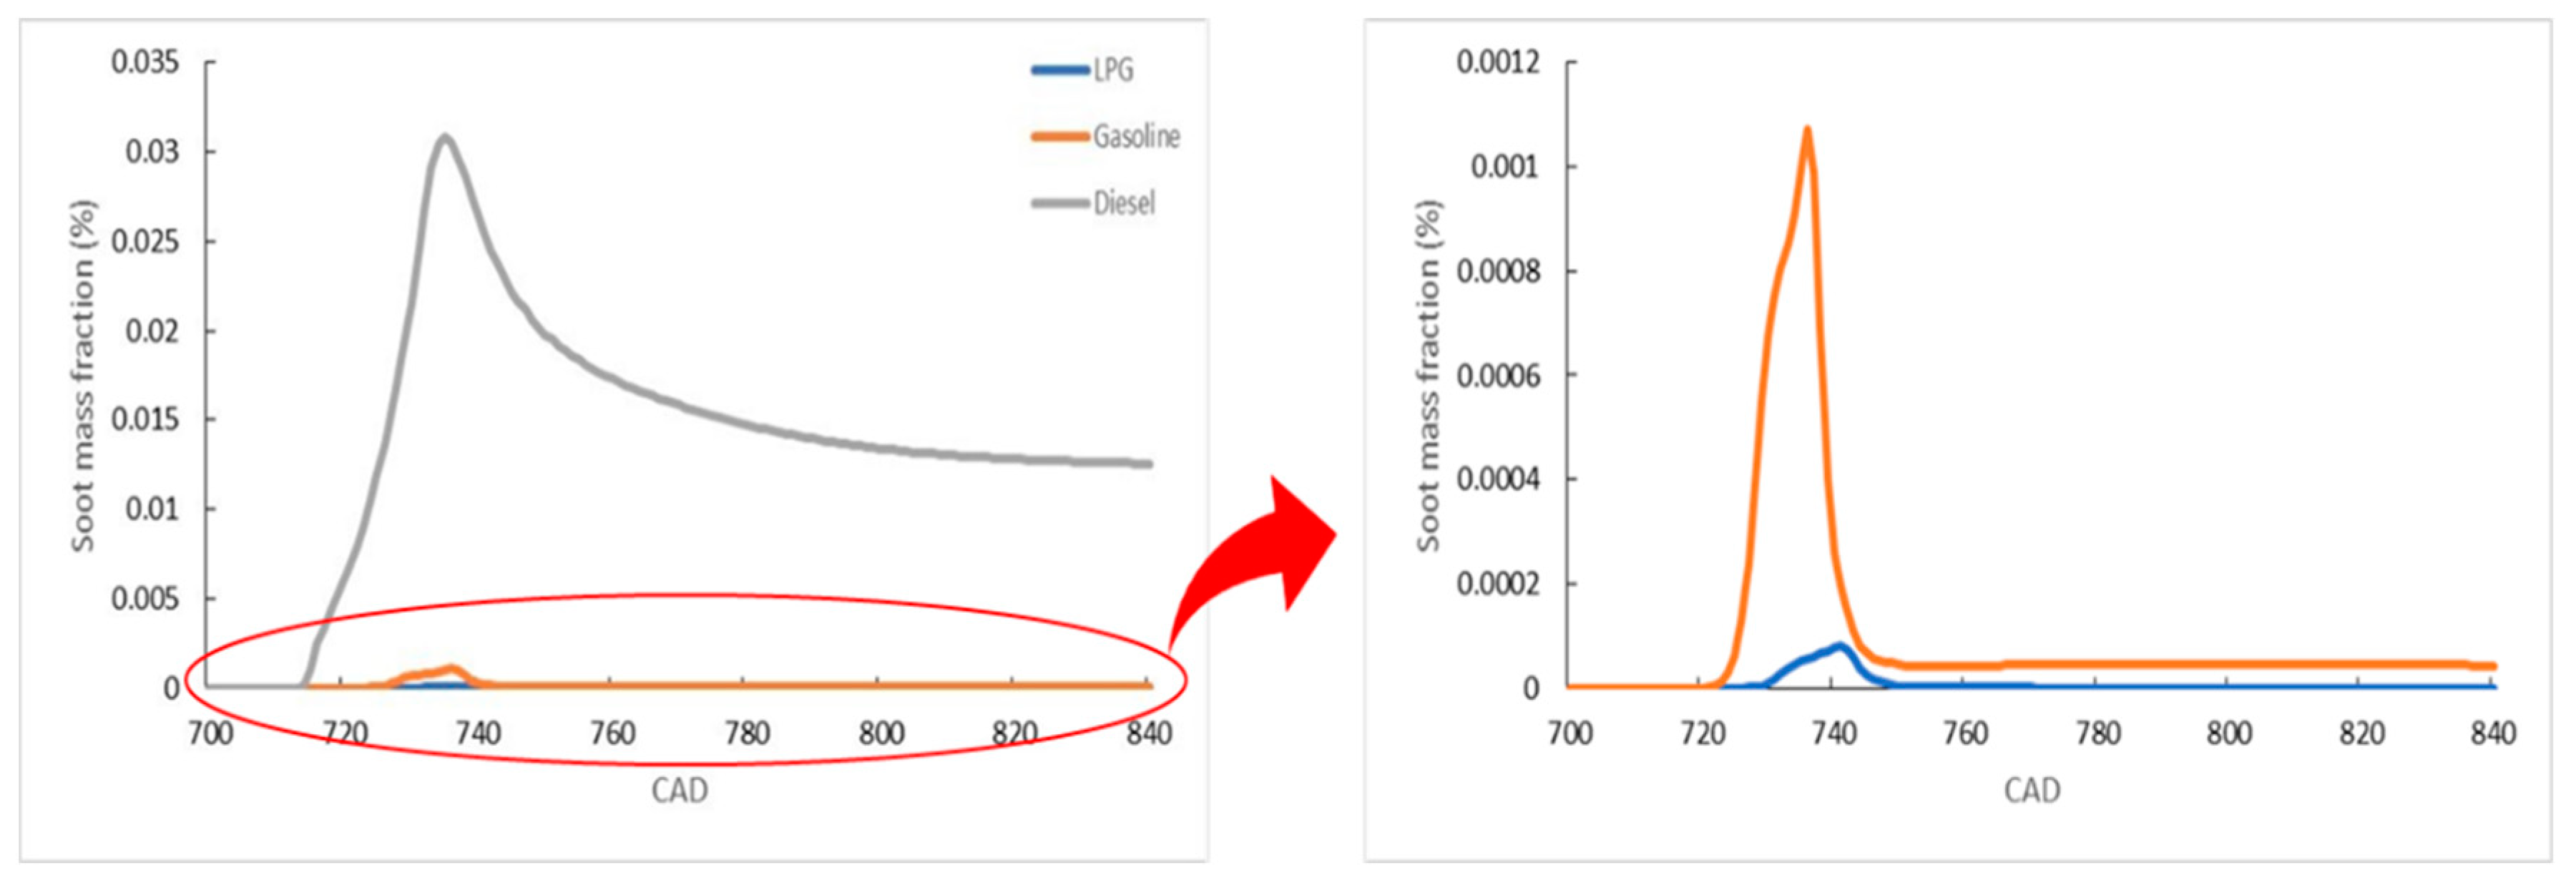
Figure 10 compares soot emissions at the same output from the LPG, gasoline, and diesel engines.
The higher production of soot in diesel engines compared to LPG and gasoline engines can be attributed to the characteristics of the fuel and combustion processes. The high carbon content of diesel fuel, coupled with partial combustion and chemical reactions occurring in the flame owing to compression ignition and direct fuel injection combustion processes, facilitates soot formation. The LPG engine exhibited 92.55% and 98.58% lower soot emissions than the gasoline and diesel engines, respectively.
The aforementioned results clearly demonstrate that LPG engines exhibit greater eco-friendliness than gasoline and diesel engines for all exhaust emissions, except for NO emissions, for which they surpass gasoline. Thus, the eco-friendly attributes of LPG engines play a pivotal role in enhancing air quality, mitigating environmental pollution, and curbing GHG emissions. Consequently, installing LPG engines in small ships offers environmental protection and provides a sustainable mode of transportation.
However, the gasoline and diesel engines implemented using simulation in this study have not been verified with those engines used in actual small fishing boats, so there is a disadvantage in that it is difficult to 100% trust the exhaust emission results of the simulated engines. Despite the shortcomings, the exhaust emission results of this study are consistent with previous studies [9,18,19,35,36,37]. It is expected that more accurate results will be derived in the future through simulation modeling using gasoline and diesel engine information from real ships.

3. Economic Feasibility of LPG Engine

To assess the economic feasibility of LPG engines, we considered the 2022 annual average prices as the standard prices and average annual price growth rates of LPG, gasoline, and diesel fuels, and the annual fuel consumption data of those engines. Additionally, assuming the life cycle of a ship to be 30 years, the long-term economic feasibility of the fuel selection for this period has been validated.

3.1. Study Sample

To assess the economic feasibility of the LPG engine, a sample was drawn from fishing vessels equipped with 180–220 kW engines, considering the ±10% deviation in engine output to limit vessels that can be equipped with a 200 kW experimental LPG engine. From the total ships registered in South Korea as of May 2020 that satisfied the output conditions, 6428 sample ships were selected.
The study sample was categorized into two engine types, gasoline and diesel, and classified by fishing zone according to each engine type. Fishing zones were classified into “Offshore”, “Coastal”, and “Ocean” according to the classification criteria of the Ministry of Oceans and Fisheries of the Republic of Korea, and vessels that did not meet the classification criteria or had more than one fishing zone were classified as “Other” [38]. Fishing zones were classified based on industry codes and government data were referenced. Table 10 classifies research samples by applying this standard according to engine type and fishing zone.

3.2. Fuel Price Information

To derive the standard price of propane, gasoline, and diesel, we used data from January 2022 to December 2022, which was obtained from the Korea LPG Association [39]. The average prices during this period were 1259.3 KRW/L, 1808.3 KRW/L, and 1835.2 KRW/L for propane, gasoline, and diesel, respectively, and these prices were used as the standard prices for each fuel in this study.
In South Korea, the average annual price growth rates over the past 10 years were 3.93%/year, 1.48%/year, and 3.06%/year for propane, gasoline, and diesel, respectively. This is because, in a period when fuel prices are rapidly rising in South Korea, there are many fuel tax reduction benefits for gasoline and diesel, which are widely used in vehicles, and among them, the tax reduction benefits for expensive gasoline are greater. Therefore, it has faced difficulties in applying this annual price growth rate to research. In this study, the average annual price growth rate of crude oil was applied as an alternative method because all three fuels were produced from crude oil. For this purpose, the average value of the annual price growth rates of crude oil over 10 years was applied, based on its price changes over the past 11 years. Table 11 presents the average annual price of crude oil over the past 11 years and its annual price growth rate over the past 10 years. As a result, the average annual price growth rate of crude oil is 5.36%/year [40].
To validate the economic feasibility considering a long-term perspective, the life cycle of a ship was assumed to be 30 years, and price changes were compared by applying the standard price of each fuel and the average annual price growth rate for this period. Table 12 presents the prices of every 5-year interval from 2022 for each fuel during the ship’s life cycle.

3.3. Operational Information and Fuel Consumption

Operational information is pivotal for calculating fuel costs during the life cycle of ships. The operation information of the fishing boat includes the engine running hours and loads for moving from the ports to the fishing zones and the engine running hours and loads for working in the fishing zones. This study used existing data on the annual engine running hours and loads for moving and working in each fishing zone, as presented in Table 13 [41].
The amount of fuel used by the engine is also important for calculating fuel costs during the life cycle of a ship. Although it is desirable to collect SFOC information by engine type on individual ships, directly collecting SFOC information corresponding to the sample ships in this study is a challenging task. Considering this limitation, this study used SFOC values derived from the simulation fuel consumption and output data, and Table 14 presented the SFOC of each engine.
Using the data mentioned above, the annual fuel consumption of the engine type-fishing zone of the sample vessel has been calculated using the following equation:
A F C i = i = 1 n S F O C i × P i × P L M i × T M i + S F O C i × P i × P L W i × T W i
A F C i : Annual fuel consumption (kg/year)
S F O C i : Specific fuel-oil consumption (g/kWh)
P i : Engine power (kW)
P L M i : Power load of engine for moving (%)
T M i : Annual engine running hours for moving (h/year)
P L W i : Power load of the engine (%)
T W i : Annual engine running hours for working (h/year)
i : Number of ships in each engine type–fishing zone.
The amount of LPG, gasoline, and diesel fuel used was calculated with the equation above. In addition, to check the price of each fuel calculated previously, the unit of weight (kg) was converted to a unit of volume (L). Table 14 lists the conversion factor for converting the weight to volume of each fuel.
Table 15 presents the annual fuel consumption of the sample vessels according to engine type-fishing zone, based on the aforementioned data.

3.4. Results on Economic Feasibility

Using the fuel price information presented in Section 3.2 and the fuel consumption by engine type–fishing zone presented in Section 3.3, the fuel costs have been derived during the life cycle of gasoline and diesel engine ships. In addition, the fuel costs of LPG when replacing gasoline and diesel engines with LPG engines were derived. Based on these results, the fuel cost savings for all ships and one ship in each engine type–fishing zone were calculated by converting gasoline and diesel engines into LPG engines, as shown in Table 16.
During the life cycle of the ship, when replacing conventional engines with LPG engines in all engine types–fishing zones, gasoline–other and diesel–offshore yielded the largest and smallest fuel cost savings of KRW 9,118,187 (million) and KRW 68,731 (million), respectively. On a per-ship basis, gasoline–other and gasoline–coastal yielded the largest and smallest fuel cost savings of KRW 4383.7 (million) and KRW 2275.1 (million), respectively. When comparing fuel cost savings per ship according to fishing zones, other fishing zones exhibited the greatest savings for both gasoline and diesel engines. This is because the annual engine running hours for moving with a high engine load in this fishing zone are approximately three times greater than those in other fishing zones. Notably, the difference in fuel cost savings per ship between coastal and offshore zones of diesel engines is more pronounced in offshore zones. This is because the annual engine running hours for moving in the two fishing zones are similar; however, the annual engine running hours for working in the offshore zone are approximately twice those in the coastal zone.
The results of this study, which established the economic advantages of utilizing LPG as a fuel for small fishing vessels, are notable for not factoring in the application of duty-free oil prices, as currently applicable to them. The reason is that gasoline and diesel are supplied to fishing boats tax free, whereas LPG is not. Nonetheless, it is crucial to note that there is already a legal basis outlined in Section 2, Article 5 of the ‘Guide to Supply and Follow-up Management of Duty-free Oil for Fishing’ in Korea. According to this provision, LPG fuel, similar to gasoline and diesel fuels, can be designated as duty-free oil upon the request of fishermen.
In the current research, several potential future works can be considered. First, when LPG fuel is supplied as duty-free oil, more precise economic assessments can be conducted. Second, based on the economic feasibility results of this study, there is potential for further research concerning the use of Bio LPG, a new eco-friendly fuel. Beyond these studies, the data presented in this study can also serve as valuable promotional materials for initiatives aimed at advancing the adoption of eco-friendly engines.

4. Conclusions

Based on the aforementioned discussion, the results of this study are summarized as follows:
(1)
In a simulation-based comparison of exhaust emissions from gasoline and diesel engines currently employed in small fishing boats, aimed at verifying the eco-friendliness of the LPG engine, it has been observed that although the LPG engine emitted more NO than the gasoline engine, the LPG engine exhibited lower levels of all other exhaust emissions compared to existing engines. The detailed results for each exhaust emission type are outlined as follows:
(a)
CO2: the LPG engine emitted 11.35% and 4.59% less emissions than the gasoline and diesel engines, respectively.
(b)
CO: the LPG engine emitted 5.17% and 95.31% less CO than the gasoline and diesel engines, respectively.
(c)
NO: the LPG engines emitted 39.63% more emissions than gasoline engines and 28.19% less than diesel engines.
(d)
Soot: LPG engines emitted 92.55% and 98.58% less soot than gasoline and diesel engines, respectively.
(2)
To assess the economic feasibility of the LPG engine, a comparison of fuel costs throughout the ship’s life cycle was conducted against existing gasoline and diesel engines used on small fishing boats. The detailed results of the economic feasibility analysis are outlined as follows:
(a)
For all ships, the most and least fuel cost reductions were observed for gasoline-other and diesel-offshore, amounting to 9,118,187 (million Won) and 68,731 (million Won), respectively.
(b)
On a per-ship basis, the most and least fuel cost reductions were observed for gasoline–other and gasoline–coastal, amounting to 4383.7 (million Won) and 2275.1 (million Won), respectively.

Author Contributions

J.K.K.: Conceptualization, Methodology, Investigation, Formal Analysis, Data Curation, Software, Visualization, Writing—Original Draft, and Writing—Review and Editing. S.Y.: Methodology, Investigation, and Formal Analysis. J.-H.C.: Conceptualization, Supervision, and Project Administration. W.-J.L.: Conceptualization, Supervision, Project Administration, and Writing—Review and Editing. All authors have read and agreed to the published version of the manuscript.

Funding

This research was supported by the Autonomous Ship Technology Development Program (20016140) funded by the Ministry of Trade, Industry, & Energy (MOTIE, Republic of Korea) and the Korea Institute of Marine Science & Technology Promotion (KIMST) funded by the Ministry of Ocean and Fisheries (RS-2023-00256331).

Data Availability Statement

Data are contained within the article.

Conflicts of Interest

The authors declare no conflicts of interest.

References

  1. Synák, F.; Čulík, K.; Rievaj, V.; Gaňa, J. Liquefied petroleum gas as an alternative fuel. Transp. Res. Procedia 2019, 40, 527–534. [Google Scholar] [CrossRef]
  2. Ryskamp, R. Emissions and Performance of Liquefied Petroleum Gas as a Transportation Fuel: A Review; World LPG Association: Neuilly-sur-Seine, France, 2017. [Google Scholar]
  3. Johnson, E.P. Carbon footprints of heating oil and LPG heating systems. Environ. Impact Assess. Rev. 2012, 35, 11–22. [Google Scholar] [CrossRef]
  4. Gould, C.F.; Urpelainen, J. LPG as a clean cooking fuel: Adoption, use, and impact in rural India. Energy Policy 2018, 122, 395–408. [Google Scholar] [CrossRef] [PubMed]
  5. Romero, C.A.; Acosta, R.; Lopez, J. The Status of Experimental Investigations on the Use of LPG for Generator Sets in Colombia; No. 2016-01-0880; SAE Technical Papers: Warrendale, PA, USA, 2016. [Google Scholar] [CrossRef]
  6. Woo Jeong, J.W.; Baek, S.; Kim, Y.; Woo, S.; Lim, Y.; Lee, K. Investigation of CO2 and PN emission characteristics according to the propane content for a LPG engine. Fuel 2024, 357, 129877. [Google Scholar] [CrossRef]
  7. Baek, S.; Lee, S.; Shin, M.; Lee, J.; Lee, K. Analysis of combustion and exhaust characteristics according to changes in the propane content of LPG. Energy 2022, 239, 122297. [Google Scholar] [CrossRef]
  8. Warguła, Ł.; Kukla, M.; Lijewski, P.; Dobrzyński, M.; Markiewicz, F. Influence of the use of liquefied petroleum gas (LPG) systems in woodchippers powered by small engines on exhaust emissions and operating costs. Energies 2020, 13, 5773. [Google Scholar] [CrossRef]
  9. Ehsan, M.; Rahman, S.Z.; Javed, K.M.; Mahboob, M.M. Performance of a LPG Run SI Engine for Small Scale Power Generation. In Proceedings of the 4th International Conference on Mechanical Engineering, Constantine, Algeria, 7–19 December 2009; Volume 2, pp. 97–102. [Google Scholar]
  10. Kim, J.; Kim, K.; Oh, S. An assessment of the ultra-lean combustion direct-injection LPG (liquefied petroleum gas) engine for passenger-car applications under the FTP-75 mode. Fuel Process. Technol. 2016, 154, 219–226. [Google Scholar] [CrossRef]
  11. Djermouni, M.; Ouadha, A. Comparative assessment of LNG and LPG in HCCI engines. Energy Procedia 2017, 139, 254–259. [Google Scholar] [CrossRef]
  12. Rej, S.; Bandyopadhyay, A.; Mahmood, H.; Murshed, M.; Mahmud, S. The role of liquefied petroleum gas in decarbonizing India: Fresh evidence from wavelet–partial wavelet coherence approach. Environ. Sci. Pollut. Res. Int. 2022, 29, 35862–35883. [Google Scholar] [CrossRef]
  13. Clark, S.; McGregor, C.; Van Niekerk, J.L. Using liquefied petroleum gas to reduce the operating cost of the Ankerlig peaking power plant in South Africa. J. Energy S. Afr. 2022, 33, 15–23. [Google Scholar] [CrossRef]
  14. Neagoie, G.S.; Simion, I. LPG, alternative fuel for internal combustion engines. J. Ind. Des. Eng. Graph. 2018, 13, 17–22. [Google Scholar]
  15. Kjartansson, S. A Feasibility Study on LPG as Marine Fuel. Master’s Thesis, Chalmers University of Technology, Gothenburg, Sweden, 2012. [Google Scholar]
  16. Chun, K.W.; Kim, M.; Hur, J.J. Development of a marine LPG-fueled high-speed engine for electric propulsion systems. J. Mar. Sci. Eng. 2022, 10, 1498. [Google Scholar] [CrossRef]
  17. Yeo, S.J.; Kim, J.; Lee, W.J. Potential economic and environmental advantages of liquid petroleum gas as a marine fuel through analysis of registered ships in South Korea. J. Clean. Prod. 2022, 330, 129955. [Google Scholar] [CrossRef]
  18. Šarkan, B.; Jaśkiewicz, M.; Kubiak, P.; Tarnapowicz, D.; Loman, M. Exhaust emissions measurement of a vehicle with retrofitted LPG system. Energies 2022, 15, 1184. [Google Scholar] [CrossRef]
  19. Nemoianu, L.; Pana, C.; Negurescu, N.; Cernat, A.; Fuiorescu, D.; Nutu, C. On LPG Use at Diesel Engine: Pollutant emissions level and cycle variability aspects. In IOP Conference Series: Materials Science and Engineering; IOP Publishing: Bristol, UK, 2018; Volume 444, p. 072002. [Google Scholar]
  20. Pham, V.C.; Choi, J.H.; Rho, B.S.; Kim, J.S.; Park, K.; Park, S.K.; Le, V.V.; Lee, W.J. A numerical study on the combustion process and emission characteristics of a natural gas-diesel dual-fuel marine engine under full load. Energies 2021, 14, 1342. [Google Scholar] [CrossRef]
  21. Wu, G.; Li, J.; Guo, H.; Wang, X.; Jiang, G. Numerical Method for Predicting Emissions from Biodiesel Blend Fuels in Diesel Engines of Inland Waterway Vessels. J. Mar. Sci. Eng. 2023, 11, 86. [Google Scholar] [CrossRef]
  22. Wei, S.; Ji, K.; Leng, X.; Wang, F.; Liu, X. Numerical simulation on effects of spray angle in a swirl chamber combustion system of DI (direct injection) diesel engines. Energy 2014, 75, 289–294. [Google Scholar] [CrossRef]
  23. Huang, Z.; Huang, J.; Luo, J.; Hu, D.; Yin, Z. Performance enhancement and emission reduction of a diesel Engine fueled with different biodiesel-diesel blending fuels based on multiparameter optimization theory. Fuel 2022, 314, 122753. [Google Scholar] [CrossRef]
  24. Yu, S.; Cao, C.; Lv, W. Combustion and emission characteristics investigation of a marine diesel engine powered by diesel/biodiesel/n-butanol blends. Energy Sci. Eng. 2022, 10, 3317–3330. [Google Scholar] [CrossRef]
  25. Lopez, N.S.; Soliman, J.; Biona, J.B.M. Life cycle cost and benefit analysis of low carbon vehicle technologies. Sustain. Energy Technol. Policies A Transform. Journey 2018, 2, 131–146. [Google Scholar]
  26. Durbin, P.A. Near-wall turbulence closure modeling without “damping functions”. Theor. Comput. Fluid Dyn. 1991, 3, 1–13. [Google Scholar] [CrossRef]
  27. Candel, S.; Veynante, D.; Lacas, F.; Maistret, E.; Darabiha, N.; Poinsot, T. Coherent flamelet model: Applications and recent extensions. In Recent Advances in Combustion Modelling; World Scientific: Singapore, 1991; pp. 19–64. [Google Scholar]
  28. AVL FIRE®R2018a. Combustion Module User Manual; AVL List GmbH: Graz, Austria, 2018. [Google Scholar]
  29. AVL FIRE®R2018a. Emission Module User Manual; AVL List GmbH: Graz, Austria, 2018. [Google Scholar]
  30. Raine, R.R.; Stone, C.R.; Gould, J. Modeling of nitric oxide formation in spark ignition engines with a multizone burned gas. Combust. Flame 1995, 102, 241–255. [Google Scholar] [CrossRef]
  31. AVL FIRE®R2018a. Spray Module User Manual; AVL List GmbH: Graz, Austria, 2018. [Google Scholar]
  32. Pham, V.C.; Kim, J.K.; Lee, W.J.; Choe, S.J.; Le, V.V.; Choi, J.H. Effects of Piston Bowl Geometry on Combustion and Emissions of a Four-Stroke Heavy-Duty Diesel Marine Engine. Appl. Sci. 2022, 12, 13012. [Google Scholar] [CrossRef]
  33. SC9D310D2 Engine Datasheet. Available online: http://sdeciepower.com/2018/pdf_hub/SC9D310D2-datasheet.pdf (accessed on 4 January 2024).
  34. V158TIH Engine Operation & Maintenance Manual. Available online: https://www.manualslib.com/manual/1844388/Doosan-V158ti.html (accessed on 4 January 2024).
  35. Negurescu, N.; Pana, C.; Cernat, A. Theoretical and experimental investigations on the LPG fuelled diesel engine. In Proceedings of the FISITA 2012 World Automotive Congress: Volume 3: Future Automotive Powertrains (I), Beijing, China, 27–30 November 2012; Springer: Berlin/Heidelberg, Germany, 2013; pp. 37–49. [Google Scholar]
  36. Usman, M.; Hayat, N. Lubrication, emissions, and performance analyses of LPG and petrol in a motorbike engine: A comparative study. J. Chin. Inst. Eng. 2020, 43, 47–57. [Google Scholar] [CrossRef]
  37. Jang, J.; Shin, Y.; Ko, A.; Jung, Y.; Woo, Y.; Cho, C.; Kim, G.; Pyo, Y.; Han, M. Particle number in small SI engine using Gasoline and LPG as fuel for Non-road Vehicle. Int. J. Automot. Technol. 2022, 23, 1547–1554. [Google Scholar] [CrossRef]
  38. Ministry of Oceans and Fisheries. 2019 Registered Fishing Vessel Statistics—Statistical Information Report; Ministry of Oceans and Fisheries: Seoul, Republic of Korea, 2021.
  39. Korea LPG Association. Available online: https://klpg.or.kr/html/dh/board04 (accessed on 15 August 2023).
  40. OPINET. Available online: https://www.opinet.co.kr/glopcoilSelect.do (accessed on 23 July 2023).
  41. An, Y.S.; Yuk, K.H.; Kim, J. Improvements in the Estimation of Air Pollutant Emissions from Ships; Korea Maritime Institute: Seoul, Republic of Korea, 2017. [Google Scholar]
Figure 1. Block diagram with measurement instruments of LPG engine experiment.
Energies 17 00450 g001
Figure 2. 2D piston shape of simulation LPG engine modeled through AVL FIRE ESE.
Energies 17 00450 g002
Figure 3. Comparison between experiment and simulation results.
Energies 17 00450 g003
Figure 4. Comparison of P–θ and P–V diagrams between experiment and simulation results.
Energies 17 00450 g004
Figure 5. Mesh independence analysis results using three different mesh resolutions.
Energies 17 00450 g005
Figure 6. Comparison of cylinder pressure and temperature of LPG, gasoline, and diesel engines.
Energies 17 00450 g006
Figure 7. Comparison of CO2 emission of LPG, gasoline, and diesel engines.
Energies 17 00450 g007
Figure 8. Comparison of CO emission of LPG, gasoline, and diesel engines.
Energies 17 00450 g008
Figure 9. Comparison of NO emission of the LPG, gasoline, and diesel engines.
Energies 17 00450 g009
Figure 10. Comparison of soot emission from the LPG, gasoline, and diesel engines.
Energies 17 00450 g010
Table 1. LPG engine specifications.
ParameterValue
MakerHyundai Motor
Name of EngineC6AF
Type of Engine4 Cycle TCI
Combustion TypeSpark Ignition
Fuel Supply TypeGas Fuel Port Injection
Cooling MethodWater Cooled
Valve MechanismOver Head Valve
Power and Engine Speed200 kW @ 1800 rpm
Table 2. Geometric information used for simulation LPG engine modeling.
Geometrical CategoryValue
Piston Diameter (mm)133
Bowl Diameter (mm)109
Bowl Depth (mm)26.5
Connecting Rod Length (mm)260
Stroke (mm)140
Engine TypeIn Line
Number of Cylinders6
Location of Spark PlugCenter
Compression Ratio9.5:1
Table 3. Boundary conditions of simulation LPG engine.
Boundary ConditionsBoundary TypeInput Value
PistonMesh Movement570 K (297 °C)
LinerWall470 K (197 °C)
Cylinder HeadWall570 K (297 °C)
Segment CutPeriodicInlet/Outlet
Table 4. Initial conditions of simulation LPG engine.
Initial ConditionsInput Value
Supply Air Pressure135 kPa
Supply Air Temperature (K)302 K (29 °C)
Intake Valve Close20 CAD ABDC
Exhaust Valve Open50 CAD BBDC
Ignition Timing20 CAD BTDC
Fuel TypeC3H8
Table 5. Summary of the models for simulation LPG engine.
ModelDescription
Turbulencek-zeta-f
CombustionExtended Coherent Flame Model—3Z
EmissionNOExtended Zeldovich
SootKinetic Soot Formation
IgnitionSpark-ignition Model
AtomizationBreakupWAVE
EvaporationDukowicz Model
Droplet–Wall InteractionWalljet1
Table 6. Modified parameters for gasoline and diesel engine modeling.
Modified ParametersGasoline EngineDiesel Engine
FuelLPG → GasolineLPG → Diesel
Equivalent Ratio0.652 → 0.669N/A *
Compression RatioN/A *9.5 → 18.0
Ignition ModelN/A *Spark Ignition → Auto Ignition
* Not Applicable.
Table 7. Properties of LPG, gasoline, and diesel fuels.
PropertiesFuel
Working ModeLPG (Propane)GasolineDiesel
FormulaC3H8C8H18C12H23
Density (kg/m3)1.91737786
LCV (MJ/kg)46.32542.84542.501
Table 8. Mesh properties and calculation time for simulation LPG engine.
CategoryCoarse MeshMedium MeshFine Mesh
Total number of faces259831313616
Total number of cells158,068184,928215,584
Calculation time0 h 53 min1 h 8 min1 h 39 min
Table 9. Simulation results for LPG, gasoline, and diesel engines.
PropertiesLPGGasolineDiesel
Output (kW)38.8238.7938.81
Fuel consumption (kg/h)43.41647.39842.606
Mean mass (kg) 3.35 × 10 3 3.41 × 10 3 3.18 × 10 3
CO2 mass fraction (%)11.6512.9012.86
CO2 emission (g/kWh)542.9612.4569.0
CO mass fraction (%)0.03980.04120.895
CO emission (g/kWh)1.8551.95639.60
NO mass fraction (%)0.1650.1160.242
NO emission (g/kWh)7.6895.50710.71
Soot mass fraction (%) 8.11 × 10 5 1.07 × 10 3 6.01 × 10 3
Soot emission (g/kWh) 3.78 × 10 3 5.08 × 10 2 0.266
Table 10. Number of fishing vessels by engine type and fishing zone.
Engine TypeFishing ZoneNumber of Vessels
GasolineCoastal2208
Other2080
DieselCoastal1091
Offshore18
Other1031
Table 11. Average annual price (2012–2022) and average annual price growth rate (2013–2022).
YearsAverage Annual Price ($/bbl)Annual Price Growth Rate (%)
201294.18
201398.084.14
201492.92−5.27
201548.76−47.52
201643.47−10.86
201750.8516.99
201864.9027.62
201957.04−12.11
202039.34−31.03
202168.1173.10
202294.3338.51
Table 12. Price trends over the life cycle of vessels.
YearPropane (KRW/L)Gasoline (KRW/L)Diesel (KRW/L)
20221259.31808.31835.2
20271635.02347.82382.6
20322122.73048.13093.4
20372755.93957.44016.1
20423578.05138.05214.2
20474645.46670.76769.6
20526031.28660.78789.1
Table 13. Engine load and annual running hours according to fishing zone.
CategoryCoastalOffshoreOther
Annual engine running hour (h)
(Moving/Working)
342/1148340/2442937/767
Engine load (%)
(Moving/Working)
79/1973/2076/14
Table 14. SFOC and conversion factor of each fuel.
Fuel TypeSFOC (g/kWh)kg to Liter
Gasoline203.651 kg = 1.351 L
Diesel182.971 kg = 1.200 L
Propane186.401 kg = 1.969 L
Table 15. Annual fuel consumption by engine type and fishing zone.
Engine Type–Fishing ZoneFuel TypeFuel Type
Annual Fuel Consumption
(kg/Year)
Annual Fuel Consumption
(L/Year)
GasolineLPGGasolineLPG
Gasoline–Coastal45,617,24141,753,27261,628,89382,212,193
Gasoline–Other82,800,19575,786,675111,863,063149,223,963
DieselLPGDieselLPG
Diesel–Coastal19,931,57120,305,21326,927,55239,980,964
Diesel–Offshore491,054500,259663,414985,010
Diesel–Other31,208,17631,793,21242,162,24662,600,834
Table 16. Results of life cycle fuel cost saving (in million Won).
Engine Type–Fishing ZoneFuel TypeFuel Cost Saving of Life Cycle for All ShipsFuel Cost Saving of Life Cycle for 1 Ship
Fuel Cost of Life Cycle
GasolinePropane
Gasoline–Coastal10,510,1745,486,6775,023,4972275.1
Gasoline–Other19,077,0959,958,9089,118,1874383.7
DieselPropane
Diesel–Coastal5,187,0492,397,2972,789,7522557.1
Diesel–Offshore127,79359,06268,7313818.4
Diesel–Other8,121,7053,753,6074,368,0994236.8
Disclaimer/Publisher’s Note: The statements, opinions and data contained in all publications are solely those of the individual author(s) and contributor(s) and not of MDPI and/or the editor(s). MDPI and/or the editor(s) disclaim responsibility for any injury to people or property resulting from any ideas, methods, instructions or products referred to in the content.

