Article

Enhancing Efficiency in Alkaline Electrolysis Cells: Optimizing Flow Channels through Multiphase Computational Fluid Dynamics Modeling

1
CRRC Academy Co., Ltd., Building 5, Nuode Centre Ⅱ, E Qichebowuguan Road Fengtai, Beijing 100160, China
2
School of Automotive Studies, Tongji University, Shanghai 200092, China
3
School of Mechanical Engineering, Shijiazhuang Tiedao University, Shijiazhuang 050000, China
*
Author to whom correspondence should be addressed.
Energies 2024, 17(2), 448; https://doi.org/10.3390/en17020448
Submission received: 14 December 2023 / Revised: 10 January 2024 / Accepted: 10 January 2024 / Published: 16 January 2024
(This article belongs to the Special Issue Advances in Numerical Modeling of Multiphase Flow and Heat Transfer)

Abstract

:
The efficient operation of alkaline water electrolysis cells hinges upon understanding and optimizing gas–liquid flow dynamics. Achieving uniform flow patterns is crucial to minimize stagnant regions, prevent gas bubble accumulation, and establish optimal conditions for electrochemical reactions. This study employed a comprehensive, three-dimensional computational fluid dynamics Euler–Euler multiphase model, based on a geometric representation of an alkaline electrolytic cell. The electrochemical model, responsible for producing hydrogen and oxygen at the cathode and anode during water electrolysis, is integrated into the flow model by introducing mass source terms within the user-defined function. The membrane positioned between the flow channels employs a porous medium model to selectively permit specific components to pass through while restricting others. To validate the accuracy of the model, comparisons were made with measured data available in the literature. We obtained an optimization design method for the channel structure; the three-inlet model demonstrated improved speed and temperature uniformity, with a 22% reduction in the hydrogen concentration at the outlet compared to the single-inlet model. This resulted in the optimization of gas emission efficiency. As the radius of the spherical convex structure increased, the influence of the spherical convex structure on the electrolyte intensified, resulting in enhanced flow uniformity within the flow field. This study may help provide recommendations for designing and optimizing flow channels to enhance the efficiency of alkaline water electrolysis cells.

1. Introduction

The decarbonization of the energy system stands as the fundamental approach to achieving carbon neutrality in rail transit. With breakthroughs in high-power fuel cell technology, the application of hydrogen fuel cells in railway transportation has translated into the practical. China Railway Rolling Stock Corporation Limited (CRRC) has dedicated considerable efforts to developing hydrogen fuel cell locomotives, advancing from pilot platforms to demonstration projects and now transitioning into the commercialization phase state. Notably, in 2015, CRRC successfully engineered the world’s first hydrogen fuel cell modern light rail vehicle, capable of reaching a maximum speed of 80 km per h with a range exceeding 100 km [1]. Subsequently, in 2016, CRRC Tangshan introduced the world’s first commercially viable fuel cell supercapacitor hybrid light rail vehicle, with a top speed of 70 km per h and a range surpassing 40 km. Furthering CRRC’s strides, in 2022, CRRC Change, in collaboration with Chengdu Rail Transit Group, showcased the world’s inaugural hydrogen fuel-cell-powered urban train in Chengdu. This train can achieve a maximum speed of 160 km per h and has a range of 600 km. In addition, in 2023, the Zhuzhou Institute of CRRC Corporation Limited launched trial operations of the independently developed, globally leading hydrogen-powered intelligent rail trams, marking a significant stride in the future trajectory of rail transportation. Figure 1 shows several models of fuel cell locomotives. These advancements underscore the pivotal role of hydrogen-powered trains in the future evolution of rail transportation. Currently, approximately 95% of hydrogen production originates from methods like steam methane reforming, natural gas reforming, coal gasification, and petroleum coke steam gasification, with some employing carbon capture and storage (CCS) technology to curtail carbon dioxide emissions. However, hydrogen derived from these methods, often termed gray or blue hydrogen, tends to have higher carbon emissions, posing limitations to comprehensive emission reduction objectives [2]. Conversely, green hydrogen production processes involve fewer carbon emissions, positioning green hydrogen as the most environmentally friendly and sustainable form of hydrogen [3]. By leveraging renewable, zero-carbon energy sources such as solar and wind energy for water electrolysis, this method mitigates direct greenhouse gas emissions during production, offering a pivotal pathway toward truly environmentally friendly and sustainable hydrogen production [4]. In the realm of rail transportation, especially in the pursuit of carbon neutrality objectives, the adoption of green hydrogen, particularly by CRRC Corporation Limited, has become imperative. Without relying on green hydrogen, achieving genuine carbon neutrality in rail transportation has become a formidable challenge. Hence, CRRC Corporation is exploring the self-electrolysis of water as a means to ensure the use of environmentally superior hydrogen, thereby promoting low-carbon and sustainable energy applications in the transportation sector. The deployment of alkaline water electrolysis (AWE) technology by CRRC Corporation represents a significant stride. Compared to alternative technologies, AWE boasts manufacturing maturity, durability, operational robustness, and notably, lower investment costs due to the absence of precious metals [5]. Thus, CRRC Corporation’s pursuit of hydrogen energy, coupled with the application of alkaline water electrolysis technology, signifies a significant leap toward decarbonization in the rail transportation sector.
Alkaline water electrolysis (AWE) presents higher overpotential in comparison to proton exchange membrane (PEM) water electrolysis, ultimately exhibiting a lower efficiency of approximately 60% [6]. Therefore, the imperative lies in augmenting the efficiency of AWE to realize more efficient hydrogen energy systems. Researchers are tackling these challenges by focusing on the development of advanced electrodes [7,8] and membranes [9], as well as the optimization of operational parameters [10,11], to enhance AWE efficiency. In the pursuit of improved electrocatalytic performance, some scholars are exploring novel materials such as nanostructured materials [12,13,14] and synthesizing non-precious metal electrocatalysts to mitigate the cost associated with AWE [15]. Beyond the development of new electrode materials, the achievement of a uniform electrolyte flow has assumed a critical role in mitigating energy consumption [16,17]. This is because irregular flow patterns can lead to the uneven distribution of reactants, resulting in diminished local reaction rates, increased overpotential in AWE, and consequently, escalated energy consumption. In addition, a non-uniform flow can foster stagnant regions within the electrolytic cell [18], causing the accumulation of H2/O2 bubbles on the electrode surfaces. This accumulation diminishes the effective reaction area and impedes the reaction process [19]. In summary, a well-designed flow field structure plays a pivotal role in facilitating uniform electrolyte distribution, which is essential for efficient mass transport, reducing stagnation, minimizing gas bubble accumulation, and ultimately enhancing the overall performance of electrolytic cells.
In the pursuit of optimizing the flow field structure via AWE, a thorough comprehension of the flow characteristics within these channels is paramount. However, due to the intricacy and high costs associated with conducting fluid dynamics experiments within AWE internal channels, studies in recent decades have predominantly relied on computational fluid dynamics (CFD) approaches and various simulation methods to investigate these flow patterns. Mandin et al. [20] and EI-Askary et al. [21] investigated gas generation and hydrogen production processes by establishing a two-dimensional model, while Zarghami et al. [22] developed a two-phase flow model for electrolysis cells, accounting for turbulent diffusion forces and validating their results with experimental data. However, due to the complexity of models, the computational domains are mostly limited to two-dimensional or small-scale electrochemical setups. While simplification can be beneficial in reducing computational costs and complexity, it may introduce certain issues: some geometric features, such as sharp edges, corners, or irregular shapes present in three-dimensional structures, might be essential to influence flow behavior. There is a growing need to expand research to encompass more complex geometries and realistic operating conditions for a comprehensive understanding of alkaline water electrolysis (AWE) systems. Li et al. [23] studied the effect of spherical protrusions and groove structures on electrolyte flow performance by establishing a three-dimensional numerical model. They found that the vortex formed via these structures contributes to a more uniform distribution of electrolytes. Wang et al. [18] established a three-dimensional numerical model as well as quantitative parameters to investigate the liquid flow uniformity in a concave–convex bipolar plate (CCBP) electrolyzer, incorporating disturbances and heat exchange to assess multi-scale flow uniformity within the cell. They also developed an on-site electrolysis visualization/performance testing platform that vividly depicted the gas–liquid flow during the electrolysis process. Despite most studies on three-dimensional models of electrolytic cells having focused on liquid flows, the two-phase gas–liquid flow within AWE cells profoundly influences cell performance [24,25]. However, in research on three-dimensional models of electrolytic cells, most studies have focused only on the flow characteristics within the flow field without considering the impact of electrochemistry on the flow field, thus neglecting the study of the gas phase. Ignoring this aspect might lead to inaccuracies in predicting the behavior and characteristics of the electrolysis process, potentially undermining a model’s ability to provide comprehensive insights into a cell’s functioning and optimization strategies. Therefore, there is still a lack of a detailed understanding of the impact of the complex two-phase flow distribution inside an electrolytic cell, especially the distribution of hydrogen gas generated during the electrolysis process. Gao et al. [26] introduced a three-dimensional numerical model coupling the electric field with turbulent flow, proposing an optimization method to achieve suitable concentrations, flow conditions, and channel structures, thus integrating electrochemical effects into the analysis. However, attention has not been given to the impact of electrolyte temperature on the performance of the electrolytic cell; research on the two-phase gas–liquid flow in AWE structures remains limited, primarily focusing on single-domain electrolysis cells. A more comprehensive understanding and optimization of the flow characteristics of AWE necessitates a deeper consideration of the complexity inherent to the two-phase gas–liquid flow.
A three-dimensional, two-phase numerical model was established in this study to accurately simulate the performance of an alkaline water electrolysis cell. Firstly, we created geometric and grid models of the flow field in the electrolysis cell. Secondly, considering the gas generation during the electrolysis process, we developed user-defined functions (UDFs) to determine source terms for hydrogen and oxygen. These terms were then introduced into the solver, for which water constituted the first phase, hydrogen the second phase, and oxygen the third phase, allowing us to simulate the flow characteristics of the two-phase gas–liquid system in the electrolytic cell channel. Furthermore, we validated the effectiveness of the model by comparing the computational fluid dynamics (CFD) results with experimental data. Additionally, we investigated the uniformity of the velocity and temperature within the flow field by varying the model’s structural parameters. Finally, we provided a detailed explanation of the internal gas distribution in the model. This demonstrates that, within a certain range of increased protrusion sizes, the velocity and temperature distribution of the fluid in the flow field are optimized, thereby improving the working environment within the electrolysis cell.

2. Method

2.1. Computational Fluid Method
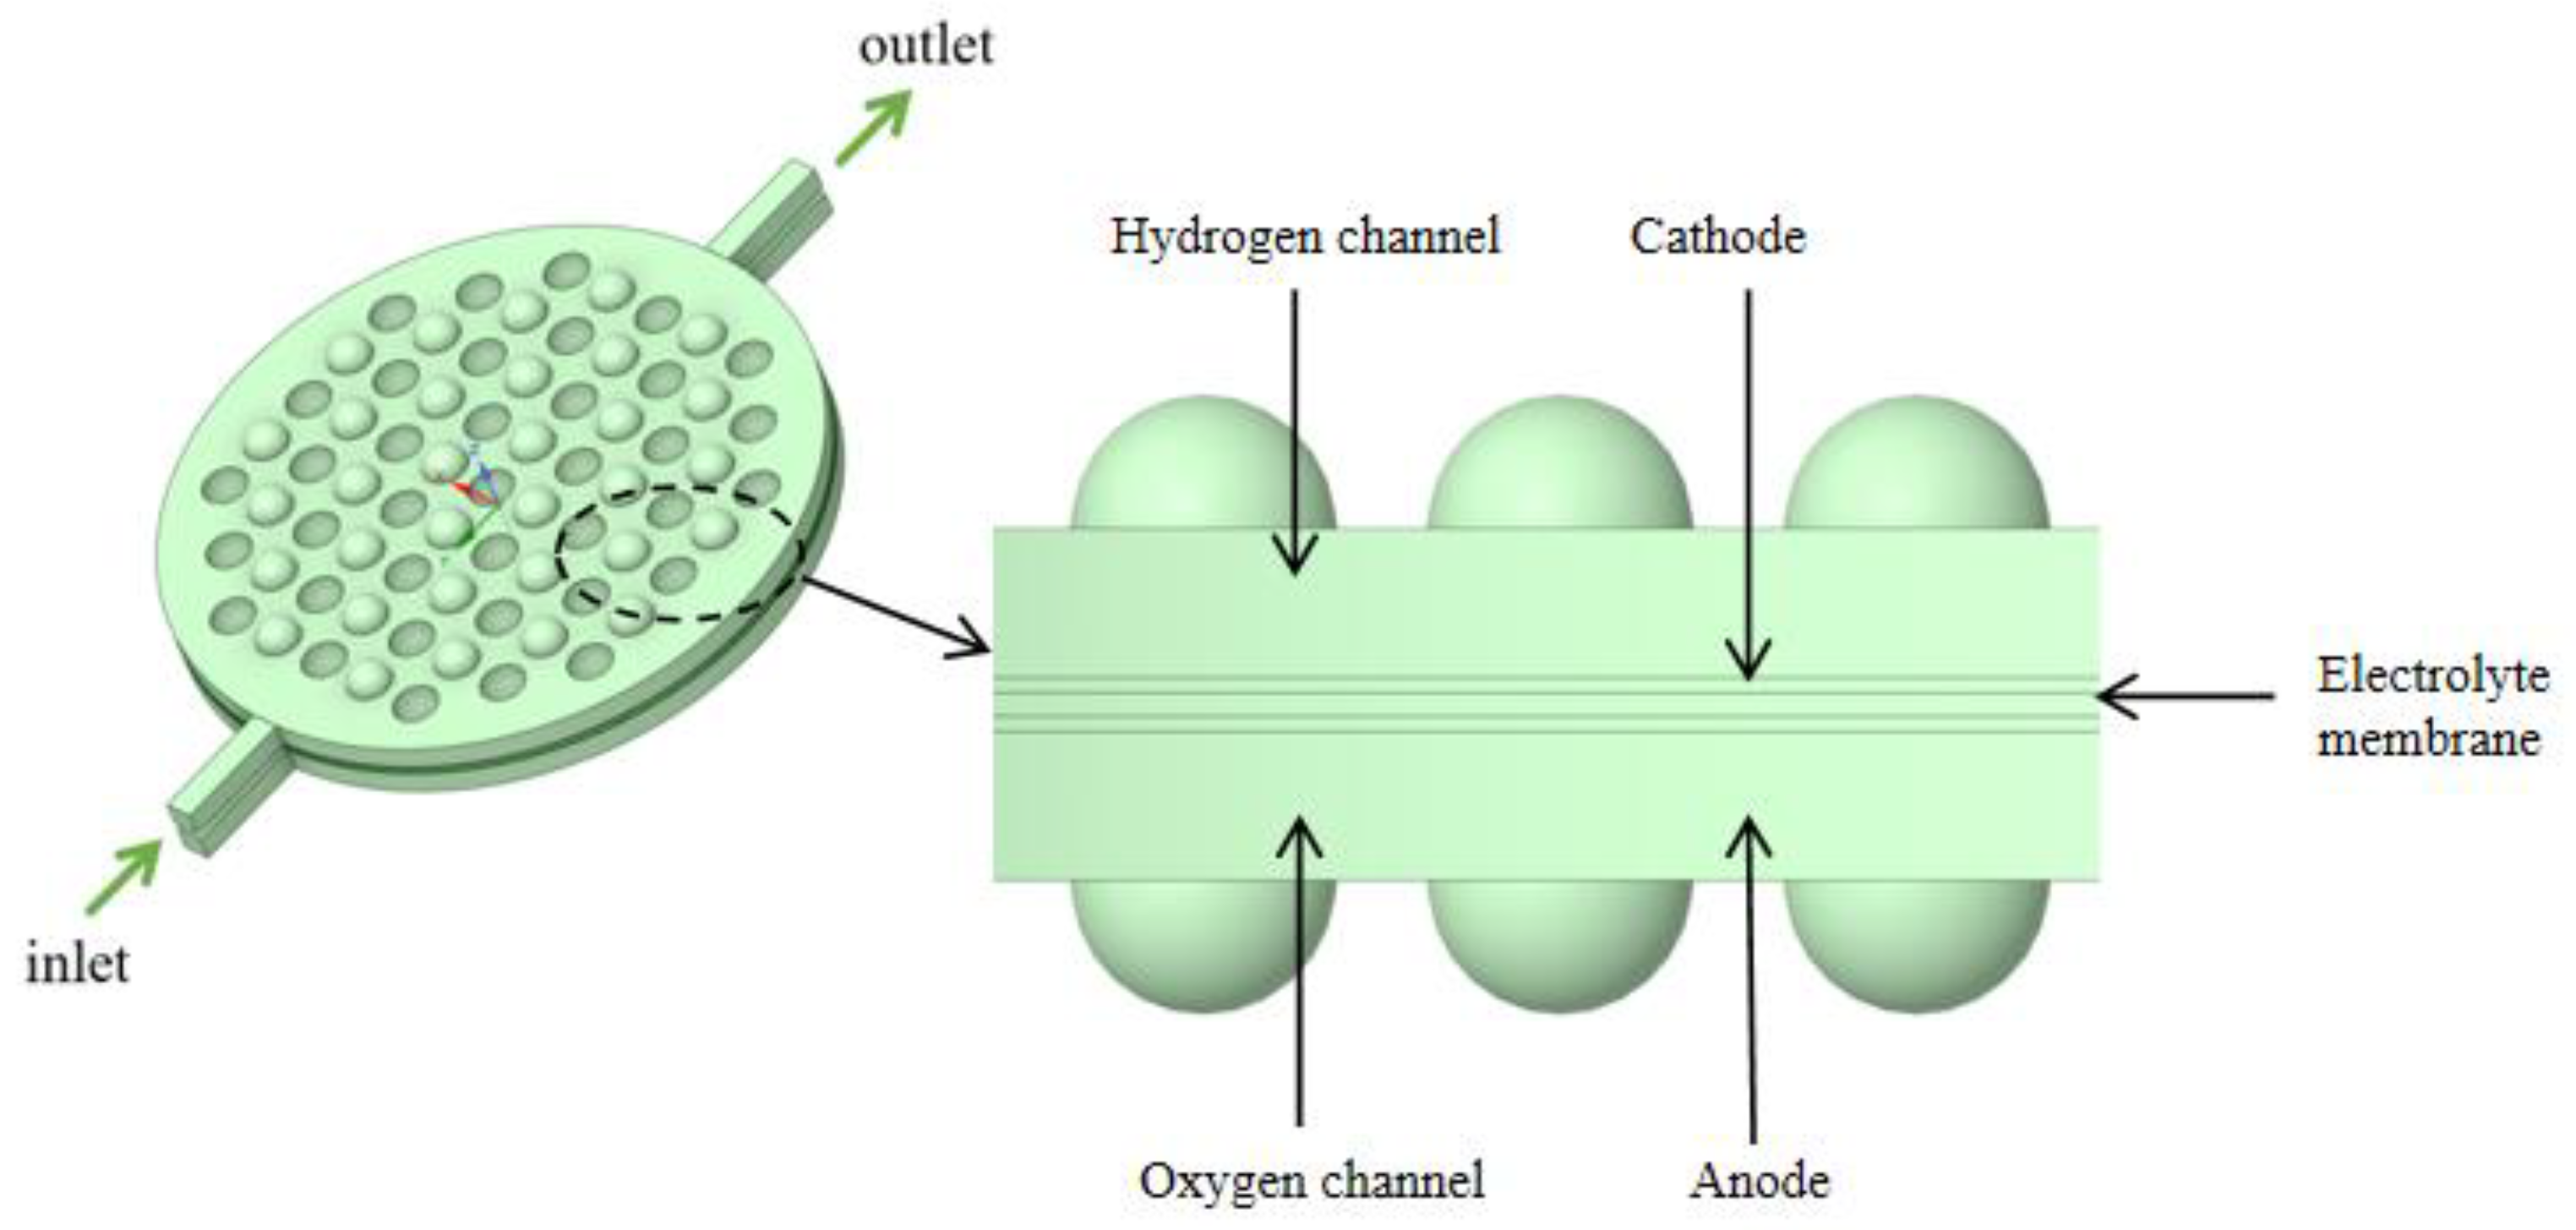
Industrial electrolytic cells typically adopt a compact, stacked structure. Each cell comprises a series of bipolar plates, a cathode, a membrane, an anode, and another bipolar plate, as shown in Figure 2. The space between these plates and their corresponding electrodes forms an electrolytic chamber, facilitating the electrolyte flow. Therefore, the structural design of the bipolar plates directly influences the flow uniformity within each electrolytic cell and requires meticulous consideration. To study the flow field within the electrolytic chamber, a three-dimensional computational domain of the same dimensions as the actual geometric shape was established. Considering the simultaneous generation of hydrogen (H2) and oxygen (O2) during the electrolysis process, the H2 and O2 phases were introduced into the existing single-phase flow field. The computational domain was simplified by selecting a single electrolytic chamber, as depicted in Figure 3. This domain included the cathode and anode channels, along with sections for the cathode, anode, membrane, and inlet/outlet channels. The generation of H2 and O2 occurs at the surfaces of the cathode and anode, with the membrane in between allowing only liquid to pass through. This ensures the flow of H2 and O2 in the cathode and anode channels. Gas is generated on the electrode surfaces and diffuses into the flow field. The vertical upward direction was considered the main flow direction, with gravity acting vertically downward. A cylindrical electrolytic chamber was established with a radius of 65 mm and a thickness of 5 mm in the z-axis. This chamber included inlet/outlet channels of 25 mm in length, along with a plate thickness of 0.5 mm, a membrane thickness of 0.8 mm, and a protrusion radius of 4.5 mm. The center distance between two horizontally adjacent identical units was 12 mm, as depicted in Figure 4, and the detailed geometric parameters are listed in Table 1. It is worth noting that the model assumes a consistent current density on the electrode surfaces. Additionally, the presence of bubbles does not lead to reduced reaction rates. Consequently, the distribution of bubbles in the flow field does not affect the electrolytic efficiency.
To explore the flow distribution within the electrolytic cells, six distinct geometric constructions were developed. These constructions were created by altering parameters such as the radius of the spherical protrusions and the number of inlets, as illustrated in Figure 5. The nomenclature used to identify these configurations follows a pattern: the G-protrusion radius and the R-number of inlets (e.g., G-4.5-1 denotes an electrolytic cell with a protrusion radius of 4.5 mm and one inlet). In comparison to the single-inlet model, the double-inlet model eliminates the bottom inlet and introduces two sets of inlets at positions 45° apart from each other relative to the axis. The three-inlet configuration, derived from the double-inlet setup, maintains the bottom inlet.

2.2. Model Overview

The Reynolds number (Re) is a dimensionless parameter defined as ρvDh/μ, where the hydraulic diameter (Dh) of the channel is expressed as Dh = 2 WH/(W + H), with W and H representing the width and height of the channel, respectively. In the case of a flat channel, the transition from a laminar to a turbulent flow occurs at the critical Reynolds number. Under the conditions studied in this paper, the Reynolds number of the electrolyte significantly exceeds the critical Reynolds number. Due to the presence of convex and concave structures causing disturbances in the channel flow, initiating local turbulence and altering boundary layer characteristics, the cathode and anode channels were considered turbulent fluids. In this study, ANSYS−Fluent 19.2, a universal commercial CFD software, was chosen for the proposed two-phase flow model. The Euler–Euler multiphase model was selected to simulate and analyze the behavior in the electrolytic chamber. This model treats each phase as a continuous medium, allowing for the simulation of various phases within the same computational domain. It considers the conservation equations for each phase separately, accounting for their interactions and dynamics. Also, this model provides options to simulate mass transfer between phases. The RNG k-ε turbulence model was employed to describe the turbulence. This turbulence model is known for providing better predictions in certain flow situations compared to the standard k-ε model. It can better handle complex flows and adverse pressure gradient situations with a strong streamlined curvature. In addition, it offers better predictions of near-wall turbulence compared to other models. Therefore, it is suitable for electrolysis cells with narrow channel sizes and complex fluid geometry like ours. The electrolysis process generating H2 and O2 on the surfaces of the anode and cathode plates is equivalent to the phase transfer process from the liquid phase to the H2 gas phase and O2 phase. This transfer process between phases is represented by the mass source term. The calculation of transfer rates is based on Faraday’s law, which states that gases are generated in thin layers close to the surface of the cathode and anode plates. These source terms were introduced into the multiphase model through user-defined functions (UDFs). The membrane separating the H2 and O2 flow channels is modeled as a porous medium, permitting only the electrolyte to pass through while restricting the passage of H2 and O2. The boundary conditions include the velocity inlet and pressure outlet; the inlet velocity is 0.056 m/s, and the working pressure is 1.6 Mpa. The inlet electrolyte temperature is maintained at 300 K, and the heat transfer prime of the concave–convex plate wall is 50,000 W/m2. The two-phase flow model in this study operates under the following assumptions:
(1)
The fluid phase is Newtonian, viscous, and incompressible.
(2)
Electrodes have uniform surfaces and a uniform current density distribution.
(3)
The current density remains constant and is unaffected by the gas phase.
(4)
The concentration of reactants in the electrolyte cell remains constant, allowing the neglect of the impact of substance concentration distribution on the reaction.
(5)
All channel walls, except for internal boundaries, are set with the no-slip condition.

2.3. Electrochemical Model

In an alkaline electrolysis cell, oxidation-reduction reactions occur on the anode and cathode surfaces, respectively, as shown below.
Anode :   2 O H 1 2 O 2 + H 2 O + 2 e
Cathode :   2 H 2 O + 2 e H 2 + 2 O H
Gaseous products are treated as ideal gases, assuming the complete conversion of all electrochemical reaction products at the electrode surface into the gas state. According to the principle of charge conservation, the production rates of reaction products can be directly computed from the magnitude of the electric current, as per Faraday’s law [27]. The calculation is executed using the equations:
m ˙ H 2 = M H 2 2 F i V
where iV (A·m−3) represents the volumetric current density, and F denotes the Faraday constant.

2.4. Two-Phase Euler–Euler k-ε Turbulence Model

The Euler–Euler multiphase flow model in Fluent calculates the flow by employing separate sets of conservation equations for each phase within the computational domain. It treats each phase as a continuous medium, accounting for phase interactions, volume fractions, and interphase transfer mechanisms such as mass, momentum, and energy exchange. Through numerical methods and iterative computations, it solves these equations simultaneously, considering phase behaviors, interactions, and transfers between phases across the computational domain. This approach enables the model to simulate and analyze complex multiphase flow phenomena, providing insights into various applications involving multiple interacting fluid phases.
Momentum conservation equations can be obtained by summing the individual momentum equations of the two phases as follows [26].
ρ c ( u c ) u c = [ p I + τ c ] + ρ c g + F m , c ϕ c + F c + m d c ϕ c ( u int u c )
ρ d ( u d ) u d = [ p I + τ d ] p ϕ d + ρ d g + F m , d ϕ d + F d m d c ϕ d ( u int u d )
where ρ represents the density, u denotes the velocity vector, p is the pressure scalar, I is the unit tensor, F represents the volume force, ϕ represents fraction, and τ denotes the viscous shear stress. Subscripts d and c respectively signify the dispersed phase and the continuous phase, respectively. The subscripts int and m represent the inlet and mass, respectively.
The continuity equations of the continuous phase and the dispersed phase are expressed in Equations (6) and (7), respectively.
( ϕ c u c + ϕ d u d ) = m d c ( 1 ρ c 1 ρ d ) , ϕ d = p h i d , ϕ c = 1 ϕ d
( ϕ d u d ) ( D m d ϕ d ) = m d c ρ d , D m d = μ T ρ σ T
In this context, phid represents the gas volume fraction, Dmd is the turbulent dispersion coefficient, μT is the turbulent dispersion coefficient, and σT is the turbulent model parameter.
Due to the extensive validation of the RNG k-ε model, this study employed the RNG k-ε model to simulate the two-phase gas–liquid flow in the electrolyzer cell. The use of wall functions achieved good convergence speed and relatively low memory requirements. Two additional variables were solved in Equations (8)–(10): the turbulent kinetic energy, k, and the turbulent energy dissipation rate, ε.
μ T = ρ C μ k 2 ε
ρ ( u m ) k = [ ( μ m + μ T σ k ) k ] + P K ρ ε
where um represents the mixture velocity, and Cε,1 and Cε,2 are turbulence-model constants with values of 1.44 and 1.92, respectively.

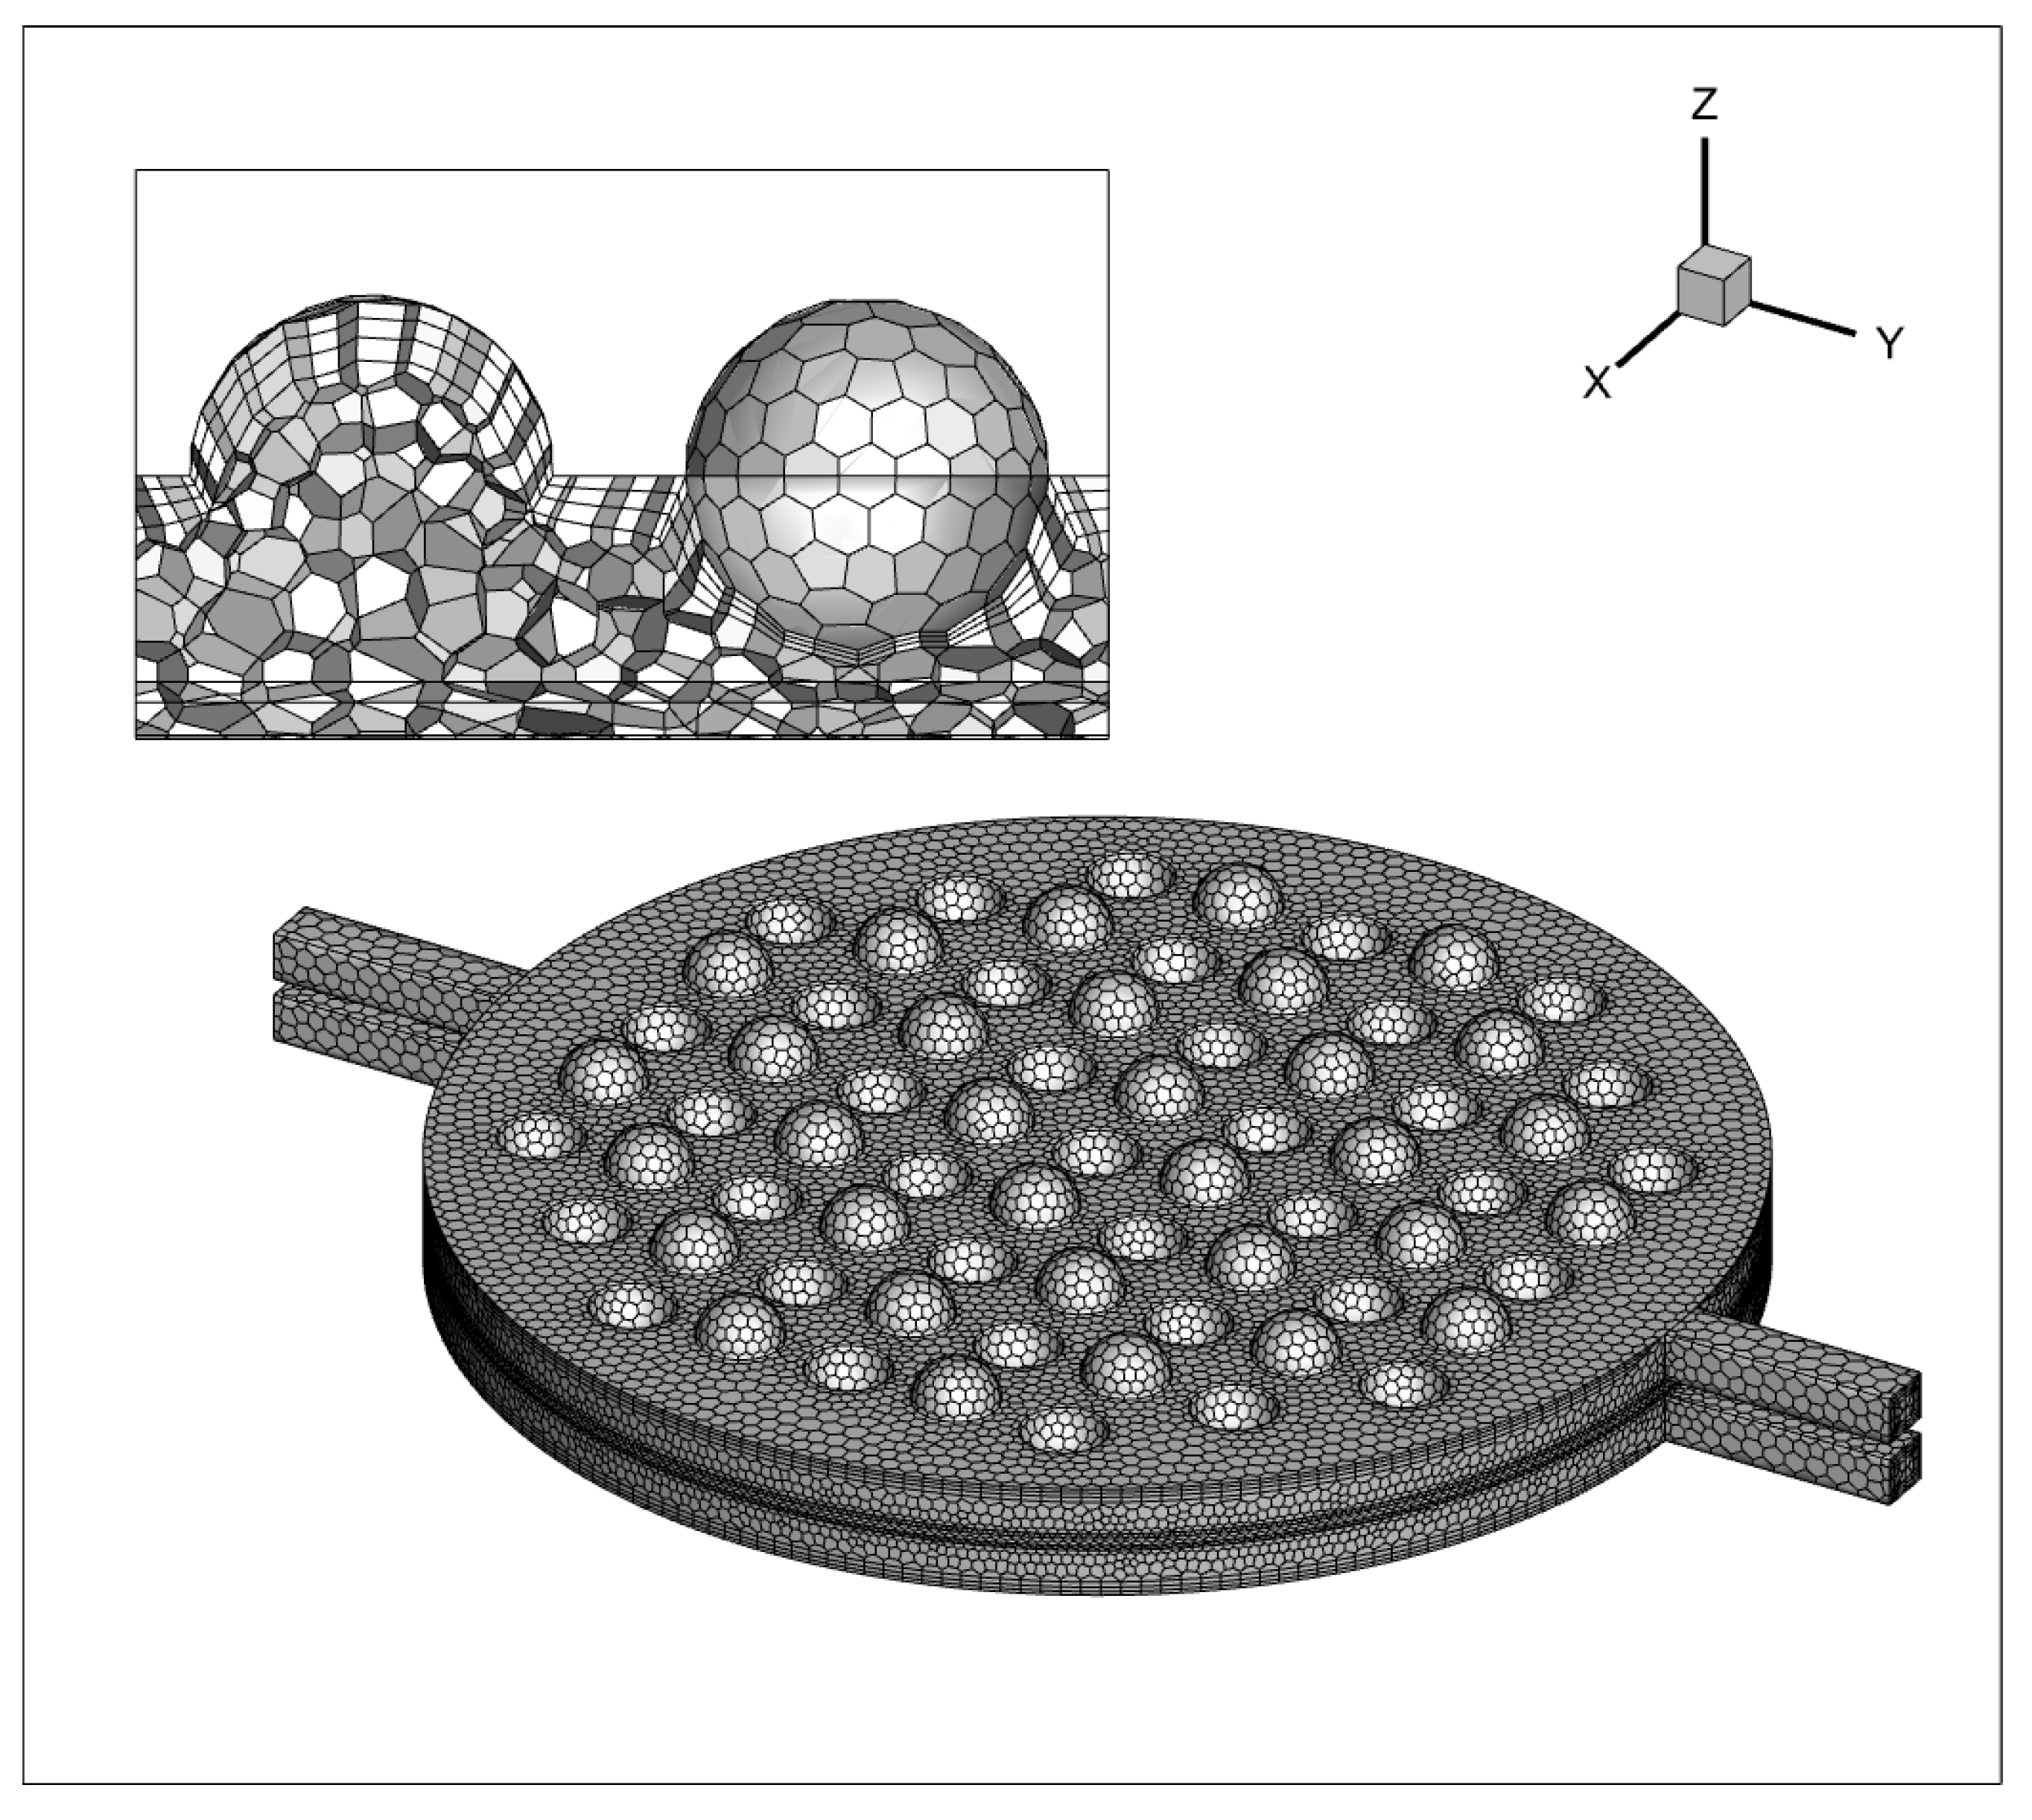
2.5. Grid and Independence Testing

Conducting a grid independence test was essential to validate that the solution is not significantly affected by changes in mesh density. This test ensured that the results were reliable and independent of the grid resolution, validating the accuracy of the simulation. As depicted in Figure 6, a polyhedral unstructured mesh is generated, with mesh refinement applied at the concave–convex structures near the channel walls and the sphere. The boundary layer mesh’s initial thickness is established at 0.05 mm, with a growth factor of 1.2, comprising three layers. A total of 1,100,684 mesh elements are utilized. The results show negligible disparity when increasing the mesh count by 20% or 40%, signifying that the computational accuracy stabilizes upon reaching the 1,100,684 mesh element count.

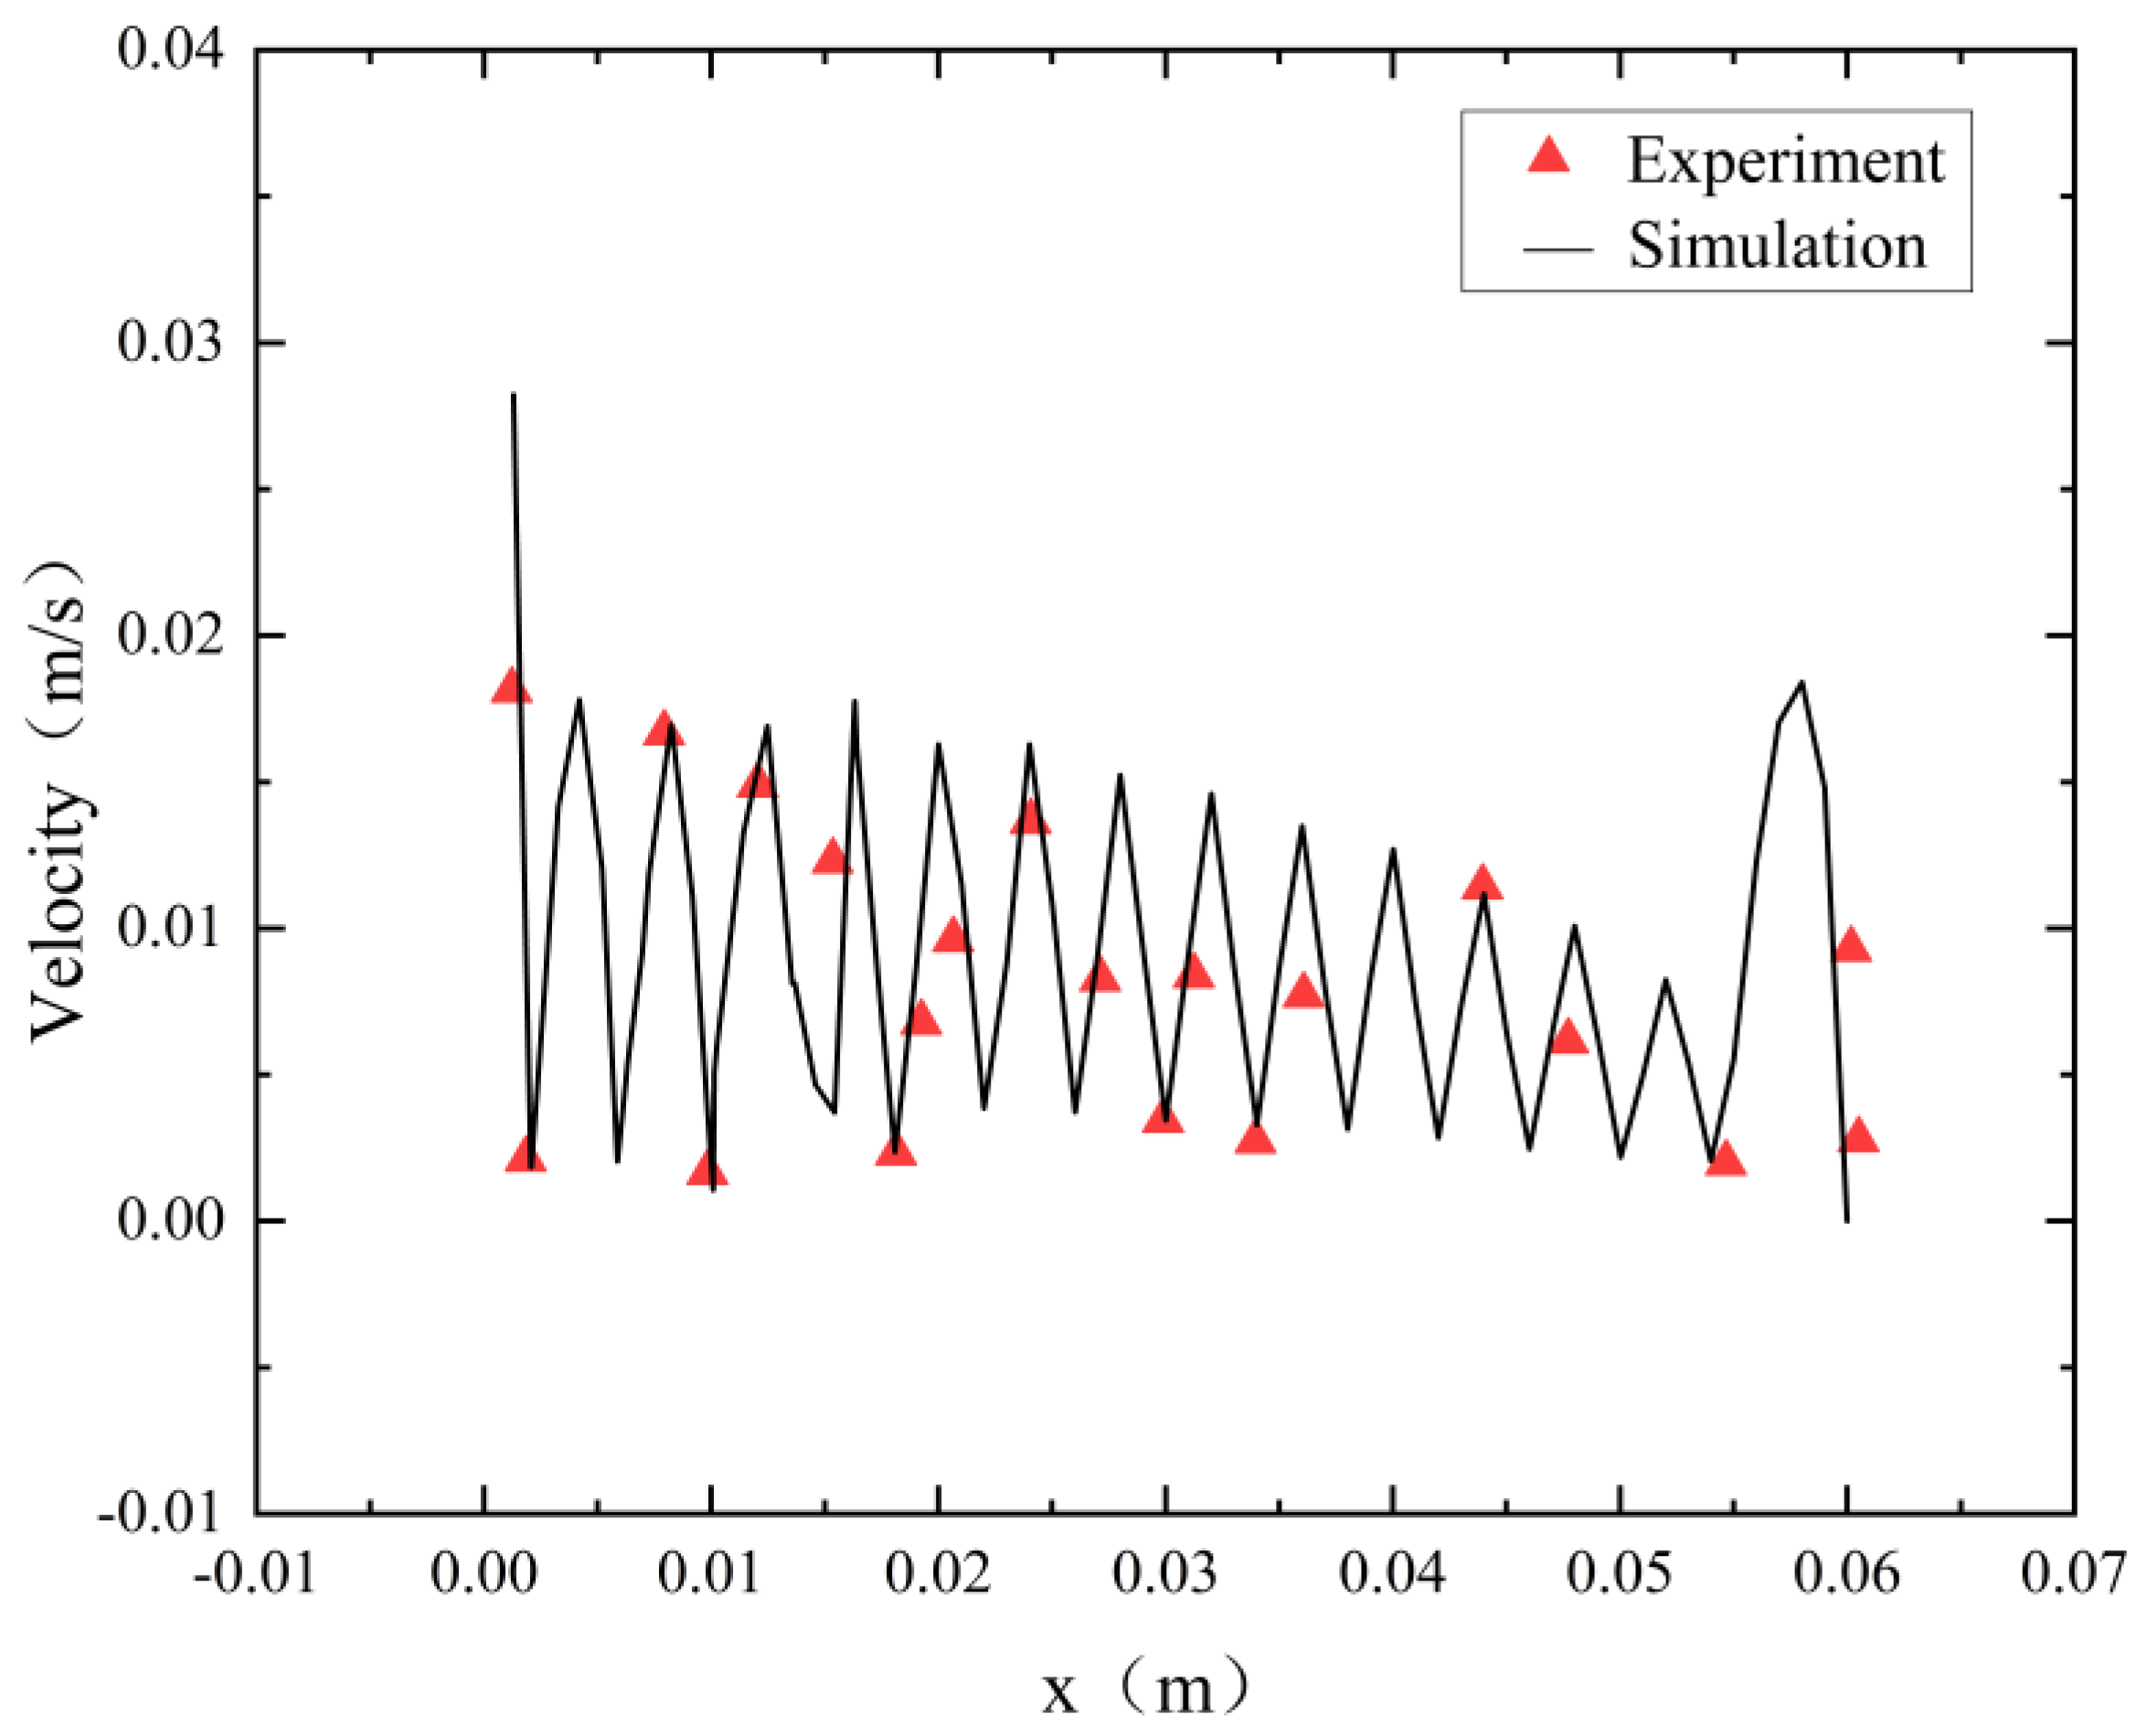
2.6. Model Validation

To assess the accuracy of the flow model employed in this study, we replicated an electrolytic water O2 production tank similar to the structure detailed in this paper [28]. In the experiment, the electrolyte flow rate was 0.015 m3/h, and the simulation adopted the same conditions as the experiment. Figure 7 compares the velocity distribution along the x-direction between the simulation and the measurement data. The simulation results closely align with the measurement data, demonstrating strong agreement between the numerical predictions and the actual experimental observations.

3. Results and Discussion

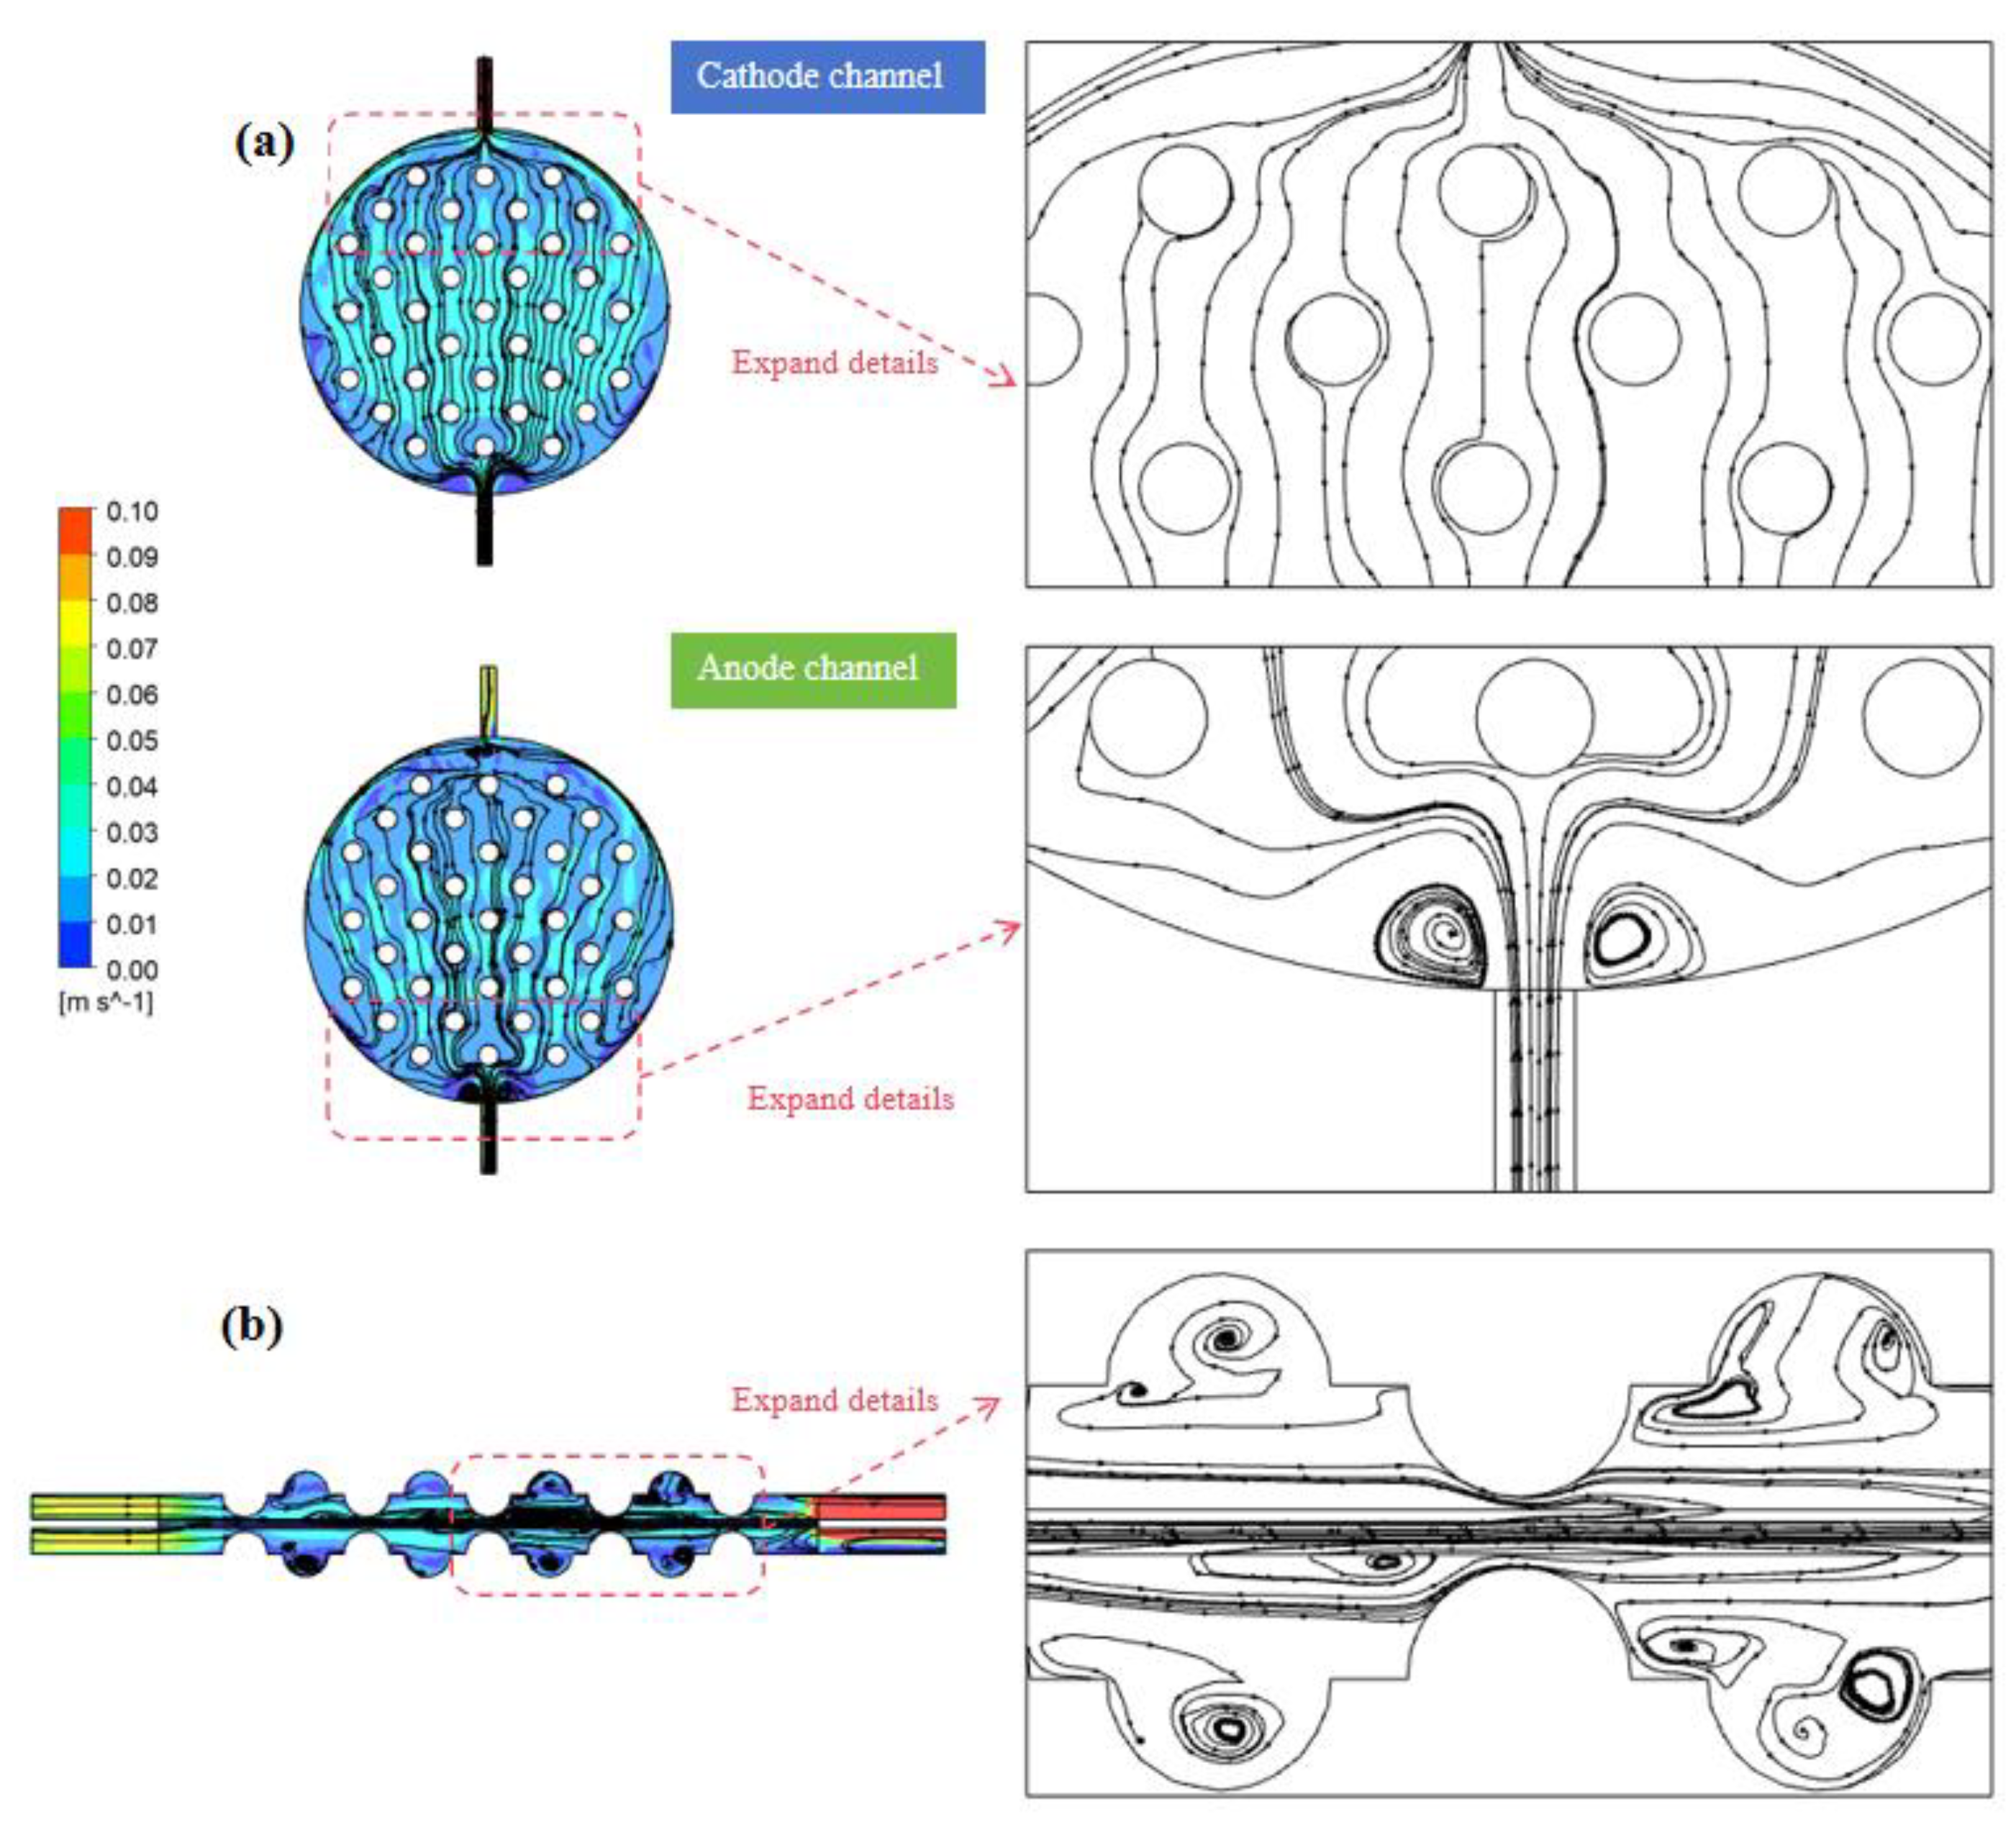
3.1. Analysis of Original Operating Conditions

Simulations were conducted to investigate the impact of operational parameters based on the G-4.5-1 model. Figure 8 illustrates the distribution of liquid-phase streamlines in the channel at a flow velocity of 0.056 m/s. Figure 8a, referencing the anode–cathode plate, illustrates the electrolyte velocity distribution at a distance of 2.4 mm along the z-direction from the electrode and channel surfaces. From the graph, similarities in the electrolyte velocity fields within the anode and cathode channels can be observed. The velocity near the center axis along the mainstream direction is significantly higher than at the channel boundaries, resulting in a pronounced, non-uniform flow distribution. Additionally, elevated velocities are also noticeable at the channel inlet and outlet, as well as at the rear edges. The peaked velocity in the cathode channel reaches 0.1 m/s, located at the outlet, attributed to the sudden expansion of the channel cross-sectional area when the electrolyte enters the electrode channel. Owing to fluid inertia, the electrolyte does not immediately spread along the side walls of the electrode channel but undergoes a progressive expansion as it ascends. Upon encountering concave–convex structures, the electrolyte flows along both sides of the channel. As it progresses to the rear section, the influence of convex structures weakens, leading to a gradual reduction in the channel’s cross-sectional area. As gas generation ensues, the convex-structure units obstruct and redirect the fluid, compelling it to flow laterally within the gap between the two units. Consequently, this action decreases the velocity disparity on the horizontal cross section. The electrolyte then moves towards both sides of the channel and gradually converges towards the outlet.
In Figure 8b, the distribution of electrolytes’ flow lines in the yz-axis central plane is shown. It reveals that the flow of electrolytes on the cross section primarily occurs between the convex structures in the electrode channel. Notably, areas with elevated flow velocities predominantly cluster around the peripheries of the convex structures, while the flow near the bottom region of the concave structures is notably sluggish, approaching zero. This occurrence was attributed to the generation of vortices within the concave structures, impeding the prompt backflow of electrolytes and gas within these regions. Consequently, the flow velocities across each cross section, in alignment with the flow direction, manifest higher speeds at the center and gradually diminish towards the peripheries. As the electrolyte flow progressively evolves within the electrode channel, the velocities across identical cross sections tend to attain greater uniformity.

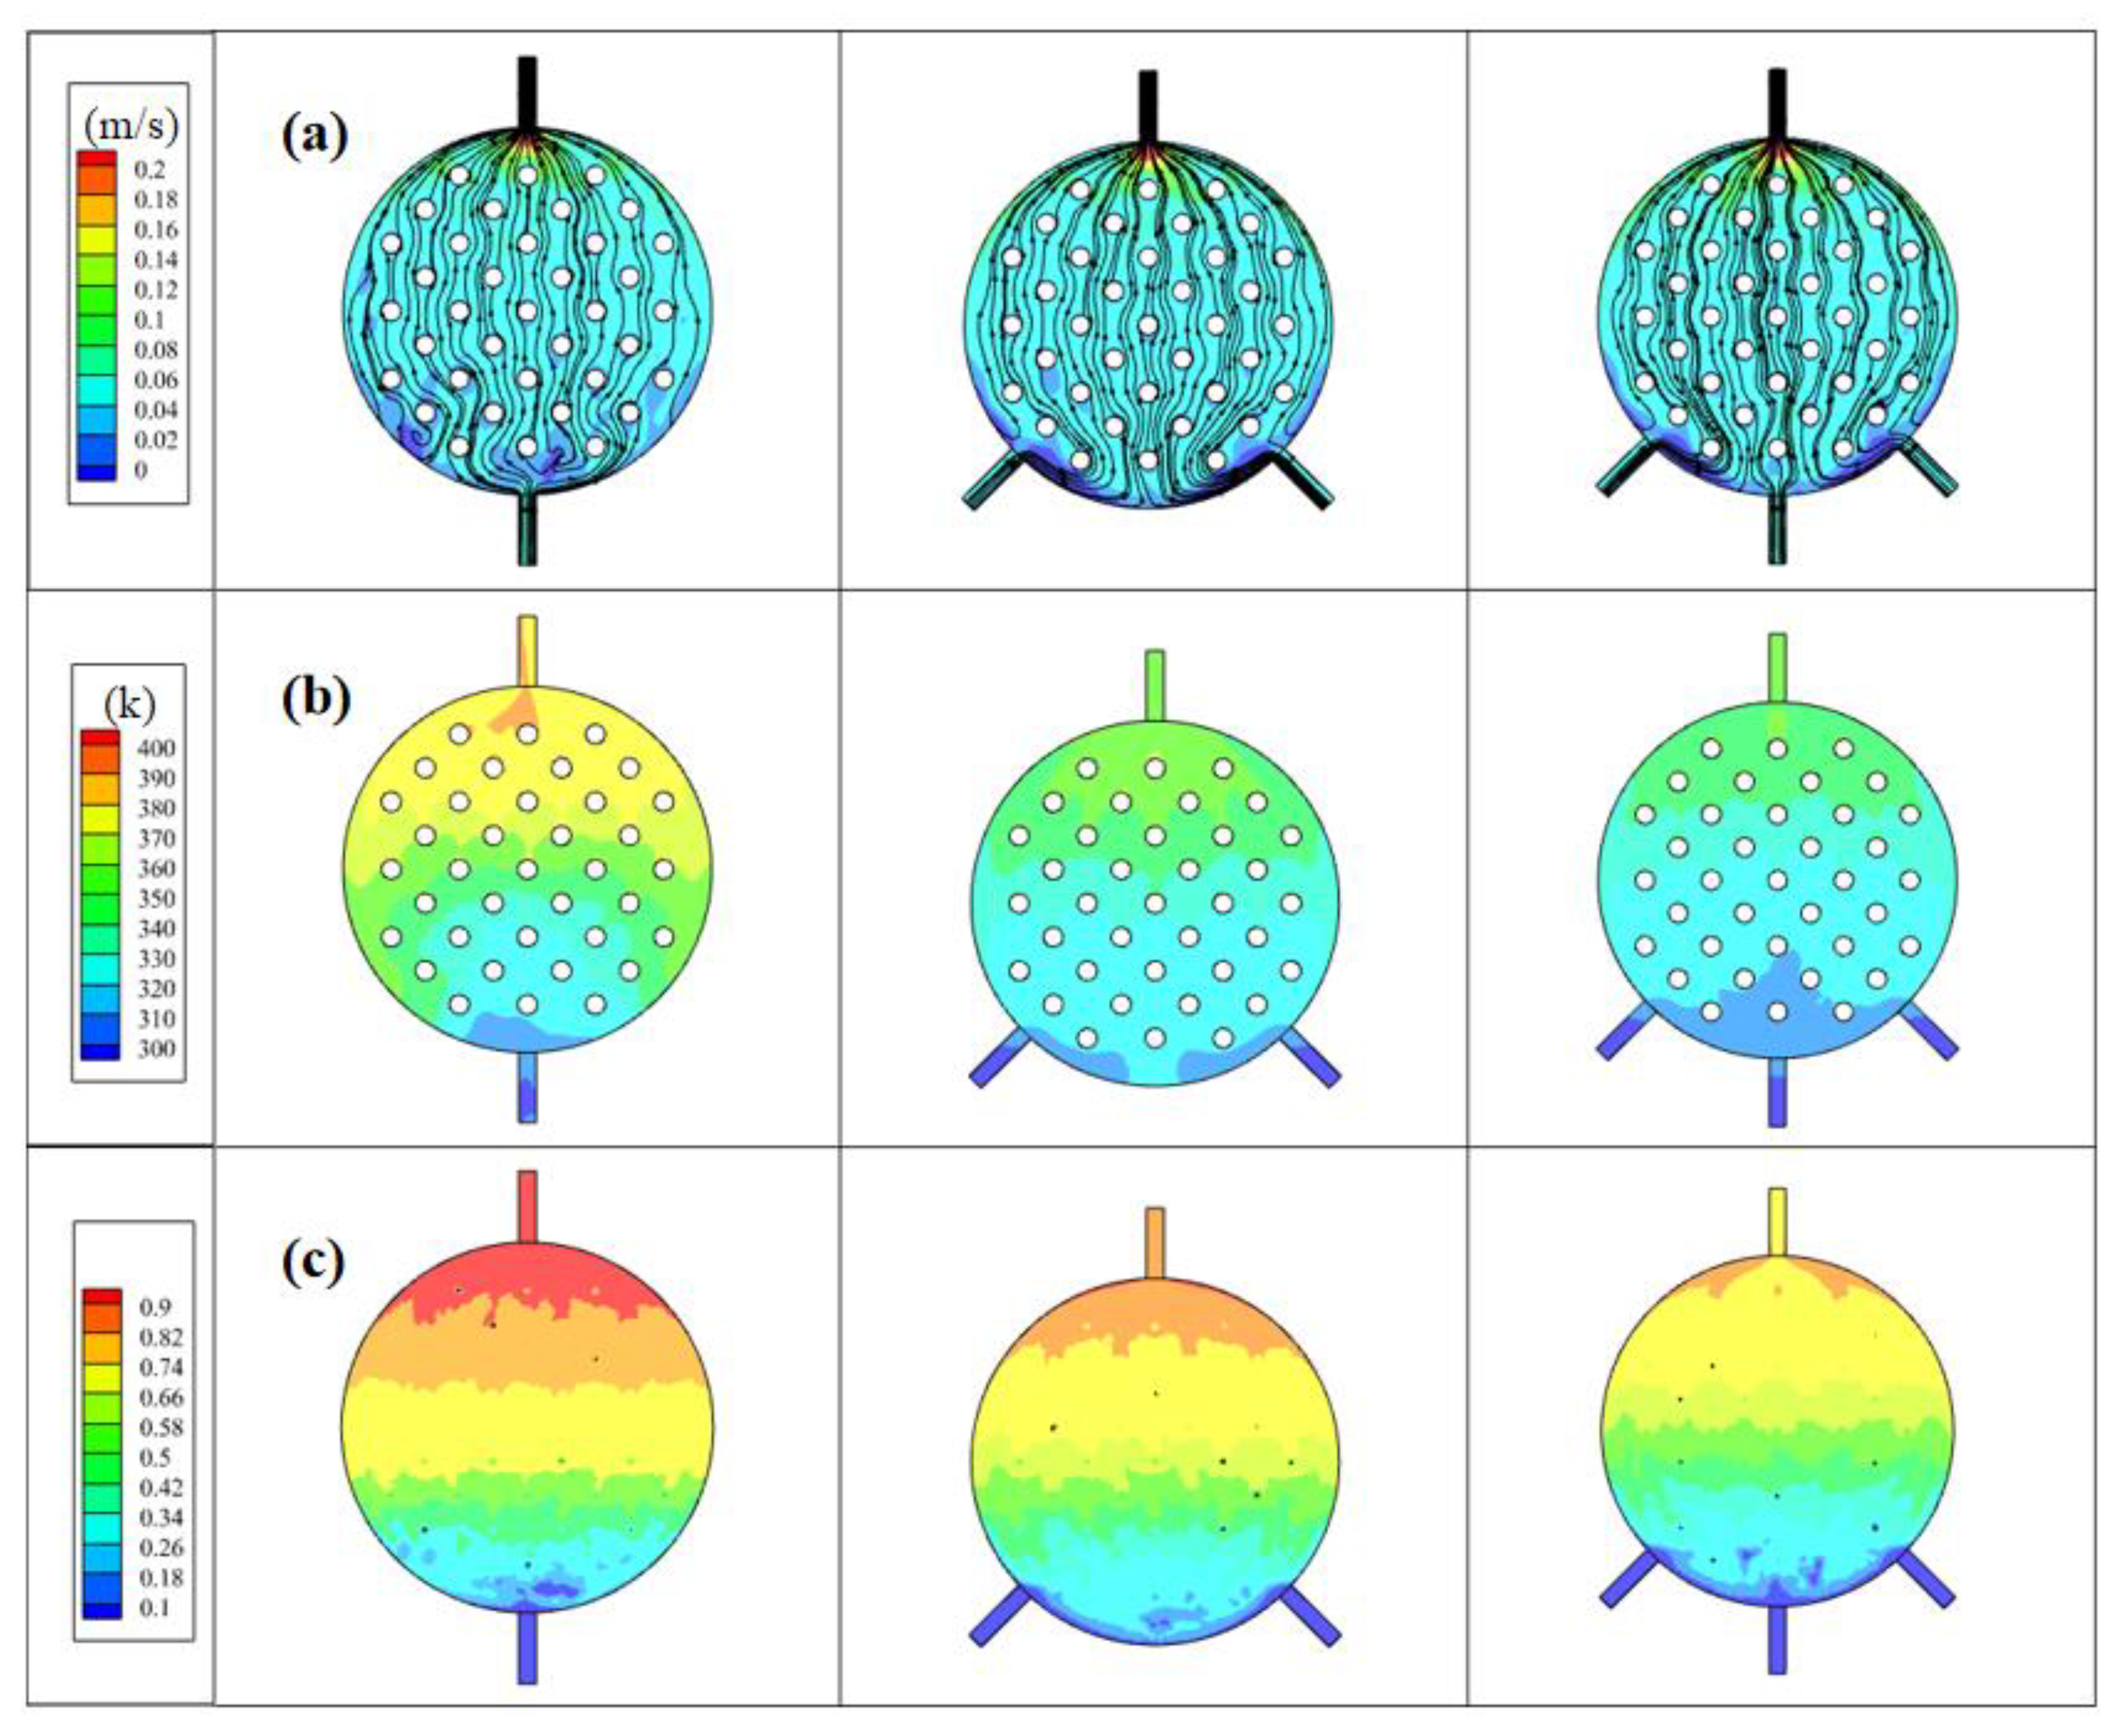
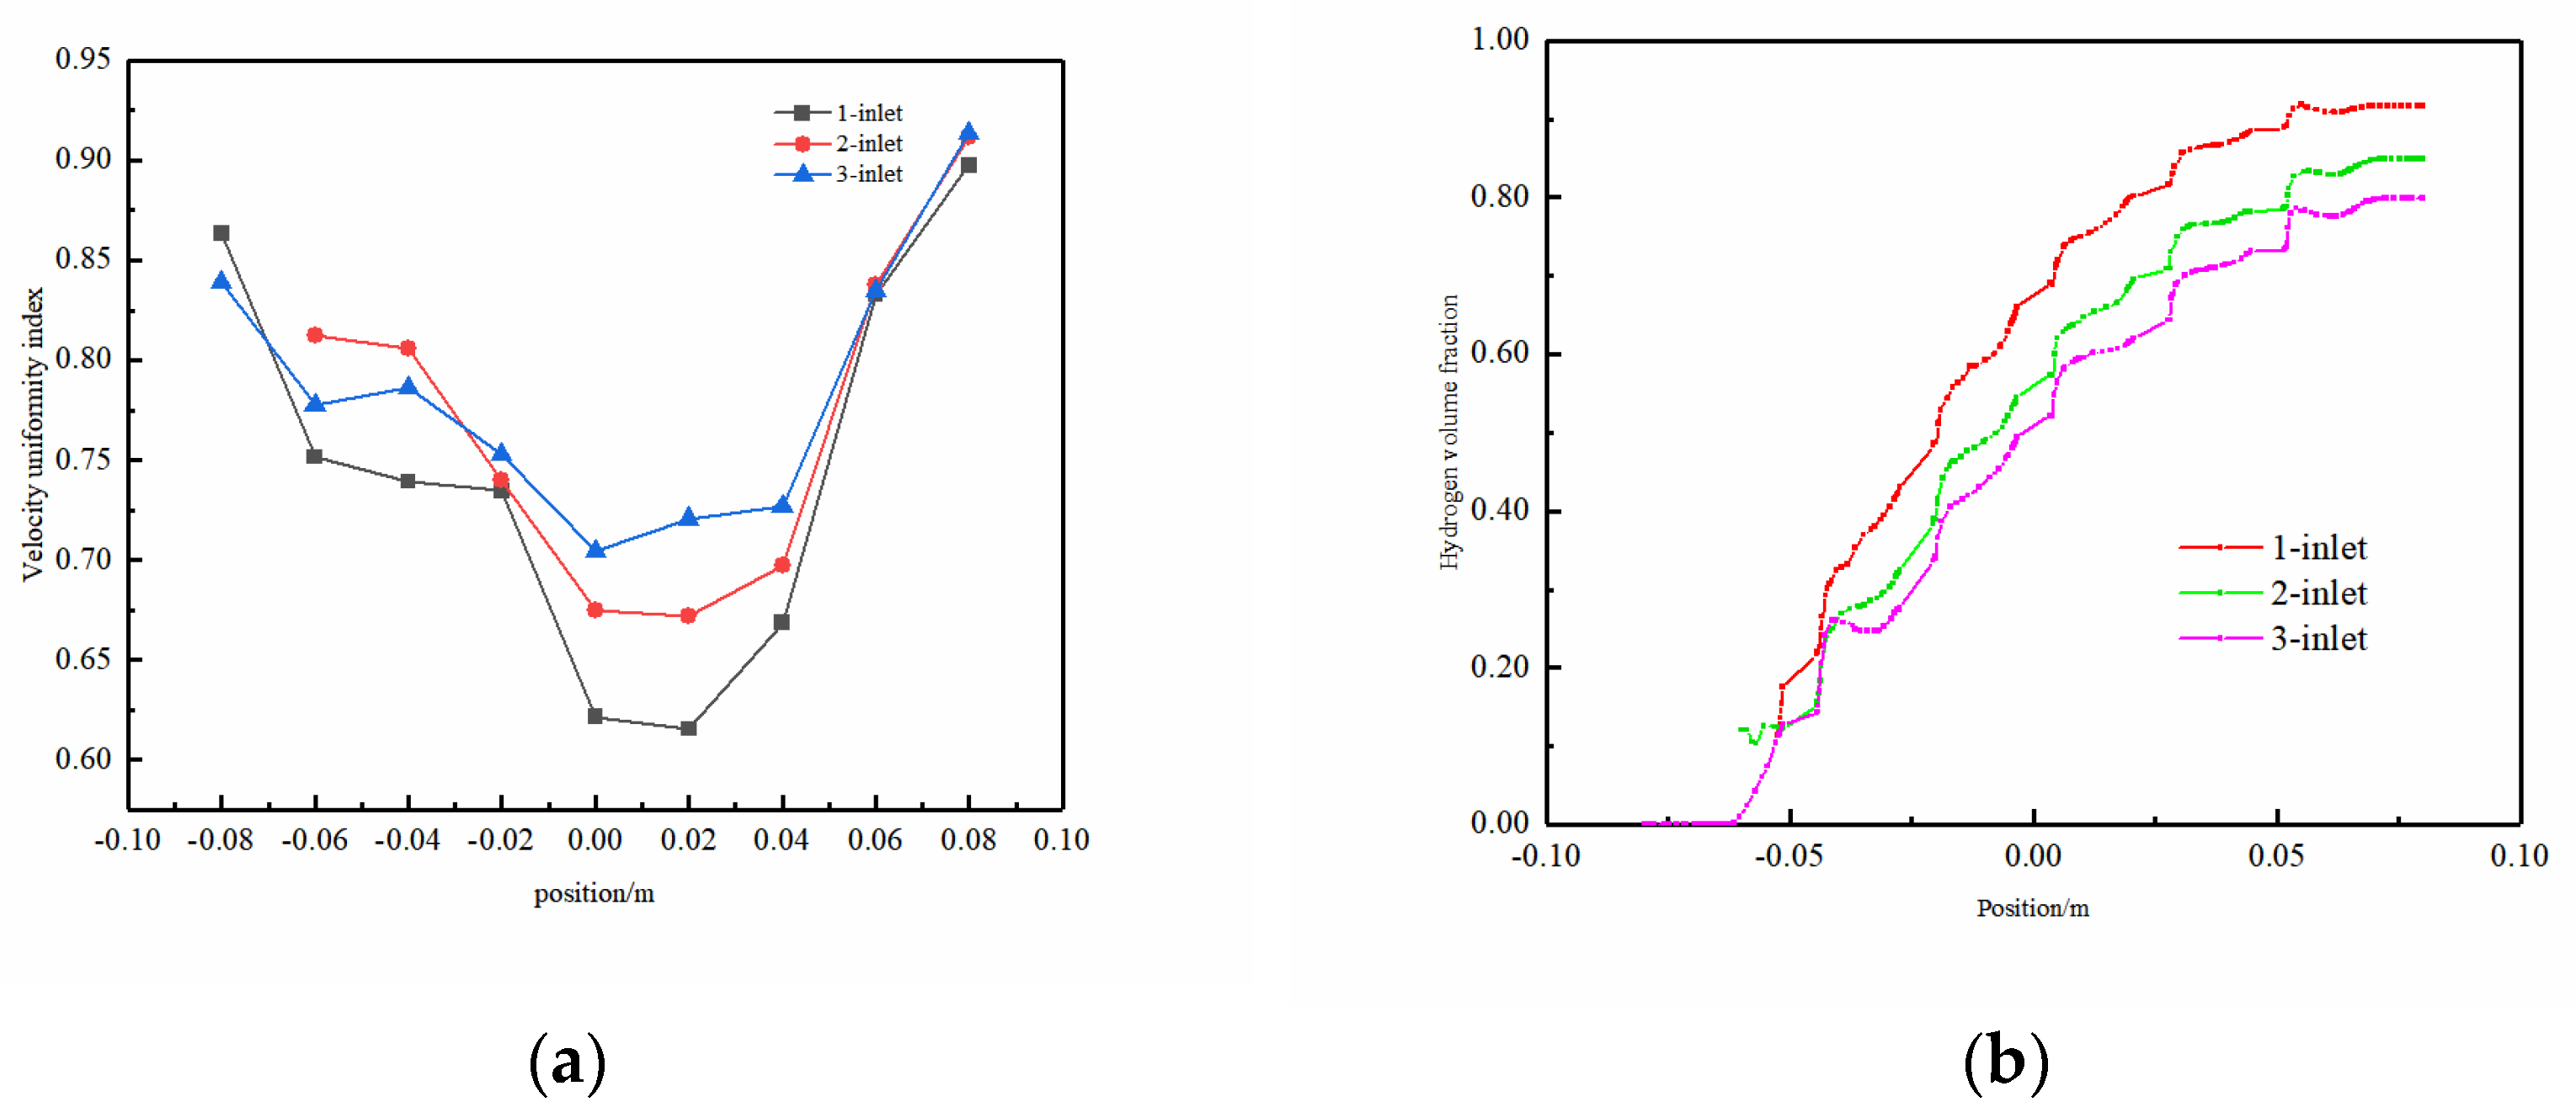
3.2. Impact of Inlet Characteristics on the Performance of Electrolytic Cells

Based on the previous analysis of the electrolytic cell structure, notable issues emerged with a single inlet and outlet, leading to an uneven inflow, an asymmetric circulation on both sides, and a non-uniform fluid temperature distribution. To address these concerns, an electrolytic cell with multiple inlets was introduced and simulated, aiming to promote a more even distribution of fluid. The resulting flow field closely resembles configurations commonly utilized in practical applications, transitioning from a concave spherical surface to a convex spherical surface. Given the intricacies of managing a two-phase flow system and the fact that H2 gas generation outpaces that of O2, the primary focus of this investigation centered on H2 gas production at the cathode side. Figure 9 illustrates a comparison of the electrolyte flow rate, H2 flow line, and gas volume fraction distribution in electrolytic cells with varying inlet quantities. The distances chosen to analyze parameters in Figure 9 correspond to our simulations’ nuances. Specifically, we examined velocity and temperature at 2.4 mm and gas volume fraction at 0.7 mm, driven by the observed dynamics. Gas generation at the electrode surface at 0.7 mm led to notable accumulation, emphasizing its analysis at this point. In contrast, the concave–convex structure’s effect on velocity and temperature was clearer at 2.4 mm. Thus, our choice aimed to emphasize both gas generation and structural influences within the experimental setup for a comprehensive understanding.
Figure 9a shows the electrolyte velocity distribution of models with different inlet quantities, referencing the anode–cathode plate and examining the electrolyte velocity distribution at a distance of 2.4 mm along the z-direction from the electrode and channel surfaces. Compared to the single-inlet model, both the dual-inlet and three-inlet models exhibited higher velocity values on both sides. Additionally, in the single-inlet model, there were substantial flow dead zones on both sides of the electrolytic cell. The dual-inlet model showcased flow dead zones in the front half of the middle section of the electrolytic cell, while the three-inlet model enhanced the overall velocity uniformity compared to these two models. It effectively reduced the flow dead zones within the electrolytic cell. This is because multiple inlets allow for the distribution of the incoming fluid across various points along the channel, ensuring a more uniform distribution of the electrolyte or fluid within the cell. This helps prevent localized high- or low-flow areas, leading to a more balanced and uniform flow throughout the cell.
Figure 9b shows the electrolyte temperature distribution of models with different inlet quantities, referencing the anode–cathode plate and examining the electrolyte temperature distribution at a distance of 2.4 mm along the z-direction from the electrode and channel surfaces. It reveals a correlation wherein areas with higher flow velocities correspond to lower temperatures, and vice versa. This is because, when the flow rate is high, the interaction between electrolytes is more intense, which enhances the heat exchange between electrolytes. At the same time, the update speed of the electrolyte is accelerated, and the cold electrolyte can be replenished promptly to exchange heat and cool the electrolyte in the channel, preventing a continuous temperature surge caused by sustained water electrolysis within the channels. This mechanism serves to safeguard electrolysis efficiency, averting potential decreases. The augmentation of outlet numbers leads to a gradual temperature reduction. Although the dual-inlet model exhibits an overall temperature decrease compared to the single-inlet model, the presence of a dead zone at the bottom of the channel leads to higher electrolyte temperature and reduced temperature uniformity. Due to the fewer flow dead zones in the three-inlet model, the electrolytic cell receives timely heat exchange, resulting in a decrease in the overall temperature and an improvement in temperature uniformity.
Figure 9c shows the electrolyte H2 gas volume fraction distribution of models with different inlet quantities, referencing the anode–cathode plate and examining the electrolyte temperature distribution at a distance of 0.7 mm along the z-direction from the electrode and channel surfaces. Within the single-inlet electrolytic cell, the volume fraction of H2 gas approaches 1 close to the exit. This signifies that H2 accumulates at the outlet without being promptly discharged from the electrolytic cell. With an increase in the number of inlets, the concentration of H2 gas within the electrolytic cell gradually diminishes. This reduction is particularly pronounced in the latter part of the electrolytic cell, implying that a higher number of inlets can facilitate a quicker outflow of H2 gas from the cell, resulting in a more uniform overall gas distribution. However, in the dual-outlet configuration, the existence of a dead zone at the bottom causes a delay in H2 gas discharge. Conversely, the three-inlet structure demonstrates the most favorable gas uniformity, emphasizing the positive impact of a moderately increasing number of inlets. This enhancement promotes fluid velocity, effectively expelling electrolyte–gas mixtures and fostering a more even distribution of fluid temperature and gas concentration. Ultimately, these improvements enhance the operational performance of the electrolytic cell, thereby holding practical value in optimizing and enhancing the efficiency of industrial electrolysis processes.
To comprehensively assess the influence of multiple inlets on the performance of the electrolytic cell, this study introduced an evaluation index for the uniformity of velocity distribution in flow channels. Based on the definition of statistical deviation, it can comprehensively reflect the fluid velocity distribution characteristics of the entire flow section and has the characteristics of strong comparability and wide applicability. The expression for the uniformity index is:
Γ = 1 1 2 n i = 1 n | u i u ¯ | u ¯
where, ui and u represent the velocity at the measurement point and the average velocity on the measurement section, respectively, and n represents the number of measurement points; the range of Γ is between [0, 1], and the larger the value, the better the flow uniformity.
Electrolyte velocity uniformity and H2 volume fraction on the yz-axis central plane were focused upon. As shown in Figure 10a, the uniformity index along the yz plane at x = 0 mm exhibited a trend of an initial decrease, followed by an increase, with the optimal uniformity position observed at the fluid outlet. This variation was attributed to the distinct dynamic influences applied to the fluid in different parts of the channel. In the initial segment of the channel, the lower flow velocity impacts the fluid’s movement due to the presence of the spherical protrusion structure, causing lateral flow on both sides. As the fluid reaches the middle of the channel, the lateral velocity diminishes substantially compared to the velocity in the middle, resulting in reduced fluid flow uniformity. In the latter half of the electrolytic cell, fluid accumulation occurs, accompanied by an increase in lateral flow velocity, thereby enhancing the uniformity index. Upon reaching the outlet position, a reduced cross-sectional area and increased mixing density eliminate the influence of the spherical protrusion structure. This leads to a significant rise in fluid velocity, optimizing the velocity uniformity within the flow field. Additionally, a discernible observation from the charts indicates that the single-inlet model demonstrated the most pronounced fluctuations in flow field uniformity, whereas the three-inlet model exhibited the smallest fluctuations. This highlights the three-inlet model’s stability, showcasing a more consistent characteristic with an increased number of inlets.
Figure 10b illustrates the volume fraction of H2 gas on the yz-axis center plane. Evidently, with an increase in the number of inlets, the H2 concentration gradually decreases, which is particularly noticeable in the latter half of the electrolytic cell. At the outlet, the H2 volume fraction for G-4.5-3 is 22% lower than that of G-4.5-1. The overall fluctuation in H2 concentration for the G-4.5-3 model was relatively small, indicating good uniformity in the distribution of gases in this model.

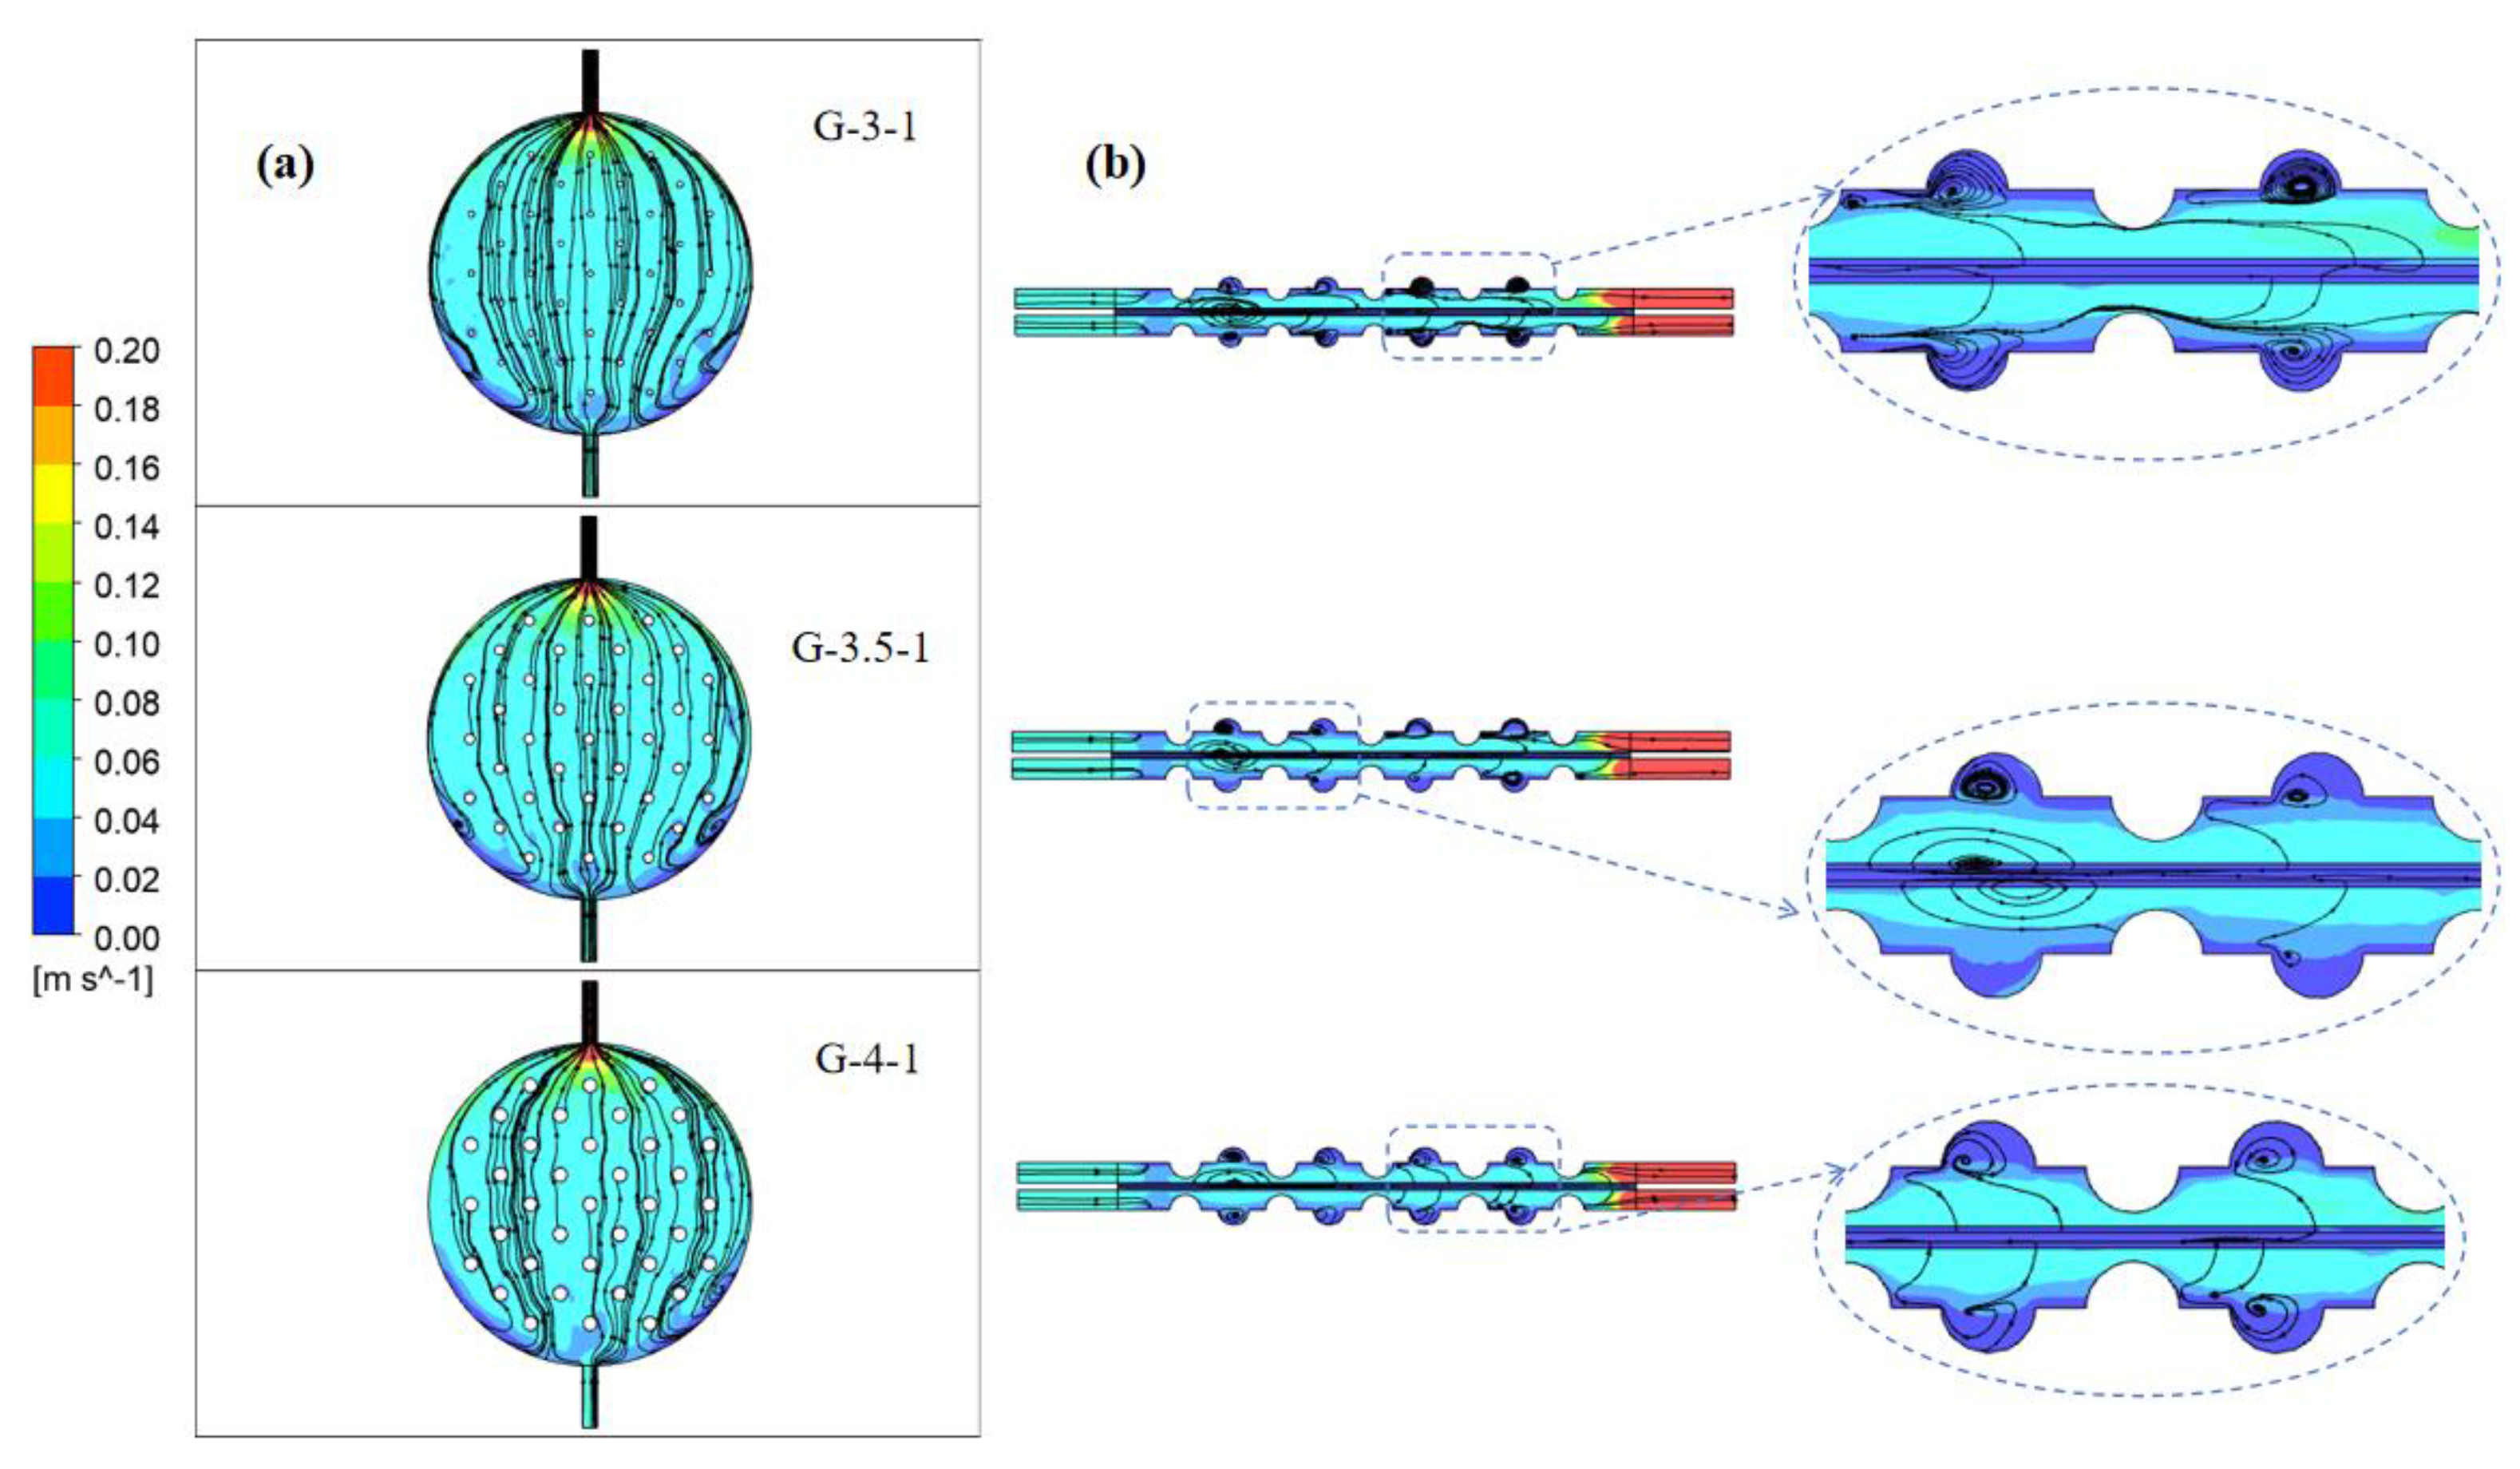
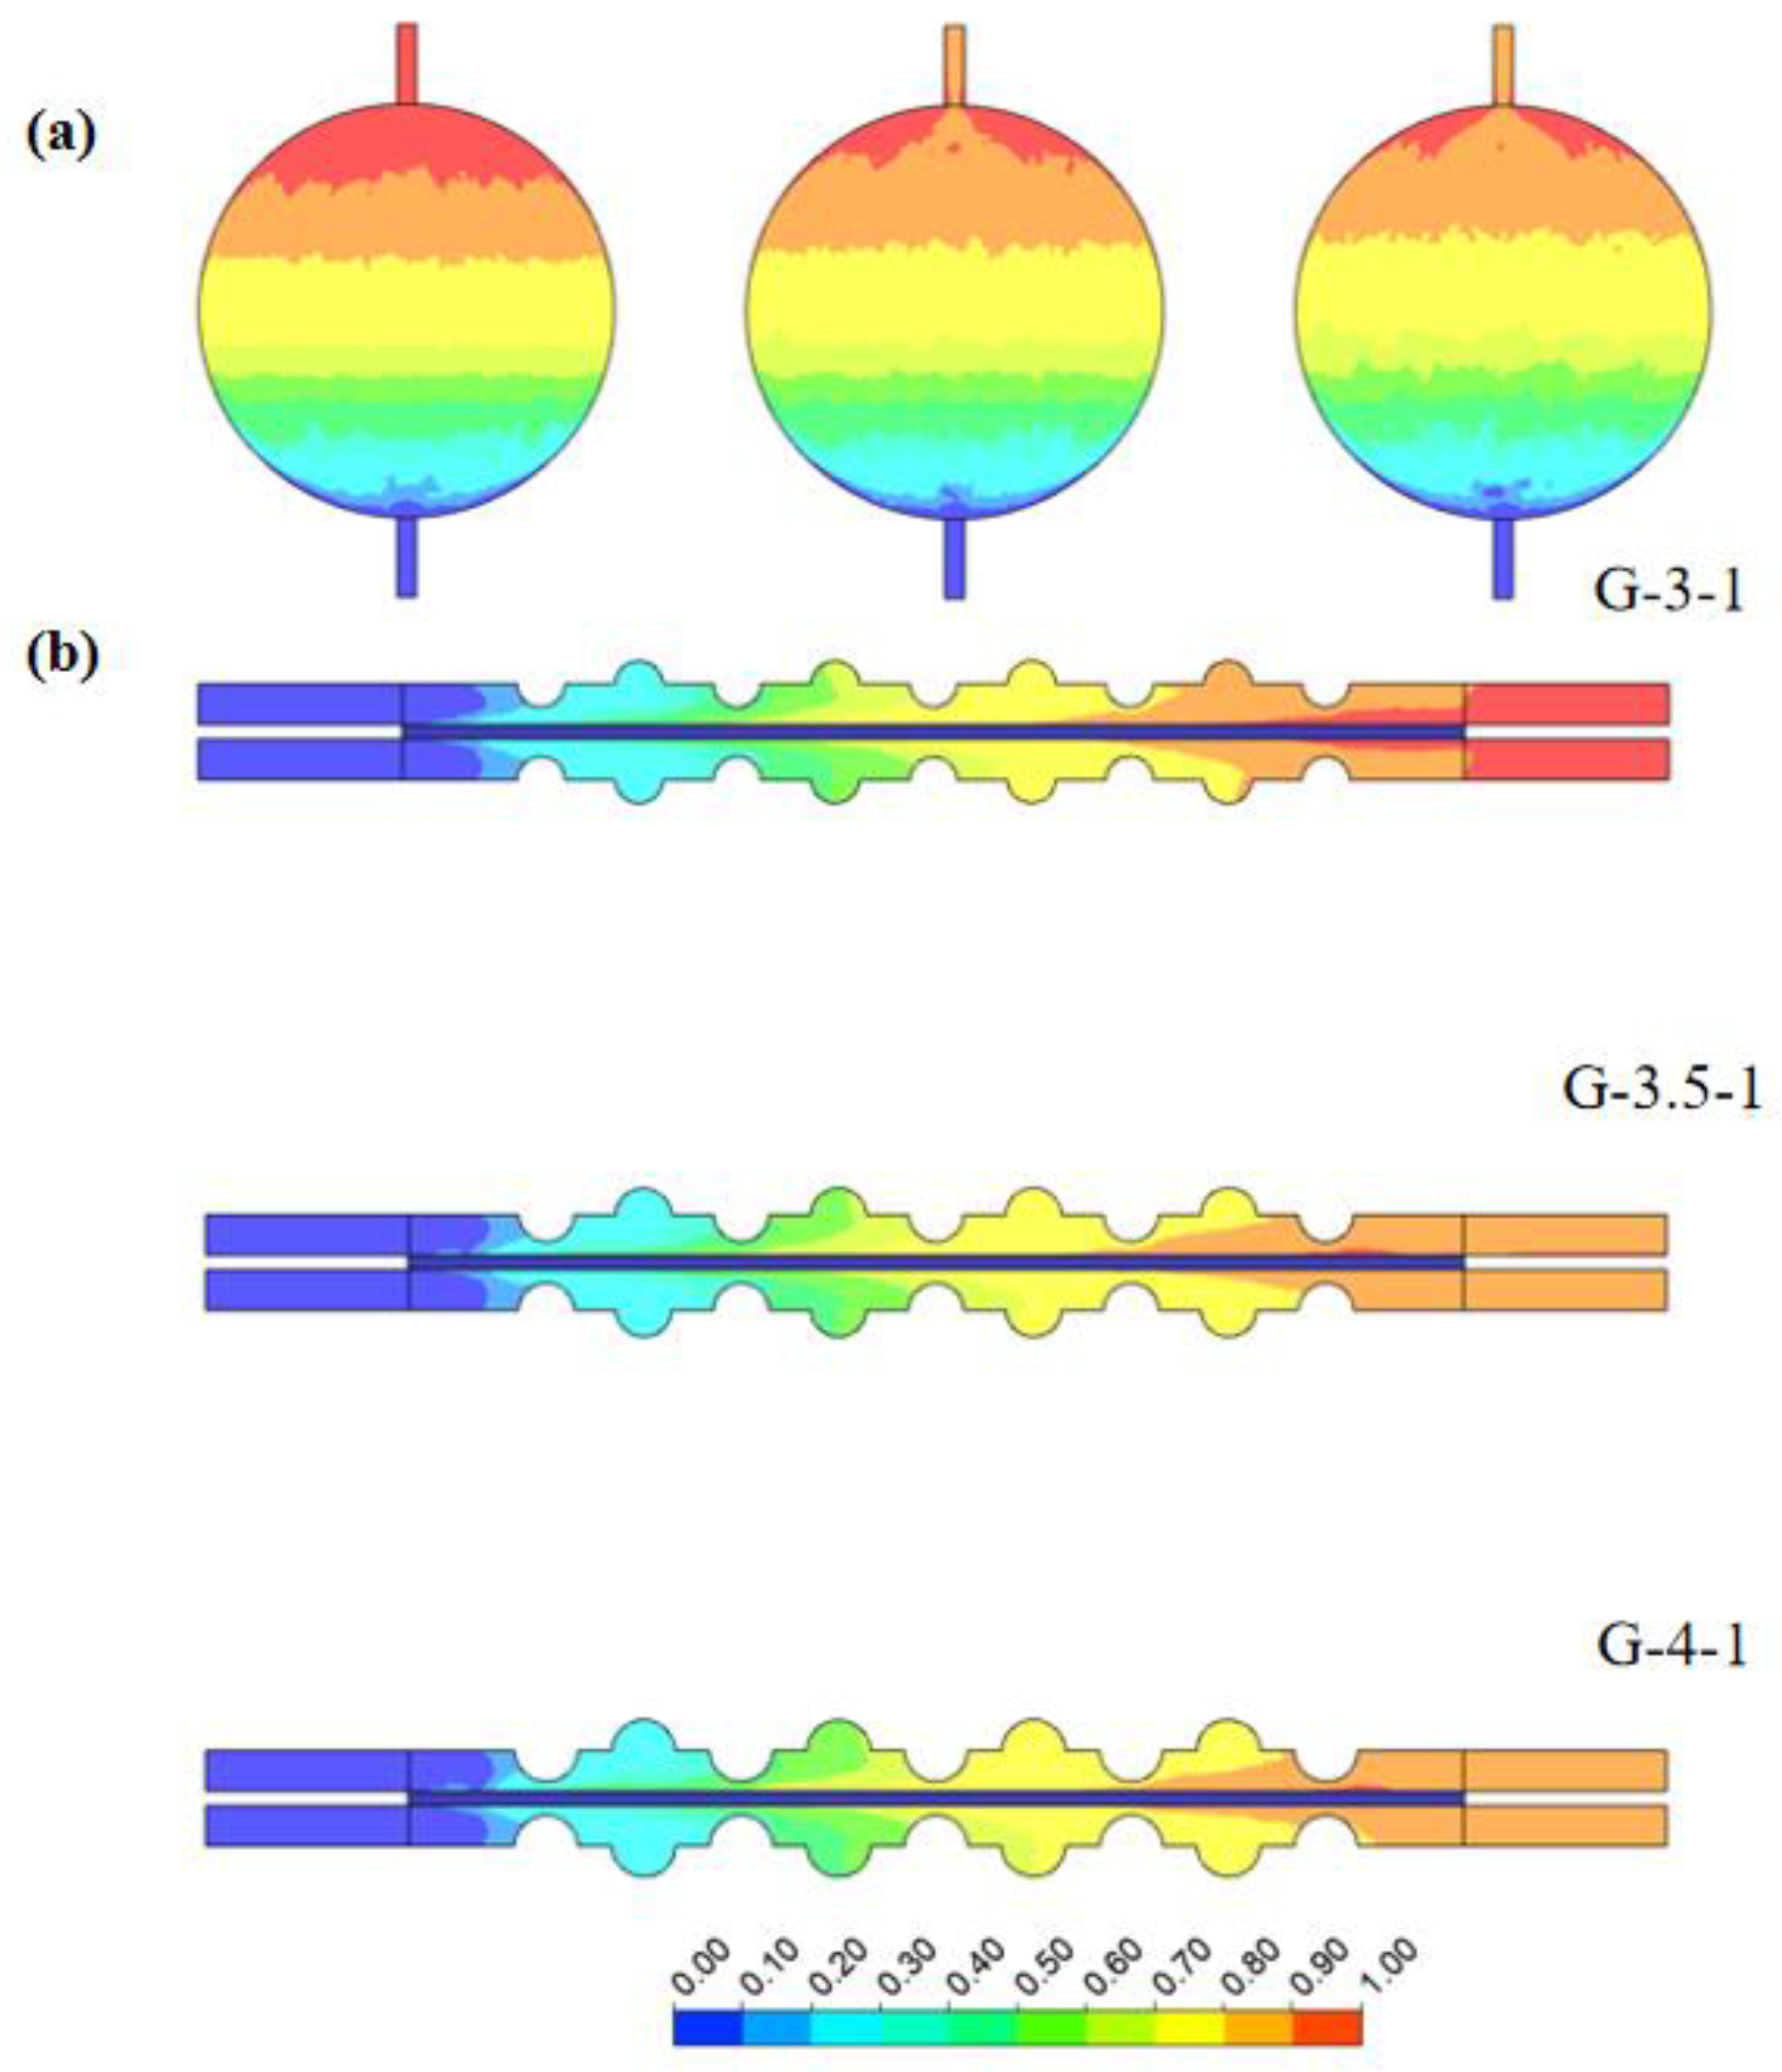
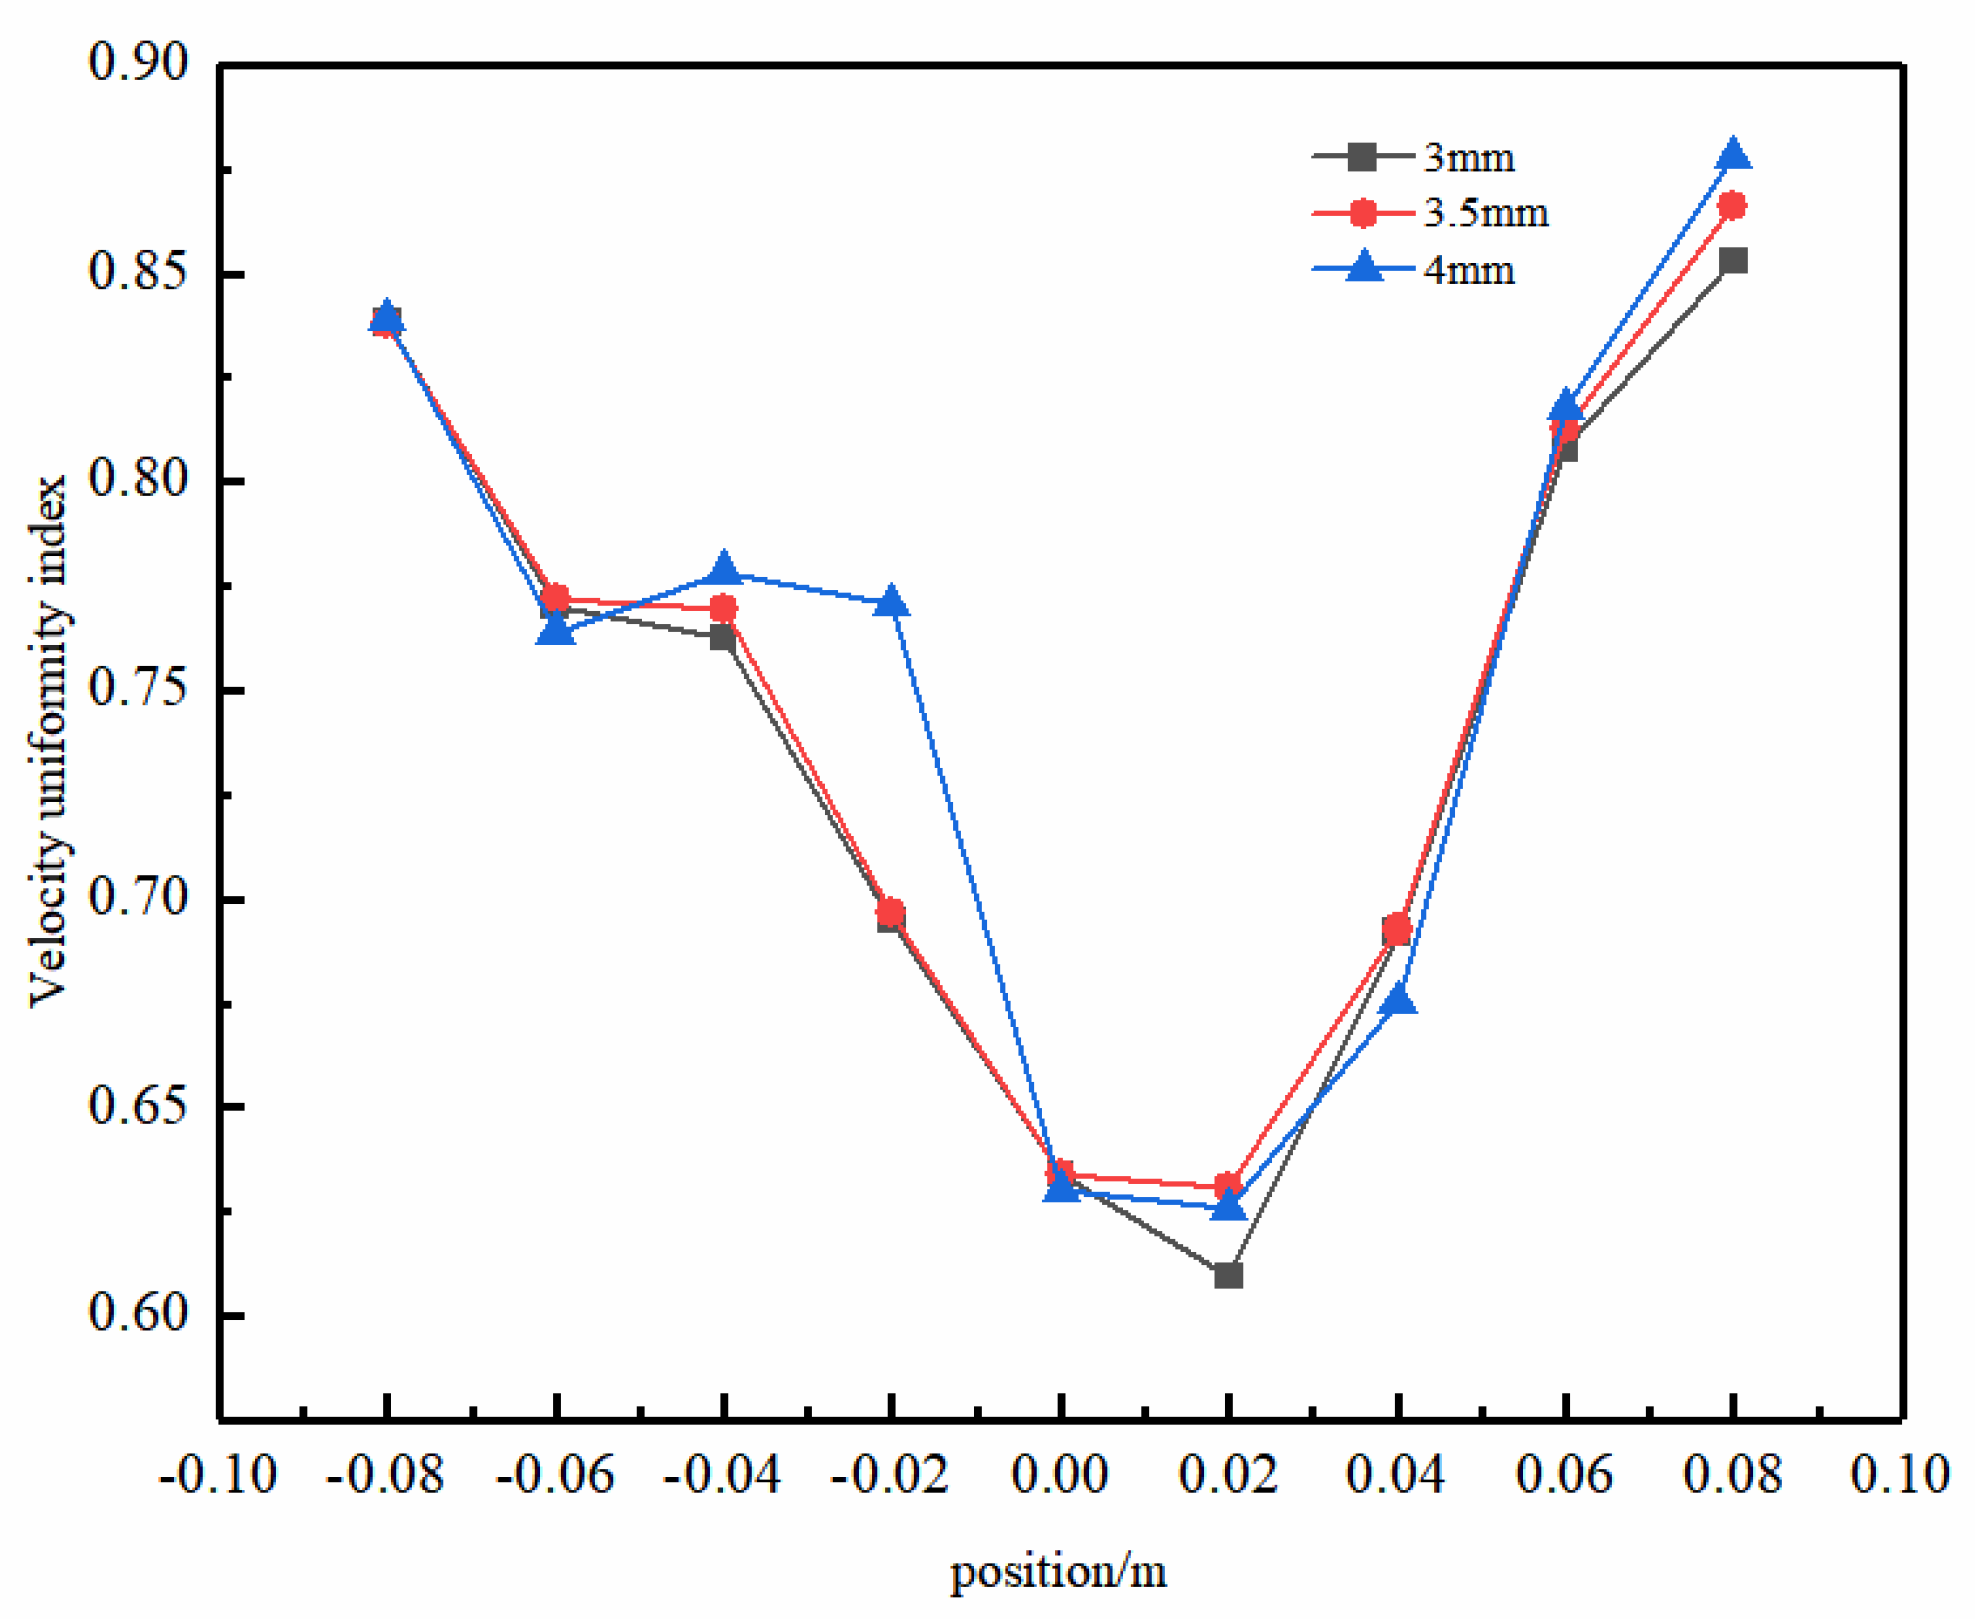
3.3. The Influence of the Concave–Convex Structure Radius on the Performance of Electrolytic Cells

Due to the interaction between fluid flow and the geometric shape of the structure, eddy currents can be generated near protrusions. The presence of vortices alters local flow dynamics and affects the uniformity and efficiency of fluid motion within the channel. Adjusting the geometric shape of these structures or modifying their design can sometimes alleviate or control the generation of vortices to optimize fluid flow characteristics. As depicted in Figure 11, streamline plots are presented for structures with concave–convex radii of 3 mm, 3.5 mm, and 4 mm.
Figure 11a shows the electrolyte flow chart at a distance of 2.4 mm from the electrode plate to the channel. In the anterior segment of the channel on both sides, considerable stagnant areas in liquid velocity are observable. As the radius of the spherical convex structure increases, the fluid encounters more pronounced effects from this structure upon entry into the channel. Consequently, the vertical velocity gradually diminishes, causing the fluid to disperse towards both sides of the spherical convex structure. This enhancement in the fluid’s lateral distribution capability notably diminishes stagnant velocity regions. This improvement alleviates the velocity discrepancies between the central and boundary regions, signifying a substantial enhancement in flow uniformity.
Figure 11b shows the electrolyte streamline diagram on the yz-axis center plane. When the radius of the concave–convex structure is 3 mm, the liquid flow remains largely unaffected by the concave–convex structure, directing the electrolyte straightforwardly toward the channel outlet. Consequently, this reduces the lateral fluid flow capacity within the electrolytic cell. As the radius increases to 3.5 mm, the liquid flow experiences notable influence from the concave–convex structure, generating multiple vortices within the spherical concave portion. This augmentation enhances the transverse fluid distribution of the electrolyte, but the diffusion of eddy currents weakens the velocity of the electrolyte in the y-direction at the front of the electrolytic cell. With a radius of 4 mm, the vortex formation within the spherical concave structure ameliorates. Simultaneously, the impact of the spherical convex structure intensifies, prompting an augmented velocity at the channel’s center and ameliorating the uniformity of fluid velocity.
Notably, larger convex structure sizes result in a more uniform lateral flow distribution within the electrolytic cell. This was corroborated by the velocity distribution in the horizontal section. Figure 12 illustrates the volume fraction cloud maps of H2 gas on the x–y plane at z = 0.7 mm and the x–z plane at y = 0 mm. It can be observed that, as the concave–convex radius gradually increases, the accumulation of H2 at the outlet decreases, thereby enhancing gas emission efficiency. This trend implies that larger convex-concave structure radii contribute to a faster discharge of H2 from the electrolytic cell, reducing the gas accumulation at the outlet. This was attributed to the enhanced design of the concave–convex structure, improving the gas flow and reducing the likelihood of H2 stagnation within the electrolytic cell. This variation has a positive impact on the stable operation of the electrolytic cell and the efficiency of gas generation. Therefore, by adjusting the radius of the concave–convex structure, not only can fluid uniformity be improved but also the distribution of H2 gas within the electrolytic cell can be optimized, enhancing the overall system efficiency.
Figure 13 illustrates the uniformity of the electrolyte flow in the yz-axis center plane with different sizes of concave–convex structures. As the radius increases, the uniformity of the liquid-phase flow is enhanced. Particularly at a radius of 4 mm, a significant improvement in uniformity was evident at y = −20 mm. This phenomenon was attributed to the larger concave–convex structure radius, which helps to more effectively overcome fluid resistance, thereby reducing the potential formation of turbulence and eddy currents during the flow process. The concave–convex structure radius significantly influences the flow uniformity in the front section of the electrolytic cell. However, as the fluid progresses towards the rear section, the impact of this radius diminishes gradually. This arises from the front section’s fluid adjustment and optimization, resulting in a relatively stable flow state in the rear section. Therefore, in this region, the influence of the concave–convex structure diminishes, although it may still have a certain degree of impact on the overall flow characteristics. This approach could enhance the efficacy of flow uniformity optimization within the electrolytic cell.

4. Conclusions

Reducing the overpotential to enhance the efficiency of alkaline water electrolysis cells requires optimizing the structural design to ensure a uniform liquid flow and gas distribution. This study coupled an electrochemical model with a two-phase gas–liquid flow model to accurately simulate the flow characteristics within the channels of alkaline water electrolysis cells, analyzing the impact of channel structure parameters on cell performance.
(1)
The uniformity of fluid velocity within the bipolar plate channels plays a pivotal role in temperature and H2 distribution. Variations in velocity can cause localized temperature fluctuations, impacting electrolytic reaction rates.
(2)
Electrolysis cells featuring multiple inlets demonstrate enhanced gas discharge efficiency. Upon qualitative analysis involving velocity, temperature, and H2 volume fraction parameters, coupled with a comparison of velocity distribution uniformity indices, the three-inlet structure exhibited more uniform velocity and temperature fields, showcasing a distinct advantage over single- and double-inlet structures.
(3)
The gradual increase in the radius of spherical protuberances intensifies the impact of the concave–convex structure on fluid dynamics, resulting in heightened fluid velocity uniformity. The design of this structure enhances the gas flow, curtails turbulence and eddy currents during the fluid flow, and diminishes the possibility of H2 stagnation within the electrolytic cell. Ultimately, this design refinement significantly bolsters electrolysis efficiency.

Author Contributions

Methodology, S.S.; software, S.S. and L.X.; validation, L.X.; formal analysis, S.S. and L.X.; resources, L.X. and W.C.; data curation, X.W. and W.C.; writing—original draft preparation, S.S. and B.L.; writing—review and editing, B.L., L.X. and W.C.; visualization, S.S. and B.L.; supervision, X.W. and W.C. All authors have read and agreed to the published version of the manuscript.

Funding

This research received no external funding.

Data Availability Statement

Data available on request from the authors.

Conflicts of Interest

Longchang Xue has received research grants from CRRC Academy Co., Ltd. Other authors have no conflict of interest to declare.

Nomenclature

ρDensity [kg·m−3]
ivReaction current density [A·m−3]
cContinuous phase
MH2The relative molecular mass of H2 2 [g·mol−1]
MO2The relative molecular mass of O2 32 [g·mol−1]
CεConstants of the turbulence model
dDispersed phase
phidGas volume fraction
DmdTurbulent dispersion coefficient
μTTurbulent kinematic viscosity [m2·s−1]
σTTurbulence model parameters
FFaraday’s constant: 96,500 [C·mol−1]
τViscous shear stress [N·m−2]

References

  1. Wan, C.; Li, G.; Wang, J.; Xu, L.; Cheng, D.G.; Chen, F.; Asakura, Y.; Kang, Y.; Yamauchi, Y. Modulating Electronic Metal-Support Interactions to Boost Visible-Light-Driven Hydrolysis of Ammonia Borane: Nickel-Platinum Nanoparticles Supported on Phosphorus-Doped Titania. Angew. Chem. Int. Ed. 2023, 62, e202305371. [Google Scholar] [CrossRef] [PubMed]
  2. Rosas-Medellín, D.; Martínez-Urbizu, S.; Barbosa, R.; Alonso-Lemus, I.L.; Escobar, B. Co-pyrolysis of two environmental issues: Face mask and Sargassum spp. for efficacious solid waste management and its AEMFC applications. Int. J. Hydrogen Energy 2024, 51, 601–611. [Google Scholar] [CrossRef]
  3. Wan, C.; Zhou, L.; Xu, S.; Jin, B.; Ge, X.; Qian, X.; Xu, L.; Chen, F.; Zhan, X.; Yang, Y.; et al. Defect engineered mesoporous graphitic carbon nitride modified with AgPd nanoparticles for enhanced photocatalytic hydrogen evolution from formic acid. Chem. Eng. J. 2022, 429, 132388. [Google Scholar] [CrossRef]
  4. Anastasiadis, A.G.; Papadimitriou, P.; Vlachou, P.; Vokas, G.A. Management of Hybrid Wind and Photovoltaic System Electrolyzer for Green Hydrogen Production and Storage in the Presence of a Small Fleet of Hydrogen Vehicles—An Economic Assessment. Energies 2023, 16, 7990. [Google Scholar] [CrossRef]
  5. Ren, Z.; Wang, J.; Yu, Z.; Zhang, C.; Gao, S.; Wang, P. Experimental studies and modeling of a 250-kW alkaline water electrolyzer for hydrogen production. J. Power Sources 2022, 544, 231886. [Google Scholar] [CrossRef]
  6. Zeng, K.; Zhang, D. Recent progress in alkaline water electrolysis for hydrogen production and applications. Prog. Energy Combust. Sci. 2010, 36, 307–326. [Google Scholar] [CrossRef]
  7. Zhang, J.; Dang, J.; Zhu, X.; Ma, J.; Ouyang, M.; Yang, F. Ultra-low Pt-loaded catalyst based on nickel mesh for boosting alkaline water electrolysis. Appl. Catal. B Environ. 2023, 325, 122296. [Google Scholar] [CrossRef]
  8. Ďurovič, M.; Hnát, J.; Strečková, M.; Bouzek, K. Efficient cathode for the hydrogen evolution reaction in alkaline membrane water electrolysis based on NiCoP embedded in carbon fibres. J. Power Sources 2023, 556, 232506. [Google Scholar] [CrossRef]
  9. Kim, S.; Han, J.H.; Yuk, J.; Kim, S.; Song, Y.; So, S.; Lee, K.T.; Kim, T.-H. Highly selective porous separator with thin skin layer for alkaline water electrolysis. J. Power Sources 2022, 524, 231059. [Google Scholar] [CrossRef]
  10. Li, Y.; Zhang, T.; Ma, J.; Deng, X.; Gu, J.; Yang, F.; Ouyang, M. Study the effect of lye flow rate, temperature, system pressure and different current density on energy consumption in catalyst test and 500W commercial alkaline water electrolysis. Mater. Today Phys. 2022, 22, 100606. [Google Scholar] [CrossRef]
  11. Abdel Haleem, A.; Huyan, J.; Nagasawa, K.; Kuroda, Y.; Nishiki, Y.; Kato, A.; Nakai, T.; Araki, T.; Mitsushima, S. Effects of operation and shutdown parameters and electrode materials on the reverse current phenomenon in alkaline water analyzers. J. Power Sources 2022, 535, 231454. [Google Scholar] [CrossRef]
  12. Qian, X.; Fang, J.; Xia, J.; He, G.; Chen, H. Recent progress and perspective on molybdenum-based electrocatalysts for water electrolysis. Int. J. Hydrogen Energy 2023, 48, 26084–26106. [Google Scholar] [CrossRef]
  13. Ganci, F.; Inguanta, R. Fabrication and Characterization of Nanostructured Ni and Pd Electrodes for Hydrogen Evolution Reaction (HER) in WaterAlkaline Electrolyze. Chem. Eng. Trans. 2017, 57, 1591–1596. [Google Scholar]
  14. Ganci, F.; Cusumano, V.; Livreri, P.; Aiello, G.; Sunseri, C.; Inguanta, R. Nanostructured Ni–Co alloy electrodes for both hydrogen and oxygen evolution reaction in alkaline electrolyzer. Int. J. Hydrogen Energy 2021, 46, 10082–10092. [Google Scholar] [CrossRef]
  15. Bhavanari, M.; Lee, K.-R.; Tseng, C.-J.; Tang, I.H.; Chen, H.-H. CuFe electrocatalyst for hydrogen evolution reaction in alkaline electrolysis. Int. J. Hydrogen Energy 2021, 46, 35886–35895. [Google Scholar] [CrossRef]
  16. Zhao, P.; Wang, J.; He, W.; Sun, L.; Li, Y. Alkaline zero gap bipolar water electrolyzer for hydrogen production with independent fluid path. Energy Rep. 2023, 9, 352–360. [Google Scholar] [CrossRef]
  17. Lee, J.; Alam, A.; Park, C.; Yoon, S.; Ju, H. Modeling of gas evolution processes in porous electrodes of zero-gap alkaline water electrolysis cells. Fuel 2022, 315, 123273. [Google Scholar] [CrossRef]
  18. Wang, T.; Wang, J.; Wang, P.; Wang, F.; Liu, L.; Guo, H. Non-uniform liquid flow distribution in an alkaline water electrolyzer with concave-convex bipolar plate (CCBP): A numerical study. Int. J. Hydrogen Energy 2023, 48, 12200–12214. [Google Scholar] [CrossRef]
  19. Rocha, F.; Delmelle, R.; Georgiadis, C.; Proost, J. Effect of pore size and electrolyte flow rate on the bubble removal efficiency of 3D pure Ni foam electrodes during alkaline water electrolysis. J. Environ. Chem. Eng. 2022, 10, 107648. [Google Scholar] [CrossRef]
  20. Anastasiou, E.; Lorentz, K.O.; Stein, G.J.; Mitchell, P.D. Prehistoric schistosomiasis parasite found in the Middle East. Lancet Infect. Dis. 2014, 14, 553–554. [Google Scholar] [CrossRef]
  21. El-Askary, W.A.; Sakr, I.M.; Ibrahim, K.A.; Balabel, A. Hydrodynamics characteristics of hydrogen evolution process through electrolysis: Numerical and experimental studies. Energy 2015, 90, 722–737. [Google Scholar] [CrossRef]
  22. Zarghami, A.; Deen, N.G.; Vreman, A.W. CFD modeling of multiphase flow in an alkaline water electrolyzer. Chem. Eng. Sci. 2020, 227, 115926. [Google Scholar] [CrossRef]
  23. Li, Y.; Yang, G.; Yu, S.; Kang, Z.; Mo, J.; Han, B.; Talley, D.A.; Zhang, F.-Y. In-situ investigation and modeling of electrochemical reactions with simultaneous oxygen and hydrogen microbubble evolutions in water electrolysis. Int. J. Hydrogen Energy 2019, 44, 28283–28293. [Google Scholar] [CrossRef]
  24. Tiwari, P.; Tsekouras, G.; Wagner, K.; Swiegers, G.F.; Wallace, G.G. A new class of bubble-free water electrolyzer that is intrinsically highly efficient. Int. J. Hydrogen Energy 2019, 44, 23568–23579. [Google Scholar] [CrossRef]
  25. Hreiz, R.; Abdelouahed, L.; Fünfschilling, D.; Lapicque, F. Electrogenerated bubbles induced convection in narrow vertical cells: A review. Chem. Eng. Res. Des. 2015, 100, 268–281. [Google Scholar] [CrossRef]
  26. Gao, L.; Yang, L.; Wang, C. Three-dimensional two-phase CFD simulation of alkaline electrolyzers. J. Electrochem. 2023, 29, 33401–33410. [Google Scholar]
  27. Bratsch, S.G. Standard Electrode Potentials and Temperature Coefficients in Water at 298.15 K. J. Phys. Chem. Ref. Data 1989, 18, 1–21. [Google Scholar] [CrossRef]
  28. LI, L.; Zhang, J.; Zhou, K. Numerical Simulation Analysisof Single-phase Flow Field in Micro flow channels of the Small Square Cylinders in the Electrolysis Oxygen Generation. Space Med. Med. Eng. 2009, 22, 22–26. [Google Scholar]
Figure 1. Research and development of hydrogen-powered trains by CRRC Group: (a) Hydrogen energy tram, (b) Commercial hybrid electric tram, (c) Hydrogen energy urban trains, (d) Hydrogen energy intelligent tram.
Energies 17 00448 g001
Figure 2. Geometric model of a pressure-filtration alkaline electrolysis cell.
Energies 17 00448 g002
Figure 3. Schematic diagram of a single electrolytic cell structure.
Energies 17 00448 g003
Figure 4. Main dimensions of the electrolysis chamber.
Energies 17 00448 g004
Figure 5. Electrolytic chambers with different geometric models.
Energies 17 00448 g005
Figure 6. Grid processing of a single electrolytic cell.
Energies 17 00448 g006
Figure 7. Model validation.
Energies 17 00448 g007
Figure 8. (a) Cathode and anode channel electrolyte streamline diagram. (b) Electrolyte streamline distribution on the yz-axis center plane.
Energies 17 00448 g008
Figure 9. In electrolytic cells with different inlet quantities: (a) electrolyte velocity distribution, (b) electrolyte temperature distribution, and (c) H2 gas volume fraction distribution.
Energies 17 00448 g009
Figure 10. On the yz-axis center plane: (a) uniformity of electrolyte velocity and (b) H2 gas volume fraction.
Energies 17 00448 g010
Figure 11. Electrolyte streamline diagram of electrolytic cells with different sizes of concave and convex structures: (a) at a distance of 2.4 mm from the channel surface of the electrode and (b) on the yz-axis center plane.
Energies 17 00448 g011
Figure 12. The distribution of H2 volume fractions in electrolytic cells with different sizes of concave–convex structures: (a) at a distance of 0.7 mm from the channel surface of the electrode and (b) on the yz-axis center plane.
Energies 17 00448 g012
Figure 13. Uniformity of the electrolyte flow in the yz-axis center plane with different sizes of concave−convex structures.
Energies 17 00448 g013
Table 1. Main geometry parameters of the computational domain.
SymbolParametersValueUnit
L1Length of entrance and exit channels25mm
L2Width of entrance and exit channels5mm
L3Ball convex spacing12mm
D1H2 and O2 channel radius130mm
D2Spherical convex radius9mm
Channel heightHeight of H2 and O2 channels5mm
Height of import and export channels5mm
ThicknessThickness of anode and cathode0.5mm
Thickness of electrolyte membrane0.8mm
Disclaimer/Publisher’s Note: The statements, opinions and data contained in all publications are solely those of the individual author(s) and contributor(s) and not of MDPI and/or the editor(s). MDPI and/or the editor(s) disclaim responsibility for any injury to people or property resulting from any ideas, methods, instructions or products referred to in the content.

