Article

Particle Swarm Optimization for an Optimal Hybrid Renewable Energy Microgrid System under Uncertainty

by
Manduleli Alfred Mquqwana
* and
Senthil Krishnamurthy
Department of Electrical, Electronics and Computer Engineering, Centre for Substation, Automation, and Energy Management Systems, Cape Peninsula University of Technology, Bellville P.O. Box 1906, South Africa
*
Author to whom correspondence should be addressed.
Energies 2024, 17(2), 422; https://doi.org/10.3390/en17020422
Submission received: 1 December 2023 / Revised: 5 January 2024 / Accepted: 10 January 2024 / Published: 15 January 2024
(This article belongs to the Section A1: Smart Grids and Microgrids)

Abstract

:
Microgrids can assist in managing power supply and demand, increase grid resilience to adverse weather, increase the deployment of zero-emission energy sources, utilise waste heat, and reduce energy wasted through transmission lines. To ensure that the full benefits of microgrid use are realised, hybrid renewable energy-based microgrids must operate at peak efficiency. To offer an optimal solution for managing microgrids with hybrid renewable energy sources (HRESs) while taking microgrid reserve margins into account, the particle swarm optimisation (PSO) method is suggested. The suggested approach demonstrated good performance in terms of charging and discharging BESS and maintaining the necessary reserve margins to supply critical loads if the grid and renewable energy sources are unavailable. On a clear day, the amount of electricity sold to the grid increased by 58%, while on a partially overcast day, it increased by 153%. Microgrids provide a good return on investment for their operators when they are run at peak efficiency. This is because the BESS is largely charged during off-peak hours or with excess renewable energy, and power is only purchased during less expensive off-peak hours.

1. Introduction

A collection of linked loads and dispersed energy sources that operate as a single, controllable unit is known as a microgrid. It can function in two modes: connected to the grid (grid-connected mode) and disconnected from the grid (islanded mode). Microgrids can help customers become more dependable and resilient to power outages. Renewable resources are those that are known to replenish on their own over time. For this reason, it is viable even after human use. Renewable resources are considered especially important since they have the potential to replace non-renewable, or finite, resources in the energy production process. Examples of renewable resources are solar power and wind turbine generators. The reserve margin, which is typically used for load balancing or supplying important loads during times of supply scarcity, is the amount of an electric power system’s unused available capability expressed as a percentage of the total capability. Microgrids are essential parts of modern grids as they provide many advantages, including improved grid stability, reliability, and resilience. Hybrid renewable energy resource microgrids provide even more advantages as they assist in achieving the United Nations 2050 net zero goals by using natural resources to reduce the carbon footprint. Microgrids also assist in reducing energy poverty in communities in remote and isolated areas where the grid cannot reach. The intermittent nature of renewable energy sources poses challenges regarding microgrid operation and management. Studies should be performed to determine the optimal cost of operating microgrids, considering the grid integration costs, battery energy storage charging/discharging, renewable energy source usage, etc., while meeting load demand.
The optimisation of power system operation has a long history; it has been enriched over time by advances in mathematical programming techniques and computational methods, but predating the advent of digital computers, which revolutionised numerical optimisation and computation in general [1]. The global maximum power point (GMPP) of standalone battery charging systems under partial shading conditions (PSCs) is tracked using a novel hybrid Series Salp Particle Swarm Optimisation (SSPSO) algorithm. Under PSC, photovoltaic (PV) characteristics such as power current (P-I) and power voltage (P-V) have a global peak as well as several local peaks with intricate forms [2]. The construction of multi-energy microgrids, which include hydrogen and electricity loads, storage alternatives, and low-carbon energy sources, is required. To increase the economic feasibility of microgrid components, the size must always be measured exactly, and energy must constantly be delivered most economically. Here, we describe a two-level optimisation for energy management and sizing applied to an original multi-energy scenario employing electricity and hydrogen as energy vectors to promote the deployment of multi-energy microgrids in industrial areas. A financial profitability target is considered, together with restrictions relating to the cost, dependability, and accessibility of sources and storage alternatives [3]. Microgrids can incorporate renewable energy sources (RESs) and provide local customers with electricity. However, microgrid operation is challenging due to load and RES uncertainty. Moreover, a precise nonlinear degradation cost model of battery energy storage systems (BESSs) ought to be put out, since BESSs are essential dispatchable devices for reducing the adverse effects of uncertainty. This study suggests an affine arithmetic-based microgrid interval optimisation (IO) technique that considers uncertainty and BESS deterioration to address these problems [4]. Off-grid microgrids are often used for power distribution in rural areas. A mathematical model that integrates N-1 security analysis for topology design, capacity planning, and the operation of distributed energy resources in microgrids is created to address the dependability challenges for these microgrids. A rolling-horizon technique combined with scenario-based deconstruction is intended to effectively solve the model because the optimisation problem is too big [5]. An efficient solution to the issue of local renewable energy consumption is the growing popularity of microgrids. In contrast, power fluctuations pose a serious risk to the widespread deployment of renewable energy-powered grid-connected microgrids. A mathematical model of a microgrid with grid-connected power constraints and a supercapacitor–battery hybrid energy storage system, as well as a novel rolling optimisation technique, is presented for smoothing grid-connected power fluctuations for microgrids [6]. The growing percentage of electric vehicles on the road means that vehicle charging is having an increasingly detrimental effect on the power supply. The microgrid’s load dispatch multi-objective optimisation model and the vehicle charging–discharging model are set. By merging particle swarm optimisation (PSO) and the gravitational search algorithm (GSA), a hybrid modified GSA-PSO (MGSAPSO) method is proposed to optimise the load dispatch of a microgrid consisting of electric vehicles. The global search performance of the GSA algorithm is improved by the proposed method, which integrates the PSO’s global memory capacity into the GSA. Concurrently, the hybrid approach is improved by generating a chaotic initialisation population, a learning factor, and an adjustable inertia vector [7].
An operation planning and management support management system for microgrids is being presented by the microgrid aggregator, the new electrical market agent. To achieve the best market participation, the aggregator controls the energy consumption, electric vehicles, energy storage, wind and photovoltaic systems, microturbines, and energy usage. As a crucial feature of a microgrid support management system, a support and information system are now necessary for decision making when participating in the electrical market. A stochastic mixed-integer linear programming problem that relies on understanding the stochastic processes defining the unknown parameters forms the foundation for the presented microgrid support management system [8]. Academic and industrial interest in DC microgrids is growing due to advancements in power electronics, the growing usage of DC loads, DC renewable energy sources, battery storage systems, and a lack of reactive power or frequency stability issues. DC microgrids require careful consideration of demand response incentives for user participation and battery degradation cost modelling to operate efficiently. To achieve a practical degradation cost model for a Li-ion battery and optimise battery scheduling, a realistic operational cost is required. Apart from the energy price, a planned islanding responsive demand response incentive is put in place to incentivise customers to change their load during prearranged grid-tie periods [9]. The fundamental electricity needs of remote and rural areas could be well served by renewable energy sources (RESs). An optimisation strategy and a potential power management plan (PMS) designed for a hybrid renewable energy system (HRES) that combines wind, a battery, and a converter to provide customers with highly reliable and high-quality power is required [10]. Long-term access to electricity is ensured by an isolated microgrid system that is fuelled by renewable energy and energy storage technologies. This type of system is especially well suited to address inadequate electrical infrastructure in rural areas. The stochastic behaviour of electric vehicle (EV) users and the uncertainty surrounding residential user behaviour and renewable energy sources impact the system’s capacity design [11]. Power quality (PQ) issues occur when non-linear loads and power electronic components are included in microgrids. These issues could also be brought on by an unequal load on the microgrid. They undoubtedly affect the daily operating schedule of the microgrid. An optimal harmonic power flow (OHPF) framework for the daily optimal scheduling of a grid-connected microgrid is created by combining an optimisation formulation with harmonic power flow (HPF). The framework for evaluating PQ uses three indices: voltage imbalance factor (VUF), voltage magnitude, and voltage total harmonic distortion (THDV) [12]. Environmental harm and energy scarcity have become major issues for business and human progress. Thus, focusing on the research on distributed energy sources (DERs) and renewable energy sources is both advantageous and required. Because of its versatility, a microgrid can function in both isolated and grid-connected configurations. To maximise the economic benefits for MG users, optimisation models should balance energy usage, battery preservation, and other parameters while considering the limitations of the power infrastructure and the current price of electricity [13]. A domain-enriched optimisation method was developed to enhance the overall dynamic resilience and small-signal stability of islanded microgrids. An exclusive eigen-value-oriented objective function and associated restrictions are used to optimise the controller settings for the power electronic interfaces of distributed energy resources (DERs). The system’s dynamic resilience depends on these interfaces. By utilising the comprehension of the microgrid domain, an additional loss component in the optimisation variables that functions as a multivariate polynomial is proposed to assist in resolving the resulting non-smooth and non-convex optimisation problem [14].
Grid-tied microgrids play crucial roles in resilience and sustainability as they establish a balanced and efficient connection between renewable energy sources and the main power grid. The dynamic interaction between the intermittent nature of renewable energy sources and the volatility of load changes, however, presents a complex spectrum of technical energy management issues [15]. Because renewable energy is erratic and electric vehicles (EVs) have an unorganised grid link, the power system will have challenges in maintaining stable and safe operations. The symmetry and dependability of the microgrid operation are ensured by the suggested microgrid optimisation scheduling method, which takes EV access into consideration. When examining each microgrid unit’s operating constraints, the network active power loss and node voltage variance are considered. To improve the efficiency of its solution, the developed microgrid model is accordingly modified by second-order cone relaxation [16]. Examining microgrid scheduling for multi-objective optimisation is necessary to improve the comprehension of the multi-objective optimisation-based microgrid scheduling technique. Before they can manage the microgrid, each energy storage device’s maximum charging power, maximum discharging power, and remaining capacity need to be determined. Above all, a mathematical model of the microgrid is built. A multi-objective optimisation microgrid operating model was created for several microgrid states, including the grid-connected state and the island state, building on the previously produced microgrid mathematical model [17].
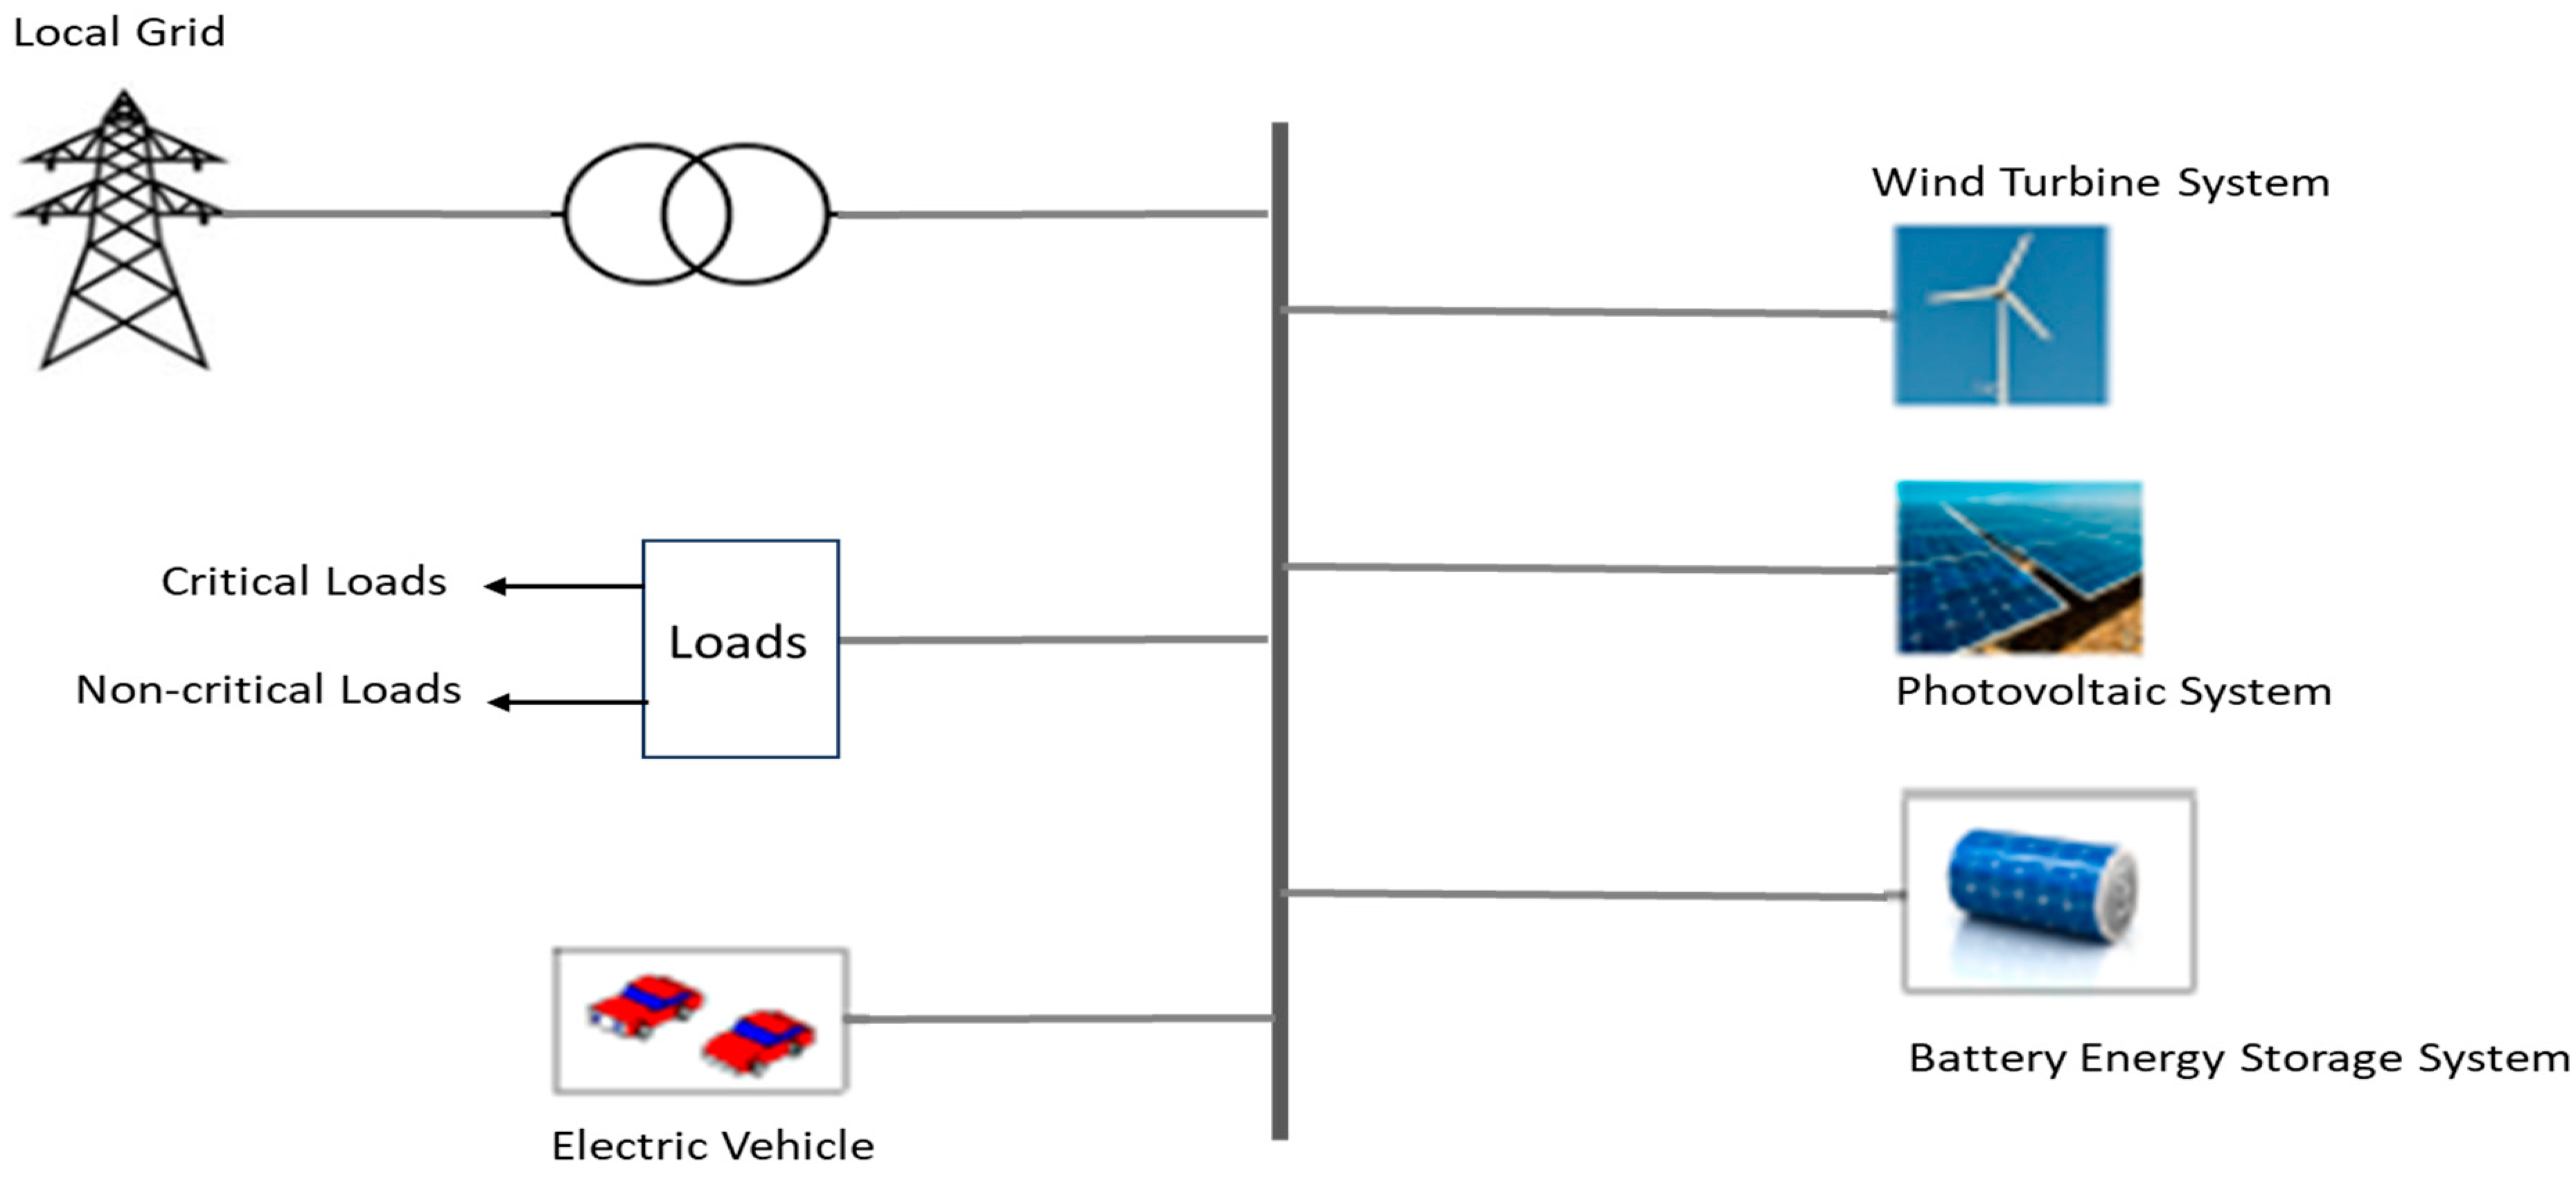
In this paper, we provide an optimised microgrid operation solution that accounts for variable electricity prices, intermittent renewable energy resources, and battery energy storage system (BESS) charging and discharging schedules. This will help ensure that the reserve margins for critical loads are covered if the grid is unavailable and the generation from renewable energy sources is insufficient or unavailable. Two major contributions of this research are that it is the first of its kind in the literature to study reserve margins for important loads, and it proposes that instead of using the grid, excess renewable energy should be the only source used to charge batteries.
The work is organised as follows: Section 1 contains an introduction, and Section 2 presents the hybrid microgrid’s mathematical problem formulation, which includes information on the pricing, load profiles, and the size of the various generating units. A PSO algorithm is shown in Section 3 in both the standard format and the hybrid microgrid-specific implementation. The results of the simulation for hybrid microgrid optimisation are shown in Section 4 and Section 5, respectively, along with a discussion of the results.

2. Problem Formulation of the Hybrid Renewable Energy Microgrid System

A grid-integrated microgrid, which consists of wind, photovoltaic systems, battery energy storage systems, and electric vehicles, is presented in Figure 1. The uncertainties of renewable energy sources and the uncertain behaviour of electric vehicles are considered in the modelling of the microgrid system. The modelling of individual systems is discussed in the following sections.

2.1. PV System Modelling

Solar energy is another form of renewable energy that assists in decarbonisation to curb global warming. Power generated by a single solar panel is given by [11]
P p v = S I A p v   ŋ p v
whereby P p v is the solar-generated power, S I is the solar irradiance, A p v is the area of the solar panel, and ŋ p v is the solar panel efficiency. To get the total power generated by the solar system, Equation (2) is used.
P T p v = N p v   P p v
whereby N p v is the number of solar panels. It assumed that the inverter has a dc/ac ratio of 1 and no losses. The temperature effect has also been ignored in the calculation for simplicity.
The solar panel size used in the simulation is 2100 m 2 , and the efficiency of the solar panel is 30%.

PV System Operation Cost Modelling

C p v = t T ( C p v , o m P i , t p v )
whereby C p v is the operation cost of the PV system, C p v , o m is the cost of operation and maintenance of the PV system, and P i , t p v is the PV power generated.

2.2. Wind Turbine Power System Modelling

Calculating power generation from wind turbines [11], as shown in Equations (4) and (5).
P w i n d = P r 0 ,                   v v c i n 0 ,     v v c o u t v v c i n v r v c i n ,               v c i n < v < v r P r ,     v r v < v c o u t
whereby P w i n d is the power generated by a single turbine, P r is the wind turbine-rated power, v is the actual wind speed, v c i n is the wind turbine cut-in wind speed, v c o u t is the wind turbine cut-out wind speed, and v r is the wind turbine rated wind speed. The effect of air density was ignored in the calculation. The total power generated from a wind farm is given by
P T w i n d = N w i n d P w i n d
whereby N w i n d is the number of wind turbines.
The wind turbine cut-in wind speed is 5 m/s, cut-out wind speed is 25 m/s, and the wind turbine rated wind speed is 11 m/s, while the wind turbine rated power is 3.2 MW.

Wind Turbine Power System Operation Cost Modelling

C w t = i T ( C w t , o m P i , t w t )
whereby C w t is the operation cost of the WTG system, C w t , o m is the cost of operation and maintenance of the WTG system, and P i , t w t is the WTG power generated.

2.3. Battery Energy Storage System Modelling

Because renewable energy sources, such as wind and solar energy, are intermittent in nature, energy storage systems are critical in microgrid systems, especially when operating in islanded mode. An energy storage system is required to improve system reliability. The battery energy storage system size is 3000 MWh, and the maximum charging and discharging power is 400 kW. The charging and discharging power flow equation for batteries is
E b a t t + 1 = P b a t c h a r ( t ) ŋ b a t Δ t P b a t d i s c h a r ( t ) Δ t ŋ b a t + E b a t ( t )
whereby P b a t c h a r ( t ) is the battery charging power flow, P b a t d i s c h a r ( t ) is the battery discharging power flow, ŋ b a t is the battery charging/discharging efficiency, Δ t is the time interval, E b a t ( t ) is the battery energy at time t , and E b a t t + 1 is the battery energy at time t + 1 .

2.4. Electric Vehicle Modelling

The use of electric vehicles has become increasingly significant due to environmental issues such as carbon emissions. The EV batteries serve as both a load (they must be charged from the system) and a power source (they provide energy to the microgrid system).
E E V t + 1 = P E V c h a r ( t ) ŋ E V P E V d i s c h a r ( t ) ŋ E V + E E V ( t )
whereby P E V c h a r ( t ) is the EV charging power flow, P E V d i s c h a r ( t ) is the EV discharging power flow, ŋ E V is the EV charging/discharging efficiency, E E V ( t ) is the EV energy at time t , and E E V t + 1 is the EV energy at time t + 1 .
Ten electric vehicles with a battery capacity of 60 kWh are considered in the simulation.

2.5. Battery Energy Storage System Degradation Modelling

Battery degradation costs are one vital aspect contributing to the total microgrid operation costs. Hence, an accurate degradation cost model is essential, which should be represented as a direct function of the BESS basic parameters [4]. The BESS degradation costs are given by
C B E S S = i E U R   T E b a t c a p S O C 0 S O C T w s | d s |
whereby E b a t c a p is the battery capacity, S O C 0 and S O C T represent the initial SOC and SOC at time, T, respectively, and w s is the wear density function. The formula for calculating the wear density function is given by
w s = C b a t r e p l 2 ŋ b a t 2 B ( 1 S O C ) B 1 A
whereby C b a t r e p l is the battery replacement cost, and A and B are the battery-specific parameters given by the manufactures.

2.6. Grid Interaction Cost Modelling

The grid interaction costs are the costs associated with buying electricity from the grid during less or no production times and selling excess electricity to the grid. The buying and selling price are usually different. The equation that defines this phenomenon is given as follows:
C g r i d = t T ( C p u r P r e c C s e l l P s e n t )
whereby C p u r is the cost of buying electricity from the grid, P r e c is the power received from the grid, C s e l l is the price of selling electricity to the grid, and C s e n t is the power sent to the grid.

2.7. Microgrid Operation Cost Modelling

The operation costs of the microgrid consider all of the individual system operation costs, as shown in the equation below. The objective function seeks to minimise the costs of microgrid operations.
C M G = C p v + C w t + C B E S S + C g r i d

2.8. System Constraints

The following constraints are considered while solving the minimisation objective function. These constraints are a mix of nonlinear, linear, and discrete variables.

2.8.1. Power Balance

P p v + P w i n d + P b a t d i s c + P r e c + P E V d i s c h a r P E V c h a r P b a t c h a r P l o a d P s e n t = 0

2.8.2. Grid Power

P r e c P l o a d + P E V c h a r
P s e n t P p v + P w i n d + P b a t d i s c h r + P E V d i s c h a r

2.8.3. Generation Limits

P p v m i n < P p v < P p v m a x
P w i n d m i n < P w i n d < P w i n d m a x
P b a t c h a r P b a t c h a r m a x
P b a t d i s c h a r P b a t d i s c h a r m a x
D O D g r i d o n = 80 %
D O D g r i d o f f = 50 %

2.8.4. Battery Charging

P p v + P w i n d > P l o a d + P E V c h a r
P r e c = 0

2.8.5. Battery Discharging

P p v + P w i n d < P l o a d + P E V c h a r

2.8.6. Reserve Margins

P r e s = P l o a d 5 100

3. Particle Swarm Optimisation Method for Hybrid Renewable Energy Micro Grid

When the PSO algorithm is compared to classical mathematical algorithms and other heuristic optimisation techniques, its key advantages can be summed up as follows: computing efficiency, robustness to control parameters, simplicity of idea, and ease of implementation. These are some of the reasons why the PSO algorithm was chosen over the others.

3.1. Standard PSO Algorithm

The particle swarm optimisation (PSO) algorithm was first introduced by Kennedy and Eberhart in 1995. The method is based on the natural process of the school of fish or the flock birds follow when they are searching for food. When birds are flying and searching randomly for food, birds in the flock share their discovery and help the entire flock achieve the best hunt, which results in increased search efficiency. PSO is an optimisation algorithm that offers a population-based search method in which individual particles utilise the information supplied by other particles to adjust their positions over time based on their own experiences as well as the experiences of other particles. Finding a function’s maximum or minimum on a multidimensional vector space is the ideal application for PSO.
The PSO algorithm can be defined as a stochastic multi-agent parallel search technique, wherein individual particles within a swarm symbolise the potential solutions to an optimisation issue. Based on its own and the swarm’s collective flight experiences, a particle can be viewed as an autonomous intelligent agent that “flies” around a multi-dimensional issue space in pursuit of the best solution to the optimisation problem. Three n-dimensional vectors make up each particle i in the swarm (with n being the dimensionality of the search space, R n ), which, at time, t , can be represented as the current location, X t i , the previous best position, p b e s t i , and the velocity, V t i [18]. The iterative velocity update, which modifies each particle’s position to guide the entire swarm towards the best solution to the optimisation issue, is the fundamental portion of the PSO method, as shown in Equation (28).
V i t + 1 = w V i t + c 1 r 1 ( p b e s t i X i ( t ) ) + c 2 r 2 ( g b e s t i X i ( t ) )
whereby r1 and r2 are random numbers between 0 and 1; w, c1, and c2 are constant PSO parameters; pbest is the best position that gives the best function evaluation; while gbest is the global best for all of the particles under evaluation. The current position of each particle X t i is assessed for “fitness” at each iteration using the optimisation problem’s objective function. The particle velocity V t i is used to update a particle’s position to move it towards a “better” position, as determined by the particle achieving an enhanced fitness evaluation. It represents the composite flying experience of the individual particle and the rest of the swarm. Every particle records the position that corresponds to its highest fitness value up to the most recent iteration, represented by the symbol p b e s t i . This position is then updated to the current location whenever the current position has a higher fitness value than the most recent best. Like a flock of birds searching for food, the swarm is likely to move toward the ideal location in the search space as the iterations go on. One crucial aspect of the PSO algorithm is the social interaction and information sharing that occurs amongst the particles in the swarm. The swarm’s collective behaviour is what allows the program to search as efficiently as possible [18]. Figure 2’s flowchart presents the standard PSO algorithm. Table 1 lists the unique characteristics of the PSO algorithm when compared to other heuristic optimisation techniques.

3.2. PSO Algorithm Implementation to the Microgrid Optimisation Problem

The PSO algorithm’s mechanics must be transferred to the optimisation problem’s structure to be applied to any kind of optimisation problem. In particular, when looking for the best solution to the problem, a mapping between the particle positions and velocities and the optimisation problem’s decision vector must be constructed, as well as an adjustment process for the decision vector. The PSO method resolves the hybrid microgrid optimisation issue presented in Equations (4)–(12), subject to the limitations specified in Equations (13)–(25). The structure of the location and velocity Equation (26) must therefore be mapped to the structure of the hybrid microgrid optimisation problem. This is accomplished as follows:
  • The number of individuals in each distinct particle within the swarm is assigned to correspond with the number of generating units. The positions of the particle members represent the active power generated by the generators for the dispatch problem.
  • The velocities are variables that are used to search in the constraint’s domain, but they have the same meaning as the active power.
  • It is considered that the swarm has Np particles in total.
The PSO algorithm for the solution of an optimal hybrid renewable energy microgrid is developed using the following steps [19]:
Step 1. Set the initial values for the PSO parameters, including the maximum number of iterations (MaxIt), uniform random number values, r1 and r2, acceleration constants, c1 and c2, and inertia weight ω.
Step 2. Determine the starting velocity’s lowest and maximum values by applying the generator limit constraint, as stated below.
0.5 X t m i n V i t + 0.5 X t m a x
X = 1 ,     N p         i = 1 ,   n 1
whereby Np is the number of particles in a swarm, and n is the number of members in one particle, which is equal to the number of generating units.
Step 3. Determine the starting velocities of each particle, as shown in Equation (28).
V i t = V t m i n + r ( V t m a x V t m i n )
whereby V t m i n and V t m a x are the previously calculated minimum and maximum velocities, respectively.
Step 4. Determine the particle members’ starting positions as follows while ensuring the constraints are met:
X i t = X t m i n + r ( X t m a x X t m i n )
A slack bus, Generator (PV) bus, and Load (PQ) bus are the three types of buses in the power system. Slack buses, also known as reference buses, are utilised in electrical power systems to balance the active and reactive powers of the system during load flow analyses. By delivering and receiving active and reactive power to and from the system, the slack bus compensates for system losses. In the microgrid simulation, two buses are regarded as slack buses (the grid bus and the BESS bus). The slack bus in the PSO algorithm serves to fulfil the power balance constraint provided in Equation (13).
Step 5. Calculate the objective function for the initial positions of the particles, as defined in Equation (14), which was modified to consider only the BESS and grid costs as the PV and wind system costs are constant.
C M G = C B E S S + C g r i d
Step 6. Choose the optimal starting point and the global optimal starting point in the manner described below.
  • The initial positions of the particles within the swarm are deemed to be their optimal positions.
  • Global best is defined as the position that is optimal among all optimal particles.
Step 7. Calculate the new velocities using Equation (26) and check the constraints defined in Equations (13)–(25).
V i n e w = w V i 1 + c 1 r 1 ( p b e s t i 1 X i 1 ) + c 2 r 2 ( g b e s t i 1 X i 1 )
Step 8. Calculate the new position of the generator in the particles using the following equation and check the constraints:
X i n e w = X t i 1 + X t i n e w
Step 9. Determine the updated real power of the generators and use the limitations to verify the generator’s new location within the particles.
Step 10. Check the objective function results as defined in the PSO flow chart.
If   F i n e w < F i b e s t 1   then   F i b e s t = F i n e w   and   X i b e s t = X i n e w
Else   F i b e s t = F i b e s t 1   and   X i b e s t = X i b e s t 1 ,   G i b e s t = X i b e s t 1
Step 11. Repeat Steps 5–10 until the maximum number of iterations is reached or the algorithm has converged.

4. Hybrid Renewable Energy Microgrid Simulation Results

The system described in Section 2 above was modelled and simulated using MATLAB R2023b run on a laptop with Windows 10 Enterprise, Lenovo ThinkPad, i5-8365 CPU @ 1.6 GHz, 4 Cores in South Africa. The weather data for a PV system, solar irradiance, and wind speed data for a wind turbine system are used to simulate the intermitted nature of the renewable sources. For a PV system, irradiance data for clear day and cloudy day scenarios are provided. The load profile as well as electricity price data for purchasing electricity from the grid and selling electricity to the grid are included in the WindPvLoadPriceData file (Supplementary Materials) taken from MATLAB examples and updated accordingly to include all of the required data. The price data are shown in South African currency, ZAR. The data provided are for a full day, 24 h, with a 1 min average. For simulation purposes, the data were further broken down into 5 min average samples for ease of computation. The PSO algorithm was run for 48 s to provide the simulation results.

4.1. Grid Interaction Cost Data

The grid interaction costs, which are made up of the cost of selling electricity to the grid as well as the cost of purchasing electricity from the grid, are divided into three price levels, which are off-peak, standard, and peak, as shown in Figure 3. The off-peak period electricity price is 2.89 ZAR/kWh, the standard price is 4.35 ZAR/kWh, and the price is 9.82 ZAR/kWh during the peak period. The time zones are defined as follows: the off-peak is between 22:00 and 06:00, the standard is between 06:00 and between 07:00 and 10:00 and 18:00, while peak periods are between 08:00 and 10:00, and between 18:00 and 22:00.

4.2. Photovoltaic System

The nature of the photovoltaic system’s behaviour during a clear day is shown in Figure 4. It is shown that the system producing energy only during the day between sunrise and sunset. Peak power is reached between 11:00 and 15:00 before the power starts dropping. A partly cloudy day simulation photovoltaic system simulation is indicated in Figure 5 using the cloudy day irradiance data. An erotic behaviour is witnessed as clouds pass by, causing sudden drops in production in comparison to a clear day simulation graph, as shown in Figure 4, which is more predictable.

4.3. Wind Turbine Generation

The wind speed data provided in the WindPvLoadPriceData file (Supplementary Materials) provide the wind turbine generation profile, as indicated in Figure 6. As mentioned in [20], wind turbine generators generate electricity at night because the wind speeds are typically higher. Figure 6 illustrates this observation, which appears to be the reverse of what the solar system is doing, with production only visible during the day, as depicted in Figure 4 and Figure 5.

4.4. Microgrid Load Profile

The microgrid load profile is given in Figure 7 as per the data provided in the WindPvLoadPriceData file (Supplementary Materials).

4.5. Microgrid Operation without Battery Energy Storage System

4.5.1. MG Operation during a Clear Day

The microgrid operation without the operation of BESS is indicated in Figure 8. The microgrid load is supplied, generally, from renewable energy sources (wind and solar), and when the load demand is not met, additional electricity is purchased from the grid. This is evident in the graph, which shows that energy was imported from the grid between 08:20 and 08:50, and between 14:25 and around 23:30. In contrast, when the load demand is lower than the produced energy from the renewable sources, excess energy is sold to the grid operator. Between 23:30 and around 08:20, and between 08:50 and 14:25, energy was sold to the grid operator. During the morning, the microgrid sells power to the grid at high prices, and during the standard pricing period, excess renewable energy is sold. However, during the evening peak, before the wind turbine generator reaches its peak, an additional supply of energy is required to meet the load demand, and that is purchased from the grid operator at high prices.

4.5.2. MG Operation during a Partly Cloudy Day

The microgrid operation without the operation of the BESS during a partly cloudy day is indicated in Figure 9. The microgrid load is supplied from renewable energy sources during off-peak periods, and when the load demand is not met, additional electricity is purchased from the grid. With the very unpredictable generation of energy from renewable sources, more energy is purchased from the grid, even during peak periods, resulting in a high cost for the microgrid operator. The use of the BESS has proven valuable in operation costs of the microgrid, as discussed in Section 4.6.

4.6. Microgrid Operation with Battery Energy Storage System

4.6.1. MG Operation during a Clear Day

It is a known fact that renewable energy resources are stochastic in nature and, as such, energy generation is intermitted. Battery energy storage systems are therefore necessary to supplement renewable energy sources while avoiding the use of diesel generators to improve carbon emissions. Figure 10 shows a microgrid operation with a BESS connected and in operation on a clear day. The graph shows that the BESS charges during off-peak periods, from late at night until the morning, from excess energy generated from renewable sources. When the BESS is fully charged, around 6/7, excess energy from renewables is sold to the grid operator, during the peak period, which has a high price. Also, during the day, for clear day forecasting, when the solar system reaches its peak generation, which is greater than the load demand, and the battery is fully charged, excess energy is sold to the grid during the standard pricing period. In the afternoon, the load demand starts peaking up, and the solar system production drops, while the wind energy is zero. This results in the battery system discharging to supply the load while the wind turbine generation slowly peaks up to assist in energy supply and reduce the burden from the BESS. Also, this is the peak period, and the microgrid manages to avoid drawing energy from the grid, as it is very costly.

4.6.2. MG Operation during a Partly Cloudy Day

Figure 11 shows the microgrid operation with a BESS connected and in operation on a partly cloudy day. Similarly, and as explained in Section 4.6.1, the graph shows that the BESS is charging during off-peak periods, from late at night until the morning, from the excess energy generated from renewable sources. When the BESS is fully charged, around 6/7, excess energy from renewables is sold to the grid operator, during the peak period, which has a high price. Also, during the day, for a partly cloudy day forecasting, when the solar system is unpredictable, at times, generation exceeds the load demand for short periods, and at other times, generation is reduced below the load demand, and the BESS is used to supplement energy generation during energy dips, while during over-generation, excess energy is sold to the grid during the standard pricing period. From the afternoon, the load demand starts peaking up, and the solar system production drops, while the wind energy is zero and the BESS becomes used more, while the wind turbine generation slowly peaks up to assist in energy supply and reduce the burden from the BESS. Also, this is the peak period, and the microgrid manages to avoid drawing energy from the grid, as it is very costly.

4.6.3. Microgrid Reserve Margins using BESS

Figure 12 shows the microgrid operation with BESS reserve margins during a clear day. The technical requirements for supplementary services in South Africa outline the conditions for each reserve category and list the following five kinds of reserves [21]:
  • Regulating reserves, which are used for second-by-second supply and demand balancing under AGC control;
  • Instantaneous reserves, which are used to arrest the frequency within acceptable bounds following a contingency;
  • Ten-minute reserves, which are used to balance the supply and demand for variations between the day-ahead market and real time, such as load forecast errors and unit unreliability;
  • Emergency reserves, which are utilised to restore normalcy to the interconnected power system while slower reserves are being drawn upon, and when the system is not operating normally;
  • Supplemental reserves, which are meant to guarantee a manageable risk for the day ahead.
The figure shows the BESS state of charge with a minimum of 50%. The depth of discharge during normal operation (grid and/or renewable energy available) is 50%. When the grid and/or renewable energy sources are not available, the minimum depth of discharge is 30%, with the BESS only supplying critical loads.

5. Discussion

Hybrid renewable energy-based microgrids must run as efficiently as possible to guarantee that the full benefits of microgrid use are achieved. The particle swarm optimization (PSO) method, with the background given in [22], is proposed as an optimal strategy to manage microgrids with hybrid renewable energy sources (HRESs) while considering microgrid reserve margins. The intermittent nature of renewable energy resources, such as wind and solar energy, has been simulated using weather data, wind speed for wind turbine generators, and solar irradiance for the solar PV system. During the summer, wind speeds are generally higher at night than they are during the day [20]. This serves as the foundation for the simulation’s wind speed data. On clear days, the solar system’s production curve is understood, but on cloudy days, it is rather unpredictable. For this reason, two sets of solar irradiance data were used: one set for a clear day to generate power predictably, and another set for a partially cloudy day to generate power infrequently. The simulated curves for a clear and partly cloudy day using the given data are shown in Figure 4 and Figure 5, respectively. The wind turbine generation profile, according to the used data, is displayed in Figure 6. 
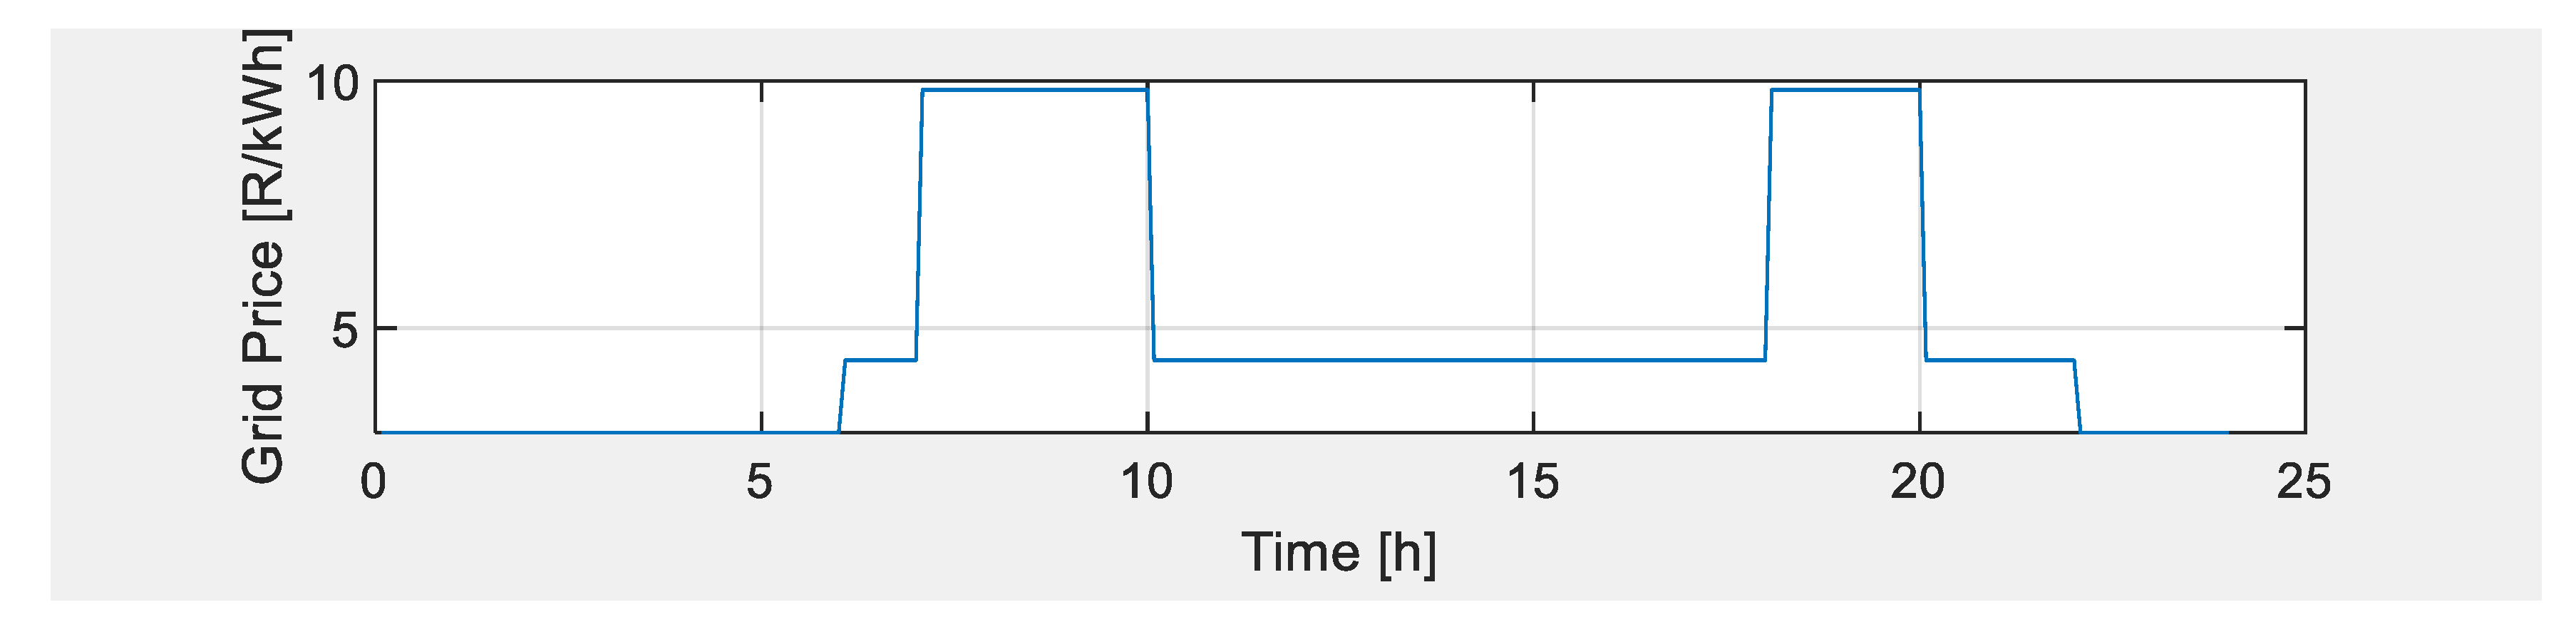
Figure 3 displays the electricity price data with three pricing tiers: off-peak, regular, and peak hours.
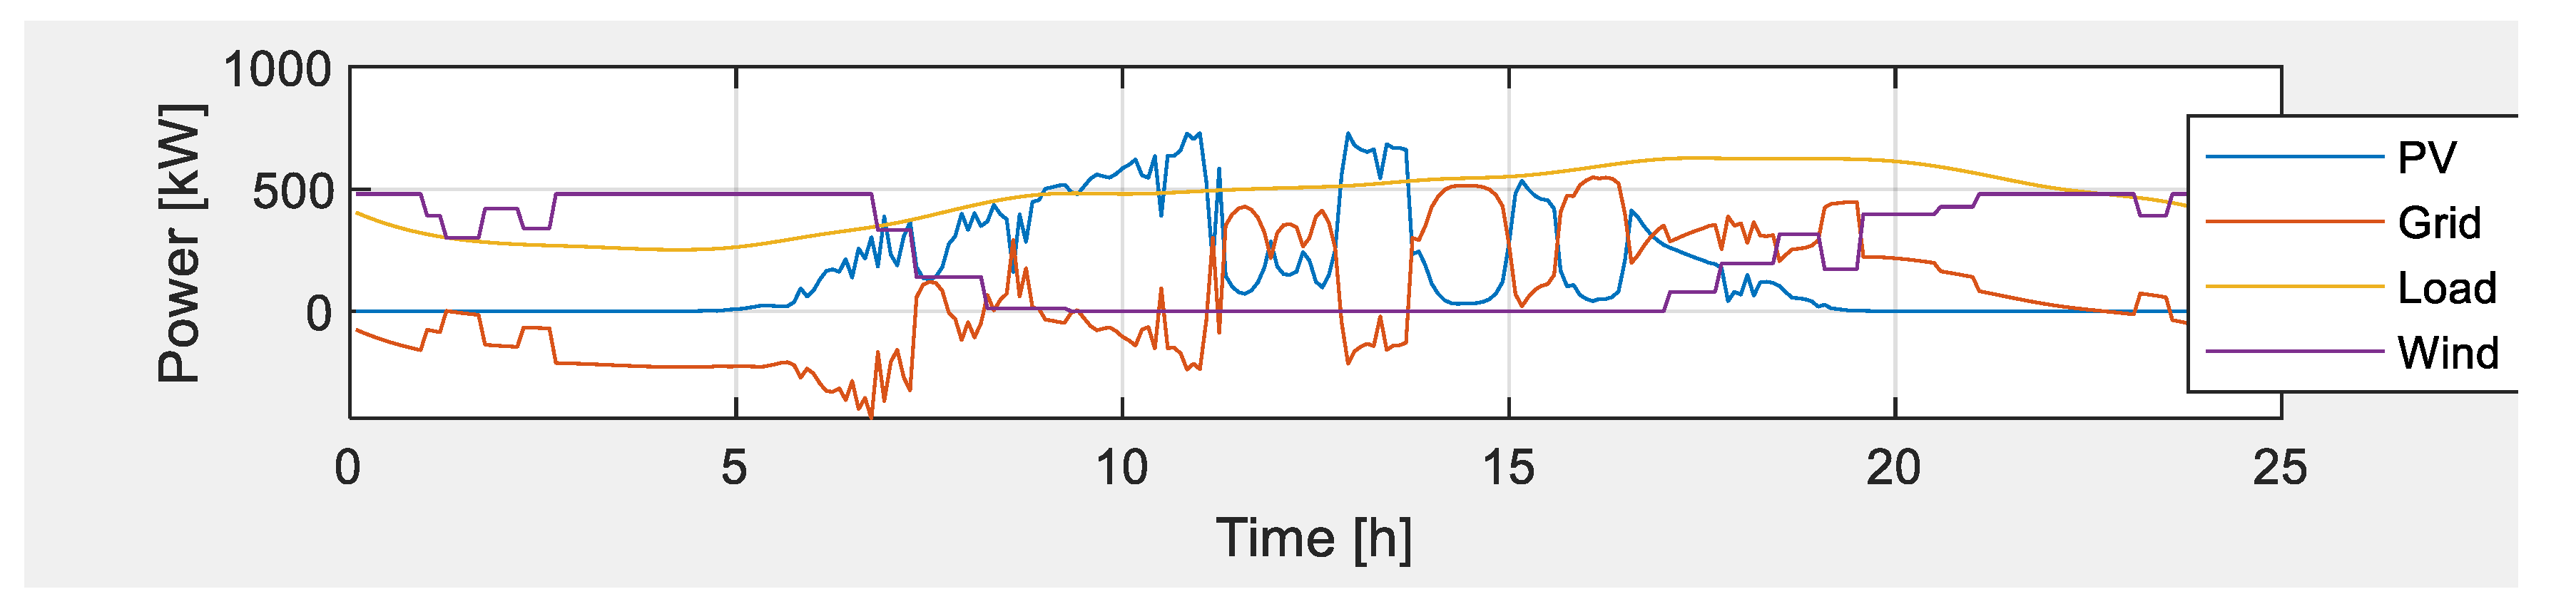
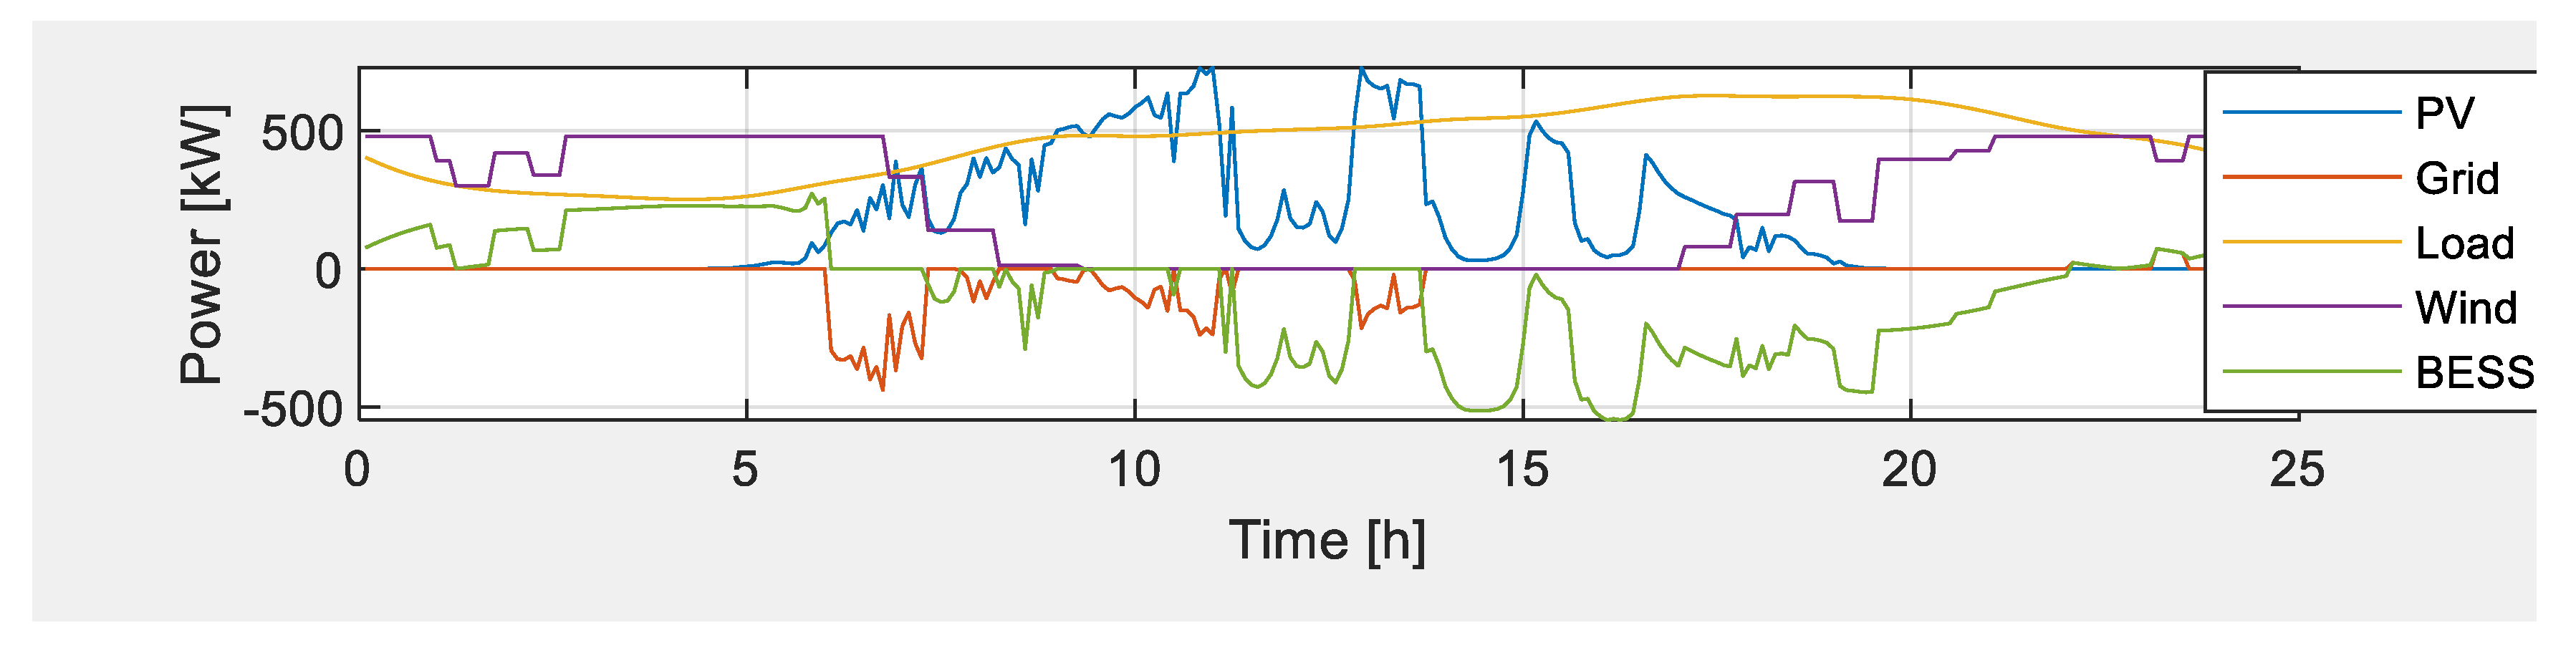
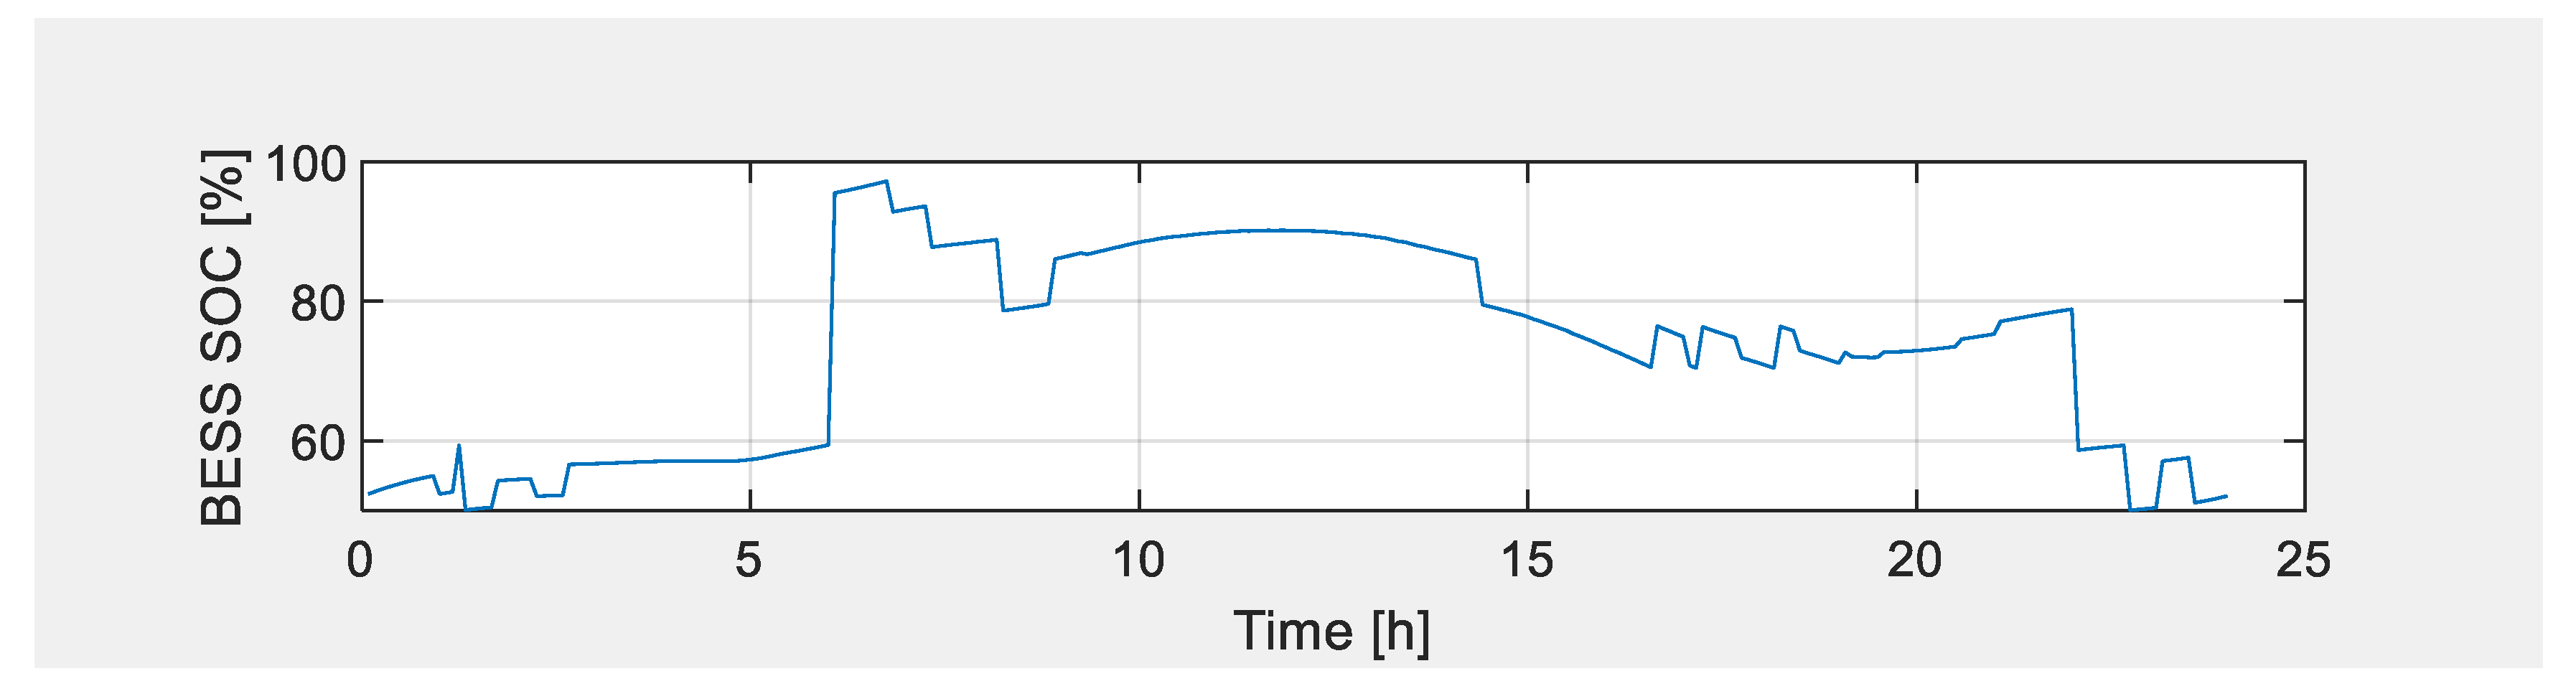
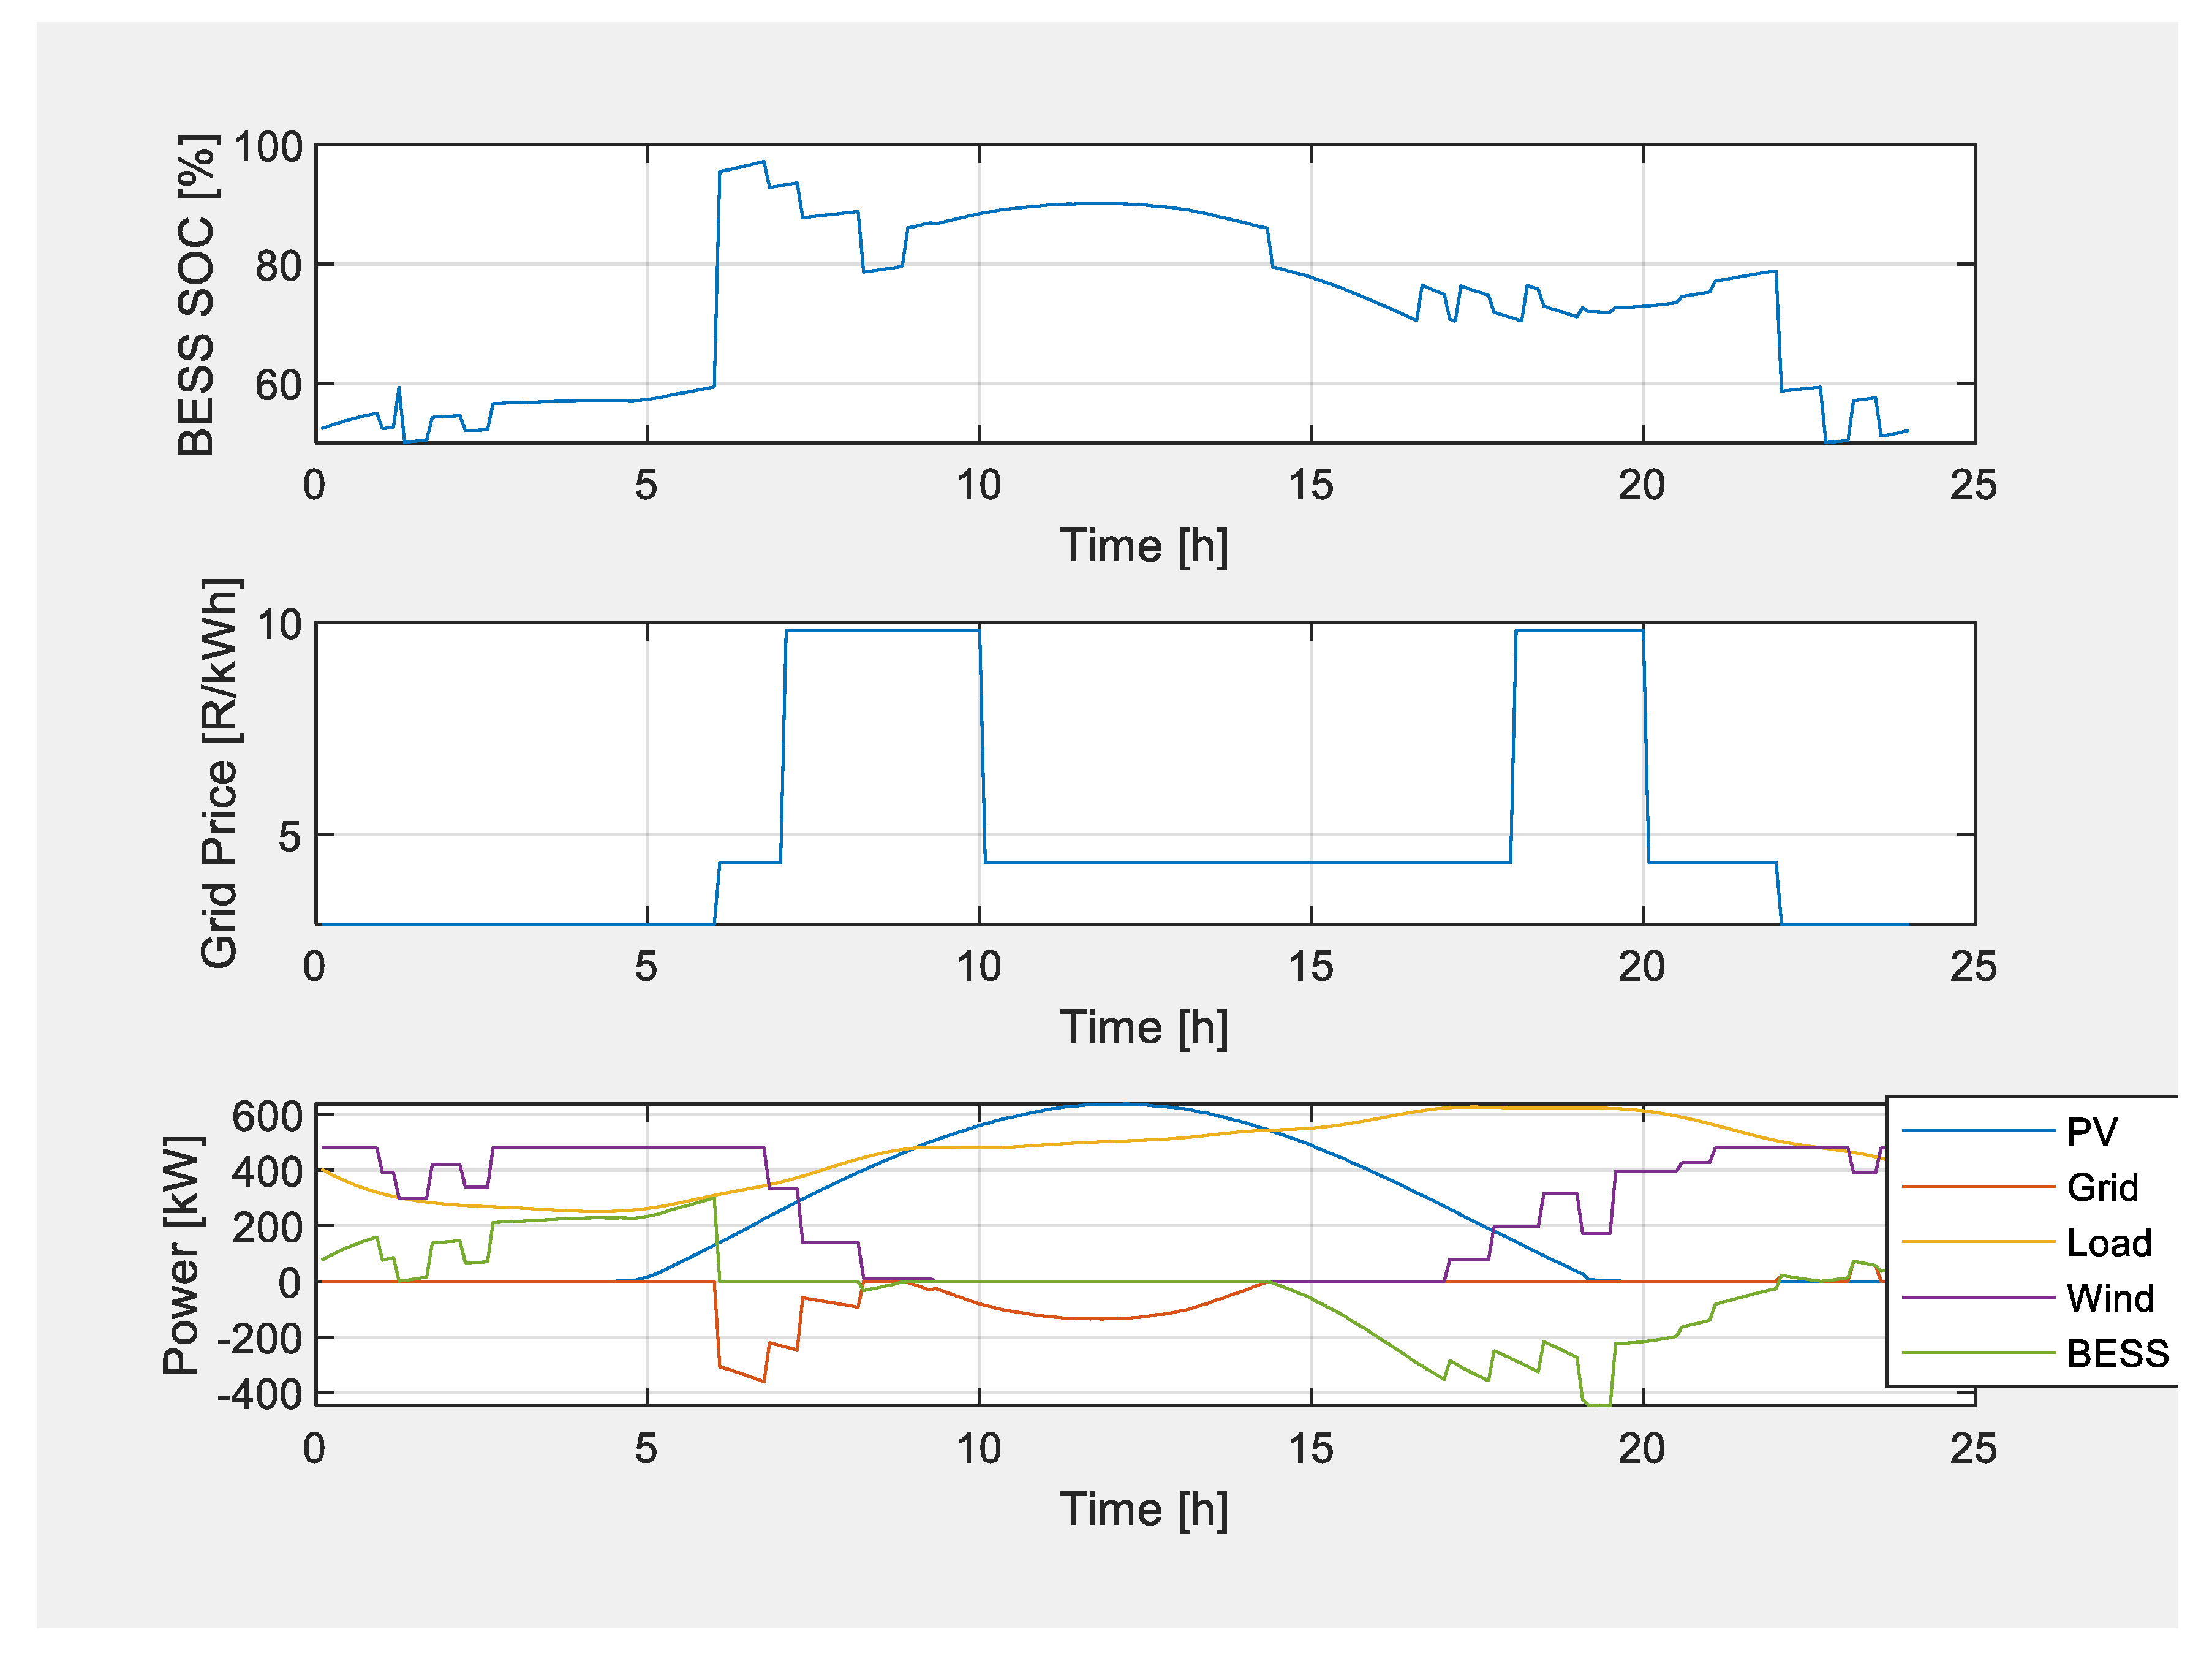
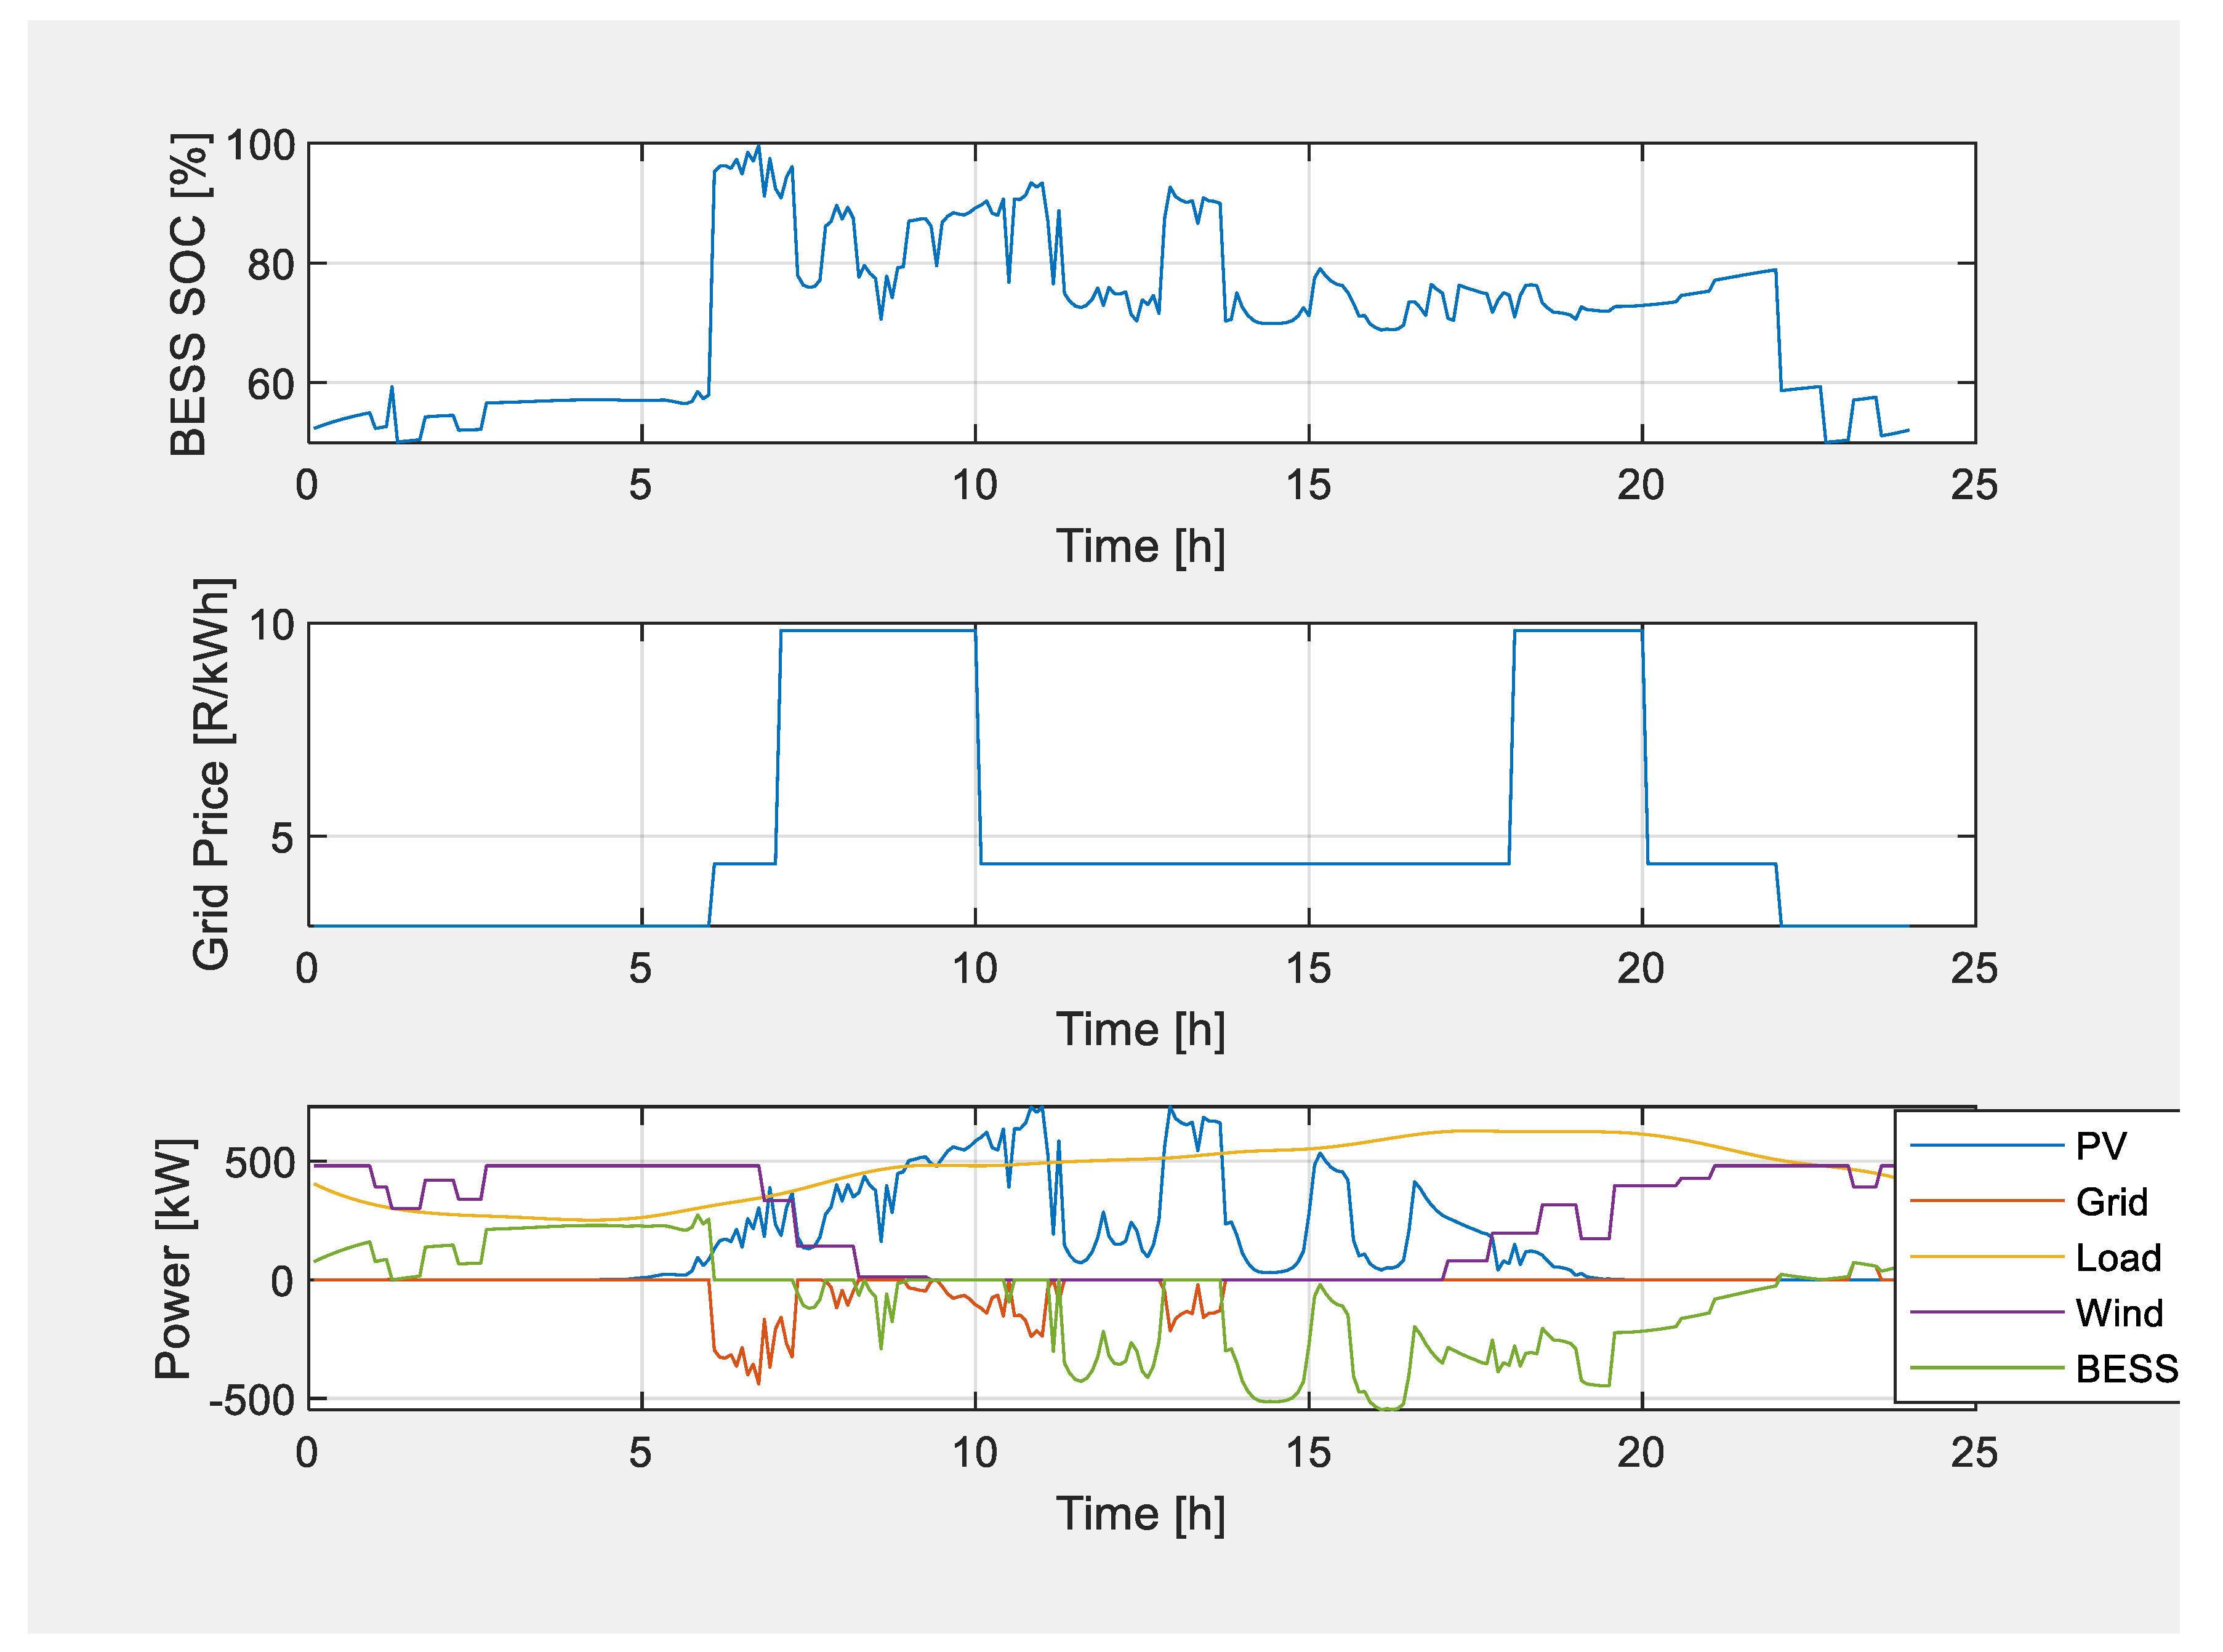
Figure 13 depicts both the electricity pricing schedule and the microgrid operation simulation on a clear day with a BESS connection. The simulation findings demonstrate that extra generated energy is sold to the grid operator during normal and peak periods, and buying electricity from the grid is entirely avoided during these times. This demonstrates that the PSO approach is operating correctly and optimally.
A partially overcast day with a BESS is depicted in Figure 14 along with the microgrid operation simulation and electricity pricing schedule. It is challenging to avoid using the grid to purchase electricity during regular and peak hours due to the solar system’s irregular generation. Moreover, the BESS is utilised for extended periods as long as the predetermined 50% depth of discharge for critical loads is maintained. By protecting the established limitations, the PSO algorithm was able to maximise the microgrid’s performance.
Figure 15, Figure 16, Figure 17 and 
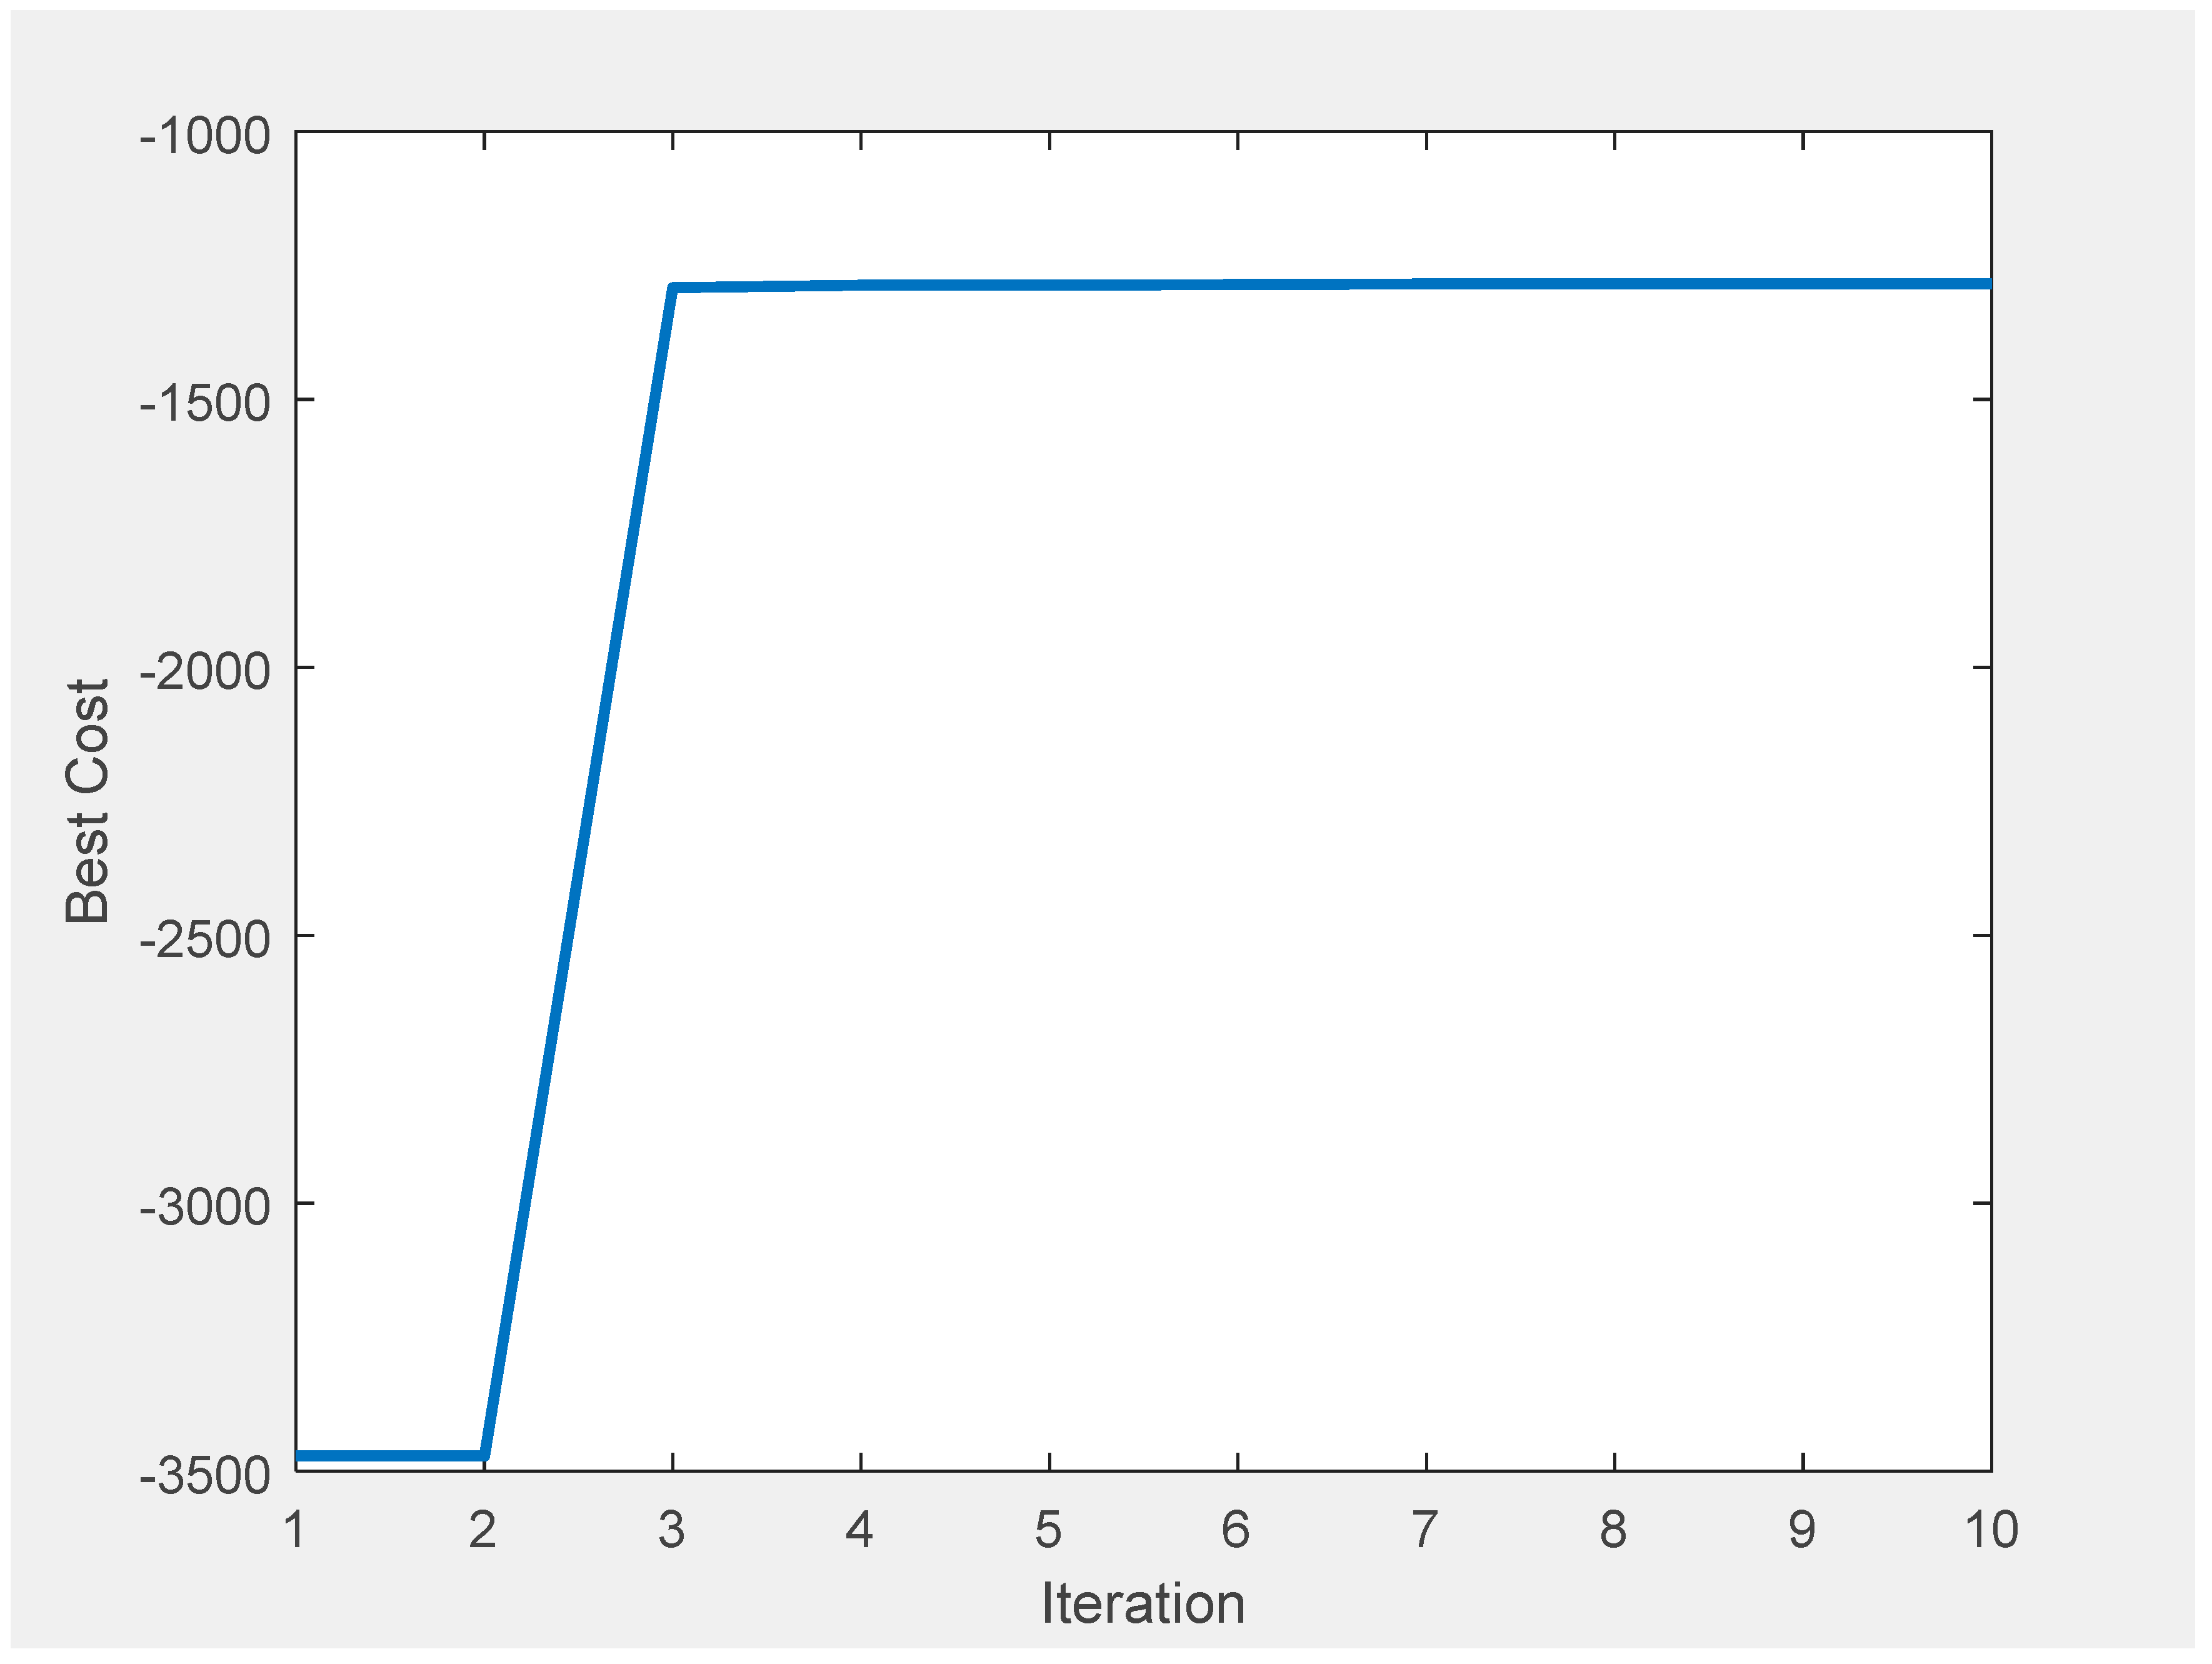
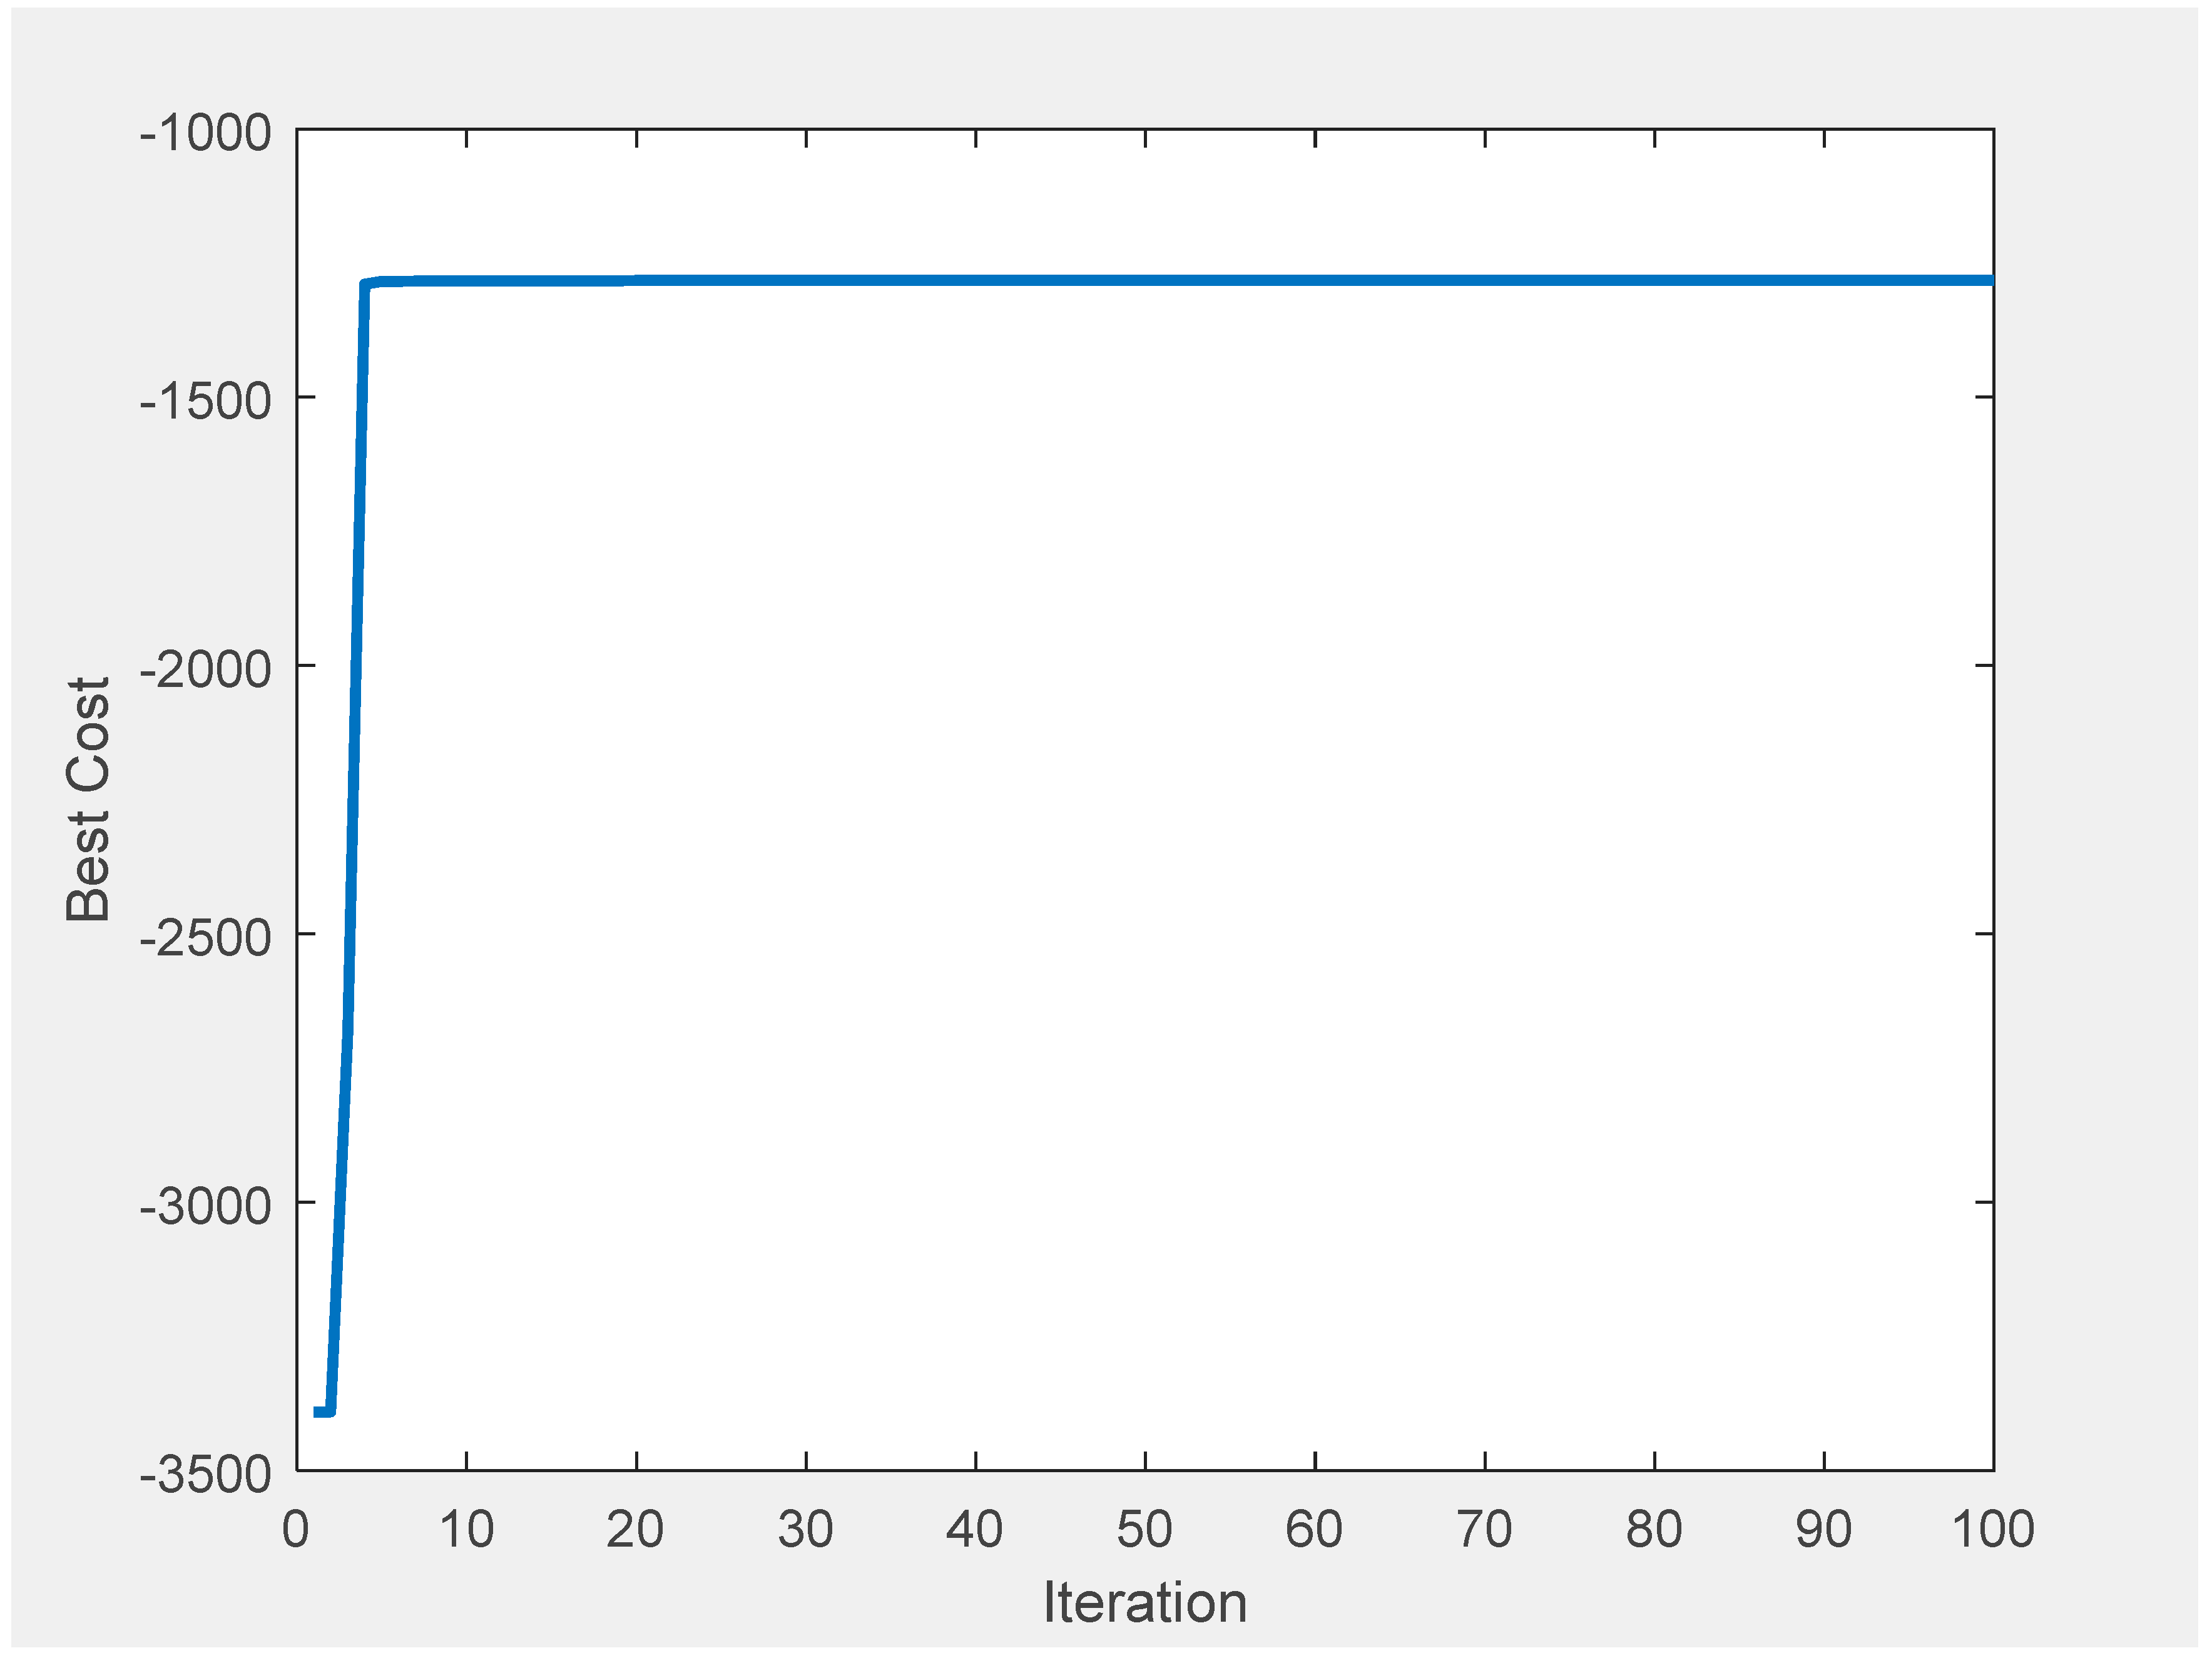
Figure 18 illustrate the effect of the number of iterations parameter selected for the PSO algorithm. On a clear day, the PSO maximum iteration count is set to 10 and 100, respectively, as shown in Figure 15 and 
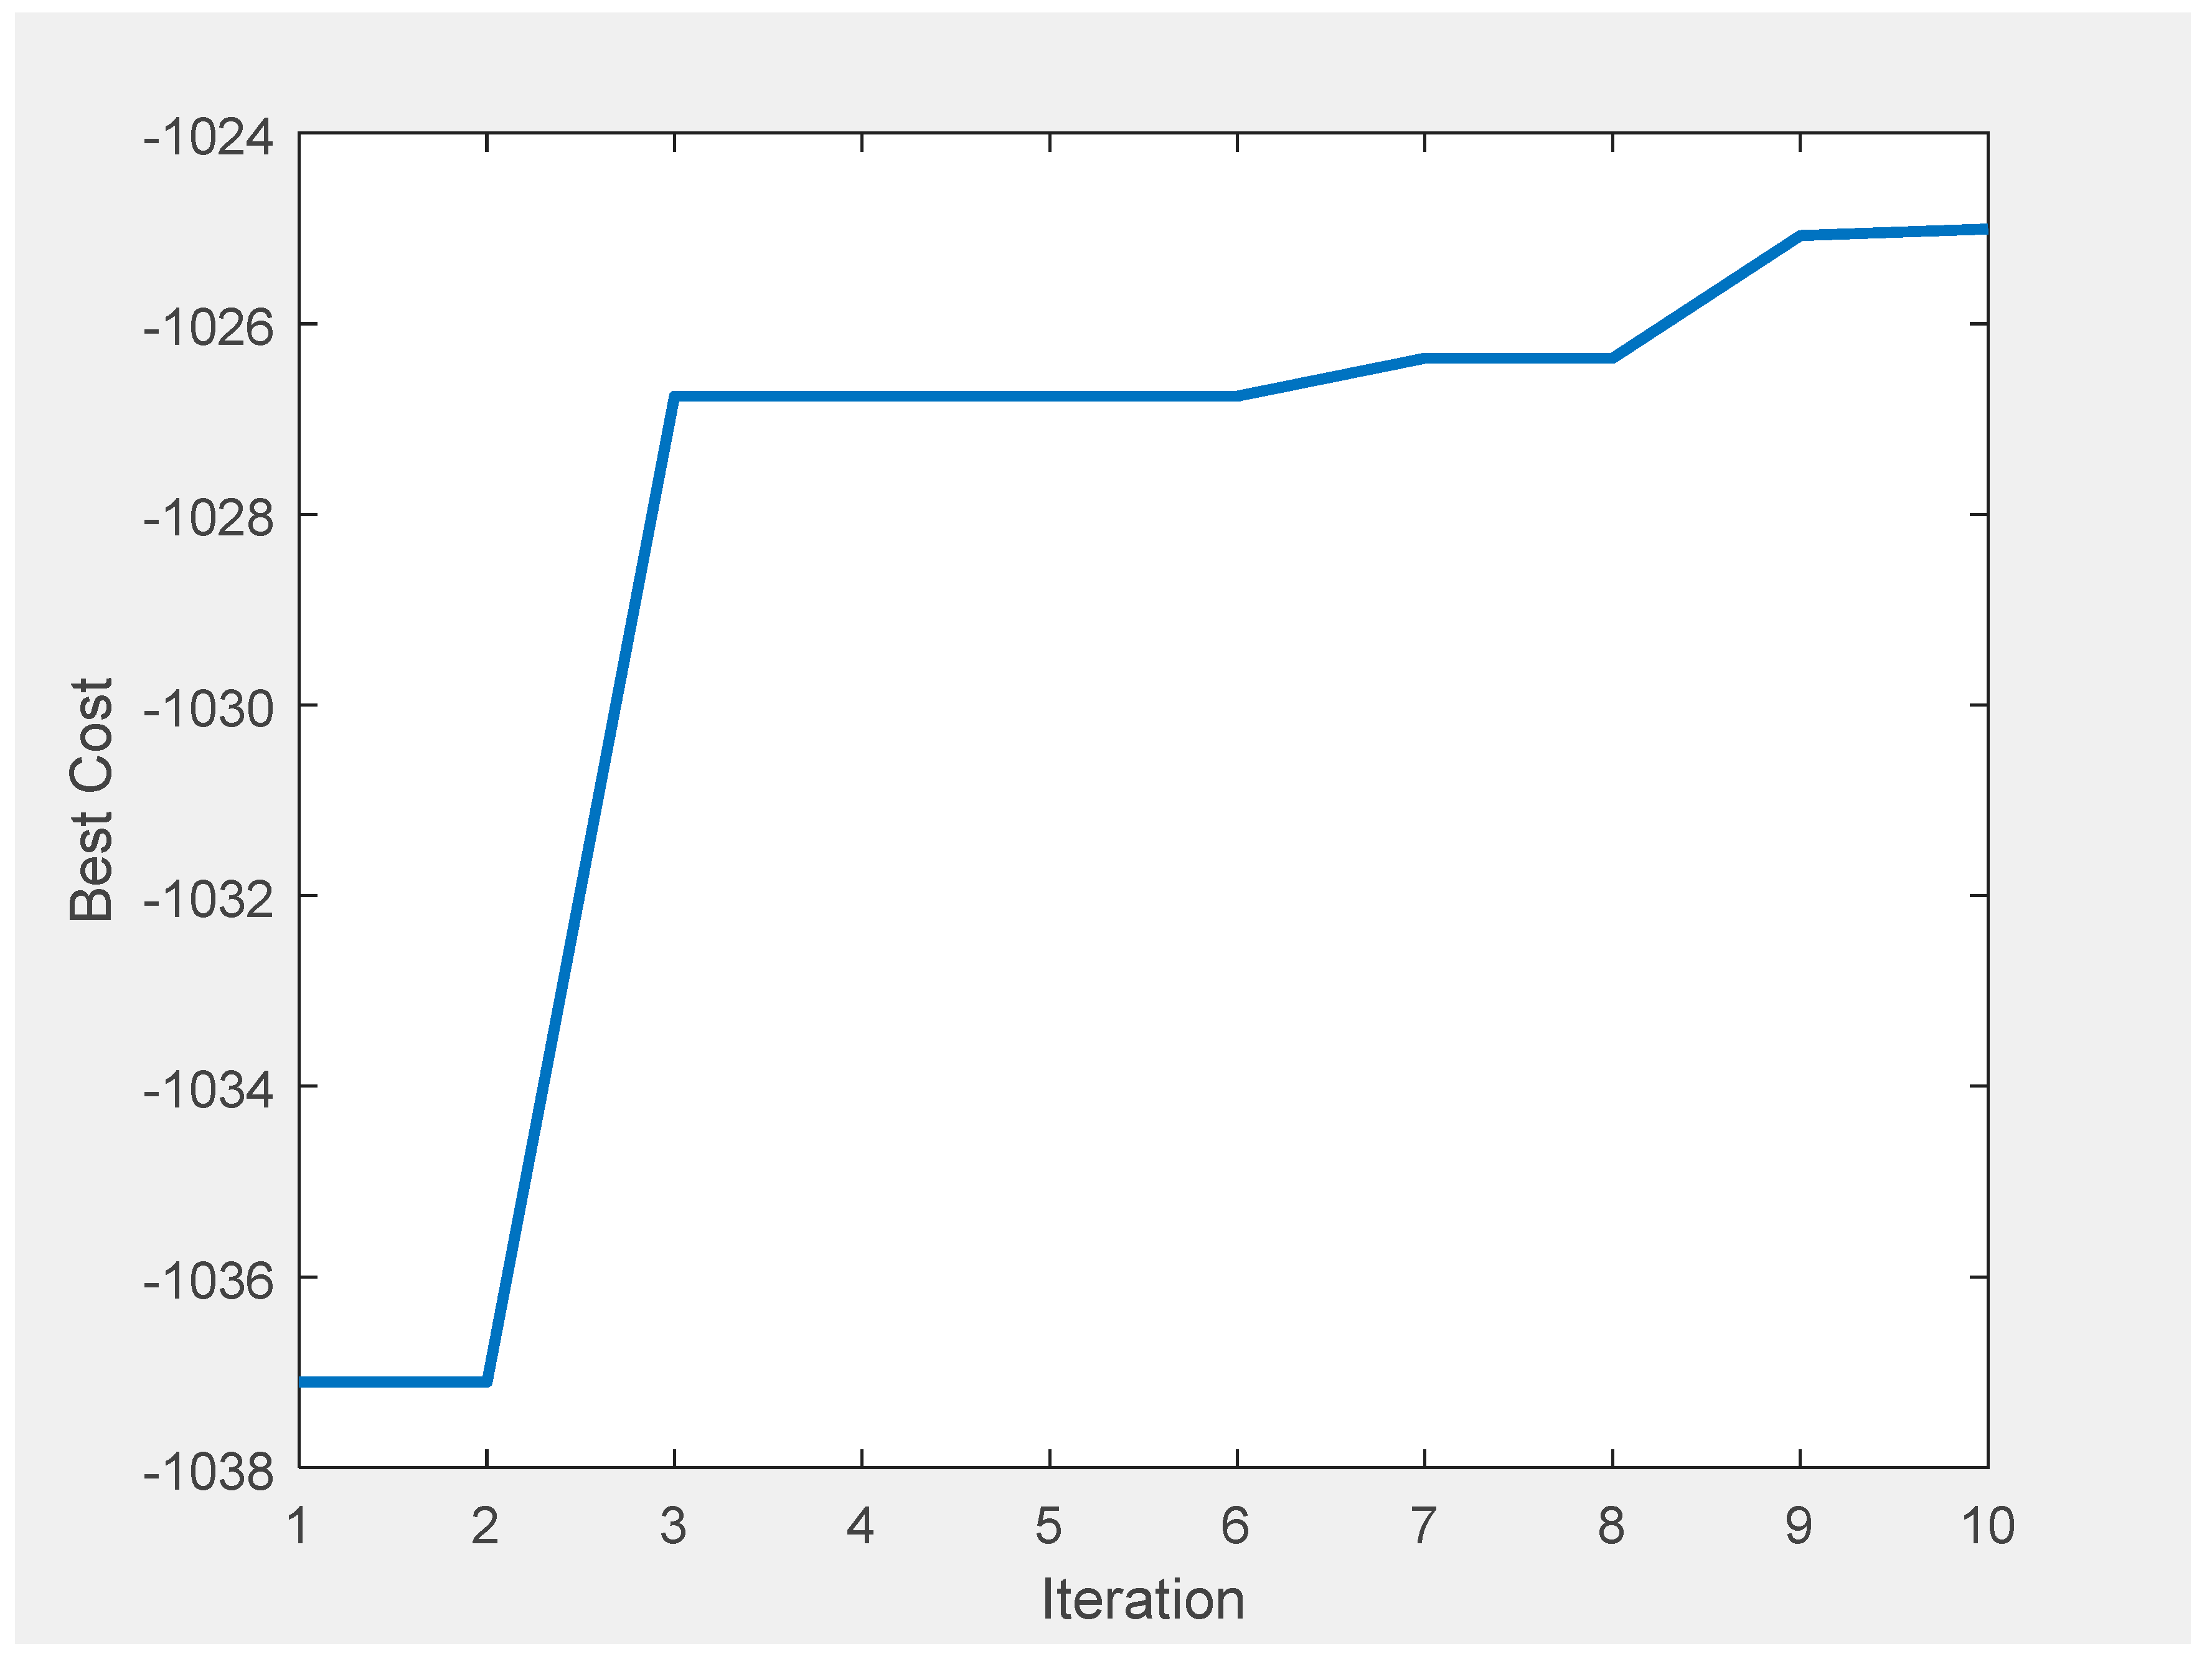
Figure 16. The PSO algorithm finds that the optimal cost is ZAR 1,283,990 per day when the maximum iteration is set to 10, and ZAR 1,281,040 per day when the maximum iteration is set to 100. This represents a difference of ZAR 2950 per day. For a partially overcast day, the same comparison is made, as shown in Figure 17 and Figure 18. The PSO algorithm determined that ZAR 1,025,005 per day was the optimal cost at a maximum iteration of 10, and ZAR 1,023,190 per day was the optimal cost at a maximum iteration of 100, resulting in a difference of ZAR 1815 per day. The contrast observed on partially cloudy and clear days emphasises how crucial it is to choose the right PSO parameters to guarantee the method’s successful and efficient operation. As seen in Figure 15 and Figure 17, an additional phenomenon to be observed is the PSO algorithm terminating early. Two techniques are employed as the stopping criteria in the PSO algorithm flowchart (Figure 2): maximum iteration and convergence. The former has already been covered. PSO convergence is the term used to describe the effective convergence of swarm particles to a single solution. To decide how much the current global best can deviate from the prior global best, a threshold is typically imposed. Once it is determined that the optimal solution has not been altered by more than a specific amount, the algorithm is said to have converged.

6. Conclusions

Table 2 compares the grid interaction costs for selling excess generated electricity to the grid and purchasing electricity from the grid at times when renewable energy sources are producing little or no electricity. The positive signs represent energy that is received from the grid, while the negative signs represent energy that is sold to the grid. The Table shows that, on a clear day, running the microgrid without the battery energy storage system has a net cost of roughly ZAR 538,320 per day. The partly cloudy day net cost, with a daily total of ZAR 1,917,400.00, is positive, indicating that more energy has been bought from the grid. Using the PSO algorithm and adding a BESS significantly reduced the grid interaction costs; on a clear day, the cost was ZAR 1,281,040, which was up 58%, and on a partly cloudy day, it was ZAR 1,023,190, which was up 153%. When deciding when to buy/sell electricity and when to charge/discharge batteries to achieve the greatest cost savings, the PSO algorithm can help to determine the best time to operate the microgrid.
Table 3 displays a tabular representation of the maximum iteration value impact of the PSO algorithm on the final solution. The efficiency and performance of the algorithm depend on choosing the right value to prevent early termination. Over a 24 h period, the difference might not seem significant, but over a year, for example, this could result in lost revenue exceeding ZAR one million.

7. Future Work

Utilising real-time simulators, future work will run EV simulations to capture the EV behaviour during transient periods instead of relying on load profile data.
A performance evaluation of the PSO algorithm with alternative heuristic optimisation techniques will also be conducted.

Supplementary Materials

The following supporting information can be downloaded at: https://www.mdpi.com/article/10.3390/en17020422/s1, Simulation data: WindPvLoadPriceData.

Author Contributions

Conceptualisation, M.A.M. and S.K.; methodology, M.A.M.; software, M.A.M.; validation, M.A.M. and S.K.; formal analysis, M.A.M.; investigation, M.A.M.; resources, S.K.; data curation, M.A.M.; writing—original draft preparation, M.A.M.; writing—review and editing, S.K.; visualisation, M.A.M.; supervision, S.K.; project administration, S.K.; funding acquisition, S.K. All authors have read and agreed to the published version of the manuscript.

Funding

This research was funded in part by the National Research Foundation (NRF) under Grant Number DAAD180213312673 and the NRF Thuthuka Grant, under Number 138177. The authors also acknowledge the research grant from the Eskom Tertiary Education Support Programme (TESP), the Eskom Power Plant Engineering Institute (EPPEI), and the funding from SANEDI JET RFQ0622, which supported the carrying out of this research work.

Data Availability Statement

Data are contained within the article and Supplementary Materials.

Acknowledgments

The authors gratefully acknowledge the authorities of the Cape Peninsula University of Technology in South Africa for the facilities offered to carry out this work.

Conflicts of Interest

The authors declare that this study received funding from Eskom Power Plant Engineering Institute. The funders were not involved in the study design, collection, analysis, interpretation of data, the writing of this article or the decision to submit it for publication. The authors declare no conflict of interest.

References

  1. Mataifa, H.; Krishnamurthy, S.; Kriger, C. Volt/VAR Optimization: A Survey of Classical and Heuristic Optimization Methods. IEEE Access 2022, 10, 13379–13399. [Google Scholar] [CrossRef]
  2. Dagal, I.; Akin, B.; Akboy, E. A novel hybrid series salp particle Swarm optimization (SSPSO) for standalone battery charging applications. Ain Shams Eng. J. 2022, 13, 101747. [Google Scholar] [CrossRef]
  3. Roy, A.; Olivier, J.; Auger, F.; Auvity, B.; Schaeffer, E.; Bourguet, S.; Schiebel, J.; Perret, J. A combined optimization of the sizing and the energy management of an industrial multi-energy microgrid: Application to a harbour area. Energy Convers. Manag. X 2021, 12, 100107. [Google Scholar] [CrossRef]
  4. Zhang, X.; Son, Y.; Cheong, T.; Choi, S. Affine-arithmetic-based microgrid interval optimization considering uncertainty and battery energy storage system degradation. Energy 2022, 242, 123015. [Google Scholar] [CrossRef]
  5. Madathil, S.C.; Nagarajan, H.; Bent, R.; Mason, S.; Eksioglu, S.; Lu, M. Algorithms for Optimal Topology Design, Placement, Sizing and Operation of Distributed Energy Resources in Resilient Off-grid Microgrids. arXiv 2018, arxiv.1806.02298. [Google Scholar]
  6. Li, S.; Zhu, J.; Dong, H.; Zhu, H. A novel rolling optimization strategy considering grid-connected power fluctuations smoothing for renewable energy microgrids. Appl. Energy 2022, 309, 118441. [Google Scholar] [CrossRef]
  7. Zhang, X.; Wang, Z.; Lu, Z. Multi-objective load dispatch for microgrid with electric vehicles using modified gravitational search and particle swarm optimization algorithm. Appl. Energy 2022, 306, 118018. [Google Scholar] [CrossRef]
  8. Gomes, I.; Melicio, R.; Mendes, V. A novel microgrid support management system based on stochastic mixed-integer linear programming. Energy 2021, 223, 120030. [Google Scholar] [CrossRef]
  9. Zia, M.F.; Elbouchikhi, E.; Benbouzid, M. Optimal operational planning of scalable DC microgrid with demand response, islanding, and battery degradation cost considerations. Appl. Energy 2019, 237, 695–707. [Google Scholar] [CrossRef]
  10. Habib, H.; Wang, S.; Elkadeem, M.; Elmorshedy, M. Design Optimization and Model Predictive Control of a Standalone Hybrid Renewable Energy System: A Case Study on a Small Residential Load in Pakistan. IEEE Access 2019, 7, 117369–117390. [Google Scholar] [CrossRef]
  11. Soykan, G.; Er, G.; Canakoglu, E. Optimal sizing of an isolated microgrid with electric vehicles using stochastic programming. Sustain. Energy Grids Netw. 2022, 32, 100850. [Google Scholar] [CrossRef]
  12. Budiman, F.N.; Ramli, M.A.; Bouchekara, H.R. Optimal scheduling of a microgrid with power quality constraints based on demand side management under grid-connected and islanding operations. Int. J. Electr. Power Energy Syst. 2023, 155, 109650. [Google Scholar] [CrossRef]
  13. Tran, H.G.; Ton-That, L.; Thao, N.G.M. Lagrange Multiplier-Based Optimization for Hybrid Energy Management System with Renewable Energy Sources and Electric Vehicles. Electronics 2023, 12, 4513. [Google Scholar] [CrossRef]
  14. Kweon, J.; Jing, H.; Li, Y.; Monga, V. Small-signal stability enhancement of islanded microgrids via domain-enriched optimization. Appl. Energy 2023, 353, 122172. [Google Scholar] [CrossRef]
  15. Majeed, M.A.; Phichisawat, S.; Asghar, F.; Hussan, U. Optimal Energy Management System for Grid-Tied Microgrid: An Improved Adaptive Genetic Algorithm. IEEE Access 2023, 11, 117351–117361. [Google Scholar] [CrossRef]
  16. Wu, Z.; Zou, Y.; Zheng, F.; Liang, N. Research on Optimal Scheduling Strategy of Microgrid Considering Electric Vehicle Access. Symmetry 2023, 15, 1993. [Google Scholar] [CrossRef]
  17. Luo, G.; Mei, Y. Multi-objective Optimization Scheduling of Microgrids based on Particle Swarm Optimization Algorithm. In Proceedings of the International Conference on Network, Multimedia and Information Technology (NMITCON), Guizhou, China, 1–2 September 2023. [Google Scholar]
  18. Mataifa, H.; Krishnamurthy, S.; Kriger, C. Comparative Analysis of the Particle Swarm Optimization and Primal-Dual Interior-Point Algorithms for Transmission System Volt/VAR Optimization in Rectangular Voltage Coordinates. Mathematics 2023, 11, 4093. [Google Scholar] [CrossRef]
  19. Krishnamurthy, S.; Tzoneva, R.; Apostolov, A. Method for a Parallel Solution of a Combined Economic Emission Dispatch Problem. Electr. Power Compon. Syst. 2017, 45, 393–409. [Google Scholar] [CrossRef]
  20. Livermore, C. Power Generation Is Blowing in the Wind. Available online: https://www.llnl.gov/news/power-generation-blowing-wind#:~:text=Wind%20speeds%20were%20higher%20at,cool%20season%20(less%20power) (accessed on 16 November 2023).
  21. Sørensen, P.; Litong-Palima, M.; Hahmann, A.; Heunis, S.; Ntusi, M.; Hansen, J. Wind power variability and power system reserves in South Africa. J. Energy S. Afr. 2017, 29, 59–71. [Google Scholar] [CrossRef]
  22. Tam, A. Machine Learning Mastery. 12 October 2021. Available online: https://machinelearningmastery.com/a-gentle-introduction-to-particle-swarm-optimization/ (accessed on 15 November 2023).
Figure 1. Grid-integrated microgrid.
Energies 17 00422 g001
Figure 2. PSO algorithm implementation.
Energies 17 00422 g002
Figure 3. Grid interaction costs.
Energies 17 00422 g003
Figure 4. Clear day photovoltaic system generation behaviour.
Energies 17 00422 g004
Figure 5. Partly cloudy day photovoltaic system generation behaviour.
Energies 17 00422 g005
Figure 6. Wind turbine generation profile.
Energies 17 00422 g006
Figure 7. Microgrid load profile.
Energies 17 00422 g007
Figure 8. Microgrid operation without BESS on a clear day.
Energies 17 00422 g008
Figure 9. Microgrid operation without BESS on a partly cloudy day.
Energies 17 00422 g009
Figure 10. Microgrid operation with BESS on a clear day.
Energies 17 00422 g010
Figure 11. Microgrid operation with BESS on a partly cloudy day.
Energies 17 00422 g011
Figure 12. Microgrid operation with BESS reserve margins on a clear day.
Energies 17 00422 g012
Figure 13. Electricity pricing schedule and microgrid operation with BESS on a clear day.
Energies 17 00422 g013
Figure 14. Electricity pricing schedule and microgrid operation with BESS on a partly cloudy day.
Energies 17 00422 g014
Figure 15. PSO solution on a clear day with an iteration of 10.
Energies 17 00422 g015
Figure 16. PSO solution on a clear day with an iteration of 100.
Energies 17 00422 g016
Figure 17. PSO solution on a partly cloudy day with an iteration of 10.
Energies 17 00422 g017
Figure 18. PSO solution on a partly cloudy day with an iteration of 100.
Energies 17 00422 g018
Table 1. PSO algorithm’s unique parameters.
ParameterDescription
Swarm SizeThe particle swarm’s population size or number of particles.
A bigger swarm size suggests a higher processing cost but also a wider search space.
It has been discovered that swarm sizes between 20 and 60 work well for many applications.
IterationsFinding the best option is more likely when the number is sufficiently large.
An excessively high number could result in an unaffordable computing cost.
The choice of the appropriate maximum number of iterations may depend on the nature of the problem.
VelocityThe contribution of each element to the total velocity update is determined by the relative values of the acceleration constants.
Numerous problem types have been discovered to benefit from a good balance between cognitive and social components.
Table 2. Total cost of grid interaction over 24 h.
Renewable SourcesPSOTotal Grid Interaction Cost on Clear Day (k ZAR/Day)Total Grid Interaction Cost on Partly Cloudy Day (k ZAR/Day)
Wind, SolarN/A−538.321917.40
Wind, Solar, BESSApplied−1281.04−1023.19
Table 3. Impact of maximum number of iterations summary.
TotalMaximum IterationTotal Grid Interaction Cost on Clear Day (k ZAR/Day)Total Grid Interaction Cost on Partly Cloudy Day (k ZAR/Day)
10−1283.99−1025.01
100−1281.04−1023.19
Difference
(k ZAR/day)
−2.95−1.82
Disclaimer/Publisher’s Note: The statements, opinions and data contained in all publications are solely those of the individual author(s) and contributor(s) and not of MDPI and/or the editor(s). MDPI and/or the editor(s) disclaim responsibility for any injury to people or property resulting from any ideas, methods, instructions or products referred to in the content.

