Article

Analysis of the Influence of Complex Terrain around DC Transmission Grounding Electrodes on Step Voltage

1
College of Electrical Engineering & New Energy, China Three Gorges University, Yichang 443000, China
2
Wuhan National High Magnetic Field Center, Huazhong University of Science and Technology, Wuhan 430074, China
3
Hubei Provincial Engineering Technology Research Center for Power Transmission Line, China Three Gorges University, Yichang 443000, China
*
Author to whom correspondence should be addressed.
Energies 2024, 17(2), 420; https://doi.org/10.3390/en17020420
Submission received: 4 December 2023 / Revised: 5 January 2024 / Accepted: 11 January 2024 / Published: 15 January 2024

Abstract

:
The distribution of renewable energy sources is geographically limited. In the process of long-distance transmission, the direct current flowing from a ground electrode into the ground will cause a higher step voltage, which will bring serious security risks to the surrounding industry and life. Accurate calculation of the complex soil electrical model around the grounding electrode is crucial for site selection. Existing simulation software like CDEGS results in significant errors, particularly in complex karst topography. Therefore, constructing a finite element model that accurately reflects the characteristics of geotechnical soil near the DC grounding electrode is an essential but unresolved problem. This paper establishes a soil electrical model for karst topography and explores the impact of cave-type caverns and underground rivers on the step voltage distribution of DC grounding electrodes. These research findings can guide the site selection of DC transmission projects in karst topography.

1. Introduction

Ultra-high voltage direct current (UHVDC) transmission technology has the advantages of a long transmission distance and low transmission loss. It can effectively realize the cross-regional transmission of renewable energy. Karst landscape is very common in cross-regional transportation. For example, the DC transmission project from Xiangjiaba to Shanghai passes through eastern Sichuan and western Hubei. Karst landscape is characteristic of such areas. Modeling such typical terrain, analyzing the distribution of surface step voltage, and accurately evaluating the safety of production and life in surrounding areas [1,2] all have important research significance. However, at present, there are few evaluations before the selection of grounding electrode sites in karst topography. Considering that the surface potential distribution is affected by the karst landform in a large range nearby, A practical soil electrical model was established for analysis. It plays an important role in accurately estimating the surface step voltage in karst landform areas for safe site selection [3,4].
Aiming at the site selection of the karst landform, Ai Linfeng [5] used the cavity to simulate the dry karst cave and studied the law of soil dispersion near the horizontal grounding electrode. This study is only aimed at dry karst caves. The analysis of the dispersion law is relatively detailed. But the morphology of the site selection object (karst landscape) is very complex, and there are caves, underground rivers, etc. That study is not yet complete [6,7]. In recent years, research on the influence of a geomorphic soil environment on HVDC transmission has made some progress [8,9,10]. For example, Professor Xiong Qi [11] established an anisotropic three-dimensional model for complex landforms. And the model calculation of single-ring horizontal earth electrode under complex landform has been optimized. The grounding electrode is equivalent to a line current source. The more accurate calculation results provide a research basis for the site selection of complex landforms. However, the complexity of geology needs to be further studied. German scholars used the finite element method [12,13,14] to simulate saturated layered soil [15]. The electricity and heat of the soil are coupled with the groundwater around the DC grounding electrode. Their research focuses on the temperature rise of the earth electrode. The optimal parameters for reducing the temperature rise and improving the degree of current diffusion below the earth are obtained. However, the situation of current diffusion below the earth is complex, and the problem of surface step voltage caused by it cannot be underestimated [16,17,18]. The research can still be pushed further. In summary, no matter the complexity of the research object or the research depth of the underground scattered flow, there is still a research gap in the topic of high-voltage DC grounding systems’ location. The electrical model of the soil around the grounding electrode under karst topography has its research value.
This paper simulates the typical karst topography around a DC grounding electrode site using the finite element simulation software Comsol 6.1. Various parameters such as the location, volume, and shape of the cave and the underground river are considered. The effects of these parameters on the distribution and maximum value of the surface step voltage are calculated. The results provide references for the site selection and optimization scheme design of the DC grounding electrode in karst topography.

2. Materials and Methods

2.1. Principle

There is a vector form of Ohm’s law of current density flow in a continuous medium [19]. The relationship between the current density and the resistivity of a geological structure is proved, as shown in Formula (1). The gradient in Formula (2) shows the relationship between the electric field strength and the electric potential. When a person’s feet are separated in the direction of increasing or decreasing potential, a potential difference is formed between the two feet [20]. For convenience, it will be assumed that a person has his feet one meter apart, and thus the step voltage is equal to the potential gradient mode [21]. The step voltage is the voltage difference per meter, so the unit is V/m. Formula (3) is derived: when the resistivity is constant, the step voltage is proportional to the current density norm.
J = 1 ρ E
E = Φ
U = | E | = ρ | J |
In these formulas, | J | is the current density norm, and its unit is A / m 2 . ρ is the resistivity, its unit is Ω · m . Φ is the potential, its unit is V. U is the step voltage, its unit is V / m . | E | is the potential gradient norm, its unit is V / m . The current injected into the earth electrode is the source of J , and the E is calculated by the Comsol module to obtain the step voltage of the surface.
Referring to DL/T 437-2012 (China Industry Standards) [5], the step voltage safety limit standards are as follows:
U lim = 7.42 + 0.0318 ρ
In this formula, U lim is the step voltage safety limit and ρ is the resistivity.
The karst topography model is based on the two layers of surrounding rock shown in Figure 1 [22]. The middle diagram’s layer 1 is the soil rock layer, and below the first floor is is the bedrock layer. The current diffusion law is as follows:
(1)
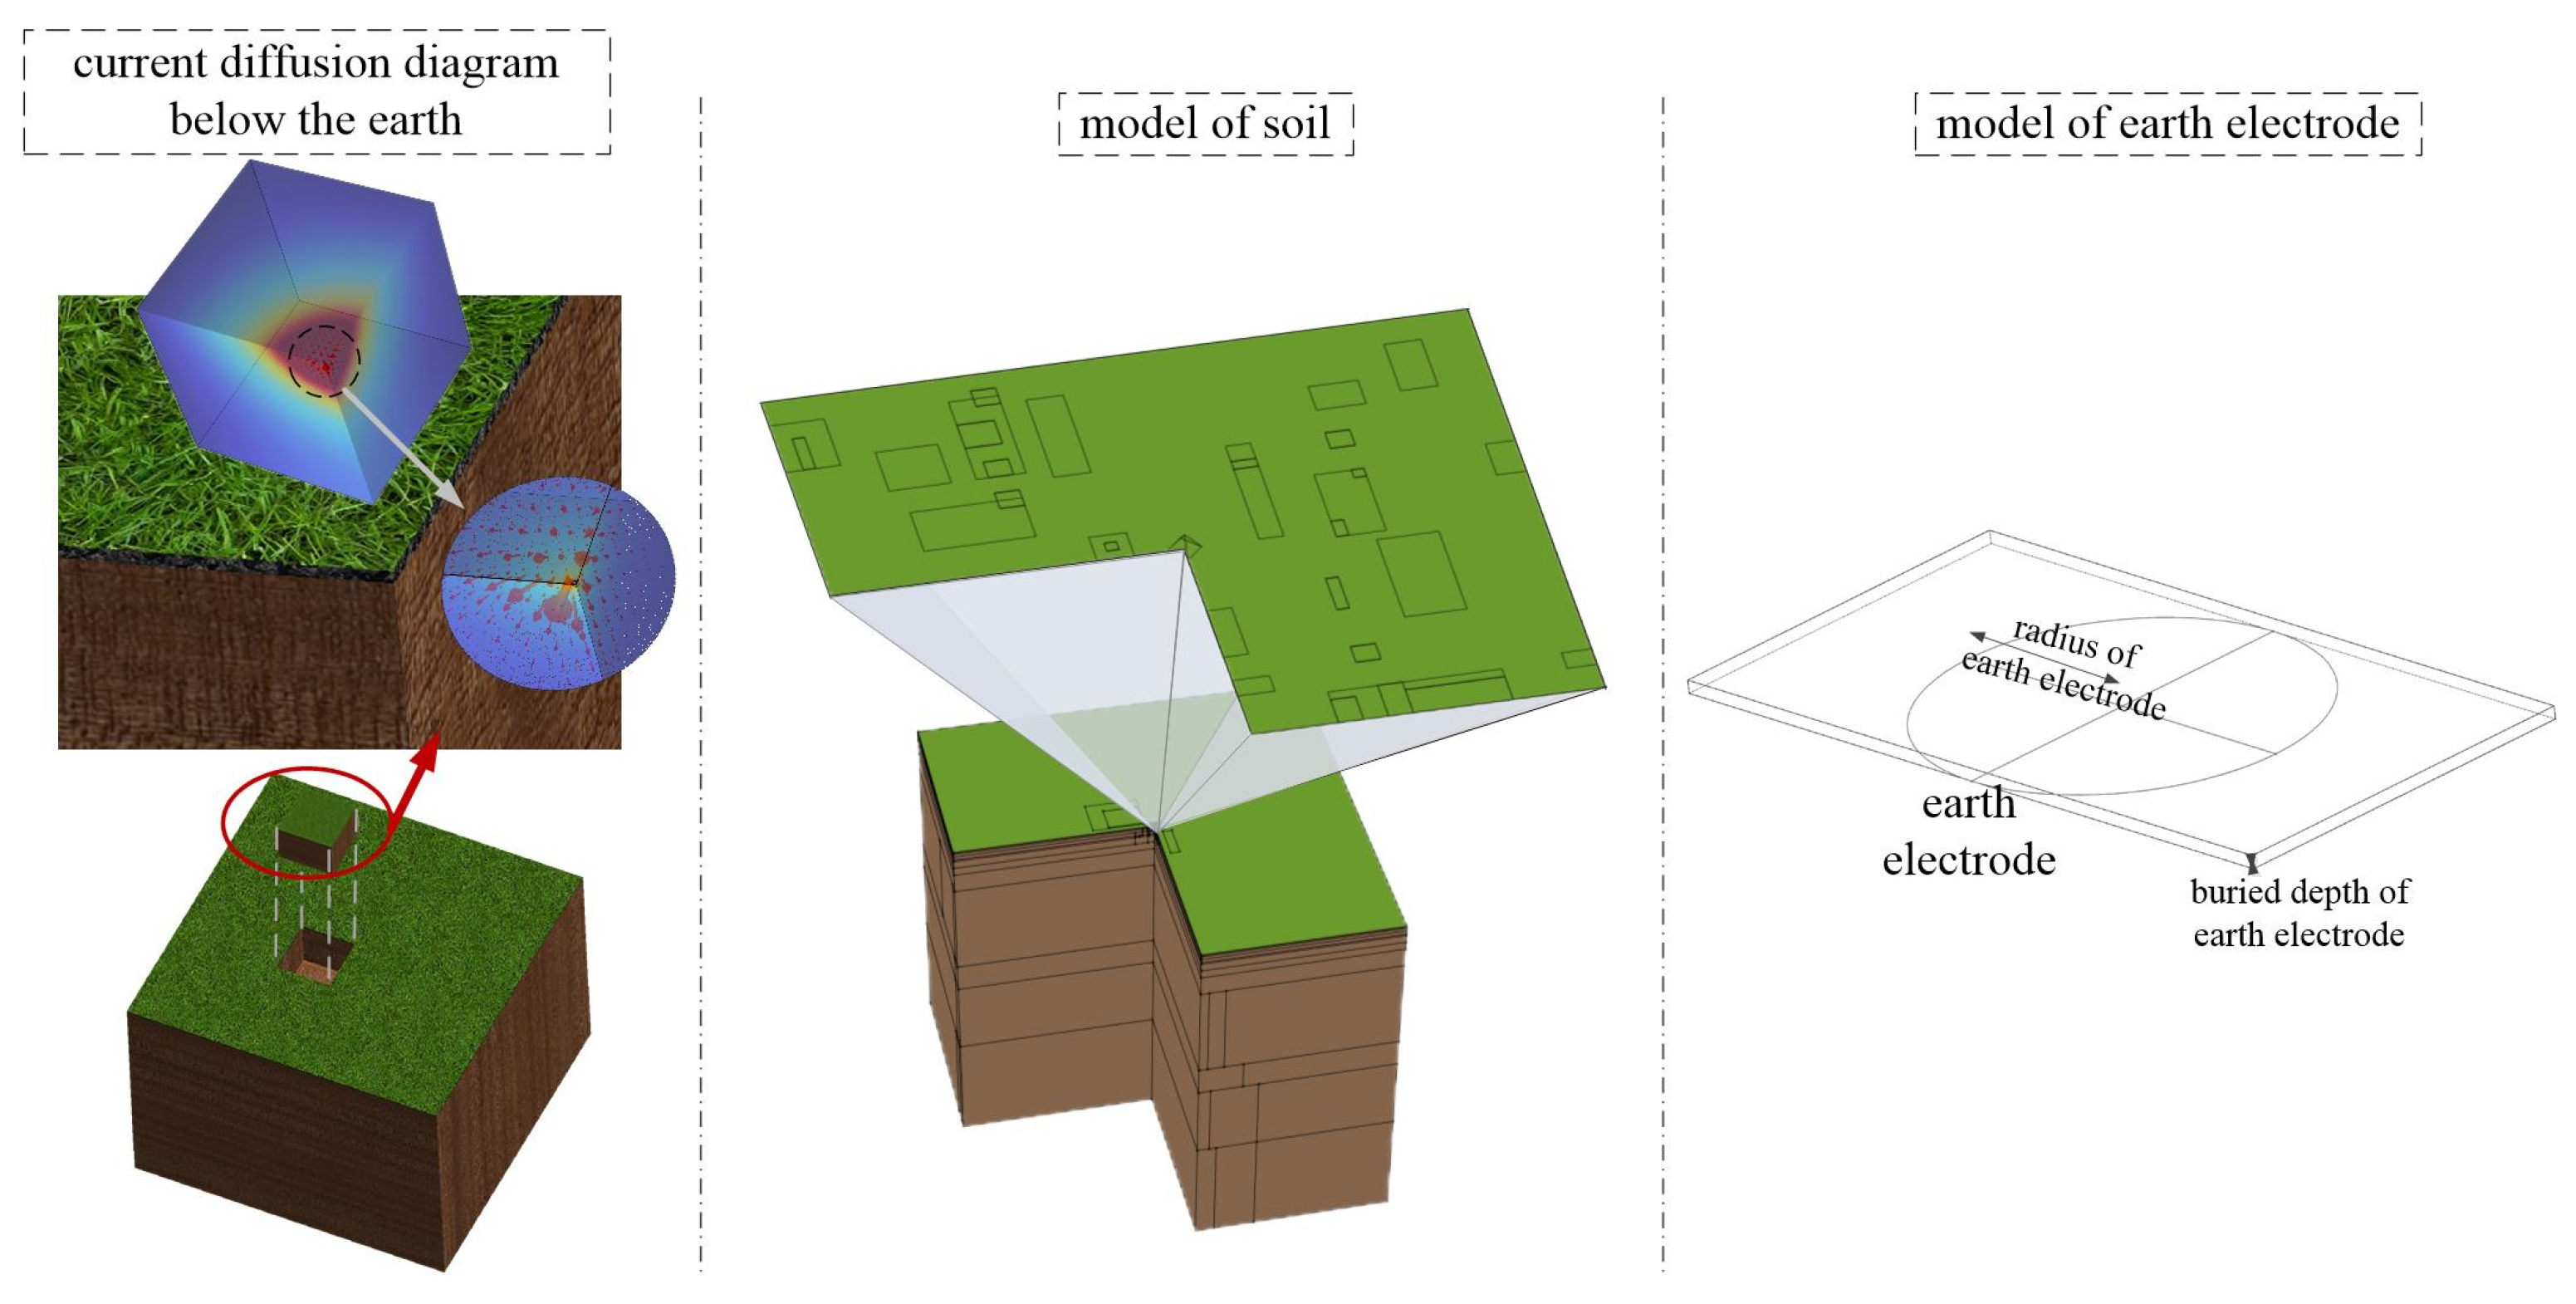
The current diffusion law around the earth electrode is divergent, as shown in Figure 1. Vertical downward current diffusion and horizontal outward current diffusion.
(2)
The current diffusion is more inclined towards the low resistance region.
Figure 1. The current diffusion trend diagram and model structure diagram.
Energies 17 00420 g001

2.2. Rationality Verification

In actual site selection, the measuring points of the soil (resistivity measurement for soil modeling) will not be infinitely dense. Under the condition of limited measuring points, paying attention to important areas can save manpower and material costs while ensuring safety. A. Li et al. [23] modeled the horizontal stratification of the earth. The solution obtained by the finite element tool was compared with the analytical solution. The agreement of the results preliminarily proves the rationality of the finite element method for soil modeling. Rémi Clémen compared the results of the resistivity model established by a finite element tool (comsol) with small experimental results. The deviation of the results is between 1.9% and 2.5%. The effectiveness of the finite element tool to simulate complex modules is proved. It lays the foundation for the finite element tool in the simulation of earth [24]. Amewode, E.K.’s doctoral thesis used finite element tools to establish a soil model in Ghana. Their simulation results are in good agreement with their experimental results. It is verified that the finite element tool can accurately represent complex 3D terrestrial media and structures [25]. In summary, the finite element model can fully fit the data of a large number of measuring points to establish a soil model. The soil model is established by using a tool that can calculate the finite element model to calculate the relevant important parameters on the soil.
To verify that the model provided in this paper is scientific and reasonable, this paper uses CDEGS, a widely used and pervasive tool software in engineering, to calculate the surface potential and compare it with the results of the finite element method based on Comsol 6.1 to solve the soil model provided in this paper. In this paper, a five-layer horizontal layered soil model is established in CDEGS 15.4, as shown in Table 1, to calculate the corresponding surface potential distribution. A point current source injected with 5000 A is located 3.5 m below the ground surface. The soil parameters in the finite element model are the same as those in the CDEGS, and the surface area is 206,210.4 m × 206,210.4 m. In summary, thousands of amperes of current flow through the DC electrode into the earth, creating potential in the soil and surface. The potential decreases to zero at an infinite distance, resulting in a steady DC flow field in the soil. The resistivity value used in the contrast model is the value of the actual measurement data of complex landforms after simple processing. The corresponding measurement area has a complex geology and a large range. A measurement method combining Wenner four-pole method and magnetotelluric detection method is adopted. The layout of the measuring points is shown in Figure 2a. The calculation results of CDEGS and the finite element model are shown in Figure 2b.
As shown in Figure 2a, the potential of each point obtained by the finite element method model is generally higher than that calculated by CDEGS, because the actual geometric data of the grounding electrode are taken into account with the finite element model, as shown in Figure 1. The CDEGS treats the earth electrode as a point current source. This assumption of equivalence to the central point will make the current decrease faster when it diverges outward from the central region, so the potential decays more. Therefore, in the case of almost the same calculation time, the calculation of the finite element tool is more accurate. Considering its accuracy, the computational cost of the finite element tool is lower. In this paper, the finite element method is used to simulate the soil model, which has high rationality. Moreover, CDEGS can only calculate a horizontally layered soil model. If the landform is complex, such as the caves and underground rivers in karst topography, it is more difficult to accurately calculate. Therefore, the finite element method used in this paper to simulate karst topography has its advantages in site selection.
The actual measured values used in the comparison model of Figure 2 are processed. The processing method is based on the modeling method of the horizontal and vertical stratification of complex earth proposed by Qi Xiong et al. [11]. A three-dimensional electrical model of the vertical two-layer and horizontal multi-region in Figure 3a is established. In this paper, the study of complex karst caves is added on the basis of complicating the earth model. Therefore, it is reasonable to simplify the vertical direction of the complex earth model. A simple sinkhole is taken as an example to prove the rationality of the model in this paper. The earth electrode model, soil resistivity model and karst cave model are established in the finite element tool. The earth electrode model is the line current source of the finite element tool. The boundary condition of the whole model is set: the potential of the remaining surface, except the top surface, is 0. In order to calculate the accuracy, the denser the mesh is, the better. The overall size of the model and the limiting factors such as computer memory and running speed were considered. The density of the grid is divided according to the importance of the region. The units close to the earth electrode and the units close to the karst cave are the focus of this paper. Therefore, the fineness of the mesh is divided according to the principle of moving from small to large. Firstly, the grid of the karst cave is divided. Then, a grid of small soil blocks with an earth electrode radius of less than 2000 m is divided. Then, the division of the remaining mesh occurs. Finally, local grid refinement is performed on the elements around the earth electrode and the karst cave (conventional refinement is selected to be more accurate). The specific selection of the cave grid is performed. If there is a regular surface in the cave, the triangular mesh is preferentially constrained. Then, the tetrahedral mesh is selected for the whole karst cave. If there is no regular surface, the tetrahedral mesh is directly used to calculate the karst cave.
The influence of special landforms in karst topography on site selection is the focus of this paper. Therefore, the existence of special landforms can be reflected in the distribution of the surface step voltage. It is an important verification of whether the model is reasonable. The existence of a sinkhole has an effect on the surface step voltage distribution. This effect on the distribution of results can be calculated by the finite element model of Figure 3a. It can be seen from the three-dimensional diagram in Figure 3b that the closer to the direction of the sinkhole (the northeast direction of this simulation), the greater the surface step voltage is affected. Therefore, it can be proved that the calculation results of the model established in Figure 3a conform to conventional theoretical law. The model can be applied to the detailed study of karst caves and underground rivers.

2.3. Cave Model Support

The surrounding rock is simplified into two layers of surface karstification and stratigraphical bedding [22,26]. Considering the actual karst landscape, the surface rock and soil are mainly distributed in large and medium-sized karst caves. Therefore, most of the cave-type karst caves discussed in this paper are allocated in the second layer of the surrounding rock, and their volume is mostly not considered. The filling, volume, shape, and location of the caves are varied [27,28,29]. Based on the premise of being close to actual karst topography [30,31], the four influencing factors of cave-type karst caves are listed as follows:
The shape block takes the following four categories: a spherical model and its variant, cylinder and its variant, truncated cone and its variant, and an irregular shape. Its position is the second layer of surrounding rock. Other parameters are shown in Table 2.

2.4. Underground River Model Support

The spatial distribution of underground rivers is complex and diverse, and their location and shape are the simulation difficulties of underground rivers [32,33,34]. The simulation of an underground river can also be equivalent to the specific analysis of the irregular shape of a cave. The shape, location, filling, and volume of an underground river [15,35] are summarized in Table 3. The underground river has three parts: recharge, runoff, and excretion. Both recharge and excretion need to be connected to the surface. This paper only discusses the underground part, so it focuses on the runoff part of the underground river to simulate the influence of the underground river on the surface step voltage.
Underground river caves are divided into five categories: dark river, swallet stream, through-hole type, undercurrent, and seepage inflow type. Among them, the through-hole type of underground river is lifted off the groundwater level due to the ground uplift, and the seepage inflow type of underground river is sandwiched between the surface rivers on both sides of the canyon, and its position is often higher than the surface. This paper does not discuss above the surface, so only dark rivers, swallet streams, and the undercurrent type are discussed. These three types of underground rivers can be simulated as karst caves with different fillings, shapes, and locations. Based on the particularity of various underground rivers, various standard models are defined [36], and the data are shown in Table 4.
In summary, for the three types of underground rivers the influence of location and shape on the surface step voltage is analyzed. The influence of the resistivity, volume, and horizontal and vertical position of the fillings follows the analysis results of cave-type karst caves. The shape and position of the real situation will not be as neat as the standard in Table 4. In the specific analysis of various underground rivers, the rotation position, hydraulic gradient, overall shape, and cross-section shape of the underground river are simulated within a reasonable range of its position and shape. These four influencing factors will help analyze the step voltage distribution of the surface around the grounding electrode, which can provide a reference for site selection in karst topography areas.

3. Results and Discussion of Caves

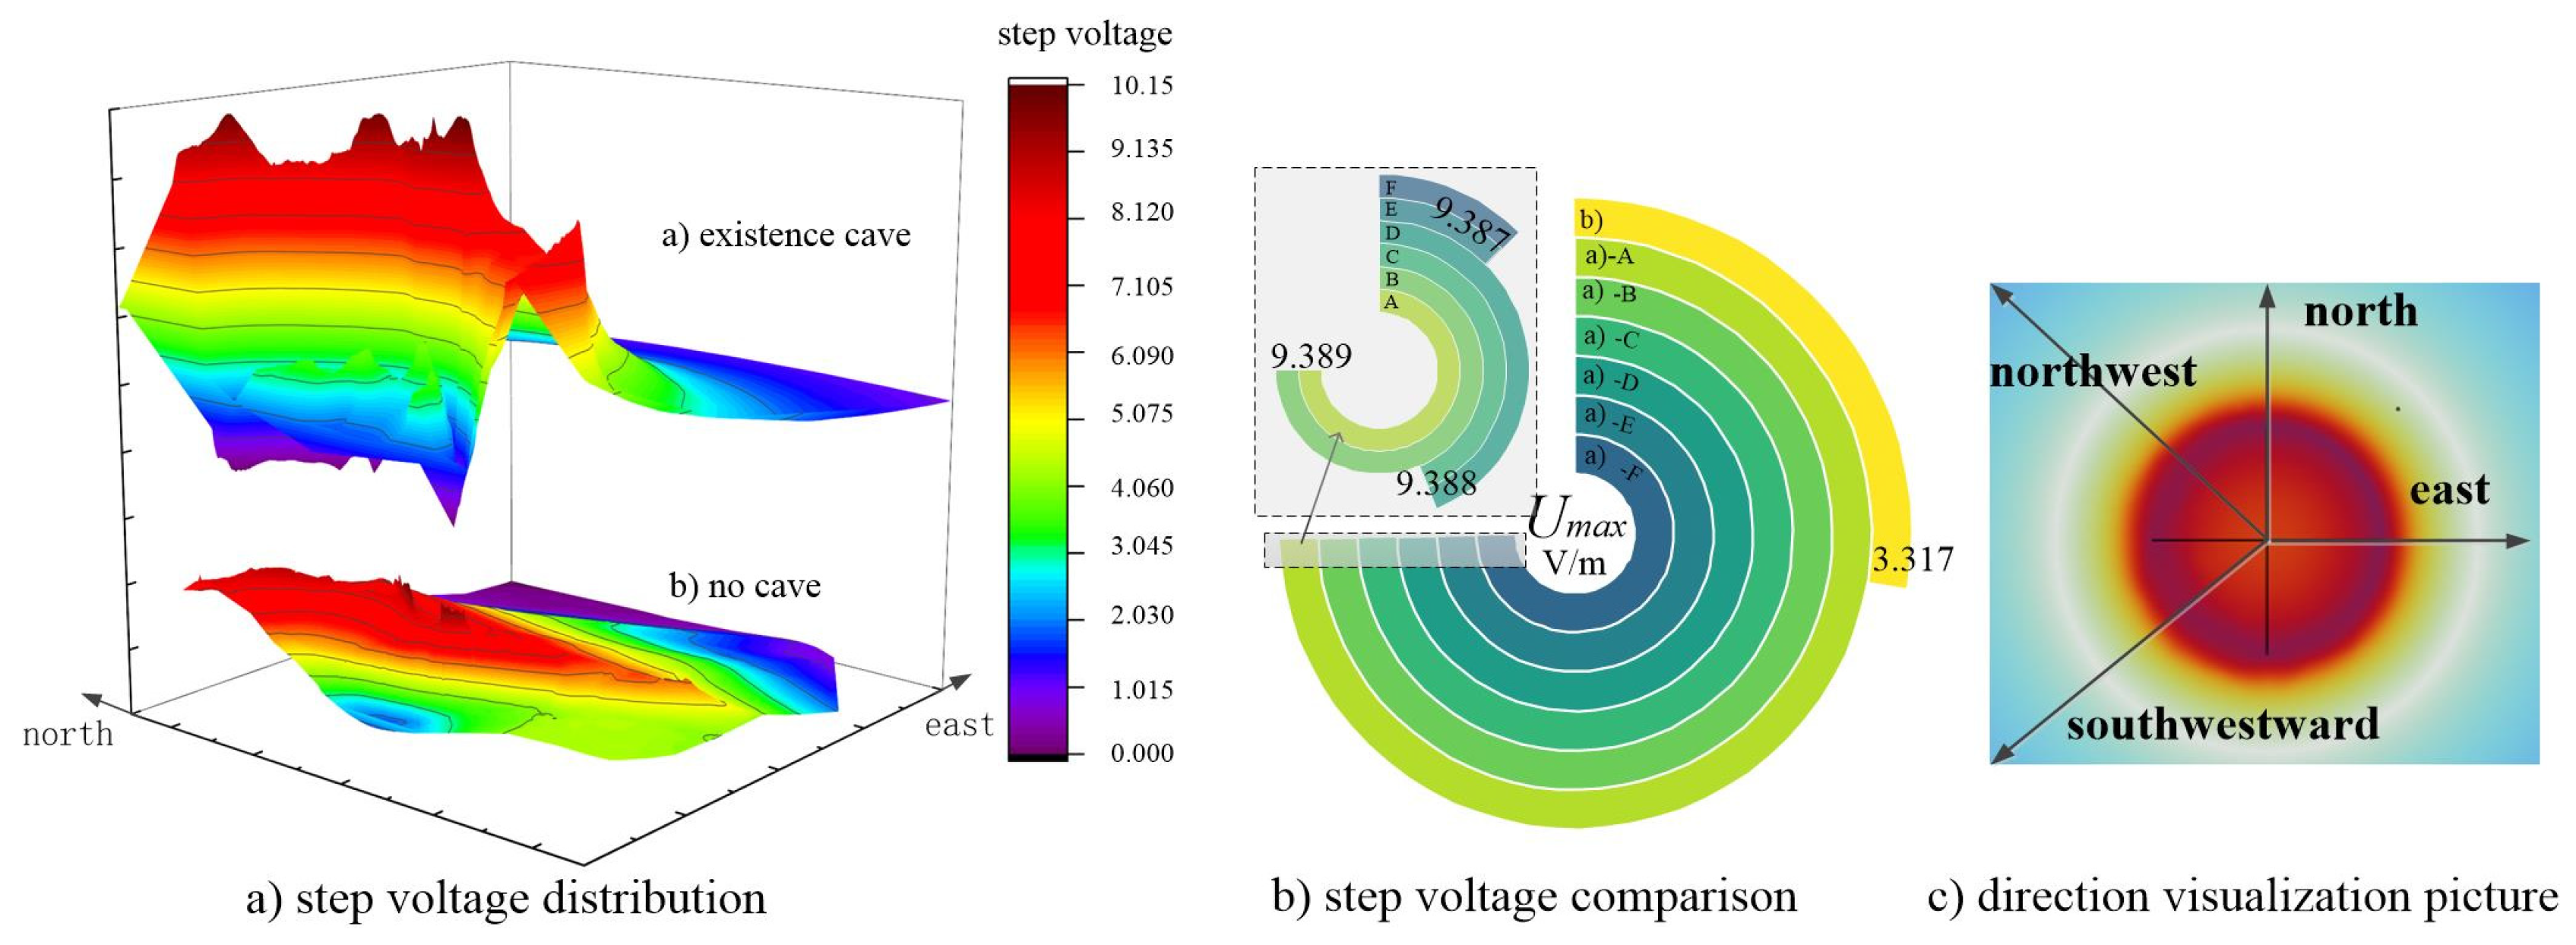
3.1. The Influence of Fillings on Surface Step Voltage

A model of a large karst cave was established: the volume was 1000 m3, the shape was a cylinder, the radius was 5 m, and the height was 12.73 m. Its location was in the east direction, 500 m away from the center of the earth electrode, and the highest point of the upper surface of the karst cave was 10 m away from the surface, which is in the second layer of the surrounding rock. The cave filling may be A: impermeable material (10 Ω·m); B: water (50 Ω·m); C: weak permeable material (200 Ω·m); D: permeable material (600 Ω·m); E: semi-filled (6000 Ω·m); F: dry cave (1,000,000 Ω·m).
As shown in Figure 4, there are underground cave-type karst caves, and their surface step voltage generates a distortion. Their maximum surface step voltage increases by about three times. The lower the resistivity of the cave fillings A to E, the greater the maximum step voltage, but the maximum step voltage of different fillings varies within 0.02%. Therefore, a change of fillings in cave-type karst caves will basically not affect the maximum value of the surface step voltage.
The resistivity of the surrounding rock of a karst cave is between E and F, but it can be seen from the results in the diagram that the resistivity difference between the karst cave and the second layer of surrounding rock is not a factor affecting the level of the surface step voltage; however, the resistivity difference is the influencing factor that causes the distortion of the surface step voltage compared to the absence of karst caves. The resistivity difference makes the current more inclined to flow in the direction of low resistivity. The resistivity of a karst cave is lower than that of surrounding rock (such as A–E karst caves). Due to the difference in resistivity, the direction of dispersion is the portion of the underground karst cave in the east, as the current is more inclined to disperse through the karst cave. The resistivity of a karst cave is higher than that of surrounding rock (such as class F karst caves and some of the class E karst caves). Due to their difference in resistivity, the direction of dispersion is still the direction of the underground karst cave towards the east, and the current is more inclined to disperse through the surrounding rock around the karst cave. There are two parts to this combined analysis. For the part below the earth, with the electrode in the vertical direction, the capacity for current diffusion in one direction is higher than that in other directions. This direction is the direction of the existence of caves. The filling of the cave does not affect this result. For the surface part, the capacity for current diffusion in all directions remains unchanged. Therefore, the surface in the direction of a cave concentrates more current. Due to Formula (3), there are underground karst caves that distort the surface step voltage.

3.2. The Influence of Position on Ground Step Voltage

The vertical position of cave-type karst caves is generally distributed under the surface soil strata, and their horizontal position distribution is not limited. When only a single karst cave is considered, the influence of the karst cave’s position on the surface step voltage does not have anisotropy in the rotation direction. The positive east direction, with the center of the earth electrode as the starting point of the azimuth, is simulated as the rotation direction. In the vertical and horizontal directions, the distribution of karst caves near or away from the center of the earth electrode is random. The volume and shape of the simulated karst cave are consistent with 3.1, and the filling condition is a semi-filled karst cave (6000 Ω·m). The position value is random and the calculation amount is large, limited by computational memory and computing time. In this paper, some representative locations are selected as the possible locations of karst caves. The relationship between the location of the underground cave and the maximum step voltage of the surface is shown in Figure 5.
The X axis in the diagram indicates the aspect of the cave’s position in the horizontal direction away from the center of the earth electrode, and the values are 0, 10, 20, 30, 60, 100, 200, 500, and 1000 (m). The Y-axis represents the aspect of the cave’s position in the vertical direction away from the surface, and the values seen are 10, 30, 90, 150, 350, 900, 1200, 1600, and 1850 (m). The Z-axis represents the maximum step voltage. According to Formula (4), the ground step voltage is less than 8.692 V/m, which is within the safe range. The influence of position on the maximum value of the surface step voltage is as follows:
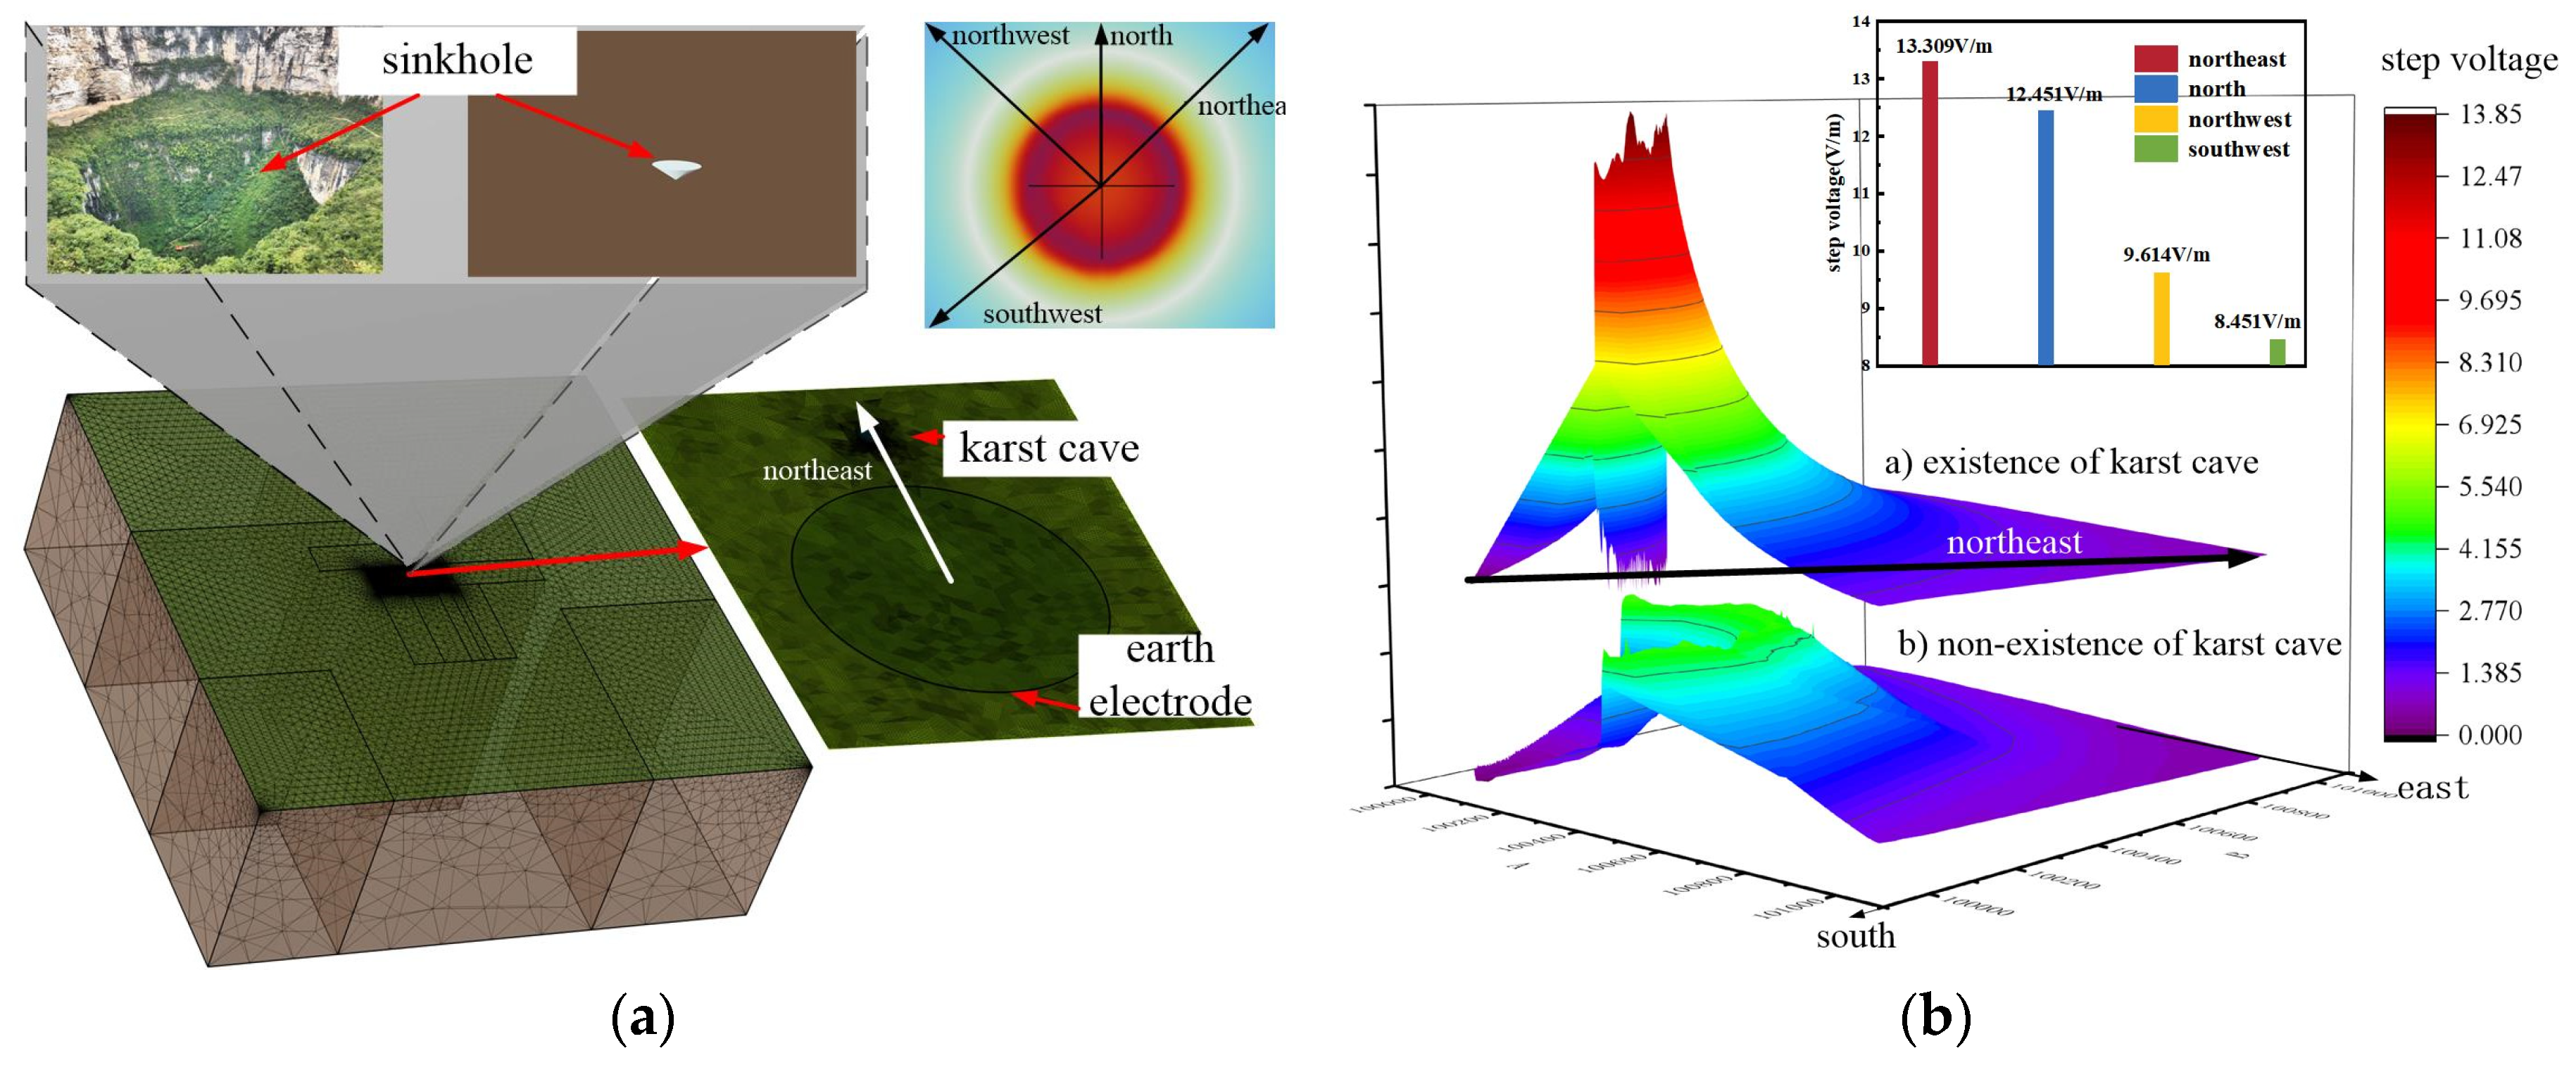
  • The closer the karst cave is to the earth electrode, the higher the maximum step voltage of the surface is. According to the analysis of 3.1, there are underground caverns that distort the surface step voltage, which are also seen in this section. The closer the distance to the earth electrode is, the greater the influence of the resistivity difference on the current dispersion is, and the more concentrated it is in the direction of the cave. According to Formula (3), the more the current accumulates in this direction on the surface, the higher the maximum step voltage.
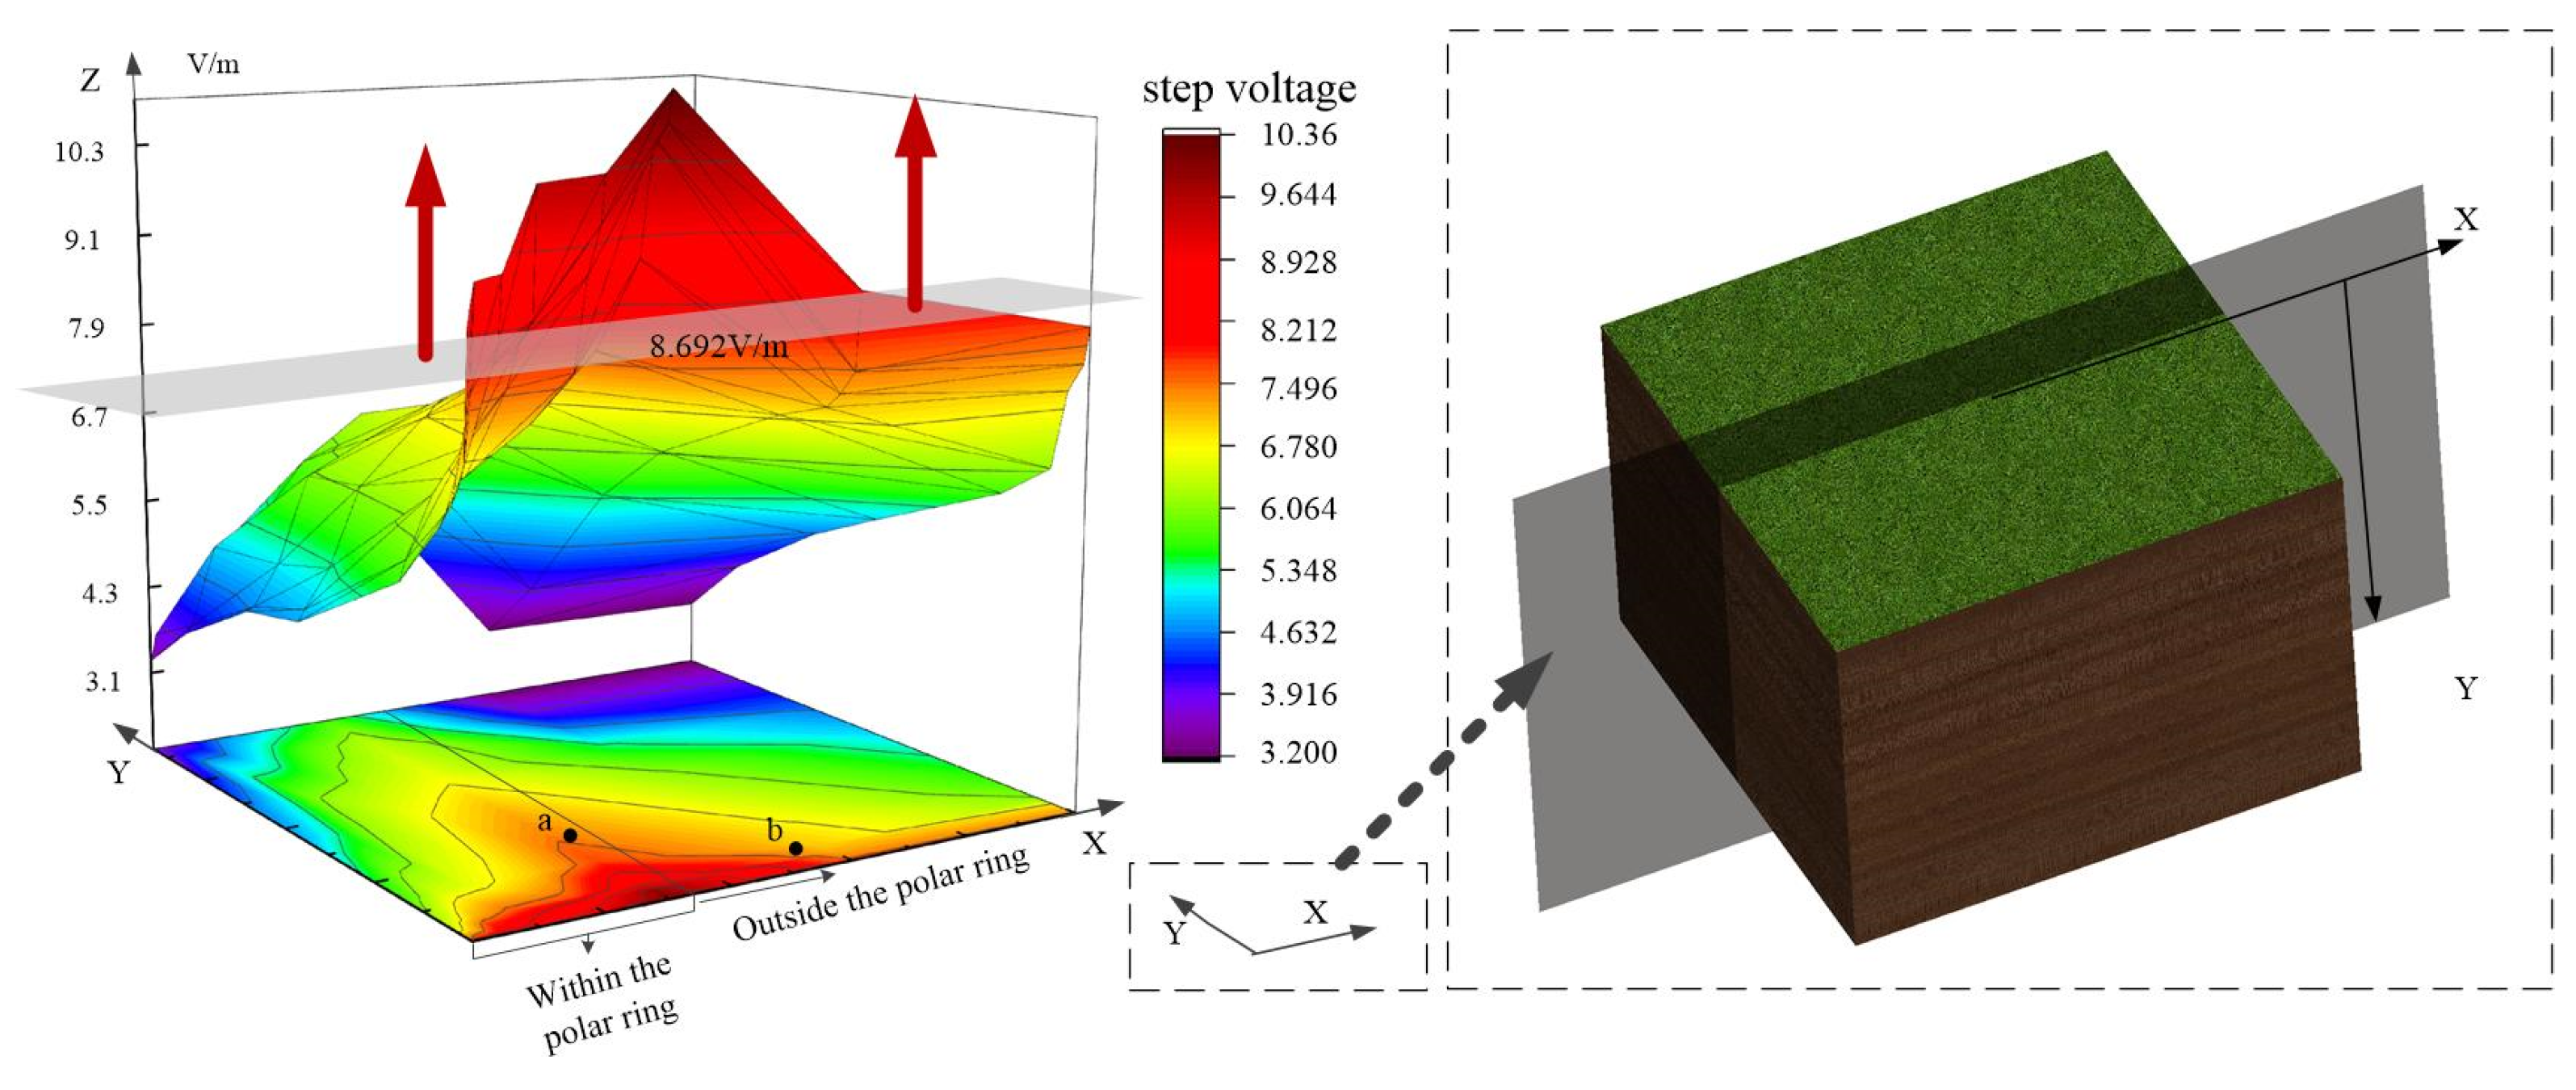
  • The maximum step voltage of a karst cave within the earth electrode is higher than that of a karst cave outside the earth electrode when both are at the same distance from the earth electrode. The karst cave is at the same distance from the polar ring, and the greater the vertical direction is (as shown in Figure 5, the position of a and b; this point accounts for more than b in the vertical direction), the lower the maximum surface step voltage is. The dispersion flow of the polar ring is always vertically downward and horizontally outward. The horizontal projection of a karst cave outside the polar ring has a greater influence on the dispersion flow than that inside the polar ring; at the same distance, the influence of the vertical aspect of the cave is greater than the horizontal aspect.
  • The location range of the karst cave satisfying the safety limit (positive east direction) is shown in the opposite direction of the arrow in Figure 5. The red arrow indicates the direction in which the value of the step voltage exceeds the limit.The safe distance between the location of the cave and the polar ring has the following seven sets of data, such as Table 5, where d is the distance between the cave and the polar ring. In Table 4, the maximum value is taken as the safe distance. When d > 350.1 m, the maximum value of the surface step voltage does not exceed the safe range.

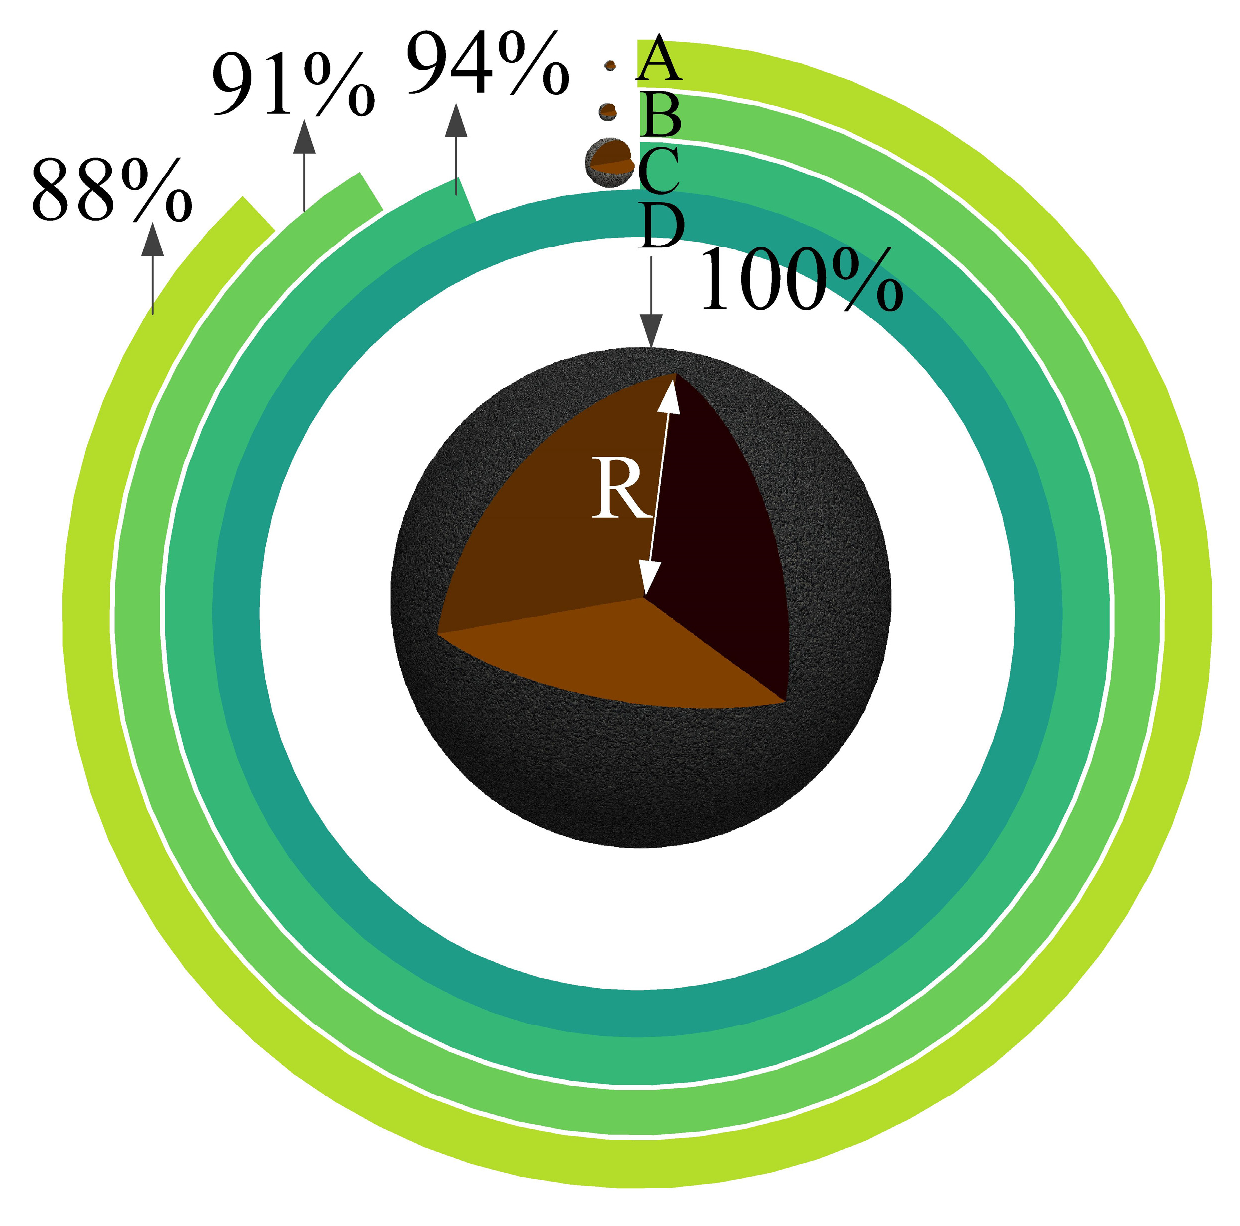
3.3. The Influence of Volume on Surface Step Voltage

The volume parameters will affect some shape parameters, so the influence of the spherical simulation volume on the surface step voltage is taken into account. The position is consistent with the filling and 3.2. The volume is taken as A: small cave, B: medium cave, C: large cave, and D: super-large cave. The specific parameters are shown in Table 6.
The percentage figure in Figure 6 is the result of the normalization of the calculation formula in the figure. The percentage in Figure 6 is the U % in formula (5). The volume of small caves is very large. In terms of their influence on the maximum step voltage on the surface, the small caves are 12% less influential than the very large caves. Therefore, cave volume has a great influence on the surface step voltage, and the maximum step voltage increases with an increase in the volume.
U % = U max ( A / B / C / D ) U max ( D )
When there is a resistivity difference between the karst cave and the surrounding rock, the current dispersion is more inclined towards the direction of the karst cave. At this time, the resistivity of the cave is lower than that of the surrounding rock, and the current tends to flow through the cave. The larger the volume, the more current flows in this direction. When the surface flow capacity does not change, the surface accumulates more current in this direction. According to Formula (3), the maximum surface step voltage increases with the increase in the volume of the underground cave.

3.4. The Influence of Shape on Surface Step Voltage

The actual cave shape is mostly irregular. A single irregular karst cave can be partially decomposed into an aggregation of multiple small blocks. The volume of each small piece of the karst cave is large enough that the small pieces can be equivalent to a regular shape. Some small pieces with extremely irregular shapes can also be targeted for analysis. Therefore, the qualitative determination of each small block can be obtained through the quantitative completion of the simulation, which provides a reference for the qualitative analysis of the influence of the whole cave-type karst cave on the surface step voltage in the actual karst topography, to provide theoretical guidance for the site selection of DC transmission projects within the karst topography area.
The radius of the cave-type karst cave (non-dissolution cave) discussed in this paper is not less than 100 mm, so the dimension of each direction of the shape should not be less than 0.1 m, while the filling and position are consistent with 3.3. If the block simulation takes the volume of each block to be about 1500 m3, then the block itself is large enough. Therefore, there is value in the analysis of the block itself. Shape division is into an analysis of a regular ball and its variants, regular cylinder and its variants, regular truncated cone and its variants, and extremely irregular shapes.

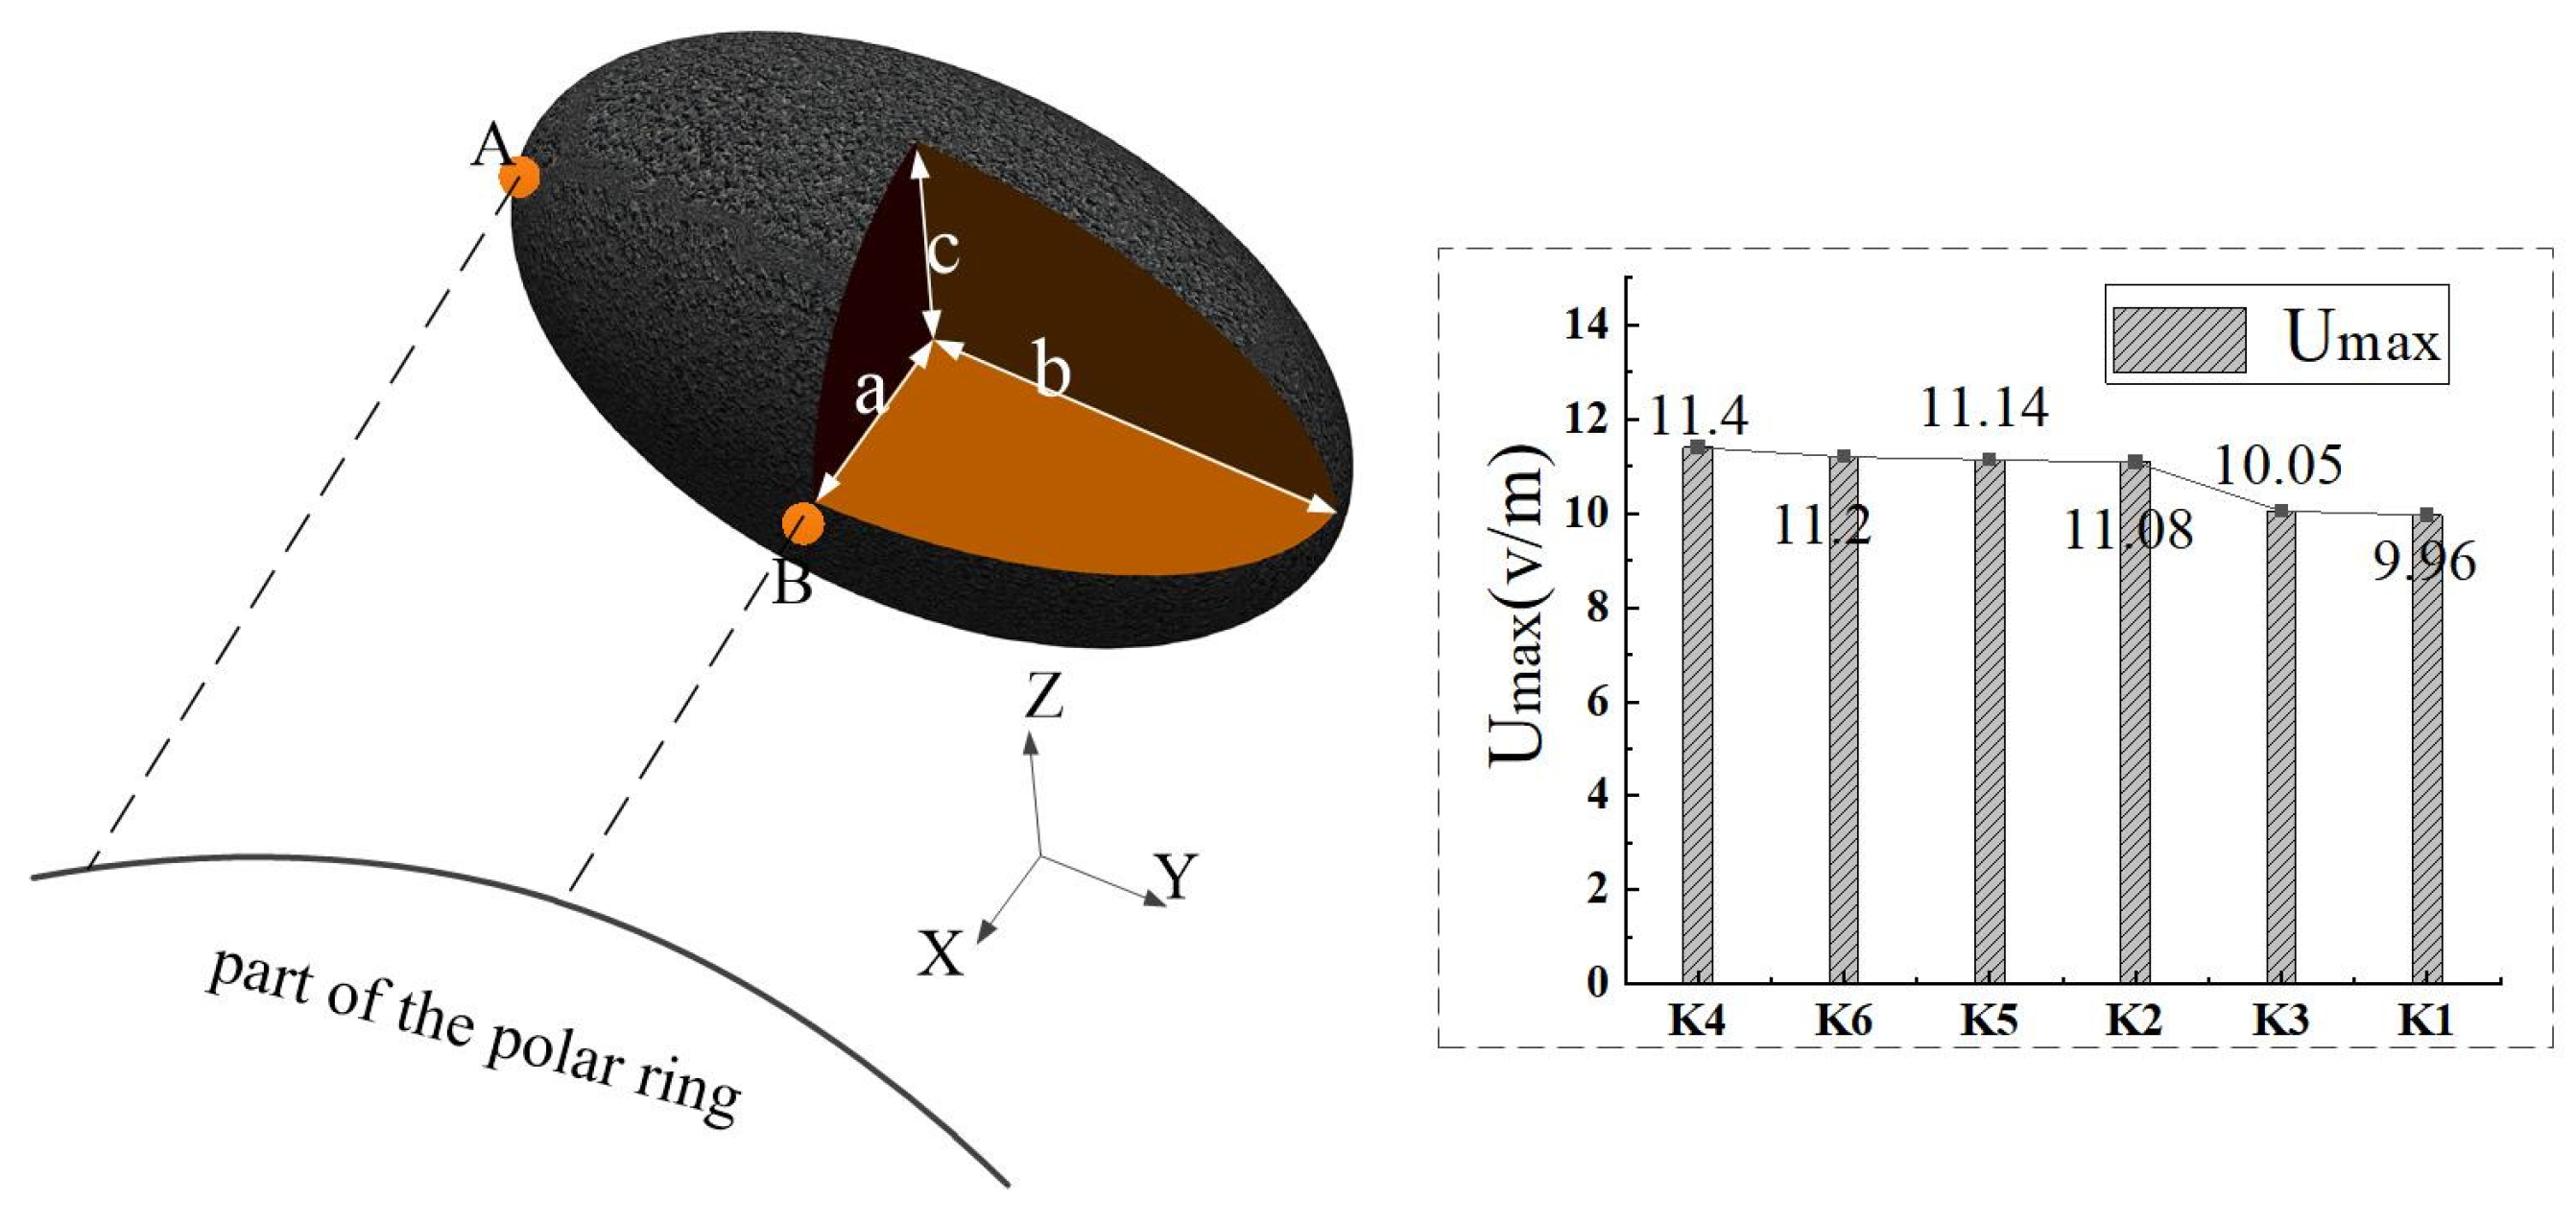
3.4.1. A Regular Sphere and Its Variants

In Figure 7, the a axis is in the X-axis direction (positive east direction). The center position of the karst cave is consistent. The larger the a axis is, the higher the proportion of the path through the cave in the horizontal direction is when the polar ring disperses in the direction of the cave. The c axis is in the Z-axis direction. When the vertex position of the cave remains unchanged, the larger the c axis is, the higher the proportion of the path through the cave in the vertical direction is when the earth electrode’s current diffusion is in the direction of the cave. The b axis is in the Y-axis direction, and the center position of the cave is unchanged. The larger the b axis, the larger the proportion of the cave in the Y axis. In the following, b1 and U2 are used to represent the b axis of ellipsoid 1 and the step voltage of ellipsoid 2. The horizontal plane of the center of gravity of the cave is defined as the horizontal part of the cross-section of the cave, and the X-axis normal plane of the center of gravity of the cave is defined as the vertical part of the cross-section of the cave, while the ratio of the horizontal to vertical cross-sectional area is K . The x is the variant number in K x .
In Table 7, the a axis of ellipsoids No. 2–4 is consistent, and the b axis is different from the c axis, and a2 = a3 = a4, b3 > b2 > b4, c4 > c2 > c3, and the step voltage is U4 > U2 > U3. The above results show that the influence of the proportion of the dispersion path through the cave in the vertical direction on the maximum value of the surface step voltage is greater than that through the cave in the Y axis. This is due to the shape of the earth electrode. At the location of the karst cave, its dimension in the Y-axis direction is increased, and the distance between each point on the axis and the earth electrode is not consistent. As shown in Figure 7, the distance between point A and the polar ring is greater than the distance between point B and the earth electrode. It is assumed that only the proportion of karst caves in the Y axis is increased, and that other dimensions remain unchanged; the length of the dispersion path remains unchanged, increasing the cross-sectional area that can pass through the cave. However, there is a difference in the distance between each point of the cross-section and the earth electrode, and the unit dispersion flows at each point of the cross-section are different. When the location of the karst cave is unchanged, the proportion of the karst cave in the Y axis increases, but the current diffusion per unit area becomes smaller and smaller. Therefore, the proportion of karst caves in the Y axis has a relatively small effect on the maximum surface step voltage. The current is more inclined to flow downward, so the proportion of the flow path through the cave in the vertical direction is greater.
In Table 7, ellipsoid 6 is consistent with ellipsoid 2’s b axis, and b2 = b6, a2 > a6, c2 < c6, and the step voltage is U2 < U6. The above results show that the influence of the length of the dispersion path through the cave on the maximum value of the surface step voltage in the vertical direction is greater than that in the horizontal direction. Because of the law of current diffusion, at the same distance, the current is more inclined to disperse in the vertical downward direction than in the horizontal direction. This is the reason for the above results.
Comparing ellipsoids No. 1 and No. 5 with ellipsoids No. 2–4 in the table, we can obtain a1 > a2 = a3 = a4 > a5, b3 > b5 > b2 > b1 > b4, c4 > c5 > c2 > c1 > c3, K4 > K5 > K2 > K3 > K1, and know that the step voltage is U4 > U5 > U2 > U3 > U1. The above results show that when there are differences in each dimension, the difference in the proportion of karst caves in the Y axis can be ignored, and the maximum surface step voltage decreases consistently with the K value, as shown in the histogram in Figure 7. In summary, the K value of the shape variation of the karst cave is an important factor affecting the maximum surface step voltage.

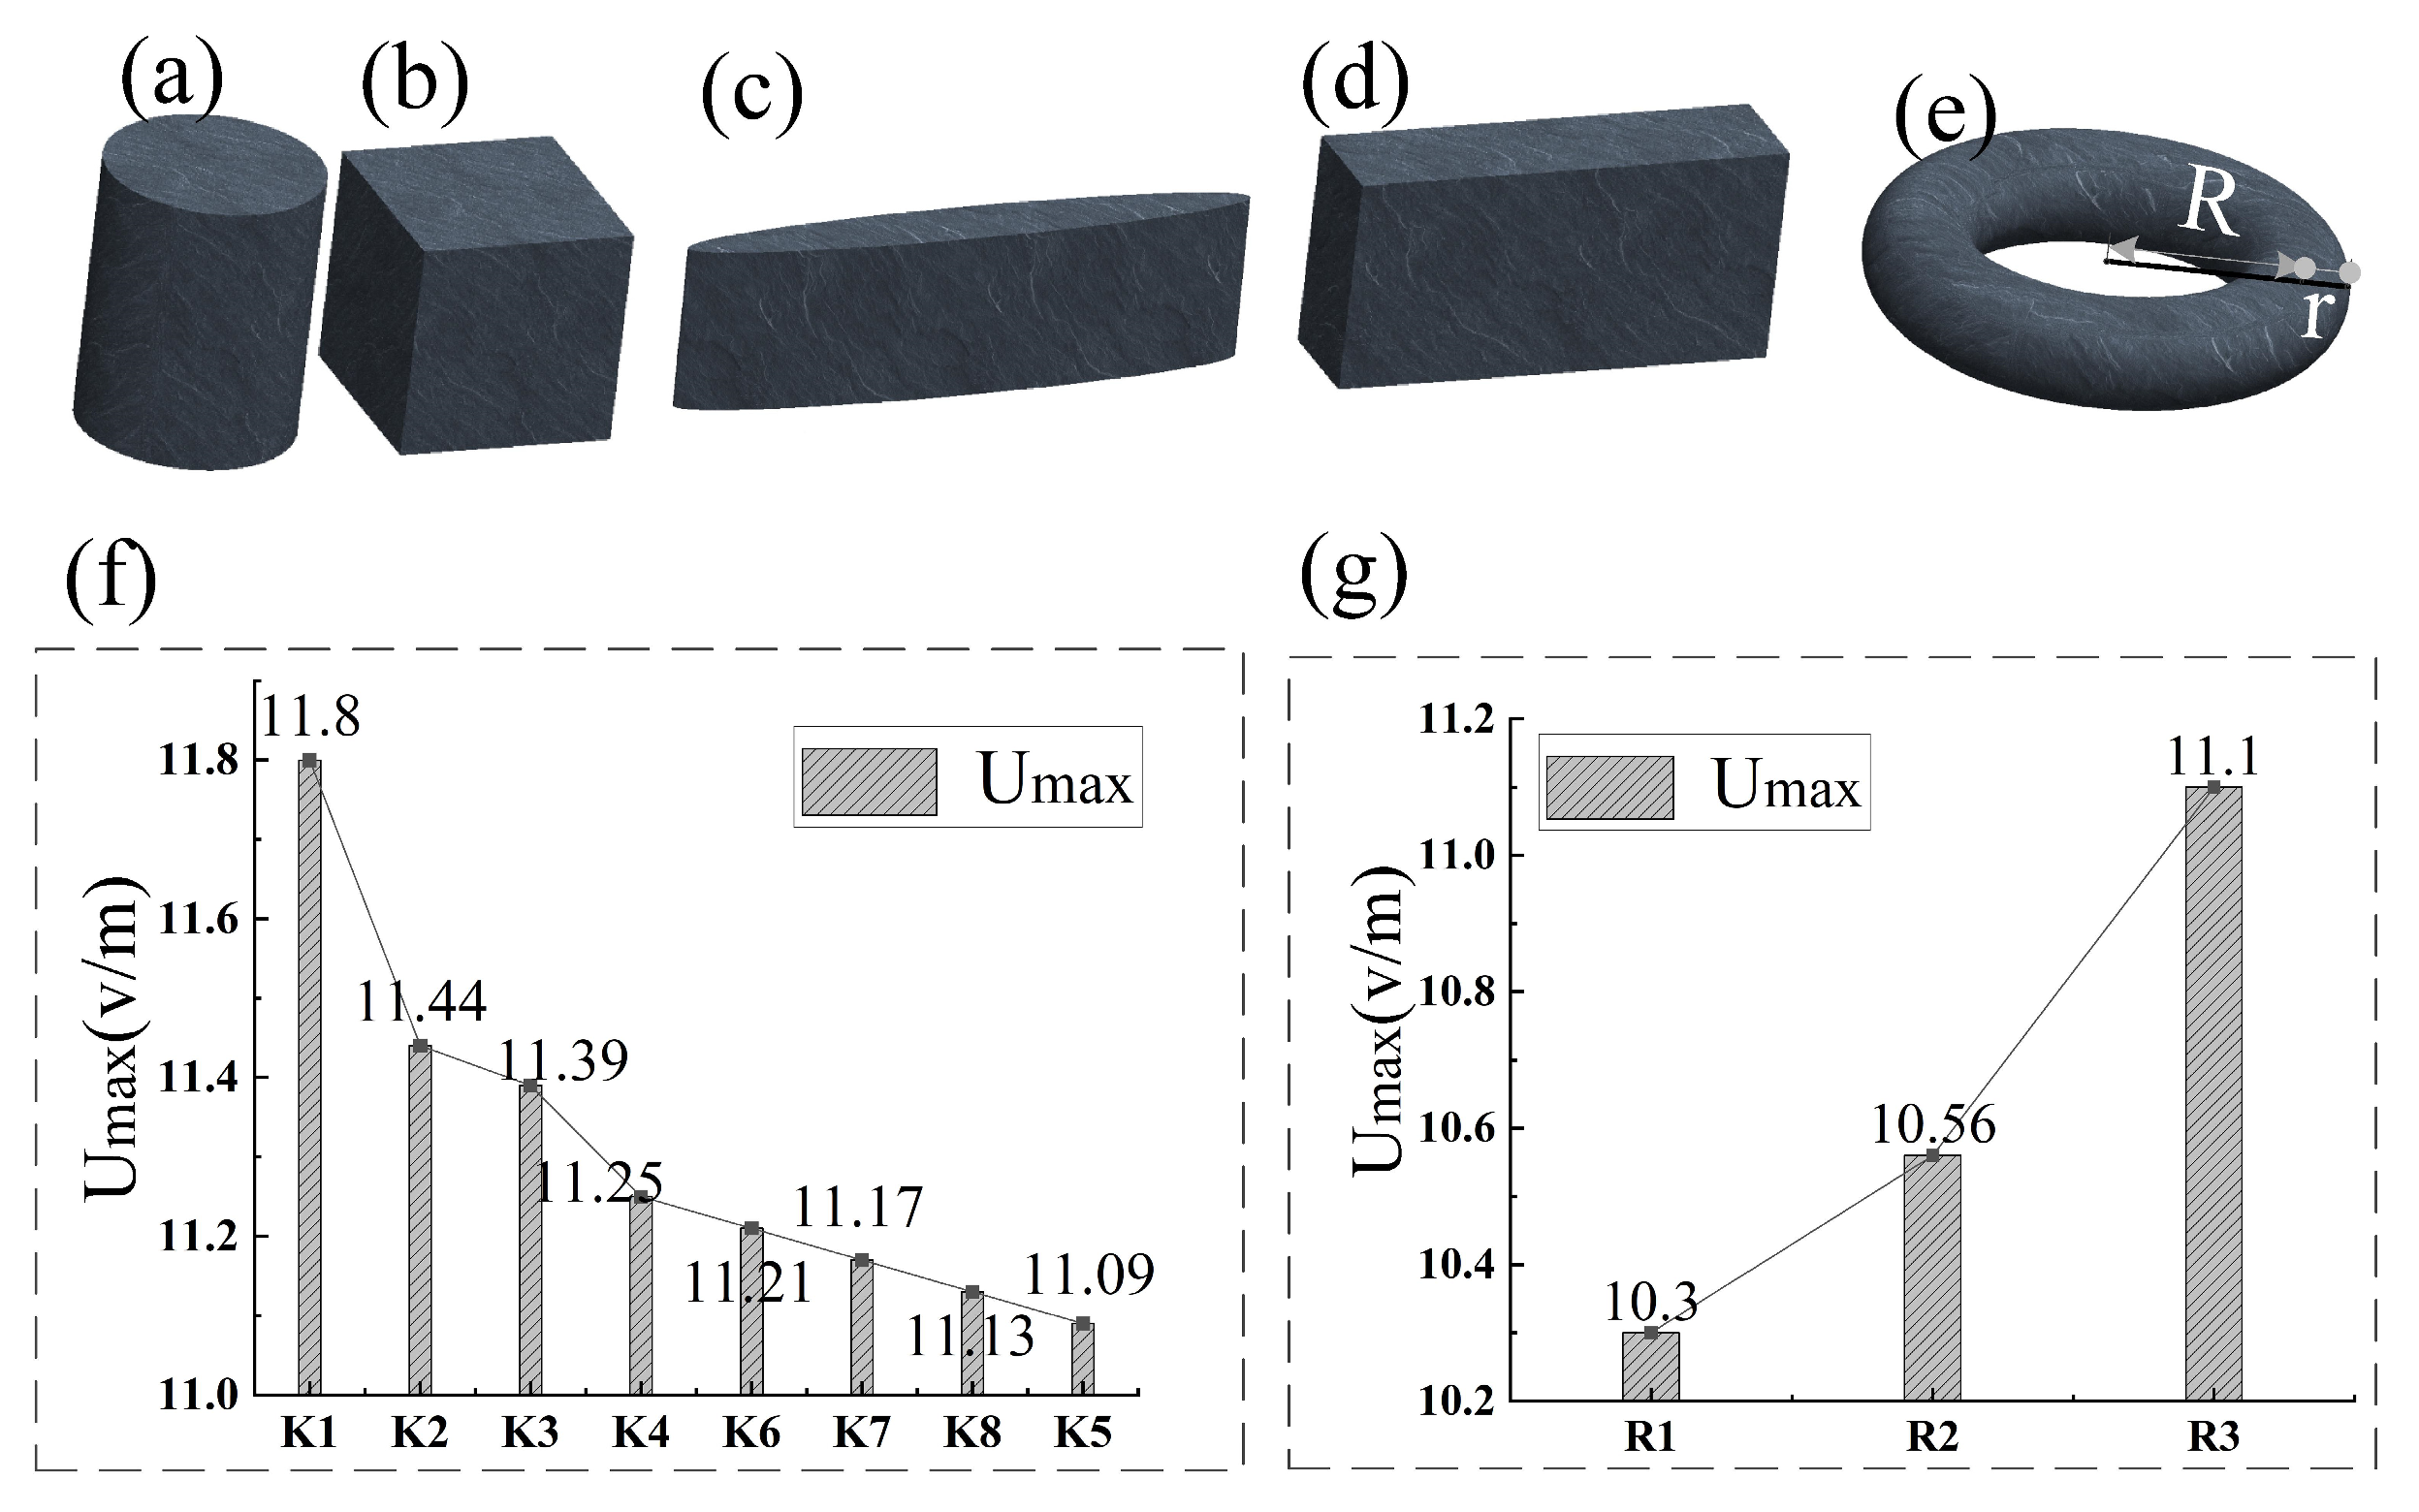
3.4.2. A Regular Cylinder and Its Variants

The definition of K and Kx in Figure 8 and Table 8 is consistent with the definition in Section 3.4.1. The variant numbers 1–5 in Table 5 are dimensional variants, as shown in Figure 8a; the numbers 6–8 are the bottom surface variants, as shown in Figure 8b–d.
The influences of the dimensional variation and the bottom variation of the cylinder on the maximum value of the surface step voltage are related. Consistent with the ellipsoid, the maximum step voltage decreases consistently, as shown in Figure 8f.
The upper bottom surface of the cylinder is overlapped with the lower bottom surface to obtain the variation of the three-dimensional ring, as shown in Figure 8e. The parameters of the three-dimensional ring are a large radius R and small radius r. Under the condition that the volume, filling, and position are unchanged, the influence of the radius on the maximum value of the surface step voltage is as follows.
The difference in the proportion of karst caves in the Y axis can be ignored. Combined with the Section 3.4.1 analysis, it can be seen that there is a gap between the distance between each point of the three-dimensional ring and the polar ring. Affected by the distance, the influence of the proportion of the vertical direction of the dispersion path through the cave on the dispersion is relatively reduced. The proportion of the flow path through the cave in the horizontal direction can directly affect the distance between the cave and the polar ring, so the parameters of the horizontal dimension are the parameters that have a greater impact on the surface step voltage. As shown in Table 9 and Figure 8g, the maximum surface step voltage increases with the increase in Rx.

3.4.3. A Regular Truncated Cone and Its Variants

The ordinary form of a cone-shaped cave comes from a variation of the bottom ellipse, and its degree of influence is consistent with the dimension variation of the sphere, so it is not necessary to discuss it repeatedly here. Different from the spherical variant and the cylindrical variant, there is no representative value for the horizontal cross-sectional area of the frustum. Therefore, the parameter K defined above cannot be used as a discriminant parameter in the frustum. The ratio k is of the radius of the upper and lower bottom of the circular truncated cone. When the ratio is 0, the variable form of the circular cone is that the radius of the bottom surface of the conical cone is 5 m, and the dimension variation is carried out according to the parameters in Table 10. As shown in Figure 9, the maximum value of the surface step voltage increases consistently with k. The maximum value of the surface step voltage, corresponding to a ratio of 0.8, increases by about 2.7% compared to a ratio of 0.3, and increases by about 4.4% compared to a ratio of 0. Regardless of whether the cone is added to the discussion of the cone, the ratio effect is less than 5%. Therefore, the ratio effect of the cone-shaped cave can be ignored.

3.4.4. Extremely Irregular Shapes

As shown in Figure 10, the center of gravity of an extremely irregular shape is difficult to determine. Therefore, the influence of the K value on the surface step voltage has no reference significance. It can be seen from Table 11 that when the volume, position, and filling of an extremely irregular shape are consistent, the horizontal cross-sectional area increases by about 250%, and the corresponding maximum surface step voltage increases by about 16%. The maximum value of the surface step voltage increases consistently with the horizontal cross-sectional area.

3.4.5. Shape Summary

Discussion of the block: The K value of the spherical and cylindrical blocks is an important factor affecting the maximum value of the surface step voltage. The large radius R-value of a block close to the three-dimensional ring type is an important factor affecting the maximum value of the surface step voltage. The ratio k of a block close to the frustum is an important factor affecting the maximum value of the surface step voltage. When the block is extremely irregular, the horizontal cross-sectional area is an important factor affecting the maximum surface step voltage. In summary, try to avoid spherical or cylindrical karst caves with a large K value, avoid three-dimensional circular karst caves with a large R-value, avoid frustum karst caves with a large value for the ratio k, and avoid extremely irregular blocks with a large cross-sectional area.
Discussion of the whole block: If the shape of the underground cave is close to the aggregation of multiple blocks, it can be discussed with reference to the block results. If the influencing parameters are consistent and the shape of the block is inconsistent, the same influence parameter can be used to avoid a karst cave that has a great influence on the surface step voltage. For example, a karst cave can be divided into several hemispheres or spheres and several cylindrical blocks and their variants, and then the K value is used as the decision parameter to avoid the location of a karst cave with a relatively large K value. If the influencing parameters are inconsistent and the block shape is inconsistent, the influencing parameters corresponding to the larger block shape are used as the decision parameters, for example, when the karst cave can be divided into several truncated cones three-dimensional rings, and several extremely irregular shape blocks. If the block volume of the truncated cone is relatively larger, the ratio k is used as the decision parameter to avoid the location of a karst cave with a relatively large ratio k value.

4. Results and Discussion of Underground Rivers

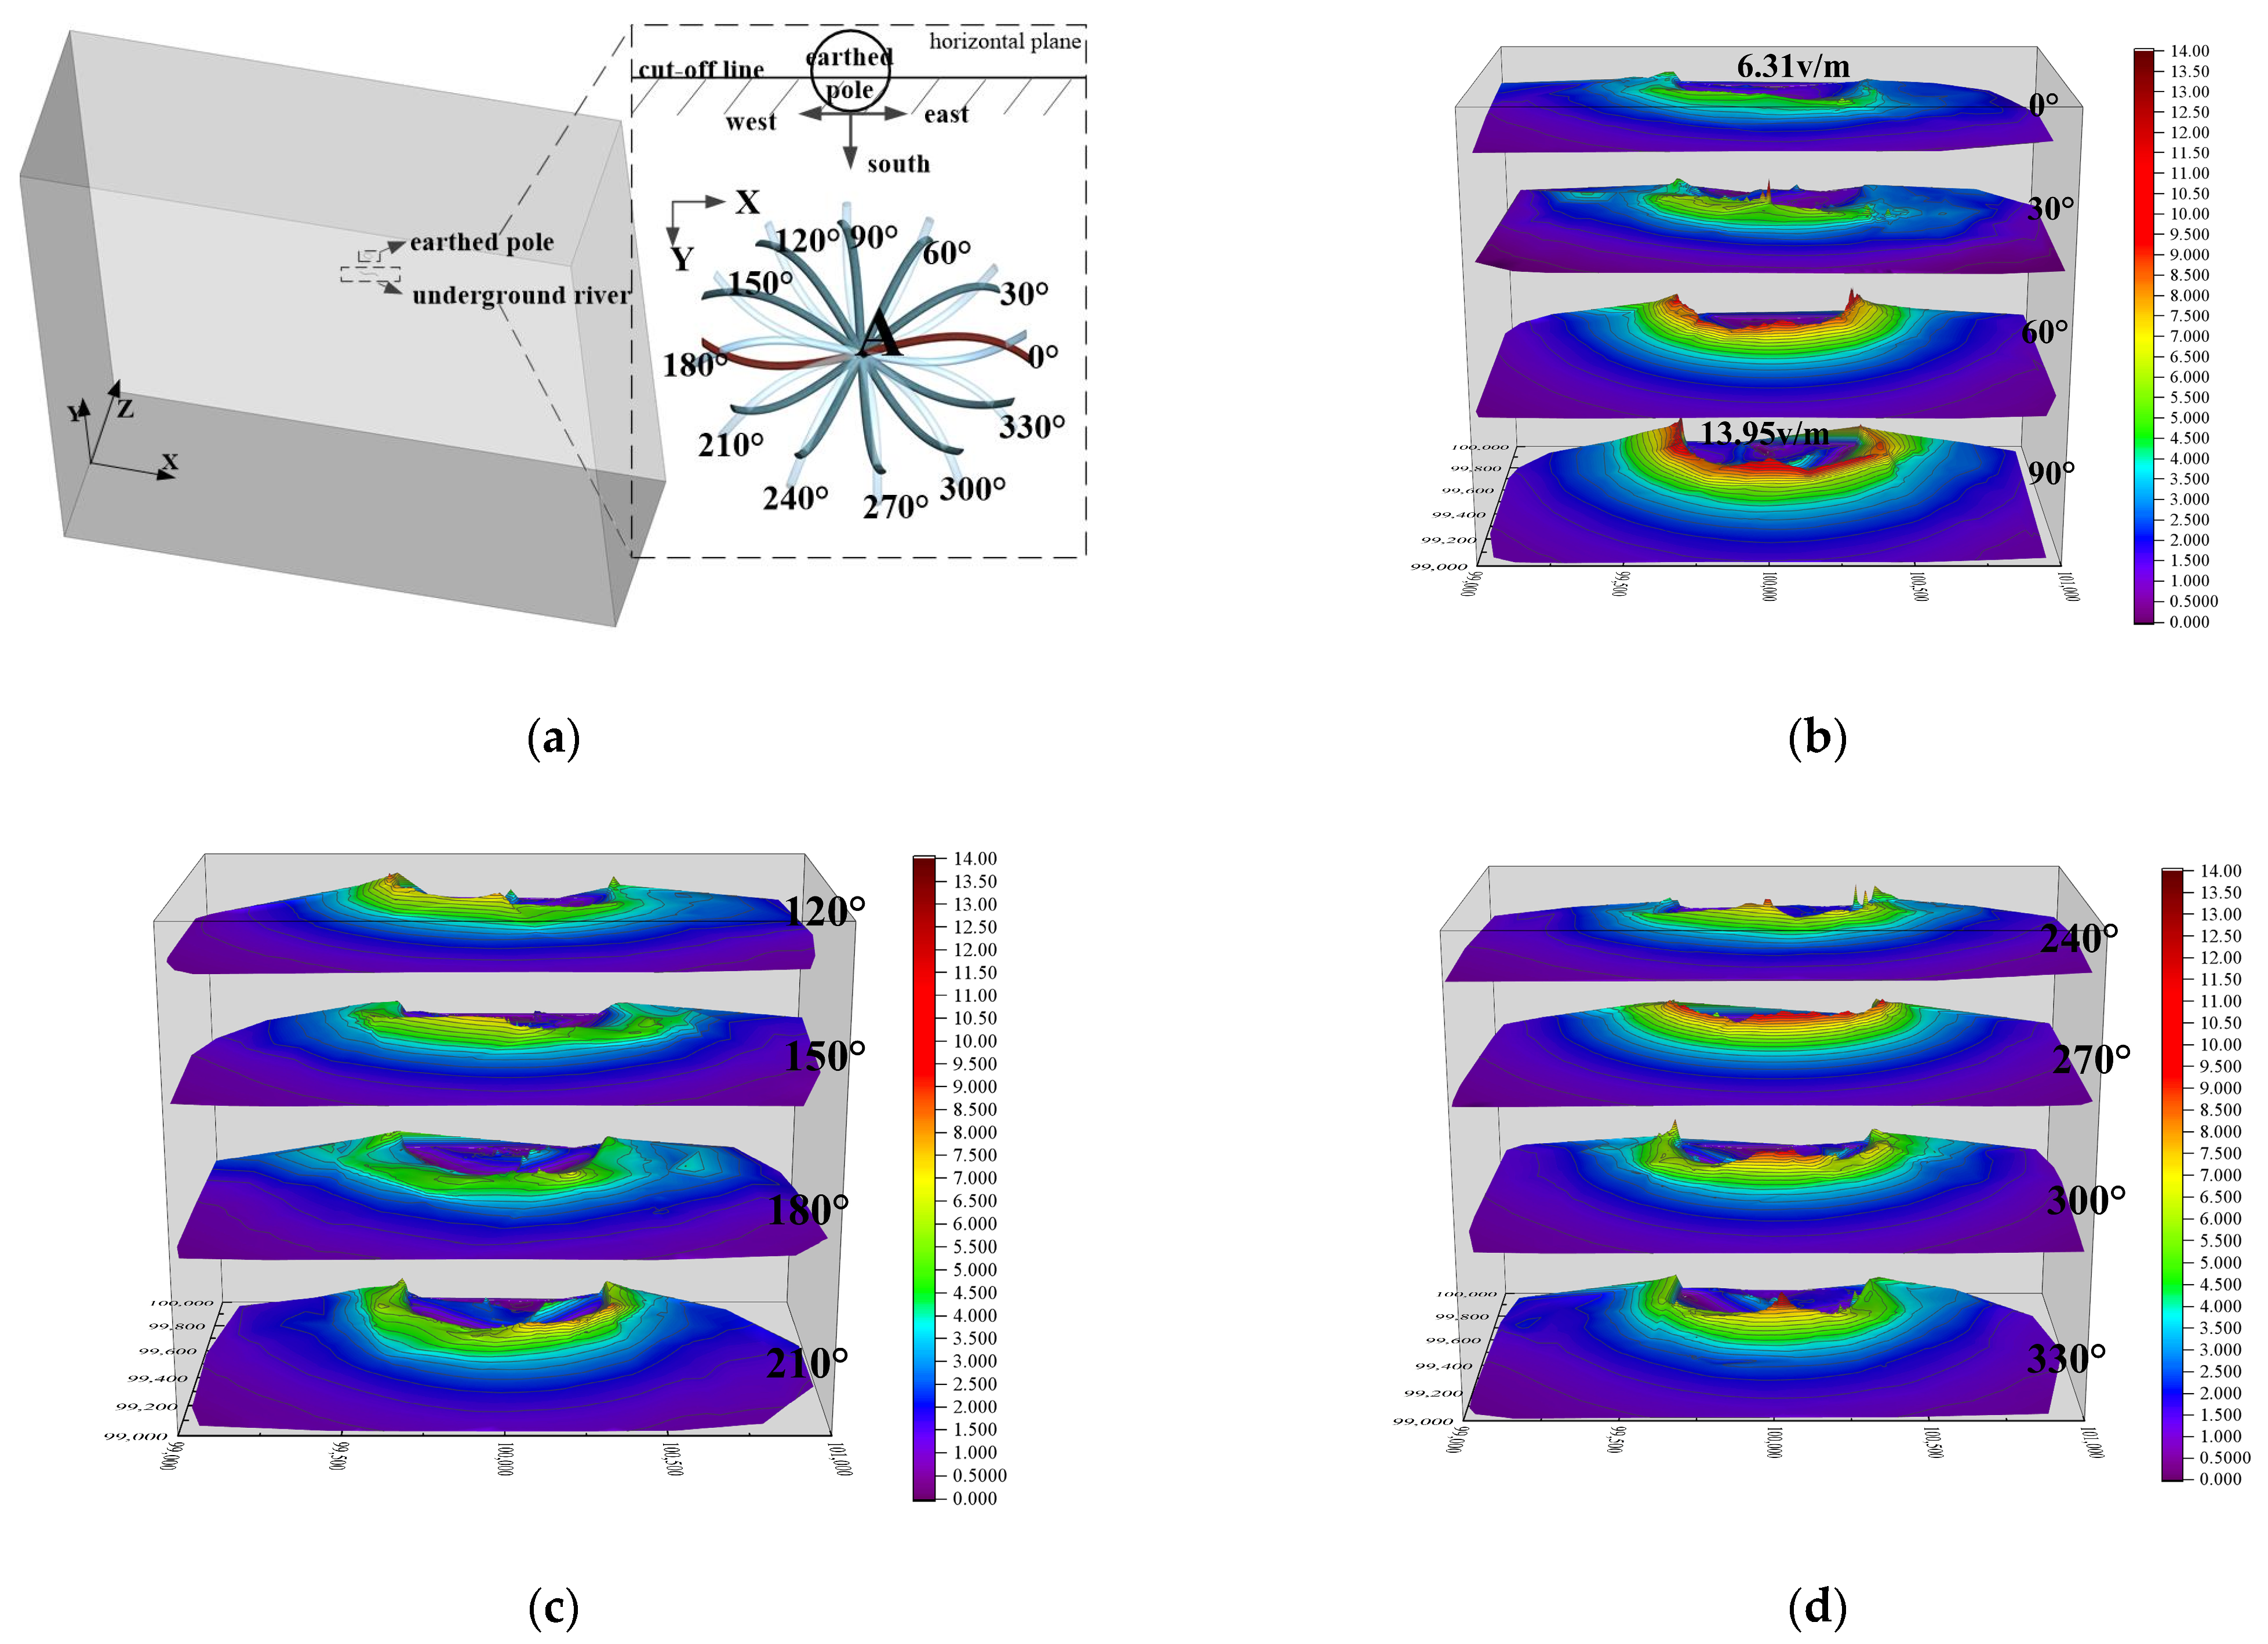
4.1. Rotation Position Analysis

Different from cave-type karst caves, the influence of different angles formed by the flow direction and azimuth line (east–west direction) of an underground river on the surface step voltage cannot be ignored due to their special shape, which is defined as the rotation position. Taking the 0° in Figure 11 as an example, the flow direction is east–west, that is, the rotation position is defined as 0°. The current is mostly a single tunnel, and the tributaries can be ignored when analyzing the rotation position. In addition to the rotation position, the parameters of the current are taken as the standard values in Table 4. The underground river is not symmetrically distributed, so there is no symmetry in the analysis of the rotation position, and the rotation position of the whole circle is taken for analysis. The horizontal and vertical positions are fixed (see Table 4), and the Z axis passing through point A in the diagram is used as the rotation axis about which to rotate horizontally. Taking a representative rotation position can reduce the computational cost and ensure the regularity of the analysis, so we take the rotation position shown in Figure 11a. Figure 11b–d are the distribution of the surface step voltage, and only the surface step voltage distribution near the polar ring in the direction of the underground river is cut out, that is, the part Figure 11a below the cut-off line. The step voltage in the direction of the underground river is more likely to cause distortion and exceed the safety limit, so it is more meaningful to discuss.
When the rotating position is taken as 0–90°, the surface step voltage increases significantly; when 120–180° is taken, the value of the surface step voltage distortion zone decreases as a whole; when 210–270° is taken, the surface step voltage is significantly increased; and when 300–330° is taken, the value of the surface step voltage distortion zone decreases as a whole. Similar to the analysis of the location of cave-type karst caves, the closer the part of the underground river is to the polar ring, the larger the surface step voltage distortion area, and the larger the maximum value of the surface step voltage. Compared with the 0-degree rotation position, the maximum surface step voltage, corresponding to the 90-degree rotation position, increases by about 121%.

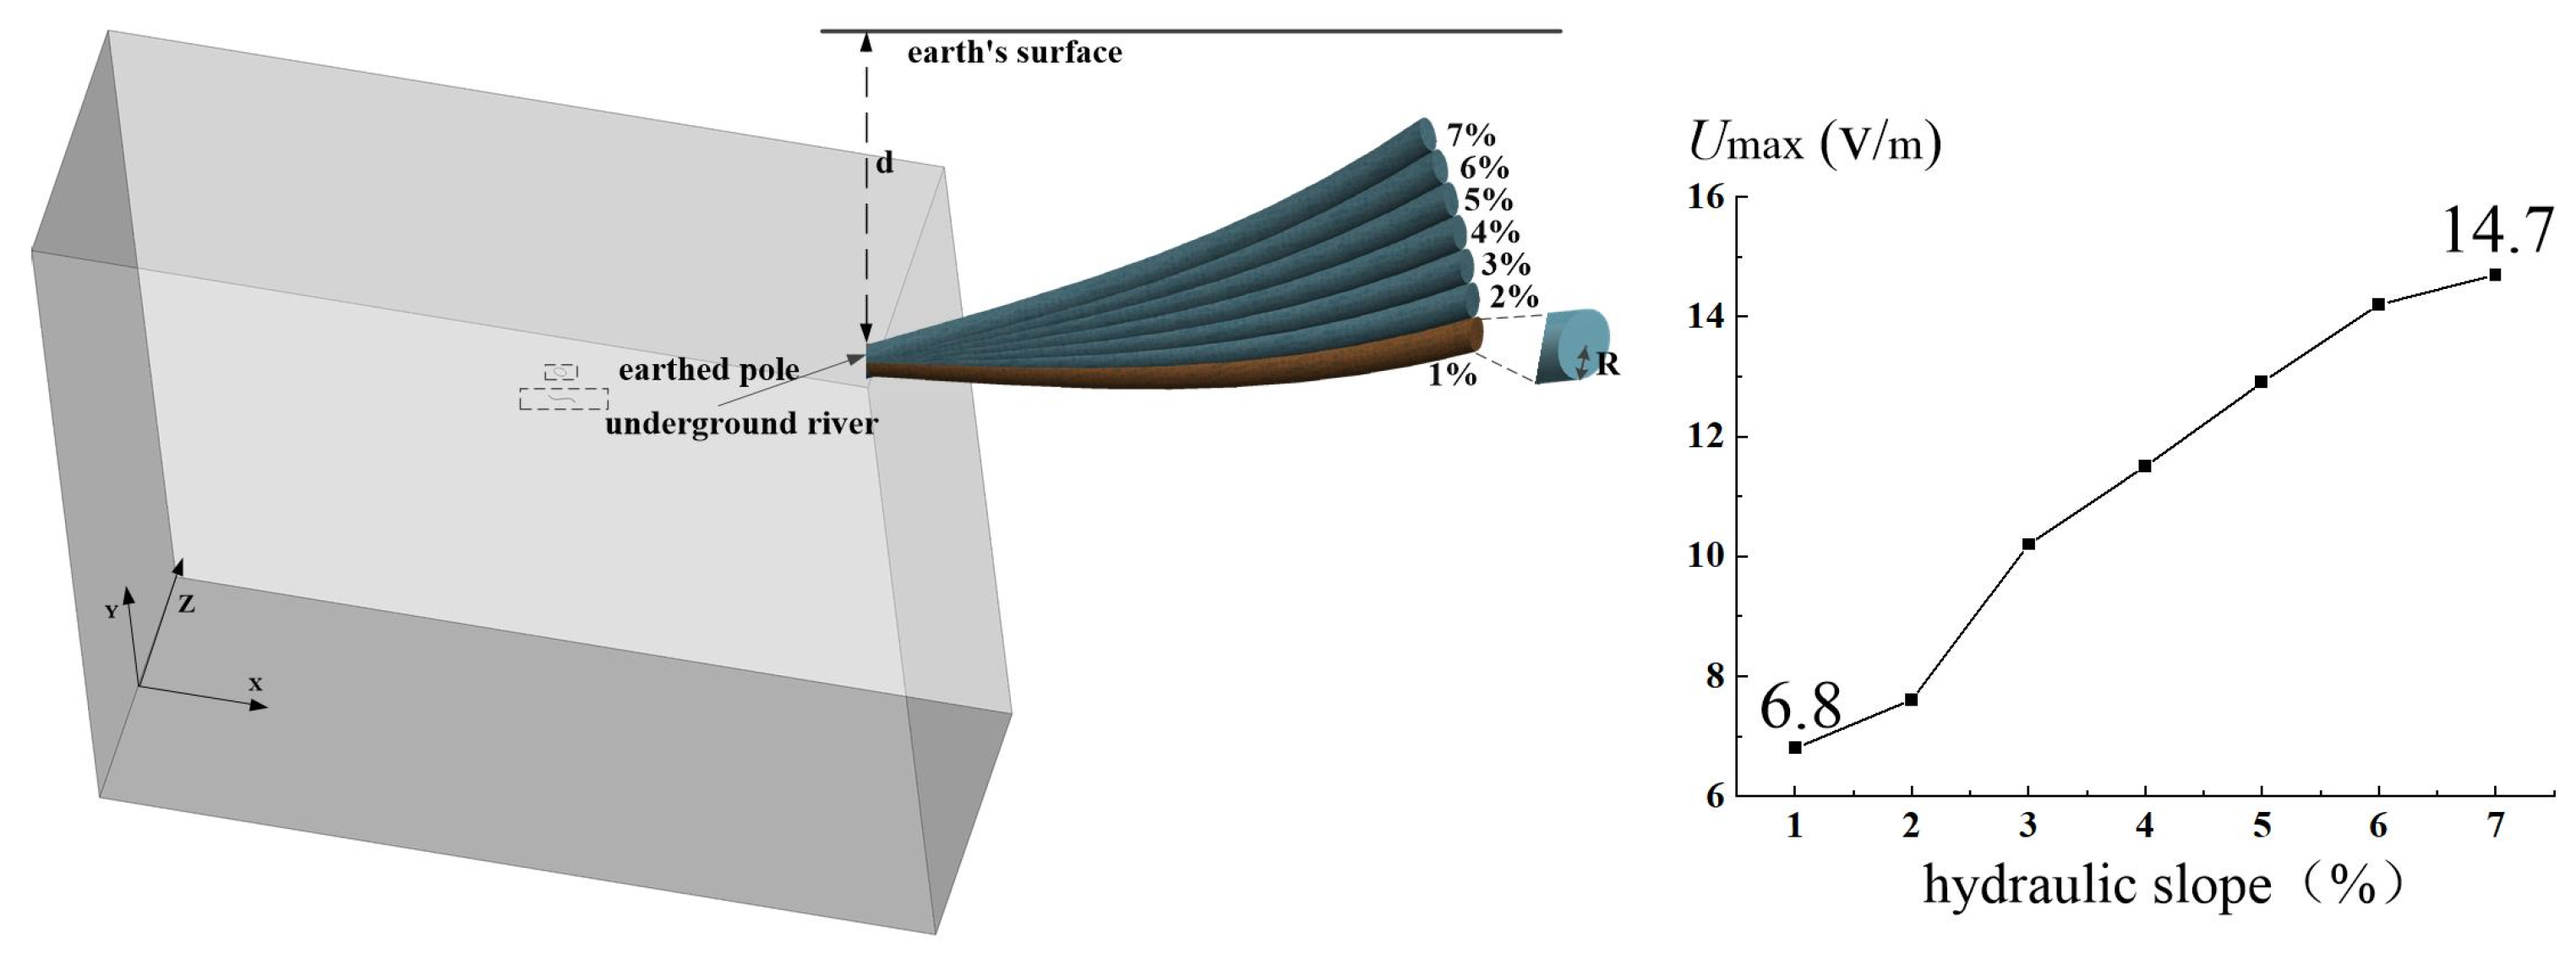
4.2. Analysis of Hydraulic Gradient

For different types of underground rivers there is no clear division of hydraulic gradient. Due to the single tunnel characteristics of the underflow, this paper takes the underflow as an example to analyze the influence of the hydraulic gradient on the surface step voltage. In addition to the hydraulic gradient, the parameters of the current are taken as the standard values in Table 4. As shown in Figure 12, d is 80 m, R is 15 m, and the hydraulic gradient is 1–7%.
With the increase in hydraulic gradient, the maximum value of the surface step voltage increases. The dispersion of the grounding electrode in the ground is affected by the underground river. When the maximum distance between the underground river and the surface is constant, the hydraulic gradient is larger, and the nearest distance between the underground river and the surface is smaller. It can be seen from the dispersion law (Figure 1) that the underground river has a greater influence on dispersion. The resistivity of the underground river is higher than that of the surrounding soil, which is the same as the filling analysis of the cave. The current is more concentrated on the surface in the direction of the underground river, the surface step voltage is distorted, and the maximum value is increased. As shown in Figure 12, the maximum surface step voltage increases by about 116% when the hydraulic gradient is 7% compared to 1%. Therefore, the influence of the hydraulic gradient on the surface step voltage cannot be ignored.

4.3. Overall Shape Analysis

The overall shape of the underground river is characterized by the possibility of multiple tributaries or a single channel. Therefore, the influence of the river’s overall shape on the surface step voltage is analyzed by taking the subsurface flow pattern along the river as an example. In addition to its overall shape, the parameters of the underground river are taken as the standard values in Table 4. The overall shape is divided into the following four types: A, single tributary (on the side away from the polar ring); B, single tributary (on the side near the polar ring); C, two tributaries (distributed on the side far away from the polar ring and the side near the polar ring, respectively); D, three tributaries (based on the two tributaries, add a short tributary on the side away from the polar ring). The relationship between the overall shape and the maximum value of the surface step voltage is shown in Figure 13. The maximum surface step voltage increases with the increase in the number of tributaries of the underground river.
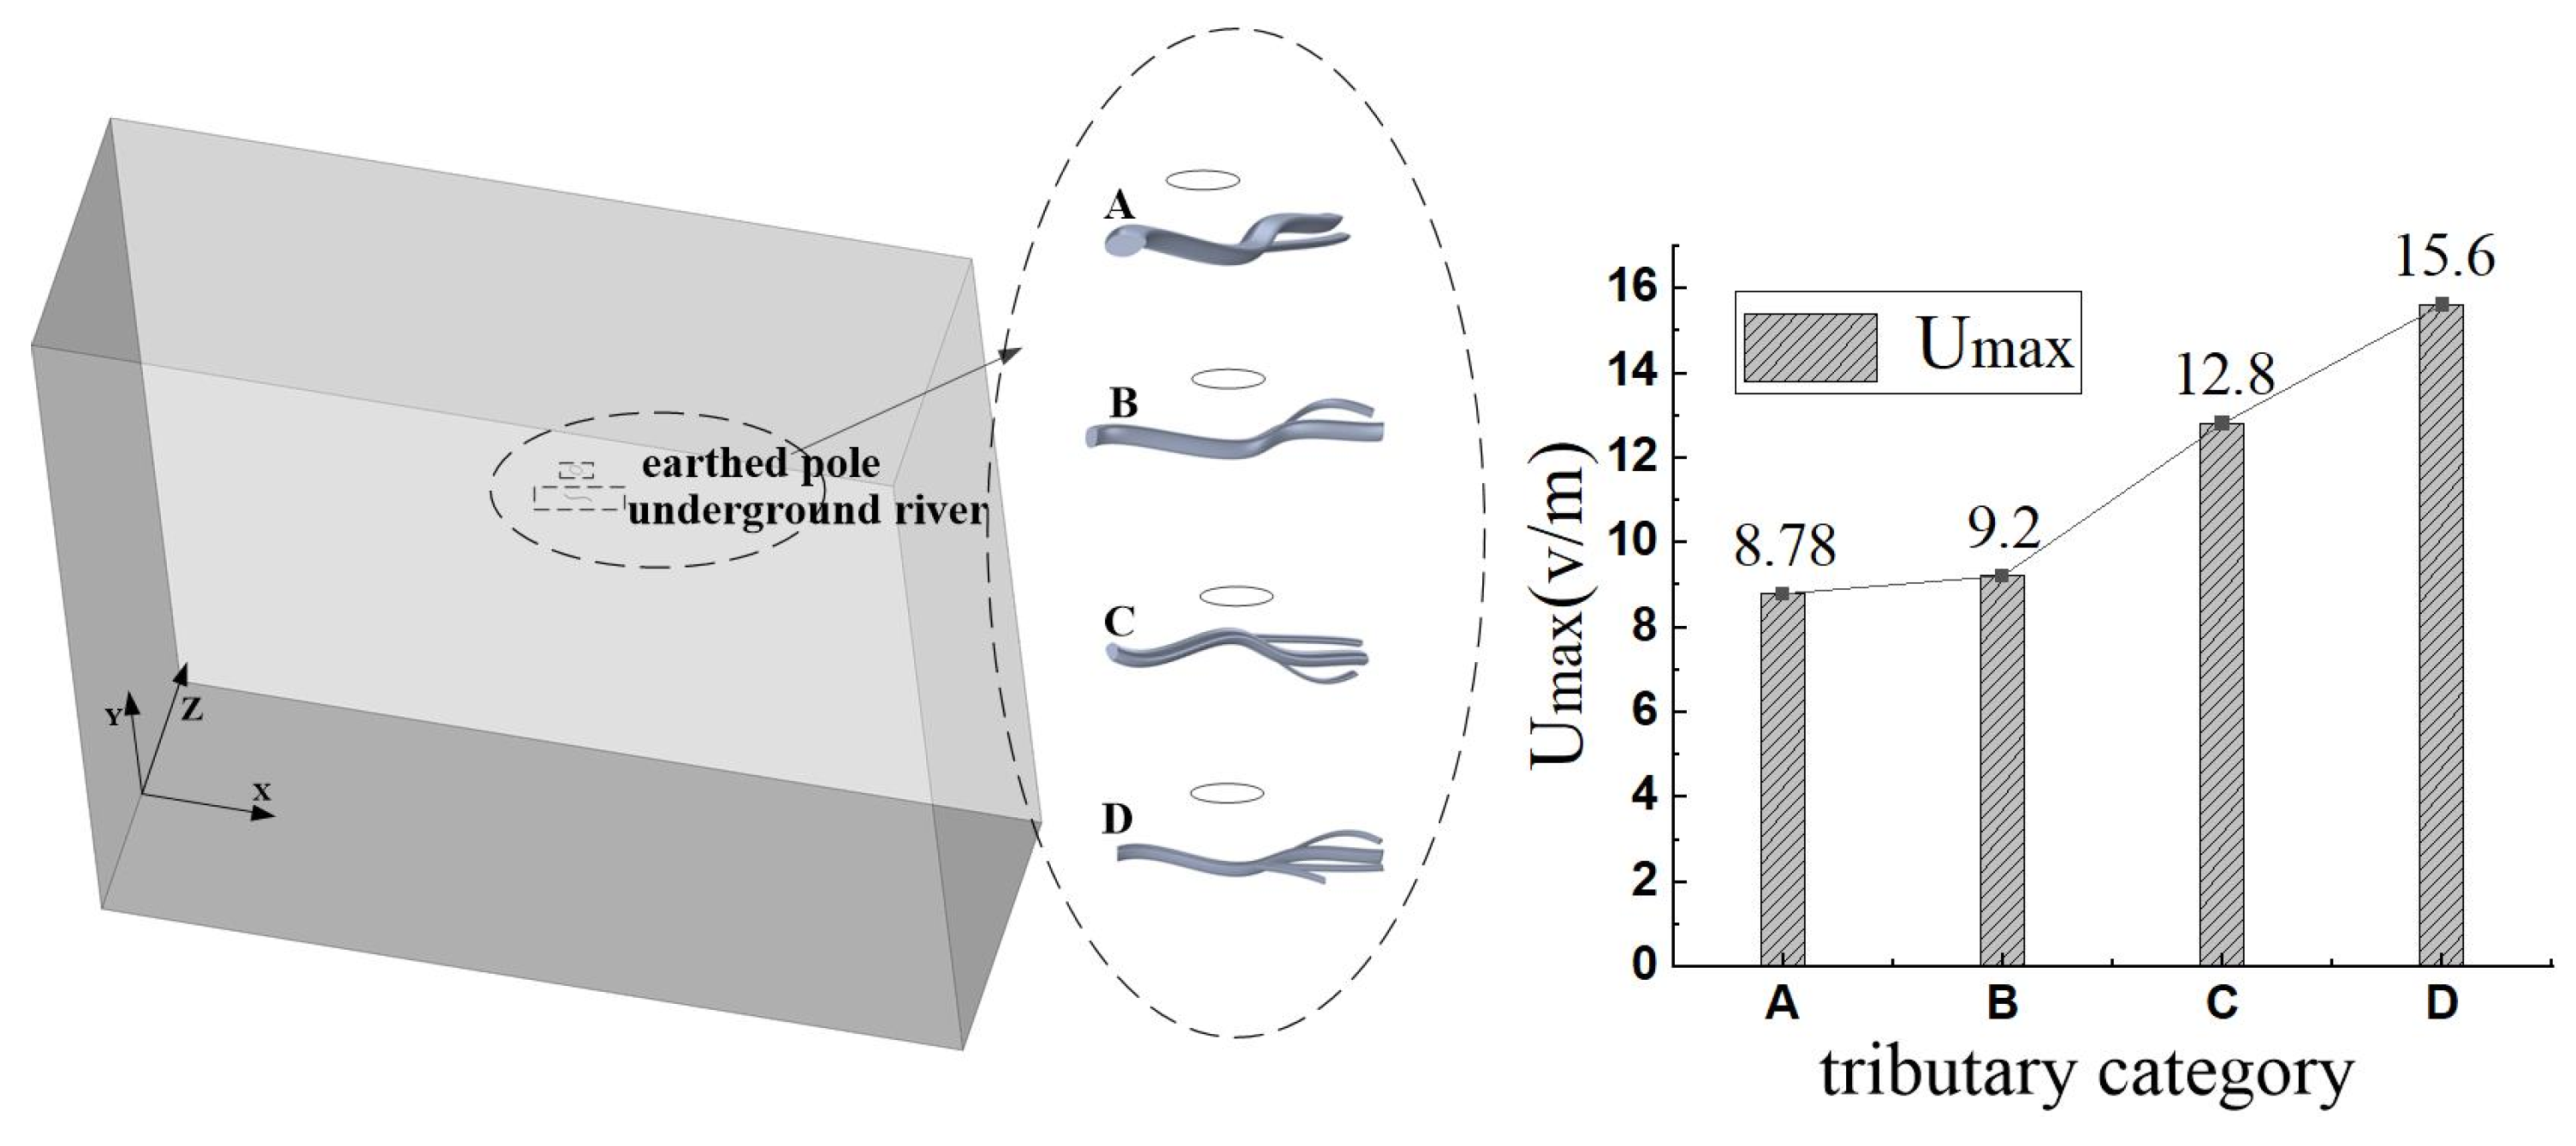
  • The number of tributaries is the same (single tributary), the mainstream is unchanged, and the maximum surface step voltage is larger on the side of the tributary near the polar ring than on the side away from the polar ring. Similar to the location analysis of cave-type karst caves, the closer to the polar ring, the greater the maximum surface step voltage.
  • The maximum surface step voltage increases with the increase of the number of tributaries of the underground river. Therefore, for the overall shape, the more dispersed the shape ( the more tributaries ), the greater the impact on the surface step voltage, the greater the maximum surface step voltage, and the easier it is to exceed the full range.
Figure 13. The overall shape affects the step voltage distribution map.
Energies 17 00420 g013

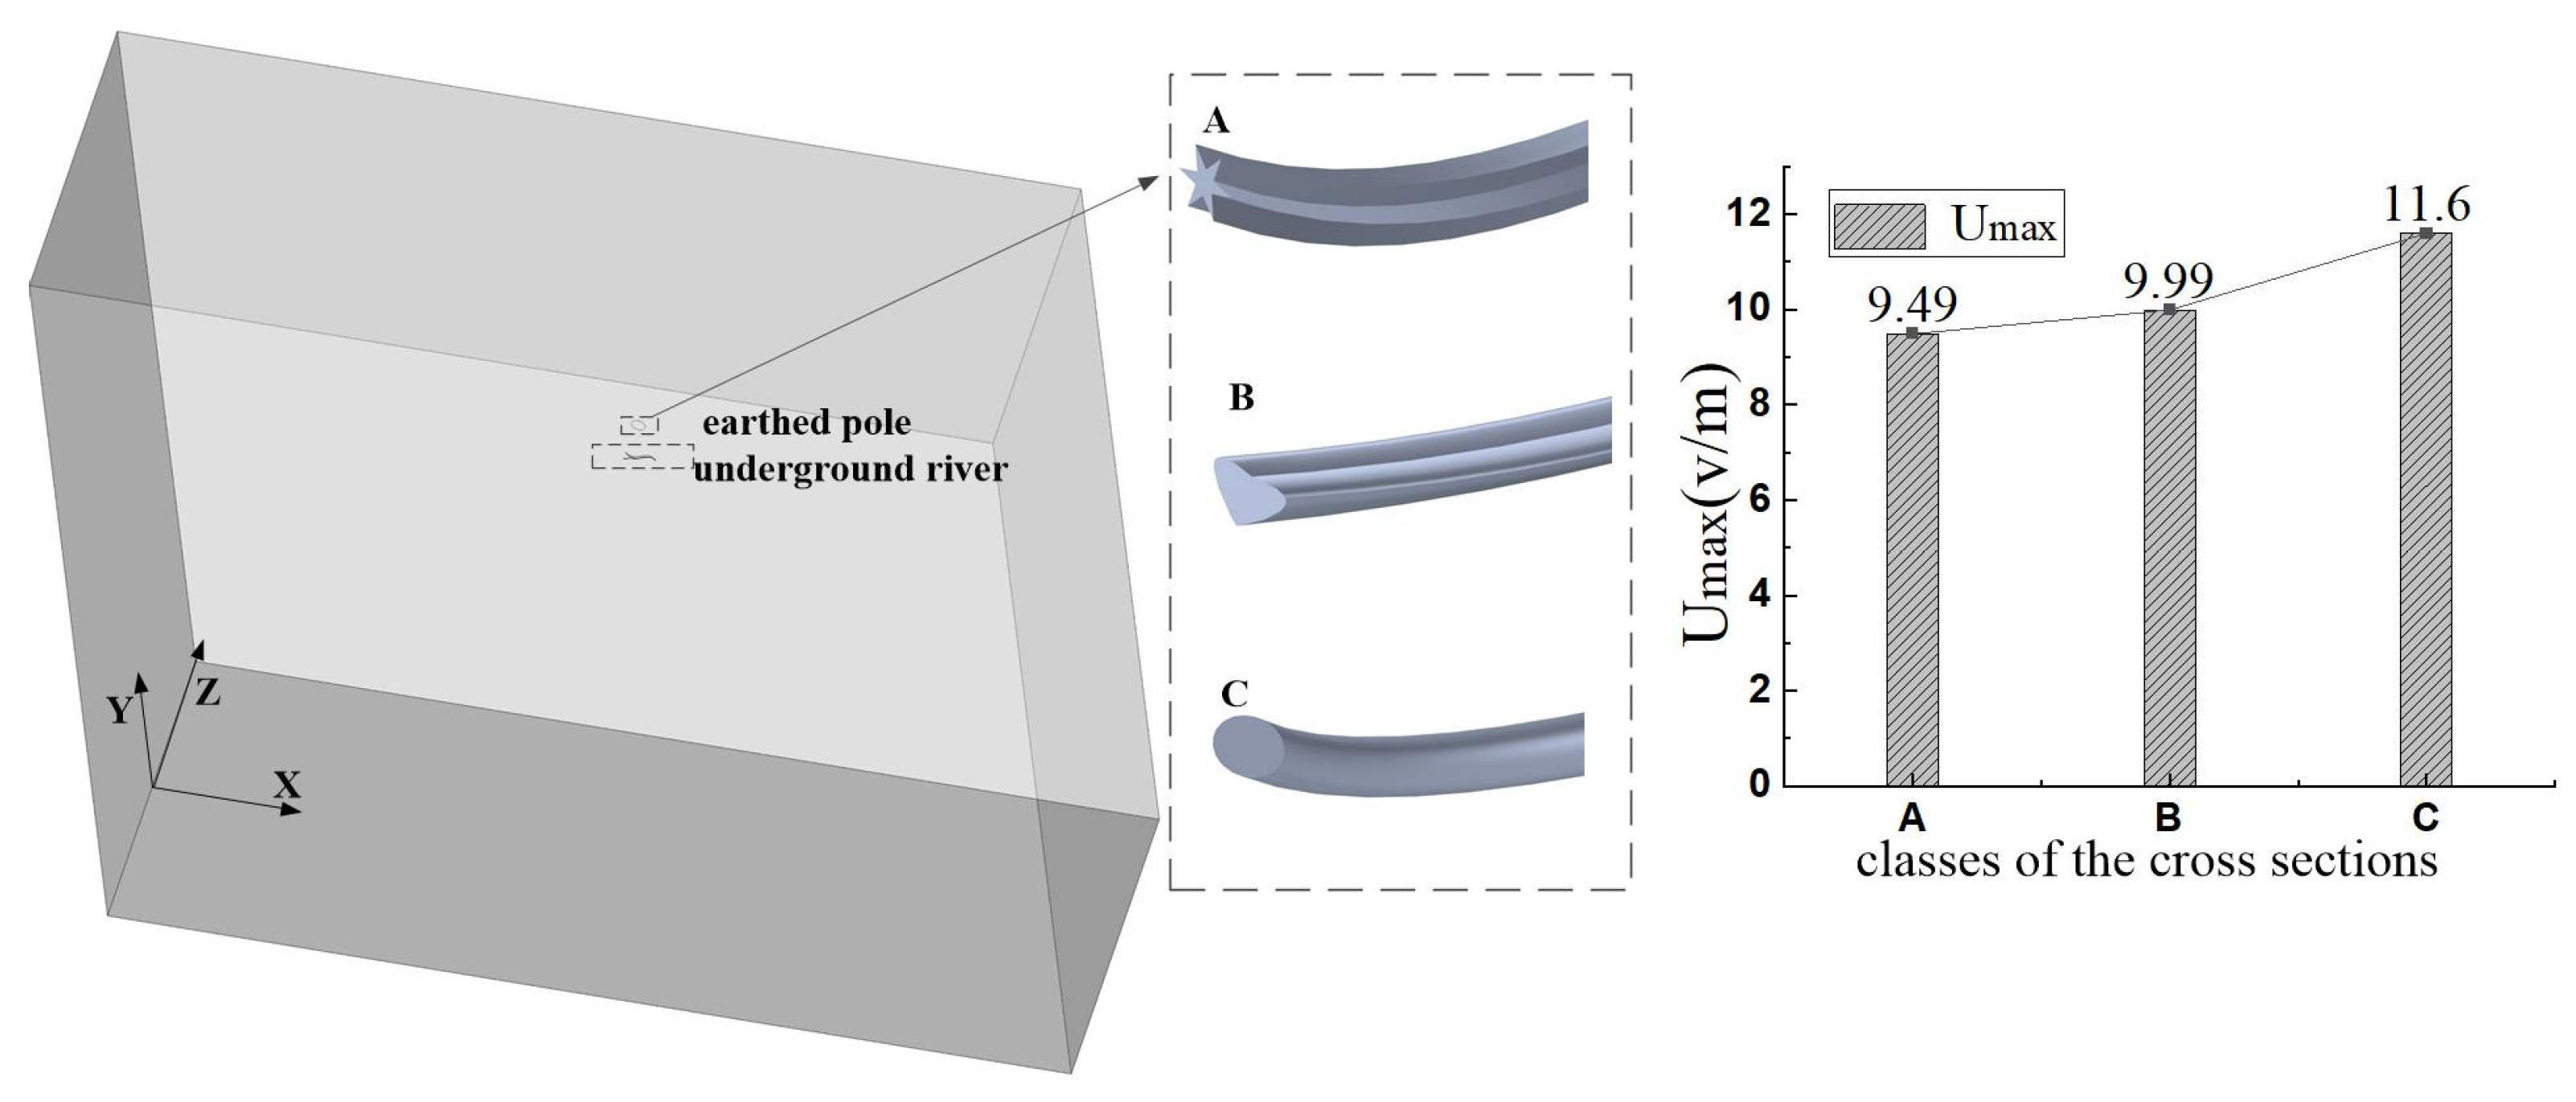
4.4. Cross-Section Shape Analysis

The cross-sectional shape of the underground river is not fixed, so the influence of the cross-sectional shape of the underground river on the surface step voltage is analyzed. In addition to the cross-sectional shape, the parameters of the underground river are taken as the standard values in Table 4. To ensure a consistent cross-sectional area (1500 m3), the influence of three cross-sectional shapes (as shown in Figure 14) on the surface step voltage is analyzed. The shape of the three cross-sections represents the irregularity of the cross-section, and the irregularity is sorted from high to low: A, B, and C. As shown in the histogram, the smaller the irregularity of the underground river section, the greater the maximum surface step voltage. In summary, the cross-section of the real underground river is mostly irregular, and the influence of the real underground river on the surface step voltage will be smaller than that in the simulation. If the simulation structure exceeds the safety limit, the real situation is certainly unsafe, so the simulation results can provide a reference for the real situation.

5. Conclusions and Prospects

This paper provides a reference for the preliminary work of determining earth electrode locations in karst topography areas. By establishing a typical soil electrical model of negative karst terrain, the influence of landforms on the step voltage distribution of the DC grounding electrode is studied. The following conclusions are obtained:
  • In the model analysis of the cave, the influences of different fillings on the maximum step voltage of the surface are within 0.02% of each other; the closer the location of the karst cave to the grounding electrode, the greater the maximum value of the surface step voltage; and there is a position range that meets the safety limit of the step voltage. The surface step voltage of super-large caves is 12% higher than that of small caves, and the volume effect cannot be ignored. The influence of different shapes on the surface step voltage has a corresponding influence on the degree of safety judgment value.
  • In the model analysis of the underground river, the influence of the rotation position cannot be ignored. The maximum value of the surface step voltage corresponding to the rotation position of 90 degrees is about 121% higher than that of 0 degrees. The influence of the hydraulic gradient cannot be ignored. A hydraulic gradient of 7% compared to 1% increases the maximum surface step voltage by 116%. The closer the tributary is to the grounding electrode and the larger the number of tributaries is, the easier it is for the surface step voltage to exceed the safety limit. The more regular the cross-section shape is, the more easily the surface step voltage exceeds the safety limit, which proves that the simulation value can provide a reference for practice.
The research results of this paper can provide theoretical guidance for the location of DC transmission projects in complex terrains. However, there are still underground fault zones and air gap water in karst landforms, which are not discussed in this paper. The soil electrical model of karst landforms needs further supplementary research.

Author Contributions

Conceptualization, Q.X., X.L. and Y.L.; data curation, X.L.; formal analysis, X.L.; methodology, X.L.; software, X.L.; visualization, X.L. and Y.L.; resources, X.L., L.X. and S.Q.; writing—original draft preparation, X.L.; writing—review and editing, X.L. and Q.X. All authors have read and agreed to the published version of the manuscript.

Funding

This research received no external funding.

Data Availability Statement

The data reported in this research are available from the corresponding author upon request.

Conflicts of Interest

The authors declare no conflicts of interest.

References

  1. Alassi, A.; Bañales, S.; Ellabban, O.; Adam, G.; MacIver, C. HVDC transmission: Technology review, market trends and future outlook. Renew. Sustain. Energy Rev. 2019, 112, 530–554. [Google Scholar] [CrossRef]
  2. Acevedo AL, F.; Jahanbani-Ardakani, A.; Nosair, H.; Venkatraman, A.; McCalley, J.D.; Bloom, A.; Osborn, D.; Caspary, J.; Okullo, J.; Bakke, J.; et al. Design and valuation of high-capacity HVDC macrogrid transmission for the continental US. IEEE Trans. Power Syst. 2020, 36, 2750–2760. [Google Scholar] [CrossRef]
  3. Oliver, D.M.; Zheng, Y.; Naylor, L.A.; Murtagh, M.; Waldron, S.; Peng, T. How does smallholder farming practice and environmental awareness vary across village communities in the karst terrain of southwest China? Agric. Ecosyst. Environ. 2020, 288, 106715. [Google Scholar] [CrossRef]
  4. Mohapatra, S.K. Design Considerations for HVDC Ground Electrode System. Water Energy Int. 2019, 62, 31–37. [Google Scholar]
  5. Ai, L. Soil Impulse Current Density Measurement and Influence of Karst Landform on Current Scattering. Master’s Thesis, Chongqing University, Chongqing, China, May 2014. [Google Scholar]
  6. Auler, A.S. Karst Landforms in the Lagoa Santa Area. In Lagoa Santa Karst: Brazil’s Iconic Karst Region; Springer: Cham, Switzerland, 2020; pp. 109–134. [Google Scholar]
  7. Auler, A.S. Karst hydrogeology, geomorphology and caves. Int. J. Speleol. 2023, 52, 0_1–0_2. [Google Scholar]
  8. Jörgens, C.; Clemens, M. Electric field and temperature simulations of high-voltage direct current cables considering the soil environment. Energies 2021, 14, 4910. [Google Scholar] [CrossRef]
  9. Kaznacheev, P.A.; Popov, I.Y.; Modin, I.N.; Zhostkov, R.A. Application of Independent Finite Element Modeling for Estimating the Effect of Simplest Landforms on Results of Inversion of Electrical Resistivity Tomography Data (Example of a Trench with the Triangular Cross-Section). Seism. Instrum. 2020, 56, 531–539. [Google Scholar] [CrossRef]
  10. Salarieh, B.; De Silva, J.; Kordi, B. High frequency response of grounding electrodes: Effect of soil dielectric constant. IET Gener. Transm. Distrib. 2020, 14, 2915–2921. [Google Scholar] [CrossRef]
  11. Xiong, Q.; Wang, M.; Huang, H.; Shi, Y.; Tang, H. Establishment of earth model for HVDC earth electrode in complicated terrain. Proc. CSEE 2020, 40, 2269–2277. (In Chinese) [Google Scholar]
  12. Sakyi, K.S. 3-D consolidation analysis of layered saturated soil using finite element method. Open Mech. Eng. J. 2019, 13, 45–56. [Google Scholar]
  13. Younes, A.; Hoteit, H.; Helmig, R.; Fahs, M. A robust fully mixed finite element model for flow and transport in unsaturated fractured porous media. Adv. Water Resour. 2022, 166, 104259. [Google Scholar] [CrossRef]
  14. Leon Bal, A.R.; Meschke, G. Two-phase model for the excavation analysis in partially saturated soft soils using the particle finite element method. Int. J. Numer. Anal. Methods Geomech. 2023, 47, 145–186. [Google Scholar] [CrossRef]
  15. De Rezende Costa, I.F.; Barbosa, M.C.; Neto, A.D.O.C. Coupled flow in saturated soil around a vertical grounding rod HVDC considering underground water’s action. Electr. Power Syst. Res. 2022, 213, 108754. [Google Scholar] [CrossRef]
  16. Kasza, Z.; Kovacs, K. Risk analysis about lightning protection for buildings focusing on risk of loss of human life. Procedia Manuf. 2019, 32, 458–465. [Google Scholar] [CrossRef]
  17. Dladla, V.M.N.; Nnachi, A.F.; Tshubwana, R.P. Analysis of Design Parameters on Substation Earth Grid Safety Limits. Sci. Publ. Group 2022, 10, 61–72. [Google Scholar]
  18. Damianaki, K.; Christodoulou, C.A.; Kokalis, C.-C.A.; Kyritsis, A.; Ellinas, E.D.; Vita, V.; Gonos, I.F. Lightning Protection of Photovoltaic Systems: Computation of the Developed Potentials. Appl. Sci. 2020, 11, 337. [Google Scholar] [CrossRef]
  19. Muzirafuti, A.; Boualoul, M.; Barreca, G.; Allaoui, A.; Bouikbane, H.; Lanza, S.; Crupi, A.; Randazzo, G. Fusion of Remote Sensing and Applied Geophysics for Sinkholes Identification in Tabular Middle Atlas of Morocco (the Causse of El Hajeb): Impact on the Protection of Water Resource. Resources 2020, 9, 51. [Google Scholar] [CrossRef]
  20. Hunt HG, P.; Blumenthal, R.; Nixon, K.J.; Gomes, C. A multidisciplinary forensic analysis of two lightning deaths observed in South Africa. Int. J. Disaster Risk Reduct. 2020, 51, 101814. [Google Scholar] [CrossRef]
  21. Heppe, R.J. Step potentials and body currents near grounds in two-layer earth. IEEE Trans. Power Appar. Syst. 1979, PAS-98, 45–59. [Google Scholar] [CrossRef]
  22. Zhou, H.; Deng, Z.; Xu, X. The application of high density resistivity method in the investigation of bedrock surface and karst cave in karst area of southern Sichuan. Theor. Res. Urban Constr. 2022, 35, 119–121. (In Chinese) [Google Scholar]
  23. Li, A.; Butler, S. Forward modeling of magnetotellurics using Comsol Multiphysics. Appl. Comput. Geosci. 2021, 12, 100073. [Google Scholar] [CrossRef]
  24. Clement, R.; Bergeron, M.; Moreau, S. COMSOL Multiphysics modelling for measurement device of electrical resistivity in laboratory test cell. In Proceedings of the 2011 COMSOL Conference, Stuttgart, Germany, 26–28 October 2011; p. 13. [Google Scholar]
  25. Amewode, E.K. Evaluation of Physical Characteristic of Sandy Soil, the Effects of Amendments Using Comsol Multiphysics and Laboratory Experiments. Ph.D. Thesis, University of Cape Coast, Cape Coast, Ghana, October 2020. [Google Scholar]
  26. Čar, J. Geostructural mapping of karstified limestones. Geologija 2018, 61, 133–162. [Google Scholar] [CrossRef]
  27. Muhammad, F.; Samgyu, P.; Young, S.S.; Ho Kim, J.; Mohammad, T.; Adepelumi, A.A. Subsurface cavity detection in a karst environment using electrical resistivity (er): A case study from yongweol-ri, South Korea. Earth Sci. Res. J. 2012, 16, 75–82. [Google Scholar]
  28. Lønøy, B.; Pennos, C.; Tveranger, J.; Fikos, I.; Vargemezis, G.; Lauritzen, S.-E. Delimiting morphological and volumetric elements of cave surveys as analogues for paleokarst reservoir modelling—A case study from the Maaras cave system, northern Greece. Mar. Pet. Geol. 2021, 129, 105091. [Google Scholar] [CrossRef]
  29. Franke, K.; Müller, H. Procedural generation of 3D karst caves with speleothems. Comput. Graph. 2021, 102, 533–545. [Google Scholar] [CrossRef]
  30. Li, Y. Application of Well Logging Constrained Inversion of Cross Borehole ERT in Urban Karst Investigation. Master’s Thesis, Shandong University, Jinan, China, 14 June 2020. [Google Scholar]
  31. Liu, Y. Research on Reservoir Characterization and Key Controlling Factors of Ordovician Yingshan Formation Carbonate Reservoir in Bachu Region. Master’s Thesis, Chengdu University of Technology, Chengdu, China, June 2013. [Google Scholar]
  32. Migoń, P.; Duszyński, F.; Jancewicz, K.; Kotowska, M.; Porębna, W. Surface-subsurface connectivity in the morphological evolution of sandstone-capped tabular hills–How much analogy to karst? Geomorphology 2023, 440, 108884. [Google Scholar] [CrossRef]
  33. Gunn, J. Karst groundwater in UNESCO protected areas: A global overview. Hydrogeol. J. 2021, 29, 297–314. [Google Scholar] [CrossRef]
  34. Saroli, M.; Albano, M.; Moro, M.; Falcucci, E.; Gori, S.; Galadini, F.; Petitta, M. Looking into the Entanglement Between Karst Landforms and Fault Activity in Carbonate Ridges: The Fibreno Fault System (Central Italy). Front. Earth Sci. 2022, 10, 891319. [Google Scholar] [CrossRef]
  35. Zhang, C. Migration Characteristics and Controlling Factors of Heavy Metal Elements in Polje Soil. Ph.D. Thesis, China University of Geosciences, Wuhan, China, May 2022. [Google Scholar]
  36. Zhang, C.; Lv, Y.; Zhang, Z. Features of Middle-Lower Ordovician paleo⁃karst caves in western slope area, Tahe Oil Field, Tarim Basin. Pet. Geol. Exp. 2022, 44, 1008–1017+1047. (In Chinese) [Google Scholar]
Figure 2. (a) measuring point layout and (b) ground potential comparison diagram.
Energies 17 00420 g002
Figure 3. (a) Three-dimensional grid model of karst landscape. (b) Analysis of the influence of the existence of a sinkhole on the surface step voltage.
Energies 17 00420 g003
Figure 4. The influence diagram of karst cave filling on the maximum values of surface electrical parameters.
Energies 17 00420 g004
Figure 5. The influence of position on the distribution of surface step voltage.
Energies 17 00420 g005
Figure 6. The normalized comparison diagram of the maximum value of the volume to the surface step voltage.
Energies 17 00420 g006
Figure 7. The influence of sphere shape on surface step voltage. Left diagram is the structure diagram. The right image is the result image.
Energies 17 00420 g007
Figure 8. The influence of cylindrical shape on surface step voltage. (ae) is the shape of the cave. (f,g) is the result.
Energies 17 00420 g008
Figure 9. The influence of the shape of the frustum on the ground step voltage. (a) Round truncated cone comparison diagram. (b) Step voltage comparison.
Energies 17 00420 g009
Figure 10. Simulation diagrams of irregular shapes.
Energies 17 00420 g010
Figure 11. Rotation position analysis. (a) Structure distribution; (bd) surface step voltage distribution under different rotation positions.
Energies 17 00420 g011
Figure 12. The hydraulic gradient affects the step voltage distribution map.
Energies 17 00420 g012
Figure 14. The cross-section shape affects the step voltage distribution map.
Energies 17 00420 g014
Table 1. Horizontal 5-layer soil.
iρi (Ω·m)hi (m)
152.055
2240.01274
33843.671945
48542.763561
535,427.8168,577
Table 2. Fillings, volume summary table.
Classification
fillingDry karst cave (above 10,000 Ω·m)
Semi-filled karst cave (5000–10,000 Ω·m)
Filled with permeable material, such as gravel or coarse sand (500–1000) Ω·m
Filled with weakly permeable material, such as microscale sand or silt (100–300) Ω·m
Water-filled cave (Less than 50 Ω·m)
Karst cave filled with impervious material, such as clay (5–30 Ω·m)
volumeSmall cave: radius 0.1–0.5 m, volume less than 10 m3, height 10–318 m
Medium cave: radius 0.5–3 m, volume 10–100 m3, height 10–318 m
Large cave: radius 1–10 m, volume 100–1000 m3
Super - large   cave :   radius   10 300   m ,   volume   greater   than   1000   m 3
Table 3. Summary table of underground river parameters.
FillingPositionVolumeShape
semi-water, semi-filled permeable
substances (275–525 Ω·m)
runoff dissolution belt
(apart from surface 45–325 m)
super-large karst cave
(above1000 m3)
hydraulic slope
2.9–12.7%
semi-water, semi-filled weakly
permeable material (75–175 Ω·m)
vertical infiltration dissolution zone
(apart from surface 30–170 m)
Table 4. Standard data values.
Dark RiverSwallet StreamUndercurrent
resistivity (Ω·m)300300150
volume (m3)about 4.5 × 10⁶about 2.8 × 10⁶about 2.1 × 10⁷
positionvertical position 130 m65–144 m100–325 m
horizontal position 2800 m1500 m800 m
rotation position0 degrees0 degrees0 degrees
hydraulic slope12%3%8%
shapewhole shapemultiple development branch holessingle tunneldevelopment branch hole
cross-sectional shapeirregularkeyhole typethe shape of a pothole
1 The highest point from the surface. 2 The distance from the center of gravity of the underground river to the center of the grounding electrode in the south direction of the horizontal plane.
Table 5. The critical values of safety range.
(X, Y)d (m)(X, Y)d (m)
(0, 10)350.06(200, 90)173.15
(10, 30)341.03(300, 350)350.09
(50, 30)301.17(600, 10)250.08
(100, 30)251.4
Table 6. Volume value parameter table.
CategoryVolume (m3)Radius (m)Umax (V/m)
A101.349.367
B502.299.706
C10006.29.999
D1,000,00062.0510.647
Table 7. Parameter table of the spherical model.
NumberingHalf Axis a (m)Half Axis b (m)Half Axis c (m)U (V/m)Kx
16.26.26.29.961
21.2413.8813.8811.080.089
31.24138.81.3910.050.89
41.241.39138.811.40.0089
50.6219.6319.6311.140.0316
60.6213.8827.7611.20.022
Table 8. Cylindrical variant values parameter table.
NumberingHeight (m)Radius or Other Bottom
Parameters (m)
Umax (V/m)Kx
1238.161.1611.80.00765
225.043.5711.440.224
3105.6411.390.885
47.056.7211.251.5
51.3515.3611.0917.86
610length of side: 1011.211
710elliptical shaft: 11.29, 2.8211.171.77
810length of side: 20, 511.132
Table 9. Three-dimensional ring value parameter table.
NumberingRxr (m)U (V/m)
15.073.1610.3
250.71110.56
3101.420.7111.1
Table 10. Table of round truncated cone value parameters.
NumberingHeight (m)kU (V/m)
138.22010.9
227.50.311.08
321.840.511.12
415.660.811.38
Table 11. Irregular shape parameter table.
NumberingSectional Area (m2)Height (m)U (V/m)
143.51222.9810.31
25219.2310.33
3105.549.47511.39
4150.66.6411.93
Disclaimer/Publisher’s Note: The statements, opinions and data contained in all publications are solely those of the individual author(s) and contributor(s) and not of MDPI and/or the editor(s). MDPI and/or the editor(s) disclaim responsibility for any injury to people or property resulting from any ideas, methods, instructions or products referred to in the content.

