Article

Fuzzy Inference System Development for Turbogenerator Failure Diagnosis on Floating Production Offloading and Storage Platform

by
Patricio F. Castro
1,*,
George Rossany Soares de Lira
2,
Pablo Bezerra Vilar
2,
Edson G. da Costa
2 and
Fabricio B. S. Carvalho
3
1
Petrobras, Av. Henrique Valadares, 28, Centro Empresarial Senado, Bairro, Centro, Rio de Janeiro CEP 20.231-030, RJ, Brazil
2
Post-Graduation Program in Electrical Engineering, Department of Electrical Engineering, Campina Grande Federal University (UFCG), Campina Grande CEP 58.429-900, PB, Brazil
3
Post-Graduation Program in Electrical Engineering, Department of Electrical Engineering, Federal University of Paraíba (UFPB), João Pessoa CEP 58.051-900, PB, Brazil
*
Author to whom correspondence should be addressed.
Energies 2024, 17(2), 392; https://doi.org/10.3390/en17020392
Submission received: 24 November 2023 / Revised: 18 December 2023 / Accepted: 28 December 2023 / Published: 12 January 2024
(This article belongs to the Special Issue Advanced Electric Power System 2023)

Abstract

:
This paper introduces a novel approach for diagnosing failures within a turbogenerator mineral lube oil system, employing a fuzzy inference system (FIS) model. The study leverages real operational data collected from supervisory monitoring sensors across four turbogenerators over a three-year operational span, resulting in a dataset comprising 40,456,663 input parameters. The failure modes were established through expert knowledge, using the Failure Mode, Effect, and Criticality Analysis (FMECA) documentation as the basis. Initially, the model’s universe variables were constructed using the sensor calibration range, and then the fuzzy membership functions were formulated based on the operational thresholds inherent to each measured parameter. The fault identification mechanism is underpinned by an inference system employing predefined rules, extrapolated from expert judgments encapsulating failure typologies specific to the turbogenerators’ mineral lube oil system, as delineated in the FMECA. The FIS model demonstrates notable efficacy in failure diagnosis with an overall performance evaluation of the system yielding satisfactory outcomes, having a 98.35% true positive rate for failure classification, coupled with a 99.99% true negative rate for accurate classification during normal system operation. These results highlight the visibility of the FIS model in diagnosing failures within the turbogenerator mineral lube oil system, thereby showcasing its potential for enhancing operational reliability and maintenance efficiency.

1. Introduction

Failure diagnosis plays an important role in industry since it reduces losses associated with systems’ interruption time. In oil and gas production platforms like FPSO (Floating Production Storage and Offloading), typically producing over 150,000 barrels per day (BPD) of oil and 7 million m 3 /day of gas [1], as well as, with new projects where those facilities have capacity to produce up to 225,000 BPD of oil and 12 million m 3 /day of gas [2], the production interruption cost is very significant. Therefore, the diagnosis of failures is an important tool to set actions to achieve higher platform availability [3].
In Brazil, especially for pre-salt fields, FPSO are currently the most deployed production facilities [4]. In general, these platforms’ power systems are insulated and use gas turbine driven generators [5]. Hence, given its size and the significant amount of electrical load, the power generation system is one of the core for maintaining the operation and production of FPSO.
Business decision-making based on data analytics is fundamental to overcome biases and make the best managerial decisions. Therefore, in the oil and gas industry, where the downtime has huge cost for platform operators, a structured data-driven decision process and the utilization of Big Data analytics [6] have high added value to the business.
The term analytics usually refers to the use of information and mathematics to answer questions, identify relationships, and predict results. The types of analytical models are descriptive analytics, diagnostic analytics, predictive analytics, and prescriptive analytics [7].
In the field of diagnostic analytics, different types of diagnostic techniques have been employed to classify equipment failures using artificial intelligence (AI), including: fuzzy logic, artificial neural networks (ANN), hybrid fuzzy logic systems coupled with ANN, reinforcement learning and ensemble models [8,9,10].
Tran et al. in [11] applied fuzzy entropy to select features of chatter vibration signals of a CNC machine, and a similarity classifier was used to classify stable cutting and unstable cutting at different spindle speeds and cutting depths of the machine.
A fuzzy inference system was successfully applied to diagnose failures in fuel cells by Zang et al. in [12]. The work presented in [13] uses an artificial neural fuzzy inference system (ANFIS) model to identify if an induction motor has a broken rotor bar or not, through the analysis of slip data, the number of motor poles, frequencies, and fundamental frequency signatures of the motor’s current. ANFIS and time series models were used to estimate the useful life of metal oxide surge arresters [14]. Another ANFIS Neuro-Fuzzy System was presented in [15]; in this case, the model was developed to estimate the useful life of power transformers based on insulating oil parameters and humidity values.
In the field of fault diagnosis in turbogenerators, [16] proposed a method based on clustering, using fuzzy logic and the wavelet transformation, in the diagnosis of failures in the lubrication of bearings, axle unbalance and misalignment. In the work presented in [17], as well as in [18], a fault diagnosis model for turbogenerators based on a hybrid system of fuzzy logic and ANN was presented. In [19], the wavelet transform and a neuro-fuzzy system (NFS) were applied to recognize fault patterns in a turbogenerator driven by a steam turbine. A neural network combined with fuzzy logic was used in this case to detect six types of failures. In [20], a fault diagnosis model for a heavy-duty gas turbine was proposed, based on an ANFIS and orthonormal basis functions to capture failure dynamics and enhance fault detection by reducing the effects of undesired measurements such as noise and disturbances. A fuzzy inference system (FIS) was used to verify if there are parameters of the turbine sensors that are deviating from a certain threshold. Finally, a decision tree algorithm is employed to classify the mapped fault scenarios.
Other authors have used deep learning techniques for fault diagnosis, such as Li and Wang [21] who developed an artificial neural network model for fault diagnosis in bearings. Gao et al. [22] also developed an artificial neural network model for diagnosing mechanical failures in high-voltage circuit breakers. Wanderley Neto et al. [23] and Lira et al. [24] worked on failure classification methods for lightning arresters using ANN based approaches. Other neural network applications in power electronic systems can be found in [25].
When compared with other AI models, the application of FIS and NFS has the advantage of including the physical characteristics of the system in the membership functions. This way, the expert’s knowledge is incorporated into the model. The optimization of the membership functions for each training is one of the advantages of using the NFS in relation to fuzzy inference models. On the other hand, NFS has the disadvantage of needing to train the model, similar to what happens with ANN.
The evaluation proposed in this work is based on the diagnostic analysis of monitoring data from the mineral oil lubrication system of a set of four tubogenerators, whose objective is to classify equipmet’s lubrication system faults. These equipment compose the main generation system of a FPSO platform which operates on island, with no connection to another power system.
The platform’s power system is composed of four main turbogenerators driven by a heavy-duty gas turbine, and each generator has a nominal power of 25 MW at 13.8 kV [26].
In the literature, there are several techniques for failure diagnosis for equipment including turbogenerators, but none focused on standardizing the equipment specialist’s knowledge transfer for the AI model applied to failure diagnosis, as well as none that deal with oil and gas industry equipment issues.
A FIS was developed to classify faults using the variables provided by the turbogenerator’s supervisory system. This modeling procedure poses a comparatively small computational cost, which is ideal for online operation and requires no training data that is possible because it incorporates specialist knowledge about the process. The proposed method substitutes the investigation that the operation, maintenance and engineering teams need to conduct when the machines have a failure, providing a quick diagnosis at the correct time without filling errors.
When compared with other models, FIS brings the advantage of mapping all possible failure modes of the machine, even if the failure has never happened. In contrast, models that depend on a training set may not be able to map all failure modes if there are some failures underrepresented in the training set. Another advantage is not requiring a balanced data set between healthy state samples and faulty state for model training and testing purposes.
The main contributions of this paper are summarized below:
  • The model is designed to be used in scenarios where there is limited availability of failure data for training and testing models that require extensive failure data;
  • To the best of the author’s knowledge, none of the previous research available in the technical literature has simultaneously addressed the methodology of fault diagnosis and its classification in terms of machinery failure modes as this research does.
  • Definition of fuzzy universe set, based on sensors calibration ranges;
  • Creation of a fault diagnosis and classification model that standardizes the transfer of knowledge from the equipment specialist to the AI model;
  • Rules are created to establish correlation between sensor readings of mineral oil in the lubrication system and a predefined set of failures identified during the equipment design stage;
  • The model is specifically designed for diagnosing failures in a gas turbine auxiliary system, leveraging expert knowledge in the field.
The rest of this paper is organized as follows. Section 2 presents the fuzzy inference system. Additionally, this section explains the methodology used to obtain the results. The experimental results are evaluated in Section 3 and the conclusions and future works derived from this paper are discussed in Section 4.

2. Materials and Methods

Fuzzy logic is a multi-valued logic in which the variables can be determined by the limits of the antecedent variable. This logic aims to imitate human reasoning, where rules are expressed through logical implications in the form of if-then statements. In fuzzy logic, a rule will be triggered if there is a non-zero degree of similarity between a given premise (if) and the rule’s antecedent. The result will be a consequent (then) with a non-zero degree of similarity in relation to the consequent of the rule [27].
Two analysis methods are commonly used in fuzzy inference systems: Mamdani and Sugeno, with the Mamdani method usually preferred [28]. This method consists of four steps as described below:
  • Fuzzification of input values, also known as crisp inputs;
  • Rules evaluation;
  • Fuzzy outputs;
  • Output defuzzification.
In the fuzzification stage, the crisp inputs are converted into fuzzy inputs. Here the fuzzy inputs were defined for each variable in terms of Low, Medium and High. The range of values that each term represents was defined based on the alarm and trip limits of the measured variables. The range of values included in the Low category are those in which the variable has a value lower than its normal reading while the machine is in operation. The term Medium, represents the range of values in which the measured quantity is within its normal reading range and the equipment operates normally. The High category represents sensor readings that are above the normal operating values.
The definition of the membership functions used for each crisp input was also based on the operational limits of the equipment. These functions define the degree to which the input values are members of the fuzzy set [29]. Figure 1 illustrates the ranges of values for normal operating, alarm and trip conditions, as well as how the membership functions were established for the crisp inputs.
Fuzzy rules are fundamental components of the inference system and they are used to relate the fuzzy inputs using classical logic, through the if-then relationship, thus providing the consequent part of the FIS.
The consequent portion also has a membership function, which for the system studied here, was defined as triangular functions whose intervals represent the system’s failure categories.
Finally, the defuzzification step is defined as the evaluation of the result of the judgment of the rules through the relevance functions of the consequent part. With this, a crisp output is generated, which is the numerical representation of the consequent portion.

2.1. Methodology

The methodology applied in this work is divided into six steps which are presented in Figure 2. The first two steps aim to understand the business needs, define the problem to be solved, collect and organize the data to be analyzed. The data preparation and modeling steps were grouped into a single block because the fuzzification and defuzzification of crisp values belong to both phases. The last two steps aim to create the model based on the previous steps and put this model into practice. The following subsections present the stages of this methodology.

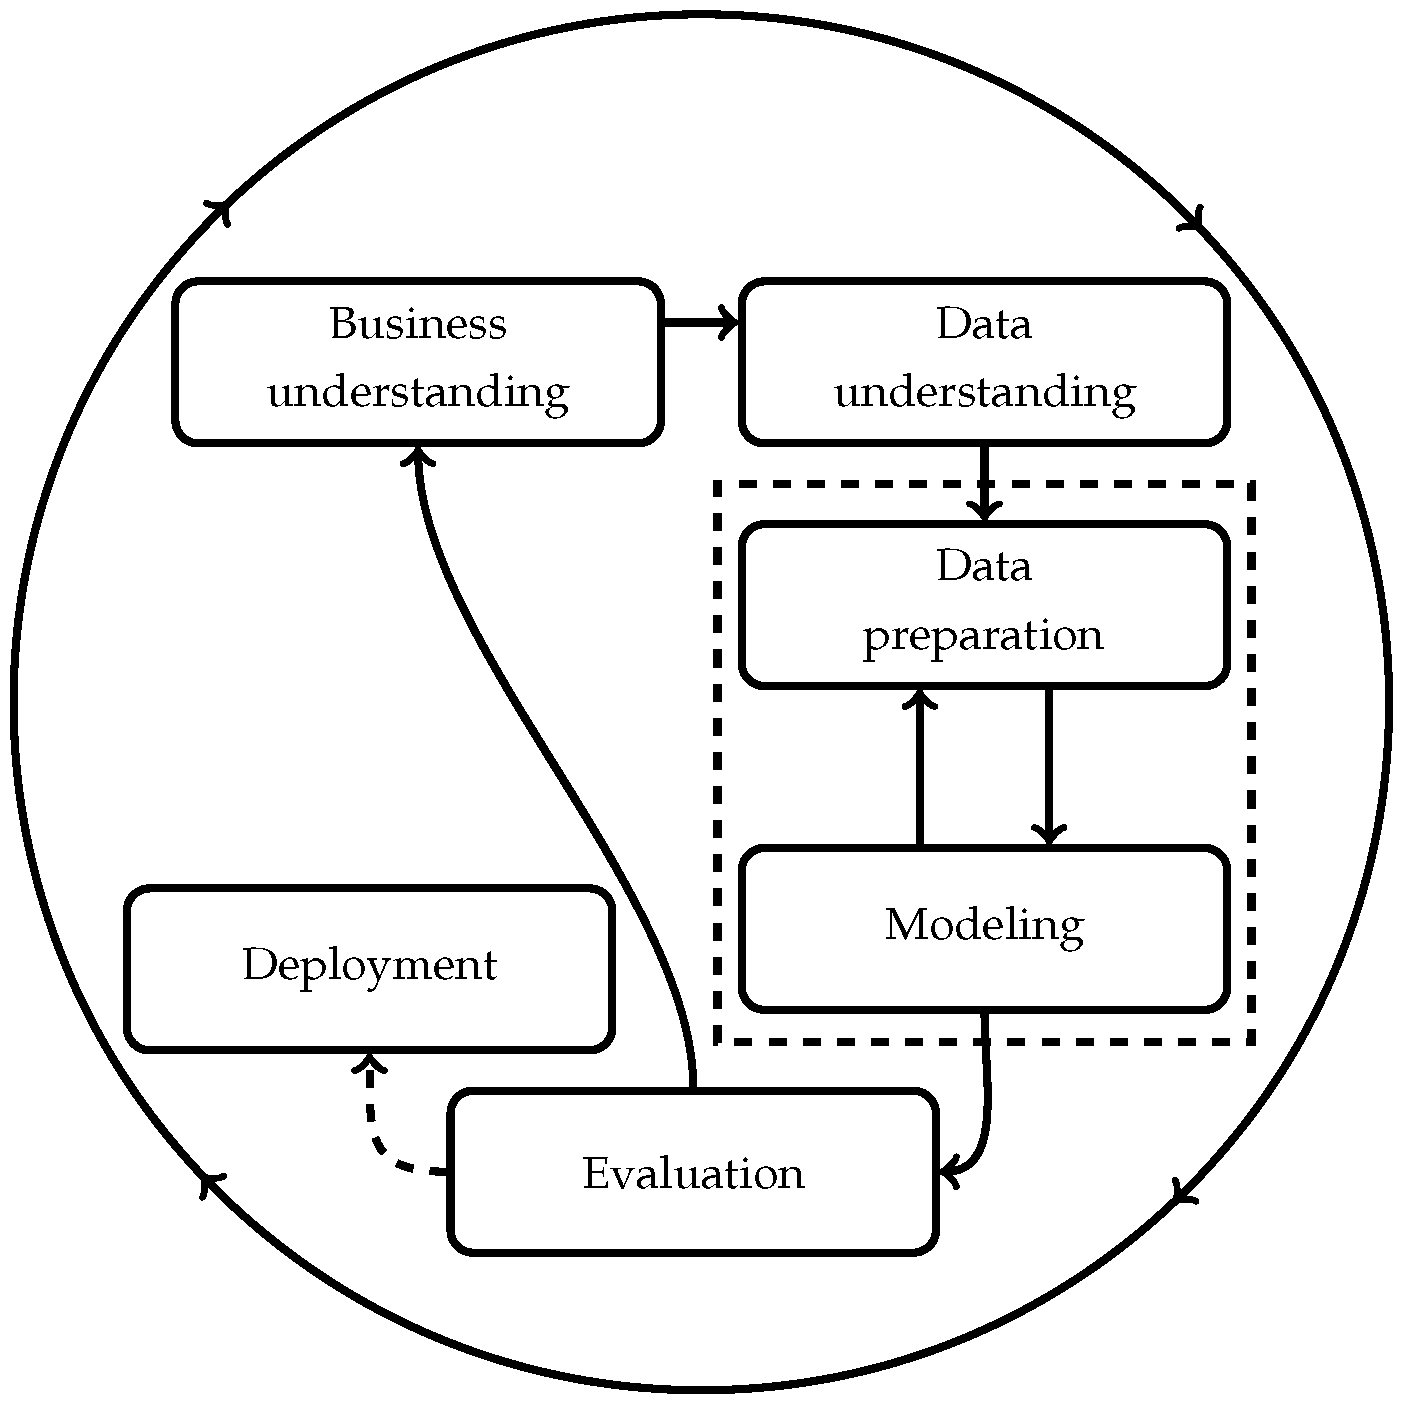
2.1.1. Business Understanding

The objective of business understanding is to define the project’s requirements. In the case study, the generator’s events and alarms list are primarily focused on fulfilling cause and effect matrices. However, in many instances, this information alone does not provide the operator with a comprehensive diagnosis of a failure. For example, when the machine’s supervisory system notifies the operator that the machine tripped due to a variable exceeding a trip limit, it fails to provide the operator with a detailed diagnosis of the specific cause that led to the variable surpassing the limit. In many cases the information that the operator has is related to very low, low, high, or very high sensor values (information of magnitude values that generate alarms and tripping).
This sensor information requires that the maintenance team analyze what happened to the machine to diagnose the failure. In some cases, the machine’s manuals’ troubleshooting sections need to be consulted, or specialist maintenance teams must be involved to diagnose a failure. Thus, the time spent investigating the causes of a failure is directly related to the increase in Mean Time to Repair (MTTR), impacting the decrease in equipment availability.
This case study was conducted during an observation period spanning from 1 January 2019 to 31 December 2022, during which all failures in the power system’s generators were recorded. This system is in operation since February of 2018 and the first year of operation of the system was disregarded for failure diagnosis since it is part of commissioning phase of the project.
In 2019, Generator A experienced eighteen forced shutdowns due to failures. Notably, the mineral lube oil system, along with the fuel gas and turbine control systems, had the greatest impact on this generator’s reliability.
Aside from operator-reported failures, the maintenance records for Generator A were examined. This examination revealed that the mineral lube oil system, along with synthetic lube oil and turbine monitoring systems, accounted for the most frequent issues during the evaluation period.
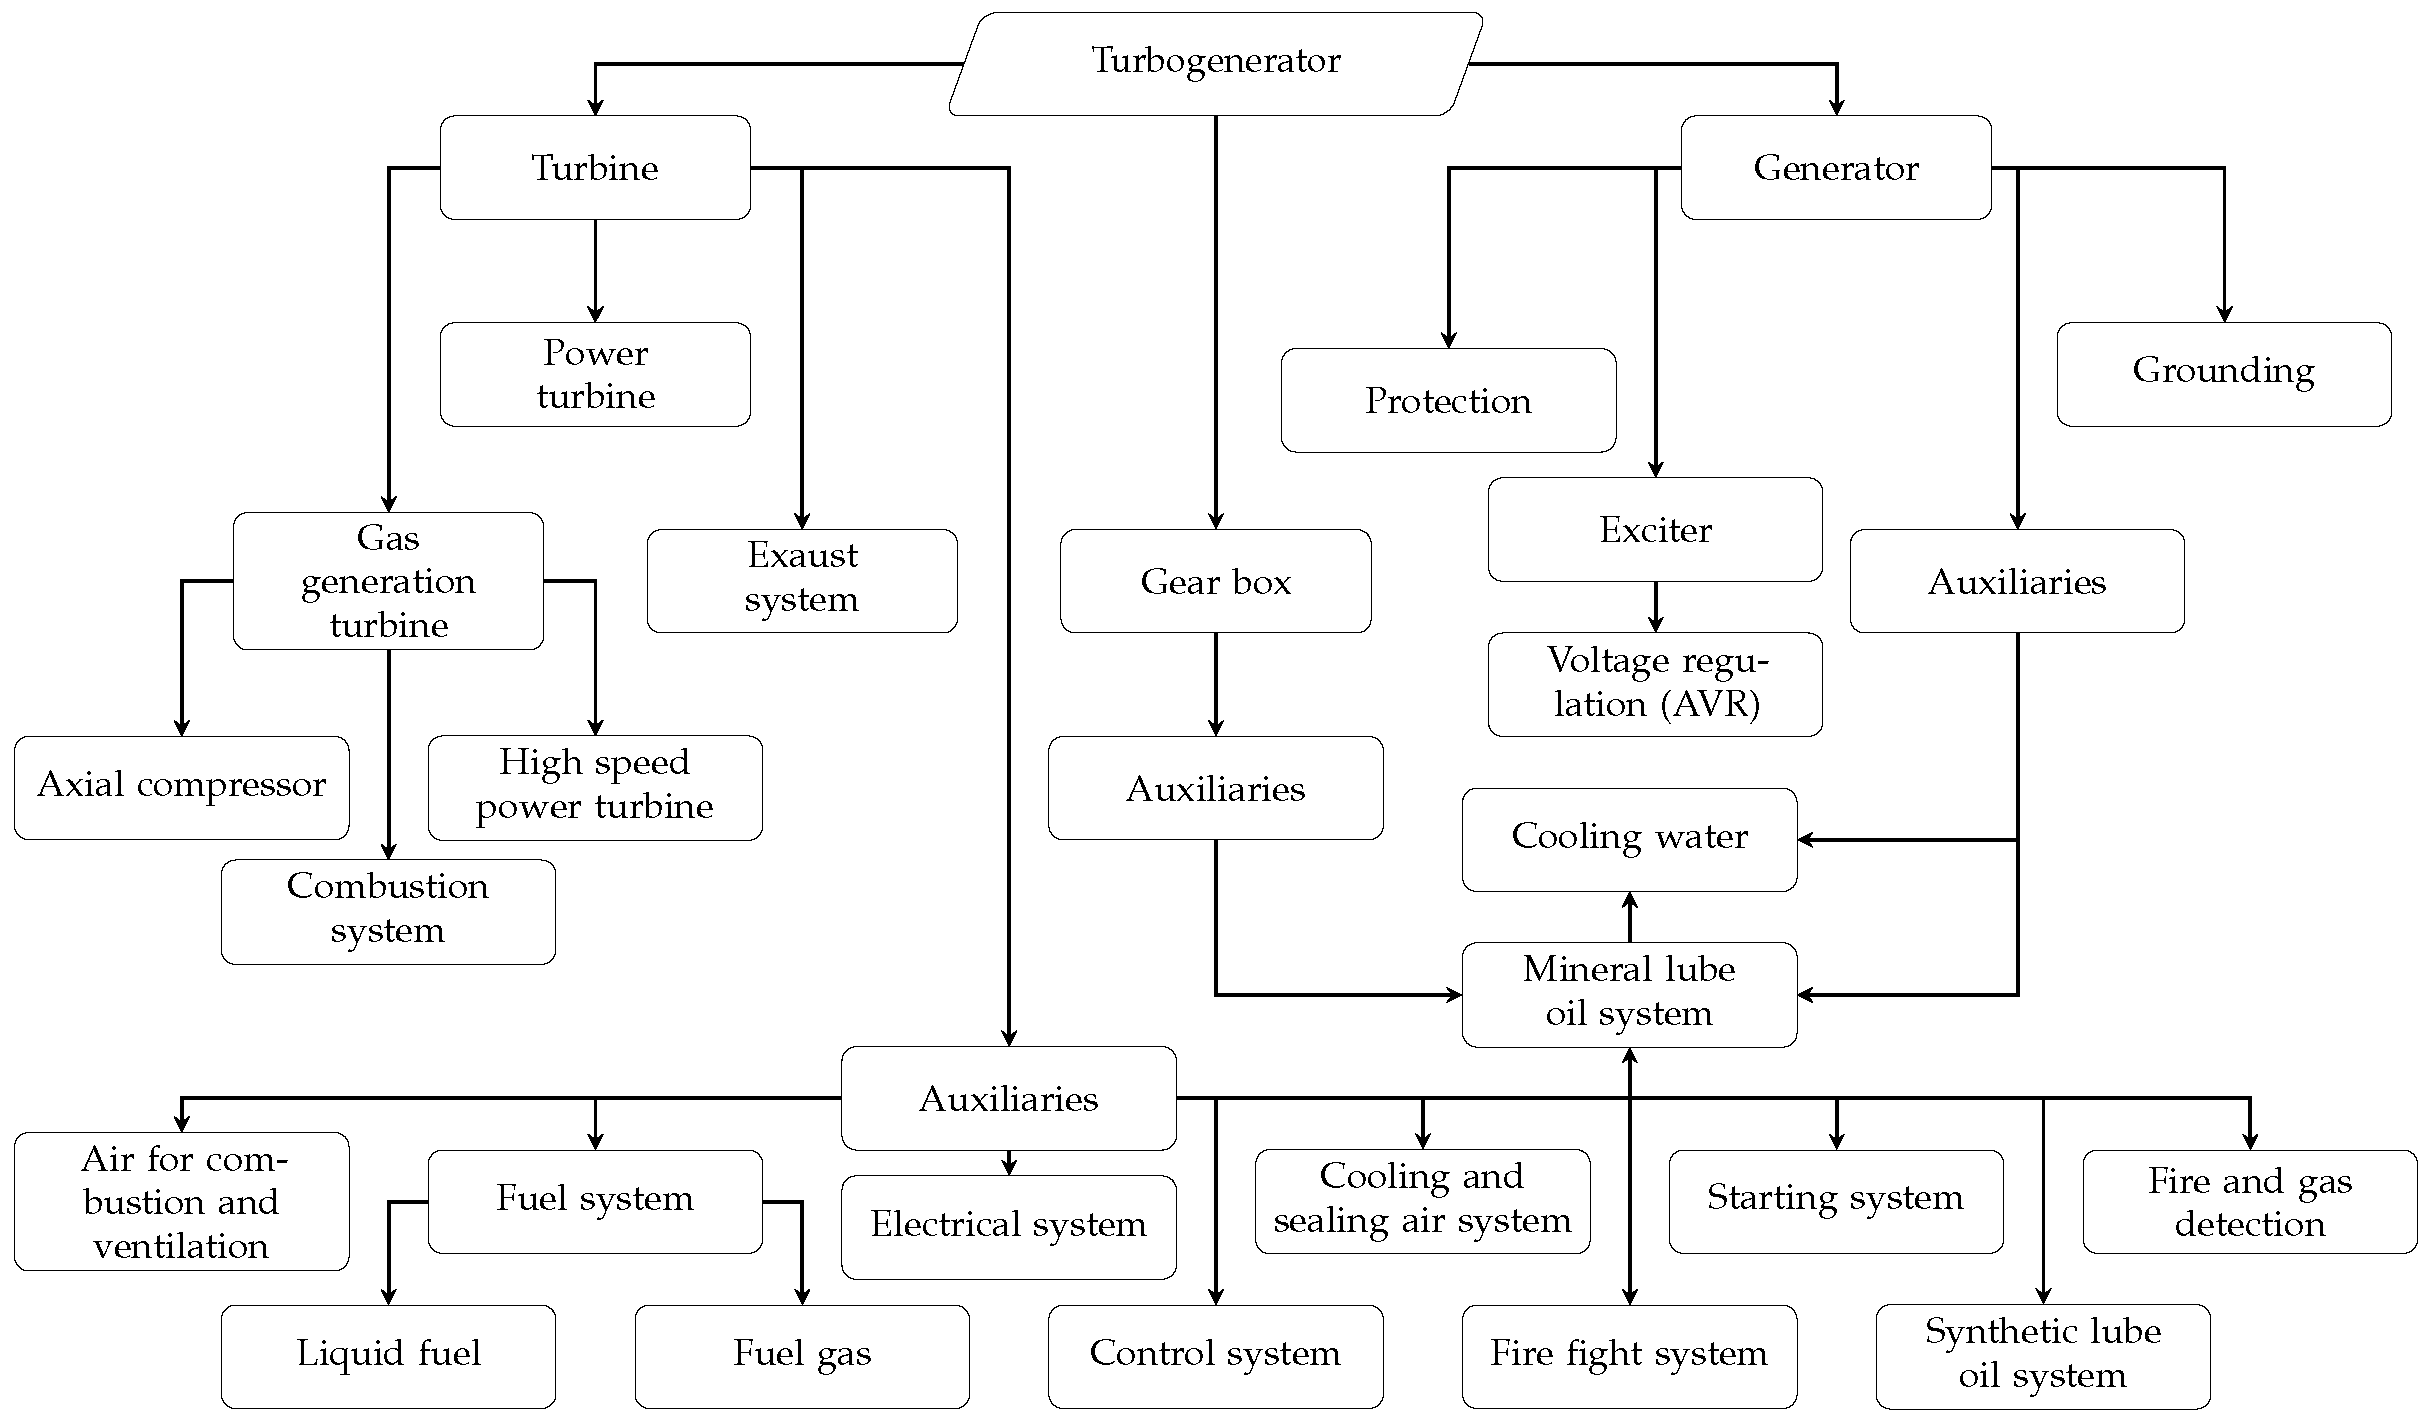
Having the results of the main systems that had an impact on the selected generator’s reliability performance, the next step was to analyze how the turbogenerator’s systems and subsystems relate each other in order to establish an operational priority system to develop the failure diagnosis model.
Figure 3 illustrates the tubogenerator system and subsystem breakdown. As can be seen, the mineral lube oil system influences several parts of the machine, such as the gas turbine, gearbox, and generator. As this system is vital for the turbogenerator operation and is one of the top three issues reported in operation and maintenance records, it was selected as the focus for the failure diagnostic model. The scope of the study expanded to encompass other generator systems as well.
To develop the diagnostic model, it is necessary to first understand the failure modes of the mineral lube oil system. This information can be accessed through the engineering documentation containing the Failure Modes, Effects, and Criticality Analysis (FMECA) [30], where all the failure modes and affected parts of this system are listed. The failure mechanisms and failure modes are then described and codified according to ISO 14224. The effects of the failures are evaluated, and the criticality is defined in order to establish the maintenance and spare parts strategy. Some maintenance strategies include parameter monitoring for failure detection.
Fuzzy models are widely known for their characteristics of being a knowledge-based modeling method that uses semantic descriptions obtained from human operators and/or expert knowledge as model inputs with gradual boundaries rather than discrete numeric ones [31]. This method can be used to incorporate specialist knowledge, such as FMECA, into an AI model.
From the FMECA list, several failures that can be detected through online monitoring were identified, as presented in Table 1, serving as outputs for the fuzzy diagnostic model. Additionally, two other failures were added to the model: mineral lube oil tank vent failure and monitoring sensor failure.
The FMECA also suggests monitoring parameters for condition assessment. These parameters can be gathered through online sensor monitoring, operational route checks, predictive maintenance, or preventive maintenance monitoring. These sensor signals serve as inputs for the fuzzy model, which bridges the gap in the turbogenerator supervisory system by explaining why a generator shifted from “in service” to “forced shutdown”.

2.1.2. Data Understanding

Pressure, temperature and level are the magnitudes that are directly available at sensors of the mineral lube oil system. These sensors monitor certain points of interest of the system to provide information to the turbogenerator’s control and protection systems enabling safe operation of the machine.
For each potential failure mode, a meticulous analysis was conducted using FMECA to identify the sensors capable of detecting specific component-related failures. Notably, not all sensors within the mineral lube oil system were necessary inputs for constructing the model. In instances where FMECA did not cover certain failure modes, the expertise of system specialists was relied upon to select the appropriate set of sensors for detection.
Having established the sensor array based on the system’s mapped failure modes, the subsequent task involves obtaining calibration ranges for each process variable-monitoring sensor to determine the FIS universe variables. Using project documentation such as instrument lists, pipe & instrument diagrams, and electrical diagrams, it is possible to determine the lower and upper limits of each variable that is monitored by the system’s sensors.
The acquisition and processing of data from the monitoring sensors of the machines under study were performed by collecting data from the supervisory system of the production plant where the turbogenerators are installed. This was done using the Python library “pandaspi” which serves as an interface between the Python language and the generator’s supervisory system for raw data acquisition [32] in a data frame format. A data cleaning step was necessary to avoid some missing or unsampled values.
The total data acquisition consisted of 3,112,051 input patterns per attribute, with a total of 13 attributes and a sampling period of 60 s per variable.

2.1.3. Data Preparation and Modeling

Throughout the operation of the turbogenerators, an array of sensors monitors various components of the machines. These sensors are equipped with distinct operational thresholds categorized as normal operation, alarm, and trip ranges.
The normal operation range is comprised between the low and high alarm limits and it is the range where the machine operates under normal conditions.
The alarm range is generally divided into low and high alarm ranges. When a machine’s parameter resides within either of these ranges, the machine retains functionality, although the parameter’s status is no longer considered a normal operating condition and can lead the machine to a failure condition since the parameter is now closer to the trip value, which is the next scale in the trip values.
For the trip range, the same analogy as for the alarm range can be performed. The difference is that the limits of alarm and trip values are different and established by the machine manufacturer in order to protect the machine.
The trip and alarm limits of each input variable were used as parameters for the limits of the membership functions in the FIS model. As not all sensors are designed exclusively for protective measures, but some also serve diagnostic purposes, the configuration of membership function limits requires the expertise of specialists to devise an optimal strategy for the model.
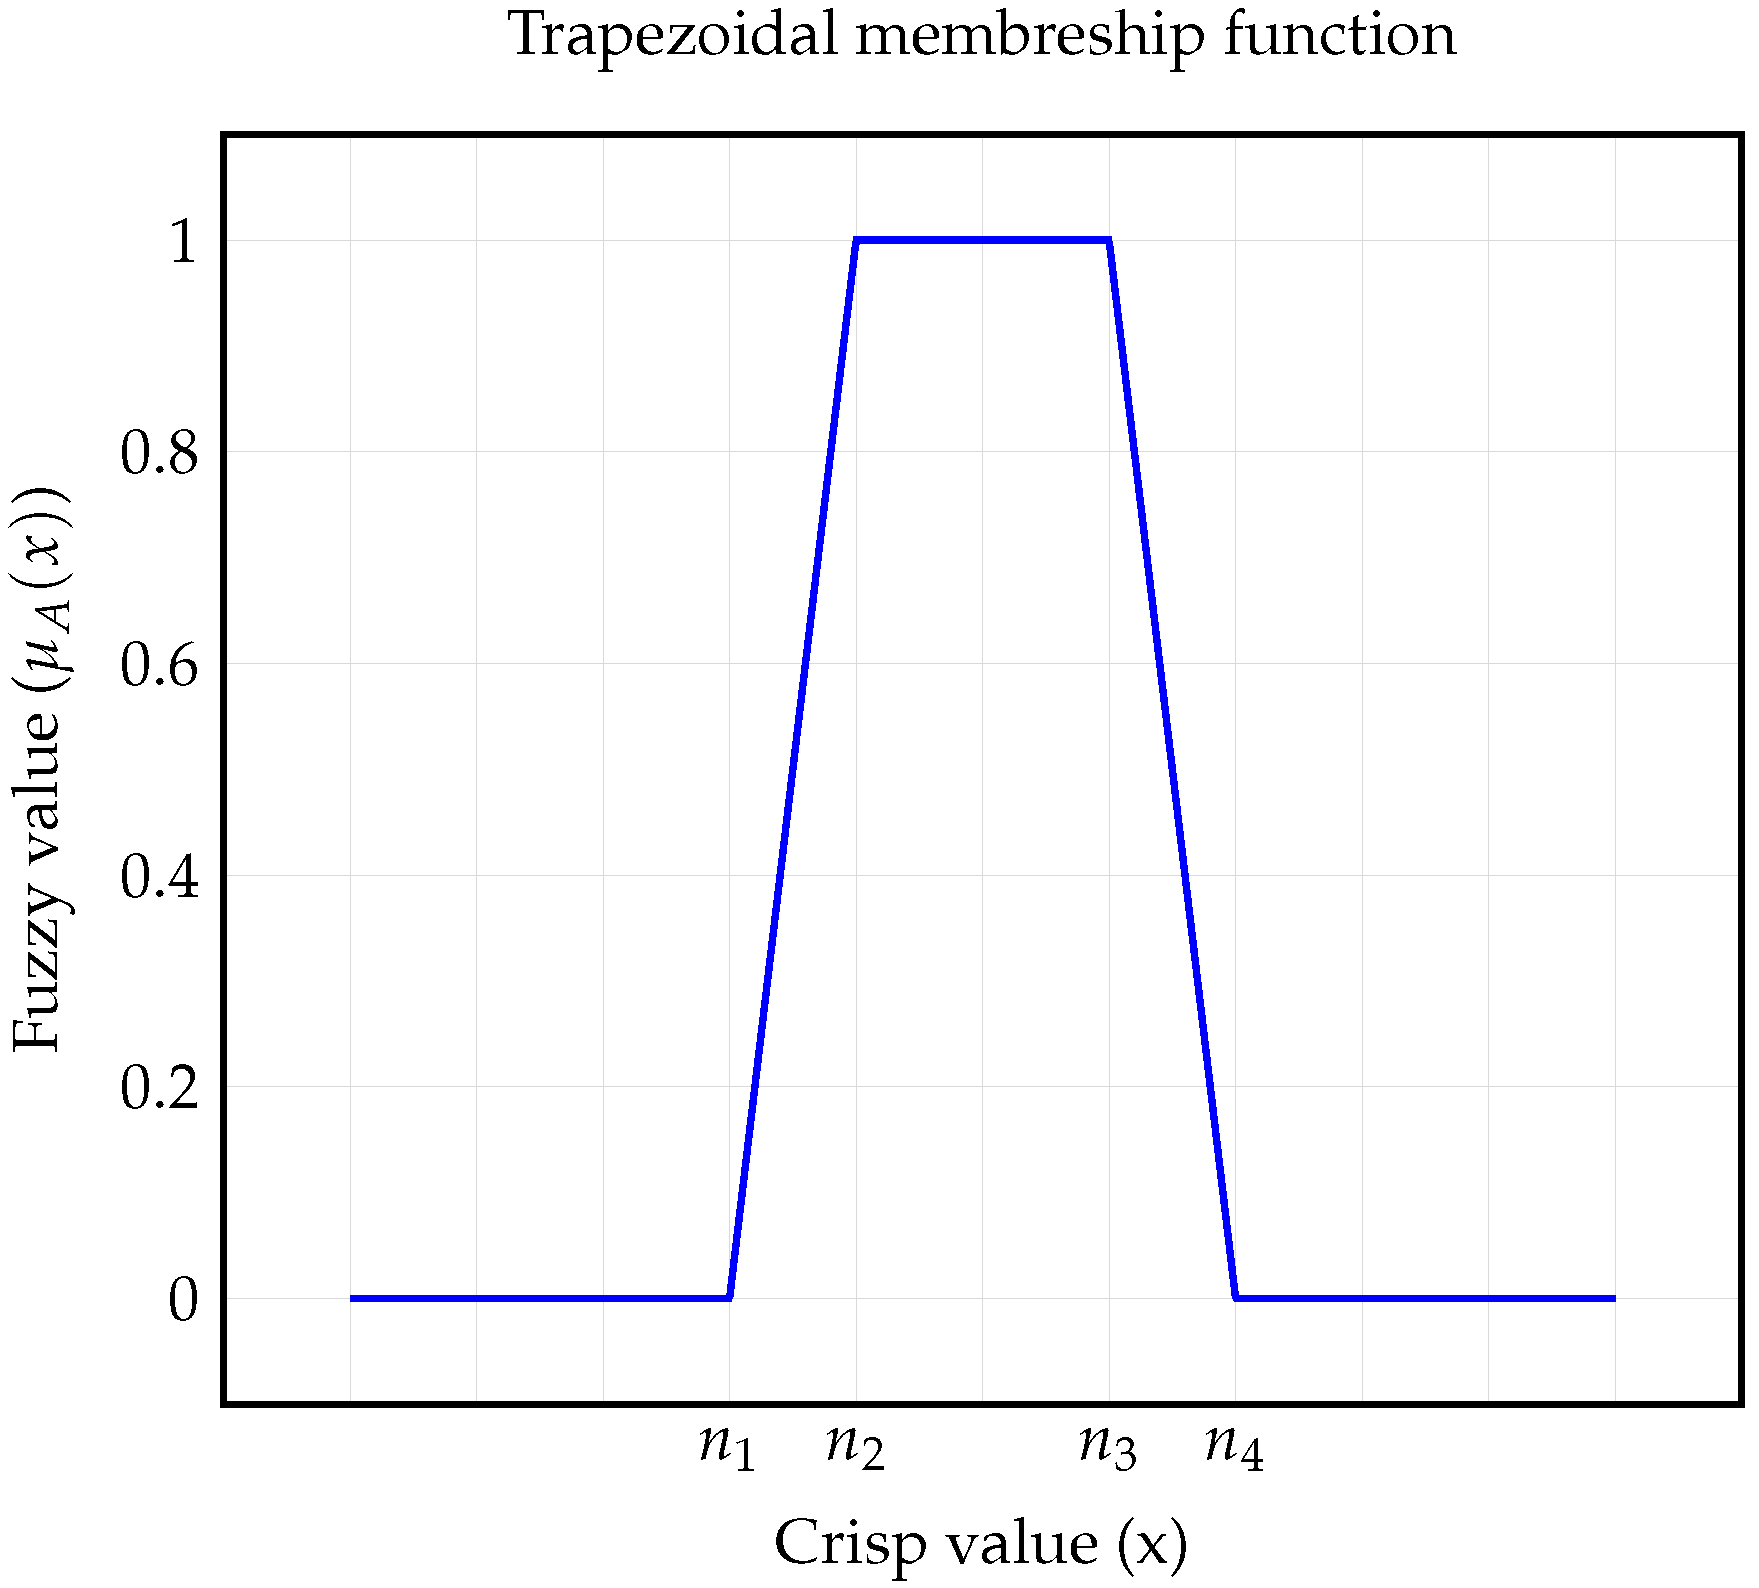
The trapezoidal function was chosen to represent the behavior of the inputs due to its characteristics of high membership in a range of values for the low, medium, and high sensor readings. Equation (1) represents the trapezoidal membership function shown in Figure 4.
μ A ( x ) = 0 , x < n 1 x n 1 n 2 n 1 , n 1 x n 2 1 , n 2 x n 3 x n 4 n 3 n 4 , n 3 x n 4 0 , x > n 4
For sensor readings below n 1 , the membership value to a given fuzzy set is low, resulting in μ A ( x ) = 0 . In the interval n 1 x n 2 , the membership value to a given fuzzy set ranges between “0” and “1”, indicating a weak association to that fuzzy set. The maximum membership value is achieved when the sensor readings fall within the interval defined by n 2 x n 3 . This maximum membership value implies that the crisp value maximizes the membership function. Similar evaluations can be performed for the sensor reading intervals between n 3 x n 4 and x > n 4 . In the first interval, the membership value to a given fuzzy set ranges between “0” and “1”, while in the second interval, the membership value is low, resulting in μ A ( x ) = 0 .
As shown in Figure 1, three fuzzy sets were created for each sensor, where low readings of the sensors indicate that the sensor is measuring a magnitude below its normal operating range. In this case, the flat part of the trapezoidal function represents the readings below the trip value, and the slope of the trapezoidal function decreases from the low trip value to the low alarm value.
Medium readings of a sensor mean that the sensor is operating within its normal range. The flat part of the trapezoidal function represents the normal readings, while the slopes of the trapezoidal function increase from the low trip value to the low alarm value and decrease from the high alarm value to the high trip value.
High readings of a sensor mean that the sensor is measuring a magnitude above its normal operating range. The flat part of the trapezoidal function represents the readings above the trip value, and the slope of the trapezoidal function increases from the high alarm value to the high trip value.
With the creation of each membership function for the three ranges of sensor readings, the fuzzy inputs for the FIS can be generated. The formulation of fuzzy rules is a crucial step that relies on the failure modes of the mineral lube oil system and the interrelationships among measured parameters. In order to establish these relationships between the system’s monitoring variables and identify the affected part in the event of a failure in the mineral oil lubrication system, logical operators, as described in Equations (2)–(5), are employed. This approach is followed by a diagnostic method consistent with FMECA analysis, where the failure classes are based on the machines’ failure modes.
T ( P ¯ ) = 1 T ( P ) ,
T ( P Q ) = max ( T ( P ) , T ( Q ) ) ,
T ( P Q ) = min ( T ( P ) , T ( Q ) ) ,
T ( P Q ) = T ( P ¯ Q ) = max ( T ( P ¯ ) , T ( Q ) ) .
where the operator in Equation (2) is the negation or the inverse of the truth value for a given proposition “P”. The operator in Equation (3) is the logical “or” operator, which is equivalent to the maximum truth value from the evaluations made between the membership functions of propositions “P” and “Q” for each fuzzy set. Equation (4) presents the “and” operator, which is equivalent to the minimum truth value from the evaluations made between the membership functions of propositions “P” and “Q” for each fuzzy set. Finally, Equation (5) presents the implication operator, which represents the “if”/”then” operation.
The created fuzzy rules were based on the processing of natural language processing since the fuzzy inputs defined as low, medium and high sensor’s readings. Table 2 lists each rule created for the FIS relating the input variables to obtain the desired diagnose based on the FMECA documentation.
With fuzzy rules and inputs, FIS engine makes the inferences based on the instantaneous fuzzy input values and generate the fuzzy outputs that need to be defuzzificated to obtain a crisp output. The defuzzification thecnique employed was the centroid, according to the Equation (6), where z * is the crisp output of fuzzy control system (the centroid) and m u c ( z ) is the output membership function and z is the corresponding crisp output value.
z * = μ c ( z ) z , d x μ c ( z ) , d x , for all z X .
For classification purposes the fuzzy outputs were divided in 9 classes as presented in the Table 3. Triangular membership functions were used to transform the fuzzy outputs in crisp outputs in the FIS. Each triangular membership function had its peak on the central value of the corresponding crisp output range and the triangle base was defined between the crisp output range.
For the creation of the fuzzy inference system, an algorithm was developed in Python. The library “scikit-fuzzy” was used in this implementation, considering that it has the necessary functions for the development of applications in fuzzy logic, for the chosen programming language. The ”Antecedent” function of the “Control” module in this library was used to create the antecedent sets, which are the functions that are activated by the input values of each variable. Similarly, the ”Consequent” function was used to create the consequent memberships of the fuzzy inference system.
The “Rule” function from the “Control” module was employed to establish the rules to be applied to the preceding data points. To enhance the classification method, two stages of fuzzy inference were developed. In the initial stage, an evaluation is conducted to determine if the system is operating in a healthy or faulty state. If a fault is detected, the subsequent step involves identifying the specific type of failure present in the system.
The “ControlSystem” and “ControlSystemSimulation” functions were used to define the relationships between the created rules and perform the calculation of the fuzzy output of the inference systems. The function “Compute” was then used to calculate the output of the fuzzy inference system given a set of inputs.
The functions “trapmf” and “trimf”, which also belong to the library “scikit-fuzzy”, were used for creating the membership functions of the inference model, where the parameters for those functions were established in accordance with the defined limits of the inputs and outputs.
To enhance the performance of the classification model and minimize computational processing, the first step is to evaluate whether the system is in a healthy or faulty state. If the system is in a faulty state, the failures are classified based on Table 3. Since multiple failures can occur simultaneously, the algorithm is designed to handle this condition. The same set of rules was utilized for both detecting system faults and diagnosing failures.
A flow diagram depicting the FIS algorithm is presented in Figure 5. The algorithm begins by acquiring data from the dataset and passing it through a data cleaning stage. Next, the algorithm creates the universe variables based on the calibration ranges of the sensors, followed by the creation of input membership functions based on the limits of the input variables. Rules are then created using logical operations to establish relationships between system variables, based on the failure modes defined in the FMECA. Subsequently, output memberships are created to facilitate the diagnosis of failures.
During the inference phase, the FIS engine iteratively processes each input variable and rule, taking into account their interactions and combining the results to generate the final output. If normal operation is detected, no classification is made, and the algorithm proceeds to process the next sample. However, if a failure is detected during the inference phase, a more detailed failure classification is performed to determine which failure(s) occurred at the given time. The failure(s) are then classified, and an output of the model is generated.

2.1.4. Evaluation

The main objective of evaluating the performance of the failure classification model is to identify the percentage of correct and incorrect classifications made by the algorithm.
The performance criteria established for this model was the percentage of correct and incorrect diagnoses, as stated below:
  • True Positive (TP): percentage of fault diagnoses that were correct;
  • True Negative (TN): percentage of normal operations diagnoses that were correct;
  • False Positive (FP): percentage of normal operations diagnoses that were incorrect;
  • False Negative (FN): percentage of fault diagnoses that were incorrect;
In the context of failure classification, the presence of an unbalanced data set is a prevalent occurrence. This disparity stems from the anticipation that occurrences of equipment failures will inherently be outnumbered by instances of normal operation. As a consequence, relying solely on conventional classification performance metrics—such as accuracy, precision, recall, and F1 score—can potentially lead to misleading interpretations regarding the efficacy of the model.

3. Results

In this section, the results obtained are presented and analyzed. Initially, an evaluation was carried out using the fuzzy inference algorithm for the period from 1 January 2019 until 31 December 2022 for all the four system turbogenerators in the system. To reduce the computational effort, the evaluation of monitoring data was confined to months during which maintenance requests or reported events concerning the mineral lube oil system were registered.
The list of sensors used for monitoring the system is provided in Table 4. The lower and upper limits of the system’s variables determine the boundaries for the universe of variables in the FIS.
Table 5 presents the operational limits for each measured variable. Input values equal to or lower than the “low low” limit, or equal to or higher than the “high high” limit, indicate a fault condition in the machine. The ”low low” and “high high” limits represent the values n 1 and n 4 in Equation (1), respectively. Therefore, the alarm ranges are set between the “low low” and “low” limits, as well as between the “high high” and “high” limits. The ”low” and “high” limits correspond to the values n 2 and n 3 in Equation (1), respectively.
By loading the variables and defining membership functions based on the limits specified in Table 4 and Table 5, the process of fuzzifying inputs within the fuzzy controller component is established. Additionally, by specifying the fuzzy controller outputs in accordance with the guidelines presented in Table 3 and using rule definitions based on expert knowledge, utilizing the relationships defined in Equations (2)–(4) to operationalize the rule-based model, the model is prepared for the execution of the inference models defined by Equation (5) using the collected data. This ultimately results in outputs that classify events based on the model’s output, which are defuzzified based on the method defined in Equation (6).
This study harnessed operational data from a real power system installed within an FPSO platform. Over a span of three years, the data encompassed the functioning of four turbogenerators, encapsulating a substantial 3,112,051 input values per variable. In total, these inputs tallied up to 40,456,663, as illustrated in Table 6, which presents a comprehensive overview of the model’s performance metrics. This table presents the number of outputs that classified a faulty value, which was 8665. This represents 31 failures or 31 instances where the system’s generators transitioned from a healthy state to a failure state.
For the classified failures the model could classify correctly 23 failures and other 8 were wrongly classified as a failure or a failure classified with a different class.
The overall performance of the model in terms of correct classification is given in Table 7, where all the performance metrics defined for the model are calculated based on the output of the model, which is compared with the Machine Event Log (MEL). The MEL is the main source of information currently used to register all events related to the machines, and the plant information data is used to confirm if the model output was correct.
As expected, not all of the model’s mapped failures occurred in the system during the evaluation period. These metrics are related to the following failures that were classified by the model:
  • Filters clogging—5 events;
  • Heat exchanger or TCV fault—12 events;
  • Oil mist eliminator failure—6 events;
  • Mineral oil manifold temperature transmitter spread measurement—5 events;
  • Mineral lube oil tank level low—2 events;

4. Discussion

Looking at the MEL, it is possible to identify that there were 5 records of machines in the service state that were forced out in a period of need state. In 4 cases, the model could successfully diagnose the failures, and in one case, the model classified the failure as a normal operational case. In those cases, a failure diagnosis system could reduce machine downtime, consequently increasing the overall platform’s production availability.
The misclassified class was “Mineral lube oil leakage”, and for this class, it is better suited for significant leakages, since small leakages may not generate a pressure loss in the system that can result in failure detection based on the currently established rules. In any case, the non-detection was considered a misclassification.
There were 26 failures that were classified by the model but not reported by the operators at the MEL. From those failures, 7 were classified with the wrong class as follows:
  • Heat exchanger or TCV fault—1 event;
  • Mineral oil manifold temperature transmitter spread measurement—5 events;
  • Mineral lube oil tank level low—1 event;
The misclassification occurred in the case of the class “Heat exchanger or TCV fault”, which occurred just after an external trip that was not caught by the model.
The model’s classification of the “Mineral oil manifold temperature transmitter spread measurement” failure was deemed inaccurate, as no discernible spread was detected among the mineral oil manifold temperature transmitter sensors. This discrepancy arose from the temporal gap in temperature sensor responses when there are abrupt fluctuations in lube oil temperature. This results in a transient spread between the sensors, a phenomenon that must be accounted for in refining the model. Interestingly, while this characteristic presents a challenge for failure diagnosis, it can potentially be leveraged as an advantage in a future prediction algorithm. In certain scenarios, this temporary spread occurs roughly two minutes before the mineral lube oil heat exchangers experience elevated temperatures.
In the case of the misclassification of the failure “Mineral lube oil tank level low”, it happened during a thermal event that melted the sensor’s cables. The event was observed by the operators on 28 February 2022, at 14:32, but the model was reporting issues with the mineral lube oil level since 28 February 2022, at 10:21, with reports of issues at 11:26 of mineral lube oil filters clogging and several reports of mineral lube oil tank level low and mineral lube oil filters clogging until the machine was manually stopped due to a thermal event caused by overheating at the mineral lube oil pump bearing. No failures were detected in the mineral lube oil pump since it kept pumping, and its pressure was normal.
The consequences of the thermal event that occurred on 28 February 2022, could be mitigated with the use of the proposed failure diagnosis, as it would have warned the generator’s operator to check what was happening with the machine, making the issue visible for the operator during the verification moment, preventing further damage escalation.

5. Conclusions

In this paper, a fuzzy inference system was developed and used to perform fault diagnosis on a turbogenerator power system composed of four machines of the same model. The results demonstrate that the model successfully classified the failures reported by the operators in 4 out of 5 cases. The model achieved a good classification performance with a percentage of 98.35% of correct failure diagnoses considering all the failures identified by the model. Some events classified by the model were not reported in the Machine Event Log (MEL) by the operators. This highlights the potential of the model to automate the process of operational registers.
In many cases, the operation and maintenance teams spend their time recording faults manually, which can lead to errors due to incorrectly filled-in information, missing information, or even the absence of any occurrence record. The fault diagnosis system proposed here performs the classification of faults that occurred in the equipment, providing the date and time information of the events, making the MEL unnecessary to be manually filled. This provides a more accurate reliability data for the machines and provides maintenance engineering with better data for their fault prevention strategies.
The creation of the universe variables for this model was based on the instruments’ calibration range, as this is the range where valid readings are obtained for the sensors. This ensures that the model has correct information about the reading variables, which improves the model’s accuracy.
The essence of effective fault diagnosis using fuzzy inference systems (FIS) hinges on mapping all potential failure modes within the system and establishing intricate relationships between process variables and their operational limits. Achieving this symbiosis demands a comprehensive establishment of rules within the model, where specialized knowledge plays a paramount role. Failure Mode, Effect, and Criticality Analysis (FMECA) emerges as a pivotal tool for codifying failure modes per ISO 14224 and standardizing specialist knowledge.

Future Works

FIS needs no training data set or a training stage is required; on the other hand, it is highly dependent on the correct variables operational limits definition. Consequently, it needs to create rules that represent the real behavior of the system and the classification criteria on the consequent part of FIS model. Thus, in cases where the rules to be generated for the fuzzy inference system are not explicit, other models should be evaluated.
As real data was used in this work and not all the failure modes that the model classifies could be verified, it is suggested as future work to simulate the other failures modes not verified with the current data.

Author Contributions

Conceptualization, P.F.C., G.R.S.d.L., P.B.V. and E.G.d.C.; methodology, P.F.C., G.R.S.d.L. and P.B.V.; data acquisition and simulations, P.F.C.; validation, P.F.C., G.R.S.d.L., P.B.V., E.G.d.C. and F.B.S.C.; writing—original draft preparation, P.F.C., G.R.S.d.L., P.B.V., E.G.d.C. and F.B.S.C.; writing—review and editing, P.F.C., G.R.S.d.L., P.B.V., E.G.d.C. and F.B.S.C. All authors have read and agreed to the published version of the manuscript.

Funding

The authors would like to thank Petróleo Brasileiro S.A. for the funding to this work. The funding sponsor had no role in the design of the study; in the collection, analyses, or interpretation of data; in the writing of the manuscript, and in the decision to publish the results.

Data Availability Statement

The data presented in this study are available on request from the corresponding author. The data are not publicly available due to administrative approvals and compliance checks.

Acknowledgments

The authors would like to thank Petróleo Brasileiro S.A. to the access to the data utilized and for the financial support to the development of this work. The authors also would like to thank Federal University of Campina Grande (UFCG) and Federal University of Paraíba (UFPB) for the support to this work.

Conflicts of Interest

Author Patricio F. Castro is employed by the company Petróleo Brasileiro S.A. The remaining authors declare that the research was conducted in the absence of any commercial or financial relationships that could be construed as a potential conflict of interest.

Abbreviations

The following abbreviations are used in this manuscript:
AIArtificial Intelligence
ANFISartificial neural fuzzy inference system
ANNartificial neural network
BPDBarrels Per Day
CNCComputer Numerical Control
FISFuzzy Inference System
FMECAFailure Modes, Effects, and Criticality Analysis
FPSOFloating Production Storage and Offloading
MTTRMean Time to Repair
NFSNeuro-fuzzy systems

References

  1. Pare, V. New Petrobras FPSO Contracts in October. Available online: https://brazilenergyinsight.com/2019/09/23/new-petrobras-fpso-contracts-in-october/ (accessed on 30 August 2023).
  2. Petrobras Orders Giant $2.9B FPSO from Keppel. Available online: https://www.oedigital.com/news/498726-petrobras-orders-giant-2-9b-fpso-from-keppel (accessed on 30 August 2023).
  3. Guan, J.; Du, W.; Wang, X.; Luo, X.; Liu, X.; Li, X. A Reliability Evaluation Method for Independent Small Offshore Electric Systems. Energies 2021, 14, 3035. [Google Scholar] [CrossRef]
  4. Musarra, S.P. FPSO Market Forecast. Available online: https://www.oedigital.com/news/455011-fpso-market-forecast (accessed on 30 August 2023).
  5. Vollet, C.; Angays, P.; De Oliveira, A.; Grandperrin, P. FPSO Electrical Network Optimization for Significant Savings: Where Lies the Cost? In Proceedings of the 2017 Petroleum and Chemical Industry Conference Europe (PCIC Europe), Vienna, Austria, 16–18 May 2017; pp. 1–9. [Google Scholar] [CrossRef]
  6. Mohammadpoor, M.; Torabi, F. Big Data analytics in oil and gas industry: An emerging trend. Petroleum 2020, 6, 321–328. [Google Scholar] [CrossRef]
  7. Attri, V.; Batra, I.; Malik, A. A Relative Study on Analytical Models. In Proceedings of the 2021 2nd International Conference on Intelligent Engineering and Management (ICIEM), London, UK, 28–30 April 2021; pp. 52–57. [Google Scholar] [CrossRef]
  8. Kari, T.; Gao, W.; Zhao, D.; Zhang, Z.; Mo, W.; Wang, Y.; Luan, L. An integrated method of ANFIS and Dempster-Shafer theory for fault diagnosis of power transformer. IEEE Trans. Dielectr. Electr. Insul. 2018, 25, 360–371. [Google Scholar] [CrossRef]
  9. Xu, G.; Liu, M.; Wang, J.; Ma, Y.; Wang, J.; Li, F.; Shen, W. Data-Driven Fault Diagnostics and Prognostics for Predictive Maintenance: A Brief Overview. In Proceedings of the 2019 IEEE 15th International Conference on Automation Science and Engineering (CASE), Vancouver, BC, Canada, 22–26 August 2019; pp. 103–108. [Google Scholar] [CrossRef]
  10. Sundaram, K.M.; Hussain, A.; Sanjeevikumar, P.; Holm-Nielsen, J.B.; Kaliappan, V.K.; Santhoshi, B.K. Deep Learning for Fault Diagnostics in Bearings, Insulators, PV Panels, Power Lines, and Electric Vehicle Applications—The State-of-the-Art Approaches. IEEE Access 2021, 9, 41246–41260. [Google Scholar] [CrossRef]
  11. Tran, M.Q.; Elsisi, M.; Liu, M.K. Effective feature selection with fuzzy entropy and similarity classifier for chatter vibration diagnosis. Measurement 2021, 184, 109962. [Google Scholar] [CrossRef]
  12. Pei, M.; Zhang, C.; Hu, M.; Jackson, L.; Mao, L. A Fuzzy Logic-based Method for Proton Exchange Membrane Fuel Cell Fault Diagnosis. In Proceedings of the 2020 International Conference on Sensing, Measurement Data Analytics in the era of Artificial Intelligence (ICSMD), Xi’an, China, 15–17 October 2020; pp. 1–6. [Google Scholar] [CrossRef]
  13. Karnavas, Y.L.; Chasiotis, I.D.; Vrangas, A. Fault diagnosis of squirrel-cage induction motor broken bars based on a model identification method with subtractive clustering. In Proceedings of the 2017 IEEE 11th International Symposium on Diagnostics for Electrical Machines, Power Electronics and Drives (SDEMPED), Tinos, Greece, 29 August–1 September 2017; pp. 304–310. [Google Scholar] [CrossRef]
  14. Barbosa, V.R.N.; Lira, G.R.S.; Dias, M.B.B.; Costa, E.G. Estimation of Metal Oxide Surge Arresters’ Useful Life Based on Time Series Forecasts. IEEE Trans. Power Deliv. 2022, 37, 842–850. [Google Scholar] [CrossRef]
  15. Forouhari, S.; Abu-Siada, A. Application of adaptive neuro fuzzy inference system to support power transformer life estimation and asset management decision. IEEE Trans. Dielectr. Electr. Insul. 2018, 25, 845–852. [Google Scholar] [CrossRef]
  16. Zhang, B.; Sun, C.; Ou, J.; Hu, X.; Zhou, Y. A new method of diagnosing turbogenerator’s vibration fault based on fuzzy clustering analysis and wavelet packets transform. In Proceedings of the ICEMS’2001: Fifth International Conference on Electrical Machines and Systems (IEEE Cat. No.01EX501), Shenyang, China, 18–20 August 2001; Volume 1, pp. 339–342. [Google Scholar] [CrossRef]
  17. Yang, P.; Wang, Q.m. Fault Diagnosis System for Turbo-Generator Set Based on Fuzzy Neural Network. In Proceedings of the 16th International Conference on Artificial Reality and Telexistence–Workshops (ICAT’06), Hangzhou, China, 29 November–1 December 2006; pp. 228–231. [Google Scholar] [CrossRef]
  18. Yang, P.; Zhang, Z. Fault Diagnosis System for Turbo-Generator Set Based on Self-Organized Fuzzy Neural Network. In Proceedings of the 2008 Second International Conference on Future Generation Communication and Networking Symposia, Hinan, China, 13–15 December 2008; Volume 4, pp. 78–84. [Google Scholar] [CrossRef]
  19. Huaying, W.; Guangjian, W. Application of Wavelet Transform and Fuzzy Theory for Turbo-Generator Fault Mode Classification. In Proceedings of the 2007 8th International Conference on Electronic Measurement and Instruments, Xi’an, China, 16–18 August 2007; pp. 3-442–3-445. [Google Scholar] [CrossRef]
  20. Mousavi, M.; Chaibakhsh, A.; Jamali, A.; Kordestani, M.; Saif, M. A New Fault Diagnosis Approach for Heavy-Duty Gas Turbines. IEEE/ASME Trans. Mechatron. 2022, 27, 3339–3349. [Google Scholar] [CrossRef]
  21. Li, X.; Zhang, W. Deep Learning-Based Partial Domain Adaptation Method on Intelligent Machinery Fault Diagnostics. IEEE Trans. Ind. Electron. 2021, 68, 4351–4361. [Google Scholar] [CrossRef]
  22. Gao, W.; Qiao, S.P.; Wai, R.J.; Guo, M.F. A Newly Designed Diagnostic Method for Mechanical Faults of High-Voltage Circuit Breakers via SSAE and IELM. IEEE Trans. Instrum. Meas. 2021, 70, 1–13. [Google Scholar] [CrossRef]
  23. Wanderley Neto, E.T.; da Costa, E.G.; Maia, M.J.A. Artificial Neural Networks Used for ZnO Arresters Diagnosis. IEEE Trans. Power Deliv. 2009, 24, 1390–1395. [Google Scholar] [CrossRef]
  24. Lira, G.R.S.; Costa, E.G.; Almeida, C.W.D. Self-organizing maps applied to monitoring and diagnosis of ZnO surge arresters. In Proceedings of the 2010 IEEE/PES Transmission and Distribution Conference and Exposition: Latin America (T&D-LA), Sao Paulo, Brazil, 8–10 November 2010; pp. 659–664. [Google Scholar] [CrossRef]
  25. Zhang, J.; Tian, J.; Alcaide, A.M.; Leon, J.I.; Vazquez, S.; Franquelo, L.G.; Luo, H.; Yin, S. Lifetime Extension Approach Based on the Levenberg–Marquardt Neural Network and Power Routing of DC–DC Converters. IEEE Trans. Power Electron. 2023, 38, 10280–10291. [Google Scholar] [CrossRef]
  26. Castro, P.F.; Rodriguez, Y.P.M.; Carvalho, F.B.S. Application of Generation Adequacy Analysis for Reliability Evaluation of a Floating Production Storage and Offloading Platform Power System. Energies 2022, 15, 5336. [Google Scholar] [CrossRef]
  27. Tanscheit, R. Sistemas Fuzzy; Departamento de Engenharia Elétrica, Pontifícia Universidade Católica do Rio de Janeiro: Rio de Janeiro, Brazil, 2004; pp. 338–353. [Google Scholar]
  28. Ispirli, M.M.; Adali, H.; Kalenderli, Ö.; Celik, M.Z.; Oral, B. Application and Comparative Analysis of Fuzzy Inference System for Transformer Fault Diagnosis with Dissolved Gases in Oil. In Proceedings of the 2021 3rd International Conference on High Voltage Engineering and Power Systems (ICHVEPS), Bandung, Indonesia, 5–6 October 2021; pp. 187–190. [Google Scholar] [CrossRef]
  29. Choi, J.; O’Keefe, K.; Baruah, P. Nonlinear system diagnosis using neural networks and fuzzy logic. In Proceedings of the [1992 Proceedings] IEEE International Conference on Fuzzy Systems, San Diego, CA, USA, 8–12 March 1992; pp. 813–820. [Google Scholar] [CrossRef]
  30. ISO 14224:2006; Petroleum, Petrochemical and Natural Gas Industries—Collection and Exchange of Reliability and Maintenance Data for Equipment. International Organization for Standardization: Geneva, Switzerland, 2006.
  31. Ouellet, V.; Mocq, J.; El Adlouni, S.E.; Krause, S. Improve performance and robustness of knowledge-based FUZZY LOGIC habitat models. Environ. Model. Softw. 2021, 144, 105138. [Google Scholar] [CrossRef]
  32. de Menezes, D.Q.F.; de Sá, M.C.C.; Fontoura, T.B.; Anzai, T.K.; Diehl, F.C.; Thompson, P.H.; Pinto, J.C. Modeling of Spiral Wound Membranes for Gas Separations—Part II: Data Reconciliation for Online Monitoring. Processes 2020, 8, 1035. [Google Scholar] [CrossRef]
Figure 1. Operating variables limits of the mineral oil system. Reference: Prepared by the Author.
Energies 17 00392 g001
Figure 2. Methodologyapplied in the FIS. Reference: Prepared by the Author.
Energies 17 00392 g002
Figure 3. Turbogenerator systems and subsystems. Reference: Prepared by the Author.
Energies 17 00392 g003
Figure 4. Typical sensor membership function curve. Reference: Prepared by the Author.
Energies 17 00392 g004
Figure 5. Overall flow diagram of FIS algorithm. Reference: Prepared by the Author.
Energies 17 00392 g005
Table 1. Mineral lube oil affected component and failure modes.
Affected ComponentFailure Mode
Mineral lube oil pumpInternal wear out
Auxiliary mineral lube oil pumpInternal wear out
Mineral lube oil pipeConnections loosening/rupture
Mineral lube oil filtersClogging
Heat exchangersObstruction/plates contamination
Temperature control valves (TCV)Sticking/loss of seal
Mineral lube oil tank ventObstruction/oil mist failure
Redundant sensorsSpread measurements
Reference: Prepared by the Author.
Table 2. SIF rules for mineral oil system fault diagnosis.
RuleDiagnose
If: pressure on mineral lube oil manifold sensor A is low and on sensor B is low and on mineral lube oil pumps discharge is lowThen check for: failure in mineral/auxiliary lube oil pumps
If: pressure on mineral lube oil manifold sensor A is low and on sensor B is low and (pressure on mineral lube oil pumps discharge is medium or high)   Then check for: Connections loosening/rupture in mineral lube oil pipes
If: filter differential pressure is highThen check for: filters clogging
If: temperature on mineral lube oil manifold sensor A is high and on sensor A is high and (temperature on cooling water manifold is low or medium) and (pressure on cooling water manifold is medium or high)  Then check for: heat exchanger obstruction/plates contamination or TCV sticking
If: mineral lube oil tank differential pressure on sensor A is high and on sensor B highThen check for: Obstruction/oil mist failure
If: (Sensor A is low value and (Sensor B is medium or high value)) or (Sensor A high value and (sensor B is low or medium value)) or (sensor B is low value and (sensor A is medium or high value)) or (sensor B high value or (sensor A is low or medium value))Then check for: Spread measurements on sensors
Reference: Prepared by the Author.
Table 3. Mineral lube oil crisp outputs.
FailureCrisp Output Range
Mineral lube oil/auxiliary lube oil pumps failure0 to 10
Mineral lube oil leakage10 to 20
Filters clogging20 to 30
Heat exchanger or TCV fault30 to 40
Oil mist eliminator failure40 to 50
Differential tank pressure transmitter spread measurement50 to 60
Mineral oil manifold temperature transmitter spread measurement60 to 70
Mineral oil manifold pressure transmitter spread measurement70 to 80
Mineral lube oil tank level low80 to 90
Normal operation90 to 100
Reference: Prepared by the Author.
Table 4. Variables monitored in the mineral oil system.
SensorDescriptionLower LimitUpper Limit
LIT-511Mineral lube oil level tank143 mm1113 mm
TIT-558AMineral oil tank temperature−50 °C130 °C
PDIT-555-AMineral oil tank differential Pressure−10 mbar10 mbar
PDIT-555-BMineral oil tank differential Pressure−10 mbar10 mbar
PIT-548-AMineral oil header pressure0 bar2.5 bar
PIT-548-BMineral oil header pressure0 bar2.5 bar
TE-559-AMineral oil temperature−50 °C130 °C
TE-559-BMineral oil temperature−50 °C130 °C
PDIT-556Mineral lube oil filters differential pressure0 bar4 bar
PDIT-556Overhead accumulation pipe pressure0 bar4 bar
PIT-562Mineral lube oil pumps discharge pressure0 bar10 bar
PIT-5124018Cooling water header pressure0 bar800 kPa
TIT-5124009Cooling water header temperature−20 °C80 °C
Reference: Prepared by the Author.
Table 5. Mineral lube oil system crsip inputs limits.
VariableLow LowLowHighHigh High
LIT-511540 mm724 mm774 mm887 mm
TIT-558A0 °C20 °C80 °C90 °C
PDIT-555-A−1.0 mbar0 mbar3.9 mbar4.9 mbar
PDIT-555-B−1.0 mbar0 mbar3.9 mbar4.9 mbar
PIT-548-A0.9 bar1.4 bar1.7 bar2.5 bar
PIT-548-B0.9 bar1.4 bar1.7 bar2.5 bar
TE-559-A0 °C20 °C65 °C70 °C
PDIT-556−1 bar0 bar1 bar2 bar
PDIT-5560 bar0.5 bar1 bar1.5 bar
PIT-5620 bar5 bar7.3 bar9 bar
PIT-51240180 kPa427 kPa487 kPa634 kPa
TIT-51240090 °C20 °C45 °C60 °C
Table 6. FIS model overall metrics.
Evaluation Period1 January 2019 to 31 December 2022
Generators evaluatedA/B/C/D
N° of input patterns per attribute3,112,051
N° of attributes13
N° of outputs with faulty values8665
N° of not detected failures1
N° of detected failures31
N° of correct diagnostics23
N° of incorrect diagnostics8
Table 7. FIS model overall evaluation.
CriteriaPercentage
TP98.35%
TN99.99%
FP1.65%
FN0.00%
Disclaimer/Publisher’s Note: The statements, opinions and data contained in all publications are solely those of the individual author(s) and contributor(s) and not of MDPI and/or the editor(s). MDPI and/or the editor(s) disclaim responsibility for any injury to people or property resulting from any ideas, methods, instructions or products referred to in the content.

