Article

Dynamic of H2NG in Distribution Systems

by
Cristian Nicolae Eparu
1,
Doru Bogdan Stoica
1,
Adrian Neacsa
2,3,*,
Renata Radulescu
1,
Dragos Chiritescu
4,
Alina Petronela Prundurel
1 and
Bogdan Ionete
5
1
Well Drilling, Extraction and Transport of Hydrocarbons Department, Petroleum-Gas University of Ploiesti, 100680 Ploiesti, Romania
2
Mechanical Engineering Department, Petroleum-Gas University of Ploiesti, 100680 Ploiesti, Romania
3
School of Advanced Studies of the Romanian Academy (SCOSAAR), 010071 Bucharest, Romania
4
Group for Capital Construction, NIS Petrol SRL, 300668 Timisoara, Romania
5
Development Business Unit Well Delivery Department, OMV Petrom S.A., 013329 Bucharest, Romania
*
Author to whom correspondence should be addressed.
Energies 2024, 17(2), 391; https://doi.org/10.3390/en17020391
Submission received: 28 November 2023 / Revised: 2 January 2024 / Accepted: 10 January 2024 / Published: 12 January 2024

Abstract

:
The reduction in GHG emissions has become one of the most important objectives in Europe. One of these clean technologies in the quest for large-scale decarbonisation is the blending of hydrogen and natural gas (H2NG). The significance of this article lies in conducting a technical–economic analysis that relies on simulating annual consumption patterns. This study focuses on the utilization of H2NG at different proportions within a distribution network in Bucharest, Romania’s largest city. The paper is a fallow up of another paper and presents a case study for the injection through all four entry points in the city of different percentages of hydrogen and the dynamic of the mix through the gas distribution network. The study found that the variation in H2 in the network is high and depends on the entry point levels and consumption. An economic analysis was conducted on seasonal real consumption, which confirmed the investment’s profitability.

1. Introduction

An avenue for achieving a fair transition to a zero-carbon energy system involves utilizing hydrogen as both an energy transporter and storage medium. This approach entails blending hydrogen with natural gas, thereby enabling numerous energy users to experience a reduction in greenhouse gas emissions.
Research into replacing fossil fuels with alternative carbon-free fuels has been, is being and will continue to be carried out.
Numerous countries globally are endorsing projects in this domain, drawing on findings from international studies that have demonstrated diverse levels of advantages arising from the utilization of H2NG. All these demonstration projects are in search of technically and/or economically optimal solutions to meet the target of greenhouse gas emission reductions in the next years [1]. This approach will help achieve environmental goals through decarbonisation, with minimal impact on end users [2].
The present study is carried out to represent the existing conditions in Europe, especially for Romania. The aim of the paper is to provide an up-to-date study on H2NG and the supply of this blend to final consumers. In addition, it outlines both its technical implications and economic implications. A graphical summary of the main milestones of our project is presented in Figure 1 for a better understanding of the study.
At present, distributors in Romania are developing some application studies of this method. This determines the newness of our paper and underlines the need to deal with the technical, environment and commercial aspects of this new technology.
Given the recent shifts in natural gas prices, the strategic replacement of a portion of gas within pipeline systems with hydrogen under optimal conditions is of paramount importance. This approach addresses concerns related to technical risks stemming from the depreciation of components within these systems [2]. Estimation or calculation of the costs and impacts of hydrogen injection into natural gas transmission or distribution networks can lead to engineering tools that can reduce costs and, secondarily, the end users final price [3,4,5].
Incorporating a small quantity of hydrogen into natural gas does not present significant technical challenges in terms of transporting and utilizing the resulting blend. However, it is essential to acknowledge potential safety concerns arising from the distinct combustion characteristics of hydrogen, which contrast significantly from those of natural gas. For the distribution of H2NG, it is anticipated that current infrastructure can be used.
Addressing the operational risks linked to the distribution of this blend, particularly with the elevated concentration of hydrogen, requires the collaborative efforts of experts engaged in pre-normative research. Their focus should be on evaluating and enhancing the performance of existing pipeline networks to ensure the safe and efficient distribution of the blend. The use of hydrogen blends can help to mitigate the serious safety issues associated with the use of pure hydrogen [6,7,8].
To familiarise people who do not have expertise in this area, here are some of the key points covered in this article:
  • GHG emissions (greenhouse gases). These are gases that trap heat in the atmosphere and are a contributor to the greenhouse effect. Common greenhouse gases include carbon dioxide (CO2), methane (CH4) and nitrous oxide (N2O).
  • Decarbonisation. This refers to reducing carbon emissions, particularly from burning fossil fuels. It is one of the key strategies for mitigating climate change and limiting the concentration of greenhouse gases in the atmosphere.
  • The blending of hydrogen and natural gas (H2NG). This involves the combination of hydrogen and natural gas in varying proportions. As hydrogen burns cleaner than conventional natural gas, the aim is often to reduce carbon emissions.
  • Technical-economic analyses. These assess both the technical feasibility and the commercial viability of a particular technology or process. In this case, it refers to the assessment of the feasibility and the economic aspects of the blending of hydrogen and natural gas.
  • Simulation of annual patterns of consumption. Models are created that mimic or reproduce consumption trends over the course of a year. This is likely to mean simulating how hydrogen and natural gas consumption changes over the year in the context of the manuscript.
  • Distribution network. This is the infrastructure (pipelines, valves, metres, etc.) used to transport and deliver gas, in this case hydrogen and natural gas, throughout a defined area.
  • Case study. A detailed study of a particular case or situation with the aim of drawing conclusions or gaining knowledge. In this case, the focus is on the injection of different percentages of hydrogen through entry points in the Bucharest gas distribution network.
  • Entry point injection. The introduction of a substitute gas (in this case hydrogen) into a system (gas distribution network) through specific injection points.
  • Mix of hydrogen and natural gas dynamics. Relates to the changing composition or ratios of the hydrogen and natural gas mixture during its movement through the distribution system. This may include tracking the evolution of the blend over a time and distance.
In this context, the European Union aims to conduct research and disseminate findings to enhance comprehension of the effect of H2NG on the distribution of gas to final consumers, particularly in the residential and industrial sector, as presented in [9] (on the durability of domestic gas metres), [10] (on residential and industrial gas appliances), and [11], which concentrates on the functioning, environmental impact, and safety of non-adapted appliances. Furthermore, the inclusion of hydrogen can positively influence overall combustion stability, contributing to improved performance in this regard [12,13].
Energy experts have highlighted the use of hydrogen and clean energy as a key pillar of the international, and particularly EU, strategy to reach the “net zero” objective of decarbonising industrialised processes and neutralising carbon dioxide emissions into the atmosphere by 2050 [14].
Among the EU Member States where the use of H2NG is permitted, Germany has the highest limits at 10%, with a condition that if CNG stations are coupled to the network, the limit is reduced to 2%. Other notable limits include 6% in France, 5% in Spain, and 4% in Austria. However, it is worth noting that several countries currently do not allow the use of this blend, at least not at present. In Romania, the two main gas distribution operators are preparing for H2NG up to 20% hydrogen, thus the percentages used in our study. Even though this maximum percentage was not be used in the beginning, it was used to see the implication of the addition on the variation in parameters, as no changes in the network are necessary and the possible disadvantages are minimum, a fact revealed by studies [9,10,11].
It is crucial to establish consistent standards for evaluating gas mixtures with varying hydrogen contents, particularly because a higher concentration of hydrogen in H2NG diminishes its calorific value.
Therefore, this article tackles a pressing contemporary concern, considering technical, technological, and economic facets. The emphasis is primarily on international and European trends aimed at curbing CO2 emissions by transitioning from conventional hydrocarbon-based energy production to innovative renewable energy technologies [2].
For different percentages of H2 in H2NG entering the grid from different entry points and for the dynamics of the composition, in particular the percentage of H2 in time and space, simulations were carried out and their technical and economic impact was analysed.

2. Methodology

The costs borne by end consumers and the environmental impact are significantly influenced by the extraction, transportation, distribution or storage of natural gas.
To meet decarbonization goals by significantly reducing carbon dioxide emissions, the emerging technology of introducing a percentage of hydrogen into natural gas distribution systems aims to provide an equivalent level of energy, with minimal impact on final consumers.
The assumptions for this study are represented by the seasonal zonal consumption recorded in Bucharest. Leveraging this dataset received from the distribution company, simulations were conducted and analysed to assess the introduction of H2NG at different concentrations (20%, 10% and 5% hydrogen) through all four entry points of the distribution system.
Additionally, a technical–economic study was undertaken, encompassing both the establishment of hydrogen production capacity and the amortization period associated with this technical objective.
The working methodology employed to generate this article is visually depicted in Figure 1. The working steps taken are presented below:
  • Choosing the solution for the integration of hydrogen into natural gas networks globally involves a comprehensive decision-making process;
  • Simulation of the distribution grid topology and entry points of adjustable capacities of H2NG and different compositions and calorific powers of natural gas;
  • Formulating calculation hypotheses and constructing working scenarios involves considering various factors, including the seasonal consumptions of the Romanian capital;
  • Results analysis of the considered scenarios emphasising the dynamic of the H2NG and the diminishing of the energy delivered, as well as the necessary increase in volumes delivered in order to achieve the main objective—the energy assurance;
  • Utilizing technical analysis, a feasibility study was conducted, encompassing calculations on the amortization of the investment;
  • A thorough discussion of the obtained results was undertaken, examining their implications and significance;
  • The study draws conclusions and outlines potential avenues for future research based on its findings and insights.

3. Study on the H2NG Usage in a Medium Pressure Distribution System

For accurate simulation of the parameters dynamic in the distribution networks with different percentages of hydrogen, it is crucial to take into account H2NG properties; thus, in this case study these properties are computed with PREOS.

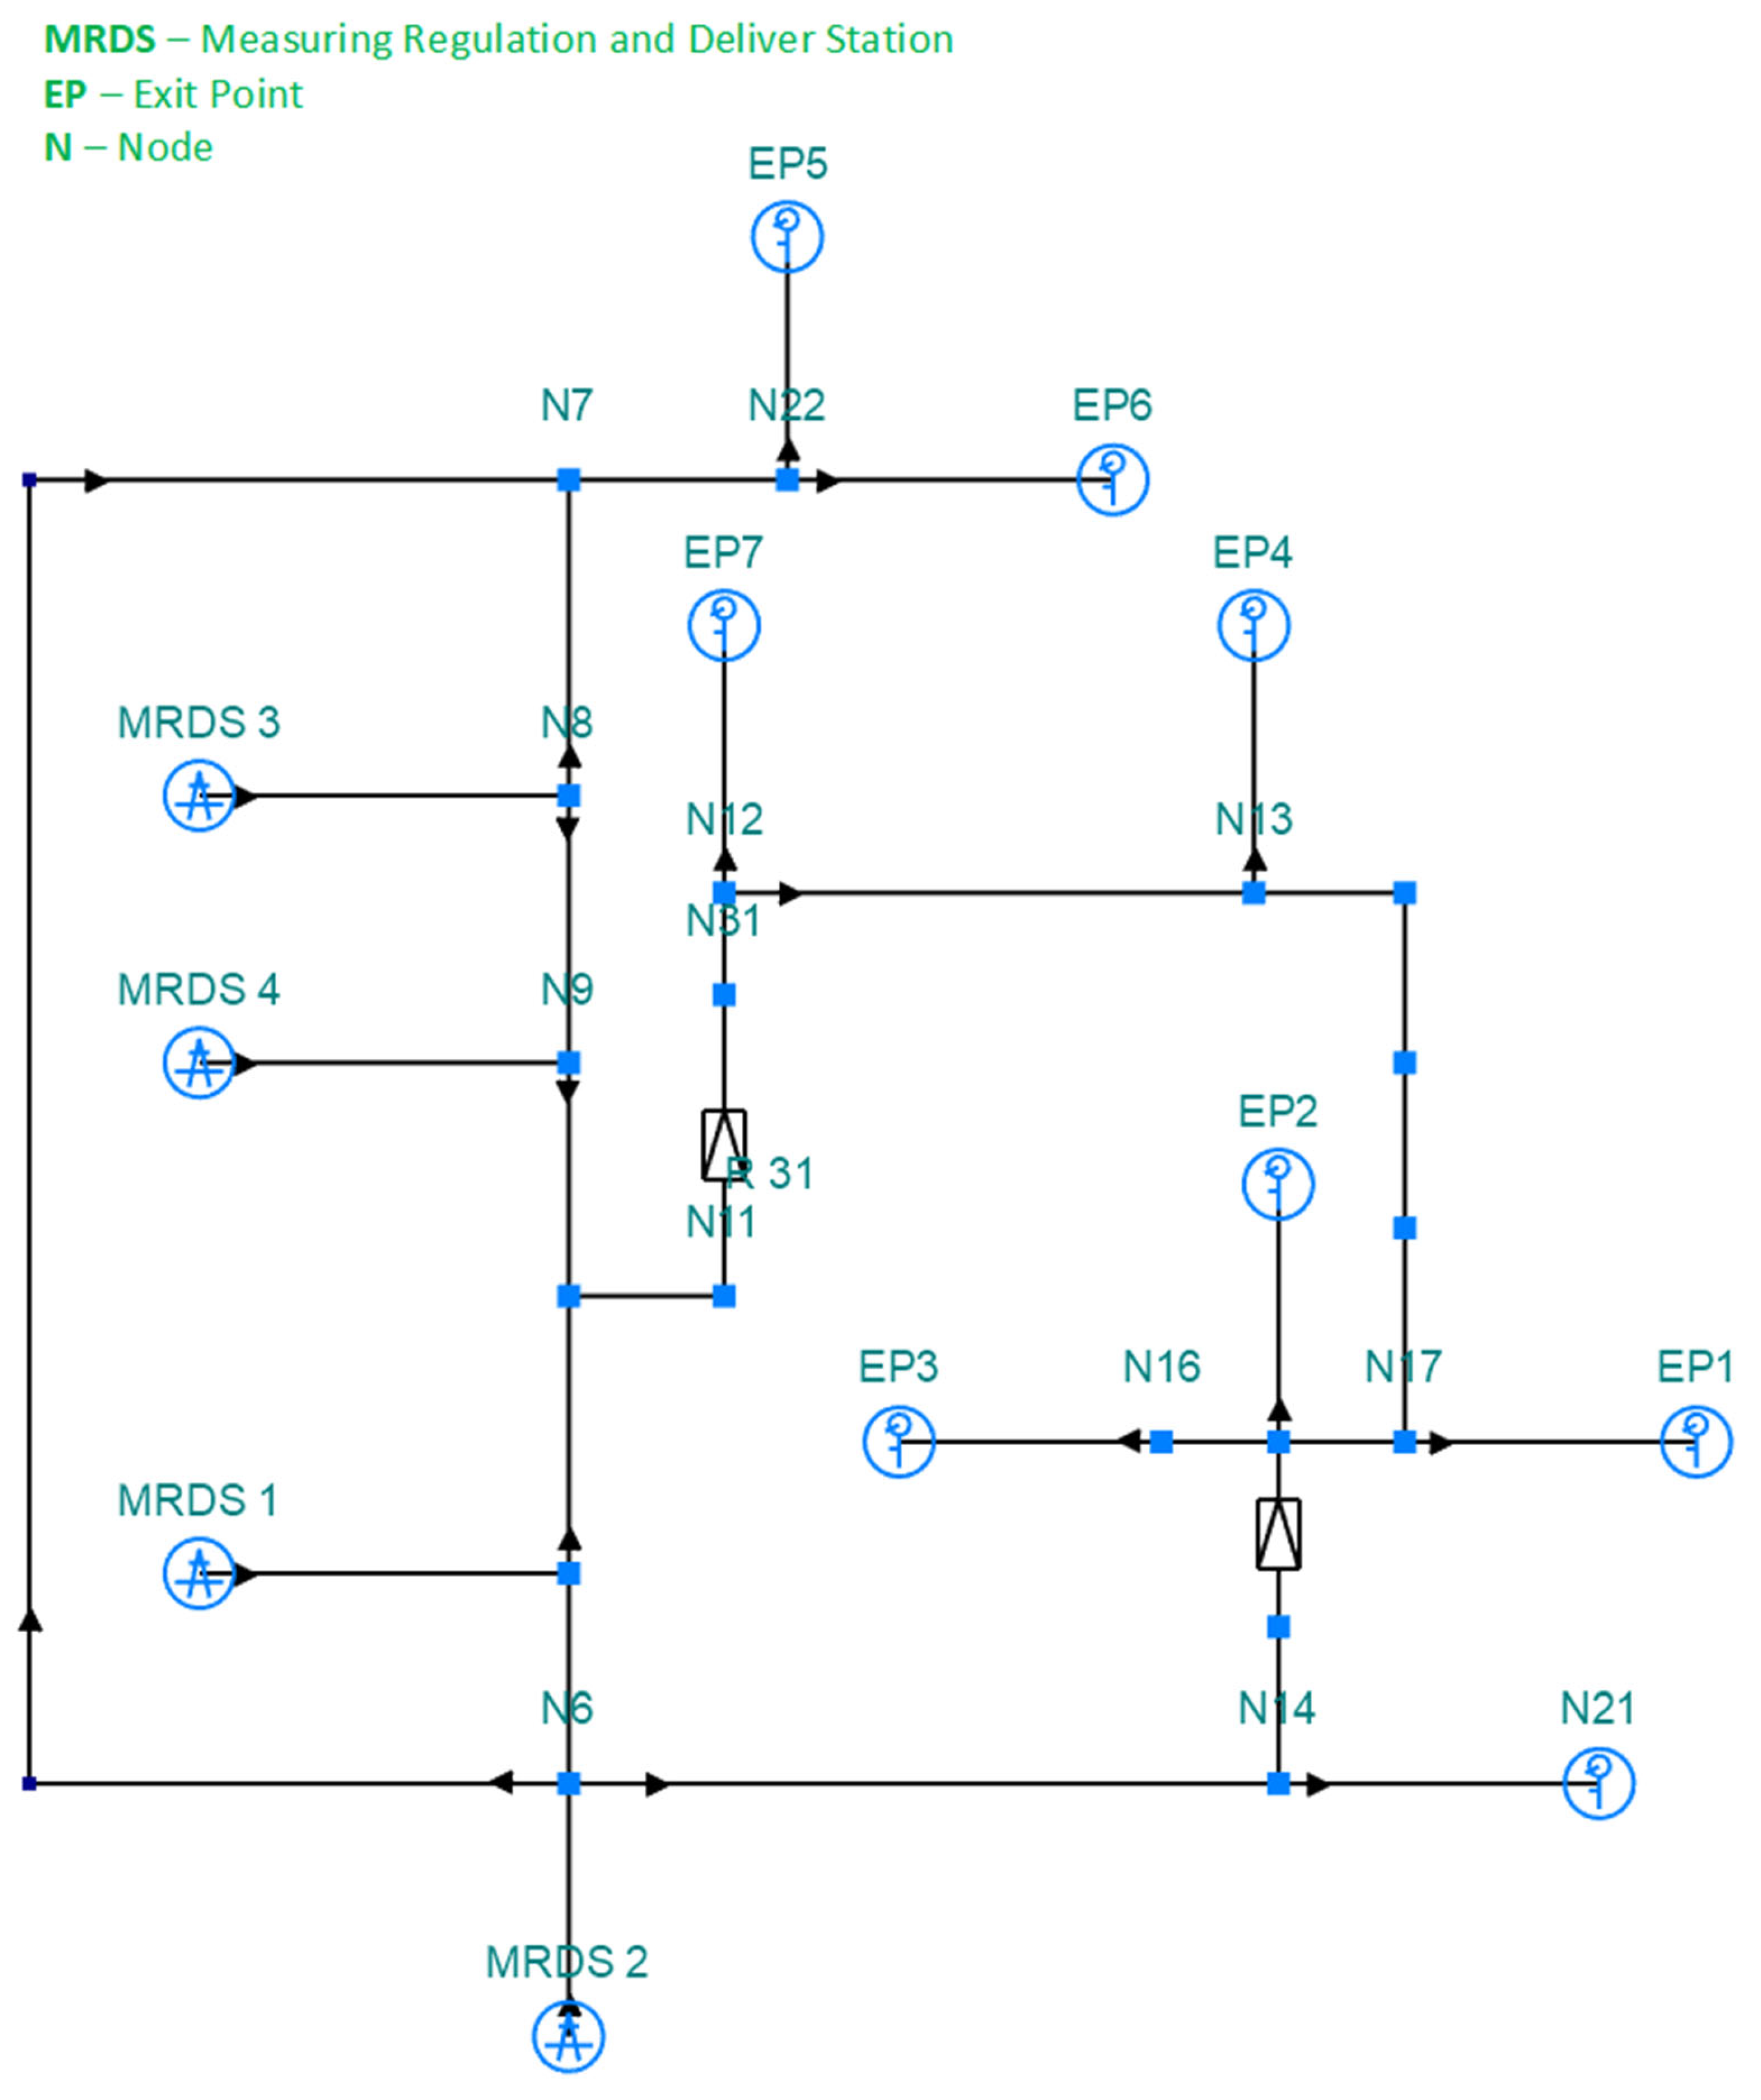
3.1. Presentation of Analysed Simulation Made on Medium Pressure Distribution System

As previously noted, our study involves a virtual model conducted on the natural gas medium-pressure distribution grid in Bucharest.
Figure 2 shows the medium pressure distribution grid, consisting of a round grid supplied from the transmission network through four MRDS; this study was executed within a simulator specifically designed for a hydrogen-enriched natural gas network. H2NG goes directly to three zonal exit points and over two SRSs to the other five.
The physical properties of the gas components aligned with the information found in the literature within the field [15]. The gas composition was extracted from actual chromatographic bulletins given by the distribution operator associated with the entry points from the transmission system. Table 1 presents a selection of these data, in order to use them in the simulation software (AdmoduNet v2.0).
H2NG was supported out in two stages, due to hydrogen plants’ readiness. This is due to the hydrogen plant being the first to become operational and possessing the required capacity for delivery. This simulation and their analysis was presented in an earlier article [1]. Another simulation type involved diverse percentages of H2 entering the system over all four entries that supplies the gas distribution network analysed, anticipating the functionality of hydrogen plants in the future. The findings from this simulation will be emphasized in this article. The three H2 percentages employed in the simulations (5%, 10%, and 20%) were determined through discussions within the PCH regarding the implementation stages in the Romanian gas systems. These percentages are expected to be incorporated into the upcoming regulatory framework. Thus, the other components of the gas are reduced accordingly in order to achieve the balance.
As one can see in Figure 3, the effect of injecting more hydrogen has the same influence, but at a different scale, in terms of HHV entering the network from all entry points. This influence will be seen at the customer’s side in energy delivered after some time, depending on the scale and configuration of the distribution network and on the customer’s consumption [16].
We performed different types of simulations, all dynamic for 24 h, to achieve a comprehensive understanding of the H2 injection impact on the medium-pressure distribution network and its repercussions on the final consumers. We used AdmoduNet v2.0, a numerical simulator developed by NetGas [17], for demonstration and validation purposes. The objective was to observe the dynamics of H2NG flow and to accurately determine the daily gas balance [16]. Three of entry points have a condition limit on flowrate and one on pressure in order to allow the simulator one degree of liberty to calculate the flowrate, thus reflecting the functioning in reality. The SRS is on the output pressure condition. As the consumed volume of H2NG must exit the network, all the exit points are on the flowrate condition.
The start of point simulation begins with natural gas entering in the system and it was used as a benchmark for parameter variation and energy delivered. Figure 2 illustrates a technical visual representation of the analysed gas distribution network.
With the winter season resulting in a consumed volume 10 times higher than in the summer, our focus shifts to the next set of simulations for these two cases. Analyses and simulations were conducted for three scenarios, with the H2 percentage in the H2NG varying from 5% to 20%. The objective was to understand the effect on the energy provided to final consumers across different areas of the network.
As already presented in [1], the energy provided will decrease in the areas affected by H2NG as the percentage of hydrogen introduced into the network increases. In this simulation, where H2NG was introduced through all four entry points, the analysis was centred on assessing the differences between various areas of the network—how much and how quickly customers are affected. Particularly, in the case of 20% H2, the goal was to understand the extent of the volume increase required to deliver the equivalent energy to the consumers.

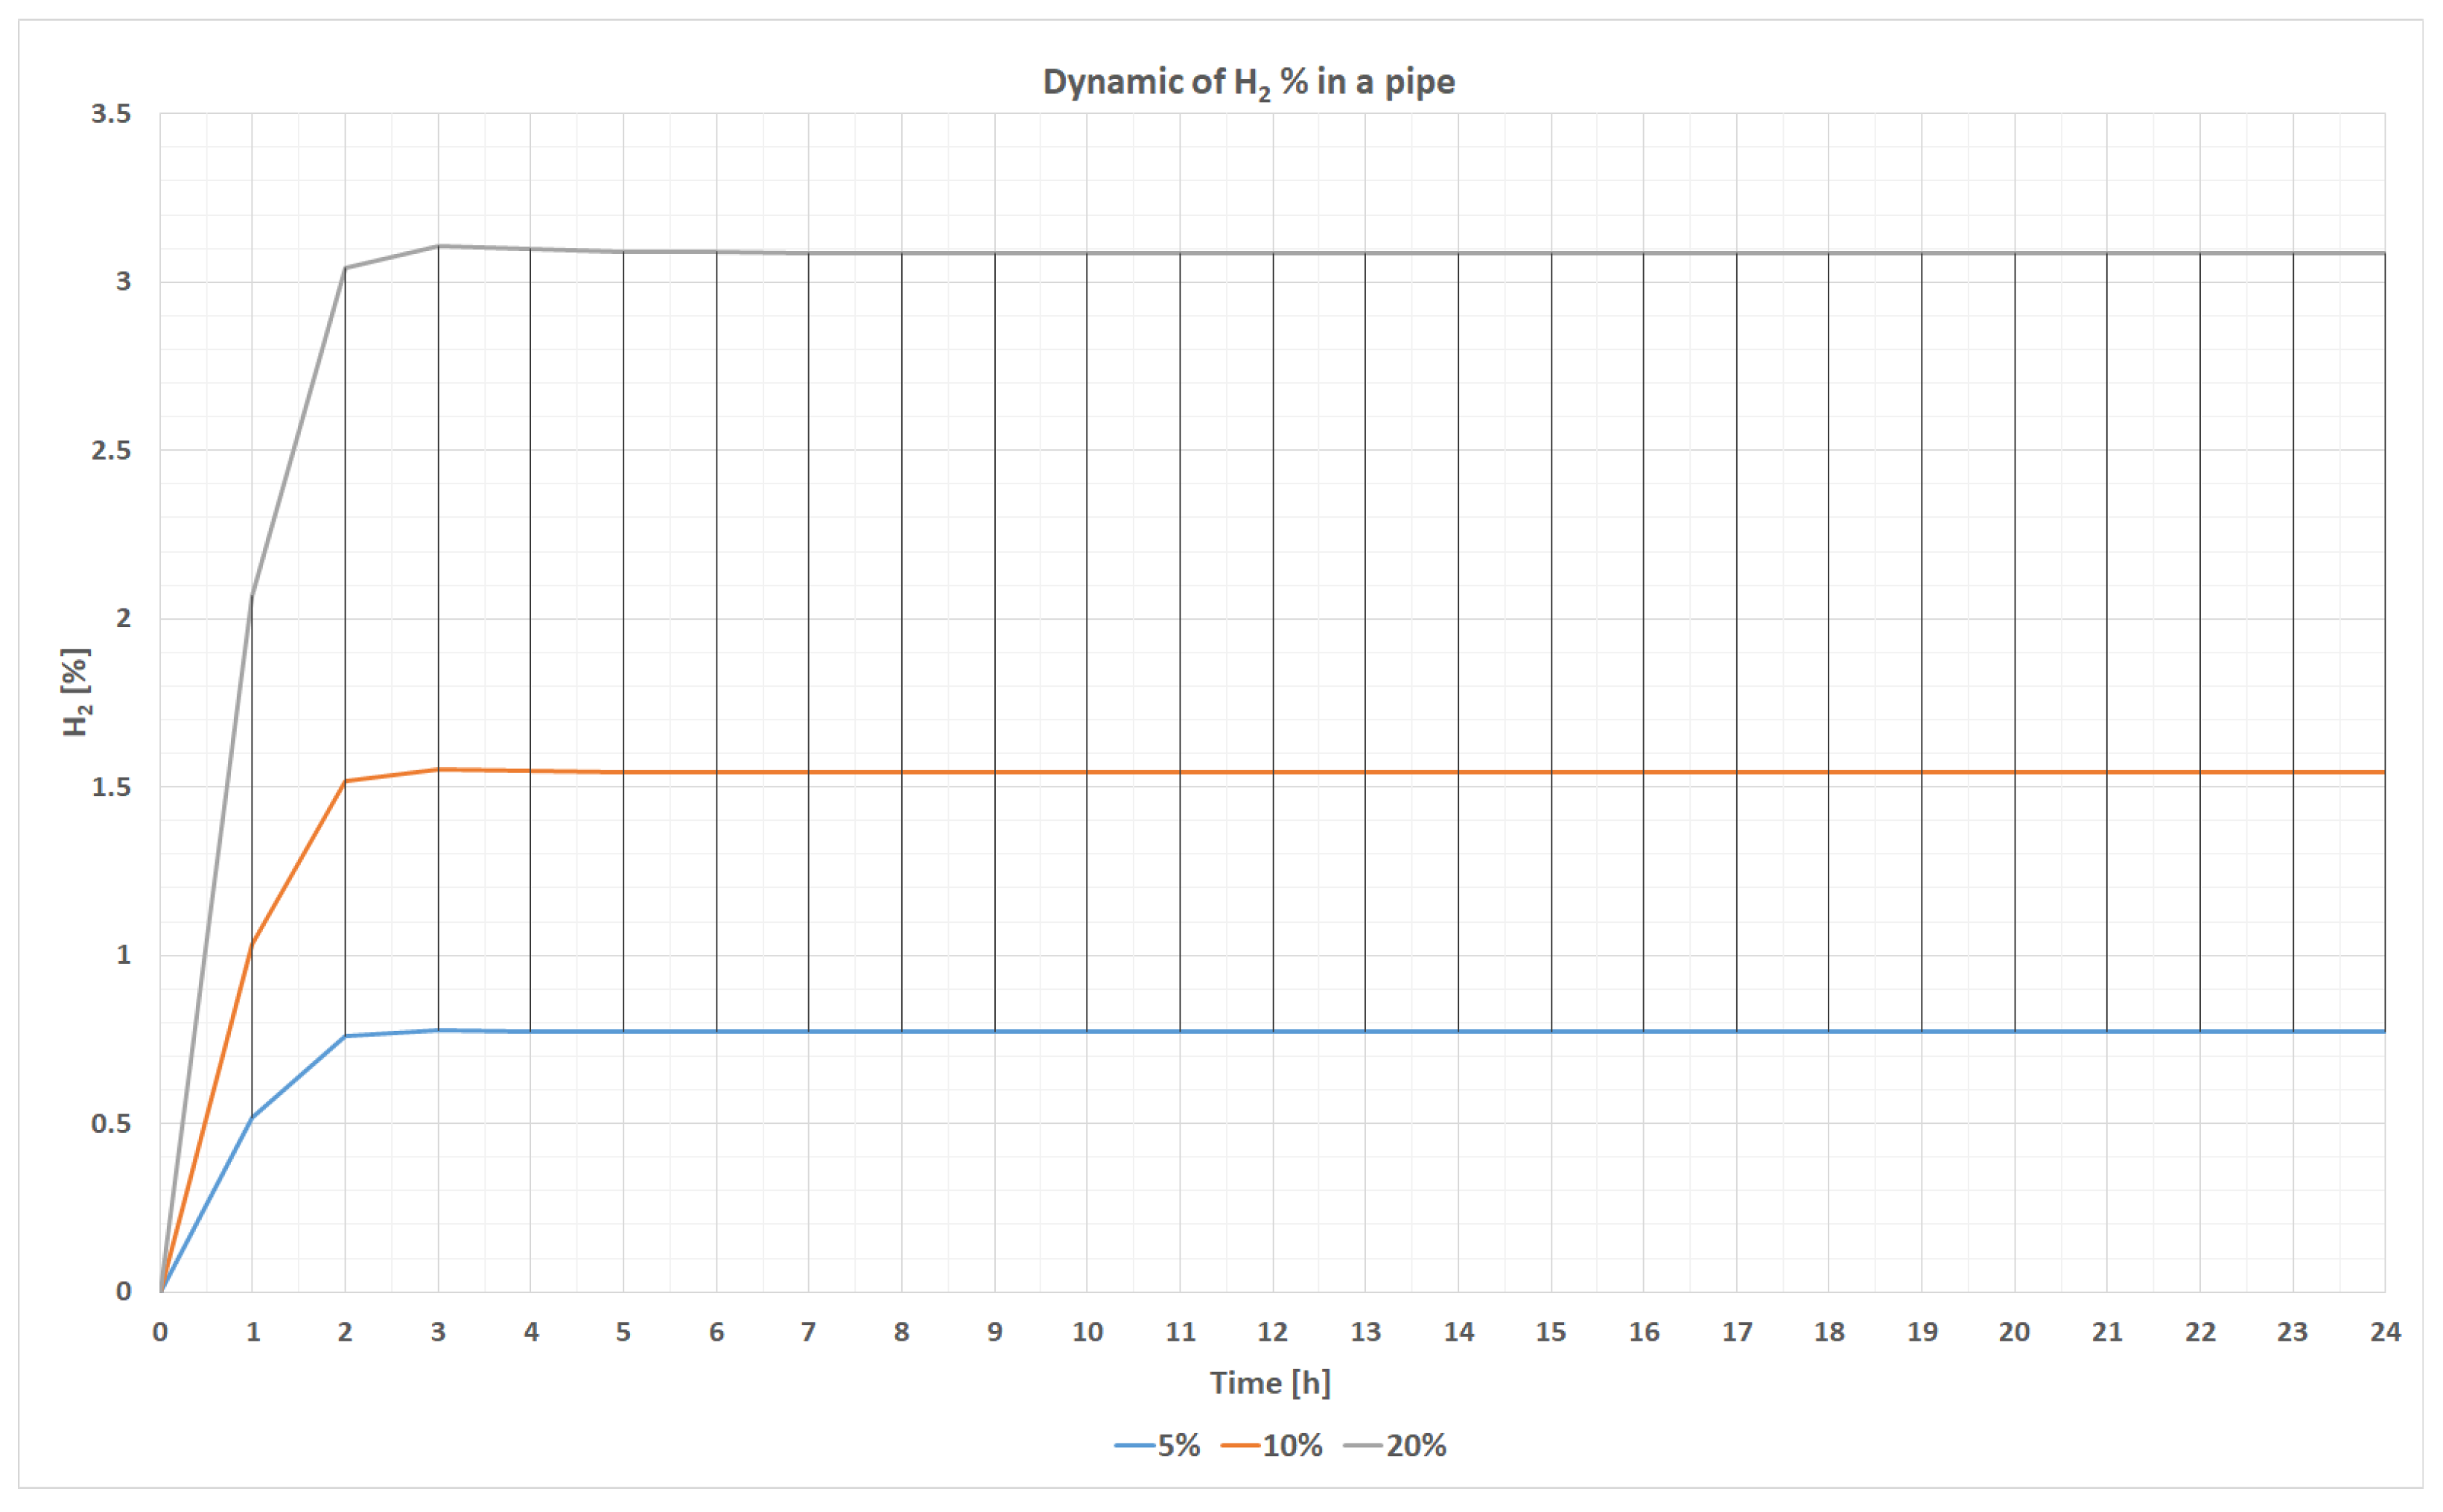
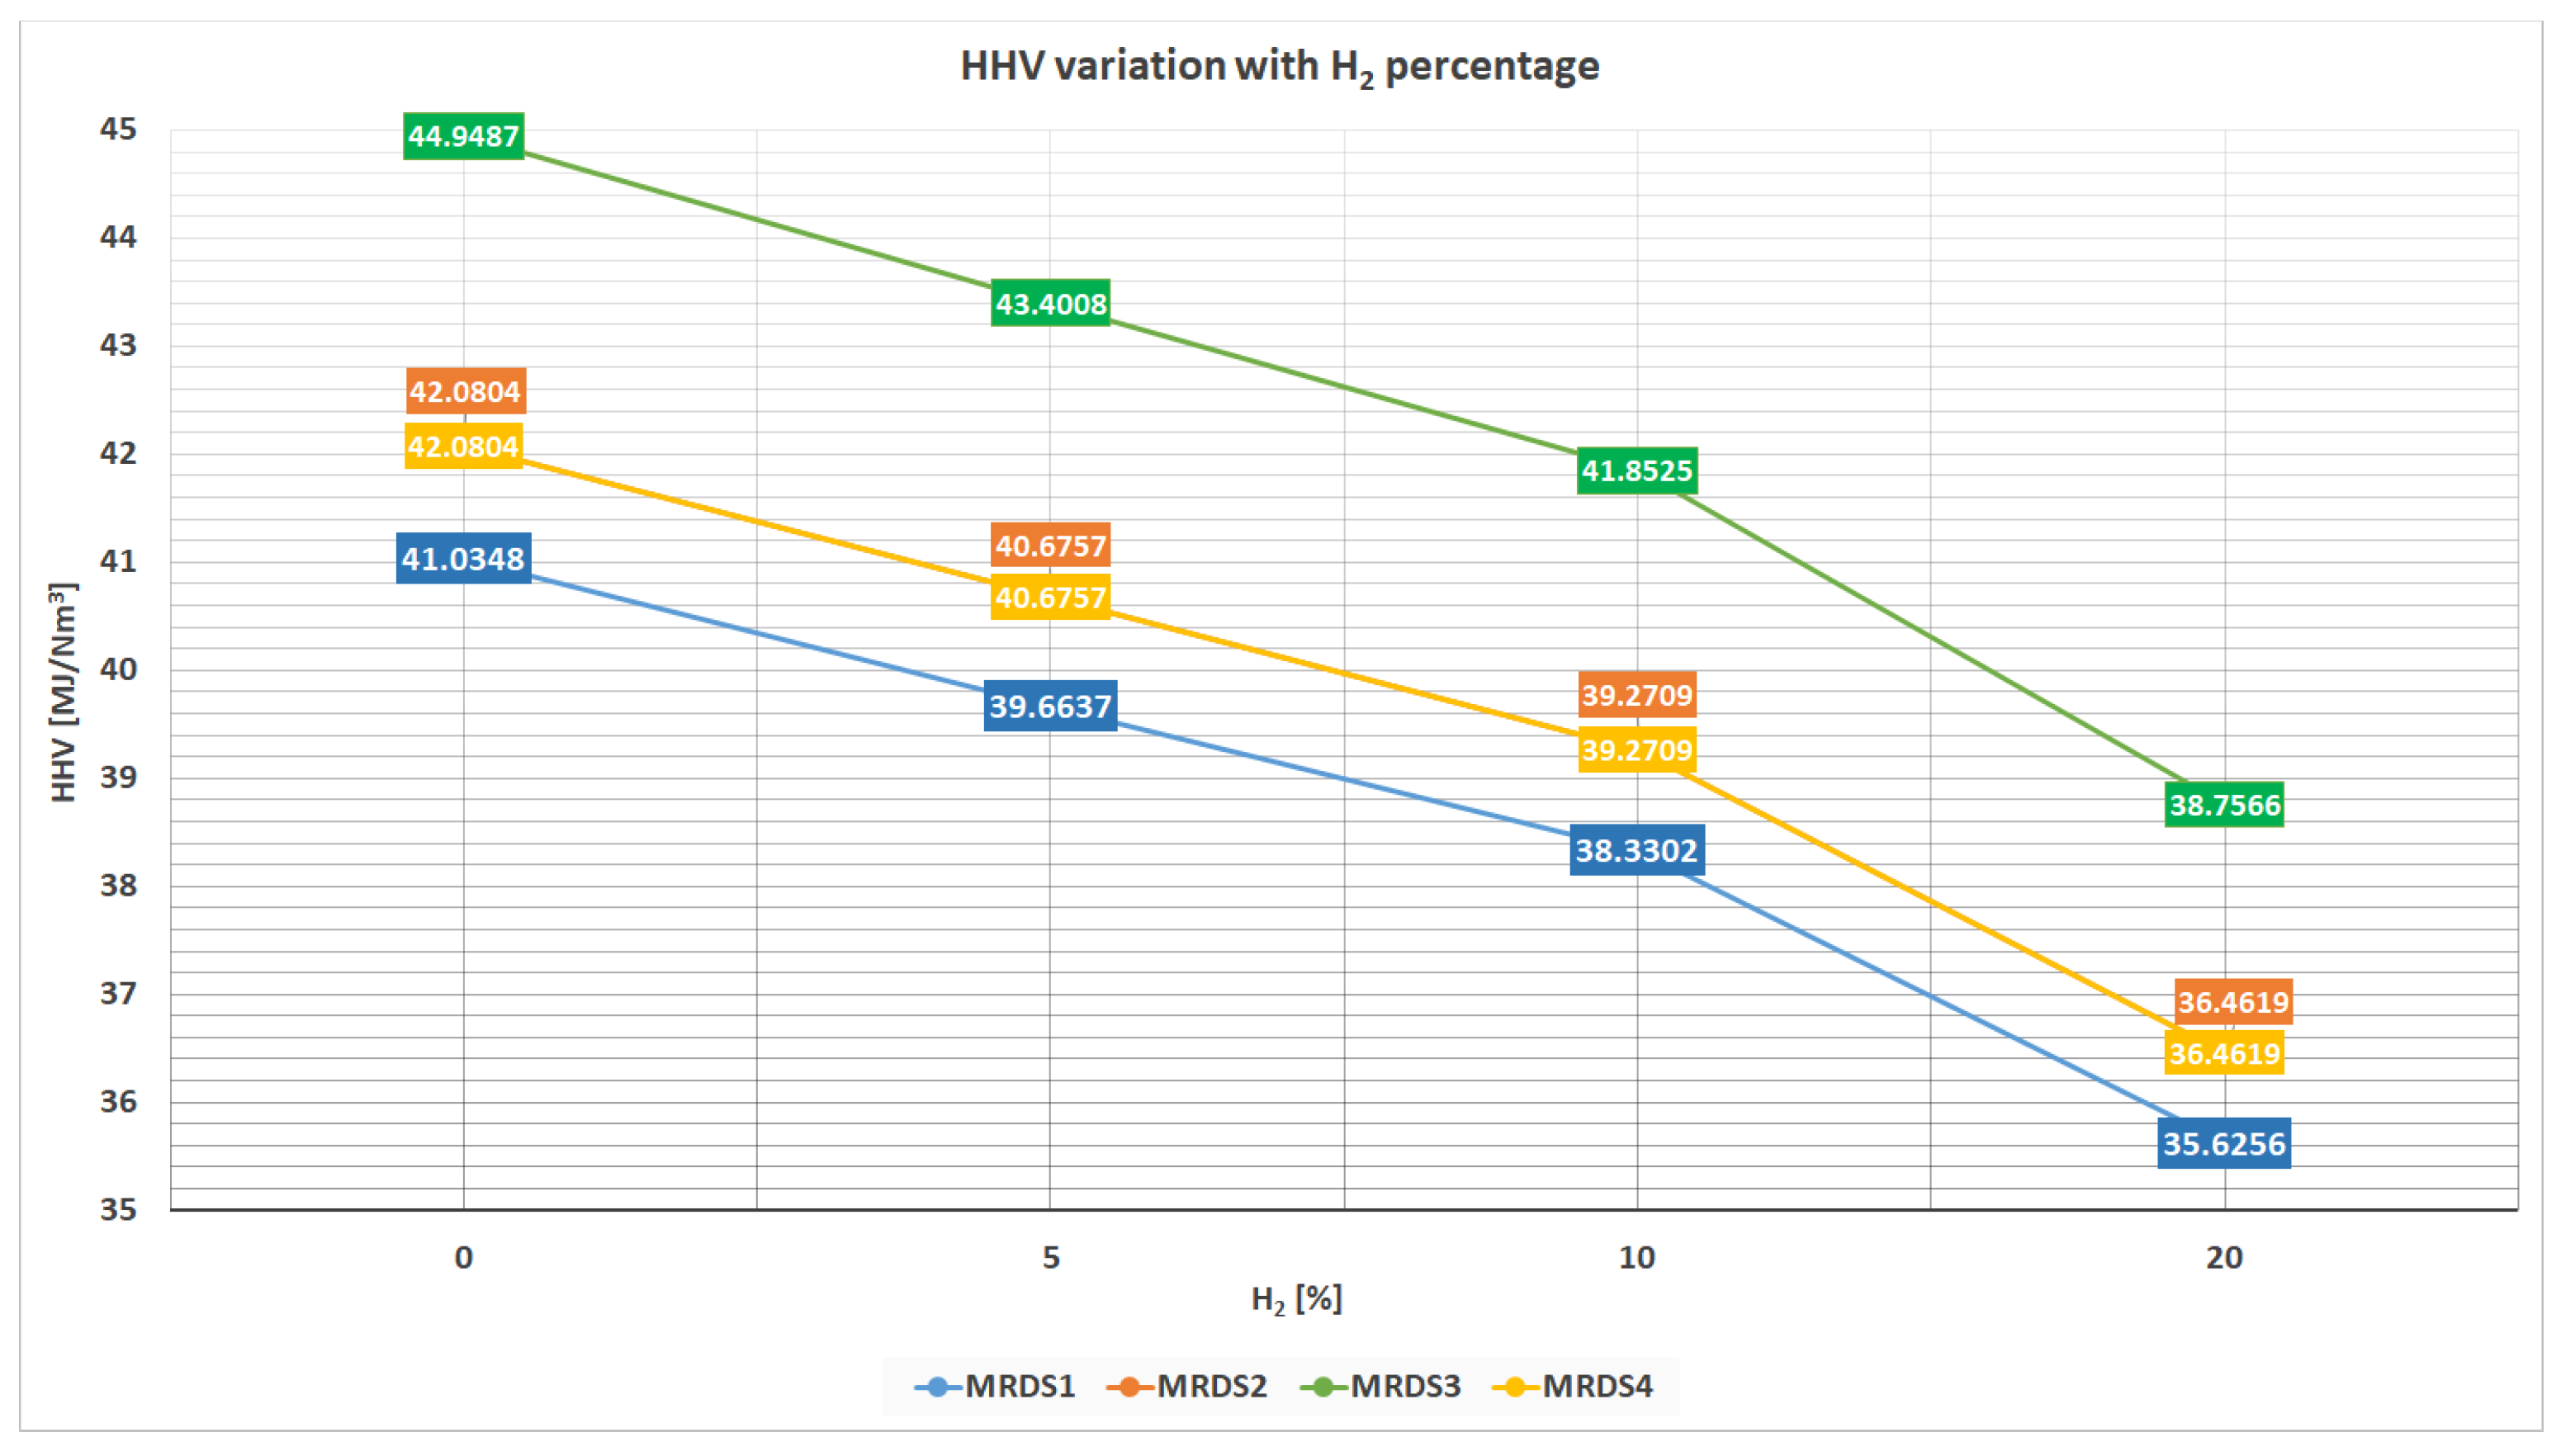
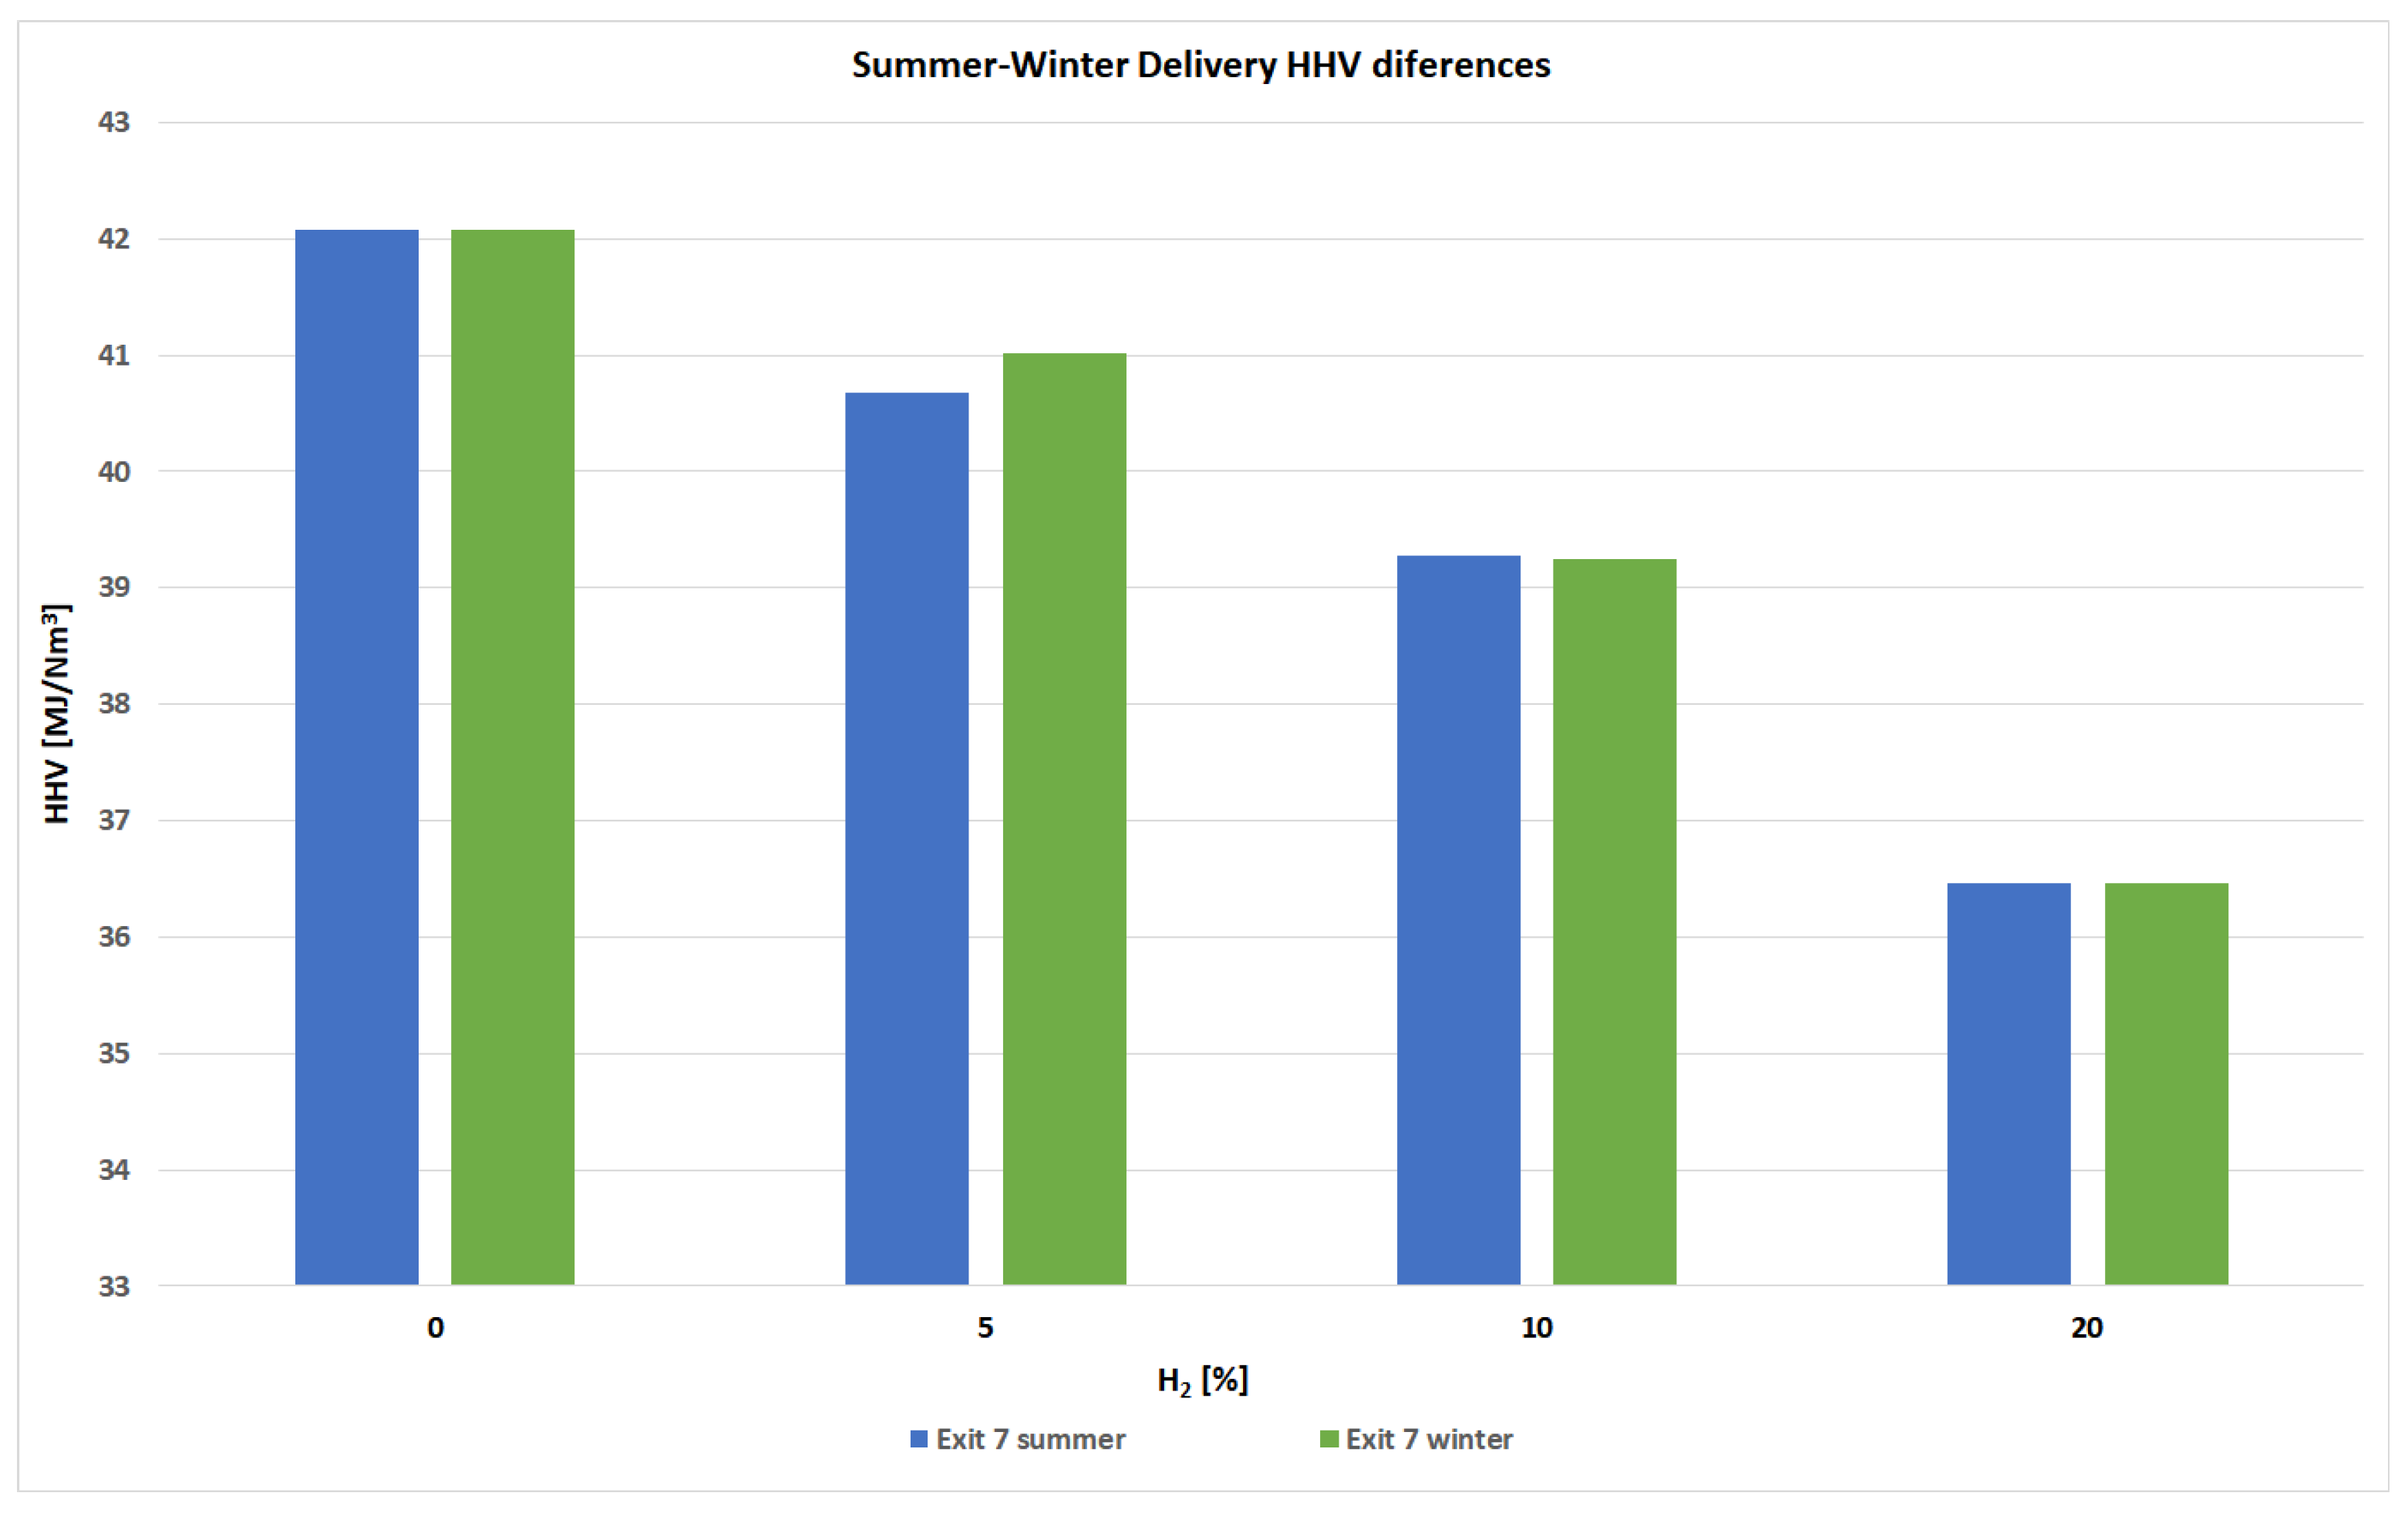
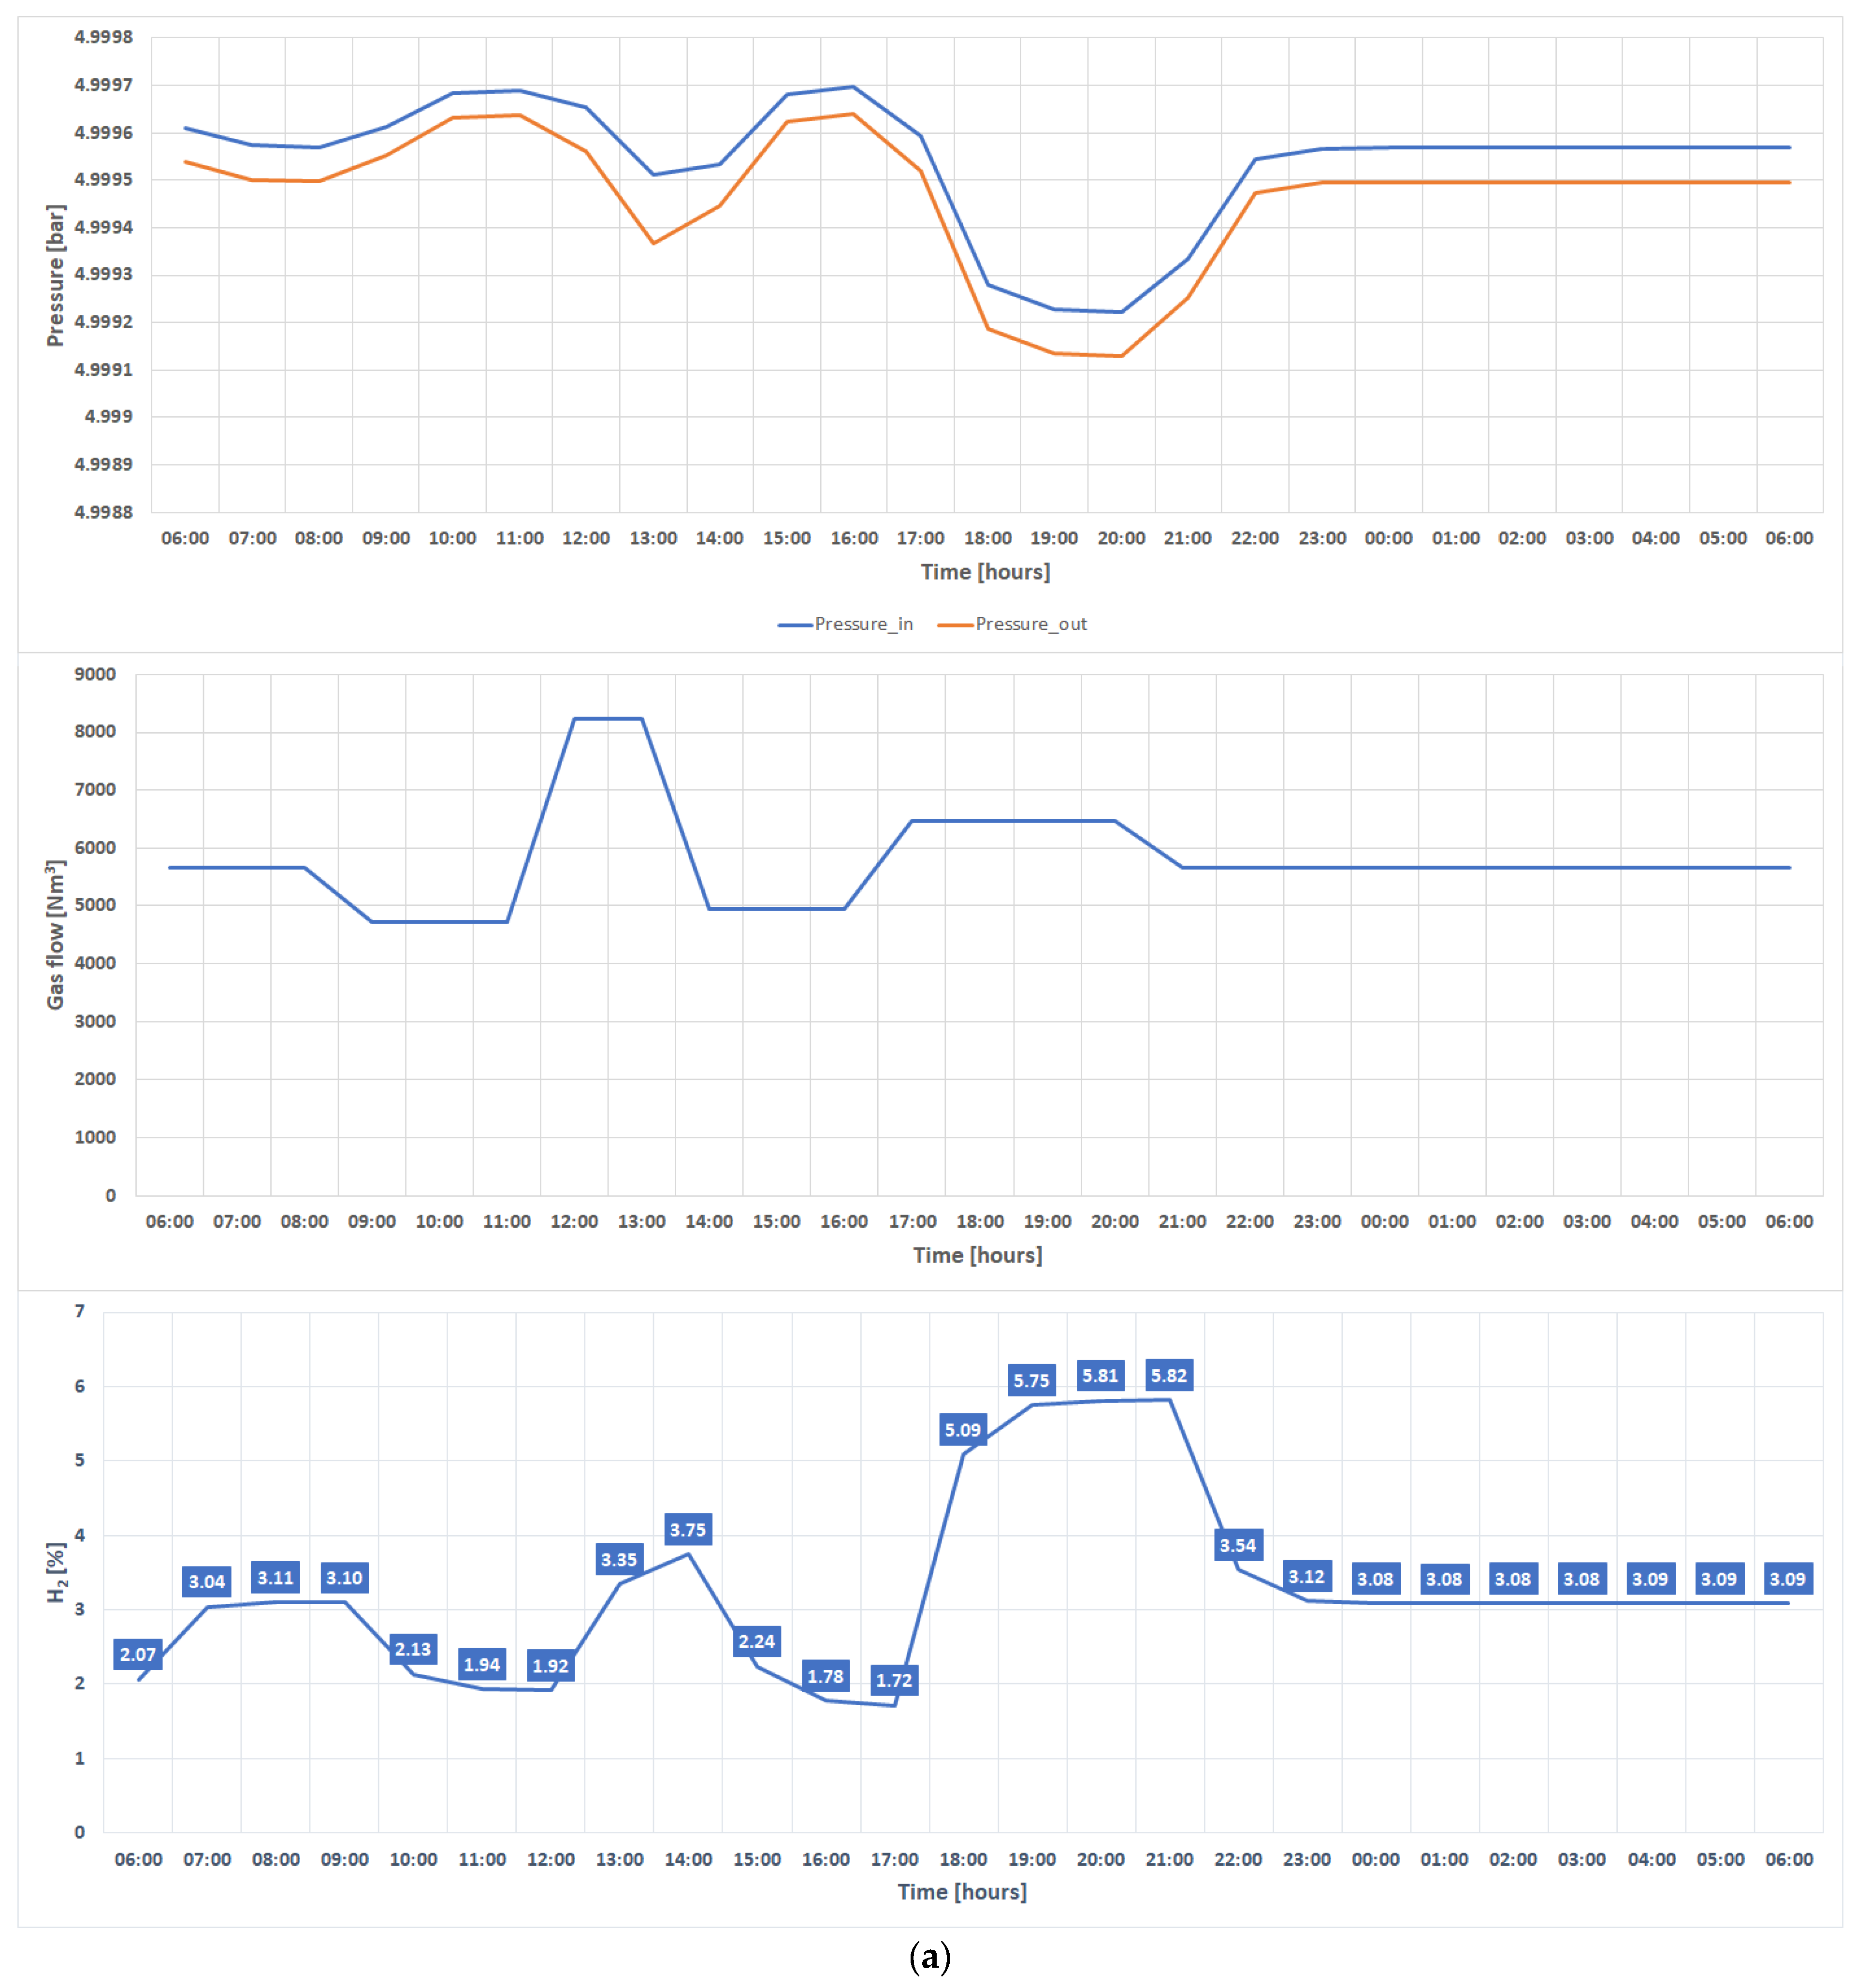
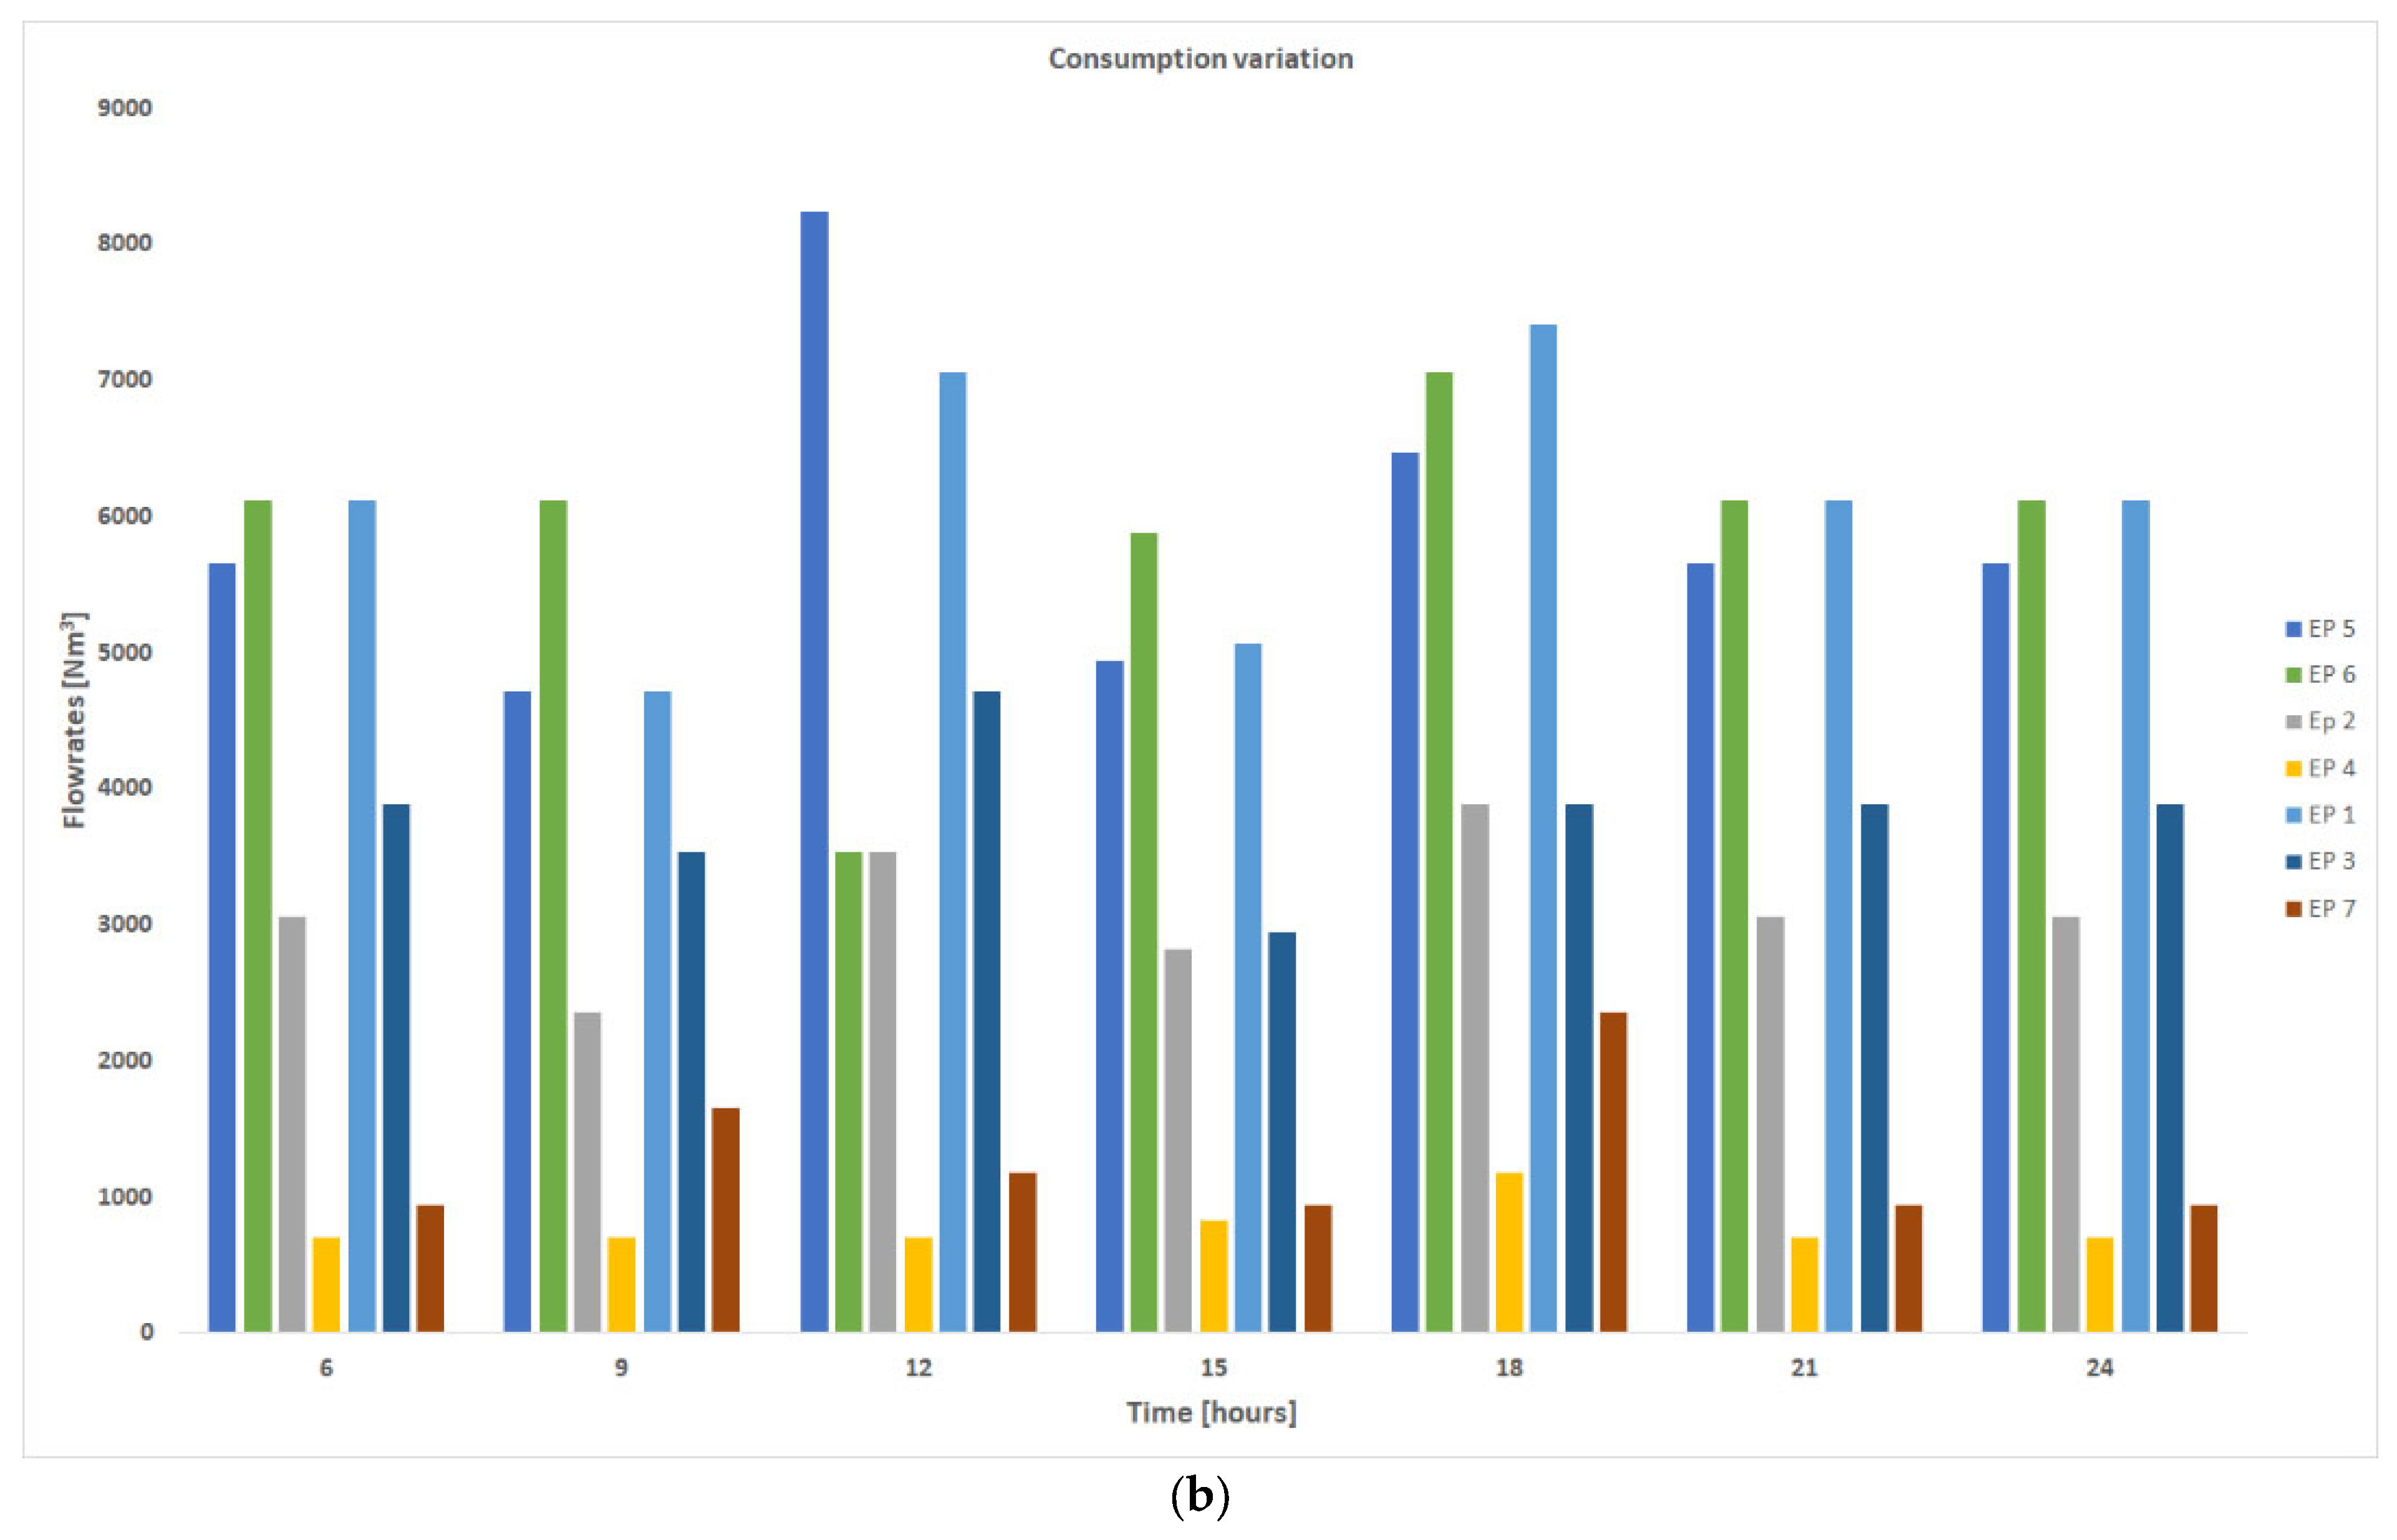
3.2. Outcomes of the Numerical Simulation

Figure 4 presents the flowrates, HHV and energy entered and delivered under analysis in the summer scenario for the initial case (the benchmark), in which no H2 had been introduced yet. The used values are the average values received from the network operator.
The analysis reveals that there are no significant modifications in HHV for different portions of the town. However, this issue arises and becomes more pronounced with the introduction of hydrogen.
In the summer situation, with H2NG introduced through all entry points, varying mixing and flow rates in the distribution grid resulted in some areas of the town being more affected by the drop in energy. As depicted in Figure 5, exit point 1 experienced the least impact on HHV, while exit points 5 and 6 were the most affected. Despite this, these areas benefited from a substantial reduction in carbon footprint.
In the winter setup, in which flow rates are approximately 10 times greater and the HHV entry remains constant, comparable trends and values were anticipated. The outcomes depended on the magnitude of gas flows. Figure 6 illustrates a comparison of summer and winter HHV for one city area. The variance among the summer and winter settings ranged from −0.825% to 0.075% in the delivered mixed gas.
Due to the high concentration of Hydrogen, the HHV decreased and also obviously the amount of energy to the consumers. As the consumer need is the same, the distributor had to increase the flows in order to compensate.
Simulations were carried out to analyse the volumes that are required for 20% H2NG in the winter.
The energy decline was similar for the entry and exit points—10,137.33 MWh versus 8894.53 MWh, approximately 13.44% for the entry points and 11.83% for the exit points (see Table 2). In order to supply the identical energy (74,105.84 MWh), the flow had to be increased by an average of 12%, with only 7.7% at Entry no. 2 and around 13.3% at the others. The final disparity of the system, based on the entry and exit points energies (see Table 2 and Table 3), was −38.37 MWh.
Because of the dynamic of the gas in the grid, the amount of entry point volume or energy was not similar to the one from the exit points. The analysis delved into the hourly variations in gas quality within the network and the gas balance. This examination aimed to discern the differences introduced by hourly consumption patterns compared to average consumption. Owing to the size and dynamic nature of the network, there existed a disparity of 232 MWh amongst the entry and exit points, representing energy accumulated within the gas present in the network.
If H2NG is introduced to all the entries, the energy diminution will not be comparable for both the entry and exit points, because of the dynamic flow in the distribution net. Even though the length of the distribution system is not so big, one can see that for all three cases analysed (5, 10 and 20% of H2) the dynamic of H2% in the network was similar and had a 2 h window (Figure 7); after that the flow would be stationary. That means that the modified composition of the H2NG would arrive at the final customer in maximum 2 h. Also, we can see that the % of H2 that arrived at the customer was significantly lower than that which entered the distribution network, due to the position of the customer and the mixing in the network.
The travel time depends on the position in the network and the consumption of the clients. For example, in the winter, when the consumption was 8–10 times higher than in summer, the travel time would be much lower.
Of course, the consumption dynamic will influence very much the flow and the H2NG mix composition. In Figure 8a, we present the outcomes of a dynamic simulation where the consumptions had three peaks (in the morning, noon and the biggest in the afternoon), with different amplitudes depending on the types of consumers. In the upper graph, the pressure variation is presented, in the middle graph the consumption, and in the bottom graph the variation in H2 percentage that arrived at one of the customers. The amplitude used was between 0.7 and 2.5, related to the average flowrates used in the simulations, and can be observed in Figure 8b.
Another thing that will influence the mixing, composition and travel time is the reduced pressure distribution system because of the length of pipes and the lower diameters and pressures that make the mix dynamic even more complicated.

3.3. Technical–Economic Study

Based on the simulations carried out previously, a case study explored how to amortise an investment in hydrogen production capacity. The investment would be necessary for an existing natural gas distribution grid, which spans roughly 40 km and which currently consumes a mixture of 6 million cubic metres per day during winter and one-tenth of that in summer.
Three case study scenarios will be explored, i.e., H2NG with 5%, 10% and 20% hydrogen. The proposed percentages for this scenario suggest that investment is required for hydrogen production capacities of 31,800/63,600/127,200 m3 H2,OUT per day. Upon converting the required hydrogen volume from m3 to MWh H2,OUT for injection, it was detected that capacities within the succeeding daily production bounds are necessary, reliant on the seasonal periods: 3.75/7.5/15 MWh H2,OUT.
At present, about 95% of hydrogen production in the EU is produced predominantly by SMR and a minor amount by ATR. Both processes result in significant greenhouse gas emissions [18].
It is important to expand the manufacturing capacity of electrolysers prior to utilizing electrolysis for hydrogen production, as outlined in this study. The manufacturers of the hydrogen production capacity provided the data used for estimating the total costs [18], without taking into account the cost of electrolyser manufacture.
The total installed cost, including CAPEX for the hydrogen production unit, BoP and system integration costs will be considered in the case studies.
Both the calculating algorithm and the data and values (CAPEX and COPEX) used came from a previous study carried out in a paper on the same subject [1].
Production capacities are reported in kW H2,out or kg H2,out in this case study.
For hydrogen produced by methane reforming, the energy efficiency of the SMR method is also reported using the lower heat output.
It should be noted that these mature production processes have a long lifetime (more than 25 years).
To implement the scenarios outlined in this case study, the energy production unit was assessed with an energy efficiency of 65%, leading to a varied hydrogen demand, as illustrated in the table below. Furthermore, an investment cost of approximately 105,000 EUR/MWh H2,out in 2022 was assumed.
As indicated in the simulation, all injection points were taken into account to analyse the volumes required for a 20% H2NG during winter. The entry points for the specified mixture included all MRDSs. To meet the same energy requirement (74,105.84 MWh), the flow had to be increased by an average of 12%, with an increase of only 7.7% at Entry No. 2 and approximately 13.3% at the other entry points. This resulted in an increase in flow from 264,045.594 Nm3/h to 264,180.380 Nm3/h. The final imbalance of the network, based on the exit point energies, was −38.37 MWh.
The necessary energy was 75,415.35 MWh, which implies 15,083.07 MWh hydrogen in the H2NG (see Table 2).
The investment costs were assessed in agreement with the specifications for each season, considering both minimum and maximum limits. For spring and autumn, an average consumption value was used, which implies the costs associated with these values. Depending on the characteristics of the hydrogen demand scenarios considered, investment costs for such production capacity were, therefore, as shown in Table 4 and Table 5.
Hydrogen can be generated in a plant located near the electricity/gas source or near the point of consumption. The case study demonstrates that this hydrogen production capacity is decentralized, situated close to MRDS (Medium-Pressure Reduction and Metering Stations), and is designed to cater to a substantial group of consumers. This approach necessitates rather minimal infrastructure for local storage and distribution.
Additionally, it is important to highlight that the case study considers the readiness of hydrogen to achieve the natural gas mixture in substantial quantities. This would involve transportation over small distances through pipelines at relatively low costs. The two primary cost components of the natural gas transmission network, following pipelines, are compressors. These elements, both pipelines and compressors, can be considered costs for either new infrastructure or upgrades to existing infrastructure, typically pipelines [19].
Investment costs for hydrogen and H2NG transport consider upgraded pipelines (usually the total cost of pipeline rehabilitation divided by the total number of kilometres), new dedicated pipeline (as CAPEX cost) and a compressor station in million EUR/km [1,18].
The total investment costs in this scenario, approximately EUR 451,310,000, incorporate the maximum mandatory distribution capacity, in view of the dimension of the grid and the structure of most elements, in the case of a 20% H2NG.
The investment costs were evaluated according to the requirements for each season (summer and winter), with minimum and maximum limits, and for spring and autumn with an average consumption value with the associated costs. Therefore, depending on the default hydrogen demand scenario, the costs of investing in such a production capacity and mix transmission are shown in Table 4.
Distributors bear the responsibility for the remaining investment needed to upgrade the network.
The return on investment study assumes a system lifespan of 25 years.
Gas distributors operate with regulated tariffs for providing gas distribution services to various categories of final clients. Established on a desk study made in 2022, it was found that differentiated tariffs apply to the provision of distribution services for specific categories of final clients, contingent on consumption and the distribution company. A comprehensive study will be conducted on the turnover of investment costs for a hydrogen production station and its injection into a section of the distribution network mixed with natural gas.
This study will be based on the distribution service tariff and annual consumption. A quantitative evaluation of seasonal consumption by customer type and a weighted average of distribution tariffs, derived from these percentages, will be considered. This assessment will be grounded on the consumption history of the case study network (refer to Table 5). Depreciation is calculated based on the distribution tariff of the natural gas partner for the entire grid of the company under consideration.
The market value for the cost and selling price of hydrogen was estimated based on the cost of producing and selling hydrogen in the European Union. An overview of hydrogen costs and sales prices in EUR/kg H2 is provided in this analysis.
Furthermore, as shown in Table 6, it is specified that the surplus of hydrogen from monthly production is traded on the open market at EUR 90/MWh H2, which increases the investment revenue.
The appropriate lifetime of a hydrogen production plant was assumed to be 25 years with linear turnover for the purpose of the case study. It should be noted that this turnover pattern and the length of the period were set at the EU level for the turnover of investments for the achievement of energy policy objectives.
In addition, the analysis of the turnover of investments was carried out using current forecasts, with distribution tariffs varying by 5% and constant income discounting by 5% for inflation. Any crisis situation could have an impact on this study and affect the investment turnover period.

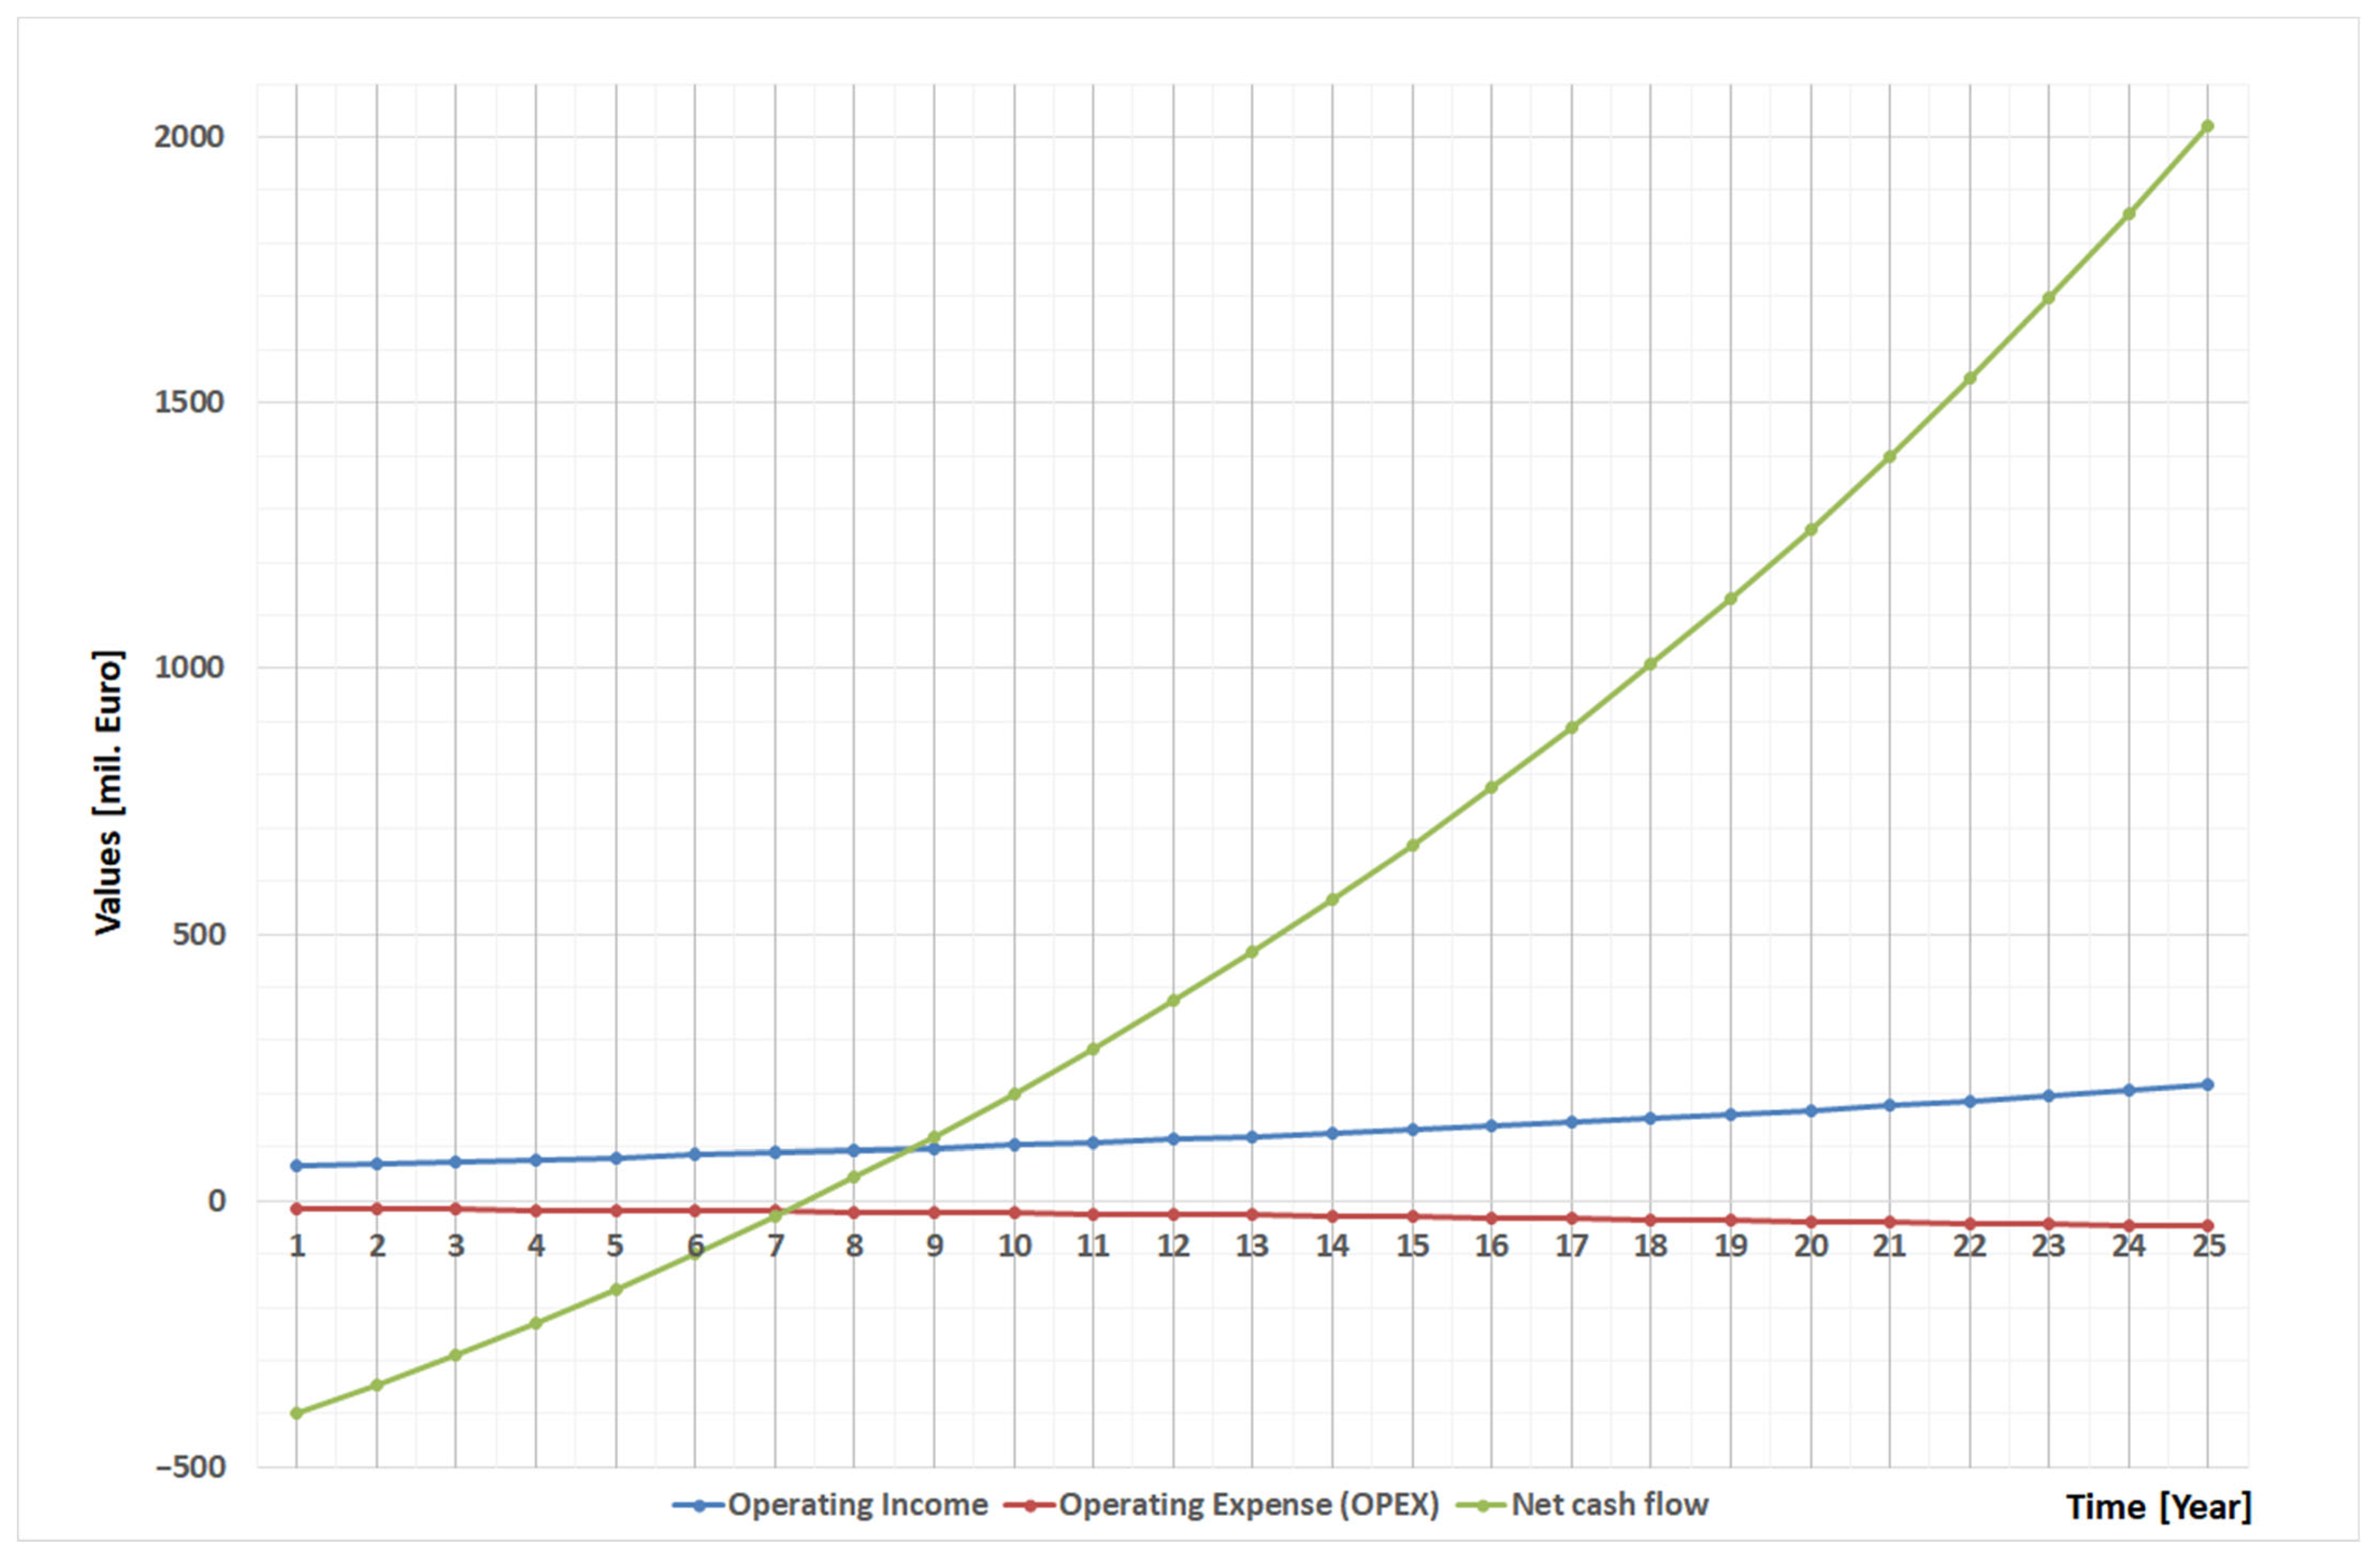
3.4. Outcomes of the Technical–Economic Study

Considering the values presented in the prior sections, Figure 9 displays the outcomes of linear depreciation applied to the investments made by the gas distributor.
As it can be noticed in Table 7, the investment would be paid off in the 7th year of operation, assuming there were no crisis or economic uncertainty.
Besides the financial and economic benefits, the most significant advantage of H2NG is its environmental impact. H2NG reduces greenhouse gas emissions, leading to a more sustainable and eco-friendly process. Even though is not the main focus of this study, the impact can be estimated based on the CO2 reduction when burning H2NG instead of natural gas.

4. Discussion

As minimum changes are required in the standard equipment from distribution systems, a fact proved by the undergoing projects, H2NG became a favourable method to achieve the decarbonisation objectives. The goal now is to identify a cost-effective route to achieving the carbon reduction goal as soon as possible.
Injecting H2 into the natural gas grid reduces emissions of unburned hydrocarbons and CO, but increases NOx emissions. Advocates often argue that introducing 10% hydrogen to natural gas will decrease CO2 emissions by the same percentage. However, research shows otherwise: replacing 20% of natural gas with hydrogen will only reduce CO2 emissions by 10%. Of course, the dynamic of consumption significantly impacts both the flow and composition of the H2NG mix. Since the reduction in CO2 emissions is a crucial factor when adding hydrogen to natural gas, it is imperative to determine the exact extent of this reduction. In our future research, we will focus more on this area, but for now we can estimate, based on the observation that the quantity of CO2/kg H2NG burned decreases with the increase in H2 from 2.5 to 11% from 5 to 20% H2, that the decrease is between 2150 and 8630 kg/h from 5 to 20% H2, which can lead to a maximum CO2 reduction for a year of about 75.6 kt.
One disadvantage of using H2NG instead of natural gas is that it reduces the HHV, resulting in less energy delivered to clients. This can only be compensated for by increased gas flow rates, leading to capacity problems as a resulting effect. Another drawback stemming from this issue is the problem with capacity, if the system is already at its higher limit. All the distribution grids should be capable of using H2NG without any modifications in pipes, valves and fittings, at low levels of H2.
Flame stability, potential issues of hydrogen embrittlement, and their detrimental impacts on the environment pose significant safety risks. Adapting and modifying customer appliances incurs high costs, significantly contributing to the overall costs of implementing a hydrogen blending scenario. As studies show, the expenses of reducing CO2 through adding hydrogen to natural gas are rather steep; however, the subsequent operational costs in the long run are significantly lower. However, the possible advantages of reducing greenhouse gas emissions through the use of H2NG must also be taken into consideration.
The requirement for flexible hydrogen production, based on gas demand-dependent nominations, could impede the achievement of higher percentages of Hydrogen in H2NG.
Additionally, standardization is a critical factor in the country’s economic activity and requires attention. Due to the various distribution systems constructed over the years in Romania, it is imperative to investigate and evaluate the maximum hydrogen concentrations necessitating negligible or zero appliance modifications.
Nevertheless, as hydrogen is produced, its injection into gas grids may offer an economic solution for storing and transporting this type of energy due to dwindling international gas resources and high gas prices [20], with Europe’s reliance on Russian gas and the Ukraine–Russia conflict in mind.
Considering the scenario and its assumptions into account, and barring any unforeseen socioeconomic obstacles that may arise as a result of the feasibility study, it can be inferred that an investment in the hydrogen production capacity, for the purpose of creating H2NG and selling the excess output on the open market, will prove self-financing within seven years of operation.
A detailed energy cost analysis for all the scenarios, combined with an assessment of the environmental impact throughout the product lifecycle, as well as a risk management analysis concerning the introduction of hydrogen into current gas distribution grids, is required to gain a comprehensive overview of which option best suits Romanian distributors in terms of harmful emission reduction. This investigation will give us a better picture of all the impacts on end users [21,22,23], which are currently minimal according to the literature.
The construction of a new hydrogen generation capacity will be a major capital investment and will have to be combined with greenhouse gas emission reduction measures.

5. Conclusions

Injecting H2 into gas distribution networks poses a significant challenge in balancing supply and demand across vast networks. Considering the rising production of renewable energy and the unpredictability that accompanies it, operating scenarios may become increasingly difficult in the near future.
In this study, we used only a medium-pressure distribution grid of a big city in Romania. The first simulation presented in an earlier article worked on the hypothesis of H2NG entering through only one entry point. For this article, we made the obvious step and simulated the entry of H2NG through all entry points and for different percentages of hydrogen. The study examined seasonal consumption habits in two consumer categories, with 94% of respondents from households and 6% from the industry sector, but also, we analysed the hourly consumption and their implication in the dynamic of the mix and the balance of the energy.
In the case of introducing hydrogen into the distribution grid, it is important to consider that several key parameters for gas network management proved to be the composition and HHV, but also the pipeline pressure drop, flowrate and velocity must be taken into consideration. As resulted from the study, the variation in H2 in the network was quite high, depending of the entry point levels and consumptions.
An economic analysis was carried out on seasonal real consumption, demonstrating the investment’s profitability as confirmed by the ERR and ENPV.
There is a possibility to find a technically superior solution with greater environmental friendliness. This solution incorporates electricity from sustainable and green sources into the technological process.
As we strive to decarbonize our energy systems, a new issue emerges: calculating the actual expense of H2NG delivery. Vital variables impacting the feasibility of this solution include regulation, investment positioning and dimensioning, hydrogen prices and the cost of electricity. The whole of Europe, including the Romanian authorities, is keen to take immediate action and has adjusted their approach to energy sources and their usage. This shift aims to decrease dependence on finite resources and promote the exploitation of renewable energy sources. The aim is to conduct further research on the H2NG’s environmental impact, focusing particularly on CO2 reduction, and to assess its socioeconomic implications.
There are currently two new projects in the south of Romania, financed by European funds, which are in the development phase and whose aim is to build new distribution systems that will allow the use of H2NG. With the help and collaboration of the two major distribution companies in Romania, Distrigaz Sud Retele and Delgaz Grid, the next step will be the analysis of all the above aspects in these real distribution systems.

Author Contributions

Conceptualization, C.N.E., A.N. and D.B.S.; methodology, C.N.E., A.N. and D.B.S.; software, D.B.S. and C.N.E.; validation, C.N.E., A.N., D.B.S., D.C., A.P.P., B.I. and R.R.; formal analysis, D.B.S., D.C., B.I. and R.R.; investigation, C.N.E., A.N., D.B.S., D.C., A.P.P., B.I. and R.R.; resources, D.B.S., C.N.E., D.C., A.P.P., B.I. and R.R.; data curation, D.B.S. and C.N.E.; writing—original draft preparation, C.N.E., A.N., D.B.S. and C.P; writing—review and editing, C.N.E., A.N. and D.B.S.; visualization, C.N.E., A.N., D.B.S., D.C., A.P.P., B.I. and R.R.; supervision, A.N. and C.N.E.; project administration, A.N.; funding acquisition, C.N.E., A.N. and D.B.S. All authors have read and agreed to the published version of the manuscript.

Funding

This research received no external funding.

Data Availability Statement

Data are contained within the article.

Conflicts of Interest

D.C. was employed by the company NIS Petrol SRL. B.I. was employed by the company OMV Petrom S.A. The remaining authors declare that the research was conducted in the absence of any commercial or financial relationships that could be construed as a potential conflict of interest.

Nomenclature

ATRAutothermal Reforming;
BoPBalance of Plant;
CAPEXCAPital EXPenditure;
CNGCompressed Natural Gas;
COCarbon Monoxide;
CO2Carbon Dioxide;
COPEXCapital Operating EXPenses;
ENPV (VANE)Economic Net Present Value;
EPExit Point;
ERR (RIRE)Economic Rates of Return;
GHGGreenhouse Gas;
H2Molecular Hydrogen;
H2NGHydrogen Natural Gas mix;
HHVHigher Heating Value;
MRDSMeasuring Regulation and Deliver Station
MWhMegaWatt hour;
PCHParliament Commission for Hydrogen;
PREOSPeng–Robinson Equation of State;
SMRSteam Methane Reforming;
SRSSector Regulation Station.

References

  1. Neacsa, A.; Eparu, C.N.; Stoica, D.B. Hydrogen–Natural Gas Blending in Distribution Systems—An Energy, Economic, and Environmental Assessment. Energies 2022, 15, 6143. [Google Scholar] [CrossRef]
  2. Neacsa, A.; Panait, M.; Muresan, J.D.; Voica, M.C. Energy Poverty in European Union: Assessment Difficulties, Effects on the Quality of Life, Mitigation Measures. Some Evidences from Romania. Sustainability 2020, 12, 4036. [Google Scholar] [CrossRef]
  3. FocusEconomics. Natural Gas Prices. Available online: https://www.focus-economics.com/commodities/energy/natural-gas/ (accessed on 25 October 2023).
  4. Chen, Z.; Wang, H.; Li, T.; Si, I. Demand for Storage and Import of Natural Gas in China until 2060: Simulation with a Dynamic Model. Sustainability 2021, 13, 8674. [Google Scholar] [CrossRef]
  5. Macrotrends. Natural Gas Prices—Historical Chart. Available online: https://www.macrotrends.net/2478/natural-gas-prices-historical-chart (accessed on 25 October 2023).
  6. Di Sarli, V.; Di Benedetto, A.; Long, E.; Hargrave, G. Time-Resolved Particle Image Velocimetry of dynamic interactions between hydrogen-enriched methane. Int. J. Hydrogen Energy 2012, 37, 16201–16213. [Google Scholar] [CrossRef]
  7. Cammarota, F.; Di Benedetto, A.; Di Sarli, V.; Salzano, E. The Effect of Hydrogen addition on the Explosion of Ethanol/Air Mixtures. Chem. Eng. Trans. 2012, 26, 405–410. [Google Scholar] [CrossRef]
  8. Salzano, E.; Cammarota, F.; Di Benedetto, A.; Di Sarli, V. Explosion behavior of hydrogen–methane/air mixtures. J. Loss Prev. Process Ind. 2012, 25, 443–447. [Google Scholar] [CrossRef]
  9. Jaworski, J.; Kułaga, P.; Ficco, G.; Dell’Isola, M. Domestic Gas Meter Durability in Hydrogen and Natural Gas Mixtures. Energies 2021, 14, 7555. [Google Scholar] [CrossRef]
  10. Leicher, J.; Schaffert, J.; Cigarida, H.; Tali, E.; Burmeister, F.; Giese, A.; Albus, R.; Görner, K.; Carpentier, S.; Milin, P.; et al. The Impact of Hydrogen Admixture into Natural Gas on Residential and Commercial Gas Appliances. Energies 2022, 15, 777. [Google Scholar] [CrossRef]
  11. Glanville, P.; Fridlyand, A.; Sutherland, B.; Liszka, M.; Zhao, Y.; Bingham, L.; Jorgensen, K. Impact of Hydrogen/Natural Gas Blends on Partially Premixed Combustion Equipment: NOx Emission and Operational Performance. Energies 2022, 15, 1706. [Google Scholar] [CrossRef]
  12. Di Sarli, V. Stability and Emissions of a Lean Pre-Mixed Combustor with Rich Catalytic/Lean-burn Pilot. Int. J. Chem. React. Eng. 2014, 12, 77–89. [Google Scholar] [CrossRef]
  13. Garcia-Agreda, A.; Di Sarli, V.; Di Benedetto, A. Bifurcation analysis of the effect of hydrogen addition on the dynamic behavior of lean premixed pre-vaporized ethanol combustion. Int. J. Hydrogen Energy 2012, 37, 6922–6932. [Google Scholar] [CrossRef]
  14. Sun, H.; Awan, R.U.; Nawaz, M.A.; Mohsin, M.; Rasheed, A.K.; Iqbal, N. Assessing the socio-economic viability of solar commercialization and electrification in south Asian countries. Environ. Dev. Sustain. 2020, 23, 9875–9897. [Google Scholar] [CrossRef]
  15. SR EN ISO 6975:2005; Gaz Natural-Analiza Extinsă. Metoda Gaz-Cromatografică. European Committee for Standardization: Brussels, Belgium, 2005.
  16. Eparu, C.; Neacşu, S.; Stoica, D.B. An Original Method to Calculate the Daily Gas Balance for the Gas Network Distribution. In Proceedings of the 21st International Business Information Management Association (IBIMA) Conference, Vienna, Austria, 27–28 June 2013; pp. 735–747. [Google Scholar]
  17. NetGAS R&D. AdmoduNet v2.0 Software. Available online: https://netgas.ro/AdmoduNet/ (accessed on 25 October 2023).
  18. Cihlar, J.; Lejarreta, A.V.; Wang, A.; Melgar, F.; Jens, J.; Rio, P.; Leun, K.v.d. ASSET Study on Hydrogen Generation in Europe: Overview of Costs and Key Benefits; Publications Office of the European Union: Luxembourg, 2021. [Google Scholar] [CrossRef]
  19. Xiang, L.; Jiang, H.; Ren, F.; Chu, H.; Wang, P. Numerical study of the physical and chemical effects of hydrogen addition on laminar premixed combustion characteristics of methane and ethane. Int. J. Hydrogen Energy 2020, 45, 20501–20514. [Google Scholar] [CrossRef]
  20. Neacsa, A.; Eparu, C.N.; Panaitescu, C.; Stoica, D.B.; Ionete, B.; Prundurel, A.; Gal, S. Hydrogen–Natural Gas Mix—A Viable Perspective for Environment and Society. Energies 2023, 16, 5751. [Google Scholar] [CrossRef]
  21. De Vries, H.; Levinsky, H.B. Flashback, burning velocities and hydrogen admixture: Domestic appliance approval, gas regulation and appliance development. Applied Energy 2020, 259, 114116. [Google Scholar] [CrossRef]
  22. Wahl, J.; Kallo, J. Quantitative valuation of hydrogen blending in European gas grids and its impact on the combustion process of large-bore gas engines. Int. J. Hydrogen Energy 2020, 45, 32534–32546. [Google Scholar] [CrossRef]
  23. Zhuang, Z.; Yan, J.; Sun, C.; Wang, H.; Wang, Y.; Wu, Z. The numerical simulation of a new double swirl static mixer for gas reactants mixing. Chin. J. Chem. Eng. 2020, 28, 2438–2446. [Google Scholar] [CrossRef]
Figure 1. Graphic abstract of the article (source: authors, based on article content).
Energies 17 00391 g001
Figure 2. Medium-pressure distribution grid (Source: authors, based on case study).
Energies 17 00391 g002
Figure 3. HHV variation for different H2 percentages in H2NG (Source: authors, based on case study).
Energies 17 00391 g003
Figure 4. Gas parameters—initial scenario (Source: authors, based on network simulation).
Energies 17 00391 g004
Figure 5. HHV deviation for different H2 ratios in the H2NG—summer (Source: authors, based on case study).
Energies 17 00391 g005
Figure 6. HHV deviation for area no. 7 (Source: authors, based on case study).
Energies 17 00391 g006
Figure 7. H2% dynamic in a pipe (Source: authors, based on case study).
Energies 17 00391 g007
Figure 8. (a) Parameters dynamic in a pipe for a dynamic simulation; (b) zonal hourly consumption variation (Source: authors, based on case study).
Energies 17 00391 g008aEnergies 17 00391 g008b
Figure 9. The straight-line approach to depreciation for the discussed investment (Source: authors, based on the considered case study data).
Energies 17 00391 g009
Table 1. Entry point gas composition (Source: authors, based on case study data).
No.Component NameMRDS 1MRDS 2MRDS 3MRDS 4
1.Methane0.9080.8780.7780.878
2.Nitrogen0.00630.00630.00630.0063
3.ISO—Butane0.00490.00490.00490.0049
4.N—Butane0.00910.00910.00910.0091
5.N—Pentane0.00150.00180.00180.0018
6.ISO—Pentane0.00190.00190.00190.0019
7.Ethane0.0210.0510.1510.051
8.Propane0.024820.024820.024820.02482
9.Hexane+0.0053830.005080.005080.00508
10.Carbon dioxide0.0170970.01710.01710.0171
11.Hydrogen sulphide0000
12.Hydrogen0000
13.Mercaptan0000
14.Water0000
TOTAL100100100100
Table 2. Energy comparison—entry points (Source: authors, based on case study data).
Entry Points
NodeNameRequired Energy,
MWh
20% H2 Mix Energy, MWh20% H2 Mix—Required Energy, MWh
1MRDS112,896.611,196.5612,895.64
2MRDS221,490.9418,621.5120,179.98
3MRDS321,190.0218,270.8621,191.16
4MRDS419,837.7917,189.0819,839.07
Total75,415.3565,278.0174,105.84
Table 3. Energy comparison—exit points (Source: authors, based on case study data).
Exit Points
NodeName Required Energy,
MWh
20% H2 Mix Energy, MWh20% H2 Mix—Required Energy, MWh
23EP 116,889.483415,850.292416,929.8161
24EP 28519.03507386.80598518.5508
25EP 310,812.62139375.561310,810.8050
26EP 41983.77911718.90831985.3391
27EP 516,479.630914,238.981816,479.3062
28EP 617,852.933515,425.563617,852.8289
29EP 72645.03882291.87772644.2539
Total75,182.522066,287.991175,220.9000
Table 4. Investment cost for hydrogen production capacity and mix transmission (Source: authors, based on case study from [1]).
Type of InvestmentInvestment Requirement Costs, EUR/Scenario
Equipment investment cost for hydrogen production capacity (NG mix with 20% H2-scenario)451,310,000
Total costs of hydrogen transmission15 in first operating year to 48 in the last 25th operating year
Table 5. Seasonal consumption of H2GN for different types of consumers and distribution tariffs in the year 2022 (Source: authors, based on case study).
NoSeasonMonthsHousehold
Consumption/Tariff, %/Euro/MWh
Commercial
Consumption/Tariff, %/Euro/MWh
Total Household Consumption, MWhTotal
Commercial
Consumption, MWh
Household
Consumption Cost, Euro/Season
Commercial
Consumption Cost, Euro/Season
1Winter360/52.140/69.445,249.2130,166.14212,173,549.6188,417,714.0
2Spring250/52.150/69.415,711.5315,711.5349,114,247.665,422,817.3
3Summer540/52.160/69.43197.6114796.4169,995,731.619,972,277.7
4Autumn250/52.150/69.415,711.5315,711.5349,114,247.665,422,817.3
320,397,776.4339,235,626.3
Total annual value659,633,402.7 Euro/year
Table 6. Seasonal revenue from the remaining hydrogen sale in the year 2022 (Source: authors, based on case study).
NoSeasonMonthsAmount of Hydrogen Sold, MWh/SeasonTotal Value Per Season, Euro/Season
1Winter3338.4830,463.42
2Spring21790.91322,364.25
3Summer513,484.26205,023.67
4Autumn21790.91322,364.25
Total annual value880,215.59
Table 7. Values of the Economic Rates of Return and the Economic Net Present Value for the case study (Source: authors, based on case study).
ERR17.24%(>5.5%)
ENPV959 mil. Euro(>0)
Disclaimer/Publisher’s Note: The statements, opinions and data contained in all publications are solely those of the individual author(s) and contributor(s) and not of MDPI and/or the editor(s). MDPI and/or the editor(s) disclaim responsibility for any injury to people or property resulting from any ideas, methods, instructions or products referred to in the content.

