1. Introduction
In 2015, the Paris Agreement was adopted by 196 state parties to limit global average temperature increases to well below 2 °C above pre-industrial levels [
1]. Undoubtedly, there is not a single end-all solution to achieve these goals and benefit ecosystem vigor. Indeed, several complementary key levers are needed to achieve these goals, including behavioral changes. One of the essential energy sectors that plays a vital role in people’s daily lives and the global economy is transportation. This also makes it a major contributor to global emissions. While efforts have been increasingly made to invest in alternative decarbonized alternatives, conventional internal combustion engines (ICE) are still the main transportation option, producing roughly eight billion metric tons of carbon dioxide equivalent (GtCO
2e) in 2022. This accounted for approximately 14% of global greenhouse gas (GHG) emissions that year, making transportation the second-largest source of emissions worldwide [
2].
Decarbonizing transportation is considered crucial for a sustainability transition of the wider European energy system. Within the European Union (EU), the transport sector accounted for almost 1/4 of greenhouse gas emissions with the heavy-duty sector’s emissions share reaching 1/5 of the road transport sector’s emissions in Europe [
3]. In order to decarbonize the transportation sector, one of the emerging EU regulations involved banning all new sales of ICE light-duty vehicles from 2035 [
4]. Another appearing pathway is to invest in synthetic fuels [
5]. In fact, synthetic fuels are liquid fuels that have the same properties as fossil fuels but are produced using renewable resources (mainly renewable electricity and hydrogen) combined with captured CO
2 to form hydrocarbons, which explains their lower upstream emissions. Despite the current challenges caused by long charging time and lack of infrastructure availability, electric trucks have been slowly penetrating the heavy-duty sector. In fact, there is currently a limited charging infrastructure dedicated to BEV trucks available on main roads and their future availability is uncertain. To account for this uncertainty, we consider different high-power charging scenarios. Another net-zero technology that might offer a decarbonization solution in Europe, especially where road freight covers longer distances are hydrogen fuel cell electric vehicles (FCEVs). Depending on EU motivations to adopt hydrogen as the future fuel for trucks, providing a regulatory ecosystem to support the required infrastructure, FCEVs might play a crucial role in the future fleet of heavy-duty road vehicles.
The EU’s commitment to reduce GHG emissions as well as air and noise pollution is the main policy driver to decarbonize the heavy-duty transport. Due to the diversity of heavy-duty vehicles (HDVs), decarbonization policies must be formulated to consider their distinctions and uniqueness compared with passenger vehicles. In fact, HDVs are a crucial part for economic development due to their significant societal implications, affecting the access to and affordability of goods and services. Adding unprecedented situations such as the pandemic as well as the volatile geopolitical change, external Chinese and American competition have been impacting the assumptions driving HDV decarbonization assumptions in the EU. Being mainly aligned towards electrification, past and current policy directions might have underestimated potential risks including raw material availability as well as charging infrastructure challenges due to HDVs long-distance travel and high energy consumption. Due to the incomplete picture of the tailpipe approach to measuring emission reduction, policymaking should take into consideration supply security and adaptability. In addition, innovation should encourage to help the market be ahead of regulation to manage and respond to risks. In this context, the purpose behind treating MCC in this study is to understand its potential to help decarbonize the freight transport sector.
Another region of focus for this study is the Kingdom of Saudi Arabia (KSA), representative of a transport sector in great expansion for the past two decades. The Kingdom has pledged to achieve net zero greenhouse gas (GHG) emissions by 2060, aiming to have renewable sources accounting for more than 50% of its electricity capacity by 2030 [
6]. Beyond a domestic energy mix transformation, the KSA is steering a range of ambitious initiatives that will reduce emissions. Saudi decarbonization aspirational goals have also included the transport sector despite the dominance by gasoline and diesel fueled vehicles leading to an increase in oil demand for transport by 110% between 2000 and 2021 [
7]. For diesel demand in transport in Saudi Arabia, it increased from 8.8 million tons of oil equivalent in 2000 to 20.9 million tons of oil equivalent in 2018 [
8]. Although the dominance of diesel fuel trucks, the KSA has started deploying BEVs. Quantrom AG (Augsburg, Germany) and Petromin Corporation (Jeddah, Saudi Arabia) have partnered in the Kingdom of Saudi Arabia, to deliver 50 battery-electric EV trucks. This marks the most extensive deployment of battery-electric trucks in Saudi Arabia and aligns with the country’s vision to decarbonize mobility, a key component of Saudi Vision 2030 [
9]. Due to the importance of hydrogen within the sustainability strategy in the KSA, FCEV has been emerging as a potential key alternative technology. In fact, FCEVs might play a niche role in the future fleet of heavy-duty road vehicles [
10]. In this context, Hyundai is planning to set up a production plant sharing its hydrogen expertise with Saudi Arabia since the Korean giant has extensive experience of fuel cells and hydrogen. It has also developed a hydrogen-powered truck that has been running in the country since 2021 [
11]. In this study, we investigate the potential of low carbon fuel technologies including BEV sand FCEVs as well as Mobile Carbon Capture (MCC) in penetrating the Saudi freight transport technology market.
Different studies have been conducted to quantify policy regulations impacts on future GHG emissions. Using the multiregional WILIAM model (Within Limits Integrated Assessment Model) [
12], authors have investigated the future of the Spanish passenger vehicles sector under different scenarios. Similarly, energy scenarios have been explored in the transition to sustainable mobility in Ecuador showing that the transition to sustainable mobility requires a combination of government policies, technological innovation, and a firm commitment to the electrification of transport [
13]. In addition, Månsson et al. [
14] developed a study to understand the influence of external factors on energy security for passenger and freight transport on Swedish roads. Moreover, based on an extensive analysis for the light-duty vehicle sector in China, Saafi et al. showed that adding to BEVs, FCEVs could also be part of the solution to decarbonize transportation [
15]. Compared with these studies, the novelty of our work comes from the application of consumer behavior modeling approach on freight transport technologies. In fact, the heavy-duty sector is better suited for profit-based decision-making strategies than the light-duty sector because freight transport companies purchase their trucks aiming to reduce the overall needed investments over the trucks lifespan. In contrast, it is more complicated to quantify consumer behavior for the light-duty sector because it doesn’t only depend on the total cost of ownership as it is also linked to preferences that may vary with different demographics such as age, income or/and education level [
16]. The reliability of market penetration modelling and GHG emissions calculations is further explained under the methodology section.
Energy Systems Optimization Models (ESOMs) are used to minimize the total discounted monetary cost of the energy system over a relatively long-time horizon, including capital investment costs as well as other fixed and variable costs to meet required end-use energy service demands. A famous bottom-up energy sector model, MARKAL/TIMES, is considered to have a high level of technological and economic detail by solving a deterministic linear program (LP) [
17]. While standard LP model used by TIMES only allows a single representative decision maker, the Market Acceptance of Advanced Automotive Technologies (MA3T) as well as the New Energy and Oil Consumption Credits (NEOCC) model models—both developed by Oak Ridge National Laboratory- simulates the vehicle market penetration over time solving a global optimization formulated based on a multinomial logit model of consumer purchase behavior [
18,
19,
20]. Despite the advanced techniques in quantifying consumer behavior and acceptance of different technologies, the above mentioned ESOMs have not captured the intangible costs associated with the adoption of costs associated with heavy-duty technologies. Therefore, the Mobility and Energy Transportation Analysis (META) Model has been developed to project market penetration, energy demand, and greenhouse gas (GHG) emissions specifically for freight transport technologies. Similar to the NEOCC and MA3T models, META has the ability to integrate consumer choice to project vehicle annual sales. On top of it, META offers the novelty of its flexibility in treating different regions, optimization performance, energy demand, and GHG emissions calculation, alternative fuels integration, sensitivity analysis, and machine learning deployment.
In this work, our major focus is on the heavy-duty sector. Due to the current battery size and charging availability challenges faced by the electric trucks, on-road CO2 emissions from conventional heavy-duty vehicles are likely to continue. This could emphasize the need for MCC as an effective alternative to reduce CO2 emissions from freight shipping. The economic implications of MCC technology compared with electric and fuel cell trucks are examined herein. In the economic evaluation, we quantify the total cost of ownership of a heavy-duty vehicle including all aspects of owning the vehicle. More details are provided in the methodology section. Based on the total cost of ownership for each vehicle technology, we quantify consumer acceptance of each technology while complying with emission constraints. This helps us understand the opportunities that MCC technology possesses to compete with alternative emerging technologies. This research makes a novel contribution to the road freight sector’s net zero emission goals by endogenizing the intangible costs of adopting BEVs and FCEVs, as well as on-board carbon capture technologies. It incorporates the hidden costs of using zero emission trucks, including significant recharging/refueling time, reduced cargo capacity, and reluctance to invest in immature technology by vehicle buyers. The key objectives of this study are to: (1) identify the feasible pathways to decarbonize the road freight sector, (2) quantify market acceptance of alternative vehicle technologies in different regions (3) analyze the impact of zero-emission trucks on the energy system. By addressing common concerns and uncertainties related to adoption of technology and market incentives, this research contributes to a global dialogue that seeks to foster sustainable practices in the road freight sector. Based on the results, carbon capture could have an opportunity to penetrate the heavy-duty sector through its practicality and cost-competitiveness while mitigating on-road GHG emissions.
2. Materials and Methods
The Mobility and Energy Transportation Analysis (META) Model is composed of a market penetration module—from both demand side and supply side- as well as a vehicle fleet module. While META quantifies the consumer’s behavior by including all costs taken into consideration when purchasing a vehicle on the demand side, the supply side is simulated by minimizing the net present value investments over the vehicle’s lifetime under the emissions constraints of government policies. In this work, the emissions constraints of the optimization model force the new sales to reach carbon neutrality in 2050 on a Tank-to-Wheel basis for both the EU and KSA. In fact, META projects the market dynamics of three different vehicle powertrains including ICE vehicles (ICEVs) running on diesel, battery electric trucks (BETs) and fuel cell electric trucks (FCETs). Consumer behavior is modeled using a multinomial logit function to find the probability of purchasing each vehicle technology every year. The utility function that feeds into the discrete choice model is composed of the total cost of owning each vehicle technology for the lifespan of the truck. This perceived cost of ownership includes the inconvenience costs representing the roundtrip and refueling/charging time, adding to the lifetime energy costs, insurance, and maintenance costs, as well as the retail price. In order to increase the reliability of the model methodology, we calibrate the model based on historical data.
The reliability of the simulation results is ensured through many elements. Firstly, in our approach we quantify the consumer behavior through complex objective function including all costs that taken into consideration when purchasing a truck. We have a detailed landscape of costs, including the inconvenience costs, in which we try to determine how long it would take to refuel/recharge a truck and how long it would take to get to the nearest station within our TCO analysis. In fact, this approach is best fitted for the freight transport sector, because the consumer in our case is the freight transport company, and it reasonable that they make their decision based on the total cost of ownership over the lifespan of the vehicle to make a bigger profit. Finally, in order to trust our results in the past, we first apply it to the historical data for the calibration process. This step allows us to tune the model to have the exact sales that occurred in the past, so that we can confidently project for the future. At the end, there is no model that could perfectly predict the future. Our approach is rather to project what would happen if a certain scenario/assumption takes place. In addition to applying consumer behavior modeling on the freight transport sector, the novelty of our work also comes from the detailed cost categories taken into consideration in the analysis including intangible costs associated with heavy-duty technologies.
Total cost of ownership (TCO) is a linear combination of the different costs when purchasing a vehicle. It is a tool to estimate the expenses associated with purchasing, deploying, and using a product, a heavy-duty vehicle in our case. TCO determines the return on investment (ROI) by quantifying the cost of purchasing a vehicle technology during its entire lifecycle. In this work, TCO includes retail price, maintenance and insurance costs, labor costs, energy costs, as well as infrastructure and emissions costs. In order to quantify the utility specification of the multinomial logit function, emissions costs aren’t considered, as it doesn’t represent an actual cash flow. Emissions impact on decision making is modeled through the optimization emissions constraints, forcing both consumers and OEMs to comply with the annual regulation targets.
The decision variables in the market penetration optimization model are the subsidies for alternative solutions, including BETs and FCETs retail prices, as well as hydrogen and e-diesel retail prices at the refueling stations. The market penetration simulation is a multivariable optimization problem, maximizing the marginal abatement cost (MAC) profit with the objective function shown in Equation (1). MAC refers to the marginal loss in project spendings from avoiding a unit of pollution, ton of CO
2 in our case. MAC is the present value of the net cost incurred in reducing one ton of carbon dioxide equivalent (CO
2e) over the alternative’s operational lifetime. It is a tool to find out the best option to reduce emissions while leading to cost savings. The optimization is constrained by emissions targets, assuming to reach net-zero for new freight transport vehicles sales on a Tank-to-Wheel basis. Since all transportation policies are currently issued on tailpipe emissions, the upstream emissions for electricity or hydrogen were not considered.
where;
n is the number of years (10 in this case).
Capext refers to capital expenditures at year t.
FOMt refers to fixed operation and maintenance costs at year t.
VOMt refers to variable operation and maintenance costs at year t.
Fuelt refers to fuel costs at year t.
r refers to the interest rate.
CO2 Avoidedt refers to abated CO2 in tons at year t.
Due to the complexity of the objective function, mainly caused by the multinomial consumer behaviour logit functions, we apply the differential evolution (DE), a global optimization algorithm belonging to the evolutionary algorithms’ family, to minimize the aggregate marginal abatement cost each year. Similar to the family of evolutionary algorithms, DE adopts initialization, mutation, crossover, and selection processes. Differential evolution differs from standard genetic algorithms in that it relies upon distance and directional information through unit vectors for reproduction [
21]. Another peculiar characteristic is that crossover is applied after mutation, instead of the other way around. In addition, the mutation operator is not created from a probability distribution, as in the previous algorithms, but from the creation of the unit vector. In fact, differential evolution is the only evolutionary algorithm that uses directional information. The usage of directional information is vital as the algorithm takes a greedy approach by heading towards the direction of the target vector. In this way, differential evolution will find a minimum quicker than the other evolutionary algorithms. However, this minimum is not guaranteed to be global optima as the algorithm has poor exploration. As a result, differential evolution outperforms standard evolutionary algorithms when the optimization problem has only one or a couple of local optima. Moreover, when the input space has many local optima, then differential evolution should not be the best option. The optimization is constrained by the emission targets. In this work we assume that the automotive industry pledges to reach carbon neutrality by 2050, for all new sales.
TCO can be calculated as the initial purchase price plus costs of operation across the asset lifespan. In our case we assume fifteen years for the lifespan of heavy-duty vehicles.
Table 1 shows the main assumptions when quantifying the total cost. Based on a fuel consumption of 35 L/100 km [
22], for a conventional diesel truck and assuming 90% [
23] and 45% [
24], respectfully, for electric and fuel-cell heavy-duty vehicles energy efficiencies, we find the corresponding energy consumption shared in
Table 1. As for the tank size for fuel cell vehicles (FCEV), it is calculated based on assuming 500 km (310 miles) autonomy range. This results in a hydrogen tank size of 50 kg [
25]. The same methodology leads to a battery size of 800 kWh for a battery electric vehicle (BEV). BEV truck efficiency adopted in this study is similar to VOLVO findings [
26].
The biggest cost within the TCO belongs to the energy costs. This represents the amount of money spent on refueling or charging the heavy-duty vehicle, depending on its powertrain. Currently, public charging electricity prices are close to 0.48 euros/kWh [
27]. Additional fuel price assumptions are illustrated in
Table 2 for the KSA and
Table 3 for the EU. Infrastructure costs reflect the inconvenience cost for a consumer to get to the nearest refueling charging station. Therefore, we developed an integrated model to quantify the roundtrip time to get to the nearest station, depending on the infrastructure availability. This cost obviously decreases overtime for BEVs and FCEVs with the increase of implementing hydrogen and electricity charging stations. An additional factor that we take into consideration is the time of refueling/charging. Assuming a refilling speed of 1.6 kg/min, it would take around 30 min to refill a hydrogen tank in full [
28]; while for BEVs, it would take a longer time charging an 800-kWh heavy-duty truck [
27]. A cost value for the overall inconvenience time by accounting for the truck driver pay rates in the EU and KSA [
29,
30] during the lifetime required electricity is assigned. Inconvenience costs in this work are related to the charging and hydrogen refueling infrastructure advancement. We are assuming zero inconvenience penalty for MCC because the CO
2 is offloaded while the vehicle is fueled. Moreover, one of the benefits of MCC technology is that it could be implemented progressively rather than requiring major efforts to supply the required infrastructure network before implementation.
In order to conduct a reliable study, we take into consideration the added mass of the technology (MCC, battery) on the required energy as well as the saved CO2. In fact, added mass penalty refers to the additional fuel required due to the impact of the system weight on the truck’s fuel economy. Moreover, due to the system weight, freight would require additional trips to be transported. This adds up to the required additional fuel per year. This affects the TCO in many aspects. First of all, the additional miles would increase the labor cost, which in our case refers to the truck driver pay. In addition to that, this additional fuel/electricity is taken into consideration when calculating the lifetime fuel/electricity, increasing the energy costs and total GHG emissions costs. Burning more fuel leads to more CO2 emissions. In this work, we assume 150 euros per ton of CO2 as an emission penalty tax. The additional miles to transport remaining freight also impact insurance and maintenance costs that are originally calculated in euros per mile.
The MCC system cost depends on the exhaust gas flow through the system, percentage CO
2 capture, volume of systems produced and other factors. We assume that the MCC system always captures 90% of the CO
2 that passes through it. For the 50% case, we pass only 55% of the exhaust gas through the MCC system, to get a net CO
2 capture of 50%. This way the system, size, and cost will be smaller. Another cost within TCO is the retail price of purchasing heavy-duty vehicles. For conventional vehicles, BETs and FECTs, retail prices are assumed based on the current Statista database [
31]. As for MCC, we studied two options: 50% and 90% CO
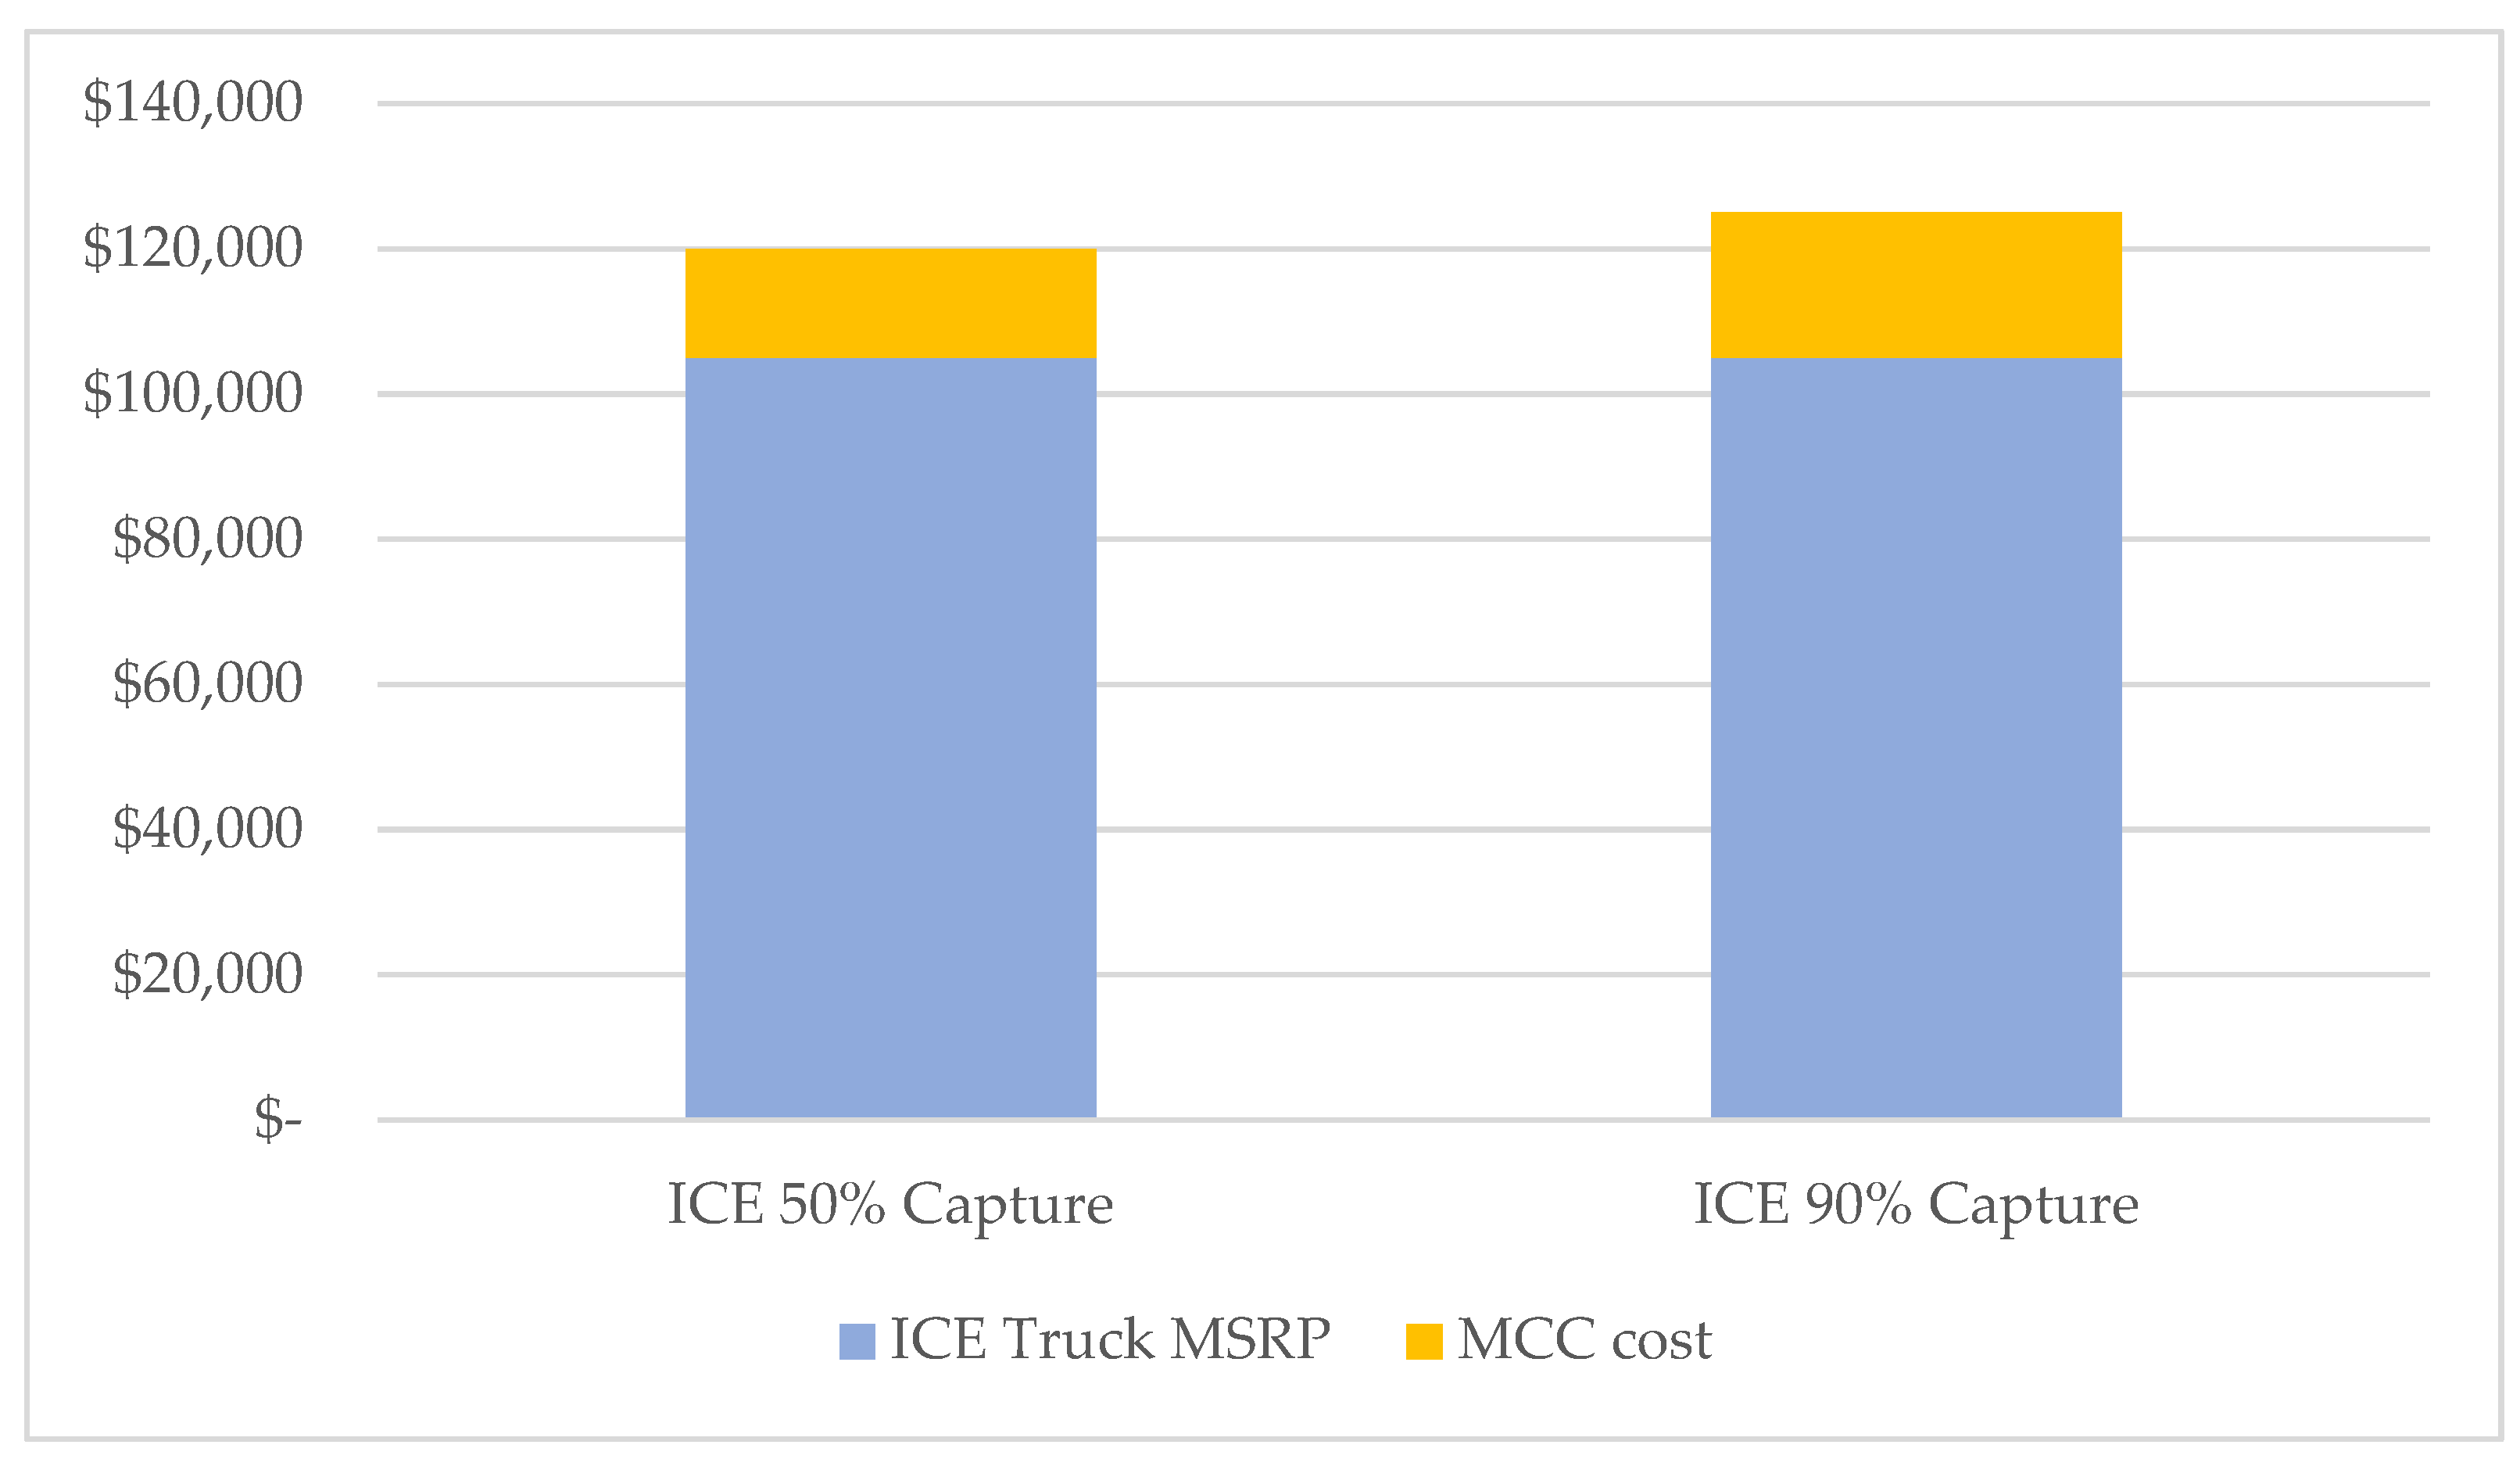
2 capture. The incremental capex for these options in comparison to the price of standard conventional diesel fuel truck elevates to 15,000 USD and 20,000 USD, for 50% and 90% CO
2 capture, respectfully, as shown in
Figure 1, representing less than 20% of ICEV retail price. MCC technology readiness is proven based on commercial solutions already available in the market, such as Ramora [
32]. By capturing CO
2 from vehicle exhaust, which is roughly 200–400 times more concentrated, MCC approach requires less capital upfront compared with other alternative technologies. The technology is considered repeatable and modular as it could work with any truck, so it will be completely modular and repeatable. In order to decarbonize the transportation sector, major efforts have been put to promote producing and distributing e-fuels in Europe. In this study, we assume that synthetic fuels blending could reach a total of 100% of the fuel composition by 2050 as a reference scenario.
The major modeling assumptions are illustrated in
Table 2 and
Table 3, for the KSA and EU, respectively. E-diesel retail price and carbon intensities projections are deduced from the recently published the techno-economic assessment joint report between Concawe and Aramco [
33]. E-diesel is projected to be cheaper in the KSA than in EU. The singularity of the KSA giving lower production costs compared with the EU is explained by climate considerations. Most EU countries suffer from extended periods with low wind and PV production, leading to high curtailment due to overbuilding renewable wind power used during intermittent periods at low capacity. As for hydrogen, blue hydrogen is currently dominant in the KSA. With the Saudi aspirations to invest in green energy within the 2030 kingdom vision, a lot of efforts are deployed to build renewable sites to produce green hydrogen. A pertinent example for that is NEOM project in the KSA, which is building a zero-carbon circular economy, fully powered by renewable energy [
34].
As Europe accelerates its ambitions to achieve climate neutrality by 2050, the energy system is projected to increasingly become greener by replacing fossil fuel generators with renewables. For electricity Well to Wheel (WTW) carbon intensities, we assume a fleet-based aggregation for electricity grid based on Statista electricity emissions database [
31]. These emission intensities are used in the energy modeling section of META, to quantify the impact of low carbon technologies market penetration on Well-to-Wheel emissions up for the freight transport sector up to 2050, as explained in the Fleet and Energy Modeling section below.
The market penetration module outputs are used withing the vehicle fleet module in META to project the fleet stocks, GHG emissions, and energy demand projections for each vehicle technology. Although the market penetration module constraints the objective function explained above by Tank-to Wheel emissions targets to match policies motivations being only focusing on tailpipe emissions, we investigate the impact of these regulations on the big picture by including the upstream emissions for producing electricity, e-diesel and hydrogen. In fact, the model estimates the well-to-wheel (WTW) which can be broken down into well-to-pump (WTP) including fuel production from the primary energy source, and pump-to-wheels (PTW) stages that constitute on-road emissions determined by the number of vehicles vehicle kilometers traveled (VKT), and vehicle FC rate (FCR) in J/km, for each year
m as shown in in Equation (2) [
35].
where
k,
i, and
j represent fuel type, vehicle technology, and vehicle age, respectively.
3. Results
In this section, we show the results for TCO analysis, MAC calculations, market penetration, as well as fleet stocks and GHG emissions projections for freight transport technologies. As shown in
Figure 2 and
Figure 3, TCO includes retail price, maintenance, and insurance costs, labor costs, energy costs, as well as infrastructure and emissions costs. TCO results show that additional avoided CO
2 for MCC 90% capture case makes it the most attractive solution across all regions, based on its reduced total GHG emissions costs. The increased inconvenience costs explained earlier for BEVs make it a less economical option. Energy costs represent the biggest share of TCO, accounting for the vehicle lifetime fuel and electricity charging costs. These costs are slightly higher for MCC options because of the additional required miles due to MCC system weight. The total cost of ownership of heavy-duty trucks is cheaper in the KSA, due to the reduced electricity and diesel retail price, being proportional to the energy costs over the lifetime of the vehicle. We also notice the reduced inconvenience costs in the EU compared with the KSA. This is due to the fact that the main inconvenience costs are related to the time of charging. For a standard charging station, it takes hours to charge an e-truck. This accounts for more time than the roundtrip time back and forth to the charging station. This gap is projected to be reduced over the years, since the KSA aspires to improve its charging infrastructure and gradually adopt 1 MW fast chargers.
Figure 2 and
Figure 3 also show TCO evolvement in the EU and KSA between 2030 and 2050. Due to projected improvement in charging infrastructure as well as the increase of 1 MW charging stations adoption, BET’s inconvenience costs are estimated to decrease making it a more economical solution over the time. As for hydrogen fueled trucks, the growth of hydrogen economy leading to the maturity of hydrogen production technologies would lead to a decrease in hydrogen refueling costs. Although ICE diesel vehicles would still be cost competitive with alternative net-zero vehicles, emission constraints would be the main driver for freight industry to promote BETs and FCETs by 2050.
To mitigate the emissions of carbon dioxide and, therefore, its contribution to climate change, various alternatives exist such as MCC options, BEVs and FCEVs, which do not burn fossil fuels and, thus, do not emit CO
2 during operation. To compare MCC cost estimates with other decarbonization strategies, values of carbon cost abatement/effectiveness were generated based on the assumptions explained above. Similar to TCO results,
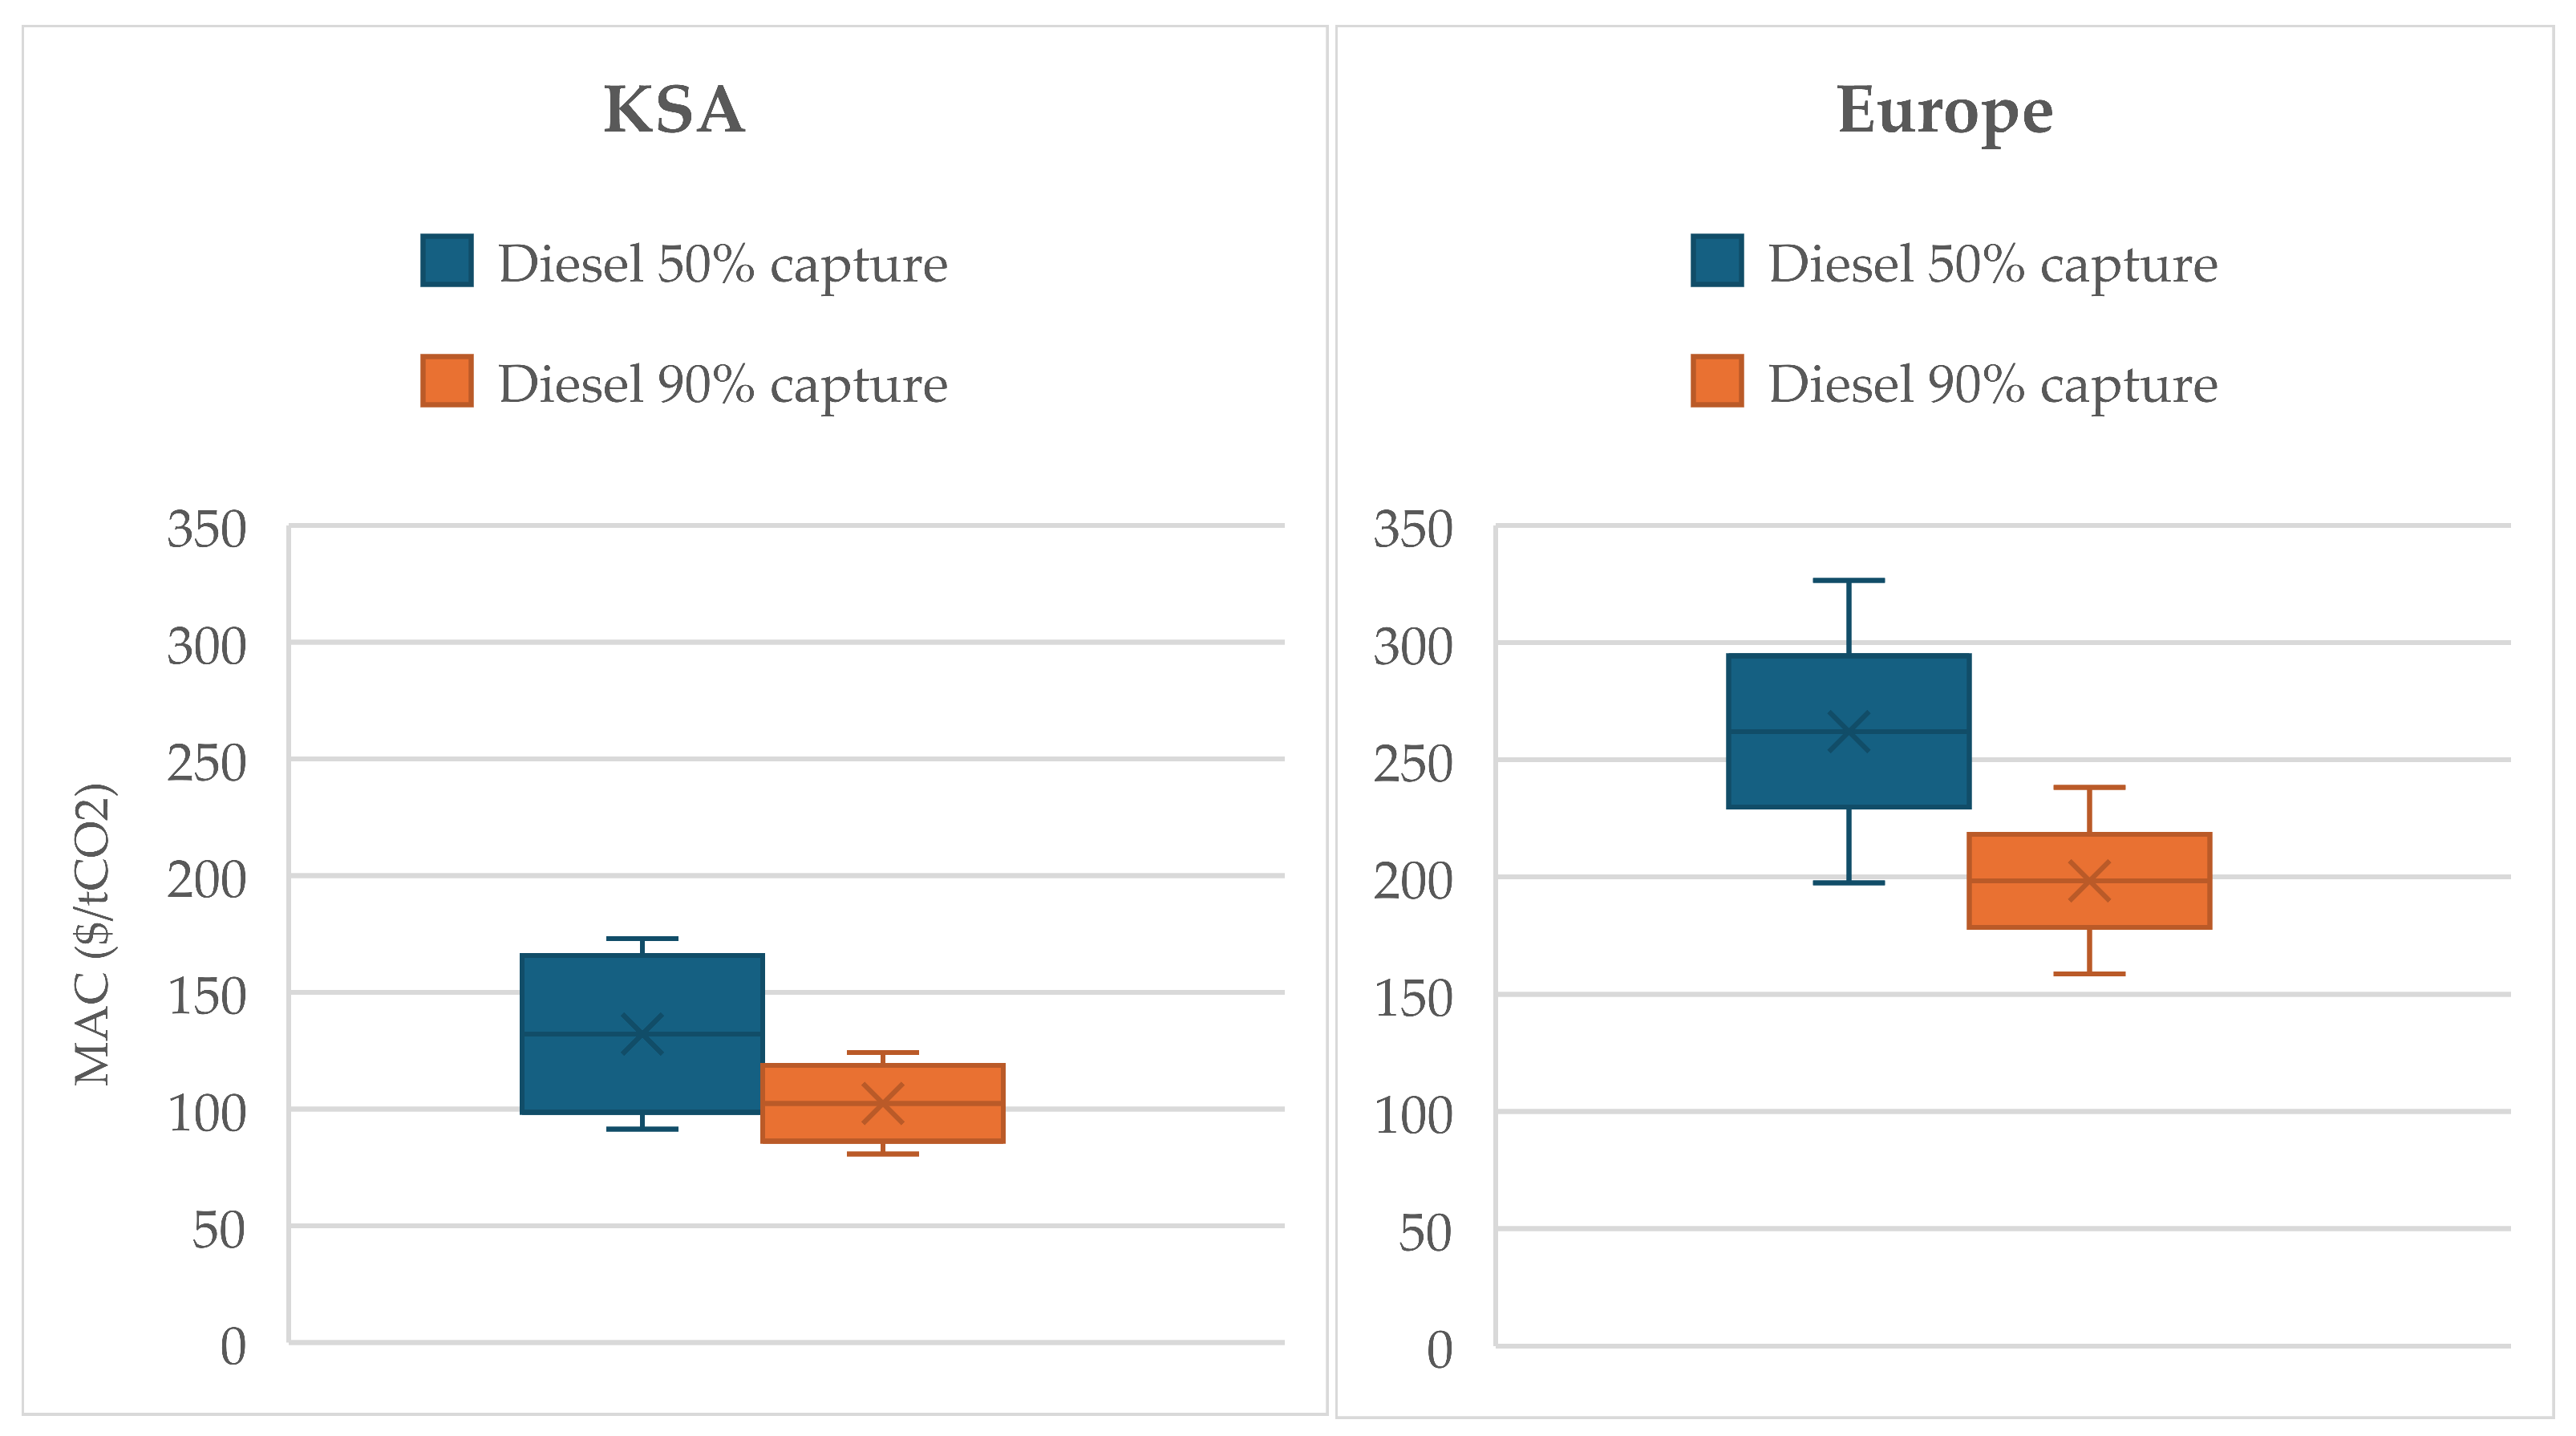
Figure 4 illustrates that the total carbon abatement cost for on-road vehicles is competitive with several other low-carbon alternatives. Results shown in
Figure 4 represent the incremental MAC values in 2024, relative to a conventional vehicle. Hence, MAC values are not calculated for ICE conventional trucks. For the KSA, it would cost 93
$ per ton of saved CO
2 compared with a standard diesel fueled truck, compared with 307
$ per ton of saved CO
2 in Europe. This is due to the competitive diesel refueling costs in the KSA. Overall, MCC guarantees lower MAC values than BETs and FCETs for both regions. Specifically, 90% capture systems offer the lowest MAC values as these technologies increase the amount of captured CO
2 compared with the 50% capture systems, compensating its added capex costs. Although these technologies require more offloading costs, upfront additional cashflow, and mass penalty, capturing higher amounts of CO
2 is more economic per 1 ton of saved CO
2. These results show that MCC is a feasible and economical approach to reduce carbon pollution from trucks that could be cost competitive with other low-carbon technologies.
MCC competitive TCO and MAC values urge the need to quantify the potential market acceptance opportunities as MCC could present an attractive alternative solution and may have opportunities to penetrate the market shares for heavy-duty vehicles, across all regions. The marginal abatement costs for all powertrains are cheaper in the KSA, due to the reduced electricity and diesel retail price, being proportional to the energy costs over the lifetime of the vehicle as well as the reduced labor costs compared with truck driver pay rates in Europe.
Figure 5 shows marginal abatement sensitivity margin for MCC with 50% and 90% carbon capture rates, respectively. These margins are obtained by varying the system costs as well as diesel price costs by 20%. The highest MAC values correspond to the most expensive MCC system costs as well the highest fuel cost assumptions, which corresponds to a 19% relative increase for 50% capture compared with an 11% increase for 90% capture rates MCC systems.
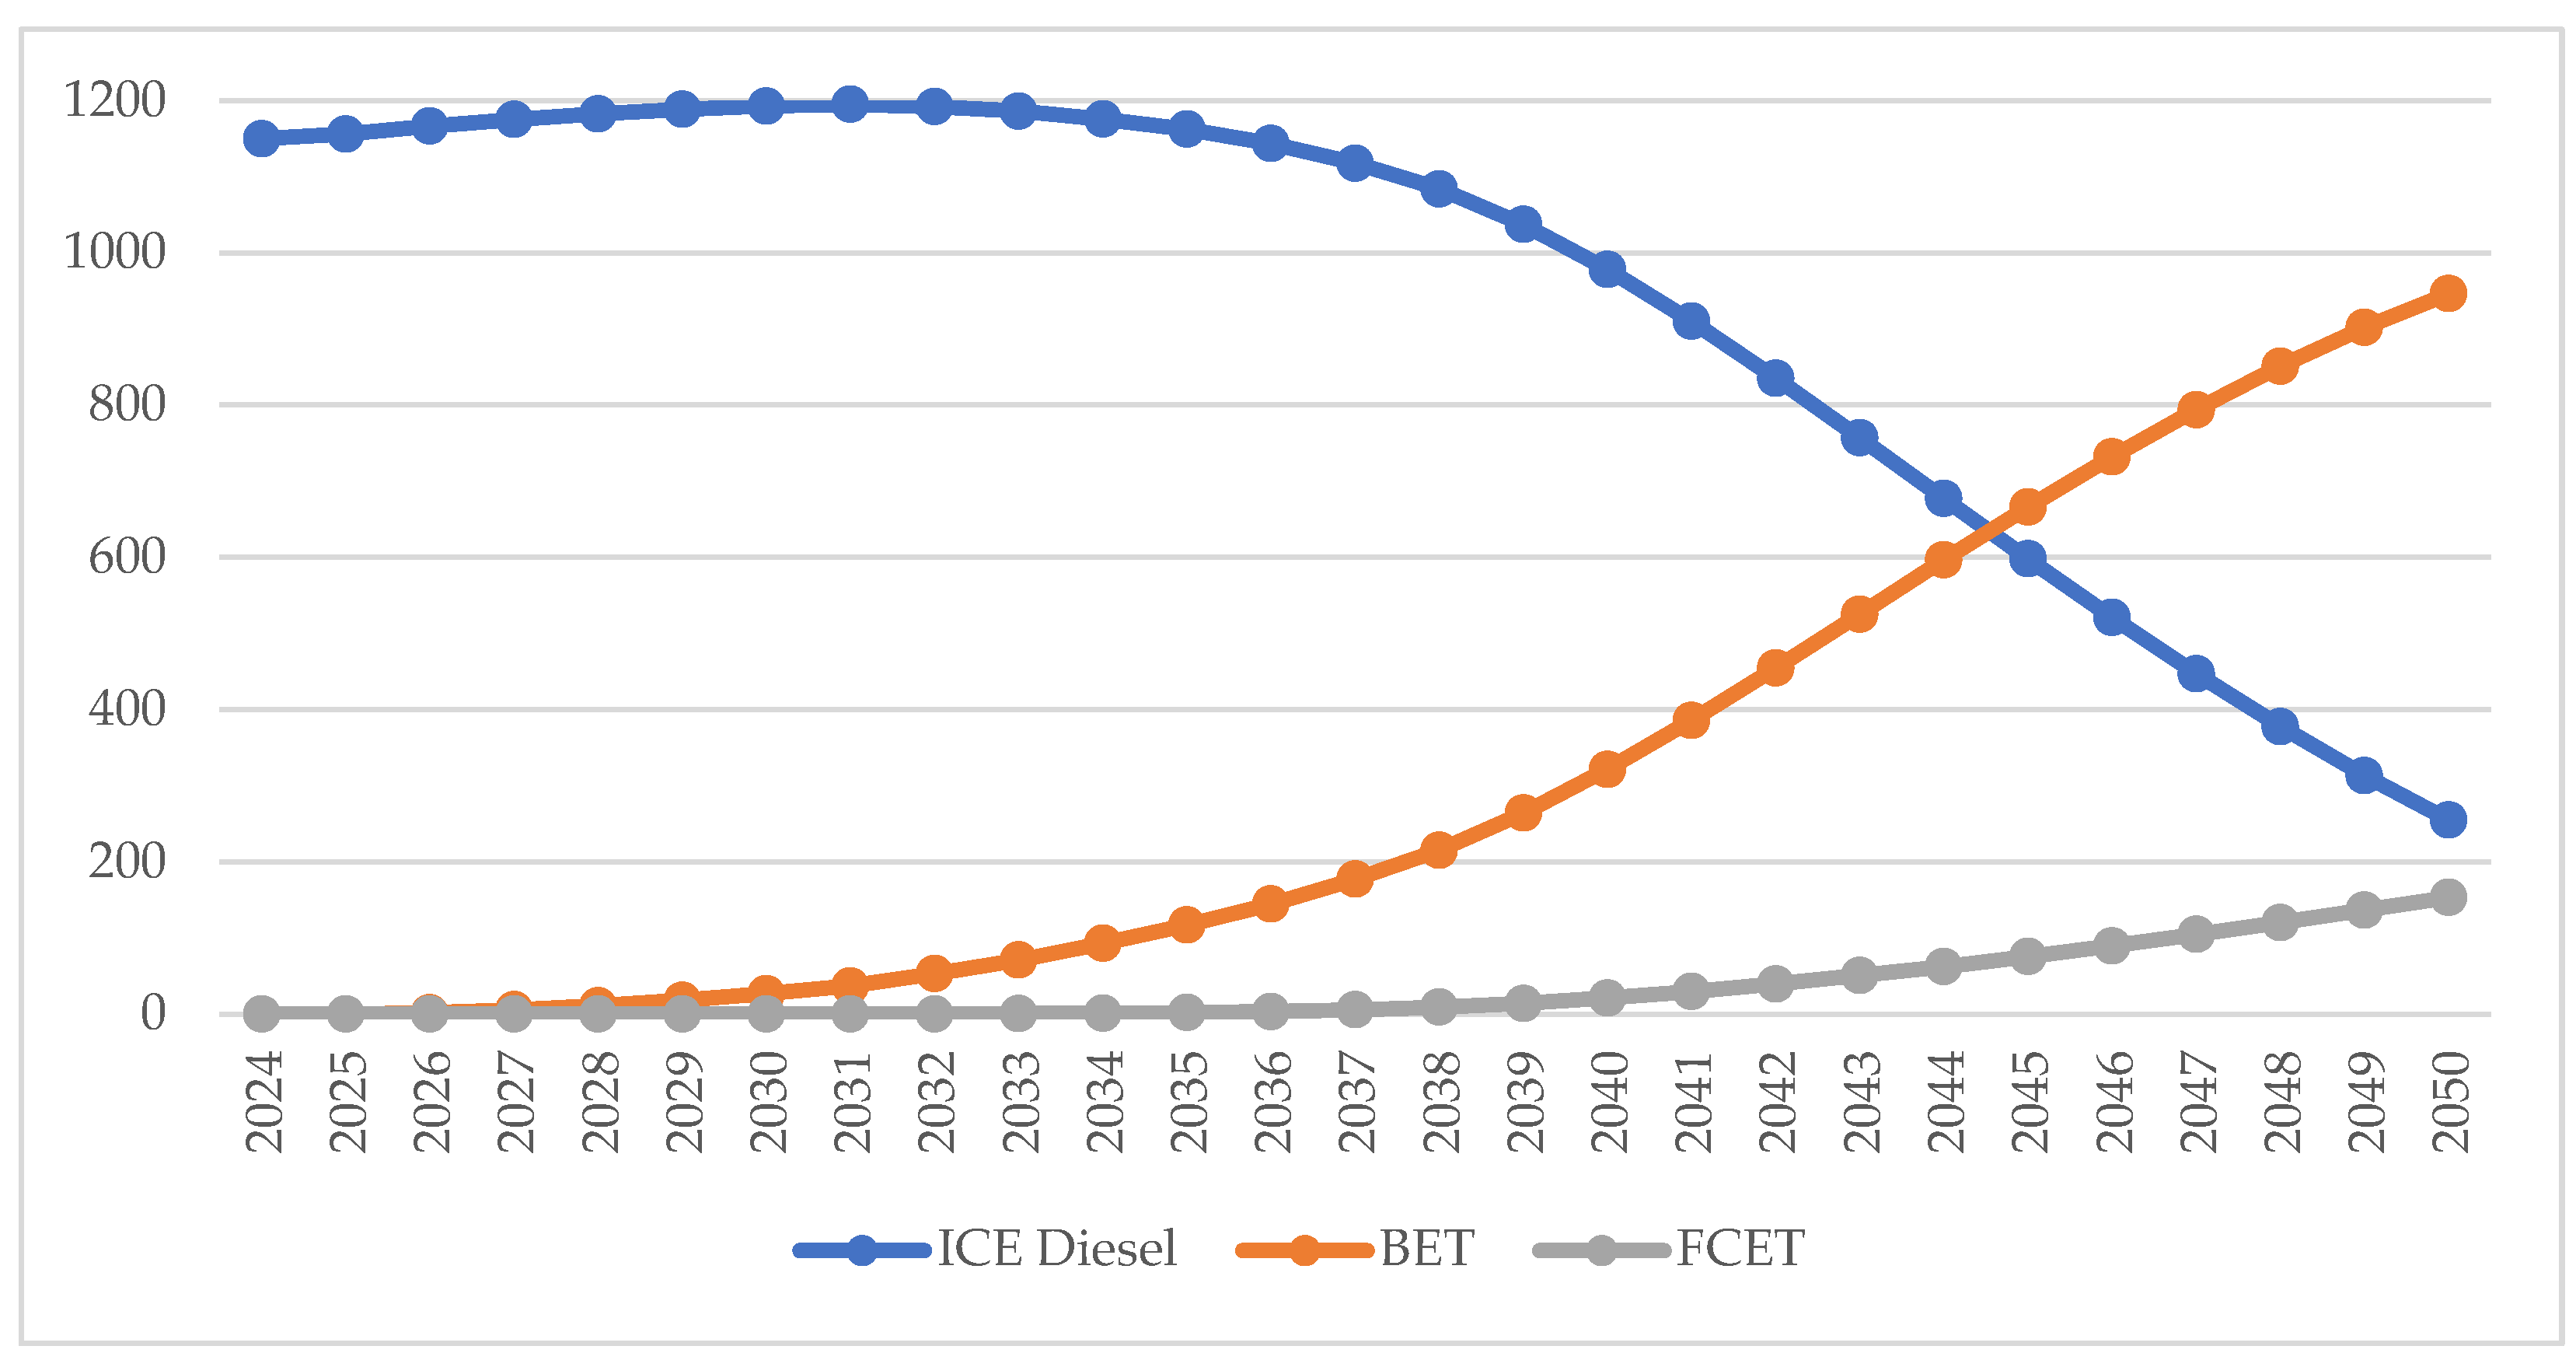
In META, the market penetration simulation is a multivariable optimization problem, maximizing the aggregated marginal abatement cost (MAC), calculated by multiplying it with the market shares of each vehicle technology. In fact, the market shares are the output of the multinomial logit function, to quantify the probability of purchasing each vehicle technology depending on its investment over its lifetime, which is proportional to the TCO shown above. For each year from 2024 to 2050, META calculates the net present value of owning each freight transport vehicle as a decision-making main factor to determine consumer acceptance for each technology. For the KSA,
Figure 6 shows that ICE diesel will still be sold until 2050 even under the emission constraints pledging to reach carbon neutrality for new sales. In fact, this emissions constraint forces the freight transport market to only have FCET and BETs sales by 2050, being the only net zero vehicles possible option on tank-to wheel basis. ICE diesel sales shown in
Figure 6 and
Figure 7 contain standard conventional ICE vehicles as well as ICE trucks with onboard MCC systems, explained further in detail in
Figure 8. Under the emissions constraints, as well as the technology maturity added to the projected charging infrastructure improvement with the increased implementation of 1 MW fast charging stations, BETs are projected to dominate the freight transport vehicle market by 2050. As mentioned above, the main inconvenience for BETs is the time of recharging. For a standard charging station, it would take up to five hours to charge an 800-kWh e-truck at an 80% state. This would lead to transport delays and logistic issues compared with conventional trucks. In contrast, the newly commercialized 1-MW charging stations would charge an 800-kWh e-truck to an 80% state in less than an hour [
26], making it competitive to conventional trucks and FCETs. Integrating this in META leads to the decrease of TCO for BETs, and therefore the increase of the probability of purchasing e-trucks, which would become more attractive even without the emissions constrains obligations.
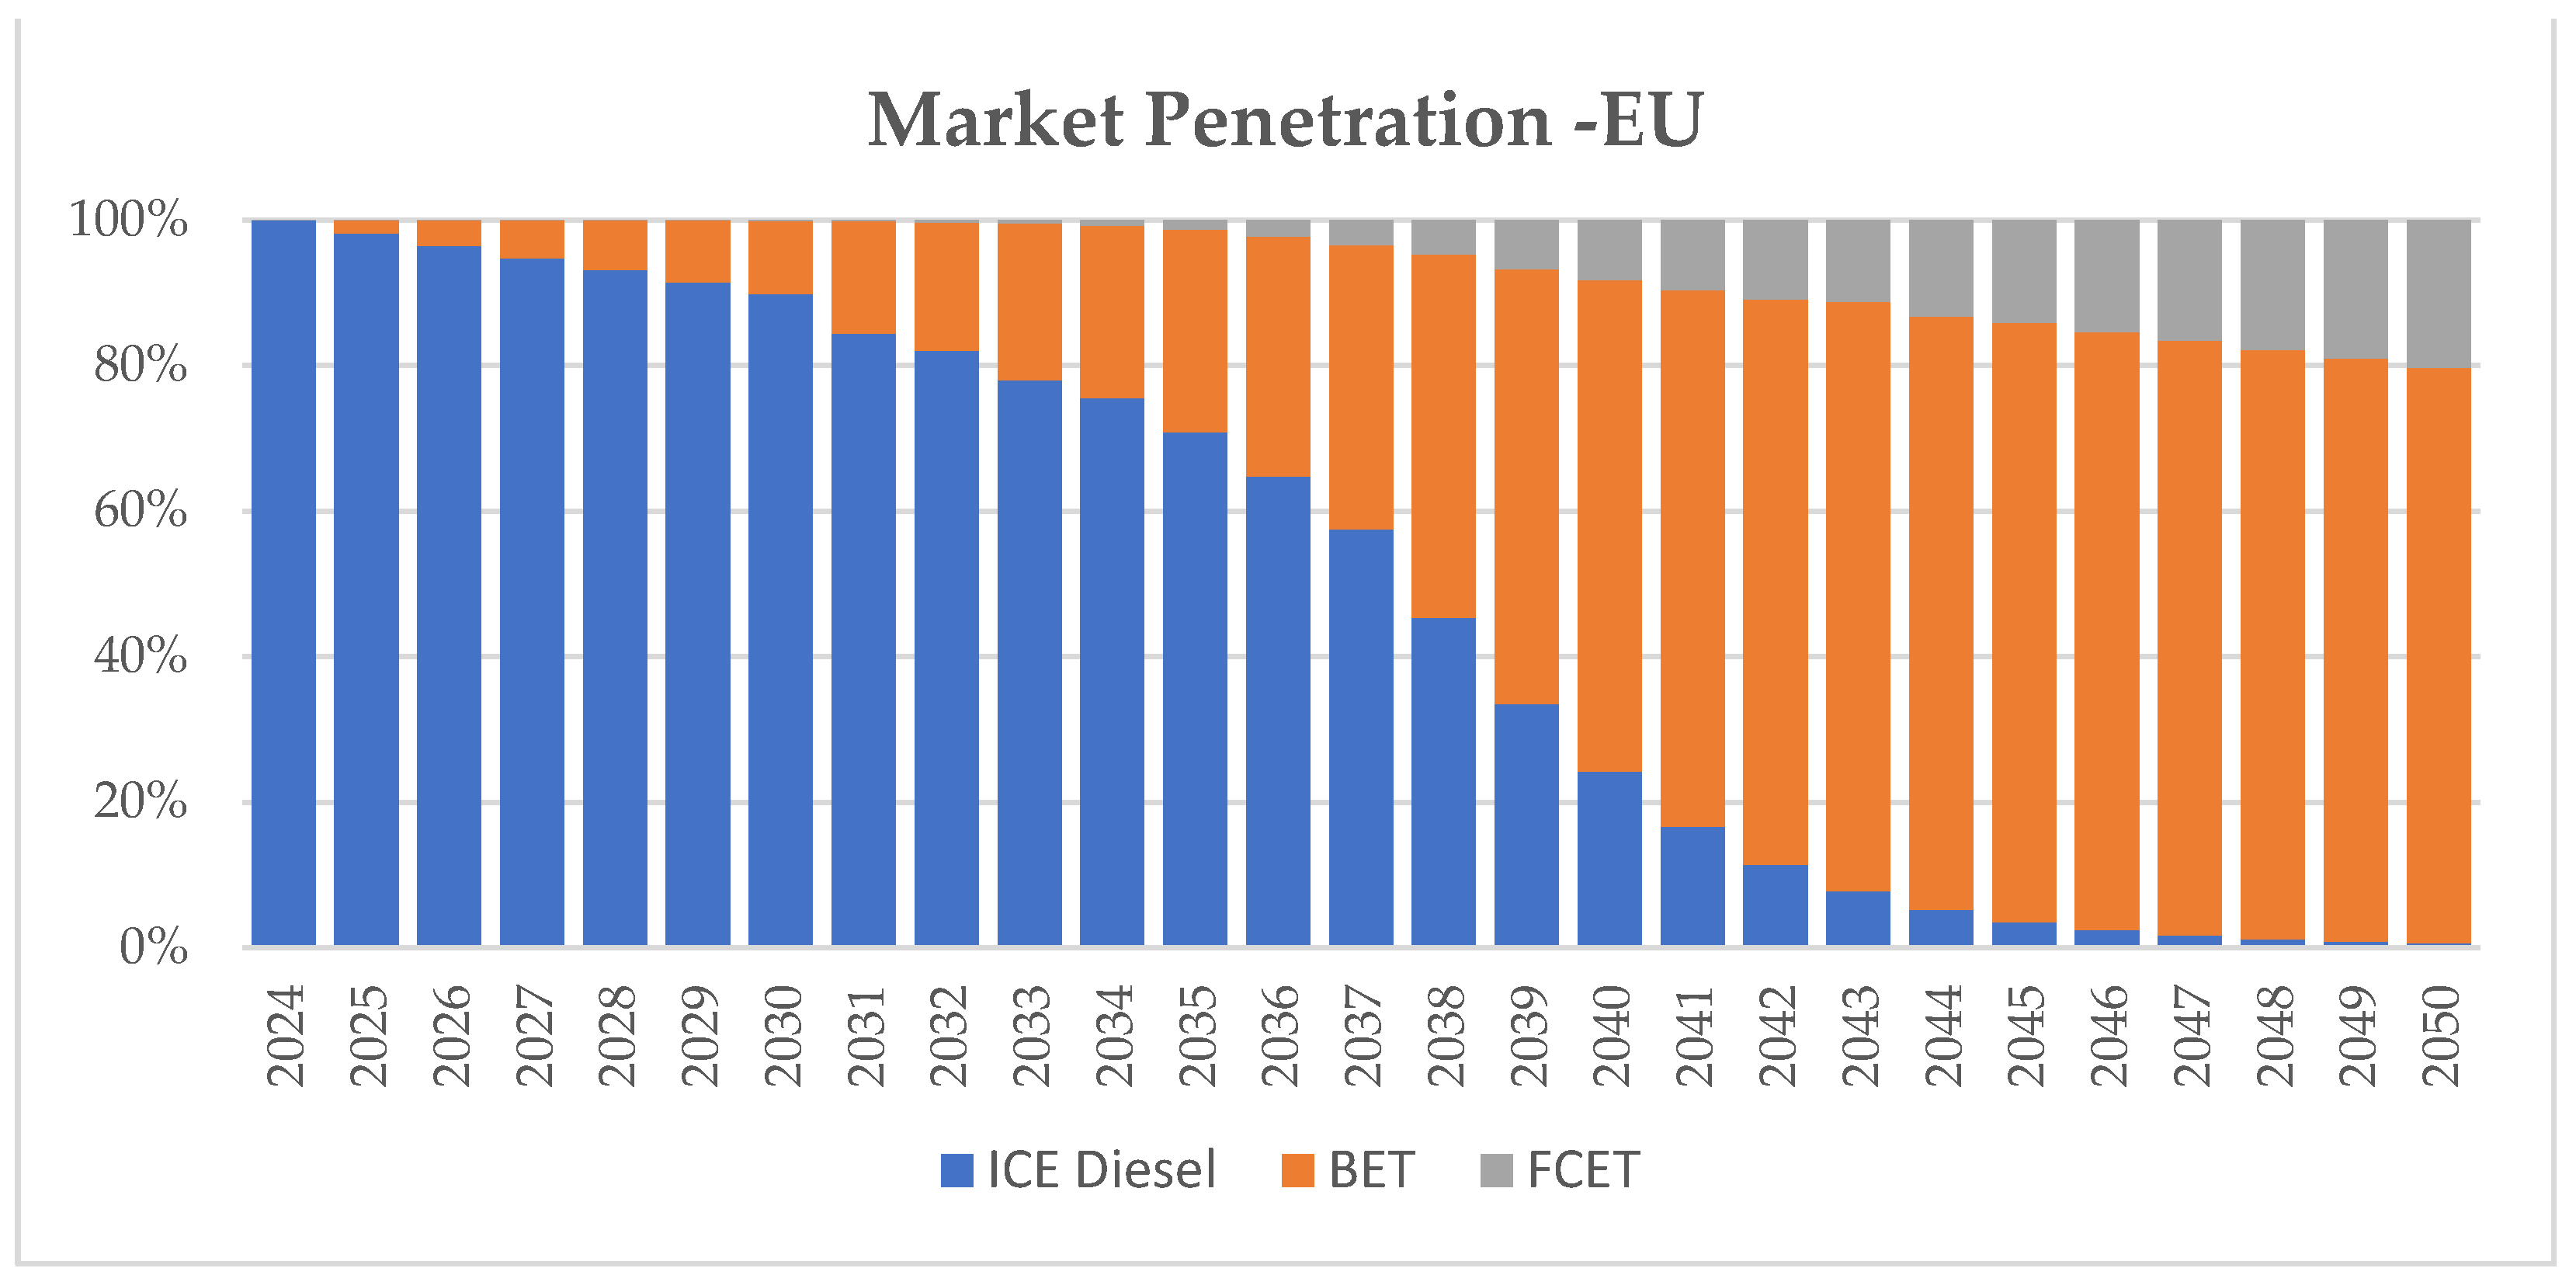
As for Europe,
Figure 7 shows that the trend is overall similar compared with the KSA results. BETs will penetrate the freight transport market sooner because of the relatively advanced charging infrastructure as well as the high diesel refueling prices. Starting from 2032, BETs become the dominant option in heavy-duty vehicle market due to the improved charging infrastructure. This is obvious in both scenarios. Due to hydrogen price decrease (5 euros/kg by 2050) as well as projected improved hydrogen refueling infrastructure, fuel cell electric trucks (FCET) would be a long-term solution alongside with BET. Overall, there is no need to force OEMs towards only producing BETs. Consumer acceptance for BETs will dominate in all ways thanks to its convenience, projected improved infrastructure and technology maturity. Another factor leading to the rise of BETs market penetration is the projected gradual increase of e-fuels blending presences at the refueling stations. This would lead to higher energy costs when owning an ICE truck. Being forced to pay a higher amount to refuel the same conventional truck might facilitate decision making switch towards e-trucks.
As mentioned earlier, conventional powertrain sales shown in
Figure 6 and
Figure 7 include ICE trucks with onboard MCC systems. MAC and TCO results show that additional avoided CO
2 for MCC 90% capture case makes it the most attractive solution across all regions, based on its reduced total GHG emissions costs. This leads to the carbon capture market shares results shown in
Figure 8. If commercialized starting from 2025, MCC has an important opportunity to penetrate the freight market shares until 2050. META is an investment optimization model. Therefore, the results prove that capturing CO
2 onboard presents a more economical solution than forcing a brutal rapid adoption for BETs and FCETs. In fact, MCC biggest advantage compared with BETs is that its technology could be implemented progressively rather than requiring major efforts to supply the required infrastructure network before implementation. As shown in
Figure 8, while MCC does not guarantee net-zero emissions on tank-to-wheel, MCC adoption would allow a smoother transition towards carbon neutrality. Both in the KSA and EU, MCC options could reach more than 50% market shares of all ICE vehicles sales, equivalent to a combined 35% of all new sales shares by 2035. Due to more favorable conditions toward ICE vehicles explained above, MCC would have better opportunities in the KSA than in EU. With the increase in e-fuel usage, MCC would lose its advantage for marginal abatement cost calculations. This justifies the comeback of standard ICE diesel vehicles, becoming less pollutant each year while being already cheaper and more convenient to own. 90% capture systems have the edge over 50% capture systems by offering the lowest MAC values as these technologies increased captured CO
2, compensating for its added capex costs. It would be beneficial to investigate the opportunities of MCC if the goals were to reach carbon neutrality on a Well-to-Wheel basis. In that context, adopting on-board carbon capture systems on e-diesel fueled trucks could be the main net-zero solution as even BETs and FCETs would not allow 100% emissions reduction.
Based on the market shares and fuel consumption values delivered by the market penetration model, META projects the fleet stocks, GHG emissions, and energy demand projections for each vehicle technology. Vehicle fleet stocks projections are a direct result of market shares evolution over the years. Fleet stocks are calculated based on the vehicle scrappage rate and age of each vehicle technology taking into consideration the historical heavy duty-vehicle data for fleet stocks as well as yearly sales.
Figure 9 shows the projection of fleet stocks for freight transportation in the KSA, including three powertrains: ICEs, BEVs and FCEVs. In fact, demand for the heavy-duty sector (HDV) in the KSA is expected to increase in the foreseeable future, as the Kingdom economy is expanding, oil, and non-oil Gross domestic product (GDP)s, within Vision 2030. In fact, Vision 2030 aims to diversify Saudi Arabia’s economy and shifting dependence away from oil. This requires huge investments in mega and giga projects to upgrade infrastructure across Saudi Arabia’s landscape in many sectors, such as tourism, entertainment, and sports, which can only be materialized and achieved by extensive support from the heavy-duty sector. HDV fleet size was reported as around 400 thousand vehicles in 2023 [
36]. The market expansion for the HVD sector in the KSA is illustrated in
Figure 9 through the increase of ICE Diesel fleet stocks, which includes MCC technology that is projected to penetrate the new sales as explained in the market penetration results section. Compared with BETs and FCETs, one of MCC technology is that it could be retrofit onto existing vehicles, bypassing the typical fleet turnover.
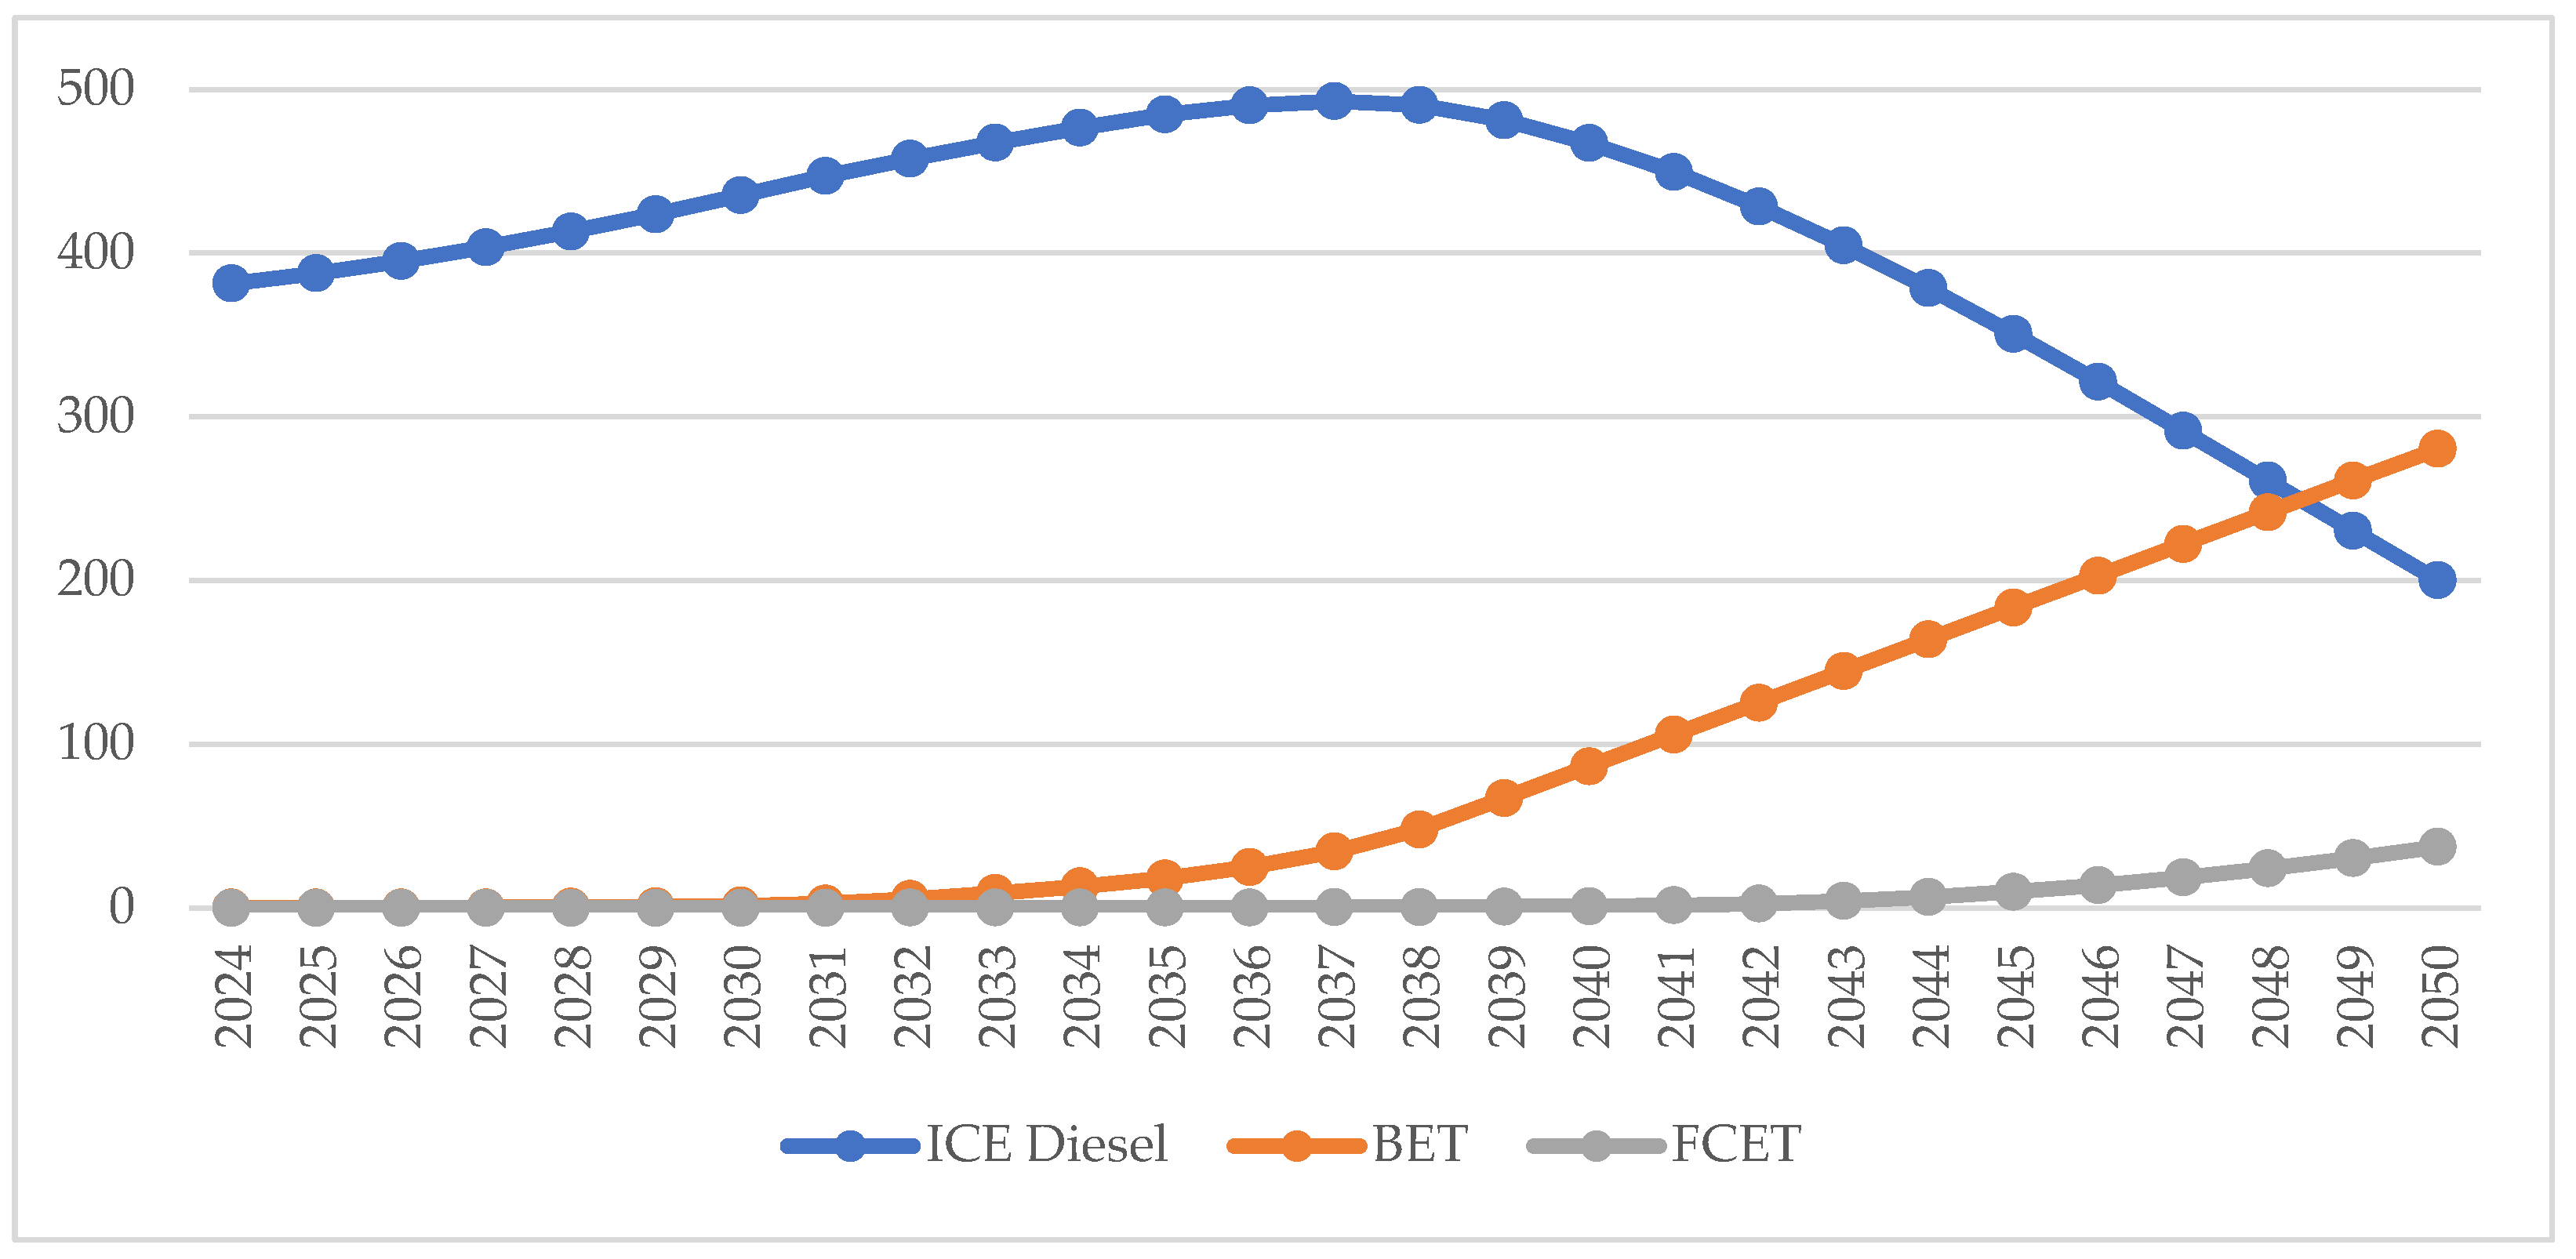
Figure 10 shows the fleet stocks projection in the EU. The trend is similar to the KSA, with an earlier penetration for BETs explained by the projected charging infrastructure improvements adding to the high prices of diesel in Europe leading to higher total cost of ownership for conventional vehicles. Allowing conventional vehicles sales beyond 2035 would open the door for MCC as an economical and eco-friendly short-term and mid-term solution before the dominance of BETs, mainly driven by emission constraints that get through each year as shown in
Figure 10. In addition to the improved charging infrastructure over time, e-diesel increased prices wouldn’t motivate consumers to keep buying conventional vehicles. ICE conventional technology along with MCC onboard added systems would be dominating (more than 50%) the vehicle stocks later than 2040. Overall, a market-free strategy would allow a smoother transition towards electrification.
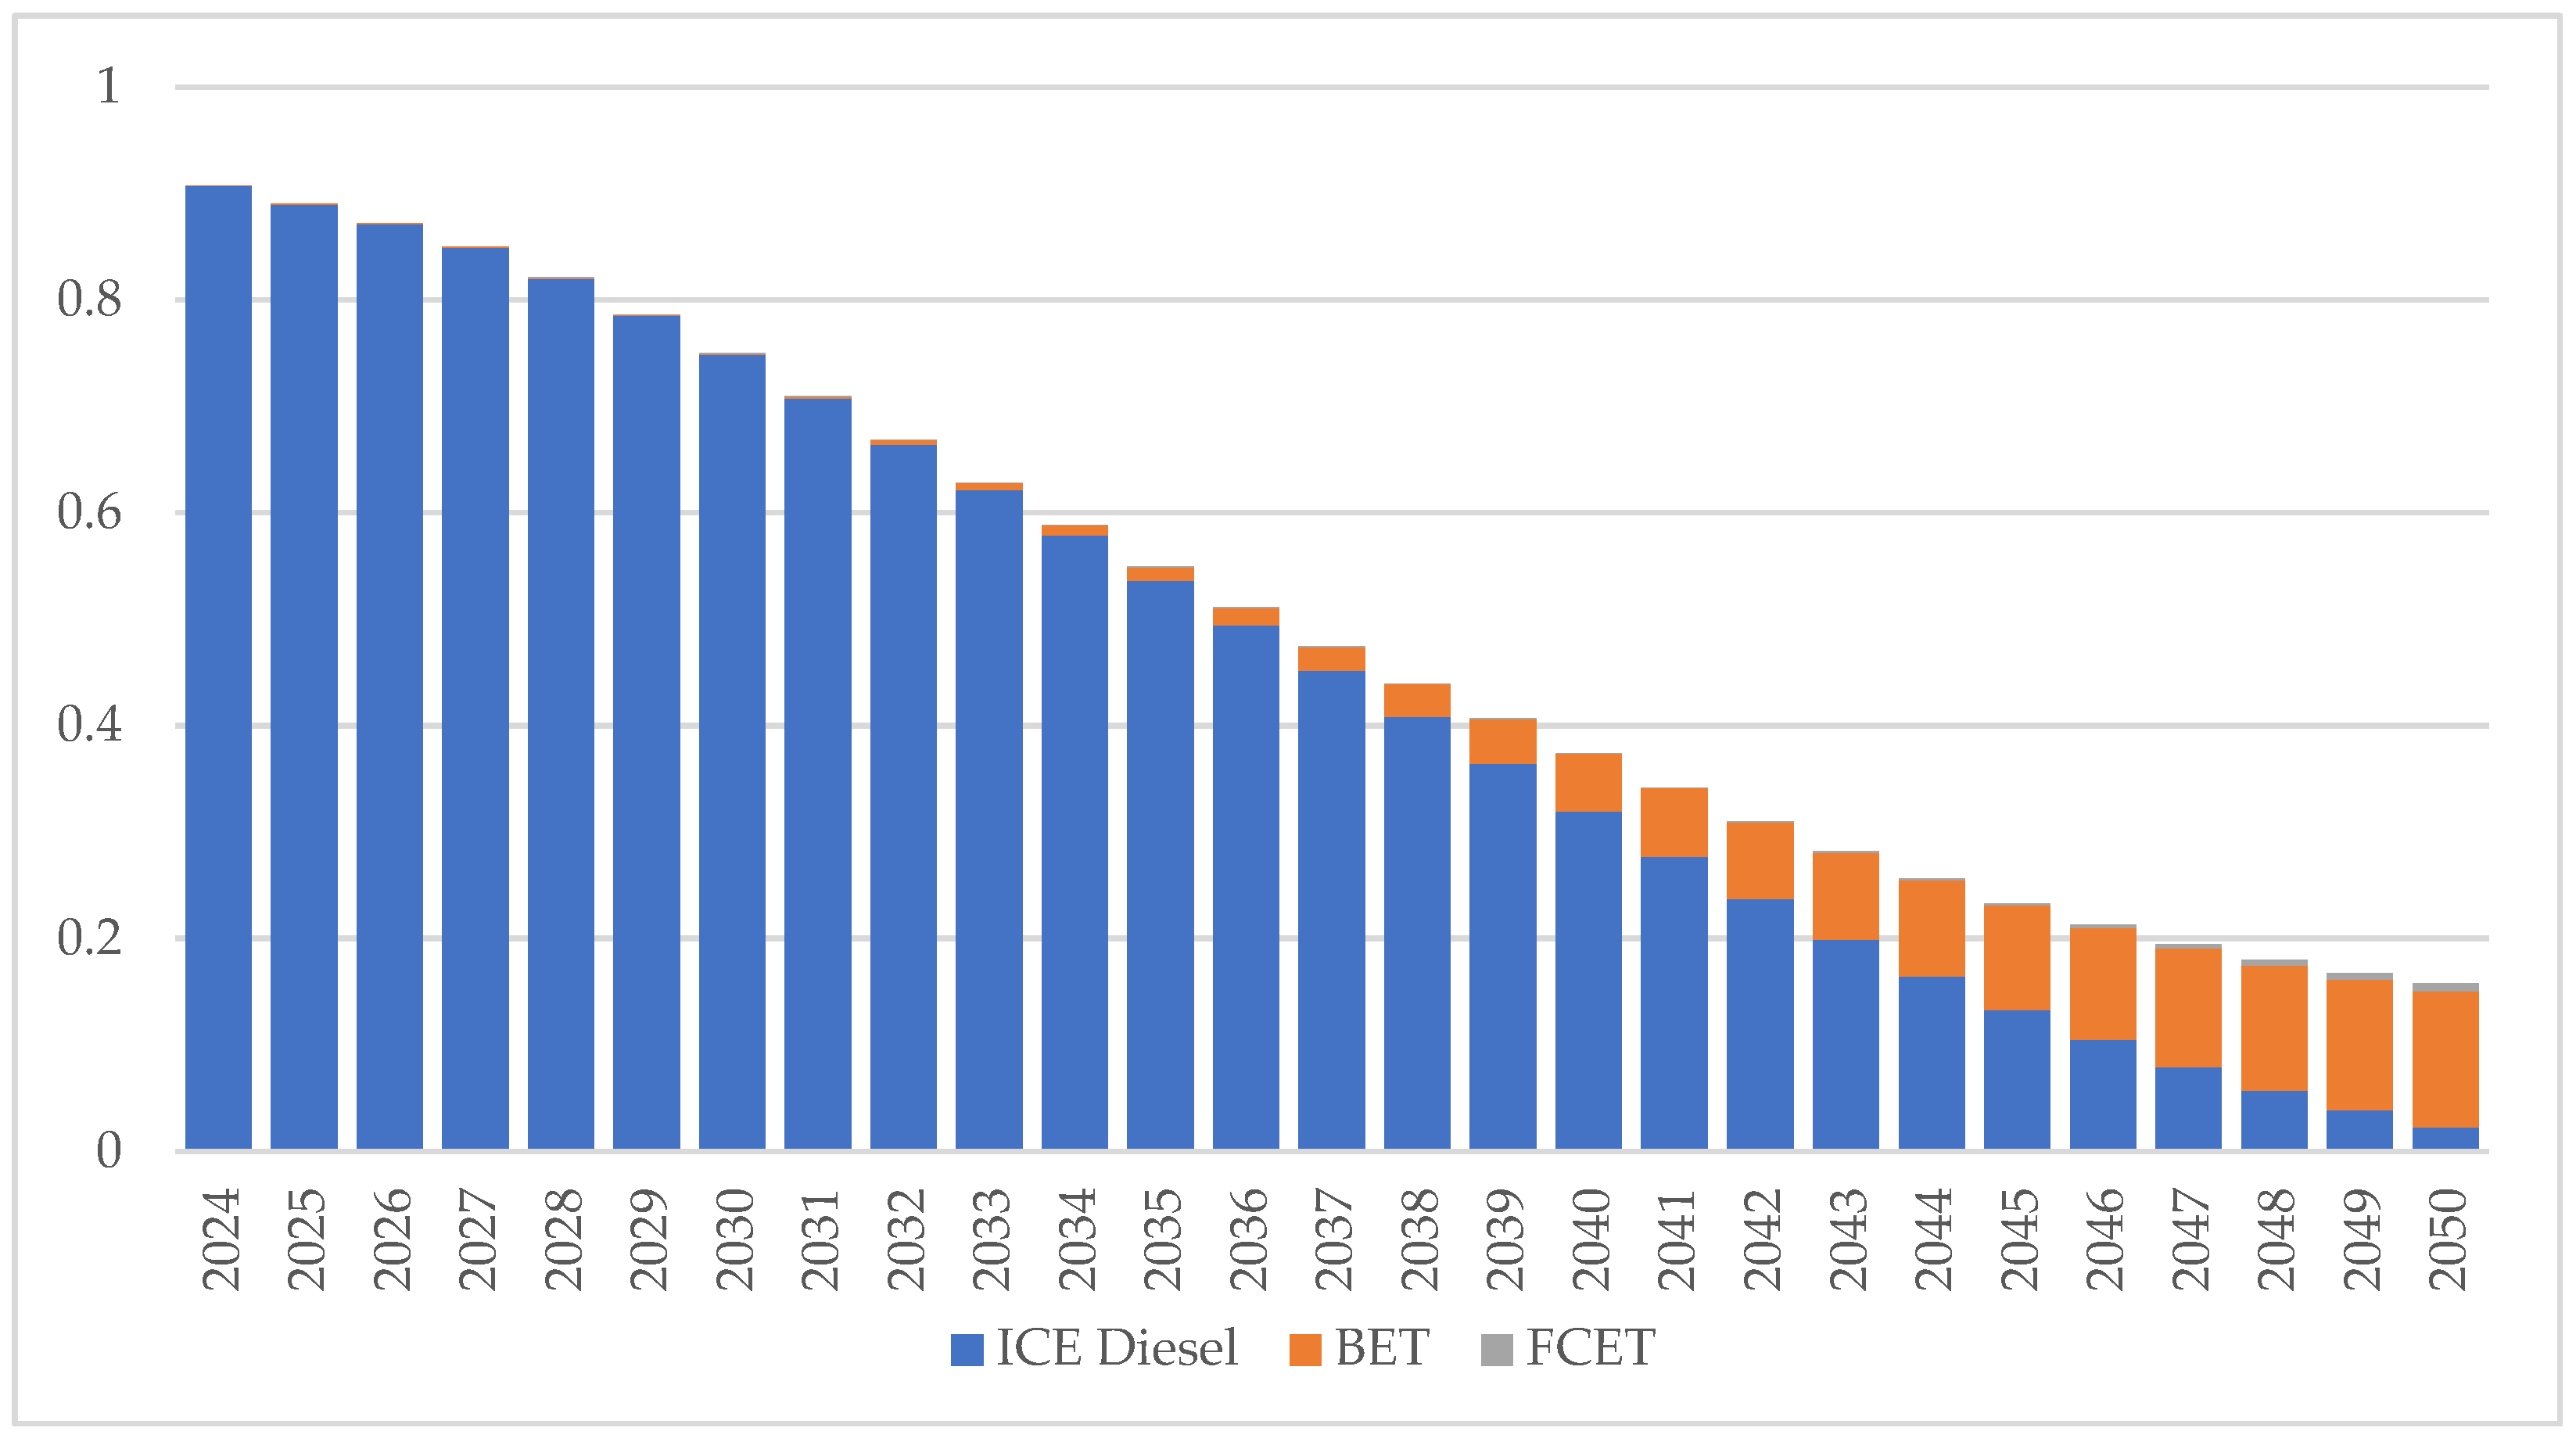
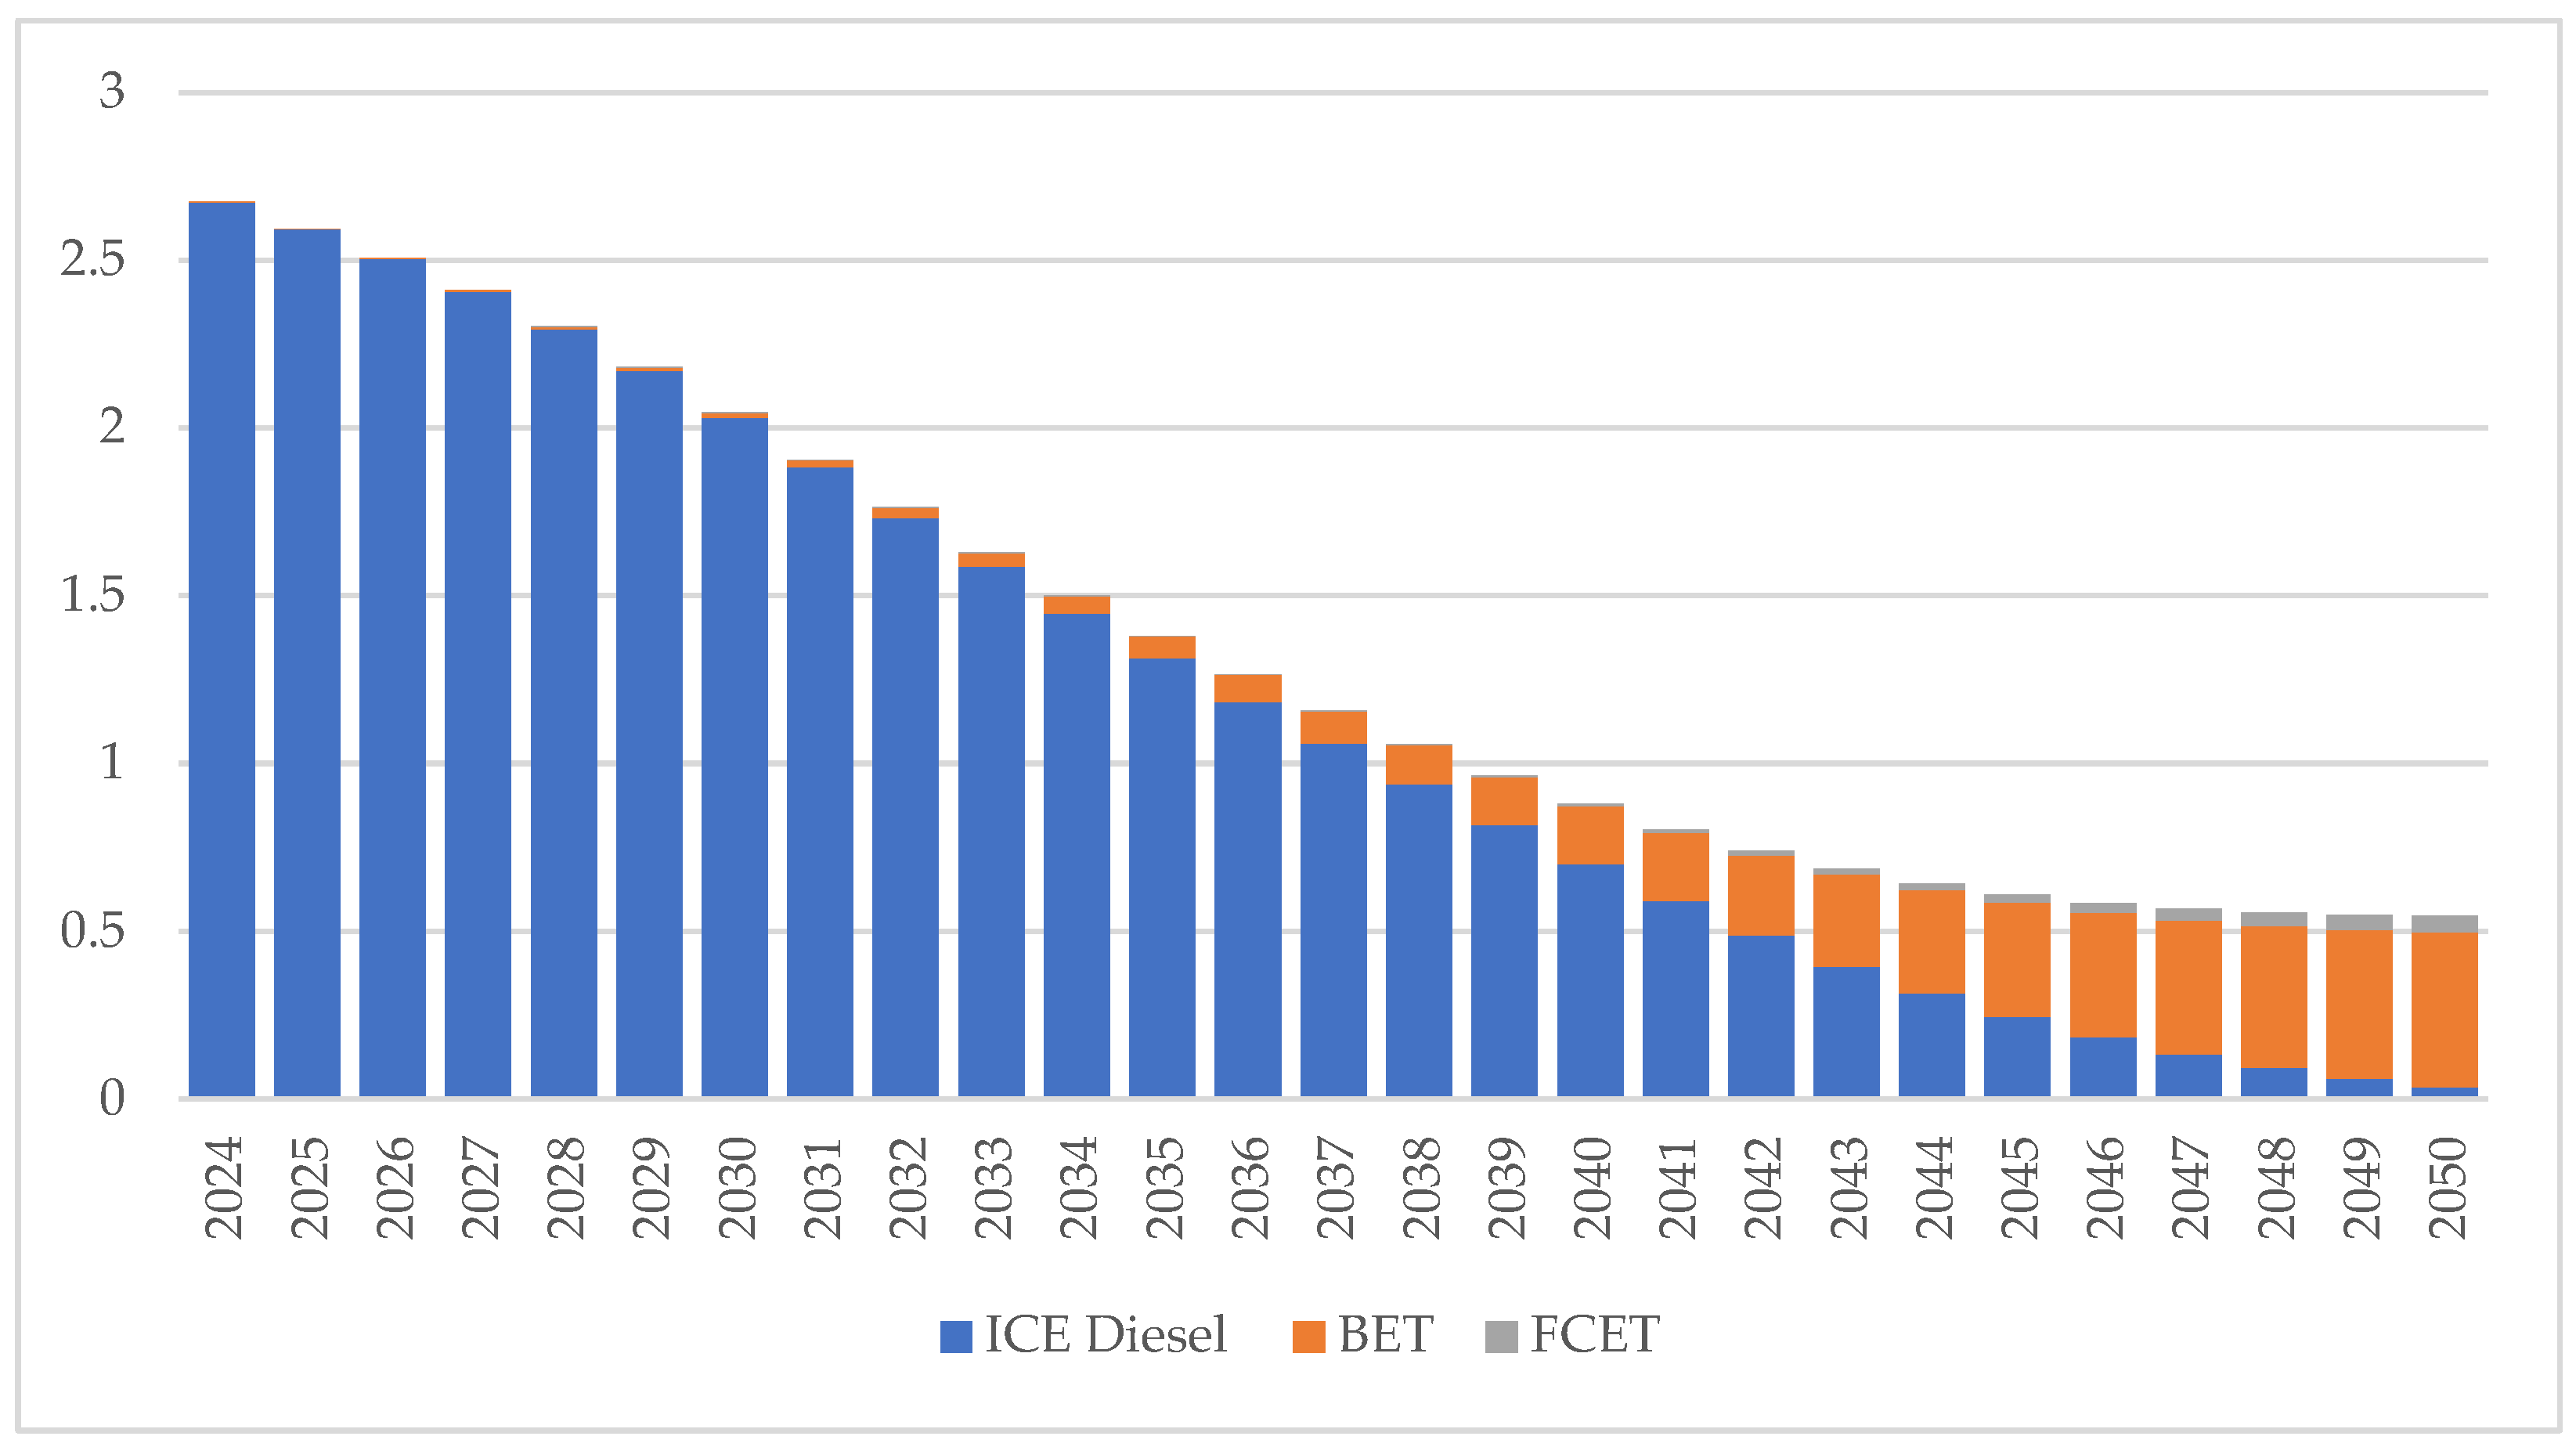
The main driving force behind issuing new regulations is to reduce emissions in the transportation sector. In this section, we explore the Well-to-Wheel emissions up for the freight transport sector up to 2050, which is a direct result of the previously shown fleet stock projections. As part of the Kingdom’s efforts for sustainability and climate change mitigation, it announced its ambition to reach net-zero greenhouse gas (GHG) emissions by 2060 [
37]. In the long term, since the heavy-duty sector will be converging towards tailpipe zero emissions vehicles (BETs and FCETs), GHG emissions will be decreasing until only electricity and hydrogen upstream emissions are included, as shown in
Figure 11 and
Figure 12. This is induced by the KSA and EU aspirations to decarbonize the grid and promote green hydrogen production. Additionally, fostering e-fuel production to become the main refueling option, has beneficial WTW GHG emissions on the ICE fleet.
Undoubtedly, fleet stocks projection strongly depends on the emissions regulations adopted by government. Pledging to reach carbon neutrality, every country could have a different strategy to reach its goal. In our simulation, we assume that both the KSA and EU are planning to reach a net-zero heavy-duty new sales landscape by 2050. This assumption is on a tailpipe basis, to comply with most transportation policies reasoning. Although this target seems reasonable compared with the overall carbon neutrality goals for the KSA and EU, more stringent regulations could occur. An example is the ICE ban for light-duty vehicles. If we apply this ICE ban for heavy-duty freight transport market starting from 2035, the sales will obviously be split between BETs and FCETs, unless e-diesel would be allowed to be treated as a net-zero fuel. Since electrification has already made bigger steps in terms of infrastructure, technology maturity, and consumer acceptance, our ICE ban scenario simulation show that BETs would dominate the fright transport sector especially when 1 MW fast chargers would be deployed both publicly and privately. It is not before 2040 that hydrogen trucks could appear in the picture, mainly due to the higher values of energy costs. A lot of efforts would be needed to decrease hydrogen retail prices to compete with charging costs, adding to the hydrogen refueling infrastructure availability. As for MCC, the market penetration would mainly depend on allowing e-diesel trucks to be sold during the ICE ban. In that case, MCC could play an important role in capturing the tailpipe emissions and lead ICE diesel vehicle to be considered net-zero. A more stringent regulation would be to target net-zero transportation sales on WTW basis. In that case, MCC could be the main solution. In fact, Both BETs and FCETs would not guarantee carbon neutrality on WTW because of the upstream emissions of electricity and hydrogen, unless only counting on renewable energy resources, which could not be sustainable for the whole fleet. Therefore, a combinatory technology taking emissions reduction advantages of both e-diesel upstream production as well as MCC tailpipe CO2 savings would allow the truck to be carbon neutral and, therefore, compliant with the stringent regulations.
The emissions constraints of the optimization model force the new sales to reach carbon neutrality in 2050 on a Tank-to Wheel basis. This is to align with transportation policies that only focus on tailpipe emissions. With META, we look at the big picture by including the upstream emissions for producing electricity, e-diesel, and hydrogen. This explains not reaching zero emissions in
Figure 11 and
Figure 12. In fact, an interesting approach would be to investigate the impact of adopting MCC on e-diesel trucks. That would lead to more than 100% emissions reduction compared with a standard diesel truck, which would be a crucial option if the policies become more stringent by targeting carbon neutrality on a well-to Wheel basis. Overall, the main takeaway behind this study is that on a WTW emissions basis, there isn’t a need to force consumers as well as OEMs to only focus on tailpipe net-zero vehicle. Adding to the fact that these technologies aren’t the best optimized economical solutions as explained above, such a strategy will also not guarantee better emissions reduction results. In fact, both e-diesel refueling availability and MCC technology commercialization will lead to lower GHG emissions specifically in the short-term and mid-term. Overall, shifting heavy-duty vehicles towards a carbon-neutral technology pathway could lead to significant GHG emissions savings.
The concern to rede emissions is the main motivation behind all decarbonization solutions and novelties. Therefore, we added the WTW emission charts which could be beneficial to investigate transportation policies real benefits on the environment, and whether these tailpipe-based regulations could be the optimal solution to decrease the transportation sector emission through the full value chain. Similar approaches were conducted to quantify GHG emissions based on yearly total sales and vehicle stocks projections and show similar emissions reductions up to 2050 [
15,
38]. These articles also quantify the impact of net-zero technologies including BETs and FCETs on reducing emissions for the transportation fleet, and which mainly depend on the upstream emissions’ assumptions taken into consideration. These assumptions are linked to governments’ aspirational renewable sites and synthetic fuels ongoing and future projects, aiming to have a cleaner grid and/or a bigger share of green hydrogen within hydrogen production plants or imports. These governments’ energy targets are the source for our data shown in
Table 2 and
Table 3.
Energy Systems Optimization Models (ESOMs) are used to minimize the total discounted monetary cost of the energy system over a relatively long-time horizon, including capital investment costs as well as other fixed and variable costs to meet re-quired end-use energy service demands. However, each model has it flaws. META is used to understand the future of global freight transport, but its output depends on the assumptions taken for its input parameters. META’s modeling approach isn’t to tell what will happen in the future. It is rather projecting what is most likely to occur for a specific set of assumptions. Therefore, it is beneficial to conduct a sensitivity analysis (SA), to quantify the most sensitive parameters and quantify their impact on the model output. In general, SA explores the relationships between uncertain input parameters and the observable output, which represents some phenotypic features of the modeled system. SA has been used for various parameterization tasks of models of biological systems, such as finding essential parameters for research prioritization, identifying significant parameters or parameters clustering. Given that META is a complex model that has multiple parameters, the objective of this SA exercise is to identify the impact of any parameter on future market sales for vehicle technologies. Identifying the most sensitive parameters will allow for the incorporation of these parameters as an input layer in the neural network, which will be discussed in future articles.
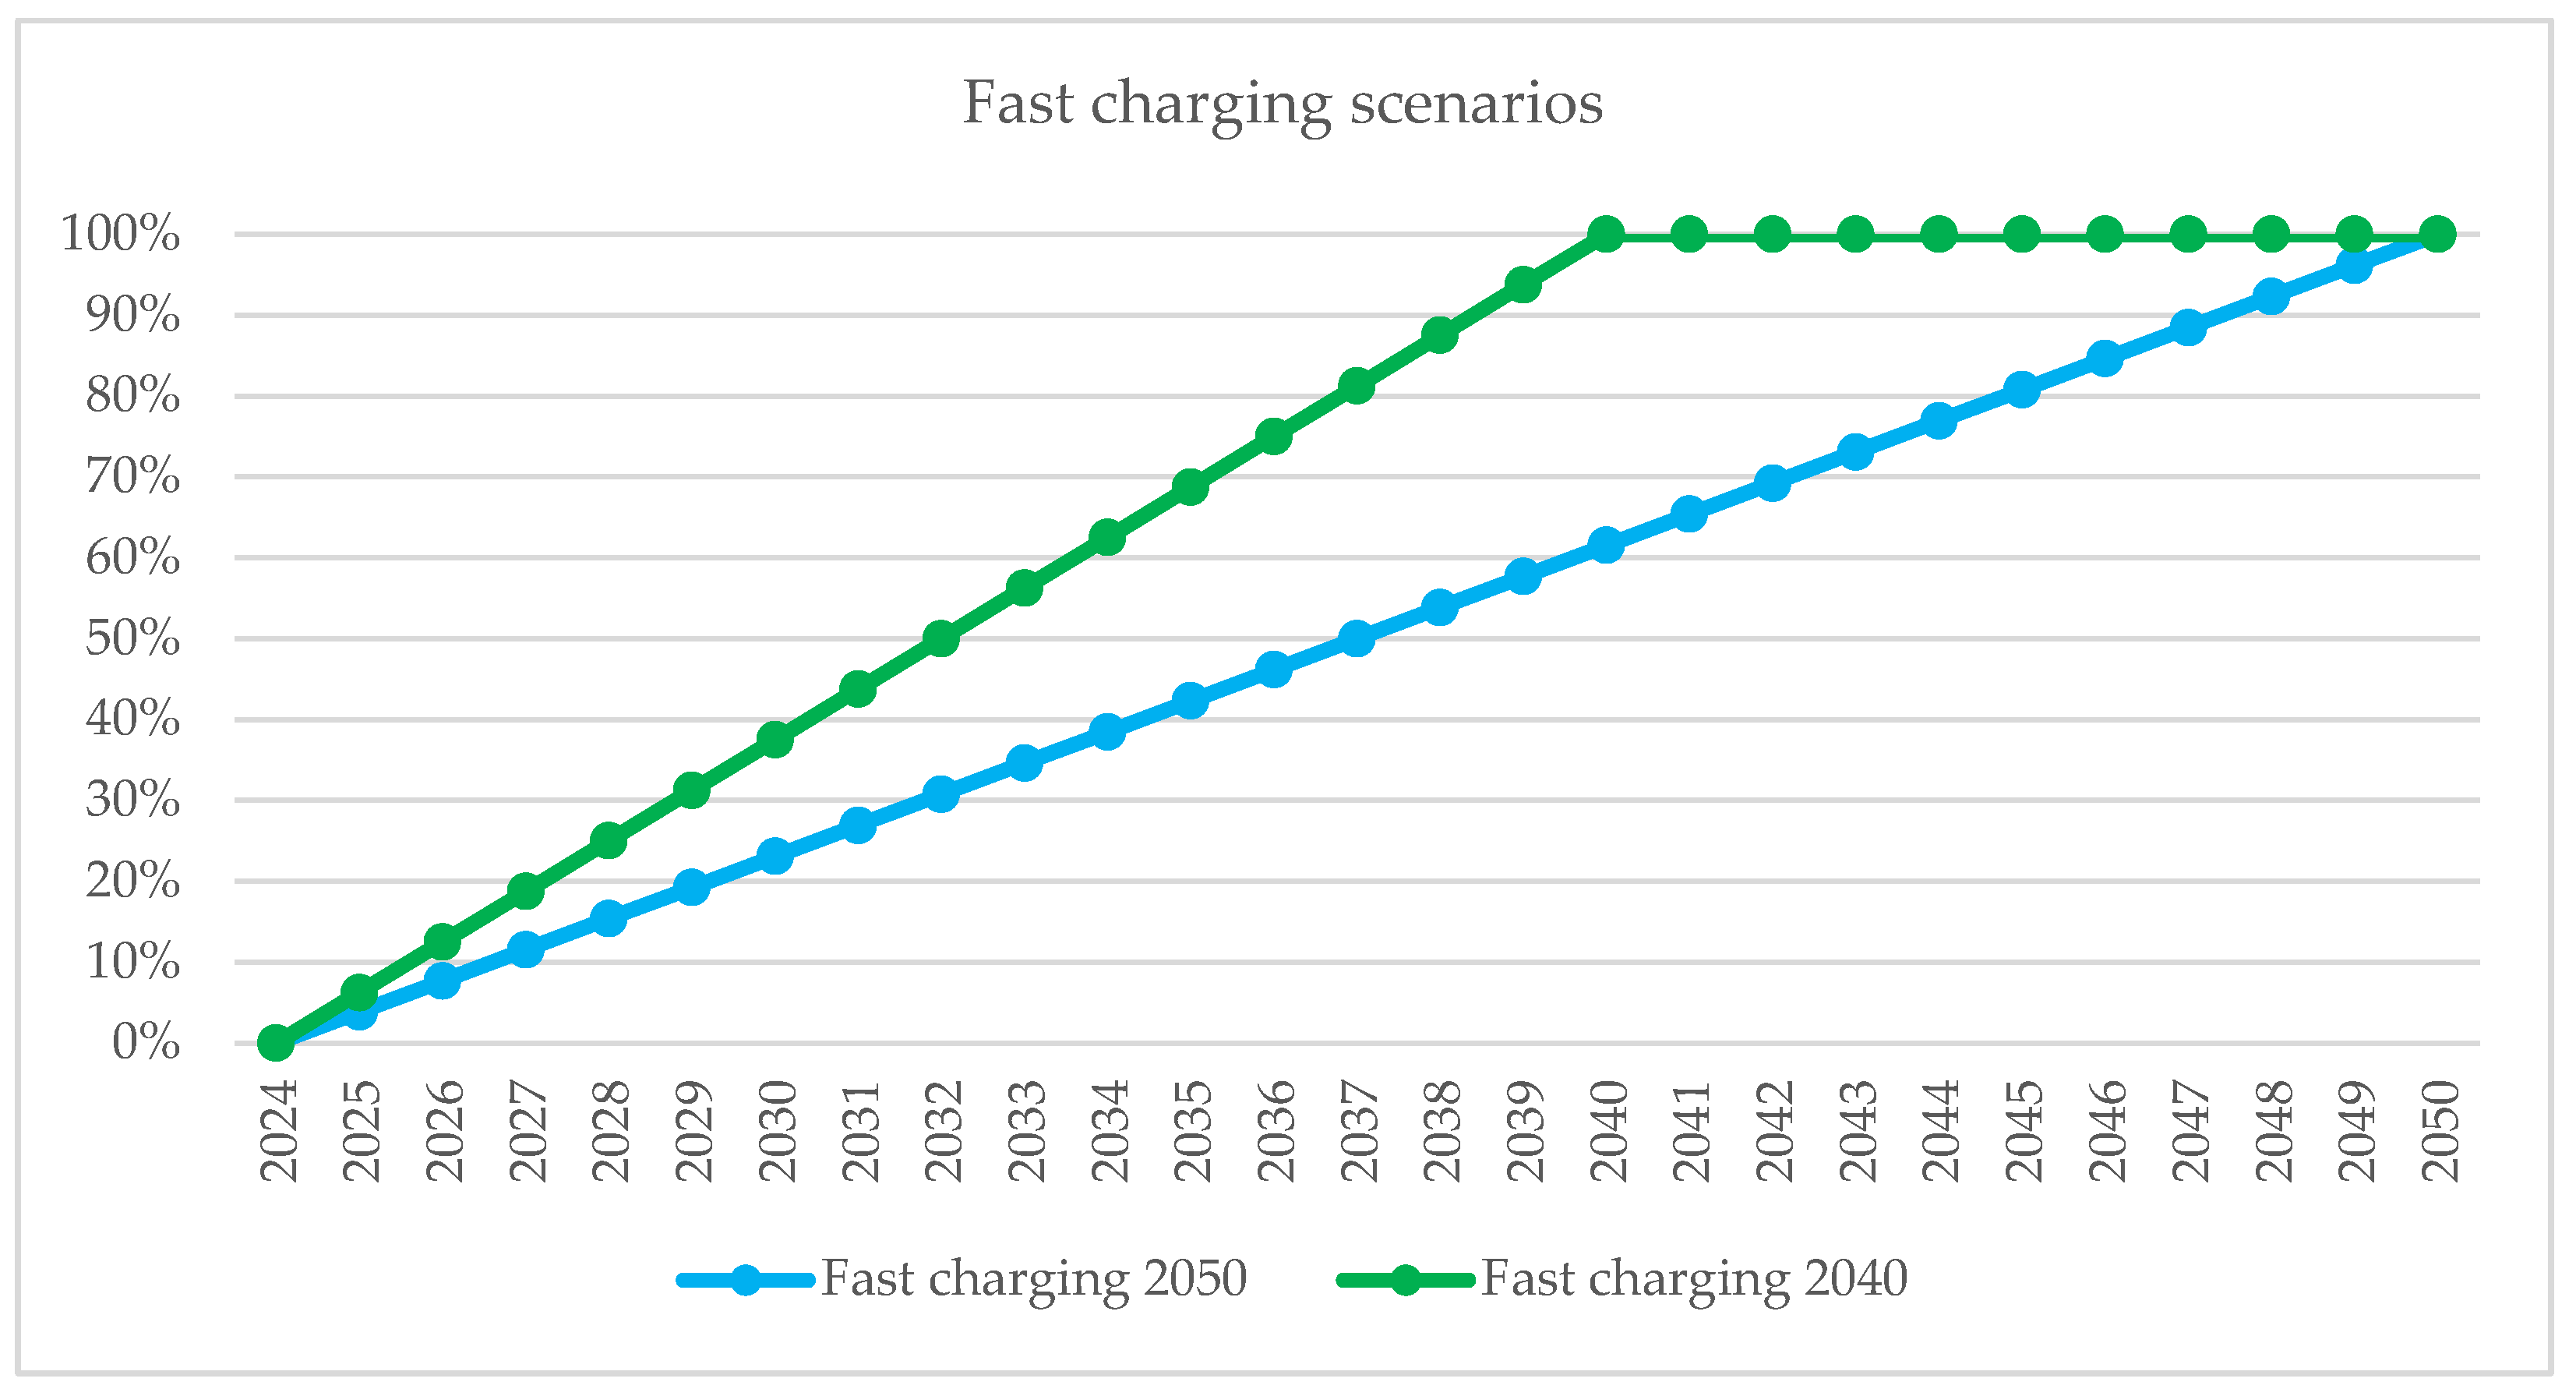
Traditionally, the sensitivity of the model is determined by the partial derivatives of the outcome with respect to its parameters. In this work, we chose a simple way to understand the impact of two sensitive parameters: fast charging possibility and e-diesel blending availability.
Figure 13 shows two scenarios for 1 MW fast charging possibility percentage. In fact, fast charging availability is so sensitive that it could be qualified as game changer for BET market penetration. As explained in previous sections, the charging costs would be drastically reduced with the implantation of this technology. In this sensitivity analysis exercise, we assume two scenarios: the first one assumes reaching full availability in 2050, while the second scenario is more optimistic, assuming to have all charging stations able to provide 1 MW chargers by 2040. The results shown in
Figure 14, for both the KSA and EU, prove the high sensitivity of fast charging availability. As shown in
Figure 14, a faster implementation would lead to more than 10% increase in market shares after 2040. For the EU, since the charging infrastructure is already better established, the impact would be visible even from 2030.
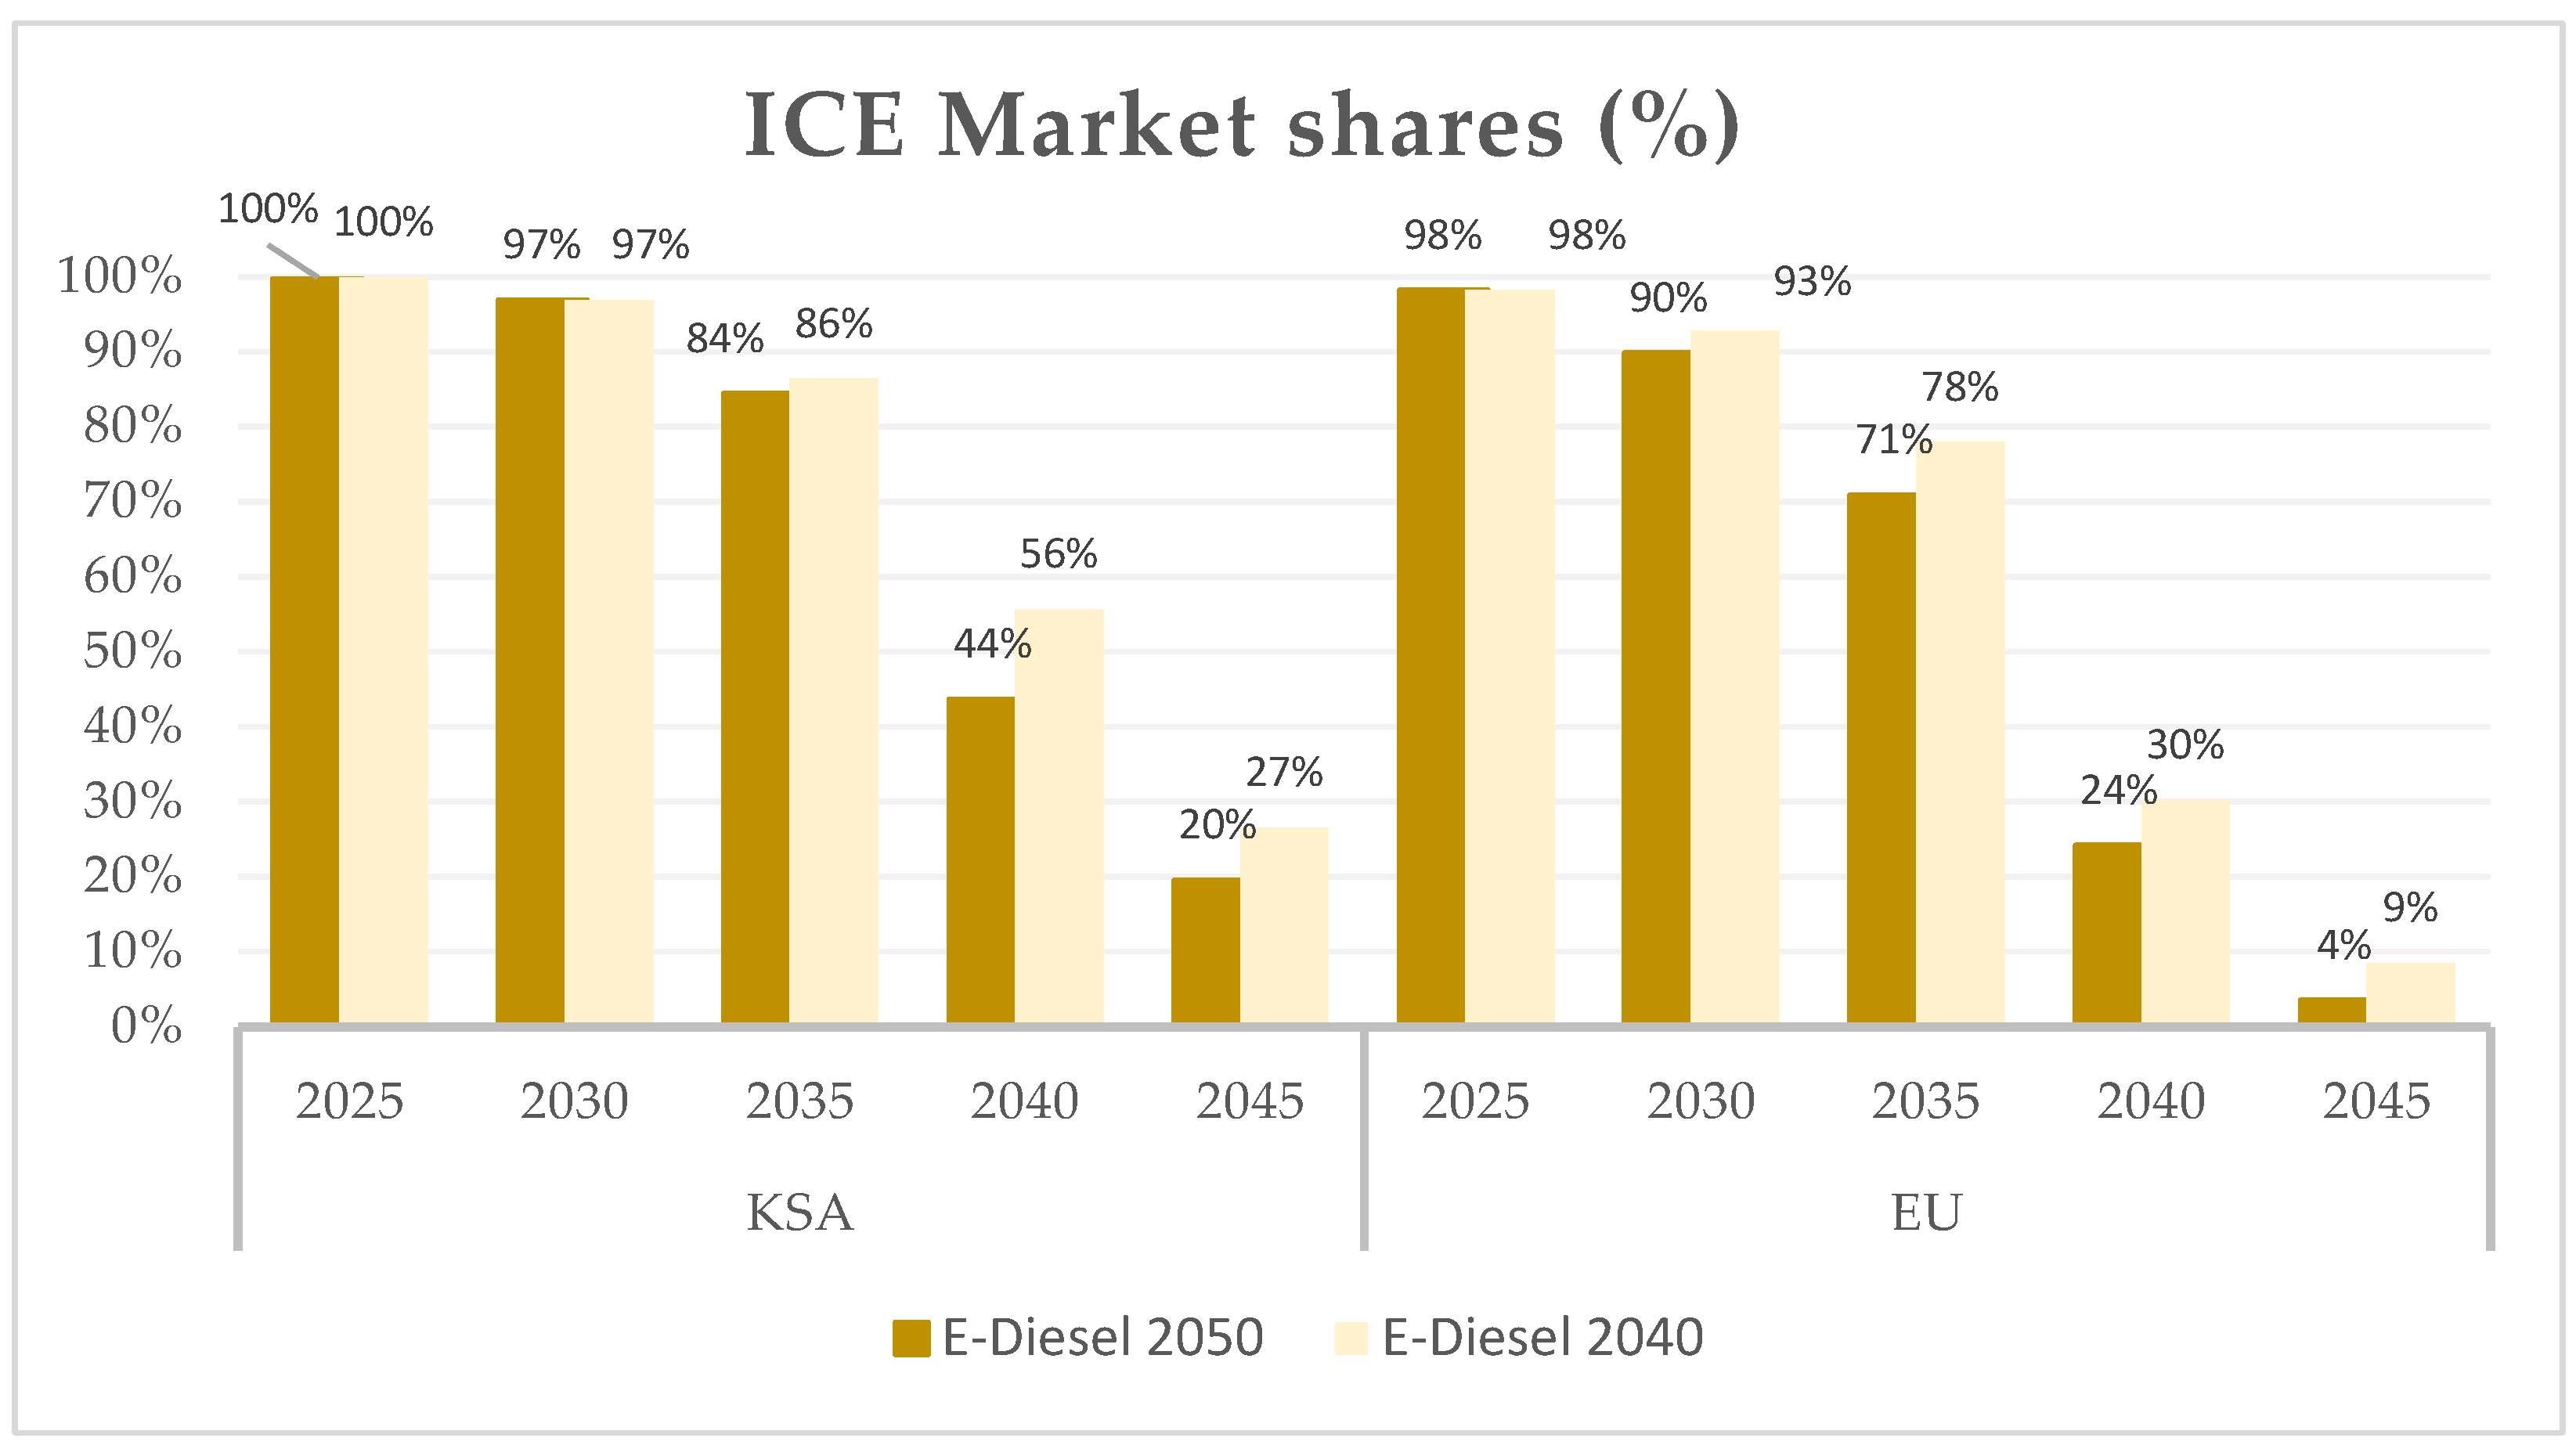
Similar to fast charging possibility, e-diesel availability in the refueling station constitute a sensitive parameter as it acts not only on the energy costs, being the biggest investment cost over the lifetime of owning the heavy-duty truck, but also as it affects drastically the conventional vehicles fleet stocks on a Well-To-Wheel basis.
Figure 15 illustrates two different scenarios; the first one assuming that diesel will be fully synthetic at the refueling stations by 2050 compared with an eco-friendlier optimistic scenario, assuming to reach 100% availability by 2040.
Figure 16 illustrates that e-diesel blending mix availability is indeed a decisive input parameter that could immoderately change the model output. Since META optimizes marginal abatement costs, which considers both net present value investments over the lifetime of the vehicles as well as the saved tons of CO
2, having a faster synthetic diesel blend penetration would be in favor of ICE diesel vehicles. In 2040, the e-diesel optimistic scenario could lead to a 12% increase in ICE market shares in the KSA compared with 6% for the EU. The gap is bigger in KSA since it would take more time for BETs to penetrate the freight transport and due to the decreased cost of e-diesel in Saudi Arabia compared with the EU. However, it is important to mention that with the increase in e-fuel usage, MCC would lose its advantage for marginal abatement cost calculations. Therefore, more ICE diesel sales don’t necessarily mean higher market shares for on-board mobile carbon capture systems. In fact, if e-diesel is officially adopted as a low carbon fuel and as e-diesel–fueled trucks are considered among the net-zero technologies, ICE trucks will be both cost-competitive and eco-friendly, especially if there is motivation to subsidize e-diesel retail costs. The results show that a maximum of 15% subsidy for e-diesel refueling retail price is required between 2035 and 2045 for ICE truck to still be attractive with other low carbon technologies from a TCO perspective. This subsidy will decrease the energy costs, being the biggest share of the perceived cost of ownership. In that case, MCC would still be a complementary solution to decarbonize the freight transport sector Even with competitive TCO values, MCC would lose its advantage compared with conventional trucks especially when we add up the CO
2 offloading, transportation, and storage infrastructure needed for trucks with MCC. The future of market acceptance for e-diesel trucks as well as MCC technologies lies on the efforts that government would put whether on supplying and subsidizing e-fuels or investing on CO
2 capture value chain that could cover the needs of increasing fleet stocks once MCC is commercialized and penetrating the heavy-duty market.
4. Discussion
Decarbonizing the transport sector is inevitable to fulfill governments aspirations to reach carbon neutrality. Therefore, it is crucial to develop reliable transportation models to investigate the feasibility and market opportunities of net-zero transport technologies, as well as the implications of tailpipe-based policy regulations on future energy demand and well-to-wheel GHG emissions. In this context, this works illustrates the research findings and methodology novelties on investigating the future of road freight transport in the EU and KSA, showcasing the novelties and capabilities of the Mobility Energy and Transport Analysis (META) model. While it is complicated to quantify the exact drivers of consumers when purchasing a car, decision-making approaches based on total cost of ownership are better fitted for the heavy-duty sector since freight transport companies are mainly driven by profit increase. This explores the market acceptance opportunities for net-zero transport solutions including e-diesel fueled trucks as well as onboard mobile carbon capture technologies. Comparing the KSA and EU, differences in economic, energy, and infrastructure characteristics led to a diverse landscape in new sales and fleet stocks projections, despite pledging similar carbon neutrality motivations.
The transportation sector is still mainly powered by carbon-based fuels. Based on our study, MCC represents an economically promising solution to decarbonize the heavy-duty sector, through its decreased TCO and MAC values compared with BEVs and FCEVs until 2035. In fact, MCC offers an effective complement to stationary CCS and should be explored as a viable climate mitigation option. Compared with BEVs, MCC offers several benefits. MCC technology could be retrofit onto existing vehicles, bypassing the typical fleet turnover. Moreover, the technology could be implemented progressively rather than requiring major efforts to supply the required infrastructure network before implementation. Another advantage for MCC is the fact that ICE engine costs will keep on increasing to meet more stringent fuel economy and emissions regulations. This cost increase could be bypassed if we rely on MCC, especially that its costs are predicted to decrease as technology advances and mass production capabilities increase. The main takeaway behind this study is that a free market strategy with promoting e-diesel availability as well as MCC technology will guarantee lower GHG emissions in the short-term and mid-term and will allow a smoother transition towards BETs and FCETs. Overall, there is no need to force consumers and OEMs towards BETs through stringent policies. Consumer acceptance for BETs will dominate in all ways because of its projected improved convenience through the infrastructure enhancements and charging costs decrease as well as the technology maturity. Additionally, consumers will not be encouraged to keep purchasing conventional trucks the more e-diesel penetrates blending stations, making it more expensive to refuel their vehicles, despite e-diesel benefits in terms of emissions. Given that META is a complex model that has multiple parameters, sensitivity analysis is crucial to identify the impact of any parameter on future market sales for vehicle technologies. Although the market sales in the KSA and EU will be similar due to the 2050 net-zero constraint, the sensitivity analysis conducted in this study shows that the impact e-diesel blending mix availability will have a different magnitude depending on the region. Which means that in any region, if the main constraint is net zero by 2050, in 2050 the fleet will look approximately the same. Since factors such as battery costs or hydrogen prices can change due to political or strategic updates, it is important for META to be adaptable to such changes. Identifying the most sensitive parameters will allow for the incorporation of these parameters as an input layer in the neural network, which will be discussed in future work.
Market penetration of MCC depends on government strategies to adopt it as an official new energy technology and to deploy the required CO2 offloading infrastructure making it convenient for truck drivers to offload CO2 at the same time of refueling, avoiding any operational added downtime that could lead to deterioration of the convenience advantage of conventional trucks compared with BEVs and FCEVs. This is where this study gets value by gauging the economic opportunities and environmental benefits of on-board carbon capture compared with the alternative technologies in the future. During the offloading step, trucks need to have the required infrastructure to offload the captured CO2. Offloading frequency will depend on the market penetration of MCC which could increase the demand for disposal facilities. After offloading, CO2 is transported to reception facilities, and further processing may be needed to prepare and condition the CO2 stream to be compatible with the downstream CCUS value chain before reaching the end of the value chain which consists of either permanent storage (sequestration) as waste or utilization. All these CO2 value chain processes need to be implemented to facilitate the market acceptance of MCC and face the current logistic challenges. In fact, MCC technology’s future depends on the prospects of governments to consider CO2 as a valuable product with an attractive revenue stream as it can be in short supply in many markets. Market opportunities applications include food processing, pharmaceuticals and medicine, horticulture, refrigeration, clean water applications, as well as a fumigant to remove infestation. On top of that, a key application of CO2 could be to produce synthetic fuels, as a part of the sustainability global goals and commitments that would align with the carbon neutrality aspirations. Although we have already taken offloading costs into consideration in our analysis, a beneficial step in our modeling approach in the future is to quantify captured CO2 infrastructure requirements as well as its market opportunities and profit benefits through different possible scenarios.
Another net-zero technology included in the study is FCEV. Depending on the hydrogen refueling infrastructure development and the affordability of hydrogen retail price, META forecasts that FCEVs are projected to reach high market shares in the future and play an important role in decarbonizing the heavy-duty sector. Despite the promising growth prospects, the hydrogen market faces several challenges that need to be addressed. Scaling up the production of renewable hydrogen to meet growing demand poses technical and logistical challenges. Electrolysis technologies need to be further optimized and deployed at scale to enable large-scale production of renewable hydrogen cost-effectively. Moreover, harmonized policies and regulatory frameworks are essential to create a conductive environment for hydrogen investment and deployment. Governments need to provide long-term policy certainty, regulatory incentives, and market mechanisms to drive hydrogen market growth.
