Analysis of Indoor Air Quality and Fresh Air Energy Consumption Based on Students’ Learning Efficiency under Different Ventilation Methods by Modelica
Abstract
1. Introduction
2. Methodology
2.1. Outdoor Meteorological Parameters
2.2. Indoor Environmental Parameters
- (1)
- The CO2 in the classroom was evenly distributed. The outdoor CO2 concentration remained 400 ppm.
- (2)
- There were 30 students in the classroom, which is a common pattern in Chinese universities.
- (3)
- The CO2 generation remained constant during the class and no CO2 had been generated during the break.
- (4)
- The influence of students entering and leaving the classroom was ignored.
- (5)
- The building energy consumption caused by the load of the building envelope remained constant.
2.3. Modelica Model
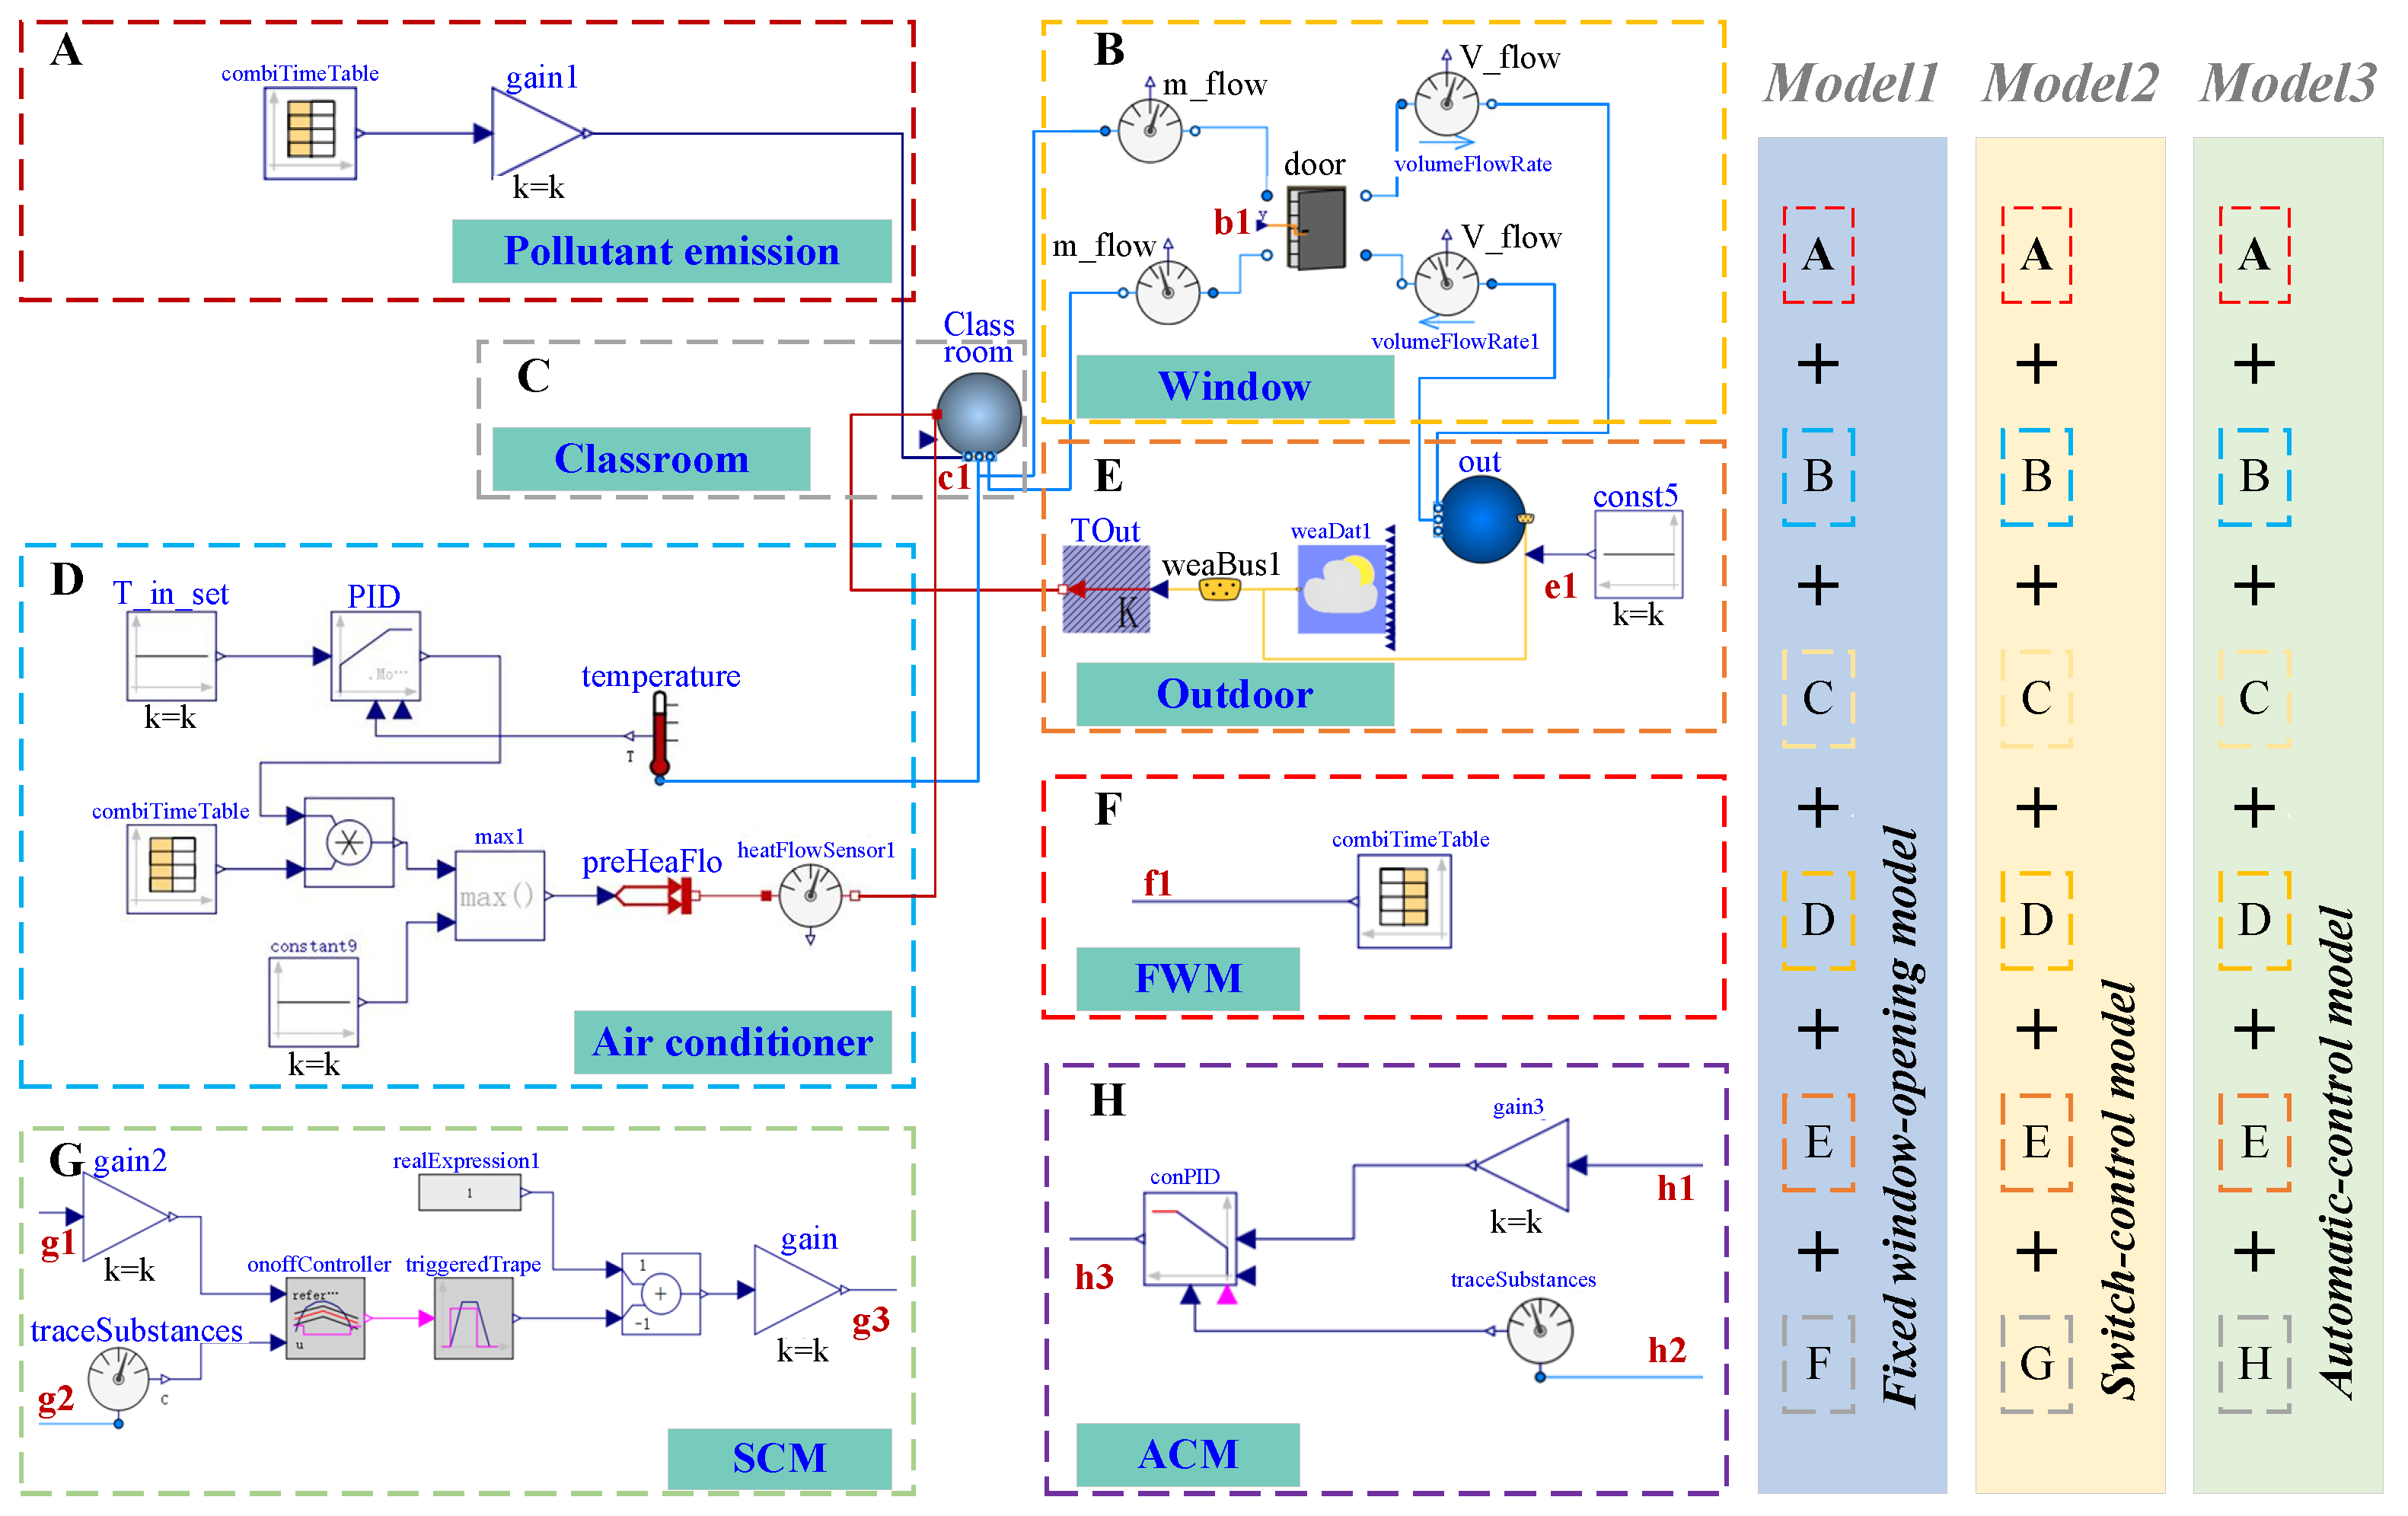
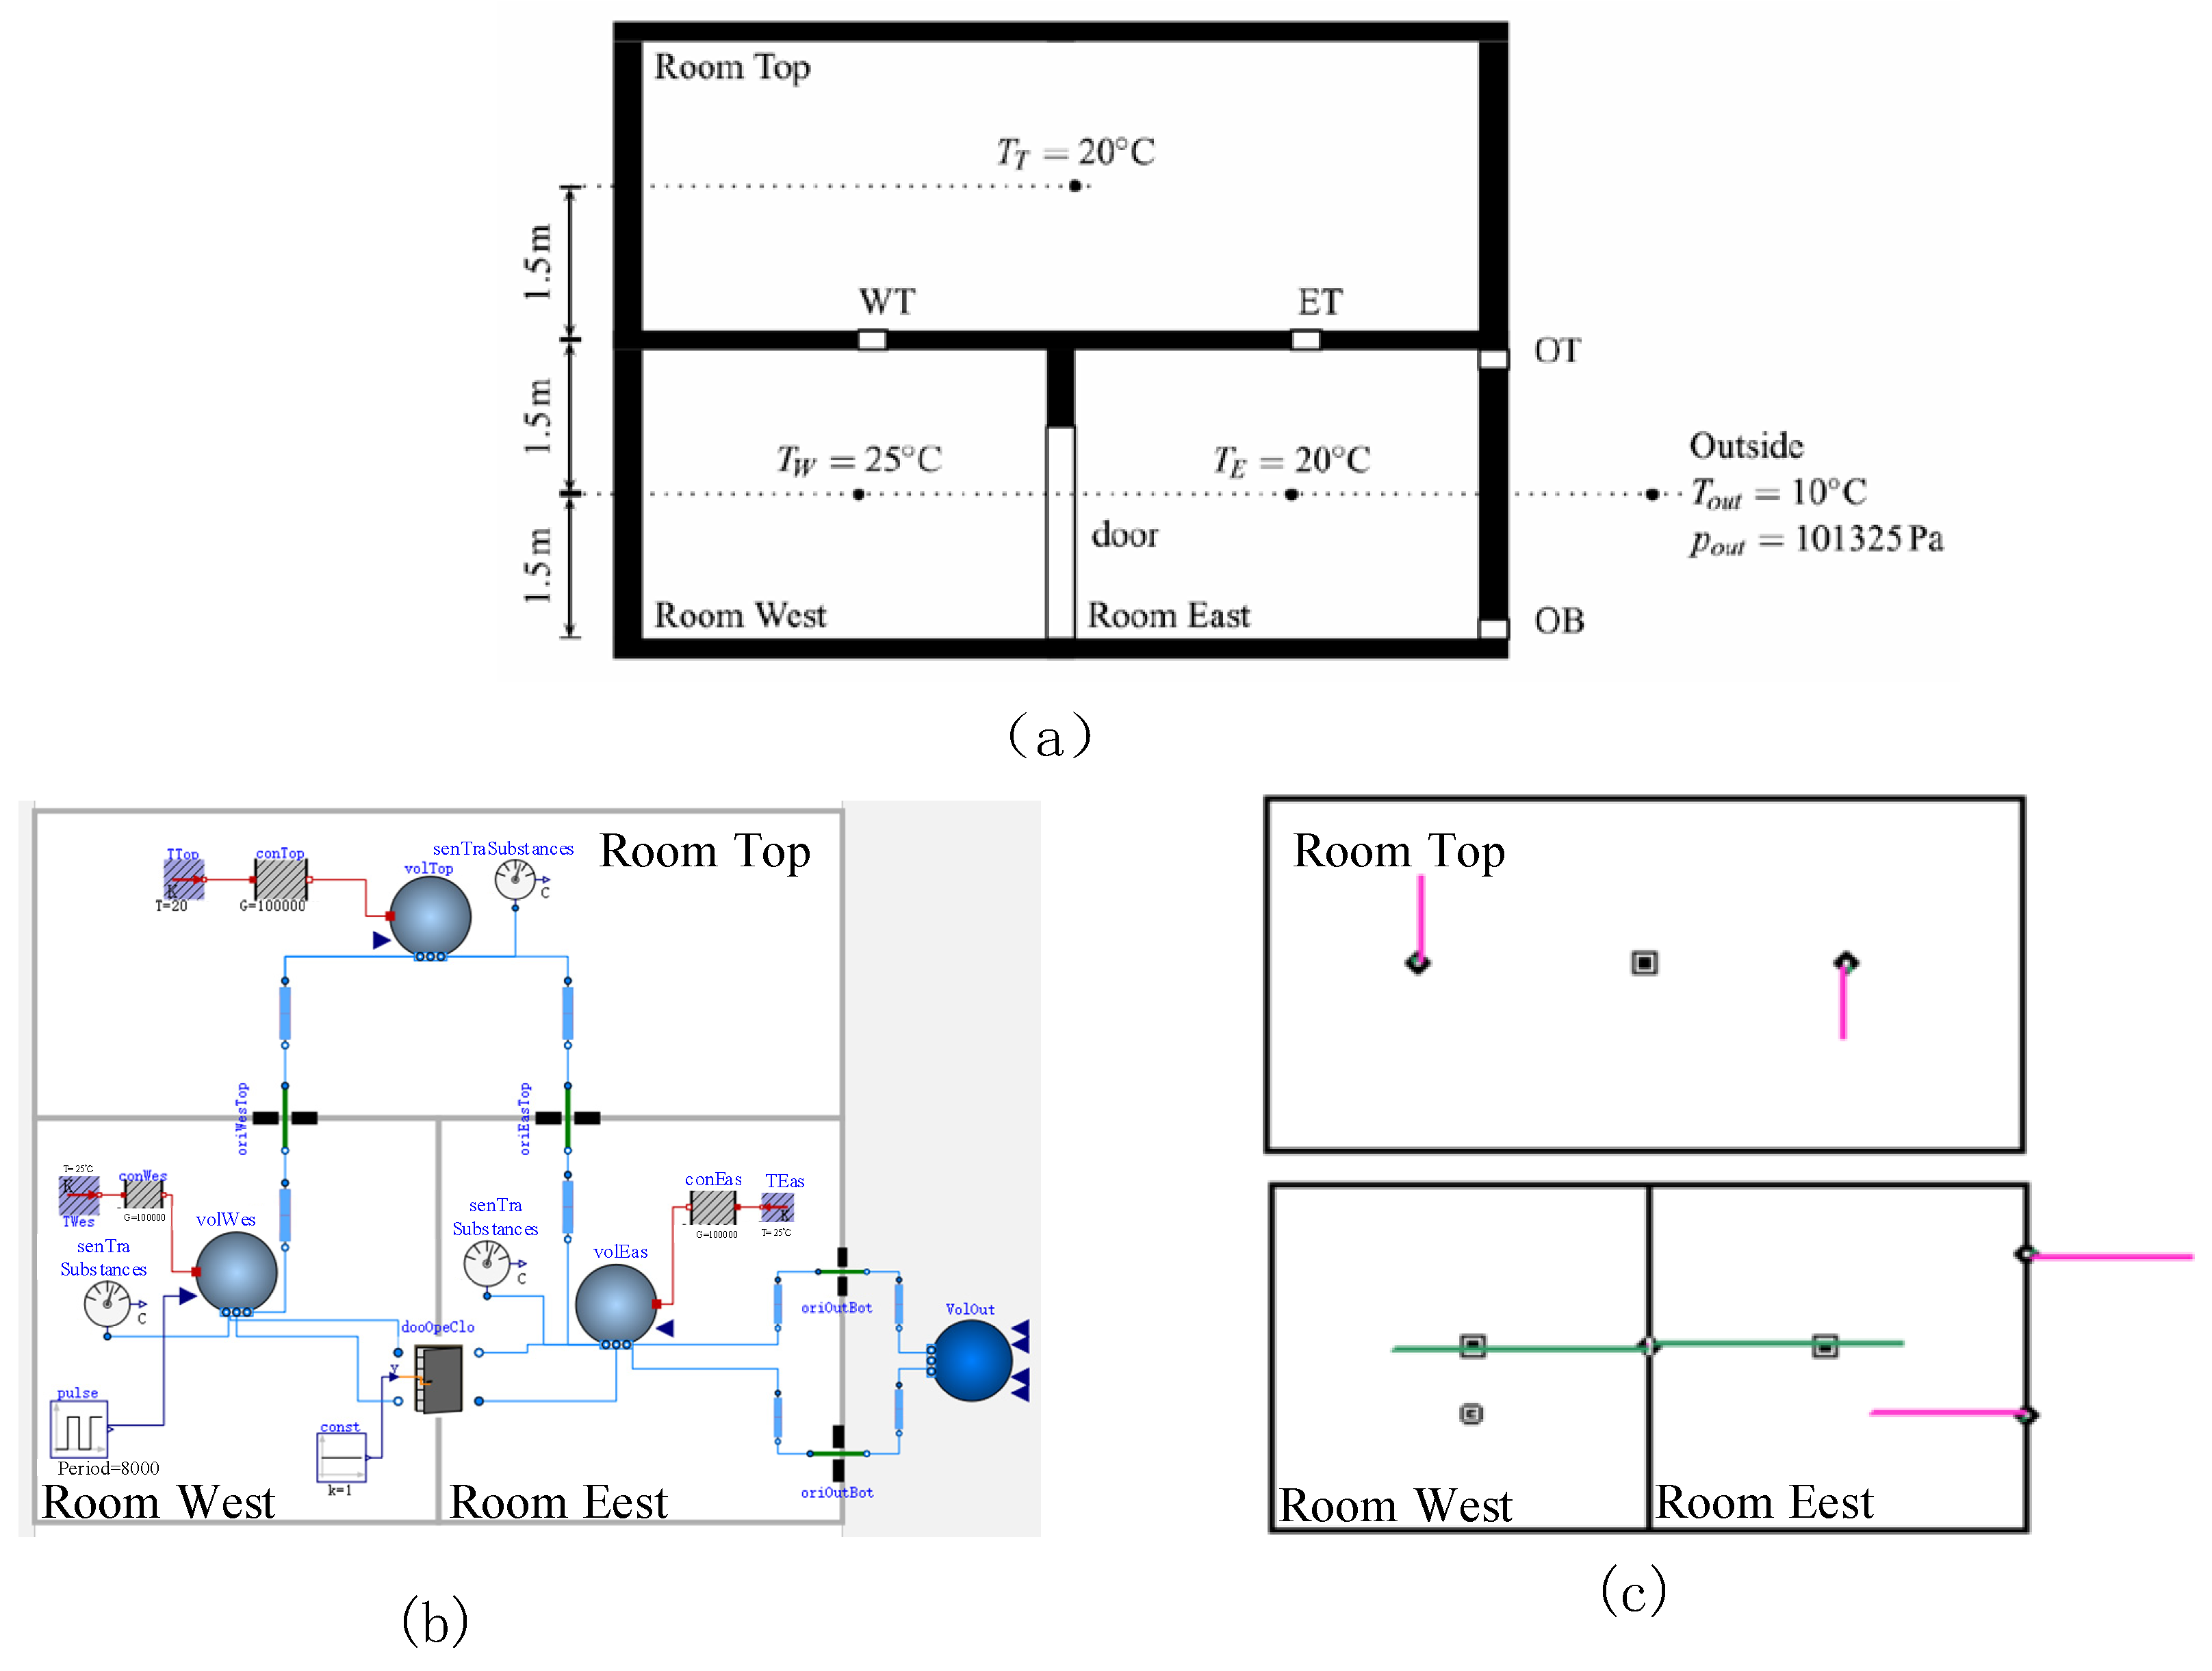
2.4. Validation
3. Results and Discussion
3.1. The Effect on IAQ and Thermal Comfort Based on the Regulations
3.1.1. The Effect of the Fixed Window-Opening Method
3.1.2. The Effect of the Switch Control Method
3.1.3. The Effect of the Automatic Control Method
3.1.4. The Effect of Indoor Average CO2 Concentration and Temperature
3.2. The Analysis of IAQ and Thermal Comfort Based on Learning Efficiency
3.2.1. The Effect of the ICC
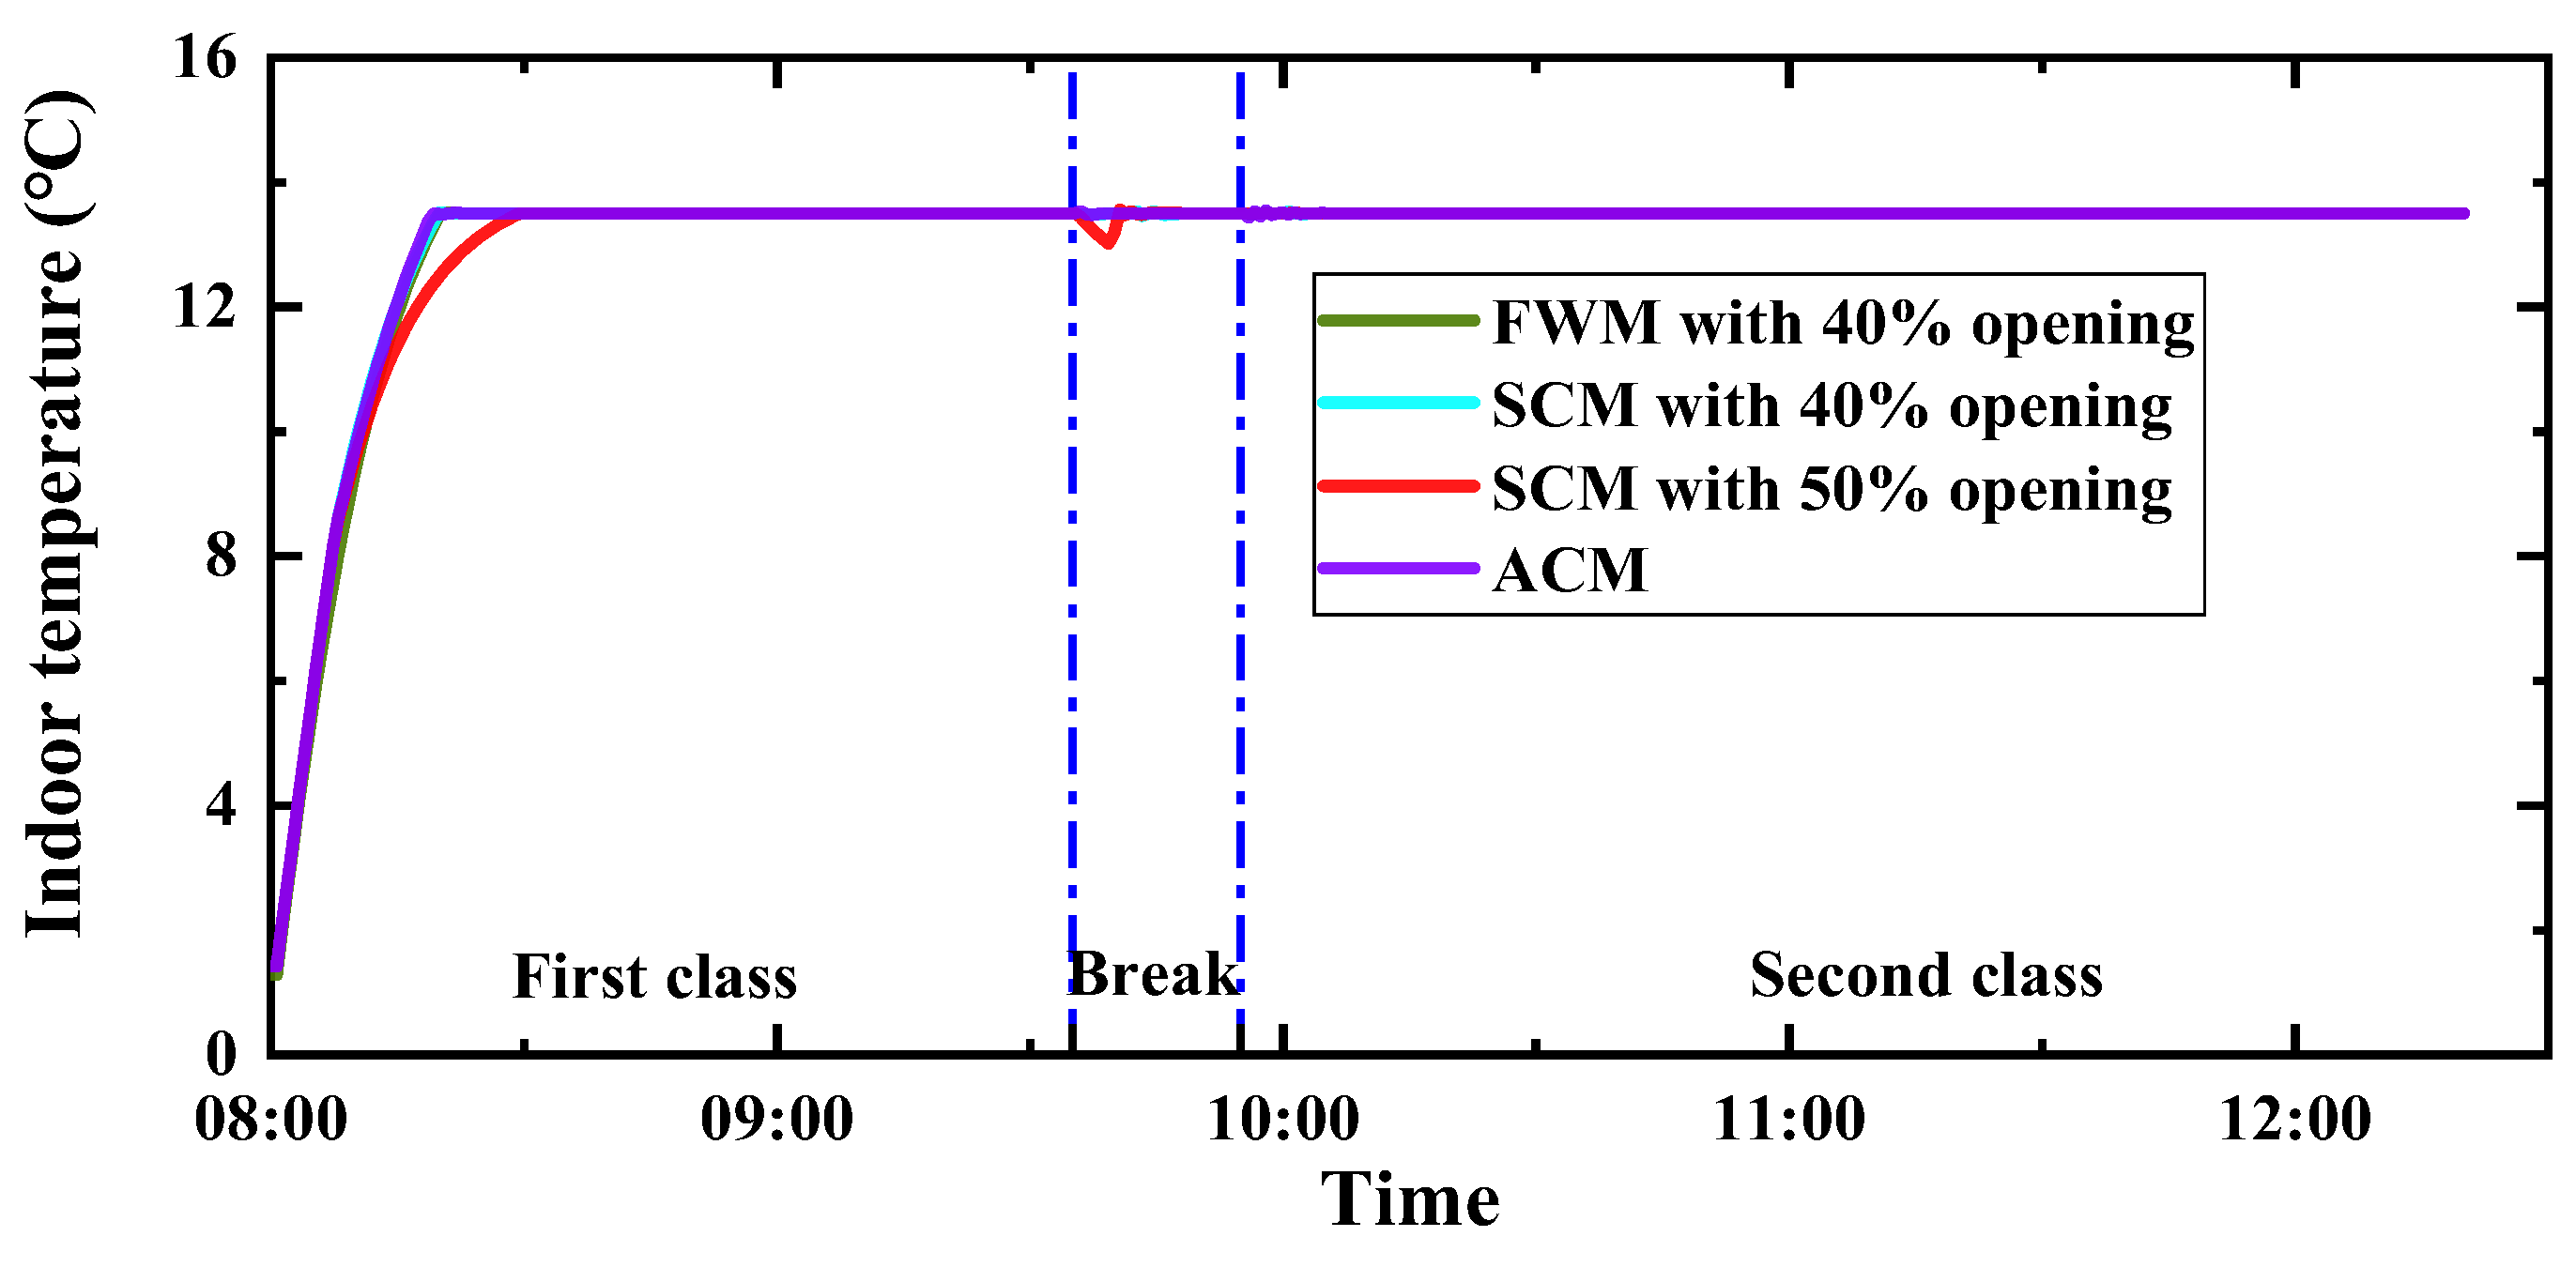
3.2.2. Indoor Temperature
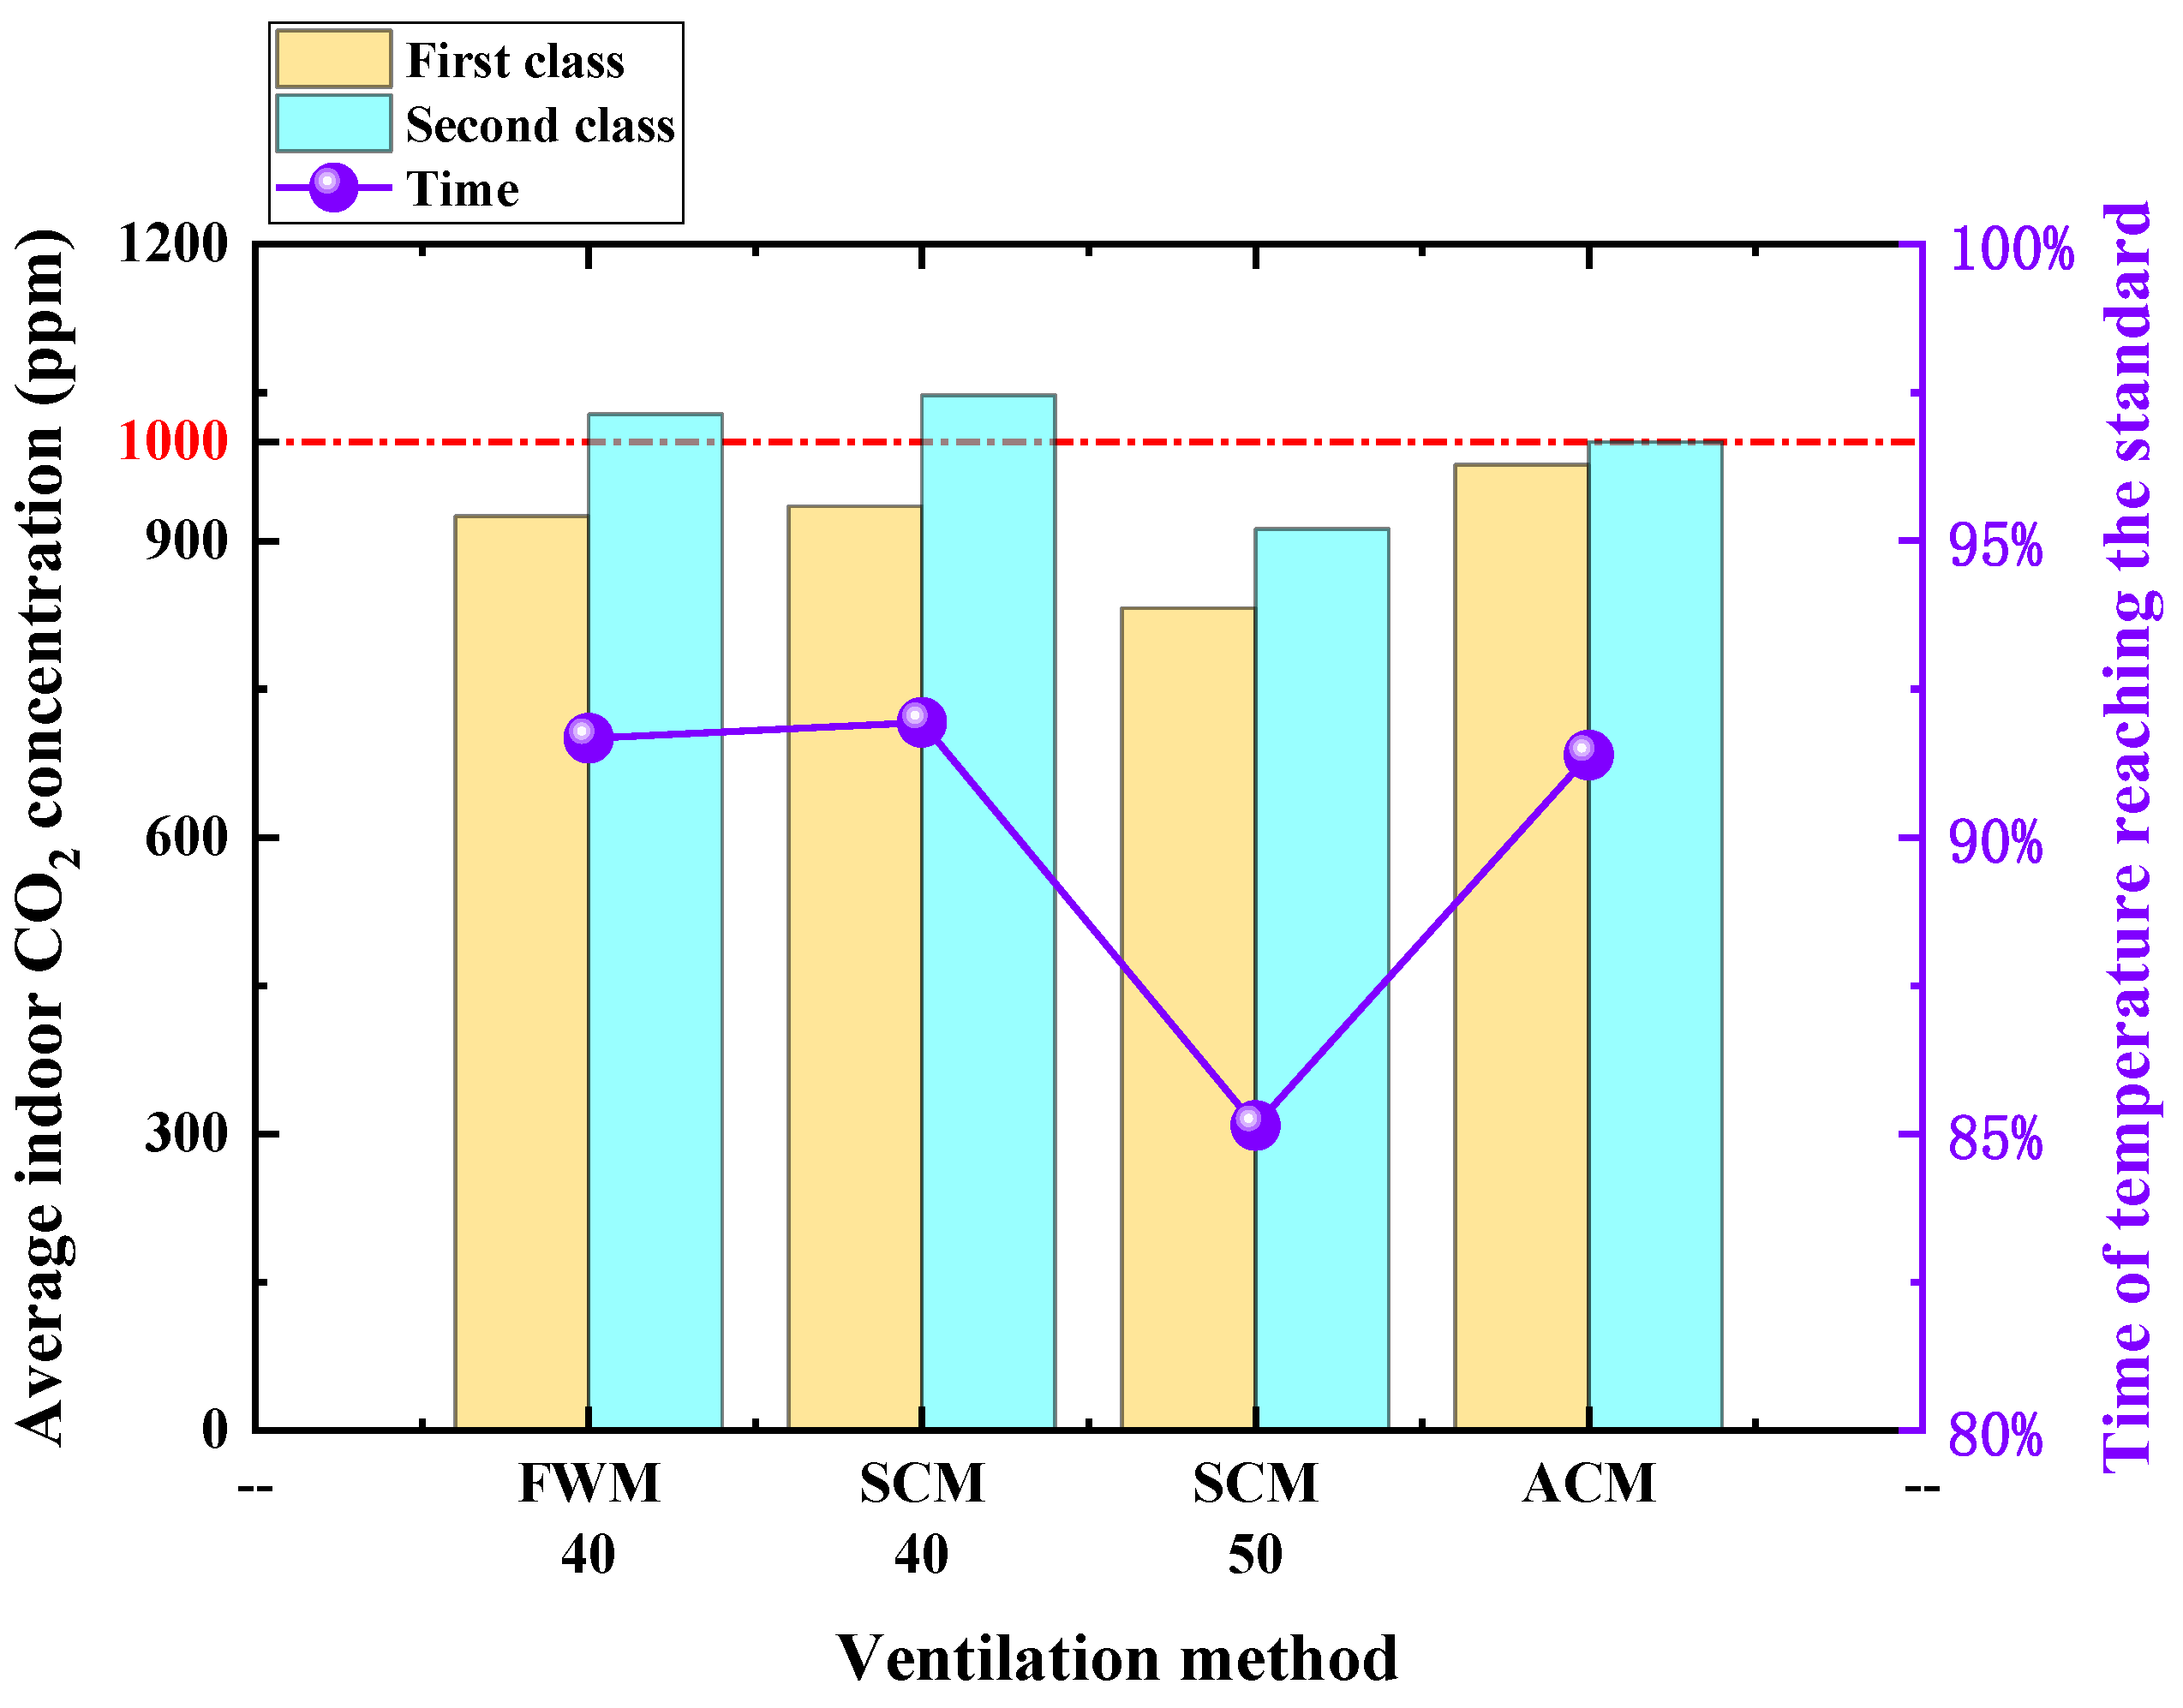
3.2.3. Comparison of Indoor Average CO2 Concentration and Temperature
3.3. Analysis of Fresh Air Energy Consumption
3.3.1. Heating Capacity of Air Conditioning under the Temperature 18 °C
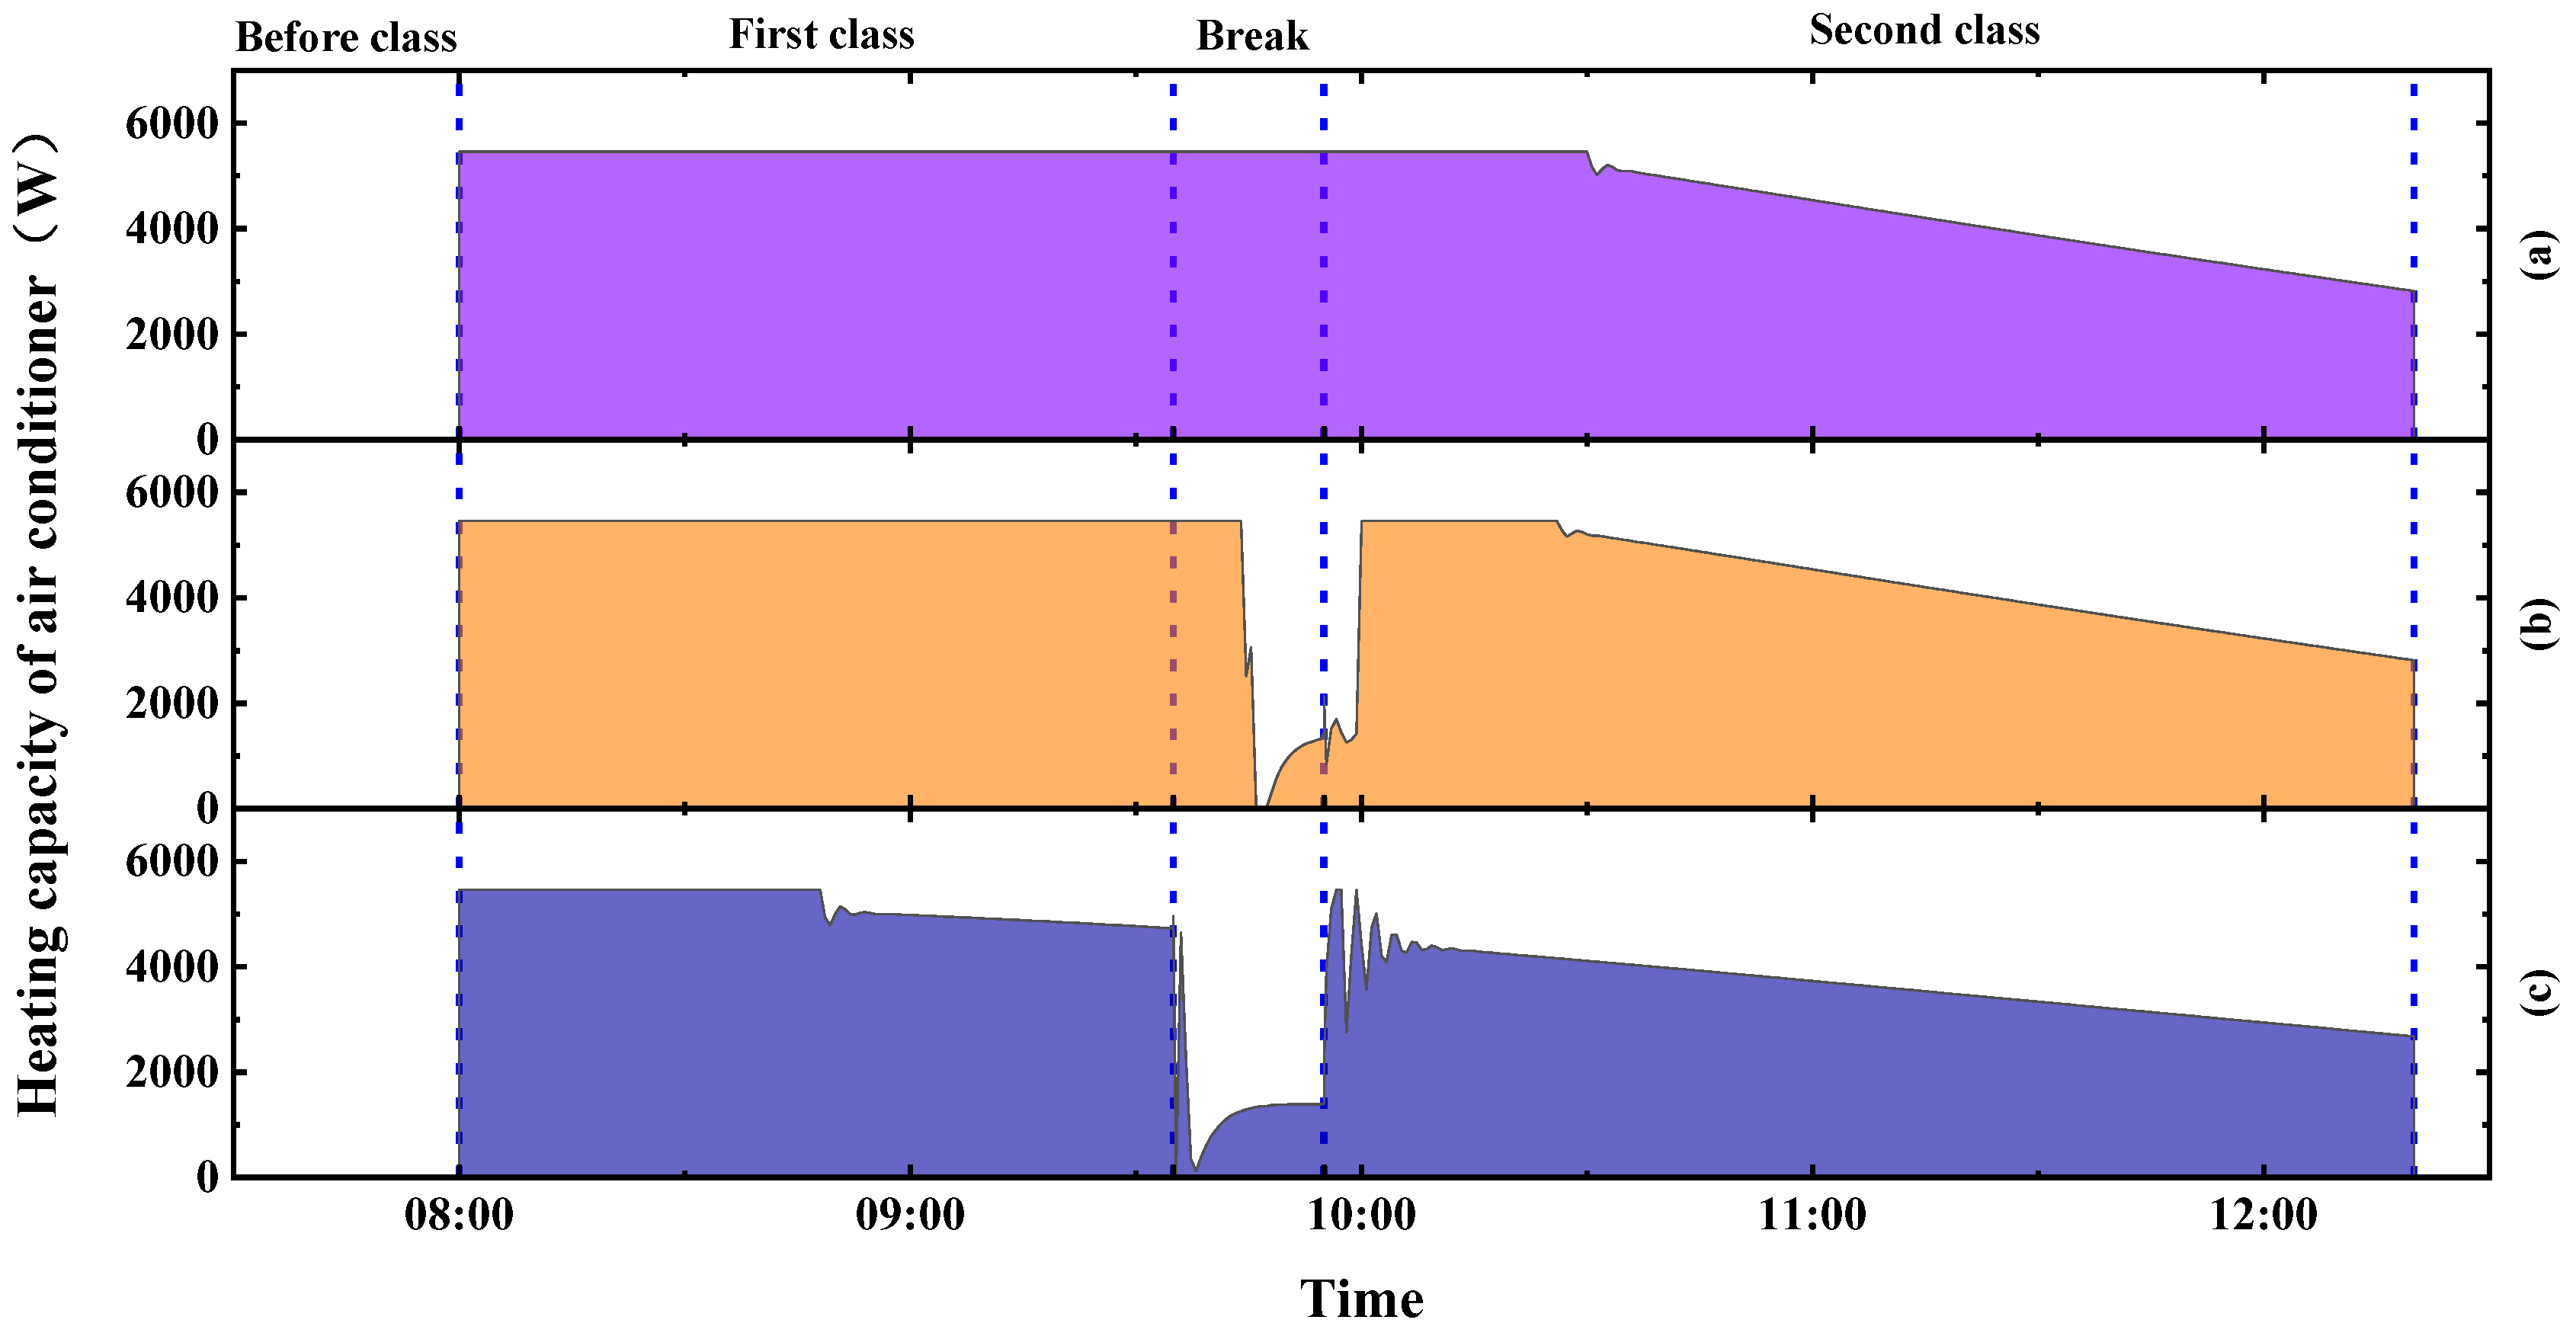
3.3.2. Heating Capacity of Air Conditioning under the Temperature of 13.5 °C
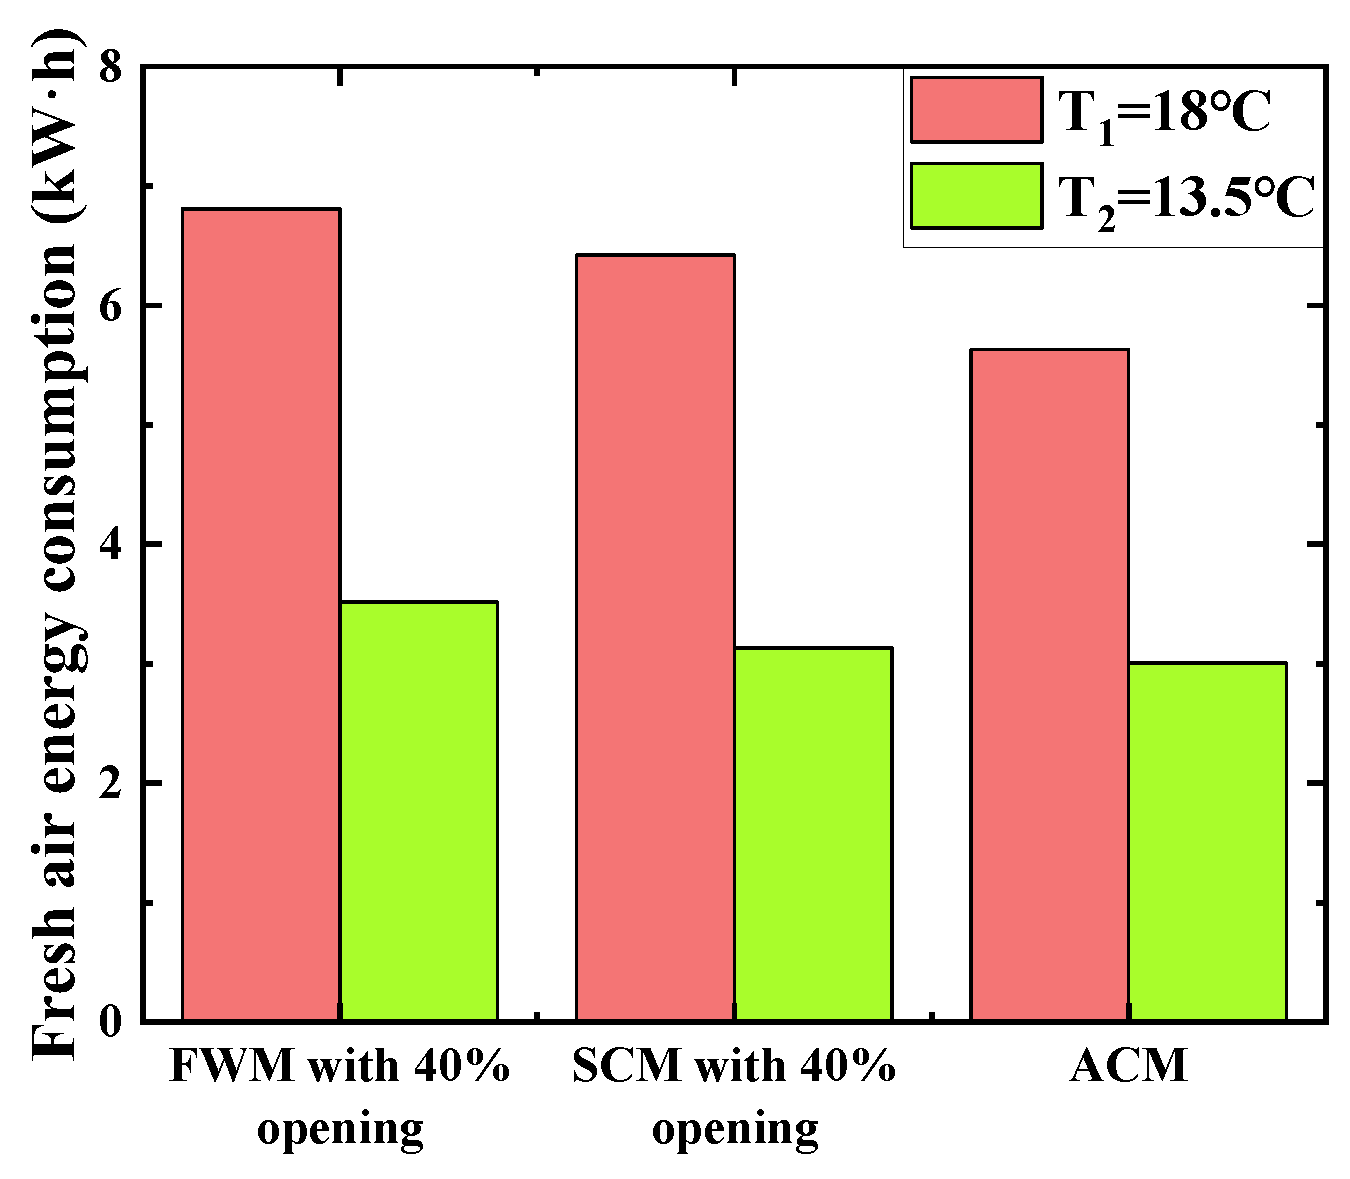
3.3.3. Comparison of Energy Consumption under the Design Temperatures
4. Conclusions
- (1)
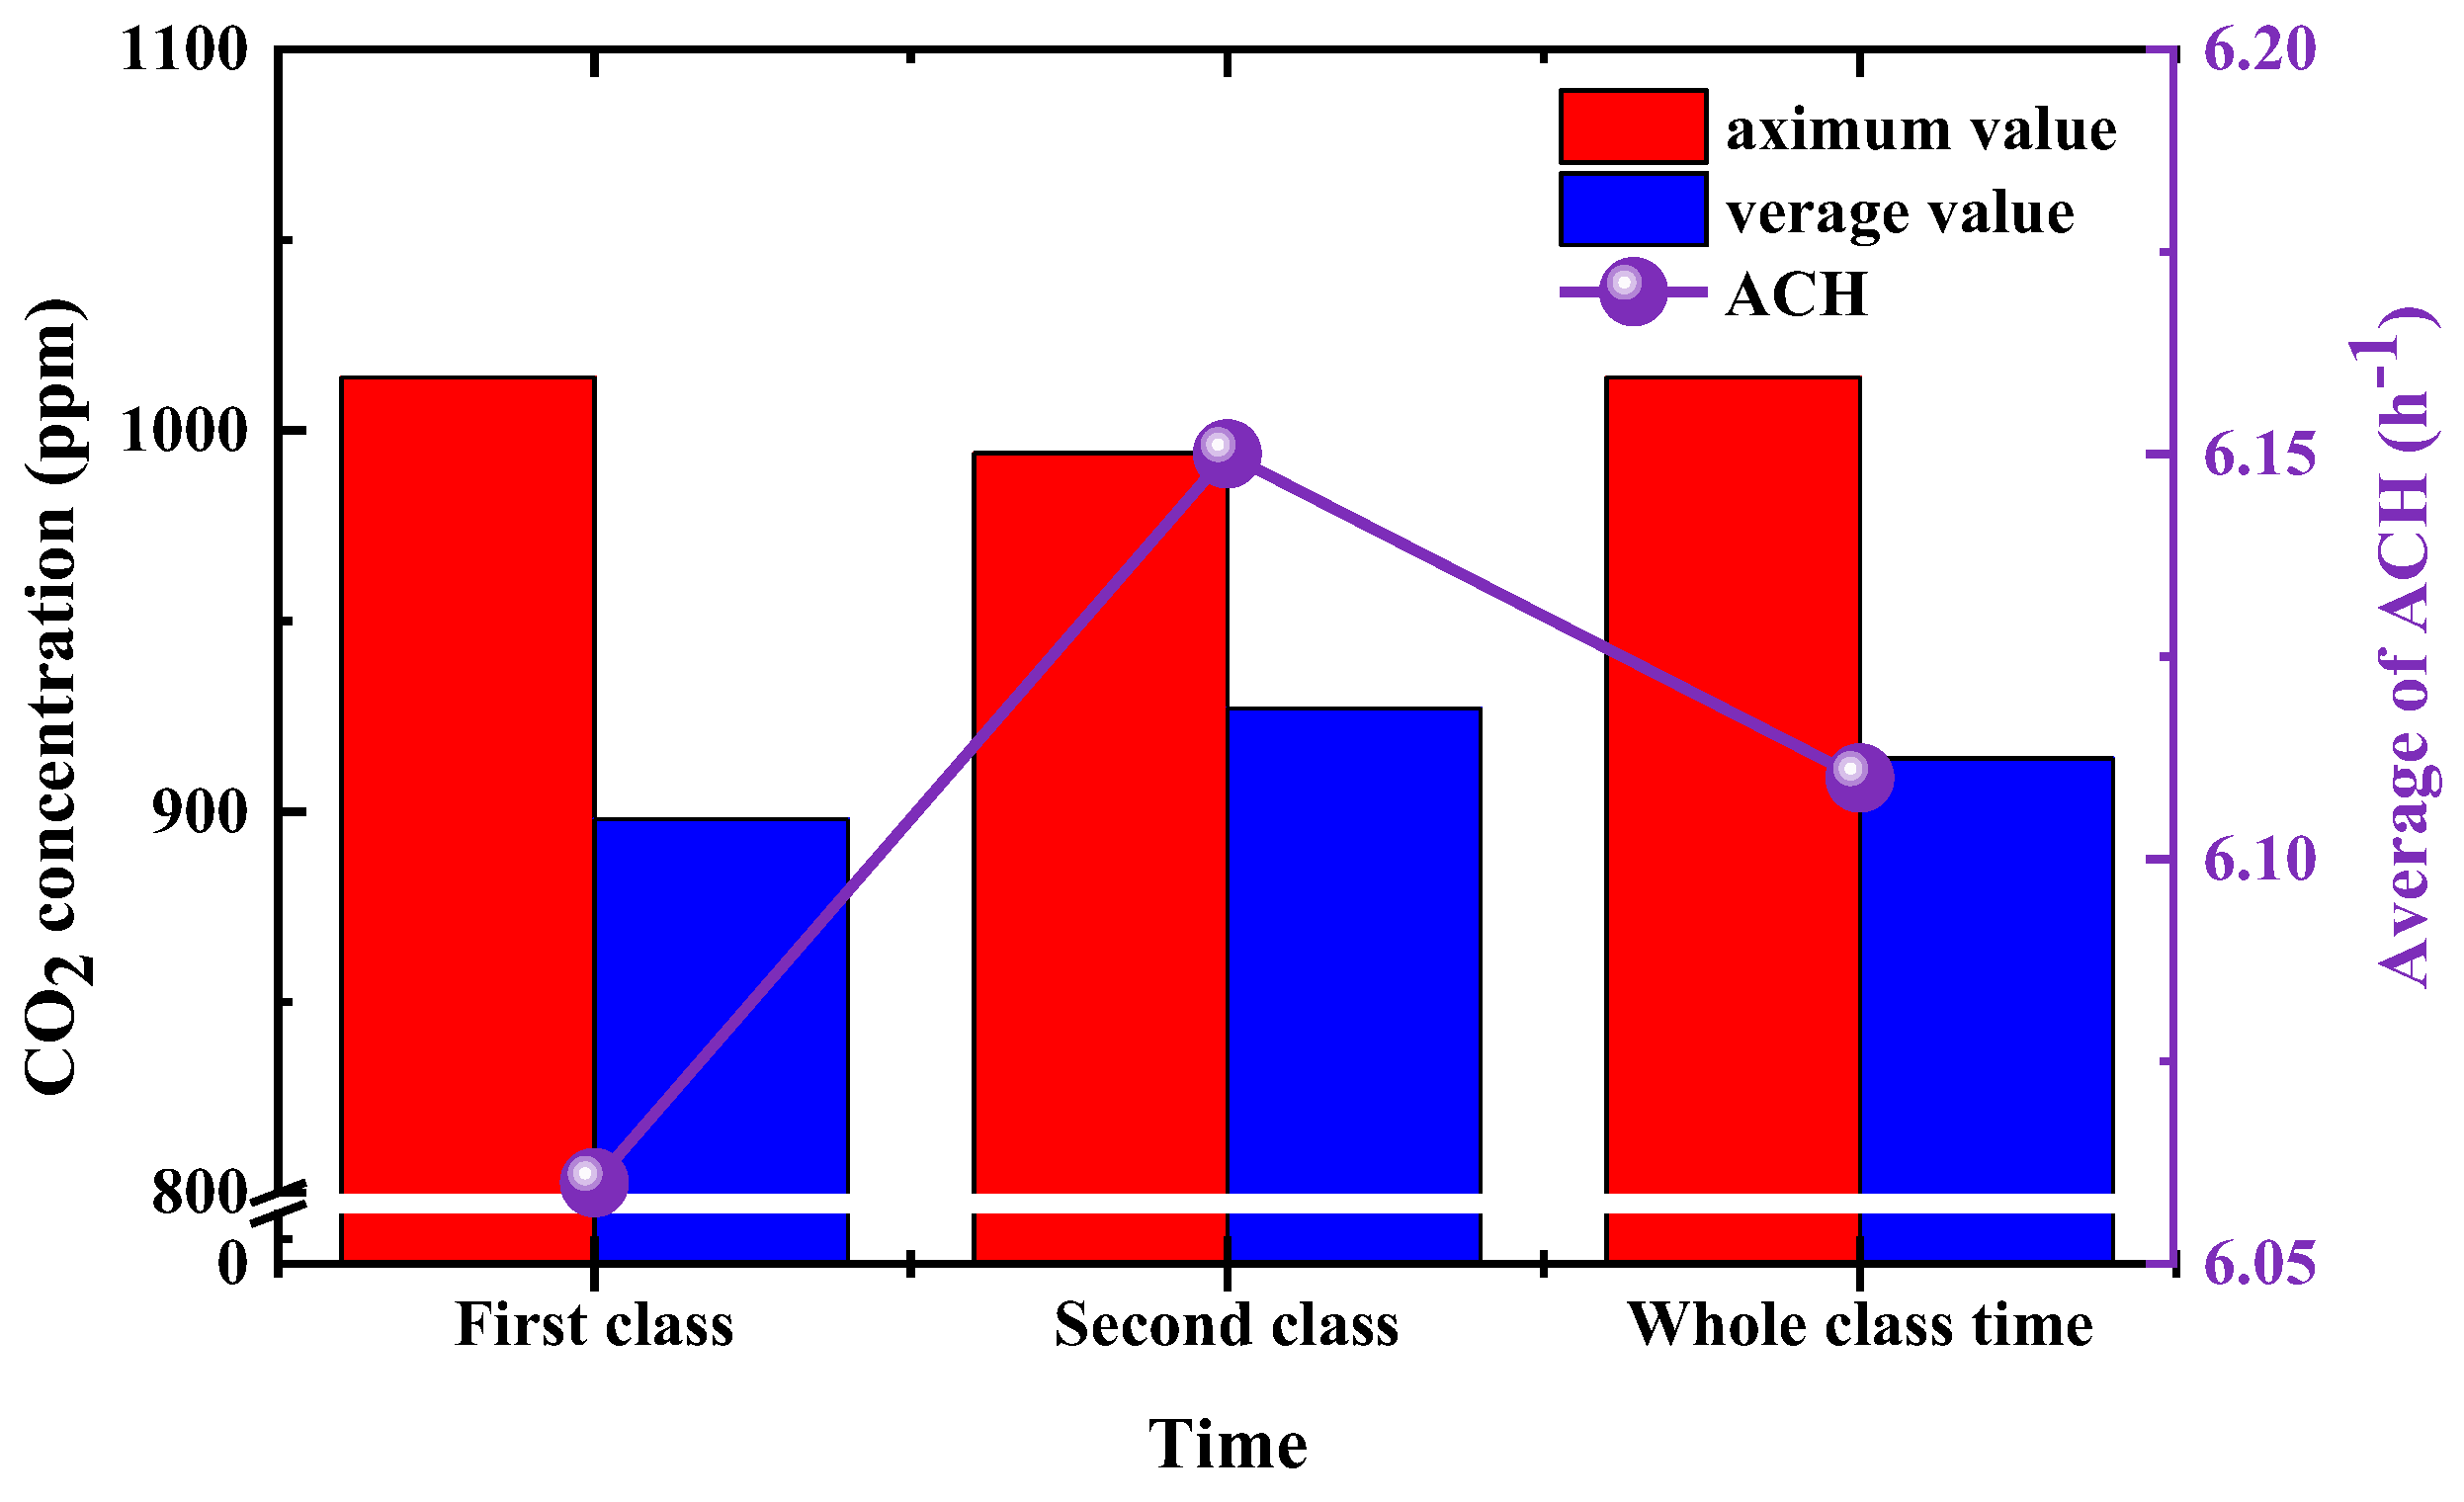
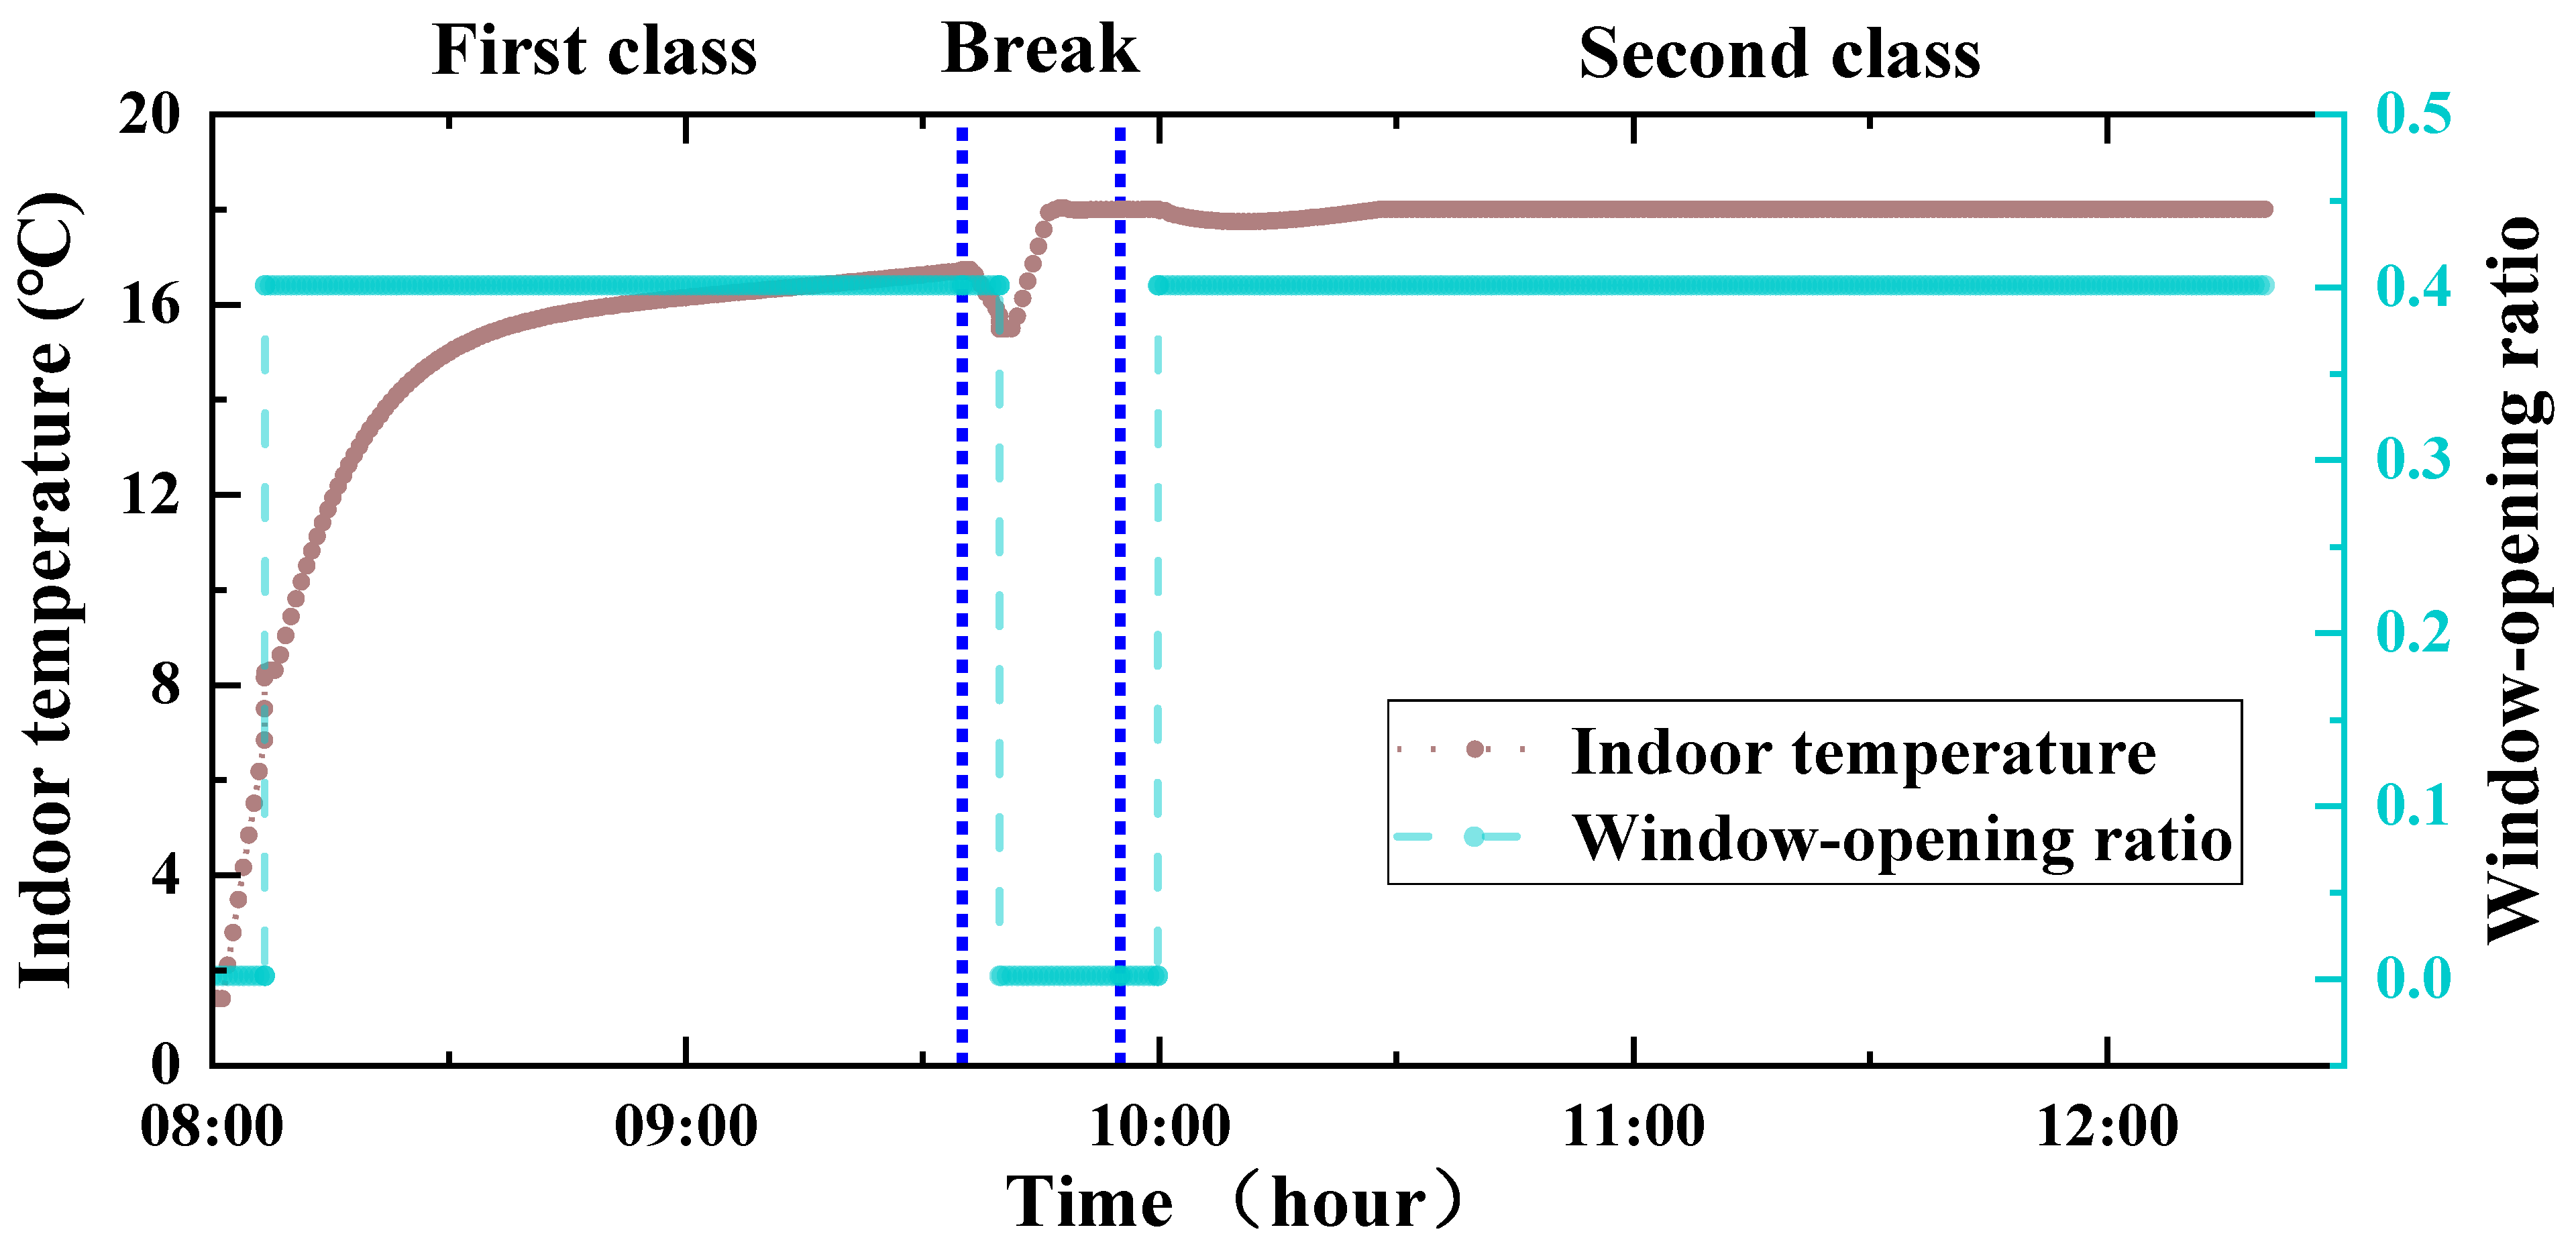
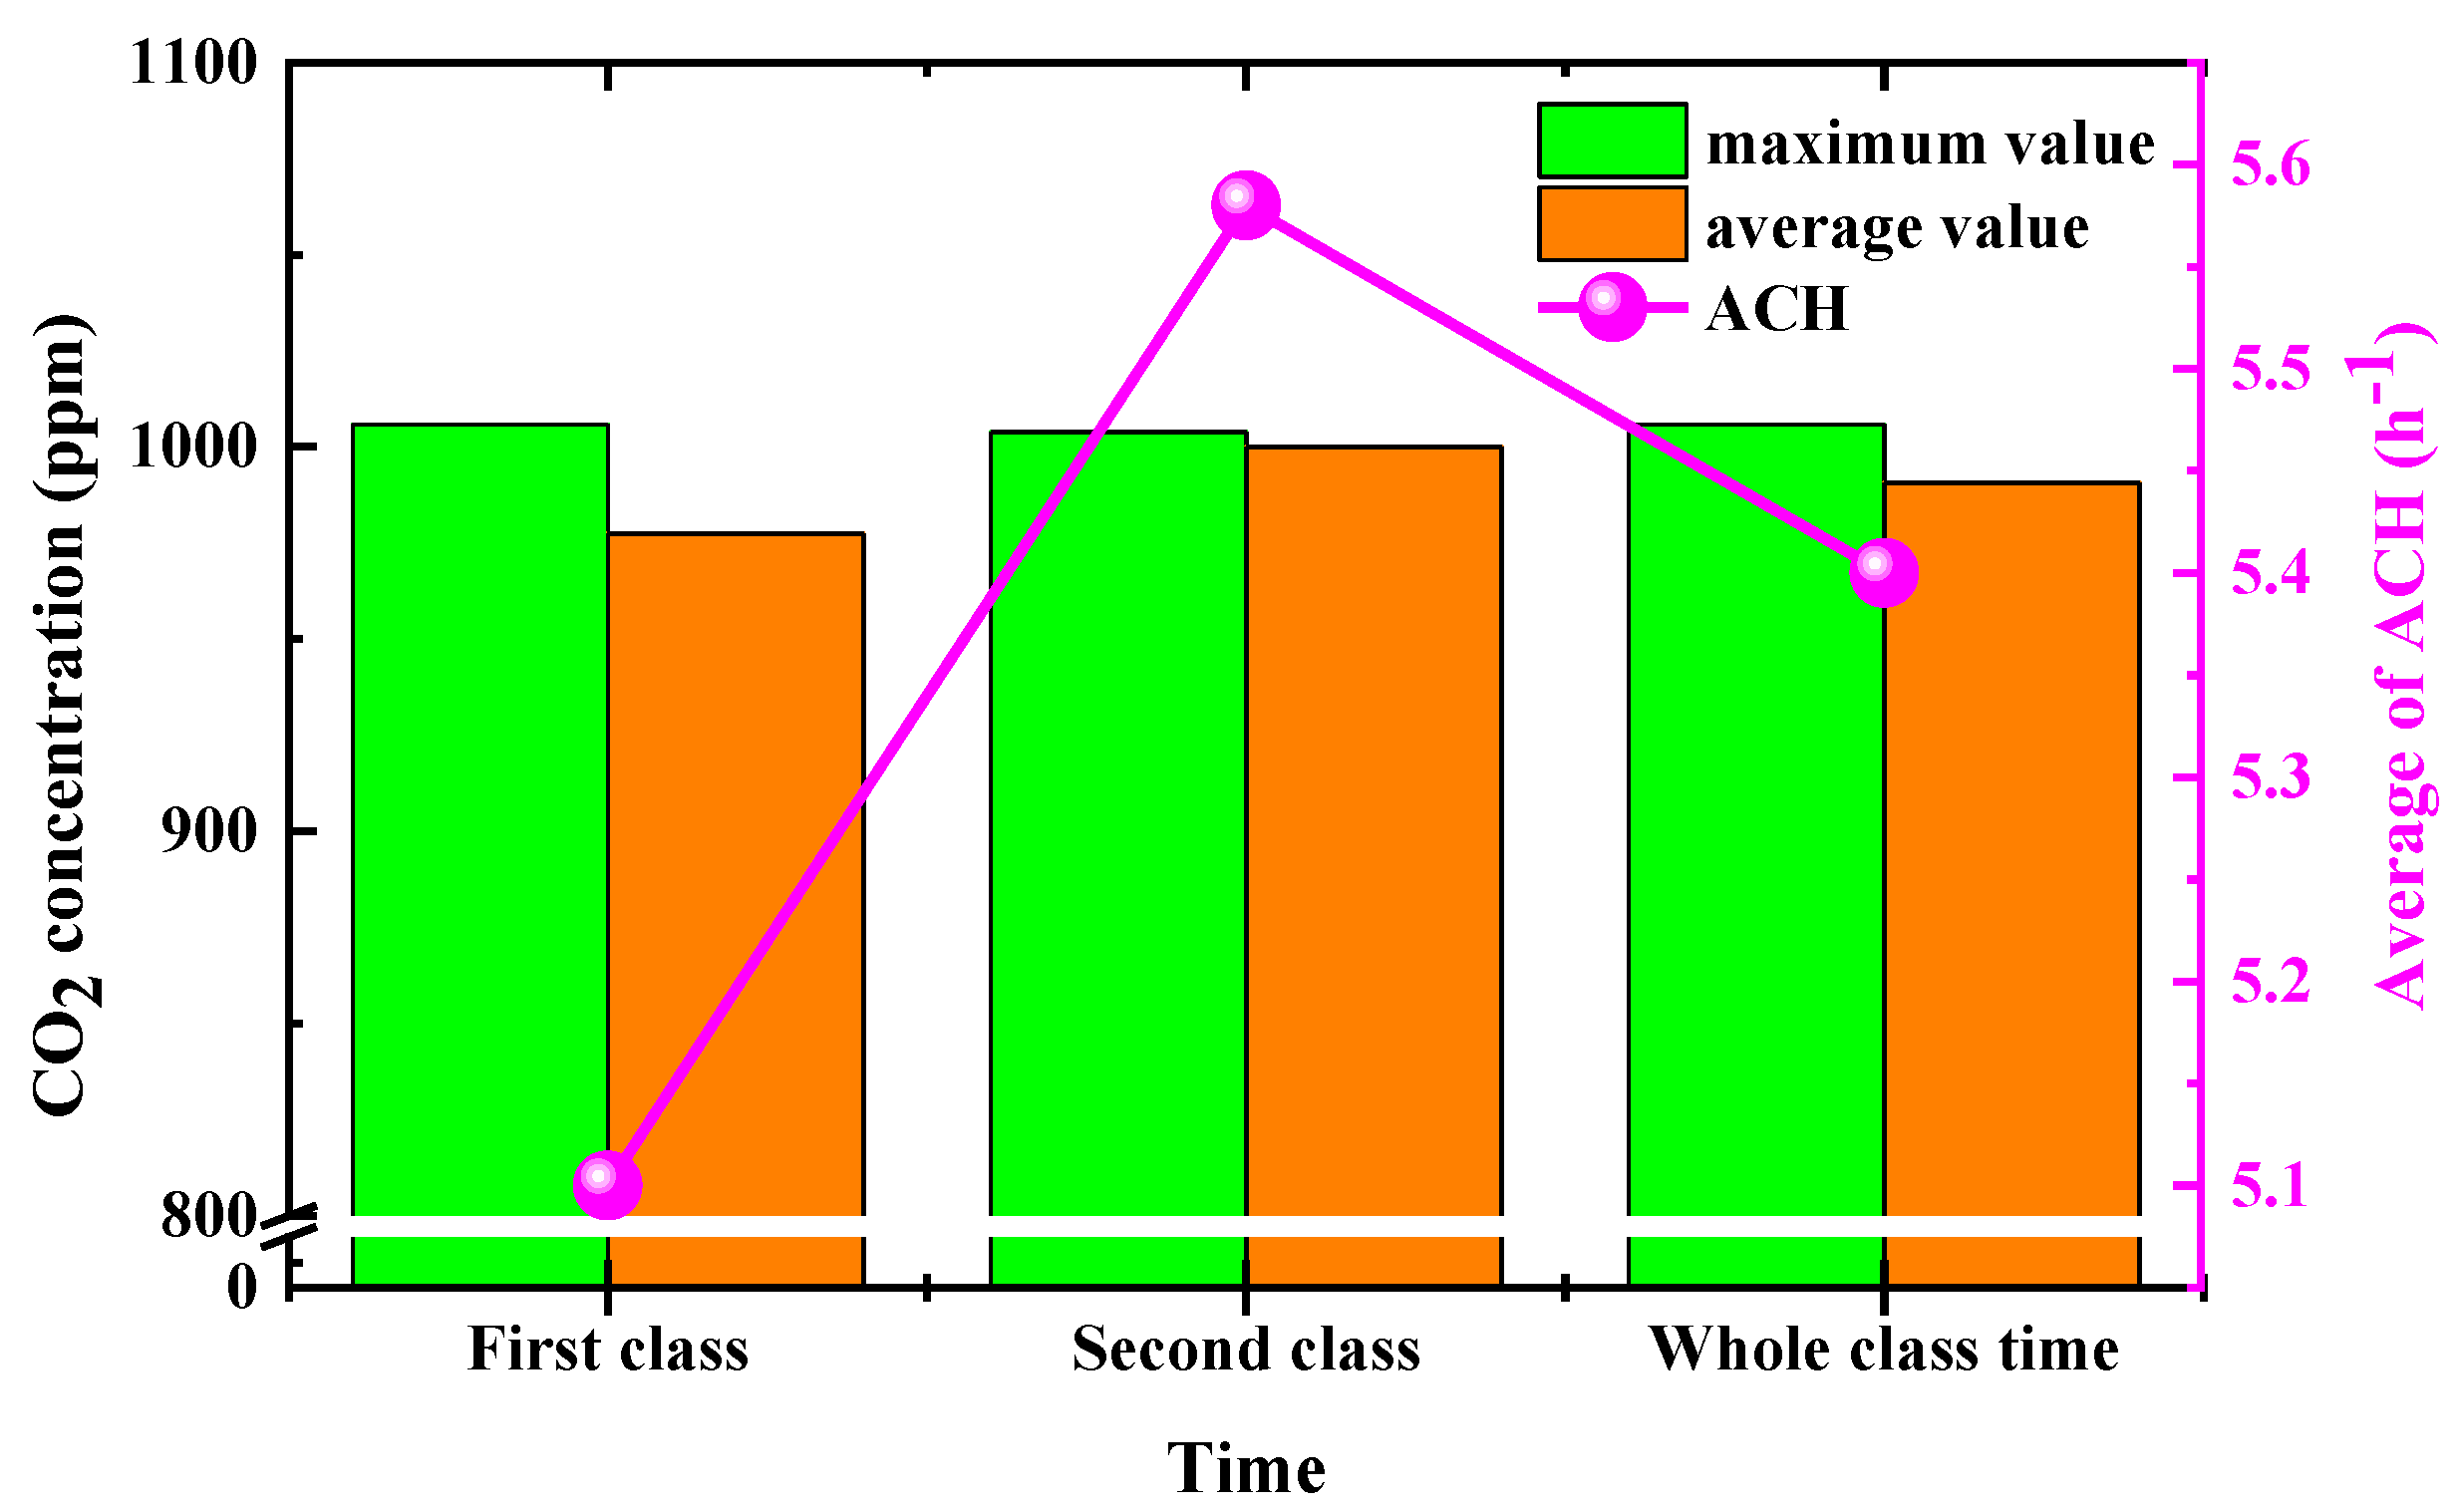
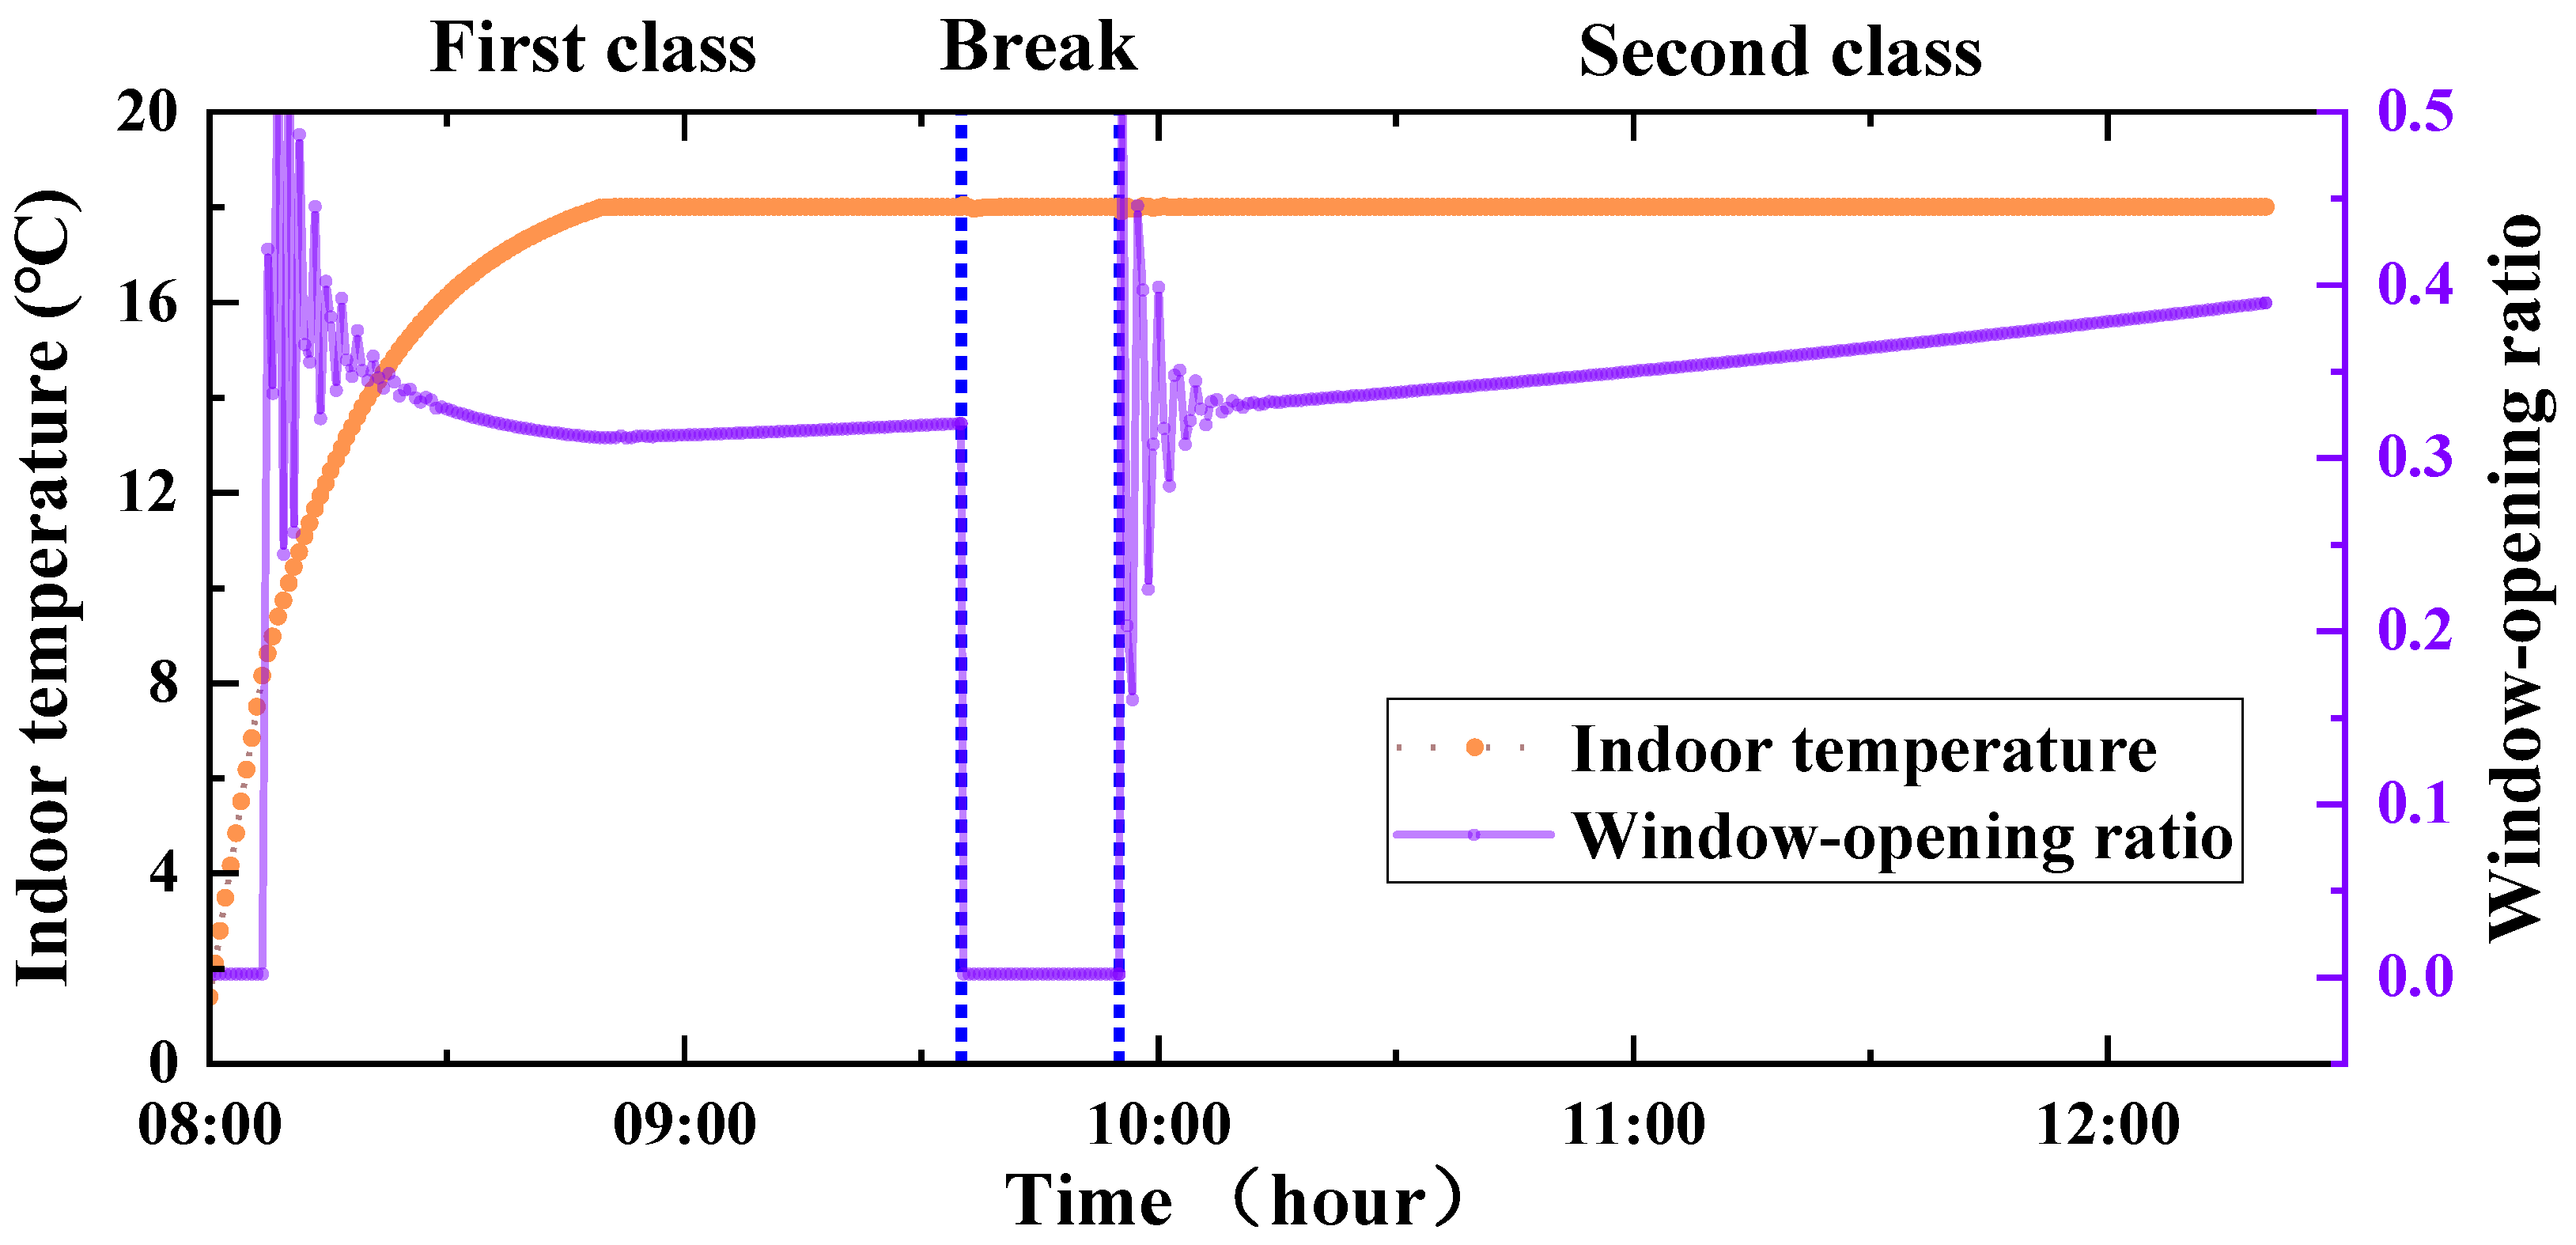
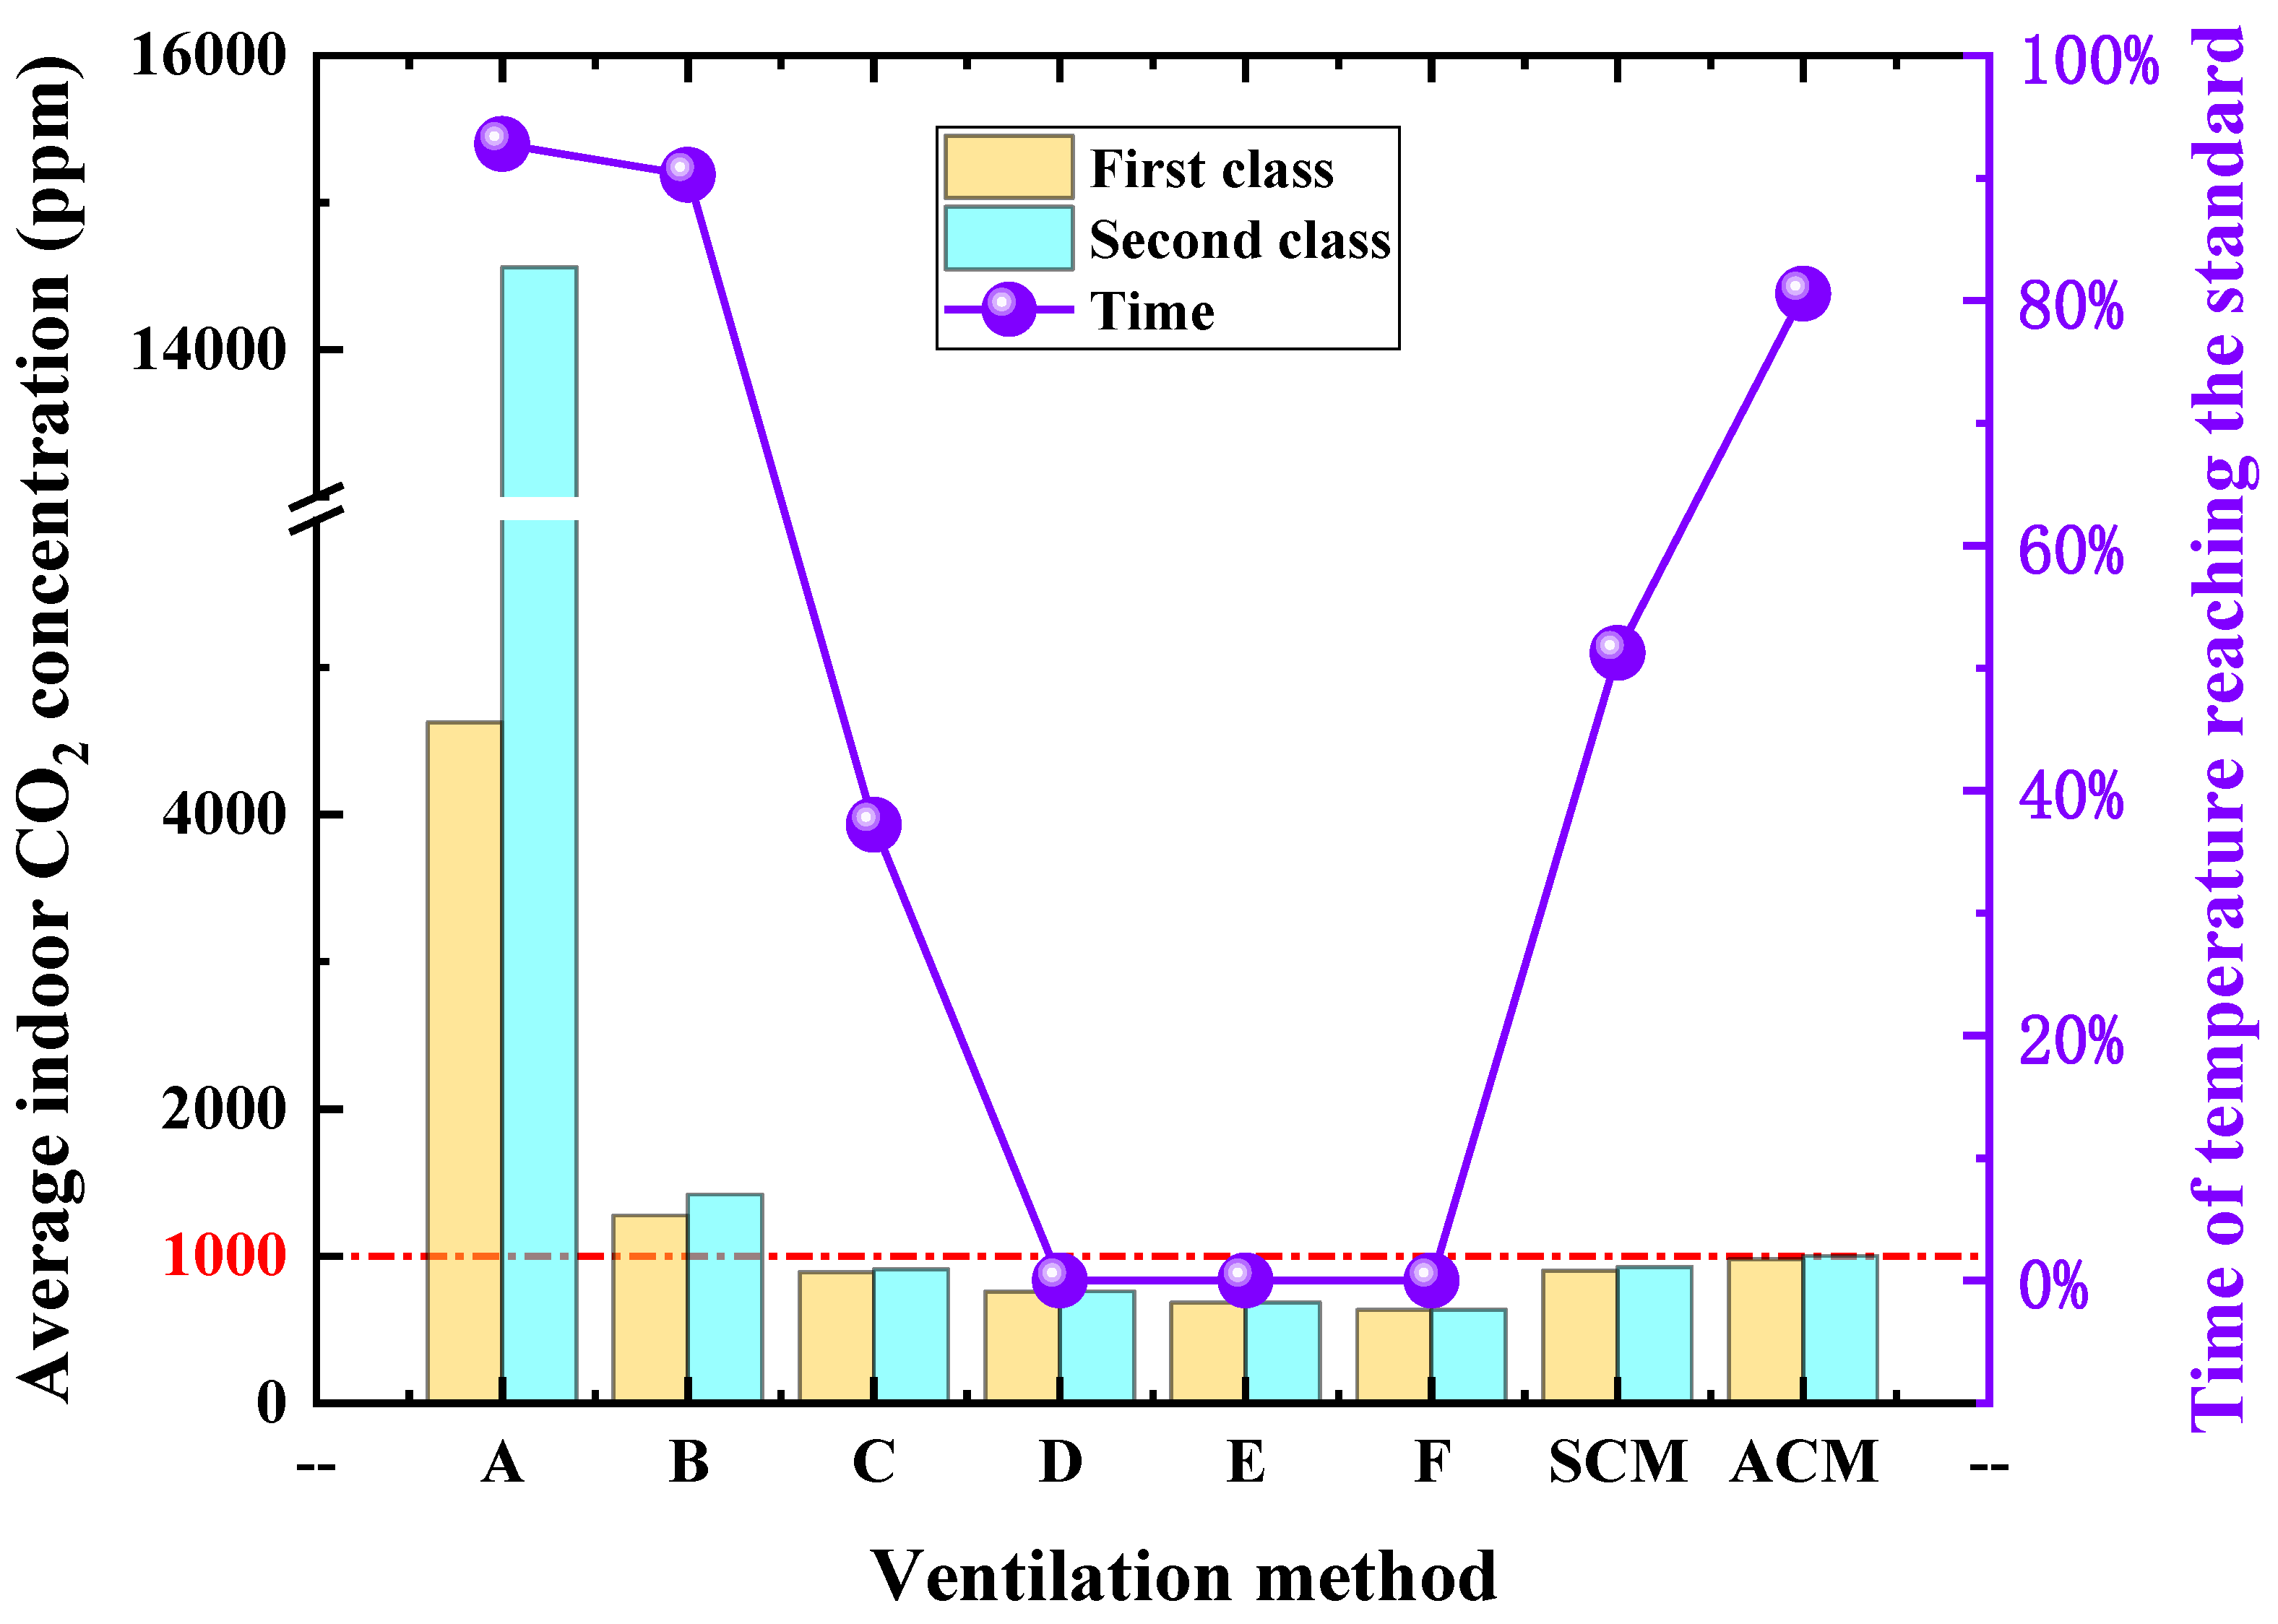
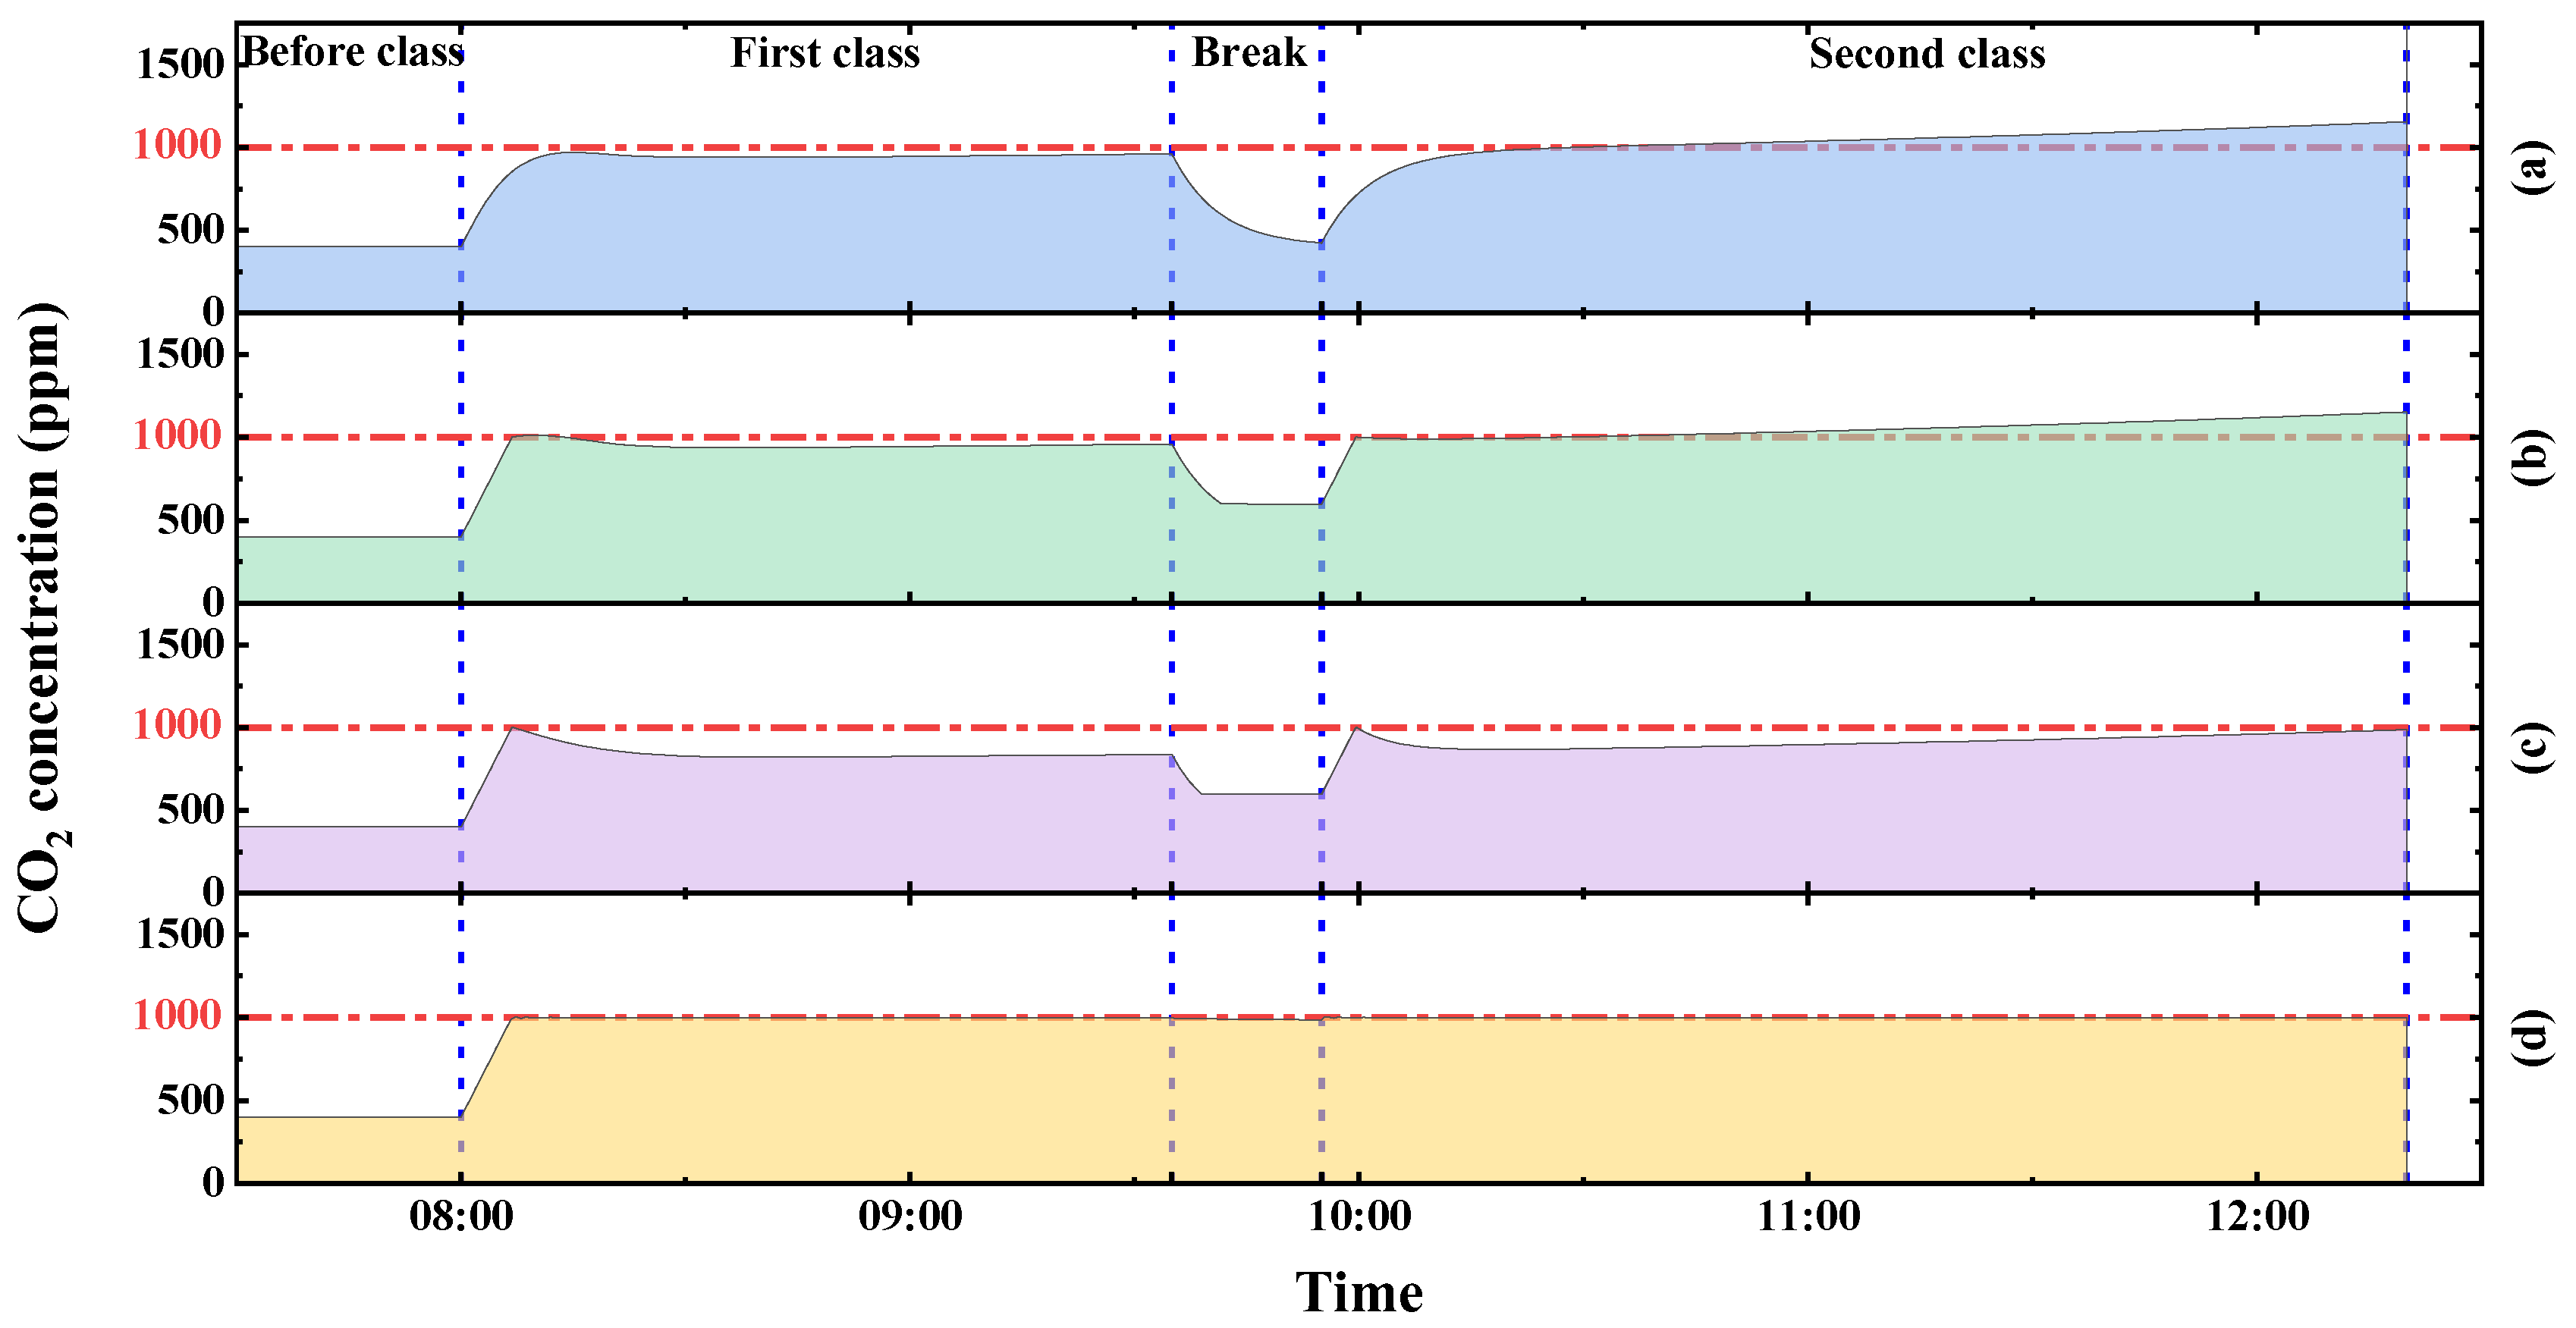
- When the FWM was adopted with the design temperature of 18 °C, the ICC was too high when the window-opening ratio was 0 or 20%. When the window-opening ratio was 40%, the indoor temperature could only be controlled at 18 °C for a third of the whole class duration. Furthermore, the indoor temperature could not be controlled at 18 °C if the window-opening ratio was 60% or 80%. When the SCM was adopted, there was no good thermal comfort in the classroom. When the ACM was adopted, the classroom room could have good thermal comfort, while the ICC would be controlled within 1000 ppm. The results recommended that, when the design temperature was 18 °C, the ACM ventilation method should be adopted.
- (2)
- When the FWM with 40% opening and the SCM with 40% opening were adopted with the design temperature of 13.5 °C, the ICC was too high. When the ACM was adopted, the classroom room could have good thermal comfort, while the ICC was controlled within 1000 ppm. Therefore, the ACM ventilation method was better than the FWM and the SCM.
- (3)
- When the design temperature was 18 °C, the fresh air energy consumption of the ACM was 12.31% and 17.33% less than that of the SCM with 40% opening and the FWM with 40% opening. When the design temperature was 13.5 °C, the energy consumption of fresh air by the ACM, SCM with 40% opening, and FWM with 40% opening was 46.58%, 48.38%, and 51.26% lower than those at 18 °C.
Author Contributions
Funding
Data Availability Statement
Conflicts of Interest
Nomenclature
| A | The opening area in validation () |
| The basal metabolic rate () | |
| The maximum fresh air load of the actual air conditioner () | |
| The opening flow coefficient in validation | |
| The maximum heating capacity of the air conditioner for fresh air () | |
| The rated heating capacity () | |
| h | The height in validation () |
| M | The variable () |
| The body mass () | |
| n | The flow exponent in validation |
| The number of interfaces in validation () | |
| The atmospheric pressure () | |
| QB | The calculation of building heat load excluding fresh air heat load () |
| QBE | The heat transfer of enclosure () |
| QEE | The heat dissipation of electrical equipment () |
| QH | The heat dissipation of classroom human body () |
| The respiratory quotient | |
| The air temperature () | |
| The O2 consumption rate () | |
| The CO2 generation rate () | |
| The Minimum velocity in validation () | |
| w | The width in validation () |
| Greek symbols | |
| The correction factor | |
| The parameters in formula | |
| The parameters in BMR formula | |
| The parameters in BMR formula | |
| Subscripts | |
| B | |
| BE | |
| EE | |
| FM | |
| H | |
| R | |
References
- Cattaneo, A.; Peruzzo, C.; Garramone, G.; Urso, P.; Ruggeri, R.; Carrer, P. Airborne particulate matter and gaseous air pollutants in residential structures in Lodi province, Italy. Indoor Air 2011, 21, 489–500. [Google Scholar] [CrossRef] [PubMed]
- OECD. How Long Do Students Spend in the Classroom; OECD Publishing: Paris, France, 2012. [Google Scholar]
- Trompetter, W.J.; Boulic, M.; Ancelet, T.; Garcia-Ramirez, J.C.; Davy, P.K.; Wang, Y.; Phipps, R. The effect of ventilation on air particulate matter in school classrooms. J. Build. Eng. 2018, 18, 164–171. [Google Scholar] [CrossRef]
- Ali, H.H.; Almomani, H.M.; Hindeih, M. Evaluating indoor environmental quality of public school buildings in Jordan. Indoor Built Environ. 2009, 18, 66–76. [Google Scholar] [CrossRef]
- Asif, A.; Zeeshan, M.; Jahanzaib, M. Indoor temperature, relative humidity and CO2 levels assessment in academic buildings with different heating, ventilation and air-conditioning systems. Build. Environ. 2018, 133, 83–90. [Google Scholar] [CrossRef]
- Jurado, S.; Bankoff, A.; Sanchez, A. Indoor air quality in Brazilian universities. Int. J. Environ. Res. Public Health 2014, 11, 7081–7093. [Google Scholar] [CrossRef]
- Bala, G. Digesting 400 ppm for global mean CO2 concentration. Curr. Sci. 2013, 104, 1471–1472. [Google Scholar]
- Khaled, A.; Dennis, L.; Nawaf, A. Impact of ventilation modes on carbon dioxide concentration levels in Kuwait classrooms. Energy Build. 2012, 47, 540–549. [Google Scholar] [CrossRef]
- Jacobson, T.A.; Kler, J.S.; Hernke, M.T.; Braun, R.K.; Meyer, K.C.; Funk, W.E. Direct human health risks of increased atmospheric carbon dioxide. Nat. Sustain. 2019, 2, 691–701. [Google Scholar] [CrossRef]
- Zhang, J.; Pang, L.; Cao, X.; Wanyan, X.; Wang, X.; Liang, J.; Zhang, L. The effects of elevated carbon dioxide concentration and mental workload on task performance in an enclosed environmental chamber. Build. Environ. 2020, 178, 106938. [Google Scholar] [CrossRef]
- Gilio, A.D.; Palmisani, J.; Pulimeno, M.; Cerino, F.; Cacace, M.; Miani, A.; Gennaro, G. CO2 concentration monitoring inside educational buildings as a strategic tool to reduce the risk of Sars-CoV-2 airborne transmission. Environ. Res. 2021, 202, 111560. [Google Scholar] [CrossRef]
- Satish, U.; Mendell, M.J.; Shekhar, K.; Hotchi, T.; Sullivan, D.; Streufert, S.; Fisk, W.J. Is CO2 an indoor pollutant Direct effects of low-to-moderate CO2 concentrations on human decision-making performance. Environ. Health Perspect. 2012, 120, 1671–1677. [Google Scholar] [CrossRef] [PubMed]
- Shendell, D.G.; Prill, R.; Fisk, W.J.; Apte, M.G.; Blake, D.; Faulkner, D. Association between CO2 concentrations and student attendance in Washington Idaho. Indoor Air 2004, 14, 333–341. [Google Scholar] [CrossRef] [PubMed]
- Snow, S.; Boyson, A.S.; Paas, K.H.W.; Gough, H.; King, M.; Barlow, J.; Noakes, C.J.; Schraefel, M.C. Exploring the physiological, neurophysiological and cognitive performance effects of elevated carbon dioxide concentrations indoors. Build. Environ. 2019, 156, 243–252. [Google Scholar] [CrossRef]
- de Dear, R.J.; Brager, G.S. Developing an adaptive model of thermal comfort and preference. Build. Eng. 1998, 104, 145–167. [Google Scholar]
- Humphreys, M.A.; Nicol, J.F. The validity of ISO-PMV for predicting comfort votes in every-day thermal environments. Energy Build. 2002, 34, 667–684. [Google Scholar] [CrossRef]
- Mors, S.T.; Hensen, J.L.M.; Loomans, M.G.L.C.; Boerstra, A.C. Adaptive thermal comfort in primary school classrooms: Creating and validating PMV-based comfort charts. Build. Environ. 2011, 46, 2454–2461. [Google Scholar] [CrossRef]
- Jiang, J.; Wang, D.; Liu, Y.; Di, Y.; Liu, J. A holistic approach to the evaluation of the indoor temperature based on thermal comfort and learning performance. Build. Environ. 2021, 196, 107803. [Google Scholar] [CrossRef]
- Wargocki, P.; Wyon, D.P. The Effects of Moderately Raised Classroom Temperatures and Classroom Ventilation Rate on the Performance of Schoolwork by Children (RP-1257). HVAC&R Res. 2007, 13, 193–220. [Google Scholar] [CrossRef]
- Ministry of Housing Urban-Rural Construction of the People’s Republic of China. Design Code for Heating Ventilation and Air Conditioning of Civil Buildings; China Architecture & Building Press: Beijing, China, 2012. [Google Scholar]
- ANSI/ASHRAE Standard 62.1-2013; Ventilation for Acceptable Indoor Air Quality. ASHRAE Standards Committee: Atlanta, GA, USA, 2013.
- Elsaid, A.M.; Mohamed, H.A.; Abdelaziz, G.B.; Ahmed, M.S. A critical review of heating, ventilation, and air conditioning (HVAC) systems within the context of a global SARS-CoV-2 epidemic. Process Saf. Environ. Prot. 2021, 155, 230–261. [Google Scholar] [CrossRef]
- Poirier, B.; Guyot, G.; Woloszyn, M.; Geoffroy, H.; Ondarts, M.; Gonze, E. Development of an assessment methodology for IAQ ventilation performance in residential buildings: An investigation of relevant performance indicators. J. Build. Eng. 2021, 43, 103140. [Google Scholar] [CrossRef]
- Xu, F.; Gao, Z. Study on indoor air quality and fresh air energy consumption under different ventilation modes in 24-hour occupied bedrooms in Nanjing, using Modelica-based simulation. Energy Build. 2022, 257, 111805. [Google Scholar] [CrossRef]
- Chenari, B.; Carrilho, J.D.; da Silva, M.G. Towards sustainable, energy-efficient and healthy ventilation strategies in buildings: A review. Renew. Sustain. Energy Rev. 2016, 59, 1426–1447. [Google Scholar] [CrossRef]
- Gao, J.; Wargocki, P.; Wang, Y. Ventilation system type, classroom environmental quality and pupils’ perceptions and symptoms. Build. Environ. 2014, 75, 46–57. [Google Scholar] [CrossRef]
- Zhou, Q.; Ooka, R. Implementation of a coupled simulation framework with neural network and Modelica for fast building energy simulation considering non-uniform indoor environment. Build. Environ. 2022, 211, 108740. [Google Scholar] [CrossRef]
- Wetter, M. Multizone Airflow Model in Modelica. In Proceedings of the Modelica Conference 2006, Vienna, Austria, 4–5 September 2006; The Modelica Association: Vienna, Austria, 2006; pp. 431–440. [Google Scholar]
- Zuo, W.D.; Wetter, M.; Tian, W.; Li, D.; Jin, M.G.; Chen, Q.Y. Coupling indoor airflow, HVAC, control and building envelope heat transfer in the Modelica Buildings library. J. Build. Perform. Simul. 2016, 9, 366–381. [Google Scholar] [CrossRef]
- Dols, W.S.; Emmerich, S.J.; Polidoro, B.J. Coupling the multizone airflow and contaminant transport software CONTAM with EnergyPlus using co-simulation. Build. Simul. 2016, 9, 469–479. [Google Scholar] [CrossRef]
- Fabian, P.; Adamkiewicz, G.; Levy, J.I. Simulating indoor concentrations of NO2 and PM2.5 in multifamily housing for use in health-based intervention modeling. Indoor Air 2012, 22, 12–23. [Google Scholar] [CrossRef]
- Barbosa, B.P.P.; Brum, N.D.C.L. Validation and assessment of the CFD-0 module of CONTAM software for airborne contaminant transport simulation in laboratory and hospital applications. Build. Environ. 2018, 142, 139–152. [Google Scholar] [CrossRef]
- Alonso, M.J.; Dols, W.S.; Mathisen, H.M. Using Co-simulation between EnergyPlus and CONTAM to evaluate recirculation-based, demand-controlled ventilation strategies in an office building. Build. Environ. 2022, 211, 108737. [Google Scholar] [CrossRef]
- Zuo, W.; Wetter, M.; Li, D.; Jin, M.; Tian, W.; Chen, Q. Coupled Simulation of Indoor Environment, HVAC and Control System by Using Fast Fluid Dynamics and the Modelica Buildings Library. In Proceedings of the 2014 ASHRAE/IBPSA-Building Simulation Conference, Atlanta, GA, USA, 10–12 September 2014; pp. 56–63. [Google Scholar]
- Wetter, M.; Zuo, W.D.; Nouidui, T.S.; Pang, X.F. Modelica Buildings library. J. Build. Perform. Simul. 2014, 7, 253–270. [Google Scholar] [CrossRef]
- Fu, Y.; Zuo, W.; Wetter, M.; VanGilder, J.W.; Han, X.; Plamondon, D. Equation-based object-oriented modeling and simulation for data center cooling: A case study. Energy Build. 2019, 186, 108–125. [Google Scholar] [CrossRef]
- Xu, L.; Guo, F.; Hoes, P.; Yang, X.; Hensen, J.L.M. Investigating energy performance of large-scale seasonal storage in the district heating system of chifeng city: Measurements and model-based analysis of operation strategies. Energy Build. 2021, 247, 111113. [Google Scholar] [CrossRef]
- Halimov, A.; Lauster, M.; Müller, D. Validation and integration of a latent heat storage model into building envelopes of a high-order building model for Modelica library AixLib. Energy Build. 2019, 202, 109336. [Google Scholar] [CrossRef]
- Mork, M.; Materzok, N.; Xhonneux, A.; Müller, D. Nonlinear Hybrid Model Predictive Control for building energy systems. Energy Build. 2022, 270, 112298. [Google Scholar] [CrossRef]
- Mahyuddin, N.; Awbi, H.B.; Essah, E.A. Computational fluid dynamics modelling of the air movement in an environmental test chamber with a respiring manikin. J. Build. Perform. Simul. 2014, 8, 359–374. [Google Scholar] [CrossRef]
- GB 50176-2016; Code for Thermal Design of Civil Building. China architecture Industry Press: Beijing, China, 2016.
- Persily, A.; de Jonge, L. Carbon dioxide generation rates for building occupants. Indoor Air 2017, 27, 868–879. [Google Scholar] [CrossRef]
- Lusk, G. Analysis of the oxidation of mixtures of carbohydrate and fat. J. Biol. Chem. 1924, 59, 41–42. [Google Scholar] [CrossRef]
- FAO. Human Energy Requirements. Report of a Joint FAO/WHO/UNU Expert Consultation; Food and Nutrition Technical Report Series 1; Food and Agriculture Organization of the United Nations: Geneva, Switzerland, 2001. [Google Scholar]
- Schofield, W. Predicting basal metabolic rate, new standards and review of previous work. Hum. Nutr. Clin. Nutr. 1985, 39 (Suppl. S1), 5–41. [Google Scholar]
- Wright, J.D.; Wang, C.-Y. Trends in Intake of Energy and Macronutrients in Adults from 1999–2000 through 2007–2008; Centers for Disease Control and Prevention, National Center for Health Statistics: Hyattsville, MD, USA, 2010. [Google Scholar]
- ASHRAE 55-2013; Thermal Environment Conditions for Human Occupancy. American Society of Heating, Refrigerating and Air Conditioning Engineers: Atlanta, GA, USA, 2013.
- ISO 7730-2005; Ergonomics of the Thermal Environment—Analytical Determination And Interpretation of Thermal Comfort Using Calculation of the PMV and PPD Indices and Local Thermal Comfort Criteria. ISO: Geneva, Switzerland, 2005; pp. 605–615.
- BS EN 16798-1-2019; Energy Performance of Buildings—Part 1: Indoor Environmental Input Parameters for Design and Assessment of Energy Performance of Buildings Addressing Indoor Air Quality, Thermal Environment, Lighting and Acoustics-Module M1-6. British Standards Institution: London, UK, 2019; pp. 18–33.






| Length (m) | Width (m) | Height (m) | Volume (m3) | Seats | Window Open Area (m2) |
|---|---|---|---|---|---|
| 6.75 | 4.9 | 3.7 | 122.38 | 40 | 4.62 |
| Heating Capacity (W) | Power (W) | EER | Air Flow Volume (m3/h) |
|---|---|---|---|
| 7800 | 2350 | 3.08 | 1200 |
| Time | QH (W) | QEE (W) | QBE (W) | QB (W) | C (W) |
|---|---|---|---|---|---|
| Class | 2569.97 | 538.31 | 505.75 | 2602.53 | 8062.53 |
| Break | 0 | 538.31 | 505.37 | −32.56 | 5492.56 |
| Sex | Age | Weight (kg) | BMR (MJ/day) | M (met) | RQ | (L/S) |
|---|---|---|---|---|---|---|
| Male | 20 | 67.4 | 7.1422 | 1.8 [44] | 0.85 [46] | 0.006217 |
| Female | 20 | 54.1 | 5.3902 | 1.8 [44] | 0.85 [46] | 0.004692 |
| Parameter Name | Orifice | Door |
|---|---|---|
| Opening flow coefficient/ | 0.65 | 0.78 |
| Flow exponent/n | 0.50 | 0.78 |
| Opening area/A (m2) | 0.01 | 2.2 |
| Width/w (m) | / | 1 |
| Height/h (m) | / | 2.2 |
| Number of interfaces/ | / | 10 |
| Minimum velocity/ (m/s) | / | 0.001 |
Disclaimer/Publisher’s Note: The statements, opinions and data contained in all publications are solely those of the individual author(s) and contributor(s) and not of MDPI and/or the editor(s). MDPI and/or the editor(s) disclaim responsibility for any injury to people or property resulting from any ideas, methods, instructions or products referred to in the content. |
© 2024 by the authors. Licensee MDPI, Basel, Switzerland. This article is an open access article distributed under the terms and conditions of the Creative Commons Attribution (CC BY) license (https://creativecommons.org/licenses/by/4.0/).
Share and Cite
Li, X.; Xiong, J.; Zhang, Q.; Wang, Q. Analysis of Indoor Air Quality and Fresh Air Energy Consumption Based on Students’ Learning Efficiency under Different Ventilation Methods by Modelica. Energies 2024, 17, 4613. https://doi.org/10.3390/en17184613
Li X, Xiong J, Zhang Q, Wang Q. Analysis of Indoor Air Quality and Fresh Air Energy Consumption Based on Students’ Learning Efficiency under Different Ventilation Methods by Modelica. Energies. 2024; 17(18):4613. https://doi.org/10.3390/en17184613
Chicago/Turabian StyleLi, Xu, Jingyi Xiong, Qifan Zhang, and Qiang Wang. 2024. "Analysis of Indoor Air Quality and Fresh Air Energy Consumption Based on Students’ Learning Efficiency under Different Ventilation Methods by Modelica" Energies 17, no. 18: 4613. https://doi.org/10.3390/en17184613
APA StyleLi, X., Xiong, J., Zhang, Q., & Wang, Q. (2024). Analysis of Indoor Air Quality and Fresh Air Energy Consumption Based on Students’ Learning Efficiency under Different Ventilation Methods by Modelica. Energies, 17(18), 4613. https://doi.org/10.3390/en17184613


