Abstract
The organic Rankine cycle (ORC) system is an important technology for recovering energy from the waste heat of internal combustion engines, which is of significant importance for the improvement of fuel utilization. This study analyses the performance of vehicle ORC systems and proposes a rapid optimization method for enhancing vehicle ORC performance. This study constructed a numerical simulation model of an internal combustion engine-ORC waste heat recovery system based on GT-Suite software v2016. The impact of key operating parameters on the performance of two organic Rankine cycles: the simple organic Rankine cycle (SORC) and the recuperative organic Rankine cycle (RORC) was investigated. In order to facilitate real-time prediction and optimization of system performance, a data-driven rapid prediction model of the performance of the waste heat recovery system was constructed based on an artificial neural network. Meanwhile, the NSGA-II multi-objective algorithm was used to investigate the competitive relationship between different performance objective functions. Furthermore, the optimal operating parameters of the system were determined by utilizing the TOPSIS method. The results demonstrate that the highest thermal efficiencies of the SORC and RORC are 6.21% and 8.61%, respectively, the highest power outputs per unit heat transfer area (POPAs) are 6.98 kW/m2 and 8.99 kW/m2, respectively, the lowest unit electricity production costs (EPC) are 7.22 × 10⁻² USD/kWh and 3.15 × 10⁻² USD/kWh, respectively, and the lowest CO2 emissions are 2.85 ton CO2,eq and 3.11 ton CO2,eq, respectively. The optimization results show that the RORC exhibits superior thermodynamic and economic performance in comparison to the SORC, yet inferior environmental performance.
1. Introduction
1.1. Relevance of the Research
In the transport industry, the dominant power supply unit is the internal combustion engine (ICE). Currently, only 20–45% of the energy generated from fuel combustion in ICEs is used effectively, with up to 30–40% lost as low-grade waste heat to the environment [1]. The effective recovery of energy from the exhaust waste heat of ICEs represents a crucial avenue for enhancing the energy efficiency of these engines, alleviating the energy crisis, and realizing the vision of carbon neutrality [2,3,4]. Compared to the high-grade heat sources to which the Rankine cycle, which is based on water, is applicable, vehicle ICE exhaust has a relatively low temperature. The organic Rankine cycle (ORC), based on low-boiling point organic working fluids, recovers energy from the exhaust of vehicle ICE more efficiently, and has attracted more and more attentions.
1.2. State of the Art
The thermal performance of ORC in vehicle engine waste heat recovery has been extensively studied. Zhang et al. [5] analyzed the thermal performance of a regenerative ORC in recovery energy from exhaust waste heat of a diesel engine and showed a 9.55% improvement in the fuel economy. Galindo et al. [6] investigated the energy recovery performance using ORC on a 2-litre turbocharged petrol engine. The power output has increased by a maximum of 3.7%, while the maximum shaft work of the expander has reached 1.83 kW. Katsanos et al. [7] theoretically investigated and compared the performance of an ORC and a Rankine cycle in exhaust energy recovery for diesel engines of a truck. The ORC, which uses organic working fluid R245fa, outperformed the Rankine cycle and showed a 8.5–10.2% improvement in the effective fuel consumption rate. Horst et al. [8] carried out numerical simulations on a BMW 5-series sedan using their designed Rankine cycle to recover exhaust waste heat energy under typical motorway driving conditions and found that fuel consumption savings of 3.4% could be achieved under ideal conditions.
In terms of ORC parametric analysis, Yang et al. [9] conducted an investigation into the performance of an ORC in recovering waste heat from marine diesel engine coolant and discussed the thermal performance of six organic working fluids. Lei et al. [10] employed the Aspen Plus v11 and Aspen EDR software to model the ORC system and plate heat exchanger, and numerically investigated the effect of structural dimensions of plate heat exchanger on the overall performance of the ORC system. The optimum evaporator and condenser heat transfer areas of the plate heat exchanger were determined for ORC systems using different working fluids. Zhao et al. [11] presented a control strategy to optimize the performance of a simple ORC system that recovered waste heat energy from a diesel engine working under different operating conditions. GT-Suite software v2016 and MATLAB/Simulink R2017a were used in the strategy to change operation modes and modify parameters. Kocaman et al. [12] presented a multi-objective optimization model that considers the impact of three key factors on the performance of the ORC: the type of working fluid, thermodynamic properties of working fluid, and temperature difference at the pinch point. Ochoa et al. [13] comparatively investigated the energy, exergy and thermal economy metrics of a simple ORC with a recuperative ORC and a simple Brayton cycle with supercritical CO2.
With regard to the evaluation of system performance, current studies have conducted investigations from three perspectives: thermal, economic, and environmental. Zhar et al. [14] carried out a comparative study of the comprehensive performance of three different ORC configurations from the thermal efficiency, exergy, payback period, and levelized cost of energy. Küçük et al. [15] analyzed four different ORC configurations utilizing either renewable or low-grade waste heat with evaluation metrics as thermal efficiency, exergy, total cost, and unit cost of electricity generation. Teng et al. [16] optimized three different ORC-CHP systems using genetic algorithms aiming to maximize the profitability of the investment value, and analyzed the energy, exergy, and economics under optimal operating conditions.
There is often an obvious competitive relationship between different performance objective functions of ORC, and for this reason, a series of works on the comprehensive performance optimization of the system have been carried out. Zhou et al. [17] proposed a method for optimizing a combined ORC system based on machine learning and mathematical planning and obtained the maximum net system output power. Chitgar et al. [18] optimized the ORC system structure and system working fluids of three geothermal ORC power generation systems using artificial neural networks (ANN) and multi-objective optimization methods. Lu et al. [19] used genetic algorithm and sequential method to optimize the performance of a zeotropic ORC system with adjustable components. Bu et al. [20] employed a genetic algorithm with an optimal combinatorial weights method in an effort to optimize the system performance of a novel ORC system (SCR-ORC). Yu et al. [21] optimized a two-stage cascade ORC by employing a non-dominated sorting genetic algorithm and obtained the preferred performance of the key components.
Existing literature indicates that the majority of research in this field is focused on the ORC subsystems under typical operating conditions, which simplifies the complex coupling association of the ICE-ORC system, and is less likely to facilitate analysis and investigation of the overall joint system of the ICE and the ORC in actual scenarios. Furthermore, the ORC waste heat recovery system for vehicles is usually working under frequent fluctuations of the internal combustion engine operating conditions, which requires the real-time performance optimization of the ORC system for control of the system’s operating parameters. The approaches to meet these requirements are very lacking in vehicle ORC waste heat recovery.
1.3. Main Attributes of the Research
The field of machine learning is one of the fastest growing fields in the last decade, and it has shown excellent performance in fast prediction tasks [22,23,24,25] and multi-objective optimization tasks [26]. In this study, we have combined a traditional numerical simulation method with machine-learning methods to propose an approach that can analyze and optimize the performance of the overall joint system of an internal combustion engine-ORC in real time and comprehensively.
This study employs GT-Suite software to construct a joint simulation model of ICE-ORC. Two distinct ORC configuration arrangement systems were considered, namely the simple configuration organic Rankine cycle (SORC) and the recuperator configuration organic Rankine cycle system (RORC). The performance of the SORC and RORC is comprehensively analyzed from multiple perspectives. The thermal efficiency and the power output per unit heat transfer area (POPA) are used as thermodynamic performance objective functions, and the electricity production cost (EPC) and the payback period (PB) are used as economic performance objective functions, and the equivalent carbon dioxide emission (ECE) is used as an environmental performance objective function. A data-driven fast prediction model for the ORC system has been constructed based on a BP artificial neural network (ANN) intelligent algorithm. This was then combined with the non-dominated sorting genetic algorithm with elite strategy (NSGA-II), and a rapid evaluation of the system performance is achieved with the optimal operating parameters in real time. Furthermore, the technique for order preference by similarity to an ideal solution method (TOPSIS) is used to indicate the direction for further optimization. In the meantime, the data-driven coupled NSGA-II analysis framework enables the revelation of the trade-off relationship between multiple objective functions, and the SORC and RORC systems are compared and analyzed from the perspective of comprehensive performance.
The results of this study can inform the development of a system for the efficient recovery of ICE waste heat in actual operational scenario.
2. System Design
2.1. Engine Model and the Characteristics of Exhaust Waste Heat
The numerical simulation model of a six-cylinder diesel engine is constructed using the GT-Power module in GT-Suite software. The technical parameters of the engine are presented in Table 1.

Table 1.
The technical parameters of a six-cylinder diesel engine.
In the engine model, ambient temperature is set to 293 K and ambient pressure is set to 1 bar. The simulation model of the diesel engine is presented in Figure 1.
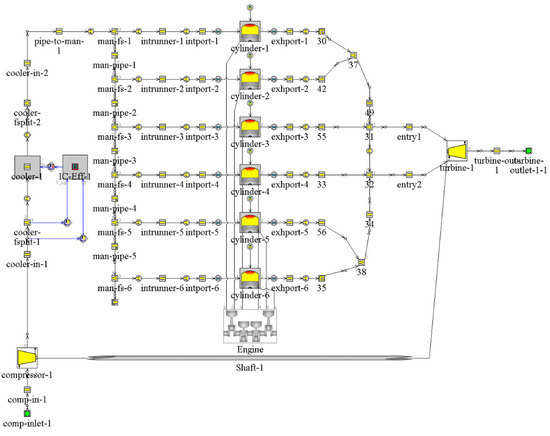
Figure 1.
The simulation model of the diesel engine.
Simulation results of the impact of engine operating conditions on the variation in engine exhaust temperature and exhaust mass flow rate is illustrated in Figure 2.
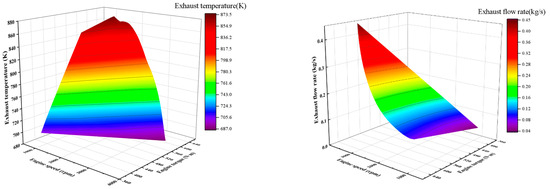
Figure 2.
The impact of operating conditions on the variation in engine exhaust temperature and exhaust mass flow rate.
Figure 2 illustrates that as the engine speed increases, the exhaust temperature initially increases and then decreases over the operating range of 1000 to 3600 rpm. The engine exhaust temperature reaches its highest point of 873.19 K at an engine speed of approximately 1400 rpm, while the lowest exhaust temperature is 687.07 K. Engine exhaust temperature generally increases as engine torque increases and as the engine speed increases, the exhaust mass flow rate increases. The exhaust mass flow reaches a maximum value of 0.45 kg/s at 3600 rpm and a minimum value of 0.04 kg/s at 1000 rpm. In addition, as engine torque increases, exhaust mass flow increases.
2.2. SORC and RORC Models for Vehicle Waste Heat Recovery
2.2.1. Numerical Simulation Models for the SORC and RORC Systems
The schematic process diagram and the temperature entropy diagram of the SORC are presented in Figure 3a and Figure 3b, respectively. The pump pressurizes the working fluid from the storage tank to evaporating pressure and it goes into the evaporator to exchange heat with the engine exhaust. In the temperature entropy diagram, points a and b correspond to the state of engine exhaust and the points c and d correspond to the state of the cooling water. The state of the cooling water corresponds to the points c and d. The working fluid is in a subcooled liquid state (point 5) at the tube side inlet of the evaporator and is heated to the saturated liquid state (point 6) following the preheating zone. Afterwards, the working fluid absorbs heat in the two-phase zone and reaches the saturated gas state (point 7), and is heated to the superheated gas state (point 1) in the superheated section. The superheated gaseous working fluid expands in the expander, which outputs mechanical work, and then condenses into the liquid phase in the condenser and flows back to the storage tank, as a cycle is completed.
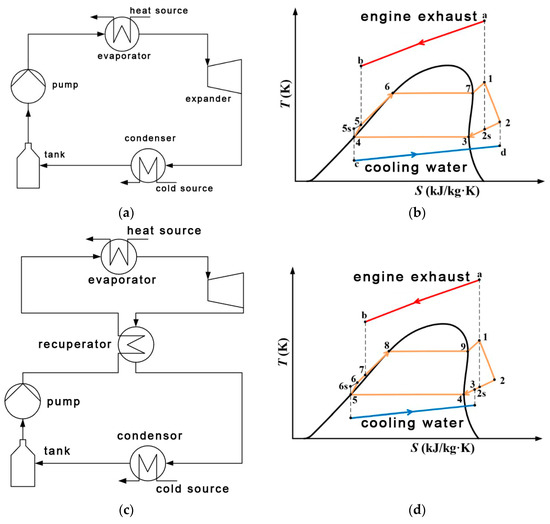
Figure 3.
Schematic diagrams and temperature entropy diagrams of the SORC and RORC. (a) Schematic diagram of SORC system, (b) T-s diagram of SORC system, (c) Schematic diagram of RORC system, (d) T-s diagram of RORC system.
The schematic process diagram and the temperature entropy diagram of the RORC are presented in Figure 3c and Figure 3d, respectively. The pump pressurizes the saturated working fluid from the storage tank, which flows into the recuperator (point 5 to point 6 indicates the actual pressurization process, point 5 to point 6s indicates the ideal pressurization process). In the recuperator, the low-temperature working fluid exchanges heat with the spent gas after doing work from the expander (point 6 to point 7 indicates an isobaric heat-absorbing process), then the organic working fluid flows into the evaporator and exchanges heat with the diesel exhaust, absorbs the residual heat energy of the exhaust, and converts it into saturated or superheated vapor (point 7 to point 1 indicates an isobaric evaporation process), and following the evaporation, the working fluid outputs the mechanical work by undergoing an expansion process within the expander, (point 1 to point 2 indicates the actual process of expansion, point 1 to point 2s indicates the ideal process of expansion). After expansion, the spent gas exchanges the heat with the low-temperature working fluid pressurized by the working fluid pump within the recuperator, which plays a role in preheating the organic working fluid (point 2 to point 3 indicates the role of an isobaric exothermic process), after which it exchanges heat with the cooling water within the condenser and becomes saturated (point 3 to point 5 indicates the isobaric condensation process), and the working fluid ultimately enters into the tank and is pressurized, as a cycle is completed. A more detailed description of the SORC and RORC, including their mathematical models, can be found in [27].
2.2.2. Selection of Working Fluid and Key Components and Model Construction and Coupling
The working fluid used in this study was R245fa [28,29], a tube-and-fin heat exchanger was chosen for the evaporator, and a shell-and-tube heat exchanger was selected for the recuperator [30]. A plate heat exchanger was selected for the condenser [23], multistage centrifugal pumps were selected for the working fluid pumps, and a volumetric expander was selected for the expander [31].
The principal technical parameters of the evaporators for the SORC and RORC systems are presented in Table 2.

Table 2.
Principal technical parameters of evaporator.
The principal technical parameters of the recuperator of the RORC system are presented in Table 3.

Table 3.
Principal technical parameters of recuperator.
The principal technical parameters of the condensers for the SORC and RORC systems are presented in Table 4.

Table 4.
Principal technical parameters of condenser.
The principal technical parameters of the multistage centrifugal pumps for the SORC and RORC systems are presented in Table 5.

Table 5.
Principal technical parameters of pump.
The principal technical parameters of the expanders for the SORC and RORC systems are presented in Table 6.

Table 6.
Principal technical parameters of expander.
The numerical simulation models of the SORC and RORC systems formed by integrating the components are presented in Figure 4a,b. The engine-coupled SORC and RORC numerical simulation models are presented in Figure 4c,d. In this case, an explicit solver was used for the engine modelling, while an implicit solver was used for the SORC and RORC systems involving fluid phase transition. The model coupling is achieved by controlling the fluid mass flow in the two different circuits through the PID controller in the “FlowCircuitSplitter” in GT-Suite. The parameters of the “FlowCircuitSplitter” module are set to a proportionality coefficient P of 0.001 and an integration coefficient I of 0.5.
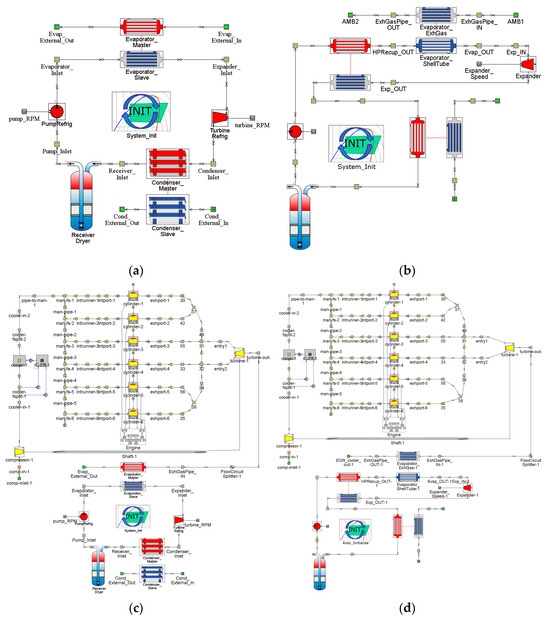
Figure 4.
SORC, RORC, and engine-coupling SORC and RORC numerical simulation models. (a) Simulation model of SORC system, (b) Simulation model of RORC system, (c) Simulation model of SORC system for engine waste heat recovery, (d) Simulation model of RORC system for engine waste heat recovery.
3. Performance Analysis of the SORC/RORC Systems
3.1. Theoretical Analysis Modelling of Thermodynamic, Economic and Environmental Performance
In this study, thermal efficiency and POPA are chosen as the objective functions for thermodynamic and thermo-economic evaluation and optimization [14,15]. Among them, thermal efficiency is the efficiency of conversion of thermal energy into mechanical energy, calculated by dividing the net output power by the amount of heat absorbed by the working fluid within the evaporator. The calculation of is shown in Equation (1) [14,15]:
where is the net output power and is the heat transfer area of the system. The higher the value, the more power the system can produce at a lower cost, and the better the thermal economy of the system.
In this study, the objective functions for economic evaluation and optimization of the SORC/RORC system are the unit electricity production cost () along with the payback period () [32,33,34,35]. The is calculated as:
where is the cost recovery factor, is the total investment cost of the equipment, is the maintenance cost required during the operation of the equipment, which is taken as 1.5% of the in this study, and is the number of annual operating hours.
The is calculated as:
where is the grid electricity price and represents the annual interest rate.
The environmental performance of the SORC/RORC system is evaluated by equivalent carbon dioxide emissions (), which is calculated as:
where is the working fluid charge, is the system lifetime, is the annual leakage rate, is the loss rate of the working fluid at the end of the system lifetime, and is the global warming potential. is the annual energy consumption, is the equivalent carbon dioxide emissions of unit energy consumption, is the material mass, is the equivalent carbon dioxide emission of unit material mass, and is the mass of the recycled material. is the equivalent carbon dioxide emissions of unit material recycled mass, and and are the equivalent carbon dioxide emissions resulting from working fluid production and recycling treatment, respectively.
3.2. Influence of Engine Speed on SORC/RORC Performance
Engine speed is one of the important factors affecting the exhaust waste heat characteristics. Figure 5 illustrates the performance objective functions of the SORC/RORC system at different engine speeds with constant model parameters.
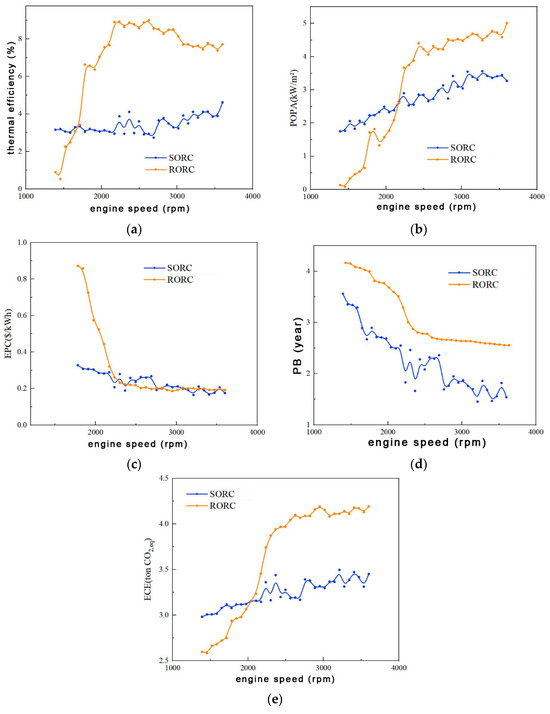
Figure 5.
Relationship between the engine speed and performance of the SORC/RORC system. (a) Variation in thermal efficiency with engine speed. (b) Variation in POPA with engine speed. (c) Variation in EPC with engine speed. (d) Variation in PB with engine speed. (e) Variation in ECE with engine speed.
From Figure 5a, it is evident that the thermal efficiency of the RORC system varies more drastically with engine speed compared to the SORC system. The RORC system is less thermally efficient than the SORC system at engine speeds below 1750 rpm but more thermally efficient at engine speeds above 1750 rpm. The RORC system exhibits the highest thermal efficiency, with a rate of 9% at 2625 rpm, and the SORC system has the highest thermal efficiency, with a rate of 4.62% at 3600 rpm. Figure 5b illustrates that the POPA of the RORC system varies more drastically with engine speed than the POPA of the SORC system. The POPA of the RORC system is lower than that of the SORC system below 2200 rpm and higher than that of the SORC system above 2200 rpm. The RORC system reaches the highest POPA value of 5.01 kW/m2 at 3600 rpm and the SORC system reaches the highest POPA value of 3.56% at 3275 rpm. Figure 5c illustrates that the EPC of the SORC/RORC system generally decreases with increasing engine speed. The EPC of the RORC system is significantly higher than that of the SORC system below 2200 rpm and has a very small difference above 2200 rpm. The RORC system has the lowest EPC value of 0.19 USD/kWh at 2950 rpm and the SORC system has the lowest EPC value of 0.16 USD/kWh at 3210 rpm. Figure 5d illustrates that the RORC system has a higher PB value than the SORC system across the engine speed variation interval. The RORC system has the lowest PB value of 2.58 years at 3600 rpm and the SORC system has the lowest PB value of 1.45 years at 3210 rpm. Figure 5e illustrates that the ECE of the RORC system is lower than that of the SORC system below 2000 rpm and higher than that of the SORC system above 2000 rpm. The RORC system has the highest ECE value of 4.19 ton CO2,eq at 3600 rpm and the SORC system has the highest ECE value of 3.5 ton CO2,eq at 3210 rpm.
In summary, at low engine speed, the RORC system exhibits inferior thermodynamic performance than that of the SORC system, but at high engine speed, the RORC system exhibits better thermodynamic performance than that of the SORC system. The RORC system is generally more costly and has poorer environmental performance than the SORC system. As the engine approaches its rated speed of 3600 rpm, both the SORC and RORC systems show better overall performance. Therefore, in the subsequent study, it was chosen to have the engine at a rated speed of 3600 rpm.
3.3. Influence of System Operating Parameters on SORC Performance
A simulation study was conducted to investigate the influence of system operating parameters on SORC performance at an engine rated speed of 3600 rpm. Figure 6 shows the impact of SORC operating parameters on thermodynamic performance. The SORC system’s thermal efficiency and POPA are significantly affected by the expander inlet pressure and evaporator working fluid side inlet pressure, which are positively correlated. The inlet temperature of the evaporator’s working fluid side has a small influence on the thermal efficiency and POPA of the SORC within the parameter variation range. The working fluid mass flow rate has a small influence on the thermal efficiency of the SORC within the parameter variation range, and the effect on the POPA is generally negatively correlated. The SORC system exhibits thermal efficiency values ranging between 4.32% and 0.48% and POPA values ranging between 4.20 kW/m2 and 0.49 kW/m2 in the simulation.
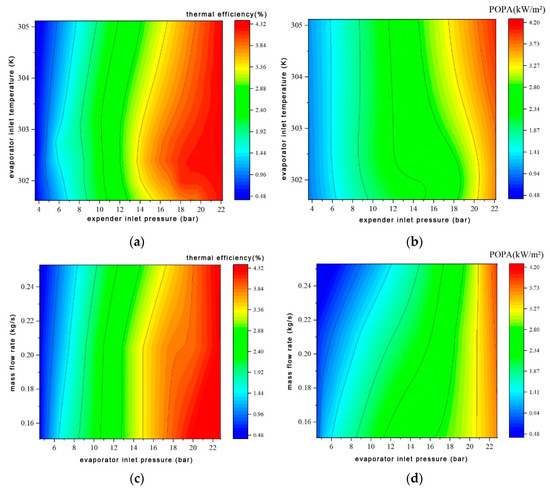
Figure 6.
Influence of SORC system operating parameters on thermodynamic performance. (a) Influence of expander inlet pressure and evaporator inlet temperature on thermal efficiency, (b) Influence of expander inlet pressure and evaporator inlet temperature on POPA, (c) Influence of working fluid mass flow rate and evaporator inlet pressure on thermal efficiency, (d) Influence of working fluid mass flow rate and evaporator inlet pressure on POPA.
Figure 7 shows the impact of SORC operating parameters on economic performance. The SORC system’s EPC and PB are significantly affected by the expander inlet pressure and evaporator working fluid side inlet pressure, which are generally negatively correlated. The working fluid mass flow rate has a small influence on the EPC and PB of the SORC within the parameter variation range, with a generally negative correlation. The influence of the evaporator working fluid side inlet temperature on the EPC and PB of the SORC system is less pronounced at expander inlet pressures below 10 bar. However, as the expander inlet pressure rises, this influence becomes more pronounced, exhibiting a general positive correlation. The SORC system exhibits EPC values ranging between 0.97 USD/kWh and 0.21 USD/kWh and PB values ranging between 8.53 years and 1.85 years in the simulation.
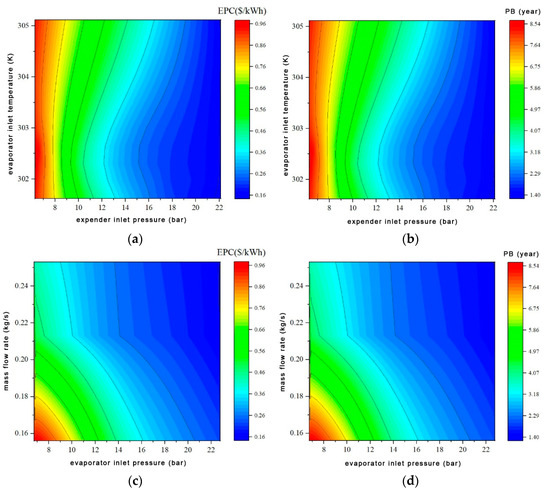
Figure 7.
Influence of SORC system operating parameters on economic performance. (a) Influence of expander inlet pressure and evaporator inlet temperature on EPC, (b) Influence of expander inlet pressure and evaporator inlet temperature on PB, (c) Influence of working fluid mass flow rate and evaporator inlet pressure on EPC, (d) Influence of working fluid mass flow rate and evaporator inlet pressure on PB.
Figure 8 shows the impact of SORC operating parameters on environmental performance. The SORC system’s ECE is significantly affected by the expander inlet pressure and evaporator working fluid side inlet pressure, which are generally positively correlated. The inlet temperature of the evaporator’s working fluid side and the working fluid mass flow rate have small influences on the ECE of the SORC within the parameter variation range, which are generally negatively correlated. The SORC system exhibits ECE values ranging between 3.5 ton CO2,eq and 2.74 ton CO2,eq in the simulation.
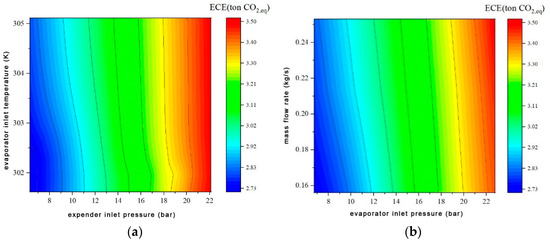
Figure 8.
Influence of SORC system operating parameters on environmental performance. (a) Influence of expander inlet pressure and evaporator inlet temperature on ECE, (b) Influence of working fluid mass flow rate and evaporator inlet pressure on ECE.
3.4. Influence of System Operating Parameters on RORC Performance
A simulation study was conducted to investigate the influence of system operating parameters on RORC performance when the engine is operating at its rated speed of 3600 rpm. Figure 9 shows the impact of RORC operating parameters on thermodynamic performance. The RORC system’s thermal efficiency and POPA are significantly affected by the expander inlet pressure and evaporator working fluid side inlet pressure, which are positively correlated. The inlet temperature of the evaporator’s working fluid side and the working fluid mass flow rate has a small influence on the thermal efficiency and POPA of the RORC within the parameter variation range. Among them, the inlet temperature of the evaporator’s working fluid side is generally negatively correlated with POPA, and the mass flow rate is generally negatively correlated with thermal efficiency and POPA. The RORC system exhibits thermal efficiency values ranging between 7.27% and 0.11% and POPA values ranging between 6.88 kW/m2 and 0.081 kW/m2 in the simulation.
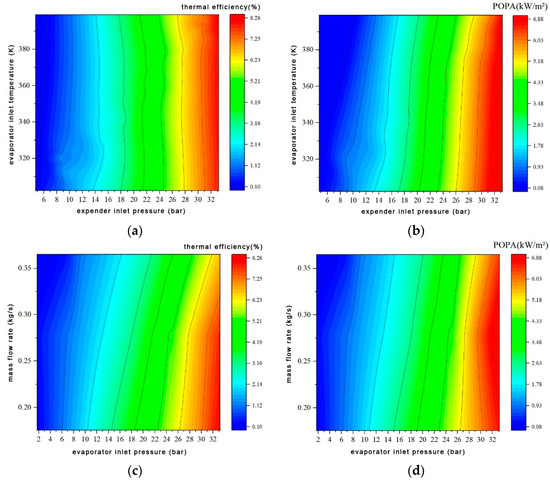
Figure 9.
Influence of RORC system operating parameters on thermodynamic performance. (a) Influence of expander inlet pressure and evaporator inlet temperature on thermal efficiency, (b) Influence of expander inlet pressure and evaporator inlet temperature on POPA, (c) Influence of working fluid mass flow rate and evaporator inlet pressure on thermal efficiency, (d) Influence of working fluid mass flow rate and evaporator inlet pressure on POPA.
Figure 10 shows the impact of RORC operating parameters on economic performance. The RORC system’s EPC and PB are significantly affected by the expander inlet pressure and evaporator working fluid side inlet pressure, which are generally negatively correlated. The working fluid mass flow rate has a small influence on the EPC and PB of the RORC within the parameter variation range, with a generally negative correlation. The RORC system exhibits EPC values ranging between 0.8 USD/kWh and 0.13 USD/kWh and PB values ranging between 7.06 years and 1.18 years in the simulation.
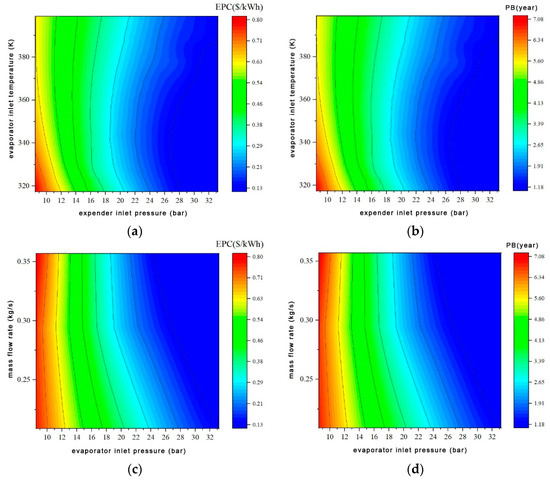
Figure 10.
Influence of RORC system operating parameters on economic performance. (a) Influence of expander inlet pressure and evaporator inlet temperature on EPC, (b) Influence of expander inlet pressure and evaporator inlet temperature on PB, (c) Influence of working fluid mass flow rate and evaporator inlet pressure on EPC, (d) Influence of working fluid mass flow rate and evaporator inlet pressure on PB.
Figure 11 shows the impact of RORC operating parameters on environmental performance. The RORC system’s ECE are significantly affected by the expander inlet pressure and evaporator working fluid side inlet pressure, which are generally positive correlated. The inlet temperature of the evaporator’s working fluid side and the working fluid mass flow rate have small influences on the ECE of the RORC within the parameter variation range. The RORC system exhibits ECE values ranging between 4.32 ton CO2,eq and 2.81 ton CO2,eq in the simulation.
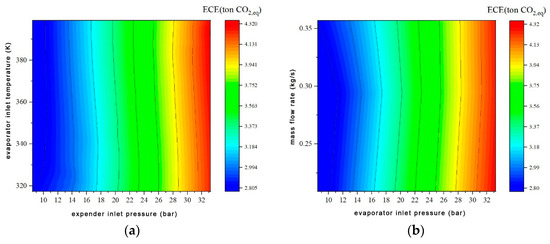
Figure 11.
Influence of the RORC system operating parameters on environmental performance. (a) Influence of expander inlet pressure and evaporator inlet temperature on ECE, (b) Influence of working fluid mass flow rate and evaporator inlet pressure on ECE.
4. Machine-Learning-Based Performance Optimization of ORC Systems
4.1. Neural-Network-Based Performance Prediction Model for ORC Systems
The operational parameters of the SORC/RORC systems exert a differential influence on the system’s various performance objective functions and the different performance objective functions are involved in the competitive relationship between one another. In order to achieve the optimal overall performance of the system, it is necessary to employ a technique that can obtain the value of the performance objective functions of the system under different parameter configurations. Subsequently, the operating parameters can be optimized through the implementation of a multi-objective optimization method. The simulation of the SORC/RORC system by the GT-Suite software is a time-consuming process, with each simulation taking a considerable amount of time, generally ranging from several minutes to a few tens of minutes. For this reason, a back-propagation of errors (BP) neural network model for the SORC/RORC is developed based on Matlab software R2017a in this study. This model can predict the performance objective functions of the SORC/RORC system within a few seconds.
Artificial neural networks (ANN), as a class of intelligent algorithms with strong generalization and learning abilities, can rapidly construct complex system analysis and optimization models based on a priori data, thereby effectively reducing the cost of computing. Figure 12 presented the schematic of the neural network model utilized in this study, which comprised one input layer, one hidden layer, and one output layer. Each layer contains multiple neurons that transfer information by connecting weights.
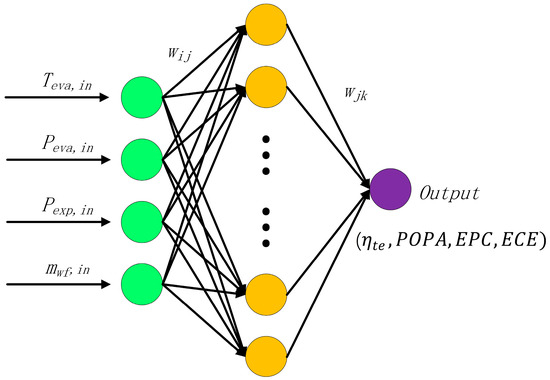
Figure 12.
Schematic diagram of neural network prediction model for SORC/RORC system performance.
The network is trained by passing the input data obtained from the sample to the input layer and the output data obtained from the sample as the true value of the output layer. The neural network improves its prediction of the output data by adjusting the connection weights. This process can be expressed by the following Equation [36]:
where f is the excitation function, wij is the weight, xj is the input, b is the bias, and y is the output.
The backpropagation (BP) neural network trains the network through a backpropagation algorithm, which adjusts the connection weights by comparing the difference between the network’s prediction and the true value. The training process of a BP neural network has two stages. In the first stage, the input data passes through each layer of the network and produces an output result through the action of the activation function. In the second stage, this error is backpropagated by calculating the difference between the output error and the target error, and the connection weights are adjusted to reduce the error. This process is carried out iteratively until the output of the network reaches the desired accuracy or the training error converges [36].
In this paper, 500 data sets each of the SORC and RORC were generated by GT-Suite simulation in a practical range of operating parameters. The data were split into a training set and a test set. In the training phase, the training set was used to train the parameters such as weights and thresholds in the neural network structure. In the testing phase, the test set was used to test the trained neural network. The neural network uses the evaporator working fluid side inlet temperature and inlet pressure, expander inlet pressure, and working fluid mass flow rate as input variables, and the thermal efficiency, POPA, EPC, and ECE of the system as output variables. The values of the input and output variables were normalized. The number of training iterations was set to 500.
There are many metrics to assess the accuracy of a neural network model. This study employed the mean square error () and the coefficient of determination () to evaluate the accuracy of the neural network prediction model and to validate the neural network model.
is the loss function for linear regression, which shows the differences between predicted and true values. The smaller the , the better the model fit. The was calculated as follows:
where and are the true value and neural network predicted value, respectively, and represents the number of data points. R2 represents the percentage of variance in the model, which presents how well the data fit the regression model. The was calculated as follows.
where is the mean value of , values are between 0 and 1, with a value closer to 1 indicating a better fit.
The structural parameters of the neural network prediction model influence the accuracy of the model’s predictions. These parameters include the number of hidden layer neurons, the learning rate, and the specific training function employed. In this study, the neural network is trained by enumerating different structural parameter values of the neural network. The training functions employed in this study comprise the six training functions included in the Matlab software: trainlm, traindx, traingdm, trainda, traingd, and trainbfg. The optimal structural parameter values of the neural network for each performance objective function of the SORC and RORC and their corresponding and are shown in Table 7 and Table 8, respectively.

Table 7.
Structural parameters of neural network prediction models for SORC system performance.

Table 8.
Structural parameters of neural network prediction models for RORC system performance.
As evidenced by Table 7 and Table 8, the neural network exhibits a high degree of accuracy in its predictions for each performance objective function of the SORC and RORC systems. The structural parameter values with the smallest MSE values are used in the neural network for subsequent optimization study.
4.2. Optimization Study
The comprehensive performance of the SORC/RORC system in this study includes thermodynamic, economic, and environmental performance, with a competitive relationship between them. The multi-objective optimization of the performance of the SORC/RORC system is conducted in this study using the NSGA-II [26] and TOPSIS methods [37].
4.2.1. Multi-Objective Optimization Models
The performance of the SORC/RORC system includes thermodynamic performance, economic performance, and environmental performance, where the thermodynamic performance and economic performance contain multiple optimization objectives. Selecting too many optimization objectives for optimization at one time can easily lead to dimensional catastrophe, which makes the optimization model less accurate and increases the cost of computational time; therefore, in this study, we choose the combination of four performance objective functions, namely, the thermal efficiency and the POPA, the thermal efficiency and EPC, the thermal efficiency and ECE, and the POPA and ECE, for the optimization. The optimization objective requires the highest possible thermal efficiency, the highest possible POPA, and the lowest possible EPC and ECE. The optimization variables are the inlet temperature and inlet pressure of the evaporator’s working fluid side, the inlet pressure of the expander, and the mass flow rate of working fluid. The optimization model for each of the above four combinations of evaluation indicators can be presented as:
The range of values for the SORC and RORC system optimization variables are presented in Table 9 and Table 10, respectively.

Table 9.
The range of values of optimization variables of the SORC system.

Table 10.
The range of values of optimization variables of the RORC system.
The parameter setting of the optimization model are presented in Table 11.

Table 11.
Optimization model parameter setting.
4.2.2. SORC and RORC System Performance Optimization
The performance of the SORC and RORC systems for exhaust waste heat recovery from automotive engines is optimized by combining NSGA-II and TOPSIS. The optimization results for the SORC are shown in Figure 13.
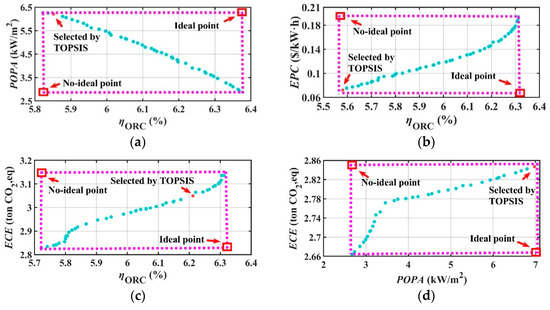
Figure 13.
Performance of the SORC system for optimization results. (a) Thermal efficiency and POPA optimization results. (b) Thermal efficiency and EPC optimization results. (c) Thermal efficiency and ECE optimization results. (d) POPA and ECE optimization results.
For the SORC system, the optimization results of selecting the thermal efficiency–POPA combination is presented in Figure 13a. This figure illustrates that the POPA tends to decrease as the thermal efficiency increases, which is because increasing the thermal efficiency of the system requires increasing the heat exchange area of the heat exchanger. That will result in more system cost and decreases in the POPA and thermal economy. The thermal efficiency and POPA are in a competitive relationship during the optimization process. The optimal solution selected by the TOPSIS method had a thermal efficiency of 5.85% and a POPA of 6.21 kW/m2. The optimization results of selecting the thermal efficiency and EPC combination is presented in Figure 13b. It shows that the EPC tends to increase as the thermal efficiency increases, and the two have a positive correlation on the trend of change. The thermal efficiency and EPC performance are competitive in the optimization process, which is caused by the heat transfer area change. The optimal solution selected by the TOPSIS method had a thermal efficiency of 5.58% and an EPC of 7.22 × 10⁻² USD/kWh. The optimization results of selecting the thermal efficiency and ECE combination is presented in Figure 13c. It shows that the ECE tends to increase as the thermal efficiency increases, and the two are positively correlated in terms of the trend of change. This is because improving the thermal efficiency requires an increase in the working fluid charge, changing the heat exchanger specifications, etc., which will lead to an increase in the direct and indirect CO2 emissions during the whole process of the system from production to operation, thus leading to an increase in the ECE. With a competitive relationship between thermal efficiency and ECE, the optimal solution selected by the TOPSIS method had a thermal efficiency of 6.21% and an ECE of 3.05 ton CO2,eq. The optimization results of selecting the POPA and ECE combination is presented in Figure 13d. It illustrates that the ECE tends to increase as the POPA increases, and the two are positively correlated. This is mainly due to the circumstances, such as increase in working fluid charge and change in heat exchanger specifications. The optimal solution selected by the TOPSIS method had a POPA of 6.98 kW/m2 and an ECE of 2.85 ton CO2,eq.
A comparison of the performance objective functions before and after the optimization of the SORC is presented in Table 12, which shows that the optimization process significantly improves the system’s thermodynamic and economic performances, but slightly reduces the environmental performance.

Table 12.
Performance optimization results of the SORC system.
The results of the RORC optimization using the same method are shown in Figure 14.
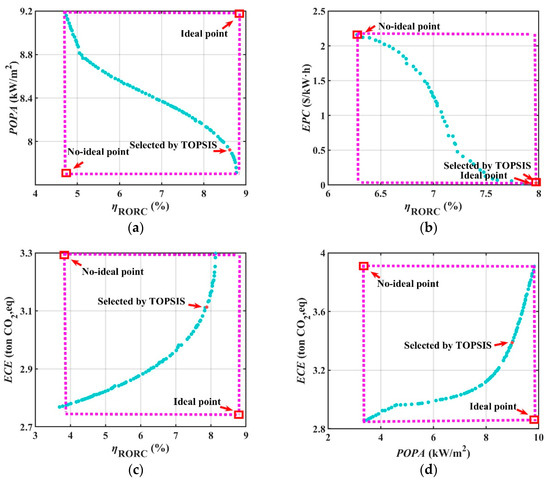
Figure 14.
Performance of the RORC system for optimization results. (a) Thermal efficiency and POPA optimization results. (b) Thermal efficiency and EPC optimization results. (c) Thermal efficiency and ECE optimization results. (d) POPA and ECE optimization results.
The RORC optimization results of selecting the thermal efficiency and POPA combination is presented in Figure 14a. This figure illustrates that the POPA tends to decrease as the thermal efficiency increases, and there is a negative correlation between the two, which due to the same reason as in the SORC, increasing the thermal efficiency of the system requires increasing the heat exchange area of the heat exchanger. The thermal efficiency and POPA are in a competitive relationship during the optimization process. The optimal solution selected by the TOPSIS method had a thermal efficiency of 8.61%% and a POPA of 7.92 kW/m2. The optimization results of selecting the thermal efficiency and EPC combination are presented in Figure 14b. They show that the EPC tends to decrease as the thermal efficiency increases, and the two have a negative correlation. The optimal solution selected by the TOPSIS method had a thermal efficiency of 7.88% and an EPC of 3.15 × 10⁻² USD/kWh. The optimization results of selecting the thermal efficiency and ECE combination is presented in Figure 14c. It shows that the ECE tends to increase as the thermal efficiency increases, and the two are positively correlated, which is mainly affected by the circumstances, such as when more working fluid is charged and the change in the heat exchanger specifications. The optimal solution selected by the TOPSIS method had a thermal efficiency of 7.88% and an ECE of 3.11 ton CO2,eq. The optimization results of selecting the POPA and ECE combination are presented in Figure 14d. They illustrate that the ECE tends to increase as the POPA increases, and the two are positively correlated. This is also mainly affected by the change in circumstances. The optimal solution selected by the TOPSIS method had a POPA of 8.99 kW/m2 and an ECE of 3.39 ton CO2,eq.
Comparison of Table 12 and Table 13 shows that, in general, the RORC system has a higher thermal efficiency than that of the SORC system, but the introduction of the recuperator also results in a higher cost as well as carbon emissions. Optimization leads to more thermodynamic performance improvements for SORC systems than for RORC systems; this is because the introduction of the recuperator in the RORC system has already improved its thermal efficiency, which has less potential to optimize than the SORC system. Optimization leads to slightly more economic performance improvements for RORC systems than the SORC system; this is because the RORC system cost is higher due to the introduction of the recuperator and has higher optimization potential. It is also observed that, due to the competing relationships between the thermal efficiency, the POPA, and the ECE during the optimization process, it is difficult to avoid an increase in the system’s ECE while obtaining a higher thermal efficiency and POPA.

Table 13.
Performance optimization results of the RORC system.
5. Conclusions
This study used GT-Suite software to create a joint simulation model of an ICE-ORC. The impact of key operating parameters on the thermodynamic, economic, and environmental performances of the SORC and RORC was investigated. A data-driven model for rapid prediction of the ORC performance was established based on a BP neural network. Additionally, NSGA-II and TOPSIS were employed to optimize the comprehensive performance of the SORC and RORC systems. The results indicate that:
- The exhaust temperature of the six-cylinder diesel engine shows a gradual increase and then decrease with the decrease in engine speed with a maximum temperature of 873.19 K. As the engine speed decreases, the effective fuel consumption rate shows a tendency of decreasing and then increasing, while as the engine torque increases, the effective fuel consumption rate decreases. It can reach a maximum of 361.01 g/kW·h. The engine exhaust mass flow rate rises with torque, and the maximum available exhaust energy reaches a maximum 192.77 kW at the rated engine speed of 3600 rpm. In the 1000–3600 rpm range of engine speed, the RORC fluctuates more dramatically than the SORC in terms of system performance as a function of engine speed. At low engine speeds, the thermodynamic performance of the RORC is inferior to that of the SORC. Conversely, at high engine speeds, the thermodynamic performance of the RORC is markedly superior to that of the SORC, although the payback period is lengthy, and the environmental performance is poor. The SORC and the RORC exhibited enhanced thermodynamic and economic performance as the engine approached its rated speed.
- When the engine is at rated at a speed of 3600 rpm, while the key operating parameters affect all three ORC performances significantly, the trend of the effect of a single parameter on the different performances varies. When optimizing the performance of the SORC and RORC systems by adjusting the parameters, there is some competition between thermodynamic, economic, and environmental performance. The RORC has better optimal thermodynamic and economic performance but poorer environmental performance compared to the SORC over a practical range of parameter variations. The RORC has better optimal thermodynamic and economic performance but poorer environmental performance compared to the SORC after optimization within the practical parameter variation range.
- A model for fast prediction of system performance of the SORC and RORC has been developed by the artificial neural network method. Based on this, multi-objective optimization of system performance of the SORC and RORC has been carried out by NSGA-II and TOPSIS. The SORC system has a thermal efficiency of up to 6.21%, a POPA of up to 6.98 kW/m2, an EPC of up to 7.22 × 10⁻² USD/kWh, and an ECE as low as 2.85 ton CO2,eq; the RORC system has a thermal efficiency of up to 8.61%, a POPA of up to 8.99 kW/m2, an EPC of up to 3.15 × 10⁻² USD/kWh, and an ECE as low as 3.11 ton CO2,eq. After multi-objective optimization, the RORC system has better thermodynamic and economic performance compared to the SORC system, but poorer environmental performance.
Final remarks: This study presents an approach for the rapid optimization of ORC system performance, which is suitable for application in systems with operating conditions subject to frequent fluctuations, such as the ORC waste heat recovery system for the vehicle. However, there are several areas where this approach can be improved. Firstly, there are several types of artificial neural networks. Other than the BP network used in this approach, it is known that a radial basis function (RBF) network is also a very excellent network that has successfully solved multi-criteria optimization problems in many works [38,39,40]. The main difference between an RBF network and a BP network is the use of the radial basis function as the transfer function between the input layer and the hidden layer, which effectively eliminates the influence of training samples far away from the prediction point on the prediction result. The use of RBF networks promises faster computation and is well worth investigating in future work. In addition, the evaluation of the neural network model in this study adopts MSE and R2. Further introducing a variety of other evaluation metrics, such as RMSE, MAE, and R could improve the generalization ability of the network. Finally, in this study, the data were divided into a training set and a test set. It is worth exploring more ways to divide the data so as to further improve the prediction accuracy while reducing the detection time in the future.
Author Contributions
Conceptualization, H.Z.; Methodology, C.X. and H.Z.; Software, X.W. and X.P.; Formal analysis, X.C.; Investigation, X.W., C.X. and F.Y.; Data curation, X.W., C.X. and X.P.; Writing—original draft, X.W.; Writing—review & editing, X.C. and F.Y.; Visualization, F.Y.; Supervision, X.C.; Funding acquisition, H.Z. All authors have read and agreed to the published version of the manuscript.
Funding
This work was sponsored by the Beijing Natural Science Foundation (Grant No.3222024).
Data Availability Statement
The raw data supporting the conclusions of this article will be made available by the authors on request.
Conflicts of Interest
The authors declare no conflict of interest.
References
- Dolz, V.; Novella, R.; García, A.; Sánchez, J. HD Diesel engine equipped with a bottoming Rankine cycle as a waste heat recovery system. Part 1: Study and analysis of the waste heat energy. Appl. Therm. Eng. 2012, 36, 269–278. [Google Scholar] [CrossRef]
- Shu, G.Q.; Zhao, M.R.; Tian, H.; Wei, H.Q.; Liang, X.Y.; Huo, Y.Z.; Zhu, W. Experimental investigation on thermal OS/ORC (oil storage/organic Rankine cycle) system for waste heat recovery from diesel engine. Energy 2016, 107, 693–706. [Google Scholar] [CrossRef]
- Rosset, K.; Mounier, V.; Guenat, E.; Schiffmann, J. Multi-objective optimization of turbo-ORC systems for waste heat recovery on passenger car engines. Energy 2018, 159, 751–765. [Google Scholar] [CrossRef]
- Zhao, Y.L.; Li, W.J.; Zhao, X.L.; Wang, Y.; Luo, D.; Li, Y.; Ge, M. Energy and exergy analysis of a thermoelectric generator system for automotive exhaust waste heat recovery. Appl. Therm. Eng. 2024, 239, 122180. [Google Scholar] [CrossRef]
- Zhang, J.; Zhang, H.G.; Yang, K.; Yang, F.B.; Wang, Z.; Zhao, G.Y.; Liu, H.; Wang, E.H.; Yao, B.F. Performance analysis of regenerative organic Rankine cycle (RORC) using the pure working fluid and the zeotropic mixture over the whole operating range of a diesel engine. Energy Convers. Manag. 2014, 84, 282–294. [Google Scholar] [CrossRef]
- Galindo, J.; Ruiz, S.; Dolz, V.; Royo-Pascual, L.; Haller, R.; Nicolas, B.; Glavatskaya, Y. Experimental and thermodynamic analysis of a bottoming organic Rankine cycle (ORC) of gasoline engine using swash-plate expander. Energy Convers. Manag. 2015, 103, 519–532. [Google Scholar] [CrossRef]
- Katsanos, C.O.; Hountalas, D.T.; Pariotis, E.G. Thermodynamic analysis of a Rankine cycle applied on a diesel truck engine using steam and organic medium. Energy Convers. Manag. 2012, 60, 68–76. [Google Scholar] [CrossRef]
- Horst, T.A.; Tegethoff, W.; Eilts, P.; Koehler, J. Prediction of dynamic Rankine cycle waste heat recovery performance and fuel saving potential in passenger car applications considering interactions with vehicles’ energy management. Energy Convers. Manag. 2014, 78, 438–451. [Google Scholar] [CrossRef]
- Yang, M.H.; Yeh, R.H. Analyzing the optimization of an organic Rankine cycle system for recovering waste heat from a large marine engine containing a cooling water system. Energy Convers. Manag. 2014, 88, 999–1010. [Google Scholar] [CrossRef]
- Lei, M.; Ma, X.L.; Lian, Q.F.; Meng, X.; Wu, T.; Wei, X. Experimental investigation on the characteristics of heat exchangers based on Organic Rankine Cycle system under different operating conditions. Int. J. Energ. Res. 2021, 45, 13365–13379. [Google Scholar] [CrossRef]
- Zhao, R.; Zhang, H.G.; Song, S.S.; Tian, Y.; Yang, Y.; Liu, Y. Integrated simulation and control strategy of the diesel engine–organic Rankine cycle (ORC) combined system. Energy Convers. Manag. 2018, 156, 639–654. [Google Scholar] [CrossRef]
- Kocaman, E.; Karakuş, C.; Yağlı, H.; Koç, Y.; Yumrutaş, R.; Koç, A. Pinch point determination and Multi-Objective optimization for working parameters of an ORC by using numerical analyses optimization method. Energy Convers. Manag. 2022, 271, 116301. [Google Scholar] [CrossRef]
- Ochoa, G.V.; Castilla, D.V.; Casseres, D.M. Sensitivity analysis and multi-objective optimization of the energy, exergy and thermo-economic performance of a Brayton supercritical CO2-ORC configurations. Energy Rep. 2023, 9, 4437–4455. [Google Scholar] [CrossRef]
- Zhar, R.; Allouhi, A.; Jamil, A.; Lahrech, K. A comparative study and sensitivity analysis of different ORC configurations for waste heat recovery. Case Stud. Therm. Eng. 2021, 28, 101608. [Google Scholar] [CrossRef]
- Küçük, E.Ö.; Kılıç, M. Exergoeconomic analysis and multi-objective optimization of ORC configurations via Taguchi-Grey Relational Methods. Heliyon 2023, 9, e15007. [Google Scholar] [CrossRef] [PubMed]
- Teng, S.Y.; Wang, M.W.; Xi, H.; Wen, S. Energy, exergy, economic (3E) analysis, optimization and comparison of different ORC based CHP systems for waste heat recovery. Case Stud. Therm. Eng. 2021, 28, 101444. [Google Scholar] [CrossRef]
- Zhou, J.Z.; Chu, Y.T.; Ren, J.Z.; Shen, W.; He, C. Integrating machine learning and mathematical programming for efficient optimization of operating conditions in organic Rankine cycle (ORC) based combined systems. Energy 2023, 281, 128218. [Google Scholar] [CrossRef]
- Chitgar, N.; Hemmati, A.; Sadrzadeh, M. A comparative performance analysis, working fluid selection, and machine learning optimization of ORC systems driven by geothermal energy. Energy Convers. Manag. 2023, 286, 117072. [Google Scholar] [CrossRef]
- Lu, P.; Luo, X.L.; Wang, J.; Chen, J.; Liang, Y.; Yang, Z.; Wang, C.; Chen, Y. Thermo-economic design, optimization, and evaluation of a novel zeotropic ORC with mixture composition adjustment during operation. Energy Convers. Manag. 2021, 230, 113771. [Google Scholar] [CrossRef]
- Bu, S.J.; Yang, X.L.; Li, W.K.; Su, C.; Dai, W.; Wang, X.; Tang, M.; Ji, Z.; Tang, J. Comprehensive performance analysis and optimization of novel SCR-ORC system for condensation heat recovery. Appl. Therm. Eng. 2022, 201, 117825. [Google Scholar] [CrossRef]
- Yu, Z.T.; Feng, C.Y.; Bian, F.Y.; Wang, D. Investigation and optimization of a two-stage cascade ORC system for medium and low-grade waste heat recovery using liquefied natural gas cold energy. Int. J. Refrig. 2022, 135, 97–112. [Google Scholar] [CrossRef]
- Chen, W.; Liang, Y.Z.; Luo, X.L.; Chen, J.Y.; Zhi Yang Chen, Y. Artificial neural network grey-box model for design and optimization of 50 MWe-scale combined supercritical CO2 Brayton cycle-ORC coal-fired power plant. Energy Convers. Manag. 2021, 249, 114821. [Google Scholar] [CrossRef]
- Wang, W.; Deng, S.; Zhao, D.P.; Zhao, L.; Lin, S.; Chen, M.C. Application of machine learning into organic Rankine cycle for prediction and optimization of thermal and exergy efficiency. Energy Convers. Manag. 2020, 210, 112700. [Google Scholar] [CrossRef]
- Ziviani, D.; James, N.A.; Accorsi, F.A.; Braun, J.E.; Groll, E.A. Experimental and numerical analyses of a 5 kWe oil-free open-drive scroll expander for small-scale organic Rankine cycle (ORC) applications. Appl. Energy 2018, 230, 1140–1156. [Google Scholar] [CrossRef]
- Emadi, M.A.; Mahmoudimehr, J. Modeling and thermo-economic optimization of a new multi-generation system with geothermal heat source and LNG heat sink. Energy Convers. Manag. 2019, 189, 153–166. [Google Scholar] [CrossRef]
- Cao, Y.; Salem, M.; Nasr, S.; Sadon, S.H.; Singh, P.K.; Abed, A.M.; Dahari, M.; Almoneef, M.M.; Wae-Hayee, M.; Galal, A.M. A novel heat recovery for a marine diesel engine with power and cooling outputs; exergetic, economic, and net present value investigation and multi-criteria NSGA-II optimization. Ain Shams Eng. J. 2022, 14, 102067. [Google Scholar] [CrossRef]
- Wang, E.H.; Zhang, H.G.; Fan, B.Y.; Wu, Y. Optimized performances comparison of organic Rankine cycles for low grade waste heat recovery. J. Mech. Sci. Technol. 2012, 26, 2301–2312. [Google Scholar] [CrossRef]
- Wang, Z.Q.; Hu, Y.H.; Xia, X.X.; Zuo, Q.; Zhao, B.; Li, Z. Thermo-economic selection criteria of working fluid used in dual-loop ORC for engine waste heat recovery by multi-objective optimization. Energy 2020, 197, 117053. [Google Scholar] [CrossRef]
- Fan, W.; Han, Z.H.; Li, P.; Jia, Y. Analysis of the thermodynamic performance of the organic Rankine cycle (ORC) based on the characteristic parameters of the working fluid and criterion for working fluid selection. Energy Convers. Manag. 2020, 211, 112746. [Google Scholar] [CrossRef]
- Feng, Y.Q.; Wang, Y.; Yao, L.; Xu, J.W.; Zhang, F.Y.; He, Z.X.; Wang, Q.; Ma, J.L. Parametric analysis and thermal-economical optimization of a parallel dual pressure evaporation and two stage regenerative organic Rankine cycle using mixture working fluids. Energy 2023, 263, 125670. [Google Scholar] [CrossRef]
- Li, G.Q.; Wu, Z.; Wei Li Wang, Z.K.; Wang, X.; Li, H.X.; Yao, S.C. Condensation in micro-fin tubes of different geometries. Exp. Therm. Fluid. Sci. 2012, 37, 19–28. [Google Scholar] [CrossRef]
- Huang, Y.; Wang, Y.; Rezvani, S.; McIlveen-Wright, D.; Anderson, M.; Mondol, J.; Zacharopolous, A.; Hewitt, N. A techno-economic assessment of biomass fuelled trigeneration system integrated with organic Rankine cycle. Appl. Therm. Eng. 2013, 53, 325–331. [Google Scholar] [CrossRef]
- Li, M.; Wang, J.; Li, S.; Wang, X.; He, W.; Dai, Y. Thermo-economic analysis and comparison of a CO2 transcritical power cycle and an organic Rankine cycle. Geothermics 2014, 50, 101–111. [Google Scholar] [CrossRef]
- Imran, M.; Park, B.S.; Kim, H.J.; Lee, D.H.; Usman, M.; Heo, M. Thermo-economic optimization of Regenerative Organic Rankine Cycle for waste heat recovery applications. Energ. Convers. Manag. 2014, 87, 107–118. [Google Scholar] [CrossRef]
- Li, Y.R.; Du, M.T.; Wu, C.M.; Wu, S.Y.; Liu, C.; Xu, J.L. Economical evaluation and optimization of subcritical organic Rankine cycle based on temperature matching analysis. Energy 2014, 68, 238–247. [Google Scholar] [CrossRef]
- Tian, Z.; Gan, W.L.; Zou, X.Z.; Zhang, Y.; Gao, W. Performance prediction of a cryogenic organic Rankine cycle based on back propagation neural network optimized by genetic algorithm. Energy 2022, 254, 124027. [Google Scholar] [CrossRef]
- Ping, X.; Yang, F.B.; Zhang, H.G.; Xing, C.; Pan, Y.; Yang, H.; Wang, Y. A synergistic multi-objective optimization mixed nonlinear dynamic modeling approach for organic Rankine cycle (ORC) under driving cycle. Appl. Therm. Eng. 2023, 228, 120455. [Google Scholar] [CrossRef]
- Elsayed, K.; Lacor, C. Modeling and Pareto optimization of gas cyclone separator performance using RBF type artificial neural networks and genetic algorithms. Powder Technol. 2012, 217, 84–99. [Google Scholar] [CrossRef]
- Xu, K.; Wang, G.; Zhang, L.Y.; Wang, L.; Yun, F.; Sun, W.; Wang, X.; Chen, X. Multi-Objective Optimization of Jet Pump Based on RBF Neural Network Model. J. Mar. Sci. Eng. 2021, 9, 236. [Google Scholar] [CrossRef]
- Kokshenev, I.; Braga, A.P. A multi-objective approach to RBF network learning. Neurocomputing 2008, 71, 1203–1209. [Google Scholar] [CrossRef]
Disclaimer/Publisher’s Note: The statements, opinions and data contained in all publications are solely those of the individual author(s) and contributor(s) and not of MDPI and/or the editor(s). MDPI and/or the editor(s) disclaim responsibility for any injury to people or property resulting from any ideas, methods, instructions or products referred to in the content. |
© 2024 by the authors. Licensee MDPI, Basel, Switzerland. This article is an open access article distributed under the terms and conditions of the Creative Commons Attribution (CC BY) license (https://creativecommons.org/licenses/by/4.0/).