1. Introduction
Now, more than ever, energy generation has become humanity’s most strategic need. Energy is needed in every area of life and its proper management is becoming more and more important, i.e., when considering sustainable development [
1,
2,
3]. The consumption of energy and fuels in the transport sector is still a tremendous challenge, as evidenced by many scientific publications [
4,
5,
6,
7]. These publications are concerned with the production [
8,
9] and testing of alternative fuels such as biofuels [
10,
11,
12], gaseous fuels such as liquefied petroleum gas (LPG) [
13,
14,
15], natural gas (NG) [
16], compressed natural gas (CNG) [
17,
18], and liquefied natural gas (LNG) [
19,
20], synthetic fuels [
21], and others [
22,
23,
24]. Moreover, a considerable number of publications [
25,
26,
27] are devoted to the negative effects of fuel combustion, such as the emission of toxic compounds into the atmosphere. For these reasons, there is an ongoing search for new sources and carriers of energy and adaptation to new tasks.
Hydrogen has been recognized by scientists as the best medium for a periodic energy storage, a substrate for the production of many chemicals and synthetic fuels, and a fuel for driving road, floating, and even flying vehicles [
28,
29]. However, its production, storage [
30], transport, and large-scale usage pose a number of challenges [
31]. They result from the need to provide large amounts of energy from renewable sources, such as photovoltaic systems or wind farms [
32], for hydrogen production [
33,
34]. Hydrogen can be produced by applying electrolytic, chemical [
35,
36], photochemical [
37,
38,
39], electrochemical [
40], or biological methods [
41]. One way to produce low-emission hydrogen is to use nuclear energy [
42]. Each of these technologies requires specialized equipment capable of producing high-purity hydrogen. The hydrogen obtained in this way is a very explosive gas and requires special precautions related to its purification, compression, storage, transportation, and distribution. All of these areas can simultaneously be targets for business investment, research, and development to improve the current technologies and bring them to market. Polish companies and research centers have some experience and expertise in hydrogen-related areas. However, the experience and the offerings of the European and global companies and centers are much more mature in terms of technology [
43]. Western companies can also boast of a much greater involvement in the climate and energy transformation of many companies, which can be measured by the power of installed electrolyzers or tons of green hydrogen produced. Building a hydrogen economy at the level of individual countries is a major economic, scientific, and engineering challenge that should cover the following issues:
Creation of a business and technological environment within Hydrogen Clusters and Valleys, based on hydrogen production, including hydrogen obtained in the electrolysis process [
44] using the energy produced from renewable energy installations [
45].
Integration of the environment of regional entrepreneurs in the chemical industry and companies related to and cooperating with this industry in individual countries and the entire European Union [
46].
Taking actions aimed at strengthening the potential of the regions of individual countries as attractive places for external investors in areas related to the hydrogen economy and other areas that indirectly benefit from the development of hydrogen technologies [
47].
Investments in the field of the hydrogen economy, hydrogen production, and construction of infrastructure for its transport and vehicle refueling [
48,
49].
Using the existing scientific and research potential to undertake innovative industrial ventures and investment projects aimed at building common value chains in the hydrogen economy.
Exchange of information and experiences related to building a hydrogen economy within the framework of the Polish and European Hydrogen Strategy.
Analyzing, planning, and recommending activities, initiatives, and projects related to the hydrogen economy and energy optimization using hydrogen.
Organizing and participating in the dialogue between stakeholders (experts, representatives of central and local government institutions, business environment institutions, enterprises, operators and distributors, as well as the scientific community) interested in activities in the field of the hydrogen economy [
50].
Supporting the processes of constant improvement in competences of members of Hydrogen Clusters and Valleys in the area of the hydrogen economy by launching new fields of education at various levels of education and higher studies.
Currently, there are eleven Hydrogen Valley projects operating in Poland [
51]. Eight of them received consultation or were created based on the initiative of ARP S.A., which is actively involved in the development of the hydrogen economy ecosystem in Poland [
52]. Hydrogen Valleys in Poland are intended to support the process of decarbonization of energy-intensive industry, locate technology demonstrators in industrial parks and SEZs, and build a Polish supply chain with the support of business, science, and local administration [
51].
This article presents a probabilistic analysis of the distributed production of small amounts of green hydrogen. It can be used for transport purposes as well as to generate energy and heat for housing purposes. The article can be very beneficial in planning and starting the climate and energy transformation, especially for small companies. A major feature of the scientific approach presented in the article is its scalability [
53]. The metalog family of probability distributions was used to calculate the amount of energy generated from a renewable source and the amount of hydrogen produced. Calculating the amount of energy produced by the carport is then possible with the accuracy of the probability distribution. The amount of electricity produced by the carport on individual days of the month is used to determine the cumulative distribution function (CDF), which is a continuous function. Then, the probability density function (PDF) is determined. The metalog family of distributions, therefore, allows calculations to be made for a specific photovoltaic carport placed in a specific location (Lublin, Poland) and in a specific context (location on the ground, azimuth, shading) [
54]. The method of obtaining and processing data from photovoltaic systems presented in this article allows for a preliminary calculation of the required amount of energy from the renewable energy sources in the total energy needed to power hydrogen electrolyzers. The energy system takes into account the use of a stationary energy storage facility which collects energy when there is overproduction in relation to the electrolyzer’s power supply and releases it in times of shortage, in the evening and at night. In this way, almost all the energy produced by the photovoltaic carport can be used to produce green hydrogen.
2. The Needs of Companies in the Use of Green Hydrogen
As mentioned in the Introduction, many companies use hydrogen for various purposes. Very large amounts of hydrogen are needed for the production of artificial fertilizers, industrial chemicals, and in the petrochemical and metallurgical industries [
55]. However, there are many other uses for hydrogen produced on a much smaller scale. The first is the transport industry. Green hydrogen can successfully replace fossil fuels burned in internal combustion engines and there are two possible ways of using it. The first method involves burning hydrogen in an internal combustion engine. Designs of such engines are already entering the automotive market. However, such a solution is not zero-emission. The combustion of hydrogen is accompanied by the emission of nitrogen oxides. A much better solution in terms of ecology and efficiency of the entire process is powering hydrogen fuel cells with hydrogen. Hydrogen drives of vehicles are completely emission-free and the efficiency of converting hydrogen’s chemical energy into power driving vehicle wheels is much higher than in the case of combustion engines. Therefore, green hydrogen may be the fuel of the future, due to which the climate and energy transformation of transport companies will be possible. Current hydrogen drives can power various types of wheeled, rail, water, and flying vehicles. The demand of a transport company depends on the energy demand of individual types of vehicles and the size of the vehicle fleet. There are also many other applications that use small amounts of hydrogen.
Due to the dynamic increase in energy demand, and consequently, the emergence of numerous problems affecting the environment and its various aspects, including global warming and other catastrophic climate changes, a shift towards a carbon-neutral society is essential. Hence, many countries around the world have initiated actions to ensure growth and socio-economic stability through “green” initiatives and investments. Examples of such countries include Japan, South Korea, China, Germany, and Australia, which have proposed low-emission strategies for 2050 and a transition to sustainable energy sources, striving to decarbonize the current globalized economy powered by fossil fuels [
56].
For many different industry sectors, governmental efforts have been made to improve their structure to be cleaner and more ecological, as well as their actions towards energy transformation. Unfortunately, one of the sectors that is responsible for a large amount of greenhouse gas emissions and, as a result, may constitute an obstacle to achieving the carbon neutrality goal is transport, especially long-distance transport. Other sectors considered difficult to decarbonize include heavy industry, energy storage, shipping, and aviation [
57]. Therefore, various actions, including improving public means of transport and pursuing a more active policy supporting the transition to environmentally friendly cars, such as vehicles powered by hydrogen fuel cells, should be considered.
Hydrogen, as the most ubiquitous element in the universe, has significant potential, as well as efficient, safe, high-quality, and clean applications. It should be noted that hydrogen has the second-highest calorific value, 120–142 MJ/kg, which is the best mass ratio to energy among all conventional fuels [
58]. It, therefore, appears that hydrogen produced from renewable sources is likely to play a significant role in the decarbonization [
59,
60] of the previously mentioned sectors due to its additional unique characteristics, which include the ability to store and deliver concentrated, continuous energy with (almost) zero carbon emissions [
61]. A hydrogen-based system is, therefore, considered as an option that meets long-term sustainable development goals. It should be added that according to forecasts the demand for hydrogen will increase approximately 8 times by 2050 compared to 2020.
However, in order to achieve the Sustainable Development Goals, in addition to using sustainable energy sources, significant changes must also be made to economic models and practices. This involves, among others, the implementation of a circular economic model and the integration of environmental, social, and management practices, i.e., paying attention to the ESG pillars (environmental, social, and corporate governance) [
62]. Consequently, this means a paradigm shift towards a comprehensive and synergistic approach which should encompass technological progress, systemic design, policy reforms, infrastructure development, responsible governance, and social transformation [
63].
Taking the above into account, it should be stated that paying attention to the ESG pillars is gradually becoming necessary for all companies operating in the European Union; this is a manifestation of business rationality and responsibility. In the near future, reporting ESG factors will even force companies to take various actions aimed at sustainable development and supporting their social and environmental responsibility, because in the long-term this will provide them with a competitive advantage over those companies which ignore the environmental and social issues, because the former will be treated with priority by investors, customers, and contractors.
3. Methodology
The authors used a compelling methodology to plan the climate and energy transformation of a transport company using one vehicle powered by green hydrogen. One of the first steps was to determine the minimum electrolyzer power needed to produce enough hydrogen to power one hydrogen vehicle. Based on the electrolyzer power, the peak power of the photovoltaic system needed to supply the energy was selected.
According to the “Polish Hydrogen Strategy until 2030”, the production of 1 kg of hydrogen requires 9 L of water and about 50 kWh of electricity. This amount may change if a more efficient process is used [
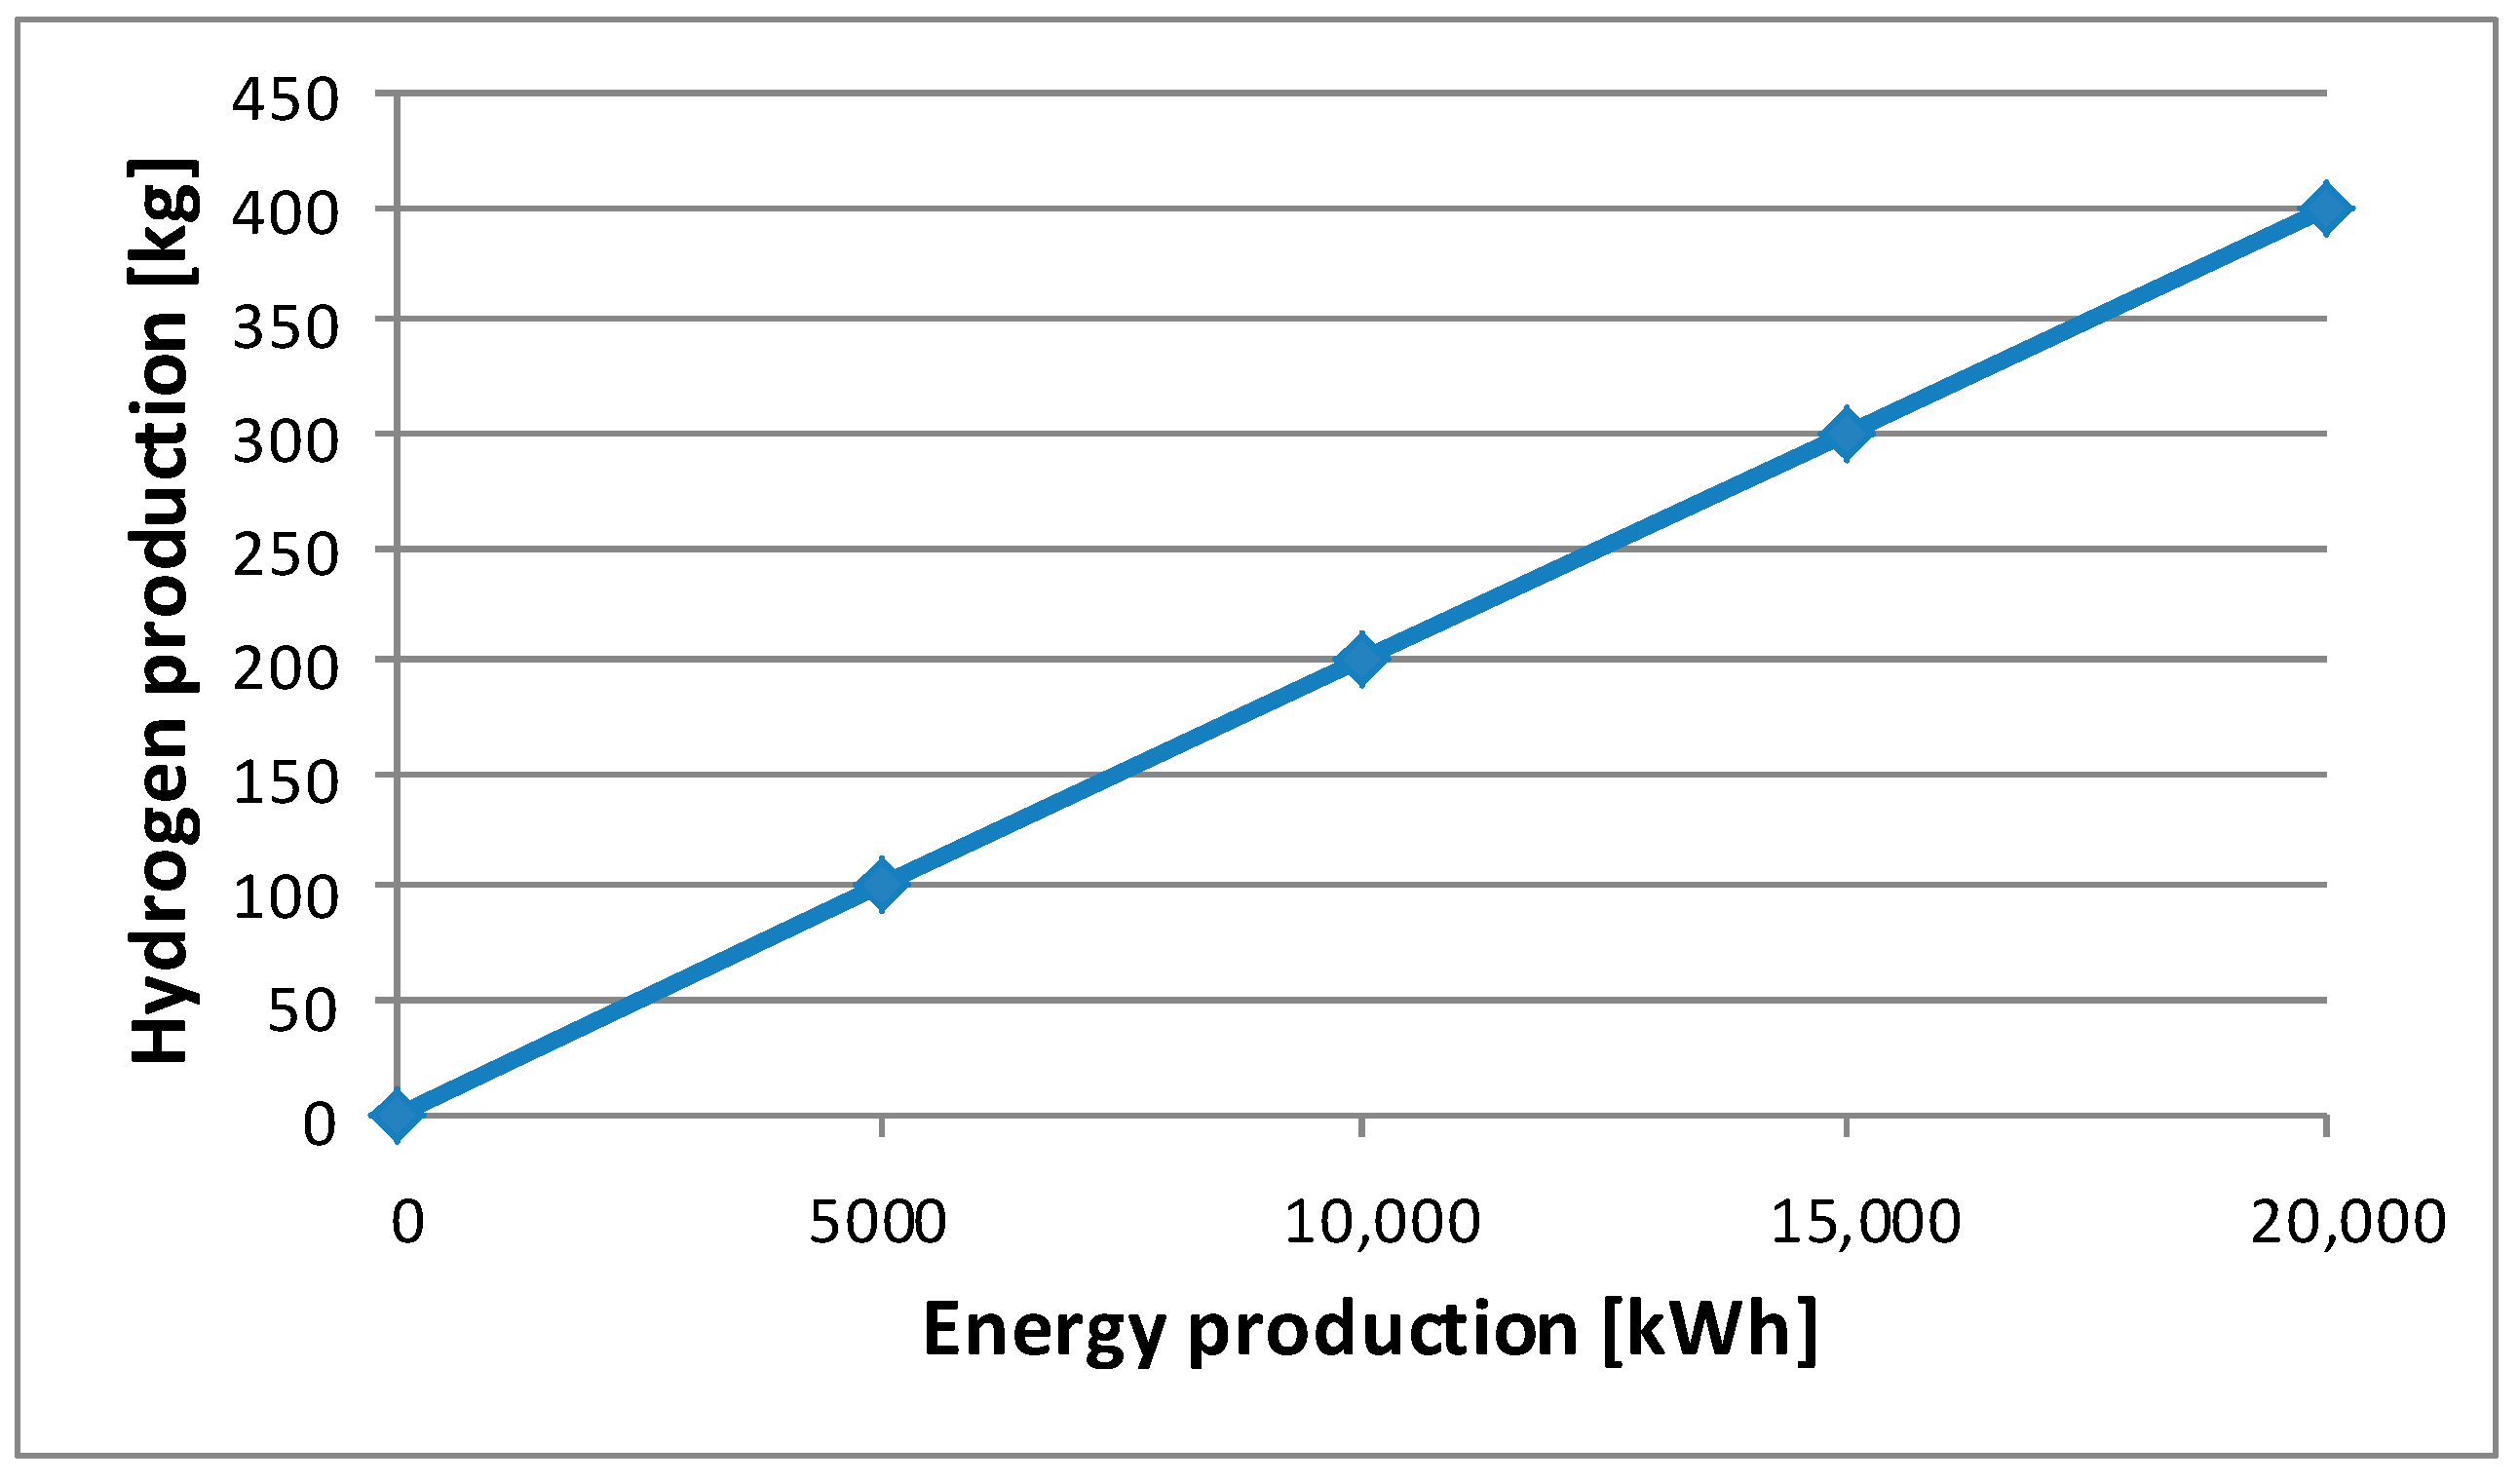
64]. The dependence of the monthly hydrogen production on the amount of electricity supplied to the electrolyzers is shown in
Figure 1. A total of 5000 kWh of electricity is required to produce 100 kg of hydrogen. This amount of hydrogen is enough to fully refuel the Toyota Mirai hydrogen vehicle 18 times, which translates into a total range for this vehicle of over 11,000 km. The algorithm presented by the authors for selecting a photovoltaic installation for the required amount of green hydrogen produced is a strategic model on which the hydrogen management of a given company can be based. The advantage of the presented calculation approach is its scalability, presented in the form of several levels of energy produced by photovoltaic systems, which translate into the amount of hydrogen generated monthly.
The participation of one of the authors at the Hydrogen Technology Expo in Bremen in 2023 confirmed that many European and global companies are developing and introducing to the market products for the production, storage, and use of hydrogen in various industries and transport. Exhibitors of electrolyzers of various types used to produce hydrogen presented their products at the fair. These were European, American, and Chinese companies. The latter’s participation in the fair was not very extensive. The latest electrolyzers are offered in PEM [
65,
66], alkaline [
67], and the latest AEM [
68] technology.
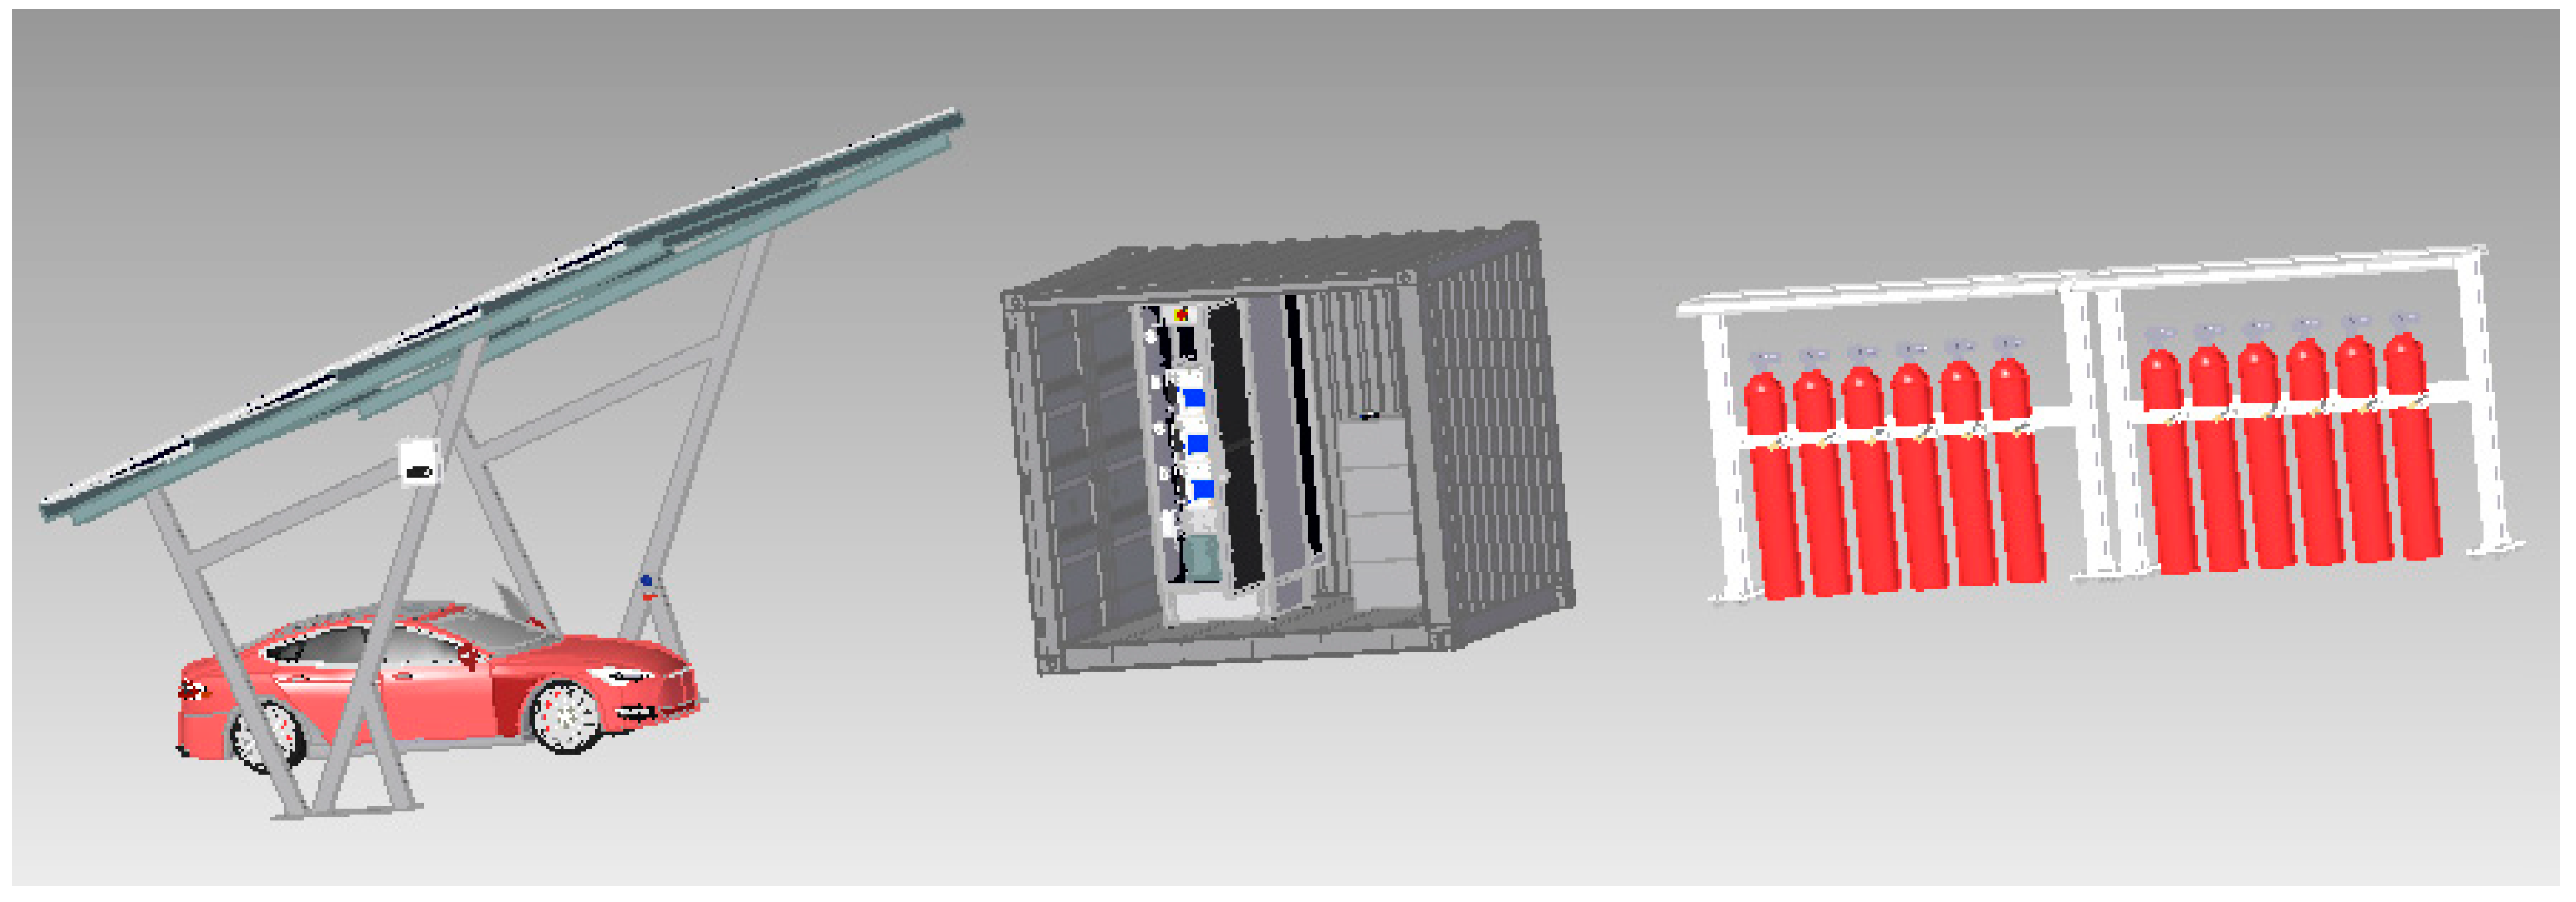
The calculations contained in the article can be used to design home green hydrogen production systems and support the climate and energy transformation of small companies with a hydrogen demand of up to ¾ kg/day. The calculations presented in the article have great practical application. Based on them, the authors design a green hydrogen production system, which is to be built in the Lublin Science and Technology Park in the near future. The 3D model of the designed system is shown in
Figure 2 and includes a photovoltaic carport with a hybrid inverter, a container with electrolyzers and energy storage, and hydrogen storage cylinders. Instead of a photovoltaic carport, investors can use any other photovoltaic system placed on the roof of the building or on the ground.
The monthly and daily amounts of energy produced by the photovoltaic system with a peak power of 6.15 kWp were analyzed using traditional statistical methods and the metalog probability distribution family. On this basis, it is possible to calculate daily and monthly amounts of hydrogen produced with accuracy from the probability distribution. A probabilistic analysis of the instantaneous power generated by the photovoltaic system was used to determine the nominal power of the hydrogen electrolyzer. In order to use all the energy produced by the photovoltaic system to produce green hydrogen, the use of a stationary energy storage was proposed and its energy capacity was determined.
So far, the authors have used the metalog family of probability distributions in various fields of science. Among other things, they demonstrated its usefulness in selecting an electric car for an existing photovoltaic system [
69]. Recently, the authors used this tool to determine the technical condition of traction batteries from hybrid vehicles [
70]. The authors combine modern tools and a modern approach to designing energy generation, storage, and distribution systems.
4. Scientific Research Results
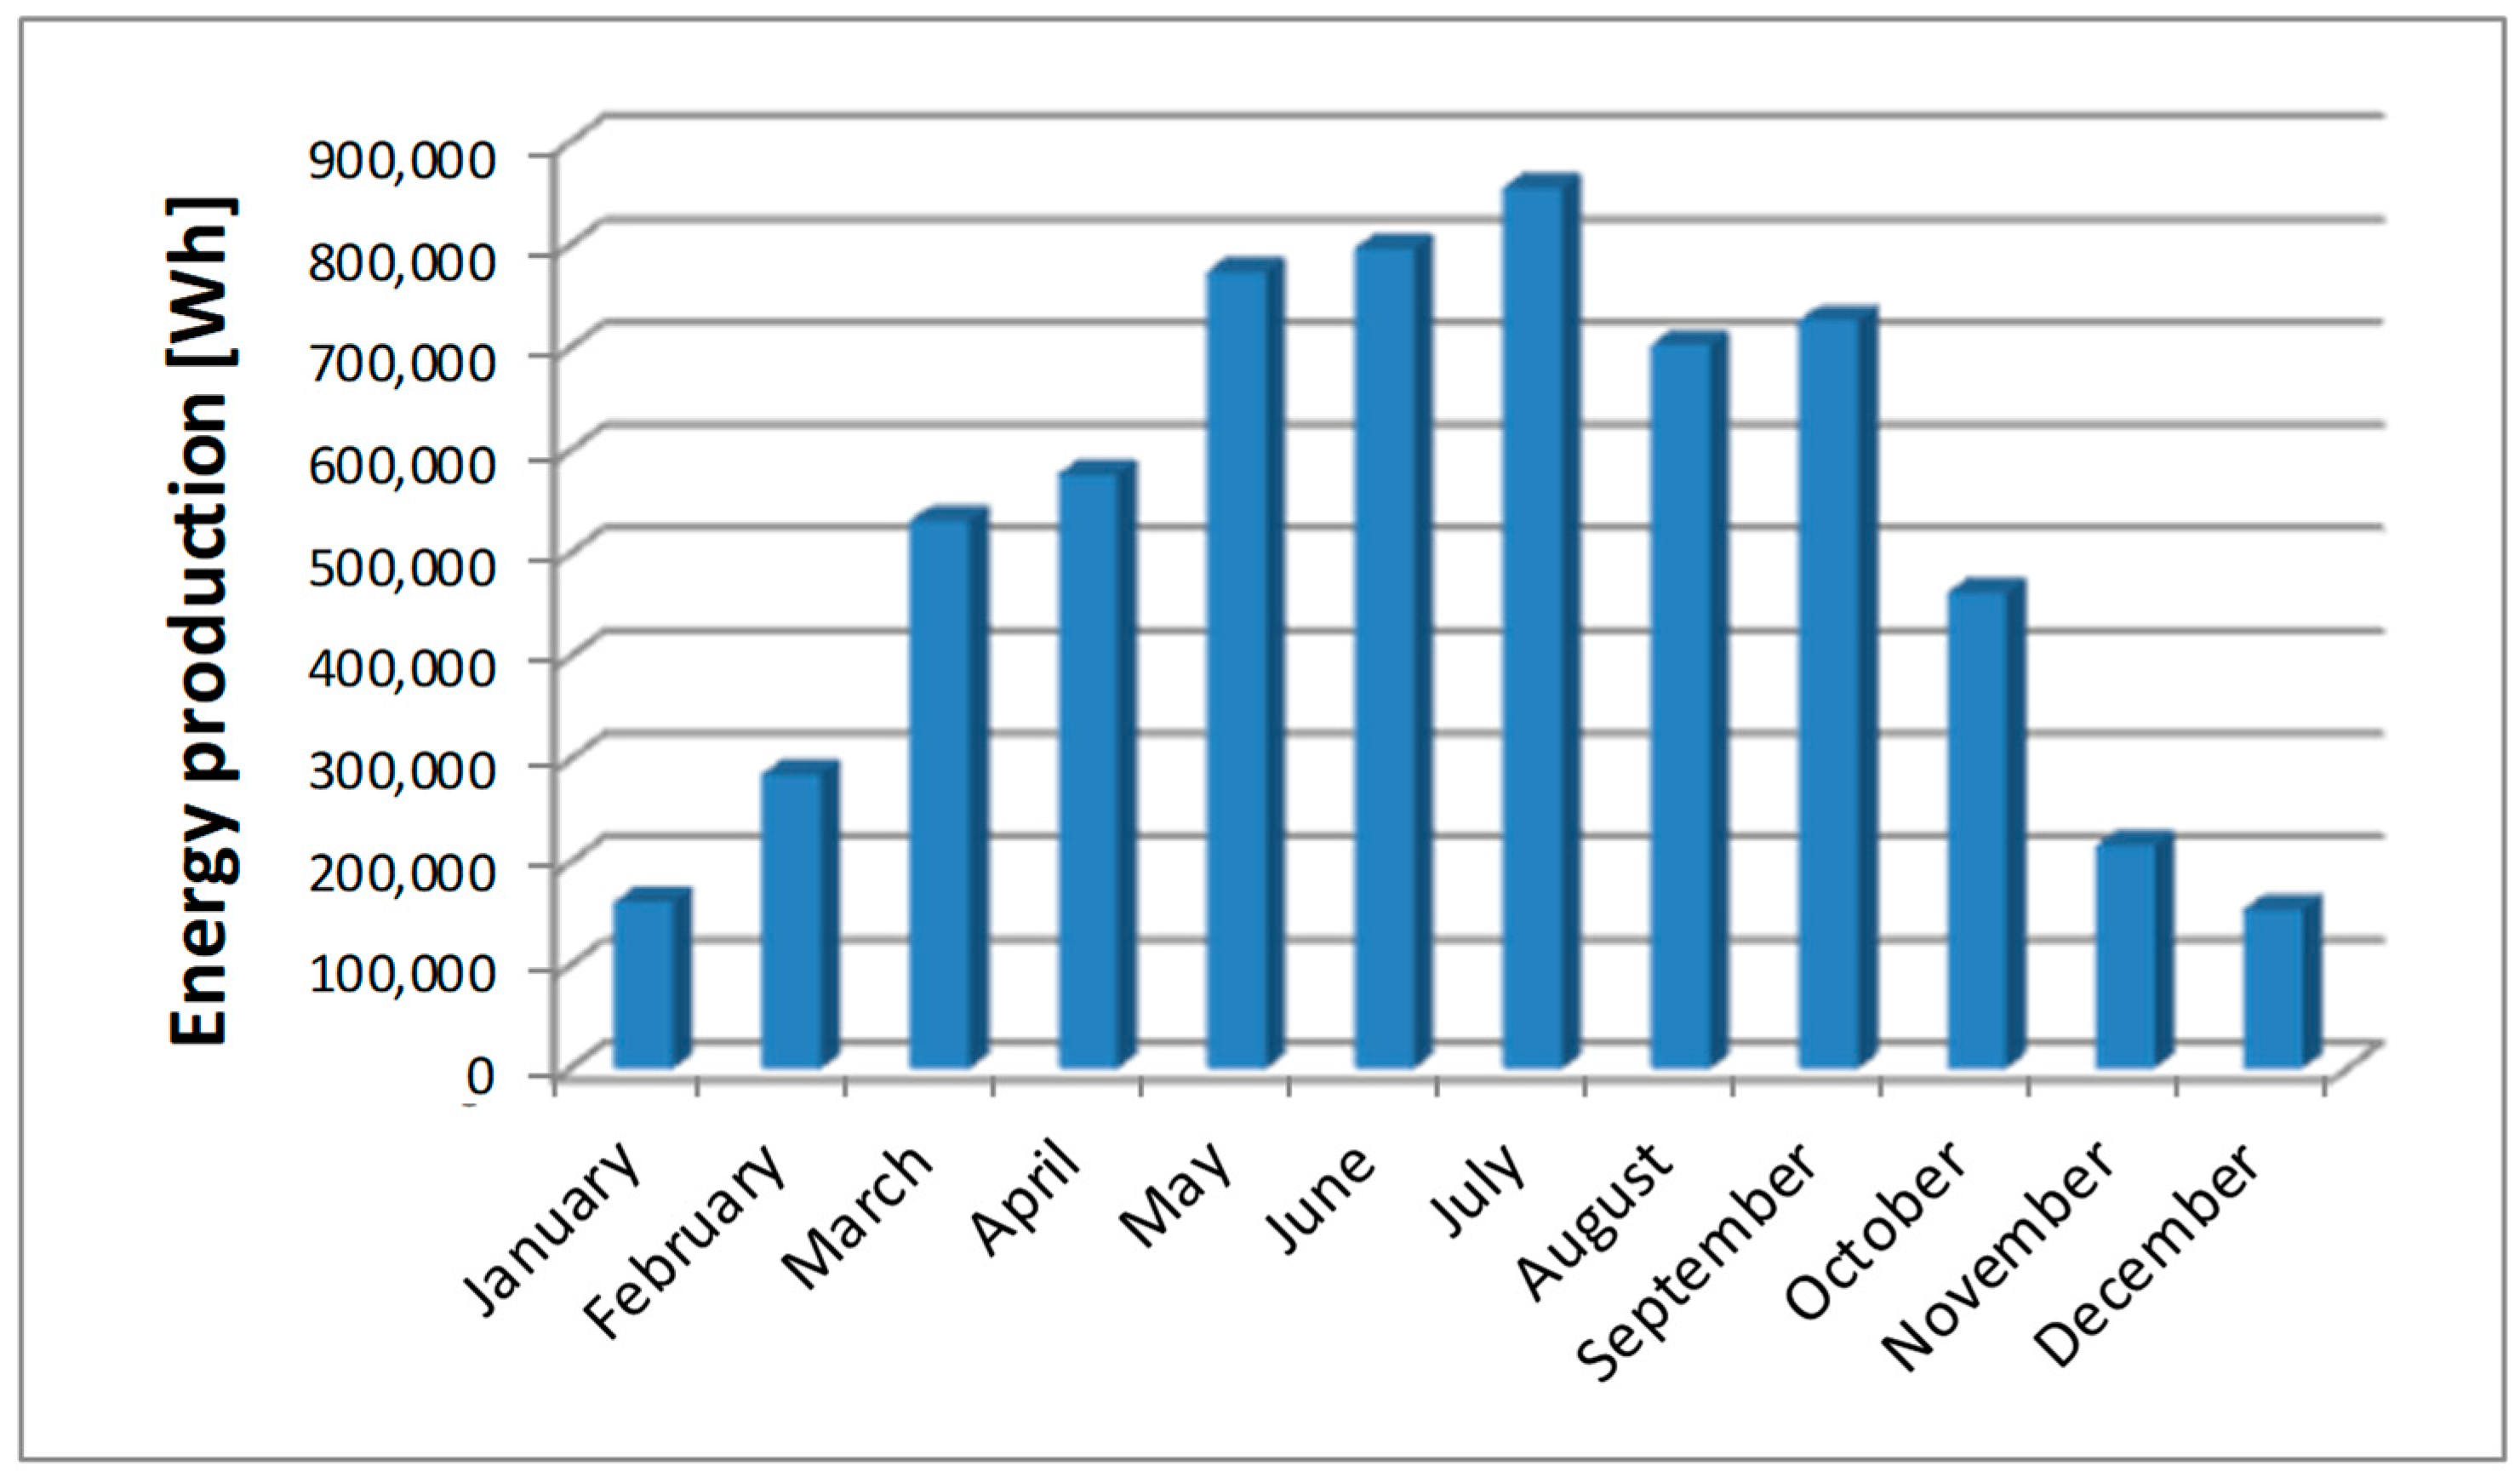
This part of the article presents the actual data on the amount of energy produced by a photovoltaic system located in Europe (Poland). The data related to the profile of power generated during the day and the amount of daily, monthly, and annual energy production can be downloaded onto a computer by any Internet user. One of the largest manufacturers of photovoltaic inverters (Solaredge, Munich, Germany) allows its users to publicize the performance of their photovoltaic installation. The peak power of the tested system is 6.15 kWp. With the exact azimuth to the south and the optimal angle of inclination of the panels, this system is able to generate 6.25 MWh of energy per year (measured data). Quantitative data on the power and the amount of energy produced saved in the cloud were downloaded in CSV format to the author’s computer hard drive for visualization and further processing. The amounts of energy produced monthly by a photovoltaic system with a peak power of 6.15 kWp throughout 2023 are shown in
Figure 3.
The metalog family of distributions allows the percentiles in the production of electricity by a photovoltaic carport to be determined and determines what its value will be with the accuracy of the probability distribution [
72]. The metalog approach discusses the composition of the probability distributions. It is a complex distribution [
73]. Using the metalog family of distributions, the information is obtained from the knowledge base and not from the database. The difference is that in a database, the answers to questions are acquired by searching the database, while a knowledge base answers questions by running an inference algorithm. This approach is like asking the question: What if? Determining the probability for a given monthly amount of energy produced requires, based on the metalog, a simulation process that uses the determination of the inverse function of the cumulative distribution function [
74]. The GeNIe 4.1 Academic software has built-in families of metalog distributions and allows one to quickly determine the cumulative distribution function, probability density function, and it is a simple way of obtaining information from the knowledge base [
75].
Basic statistical calculations (
Table 1) show that in 2023 the minimum value of the energy produced monthly was 155.069 Wh, the maximum value was 855.710 Wh, and the average value of energy produced was 520.929 Wh with a standard deviation of 260.325 Wh. The metalog family of distributions also grants a more advanced statistical analysis including the determination of quantiles, as shown in
Table 2.
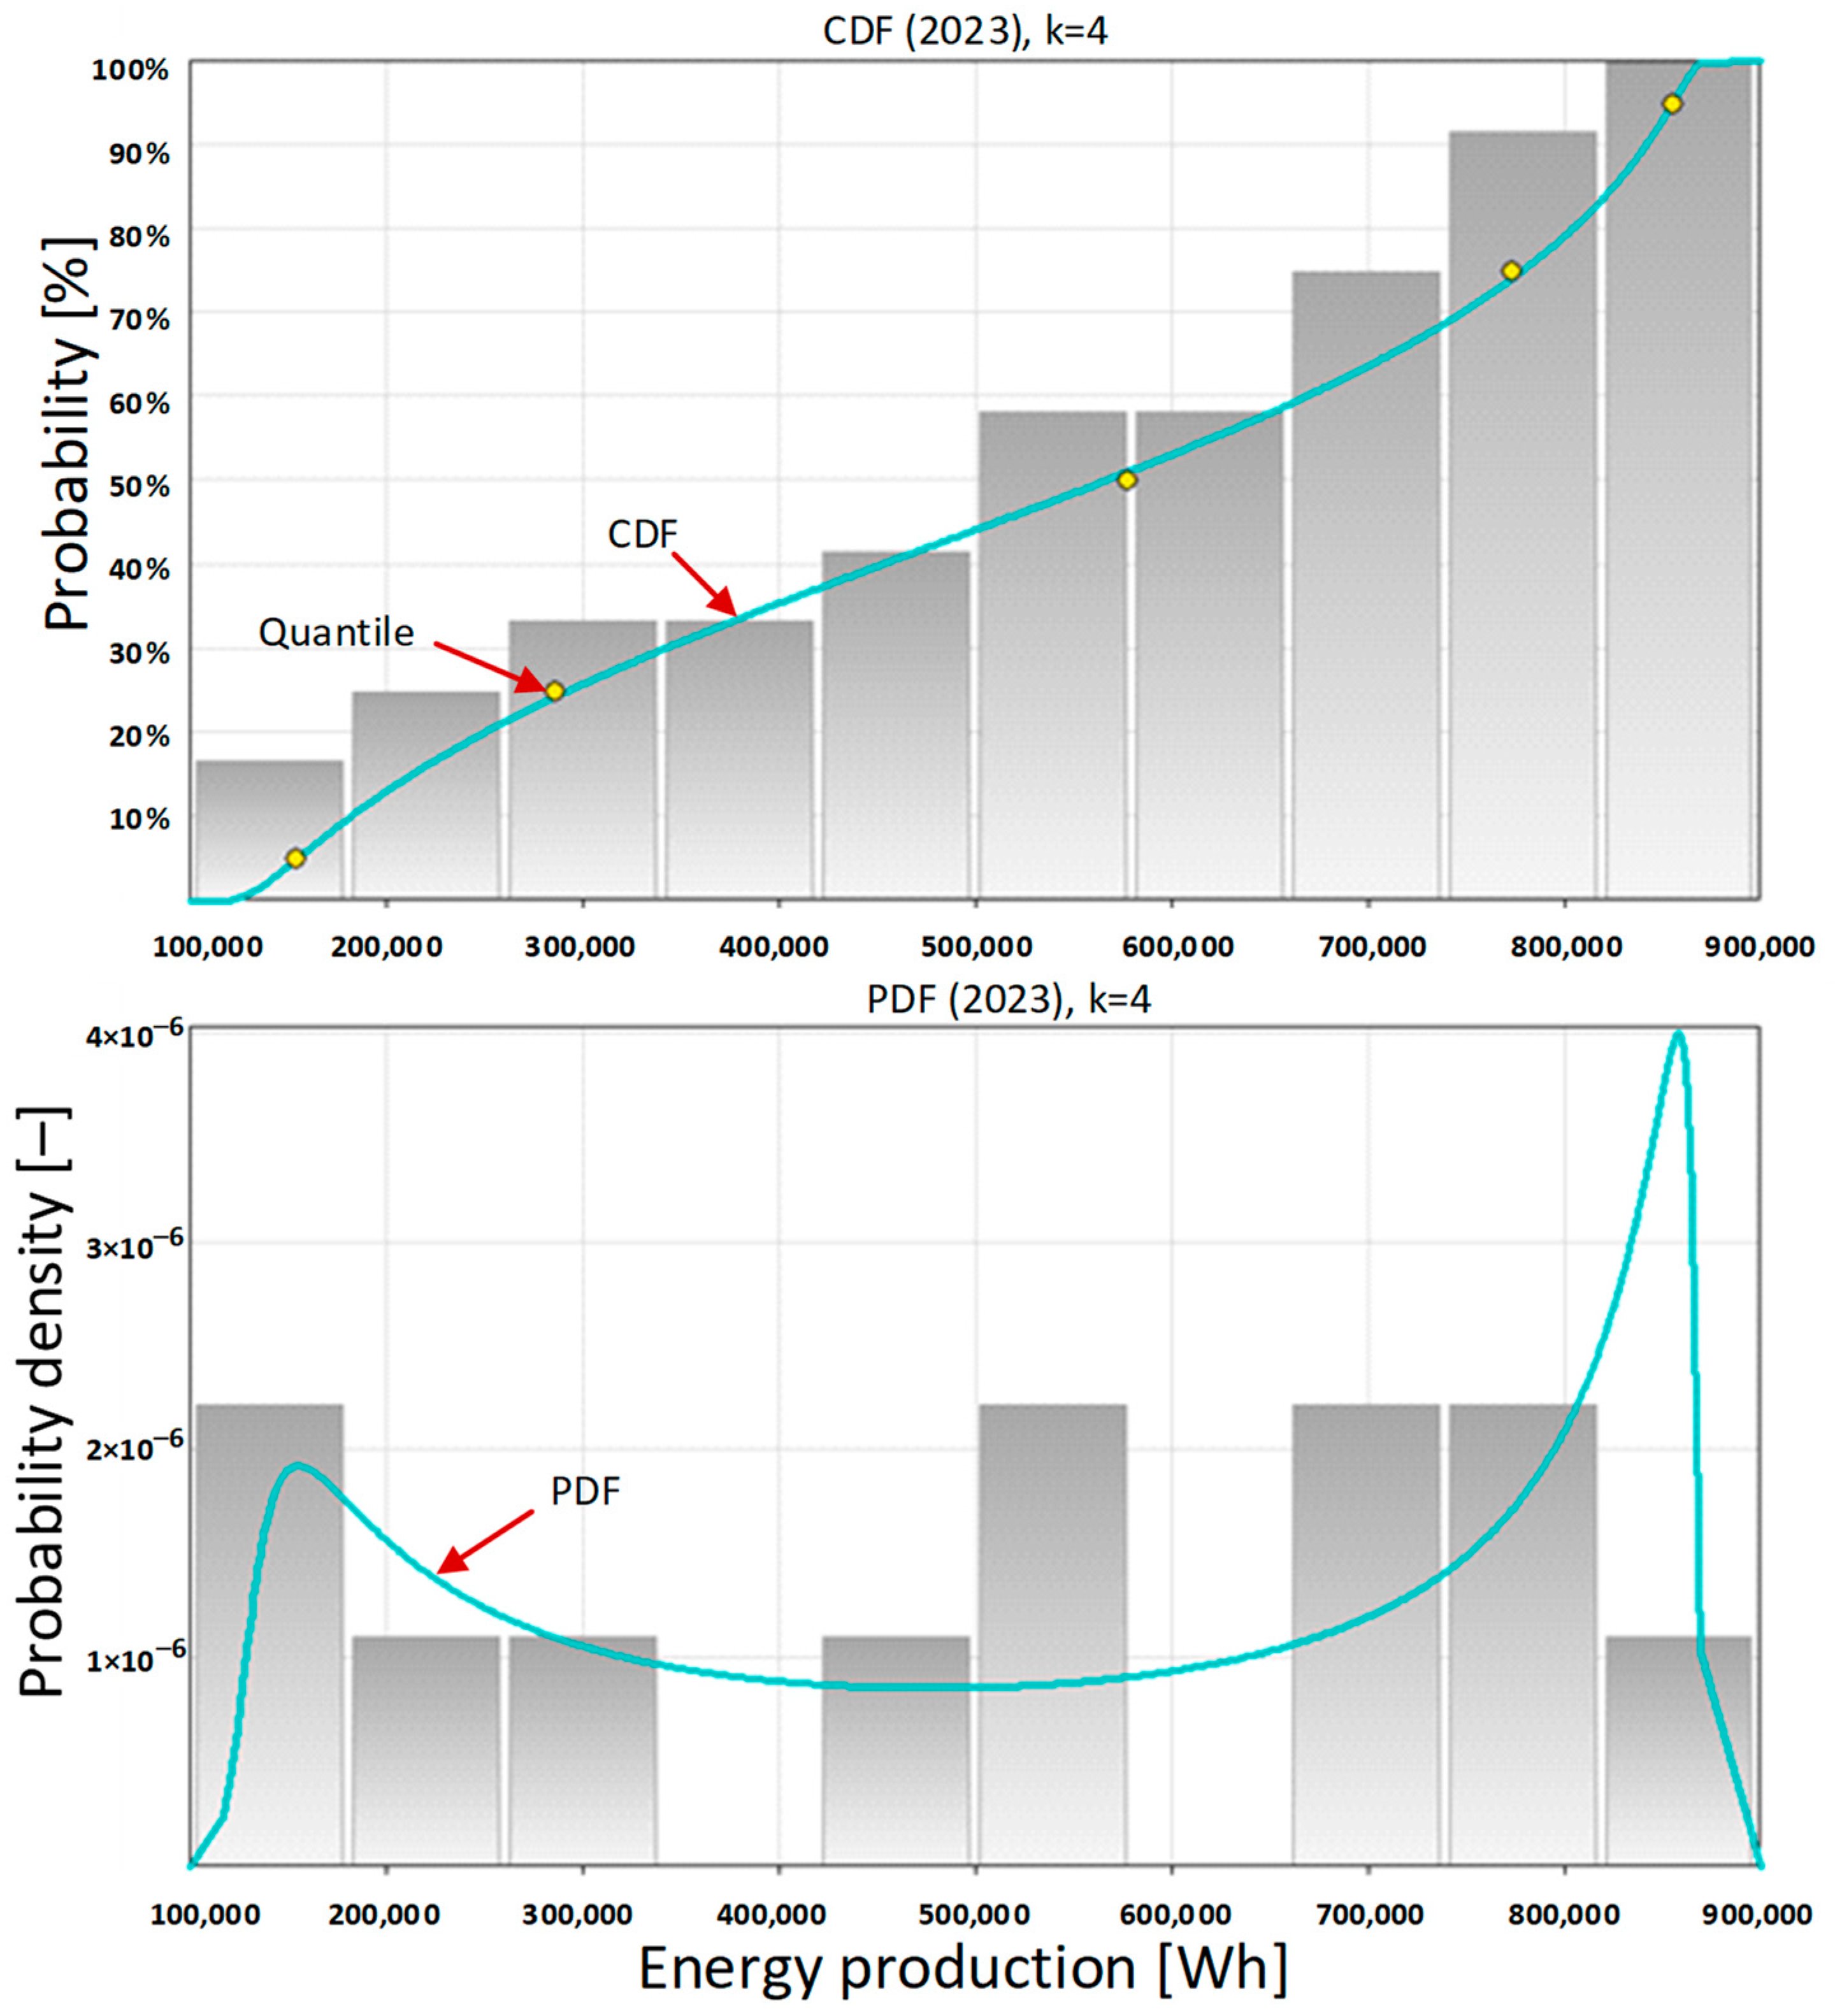
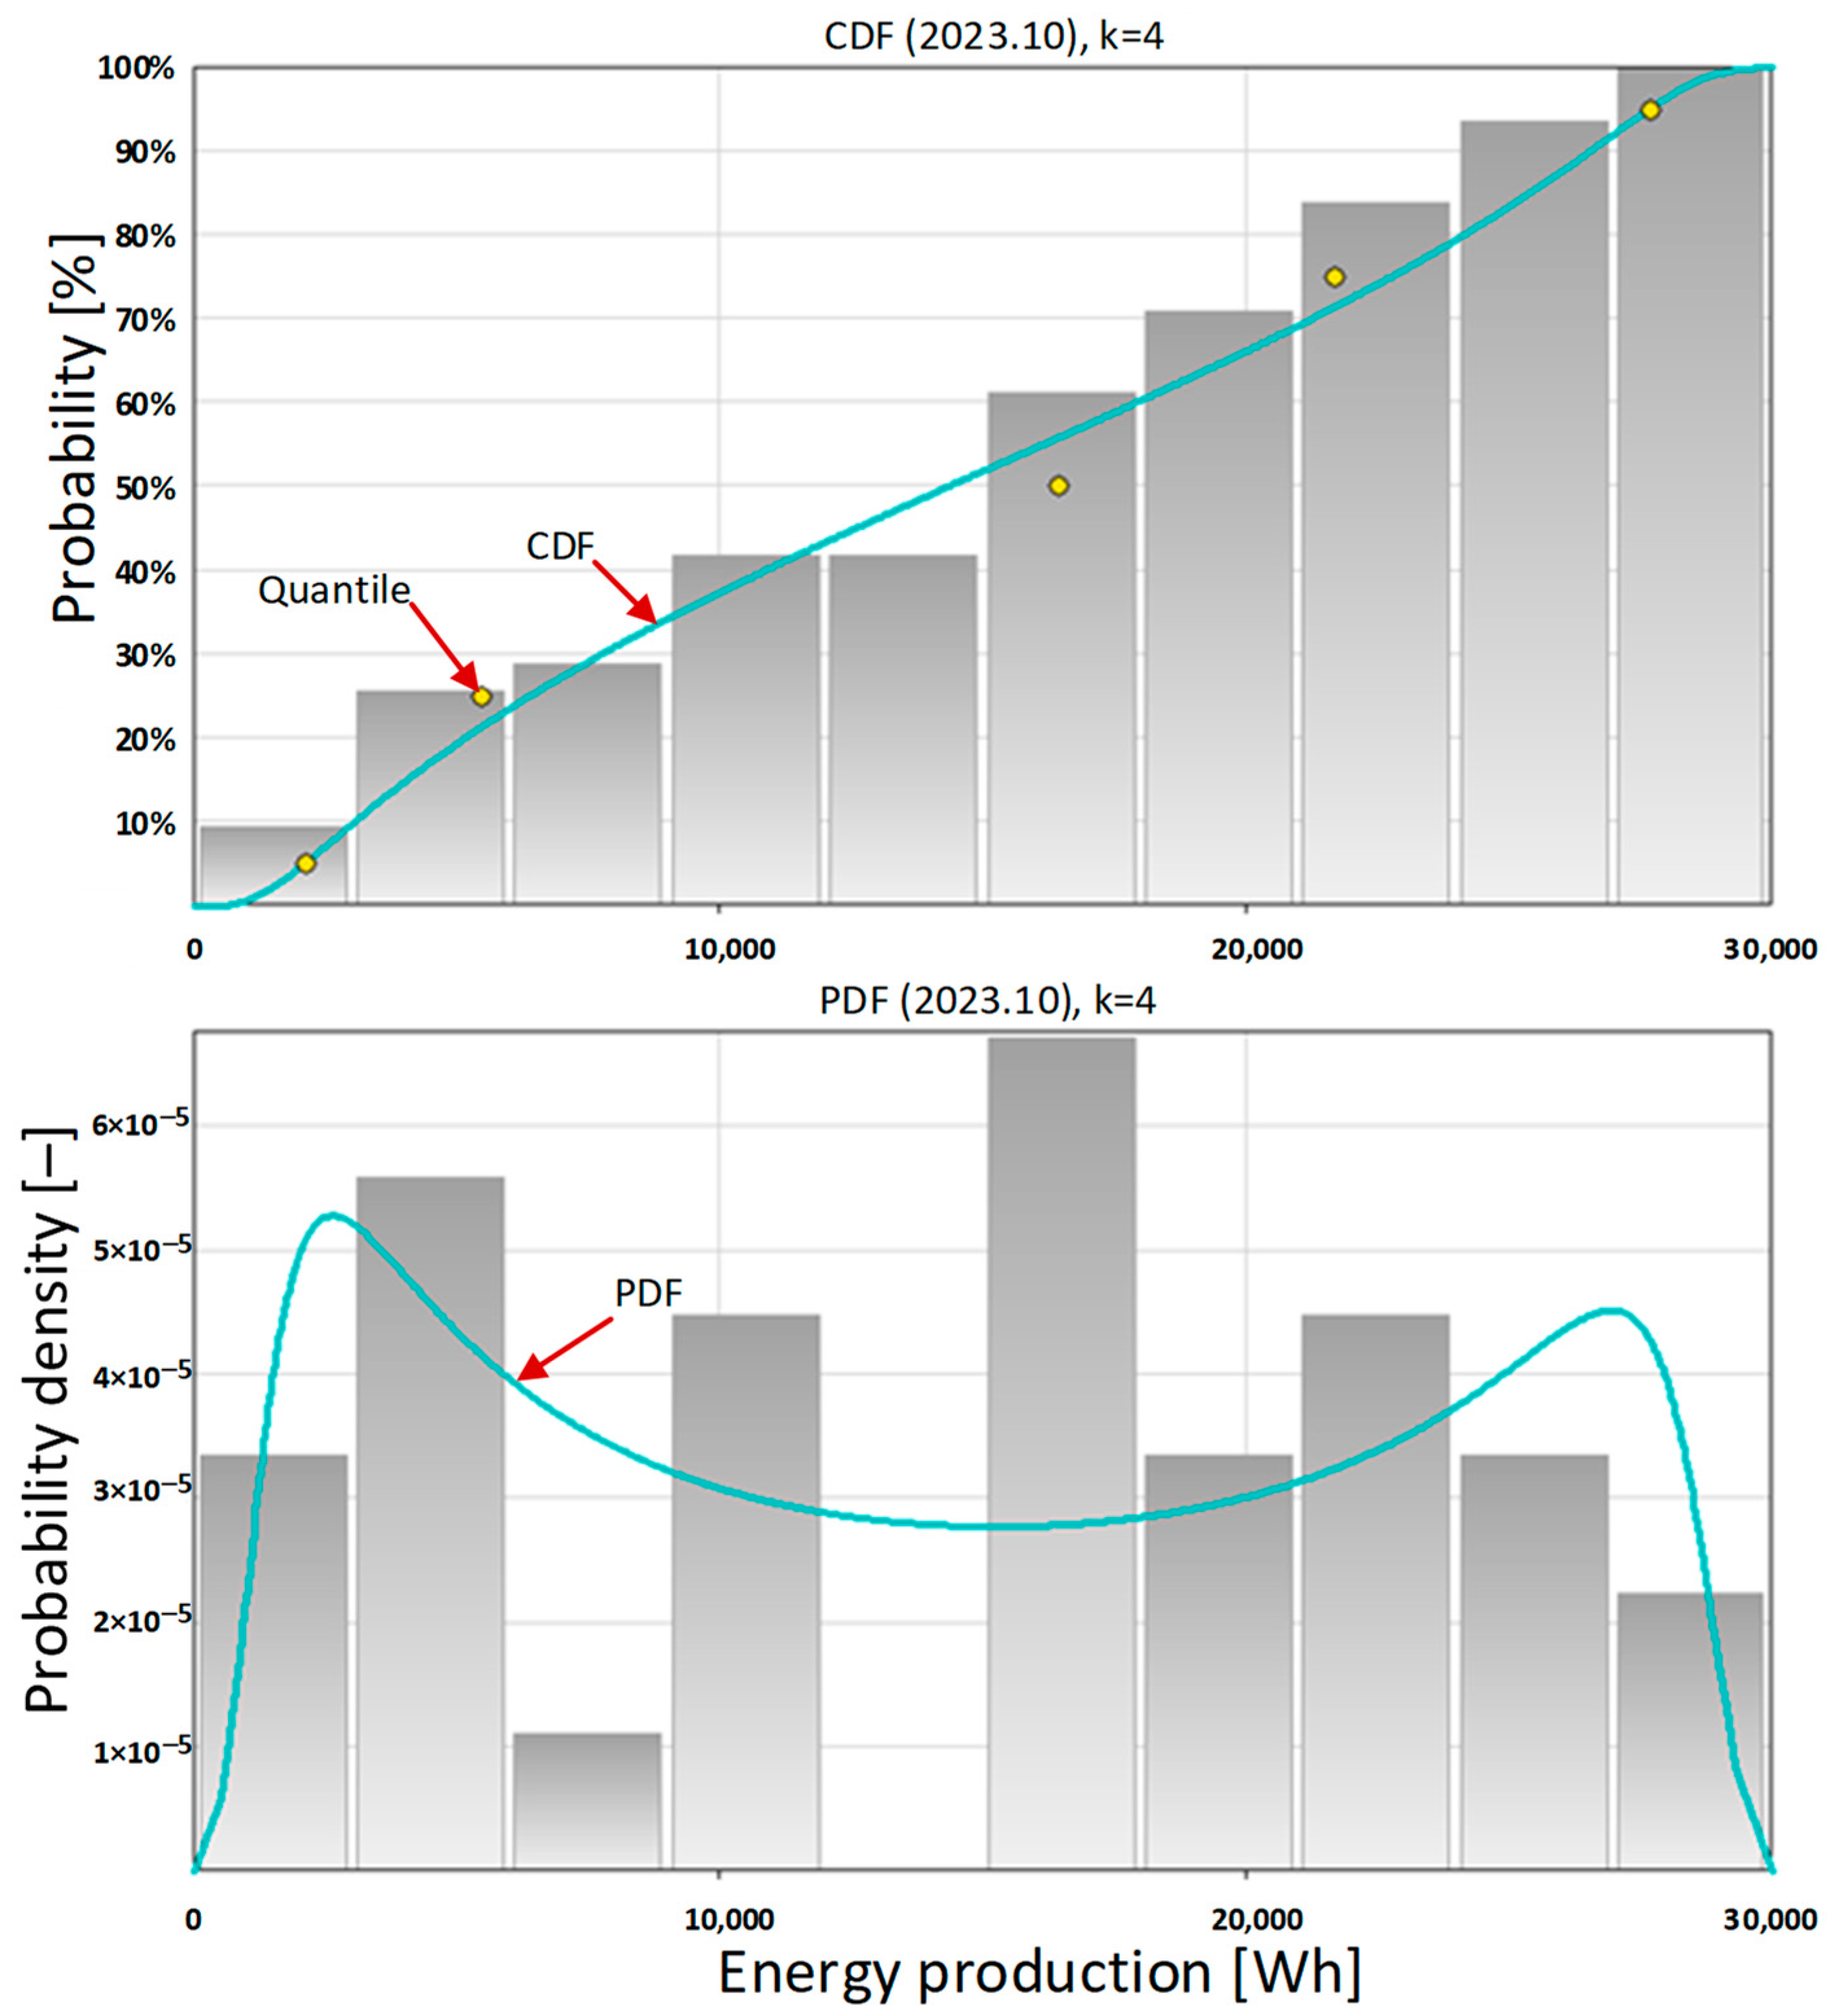
Then, the cumulative distribution function (
Figure 4, top) and the probability density function (
Figure 4, bottom) were determined. The metalog approach considers the composition of probability distributions [
76]. From the shape of the probability density function it can be concluded that there are several different contexts of carport operation. The first and most important context is the geographical one related to its location in Europe, and specifically in Poland. In the northern hemisphere and at this latitude there are different seasons, which results in a variable amount of solar radiation. In
Figure 4 (bottom), we can see that the probability density function has a bimodal profile. This results from the large monthly energy production by the photovoltaic system in the summer and a very small monthly energy production in the winter.
The GeNIe 4.0 Academic software allows one to easily use the knowledge base built in it. The bottom rows of
Table 2 provide answers to the question: What is the probability of monthly energy production being less than or equal to a given level?
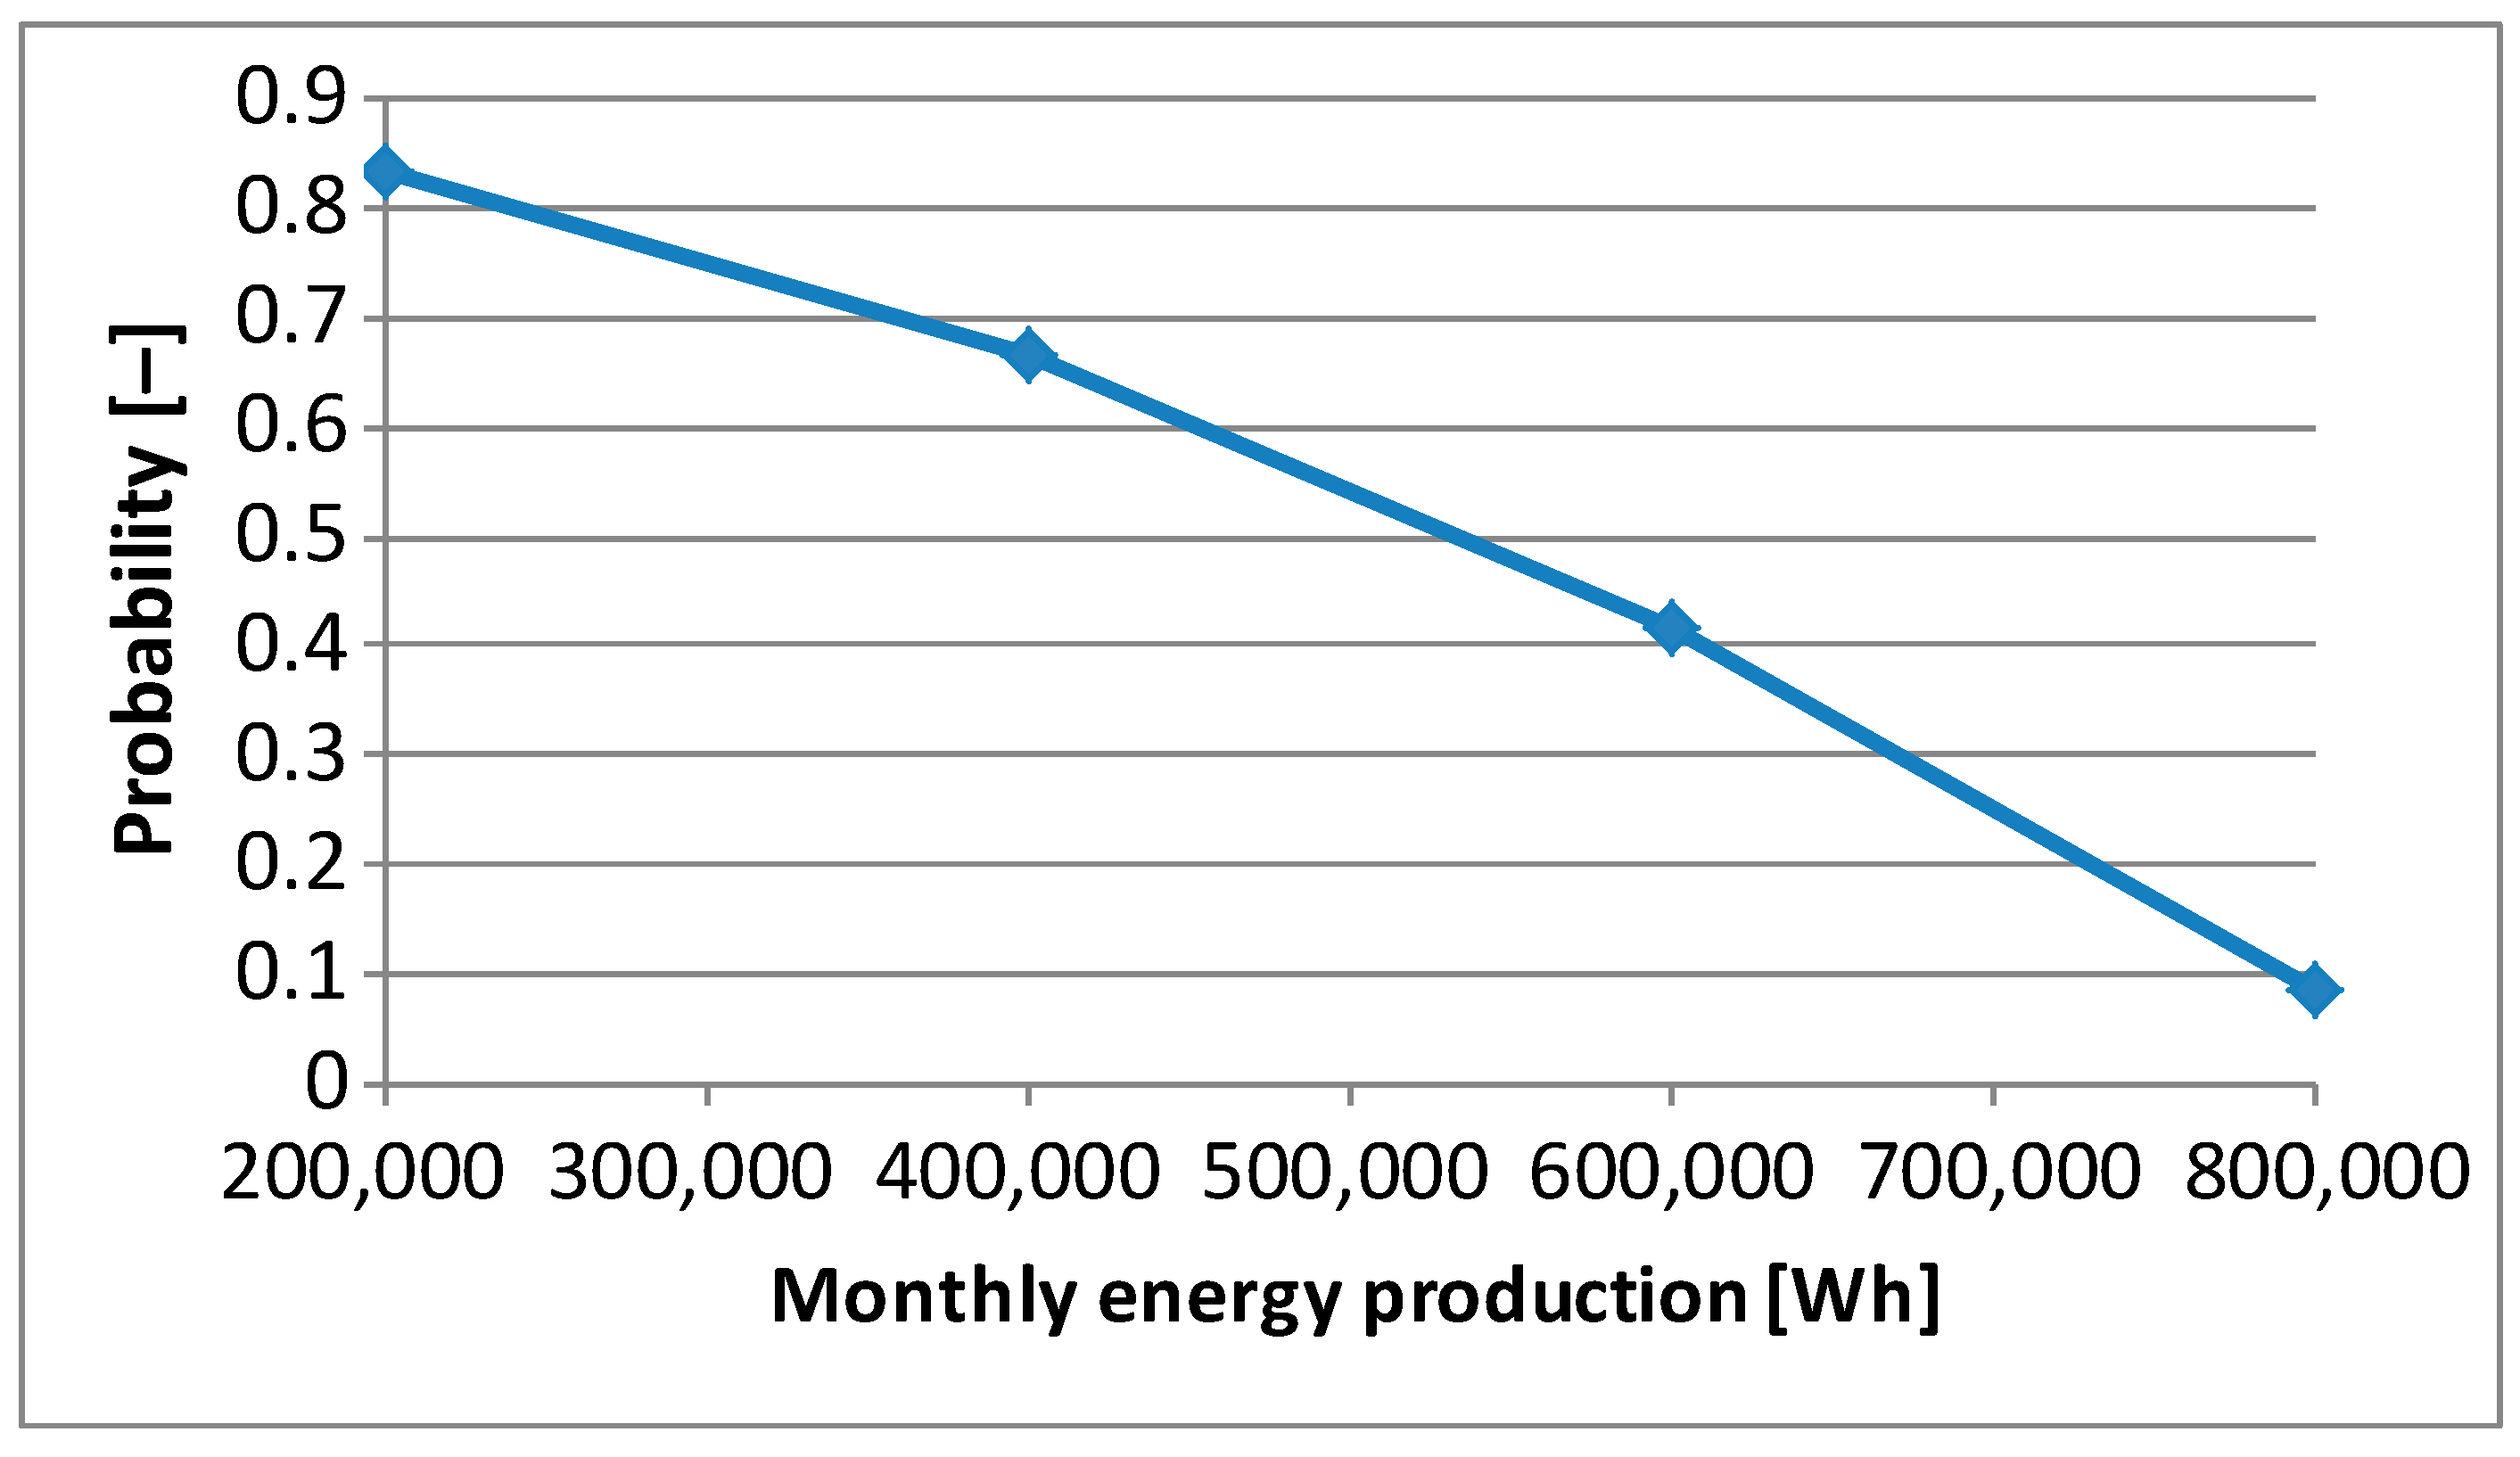
Figure 5 presents the probability of monthly energy production greater than a given level. Already on this basis, people managing the climate and energy transformation in a company can plan the production of green hydrogen. The owners of the photovoltaic system can count on a monthly electricity production of 500,000 Wh with a probability of slightly more than 0.5. This amount of energy is enough to produce 10 kg of hydrogen. With a probability of over 0.8, they can count on a monthly energy production of more than 200,000 Wh. But it is enough to produce only 4 kg of hydrogen. The information about the monthly amount of energy produced by a photovoltaic system is essential in energy management. Individual users and people managing electricity in companies often summarize the amount of energy consumed and payments for it on a monthly basis.
Calculating the probability of daily energy consumption in a given month can provide even more useful information in energy management. For this purpose, the data on the exact amount of energy produced on all days of each month in 2023 was obtained from the platform monitoring the performance of the photovoltaic system with a peak power of 6.15 kWp.
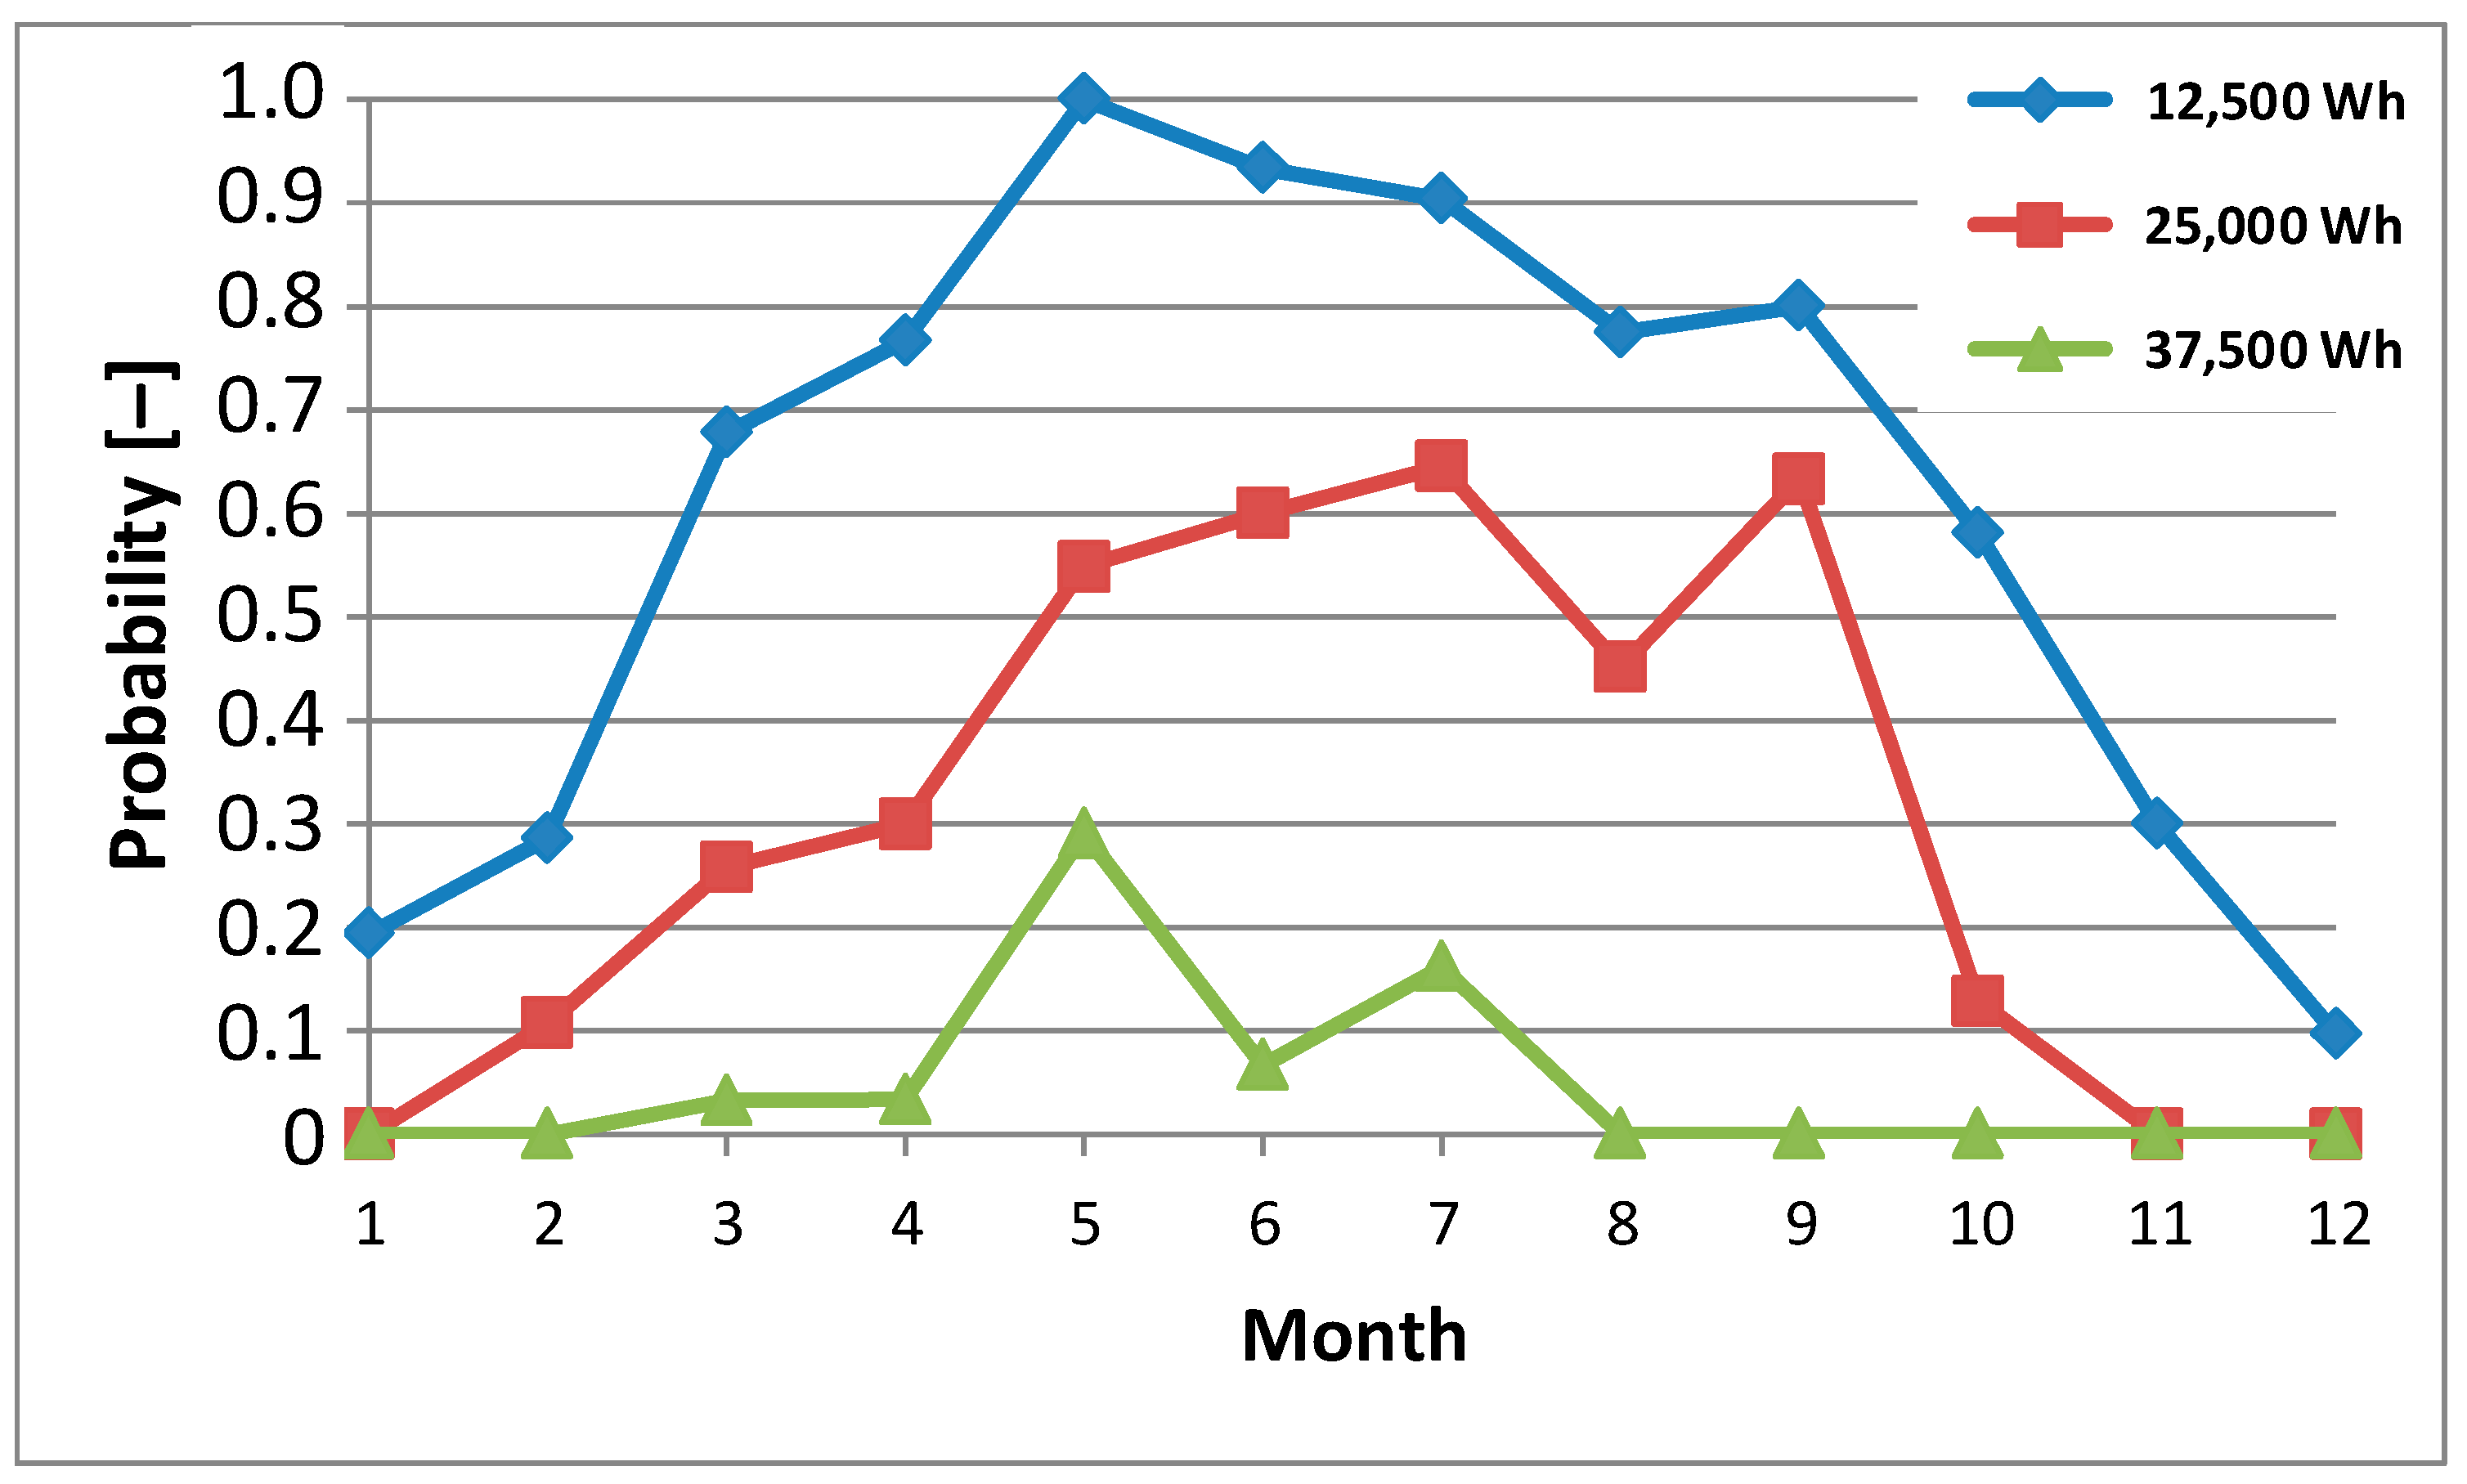
In 2023, January and December were characterized by the lowest monthly amount of energy produced by the photovoltaic system. However, this particular fact should not be generalized to all other photovoltaic systems located in Poland. Even within the borders of this European country, there may be significant differences in the amount of sunlight in individual regions, which translates into the amount of energy produced. During the winter months, the performance of the photovoltaic systems is also influenced by the amount of snowfall and the time it remains on the photovoltaic panels. In general, the performance of photovoltaic systems is also influenced by the air temperature. There are sunny and frosty winter days when it is possible to generate slightly larger amounts of energy. However, the sun being low above the horizon (unfavorable angle of incidence) and the short day make these amounts exceptionally small when compared to the results in summer. In January 2023, the probability of producing a daily amount of energy less than or equal to 12,500 Wh is 0.8065. Therefore, the probability of producing more than 12,500 Wh of energy per day is 1 − 0.8065 = 0.1935. This means that the probability of producing the amount of energy needed to produce ¼ kg of hydrogen in January is less than 20%.
Basic statistical data (
Table 3) and extended statistical data (
Table 4) of the amount of energy produced daily by the photovoltaic system in February 2023 clearly confirm that the owners of the photovoltaic system can count on almost twice the monthly amount of energy being produced.
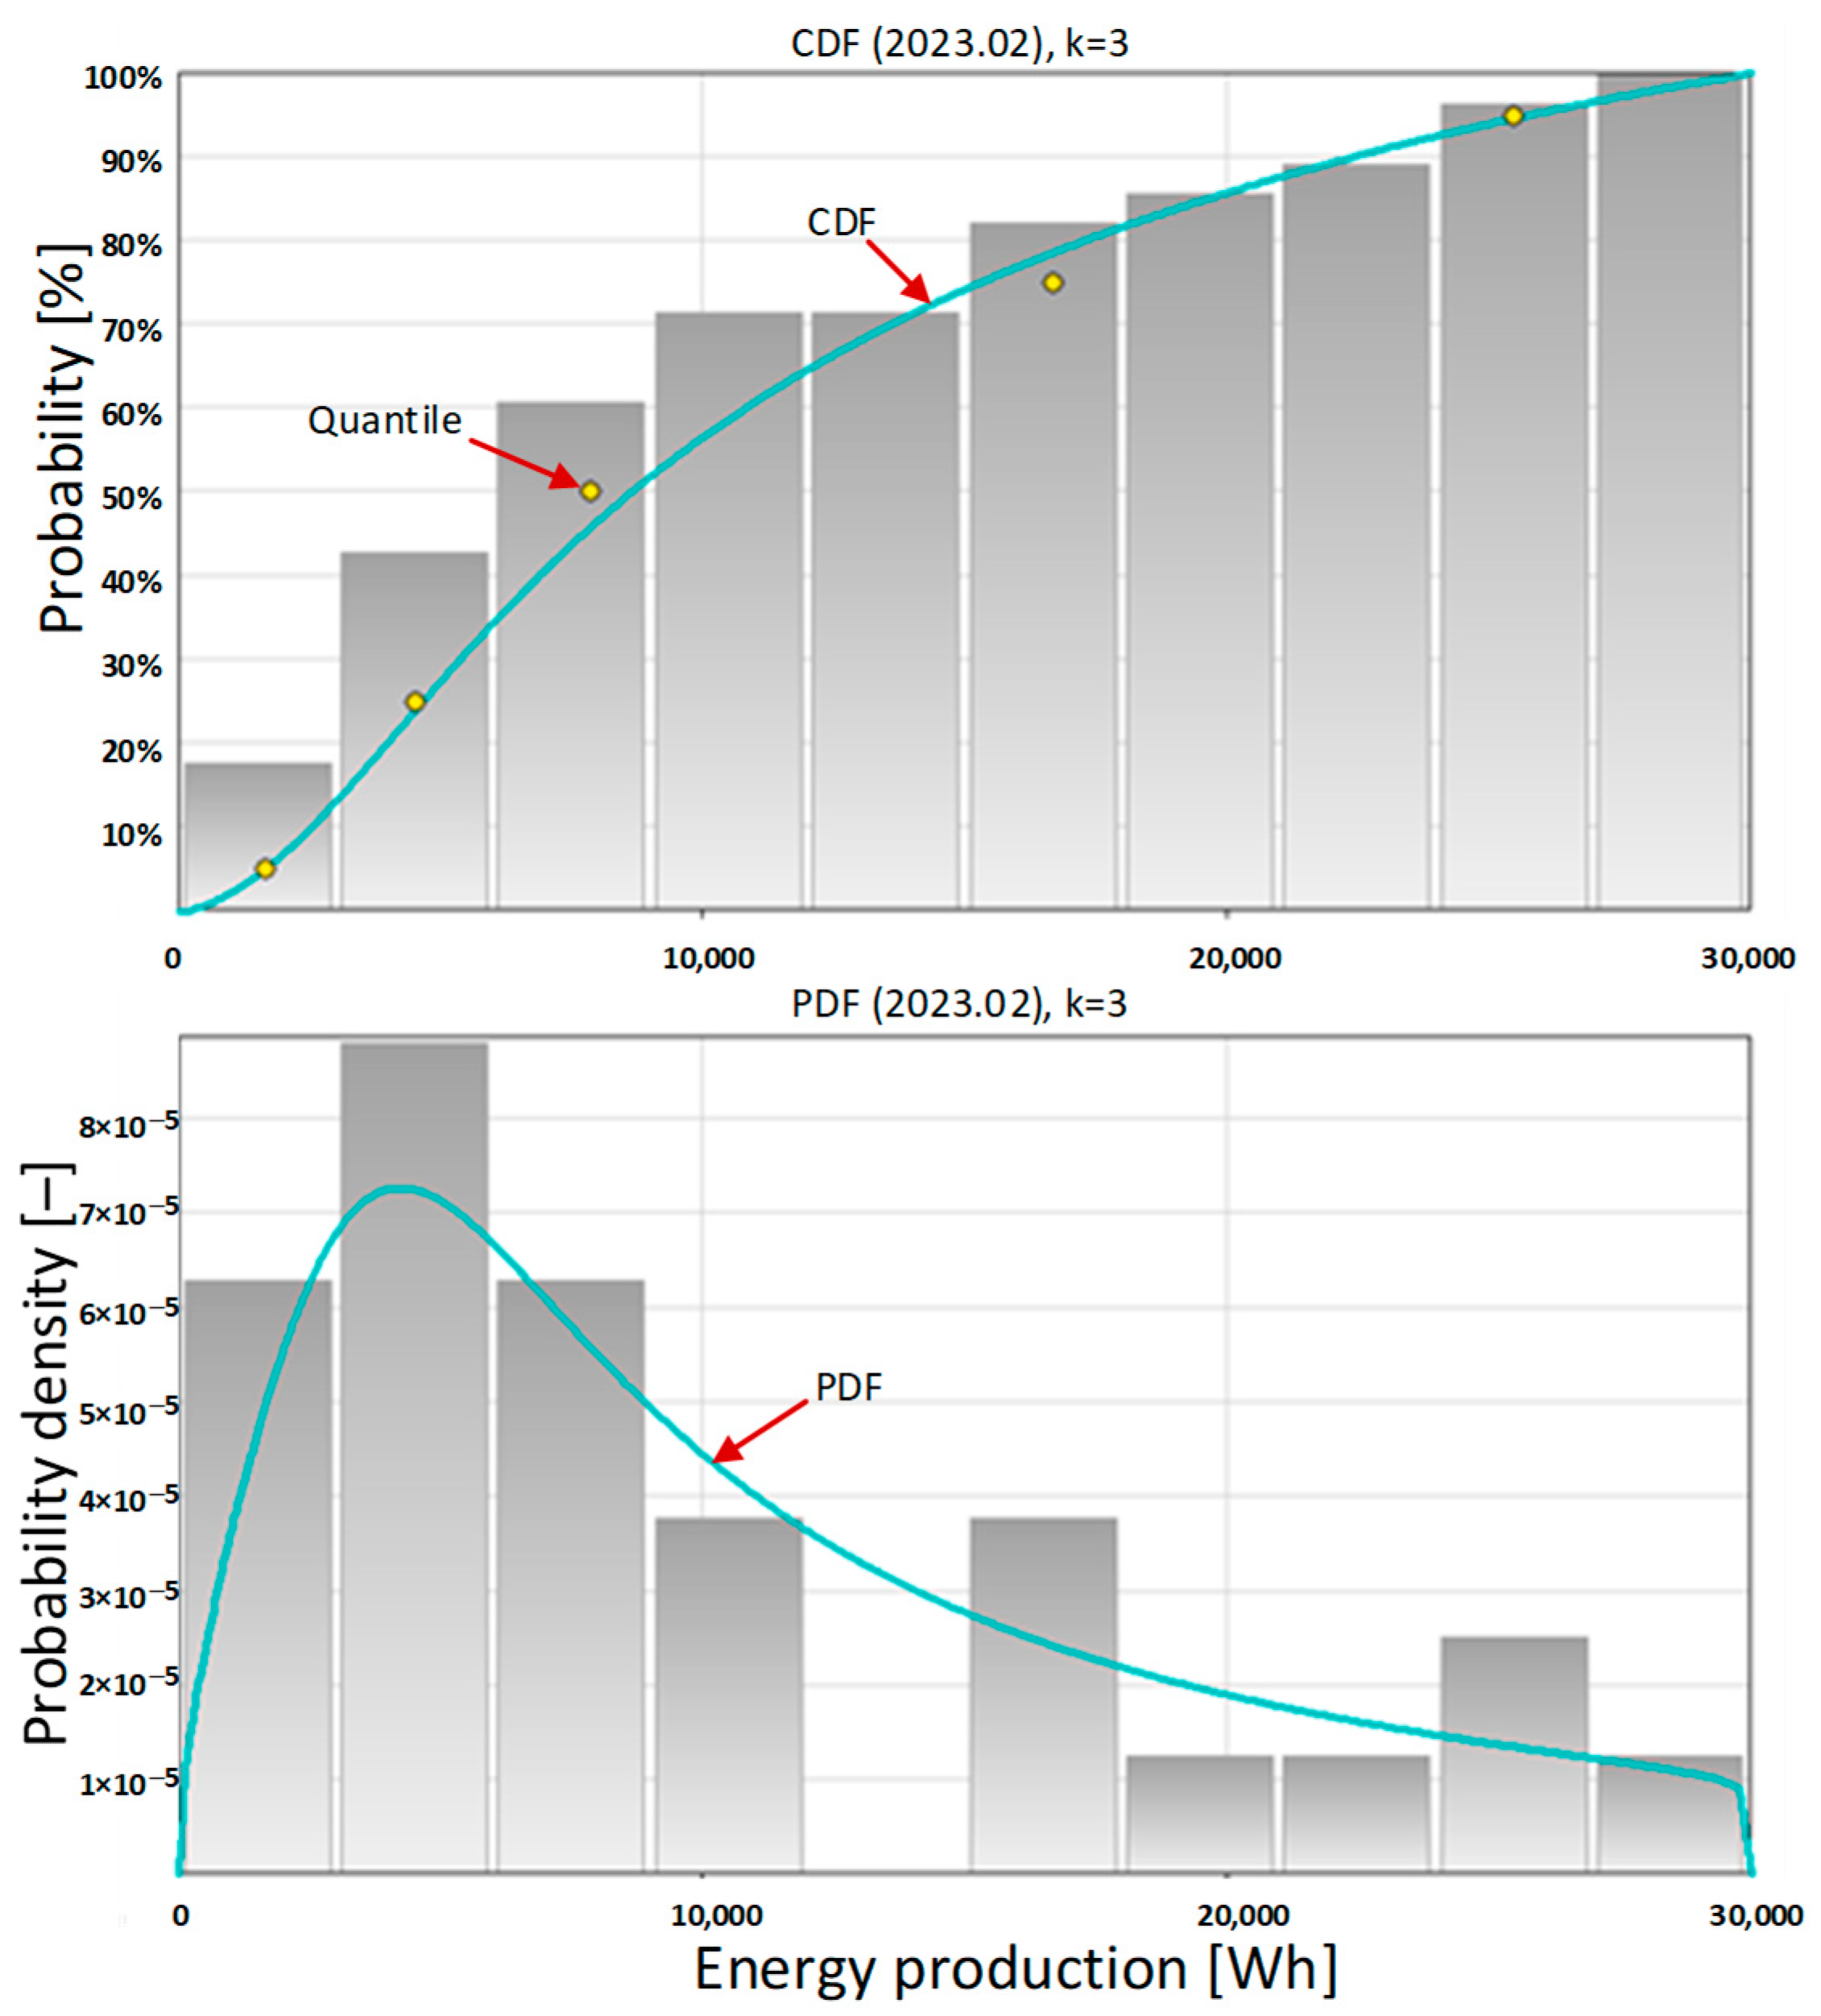
The most information about the amount of energy produced by the photovoltaic system on individual days of the month is provided by the shape of the probability density function (
Figure 6, below). The probability density function takes its highest values for the amount of energy produced as less than 10,000 Wh. The maximum PDF is for approximately 5000 Wh, which indicates small amounts of energy produced daily throughout the month. With low probability, the system is capable of producing 12,500 Wh and 25,000 Wh of energy per day, which correspond to the production of ¼ and ½ kg of hydrogen.
In March, calendar spring begins in the Polish geographical and climatic conditions. In
Table 5, the minimum value of energy produced is 1251 Wh, and the maximum is 37,700 Wh. The average value is 17,187.5 Wh and the standard deviation is large and amounts to 9915.87 Wh, indicating a high variability in sunlight in this month. Extended statistical data on amount of energy produced daily by the photovoltaic system in March 2023 are presented in
Table 6.
The large variability in the amount of energy produced translates into a clear bimodal profile of the probability density function (PDF), which is visible in
Figure 7 (bottom). This profile of the function clearly indicates that the owner of the photovoltaic system can expect either very small or large daily amounts of electricity produced in this month. These large amounts of energy produced are possible due to the positive impact of low temperatures on the amount of energy produced by photovoltaic systems. In this context, the location of the photovoltaic installation is also important. Installations mounted on the roofs of buildings are cooled the least, while those mounted on the ground and, preferably, on car ports, are slightly better cooled.
Table 7 contains the data on the probability of generating individual amounts of energy per day from the photovoltaic system. The data were obtained from the knowledge base for all months. In the next section they are presented and discussed in detail.
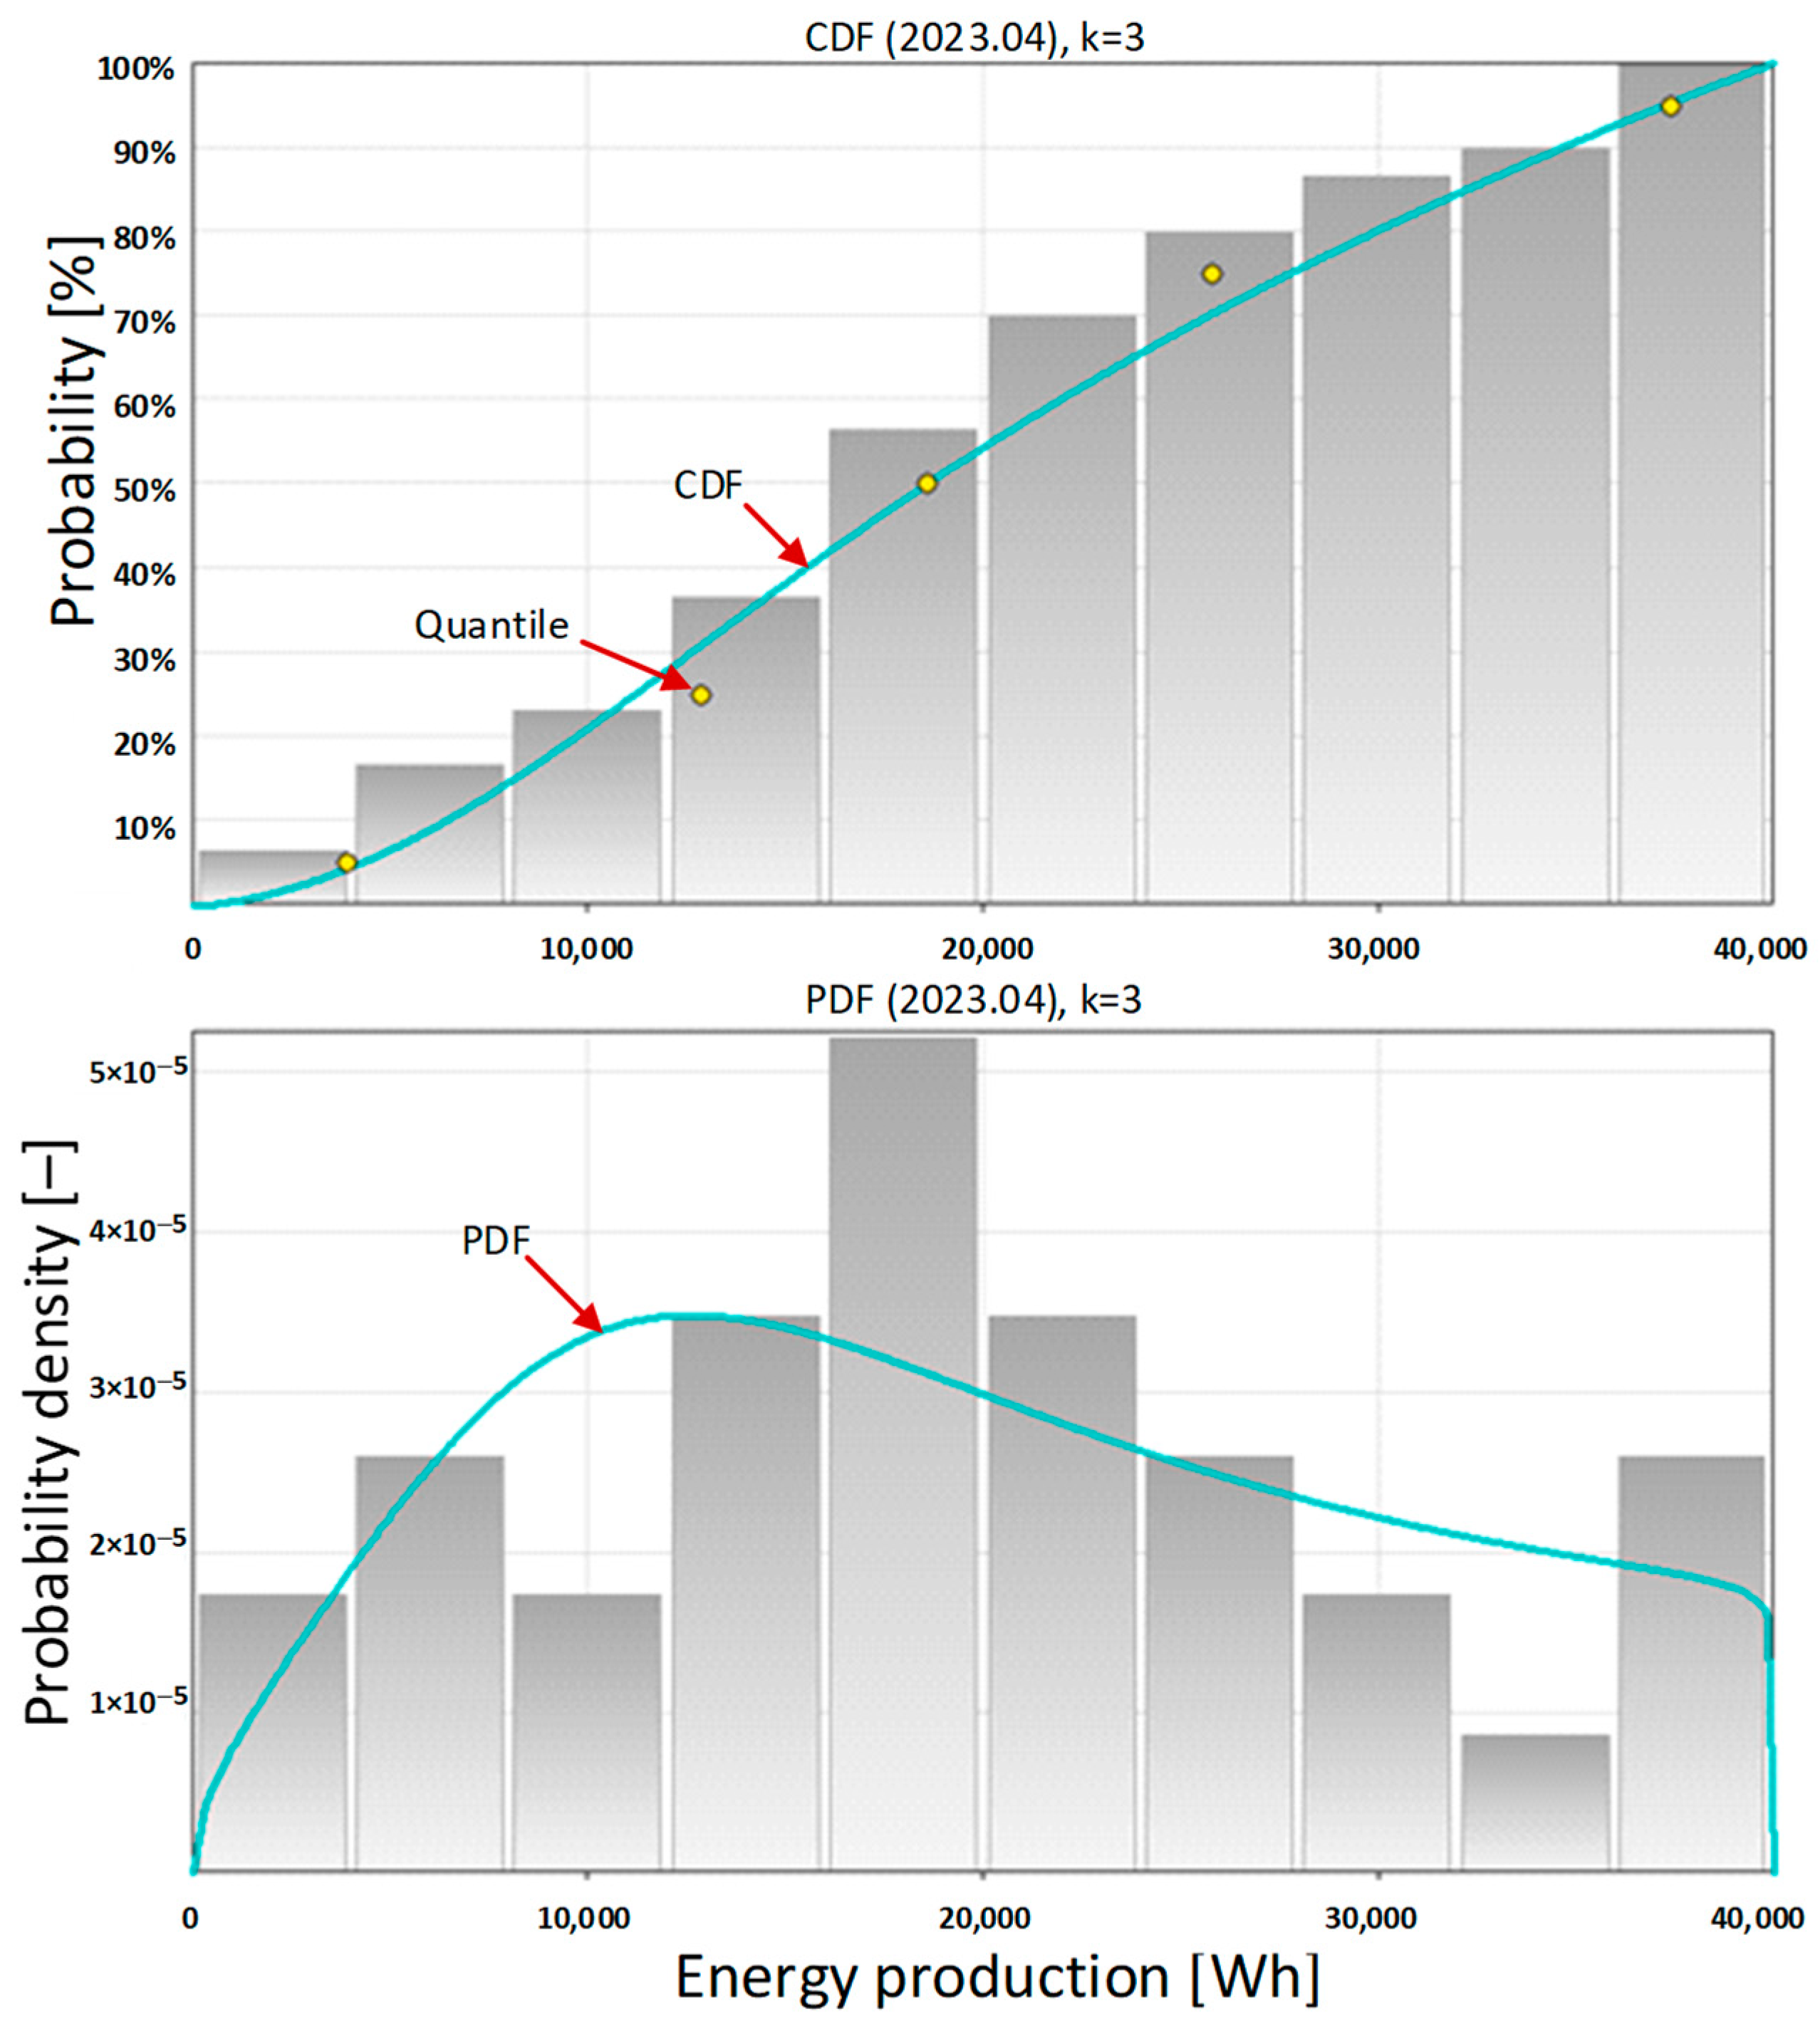
In April, the weather conditions were very similar to those in March, which resulted in a very similar performance of the photovoltaic system. This is confirmed by both basic statistical data and extended statistical data of the amount of energy produced daily by the photovoltaic system, presented in
Table 8 and
Table 9.
The probability density function (PDF) has only one optimum in this month for an energy value of over 10,000 Wh. Shown in
Figure 8, the PDF shape indicates significant amounts of energy produced every day.
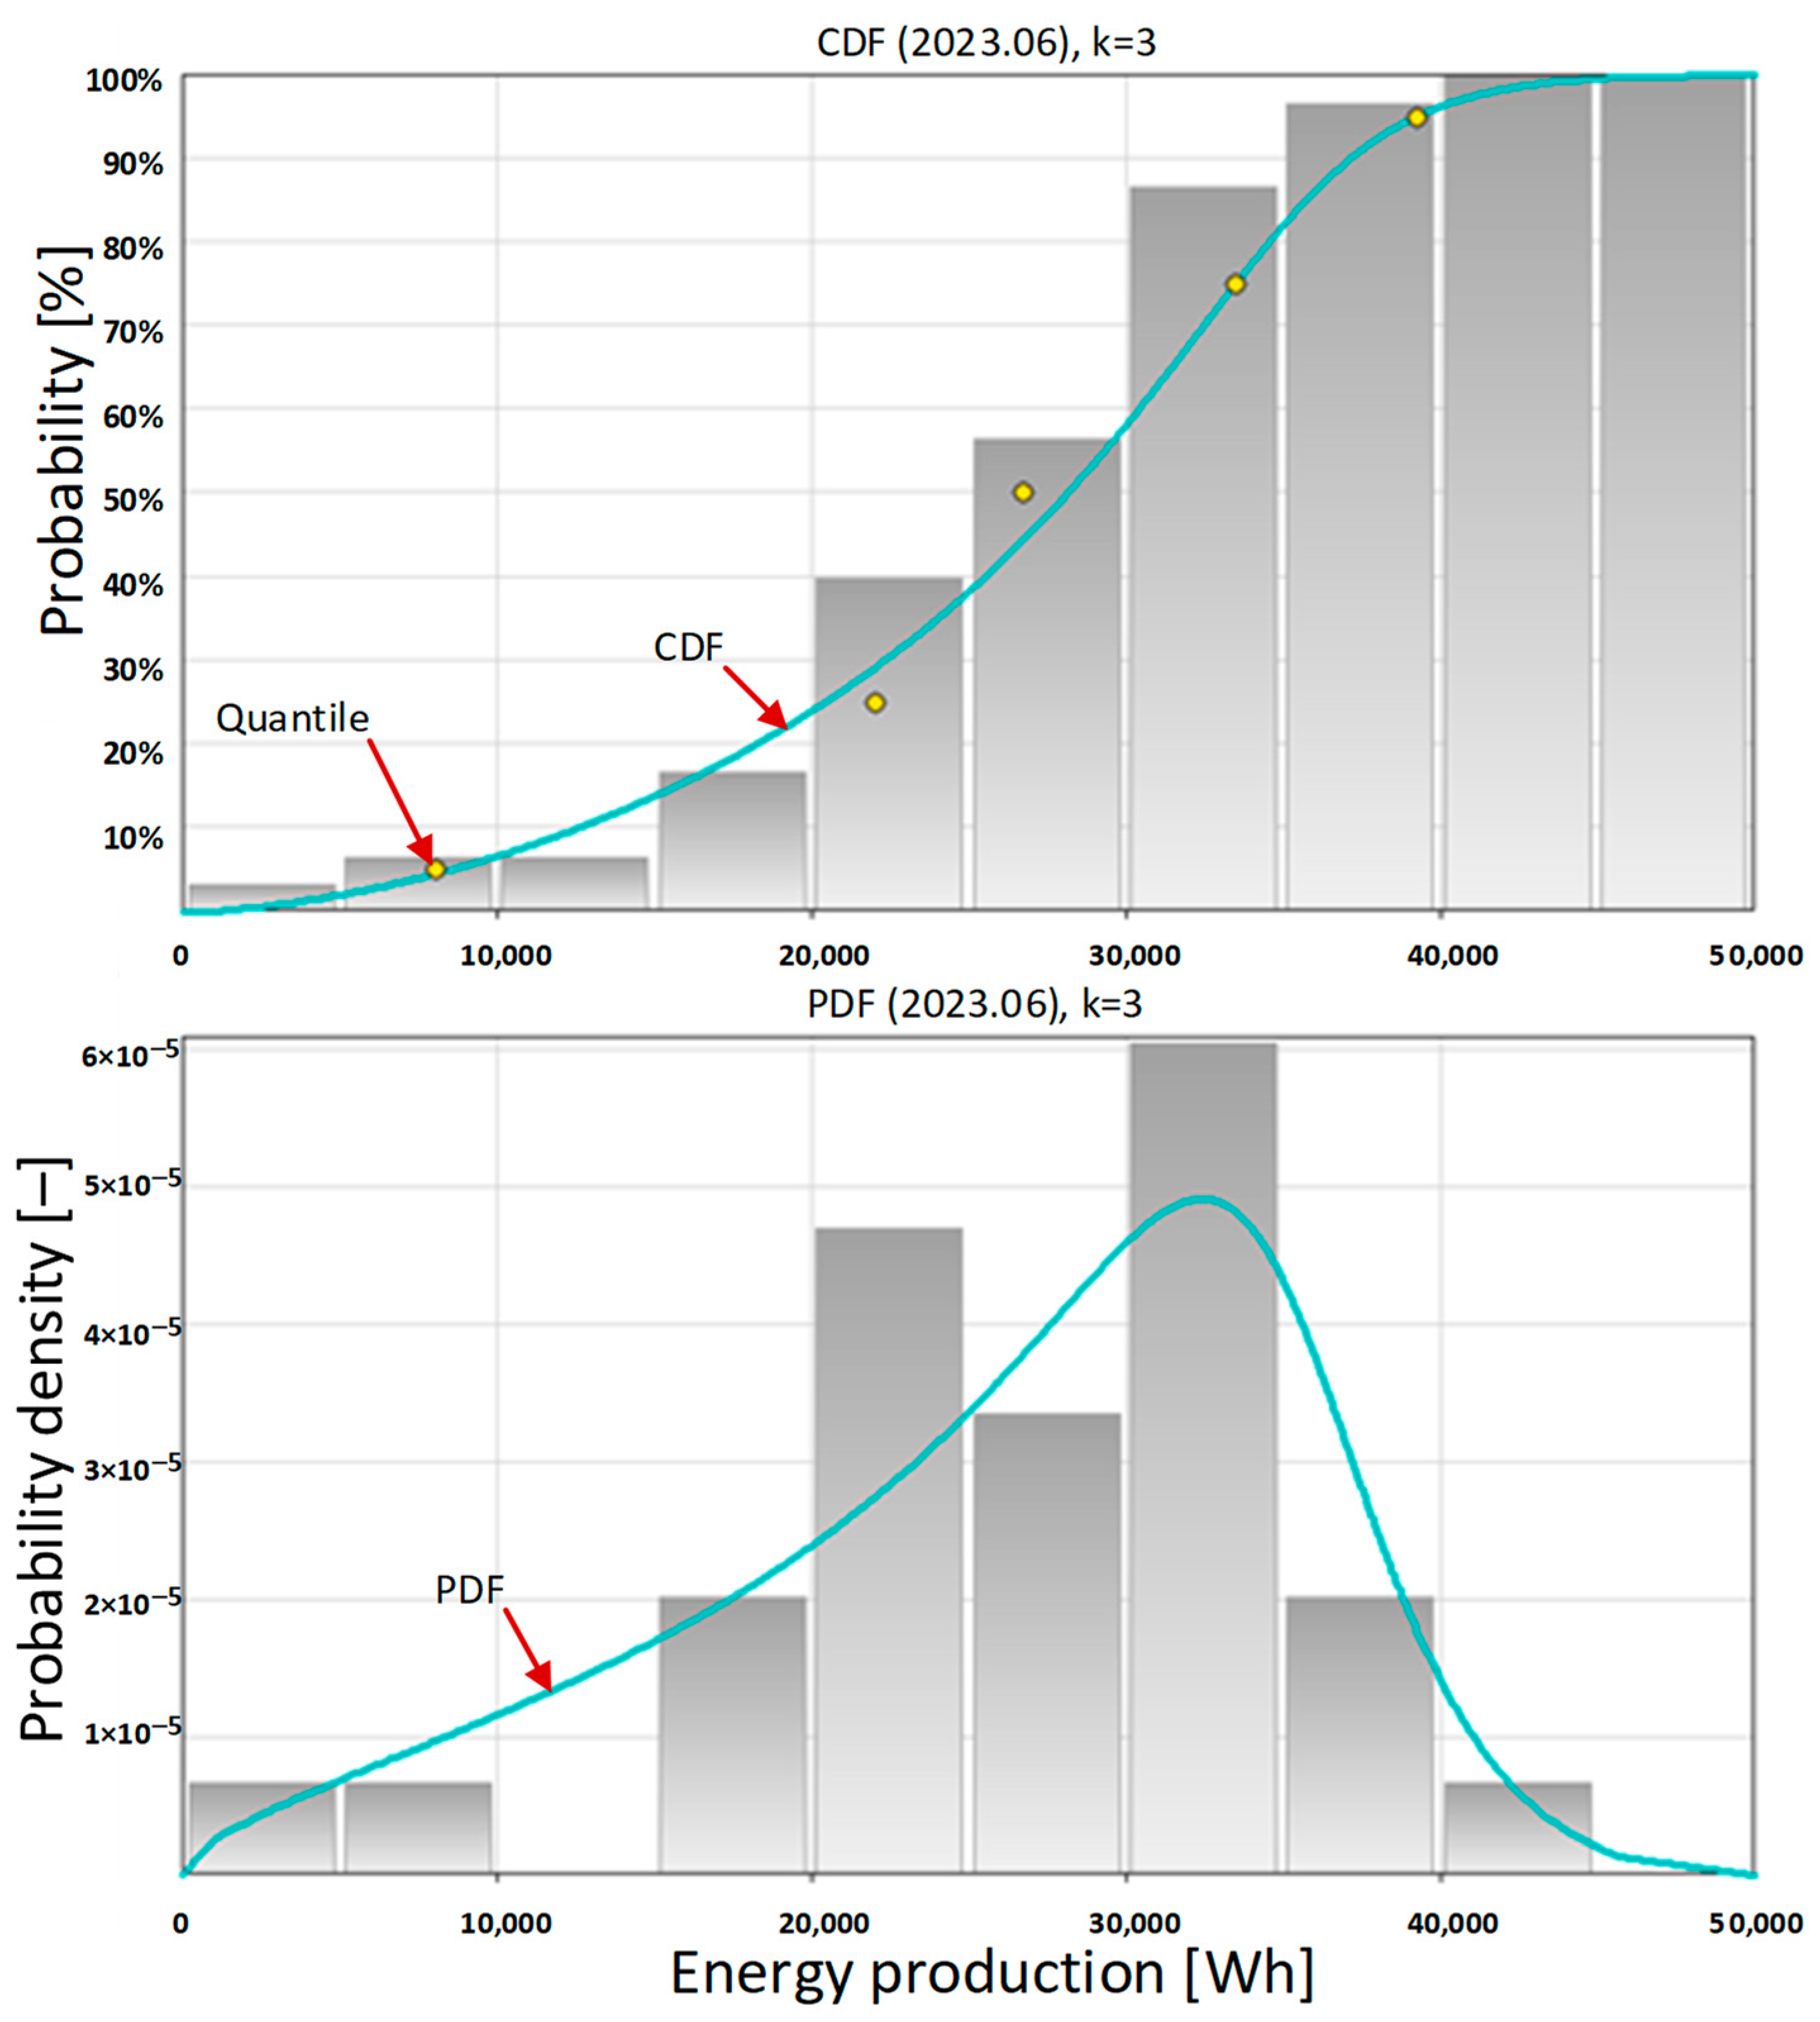
Another month that is worth examining is June. In the Polish geographical and climatic conditions, it is the beginning of summer. As shown by the basic statistical data presented in
Table 10, for the first time in 2023, in June, the amount of energy produced per day exceeded 40,000 Wh. This is due to the sun being the highest above the horizon during the year and the longest days of the year. Extended statistical data on amount of energy produced daily by the photovoltaic system in June 2023 are presented in
Table 11.
The probability density function (PDF) for the month of June has a clear maximum for daily energy production of over 30,000 Wh (
Figure 9 bottom). It is also evident that the number of days with a low amount of energy generated is small.
Favorable conditions for the production of energy from photovoltaic systems in Poland occur from May to September. In October, just as in March, the probability density function (
Figure 10, bottom) is characterized by bimodality. One of the peaks occurs for very small amounts of energy produced per day, approximately 2000 Wh, and the other for large amounts of energy produced, approximately 28,000 Wh.
In November and December, it is usually no longer possible to count on large amounts of energy being produced by photovoltaic systems in Poland.
5. Discussion
The probability of generating individual levels of daily produced energy in individual months of 2023 by a photovoltaic system with a peak power of 6.15 kWp is shown in
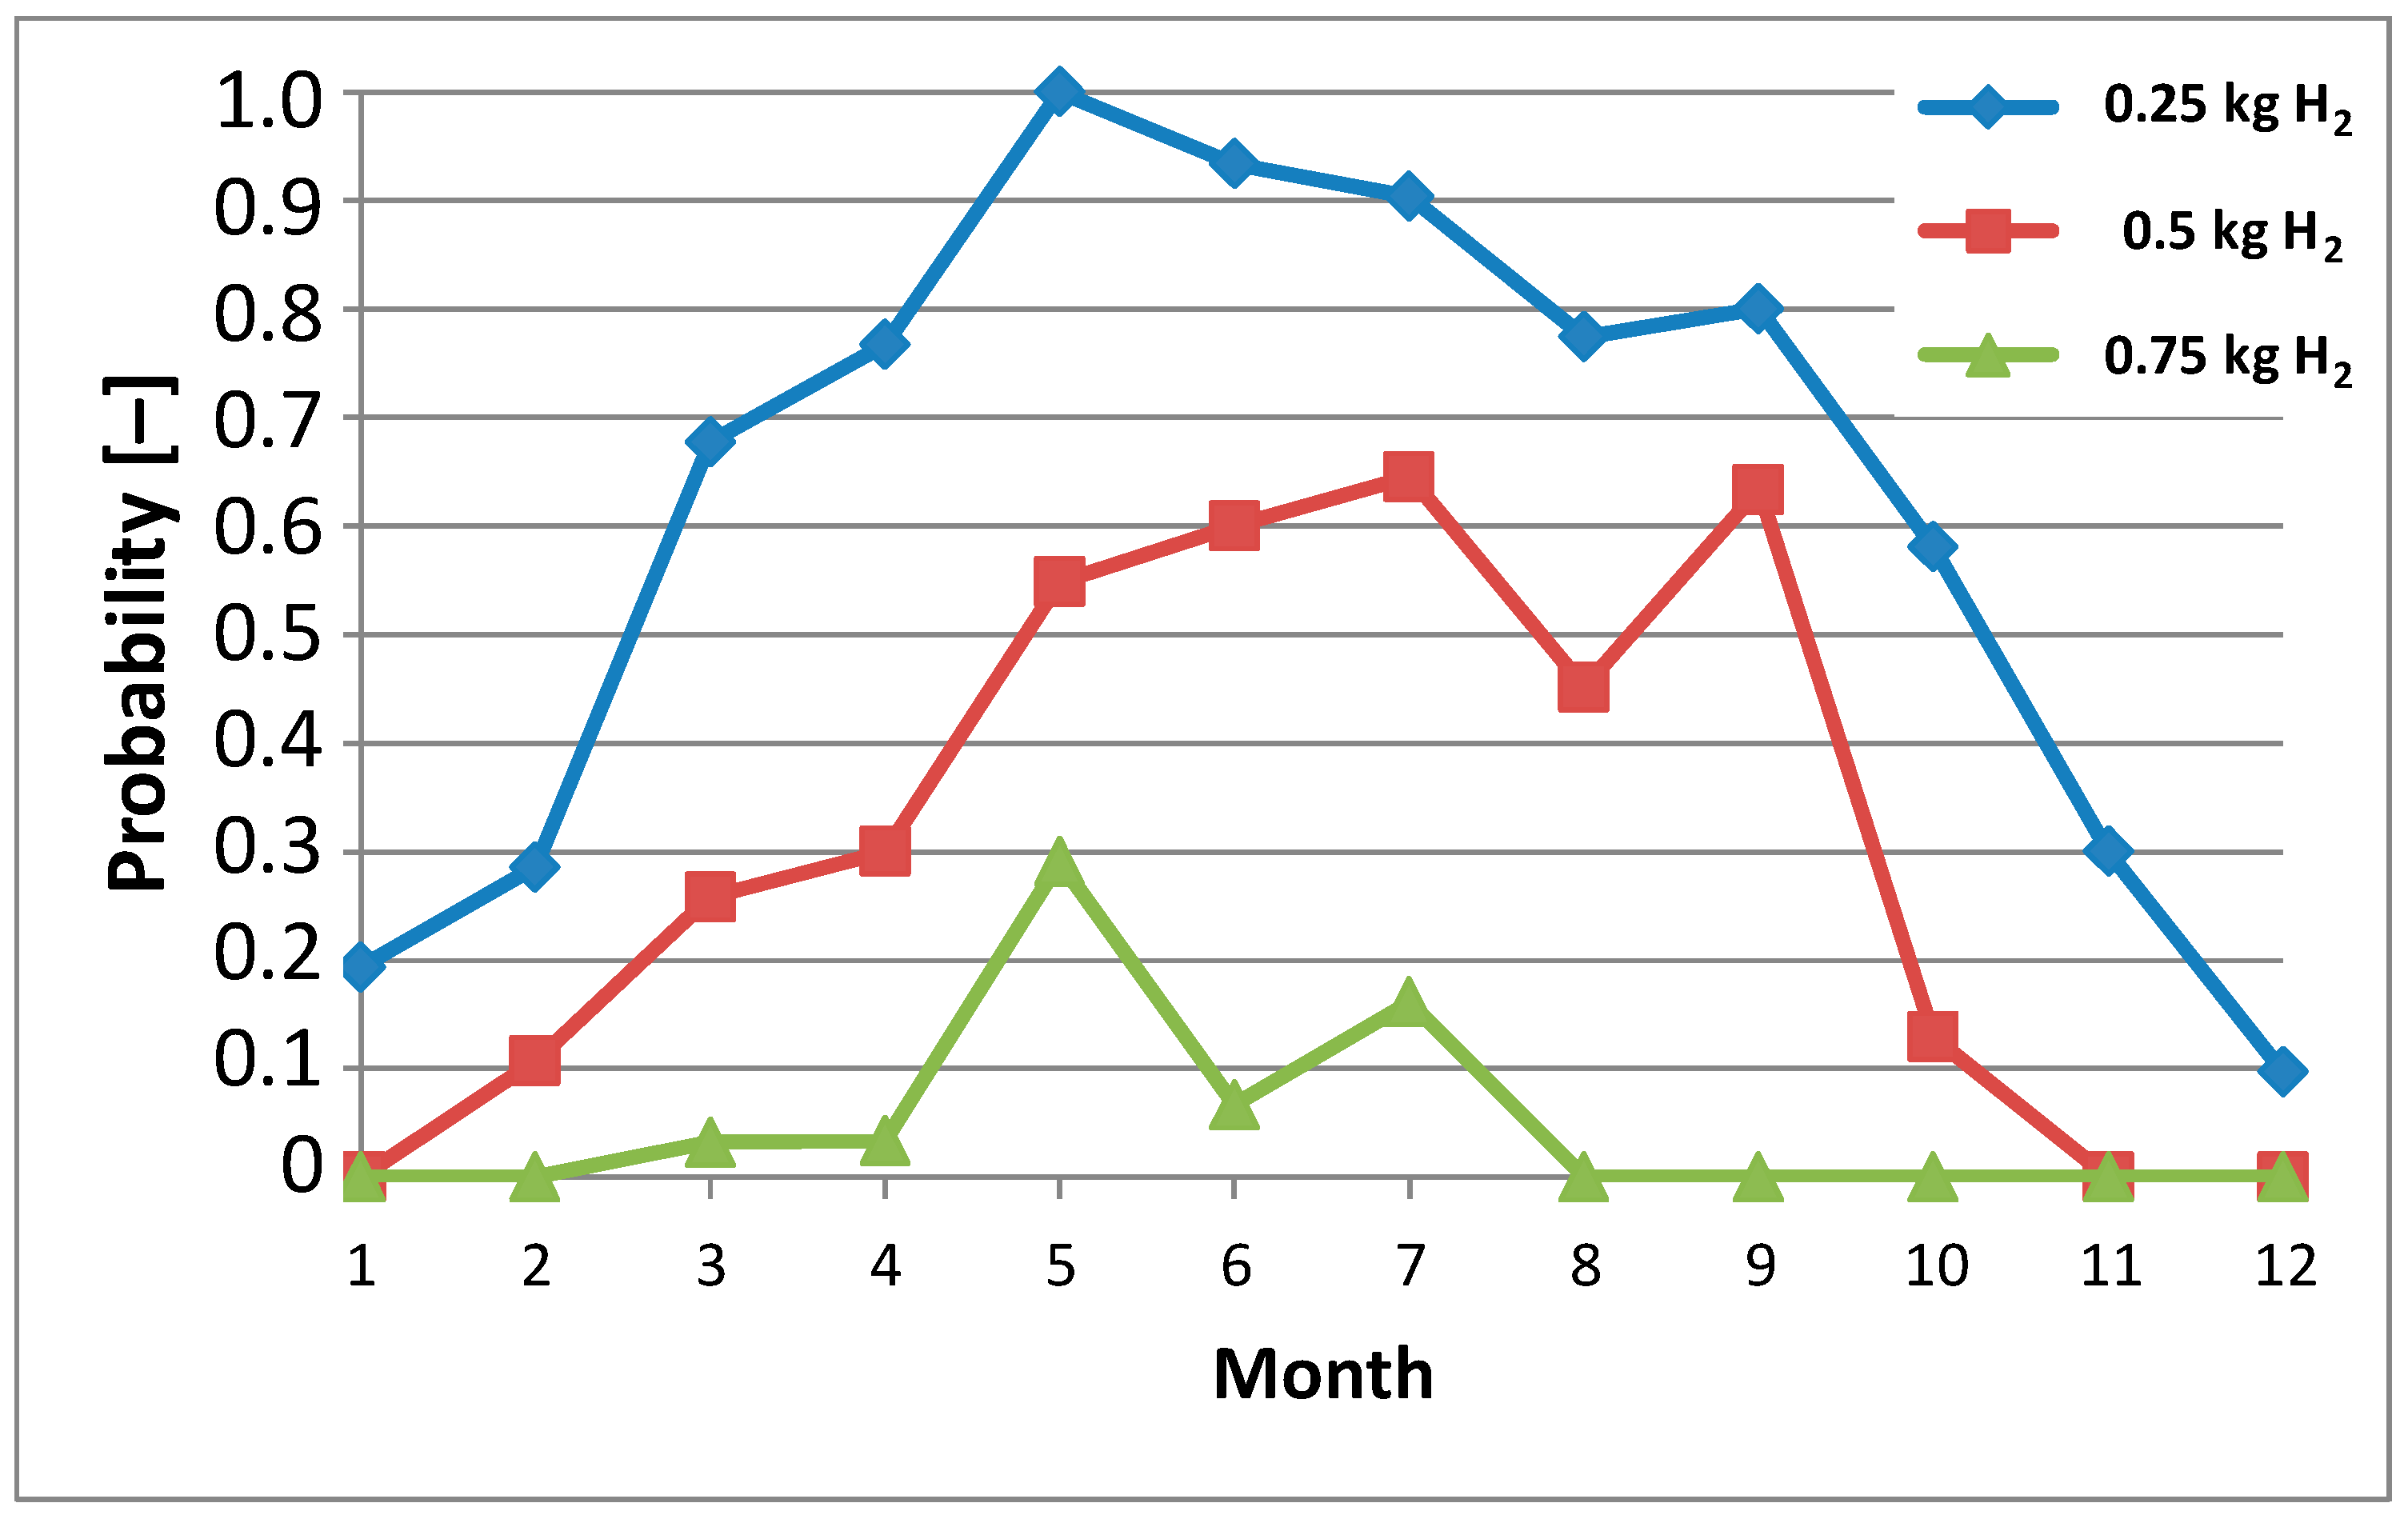
Figure 11. Taking into account the relationship from
Figure 2, the probability of generating individual levels of daily produced hydrogen in individual months of 2023 can be calculated (
Figure 12).
In Polish geographical and climatic conditions, energy production by photovoltaic systems (including carports) takes place all year round. The analyzed photovoltaic system was able to produce daily amounts of energy at specific levels with different probabilities in individual months. The authors specifically selected daily energy generation levels of 12,500 Wh, 25,000 Wh, and 37,500 Wh. They correspond to the energy needed to produce ¼ kg H2, ½ kg H2, and ¾ kg H2, respectively. A photovoltaic carport with a peak power of 6.15 kWp is not able to produce energy equal to 50,000 Wh per day in the Polish climatic conditions, which corresponds to the production of 1 kg of H2.
The choice of an electrolyzer for a hydrogen generation system powered by a photovoltaic carport is not accidental. Water electrolyzers for hydrogen production are manufactured employing various technologies. The ones that are most important include alkaline electrolyzers, those with a PEM membrane [
77,
78] or an AEM membrane [
79], and high-temperature SOE [
80]. AEM electrolyzers are characterized by the greatest flexibility in terms of load variability.
The lifecycle of the presented AEM electrolyzer stack, as with all electrochemical devices, is reduced in the event of frequent starts/stops. As the field experience and the operational data increase, the manufacturer recommends its customers to limit the electrolyzer operating cycles to a maximum of five on/off cycles per day and one on/off cycle per hour. This helps to ensure the durability of the electrolyzer. The electrolyzer works most effectively and is most durable when used continuously [
81]. However, the modular design of the presented electrolyzers and the energy management system are perfectly suited to adapt to changing the renewable energy supplies or to changing demand. Individual electrolyzers can be charged from 60 to 100%, and the combination of multiple electrolyzers allows for any required flow rate of produced hydrogen [
82].
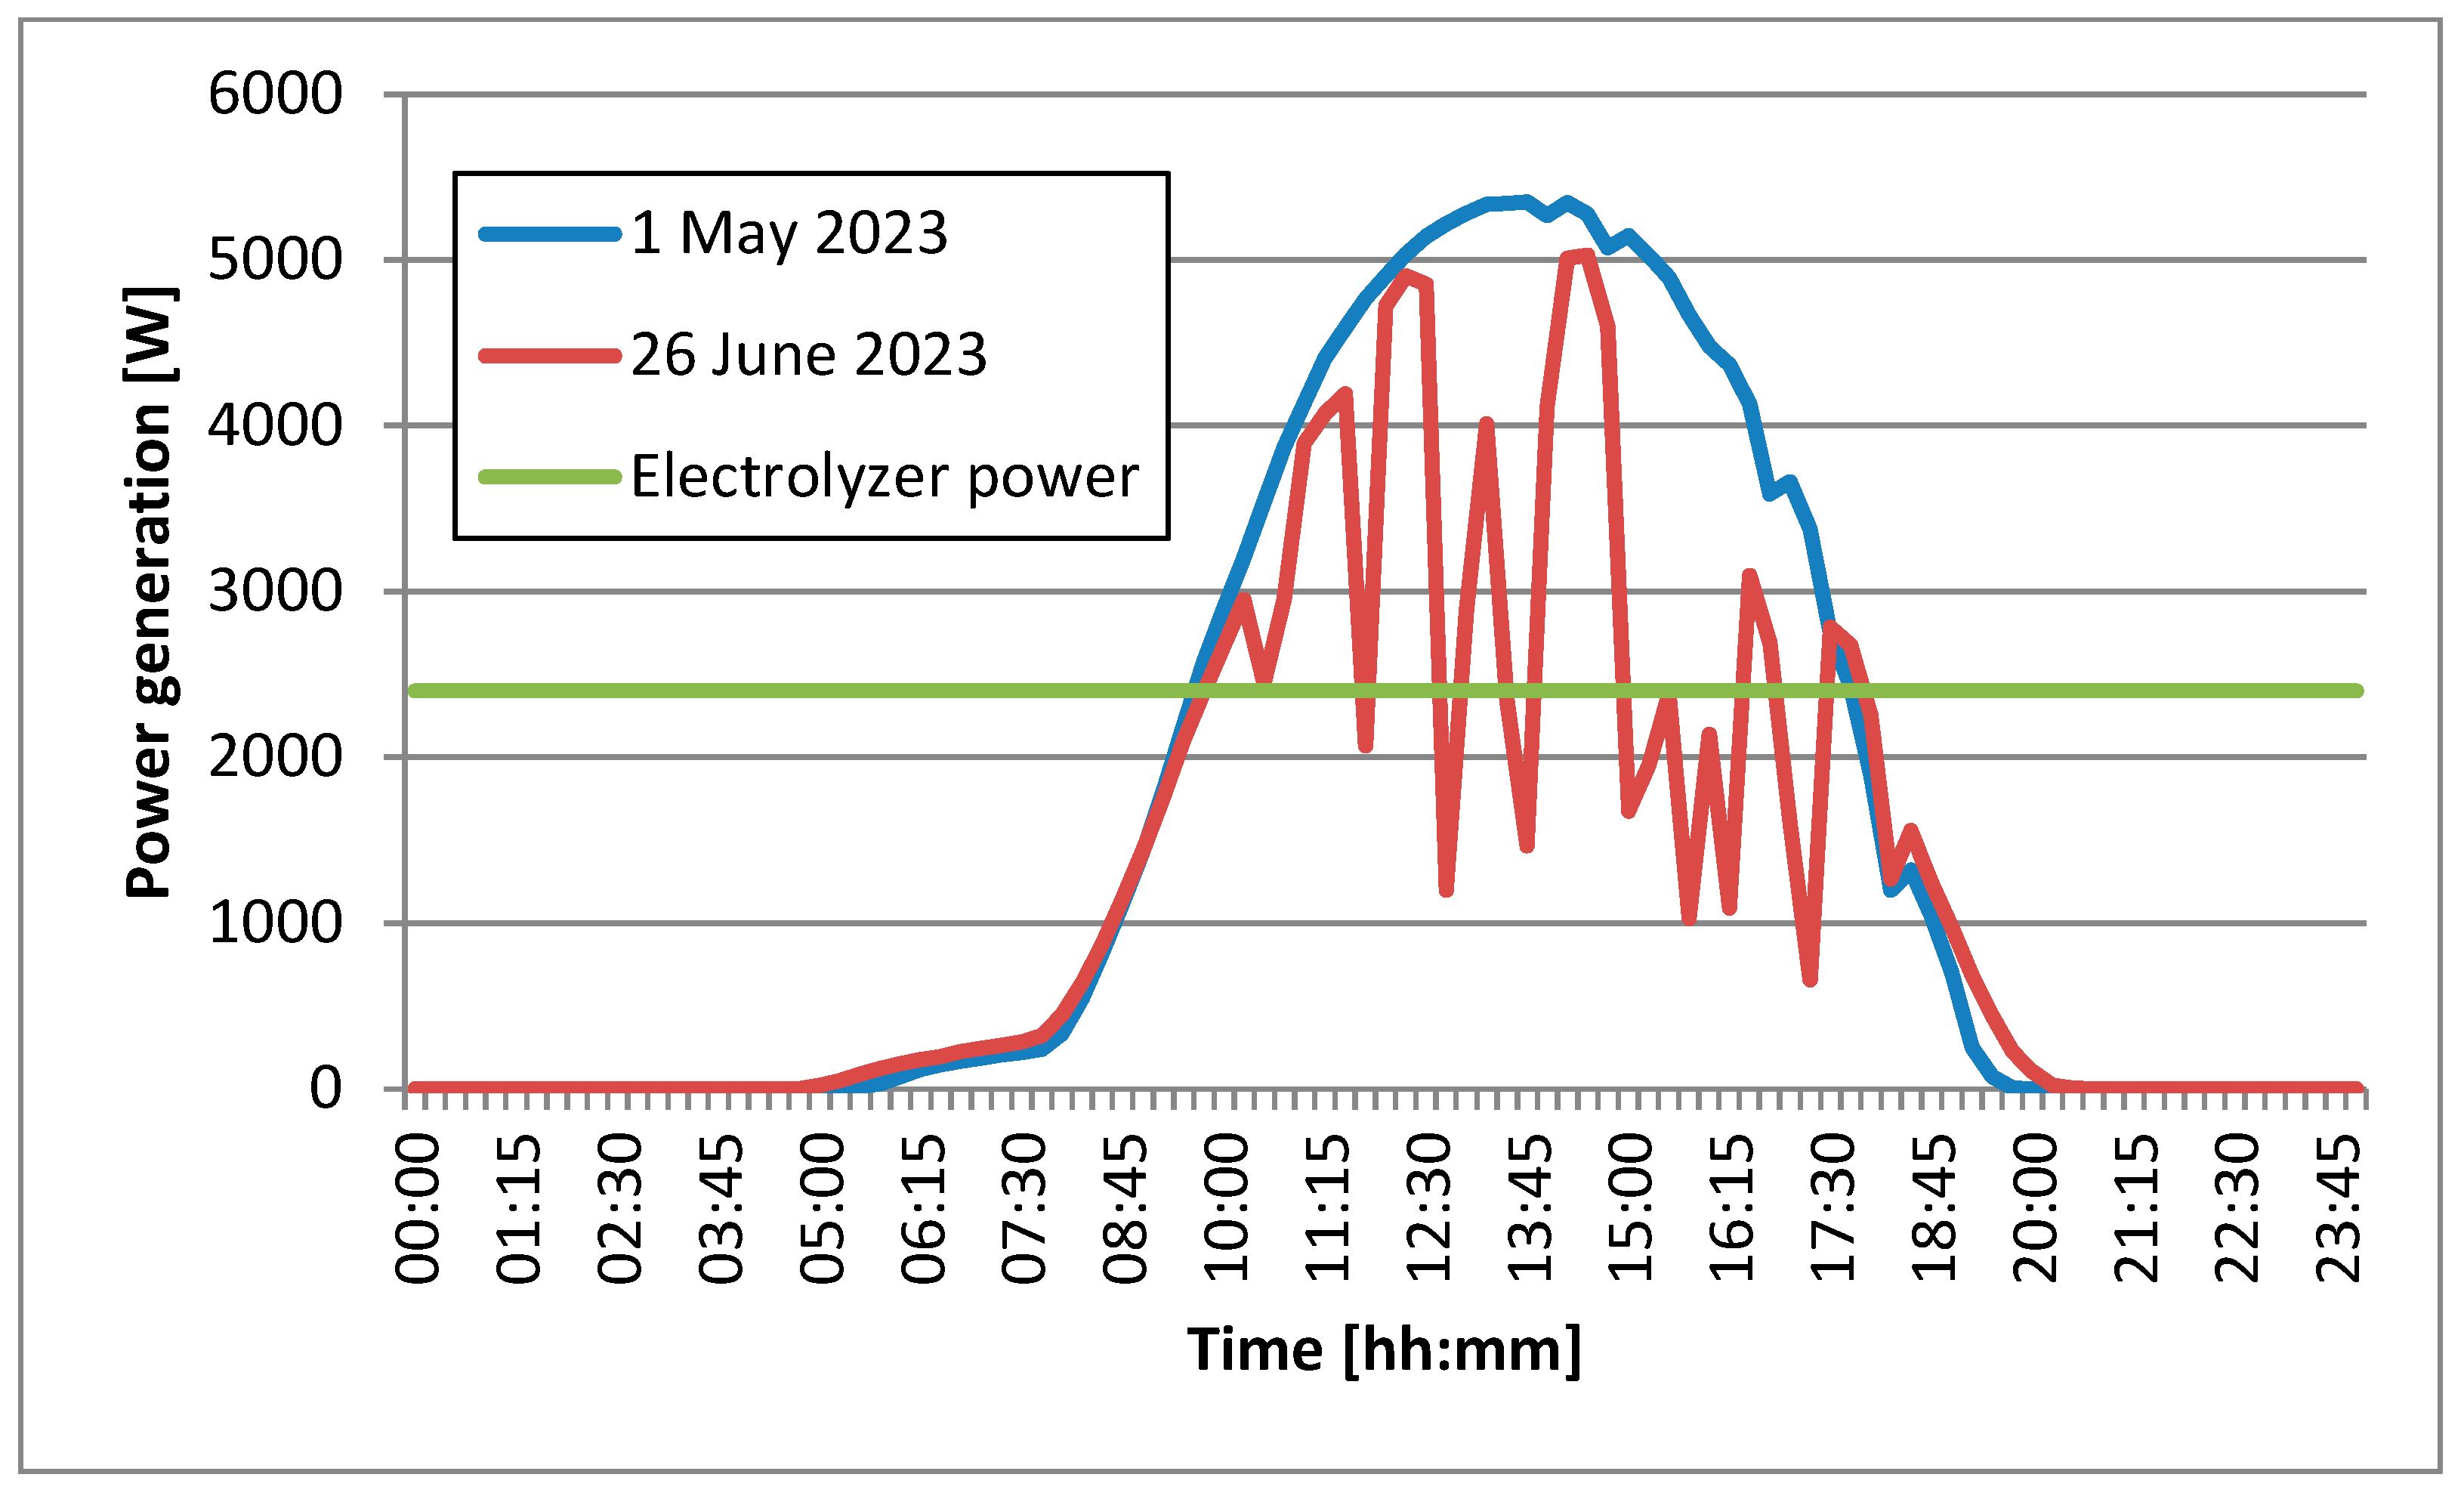
The daily time profile of the power generated by the photovoltaic system and the power consumed by the hydrogen electrolyzer is shown in
Figure 13. It shows the power generated by the photovoltaic system with a peak power of 6.15 kWp on two selected days in 2023. The date of 1 May 2023 was characterized by cloudless weather and the system reached a maximum power significantly exceeding 5000 W. On 26 June 2023, the day was a little longer, but the weather was characterized by temporary clouds, which are clearly visible in the form of drops in generated power output. The graph also shows the power of the electrolyzer, which is constant throughout the day and amounts to 2400 W. The electrolyzer described above can operate at partial loads of 60%. This means that it has the ability to control the power of the electrolyzer in the range from 60 to 100% of its power, and thus, regulate the amount of hydrogen produced and the amount of energy consumed from the photovoltaic carport and from the distribution network. However, the authors’ goal is to maximize the share of energy from the renewable energy sources in the production of green hydrogen. The graph of the power generated by the photovoltaic system on 1 May 2023 clearly displays that for many hours it is higher than the power of the electrolyzer. This means that the hydrogen produced during this time will be yellow. This term is used if only solar energy provided by photovoltaic systems is adopted to produce hydrogen using electrolytic methods. In the second case (of 26 June 2023), the energy produced by the photovoltaic system is not able to cover the power demand of the electrolyzer during the day. The missing power can, of course, be taken from the power grid. To increase the share of renewable energy in the hydrogen production, the authors propose the use of a stationary energy storage facility. Such a warehouse would be loaded at times with the so-called overproduction, when the power generated by the carport is greater than the power of the electrolyzer. The warehouse would be unloaded when the power generated by the carport was not able to cover the power demand of the electrolyzer. The warehouse could also release the accumulated excess energy in the evening and at night, contributing to a significant extension of the time of supplying the electrolyzer with energy from renewable energy sources. Further calculations will allow the energy capacity of such an energy store to be initially estimated.
The basic statistical data (
Table 12) and the extended statistical data (
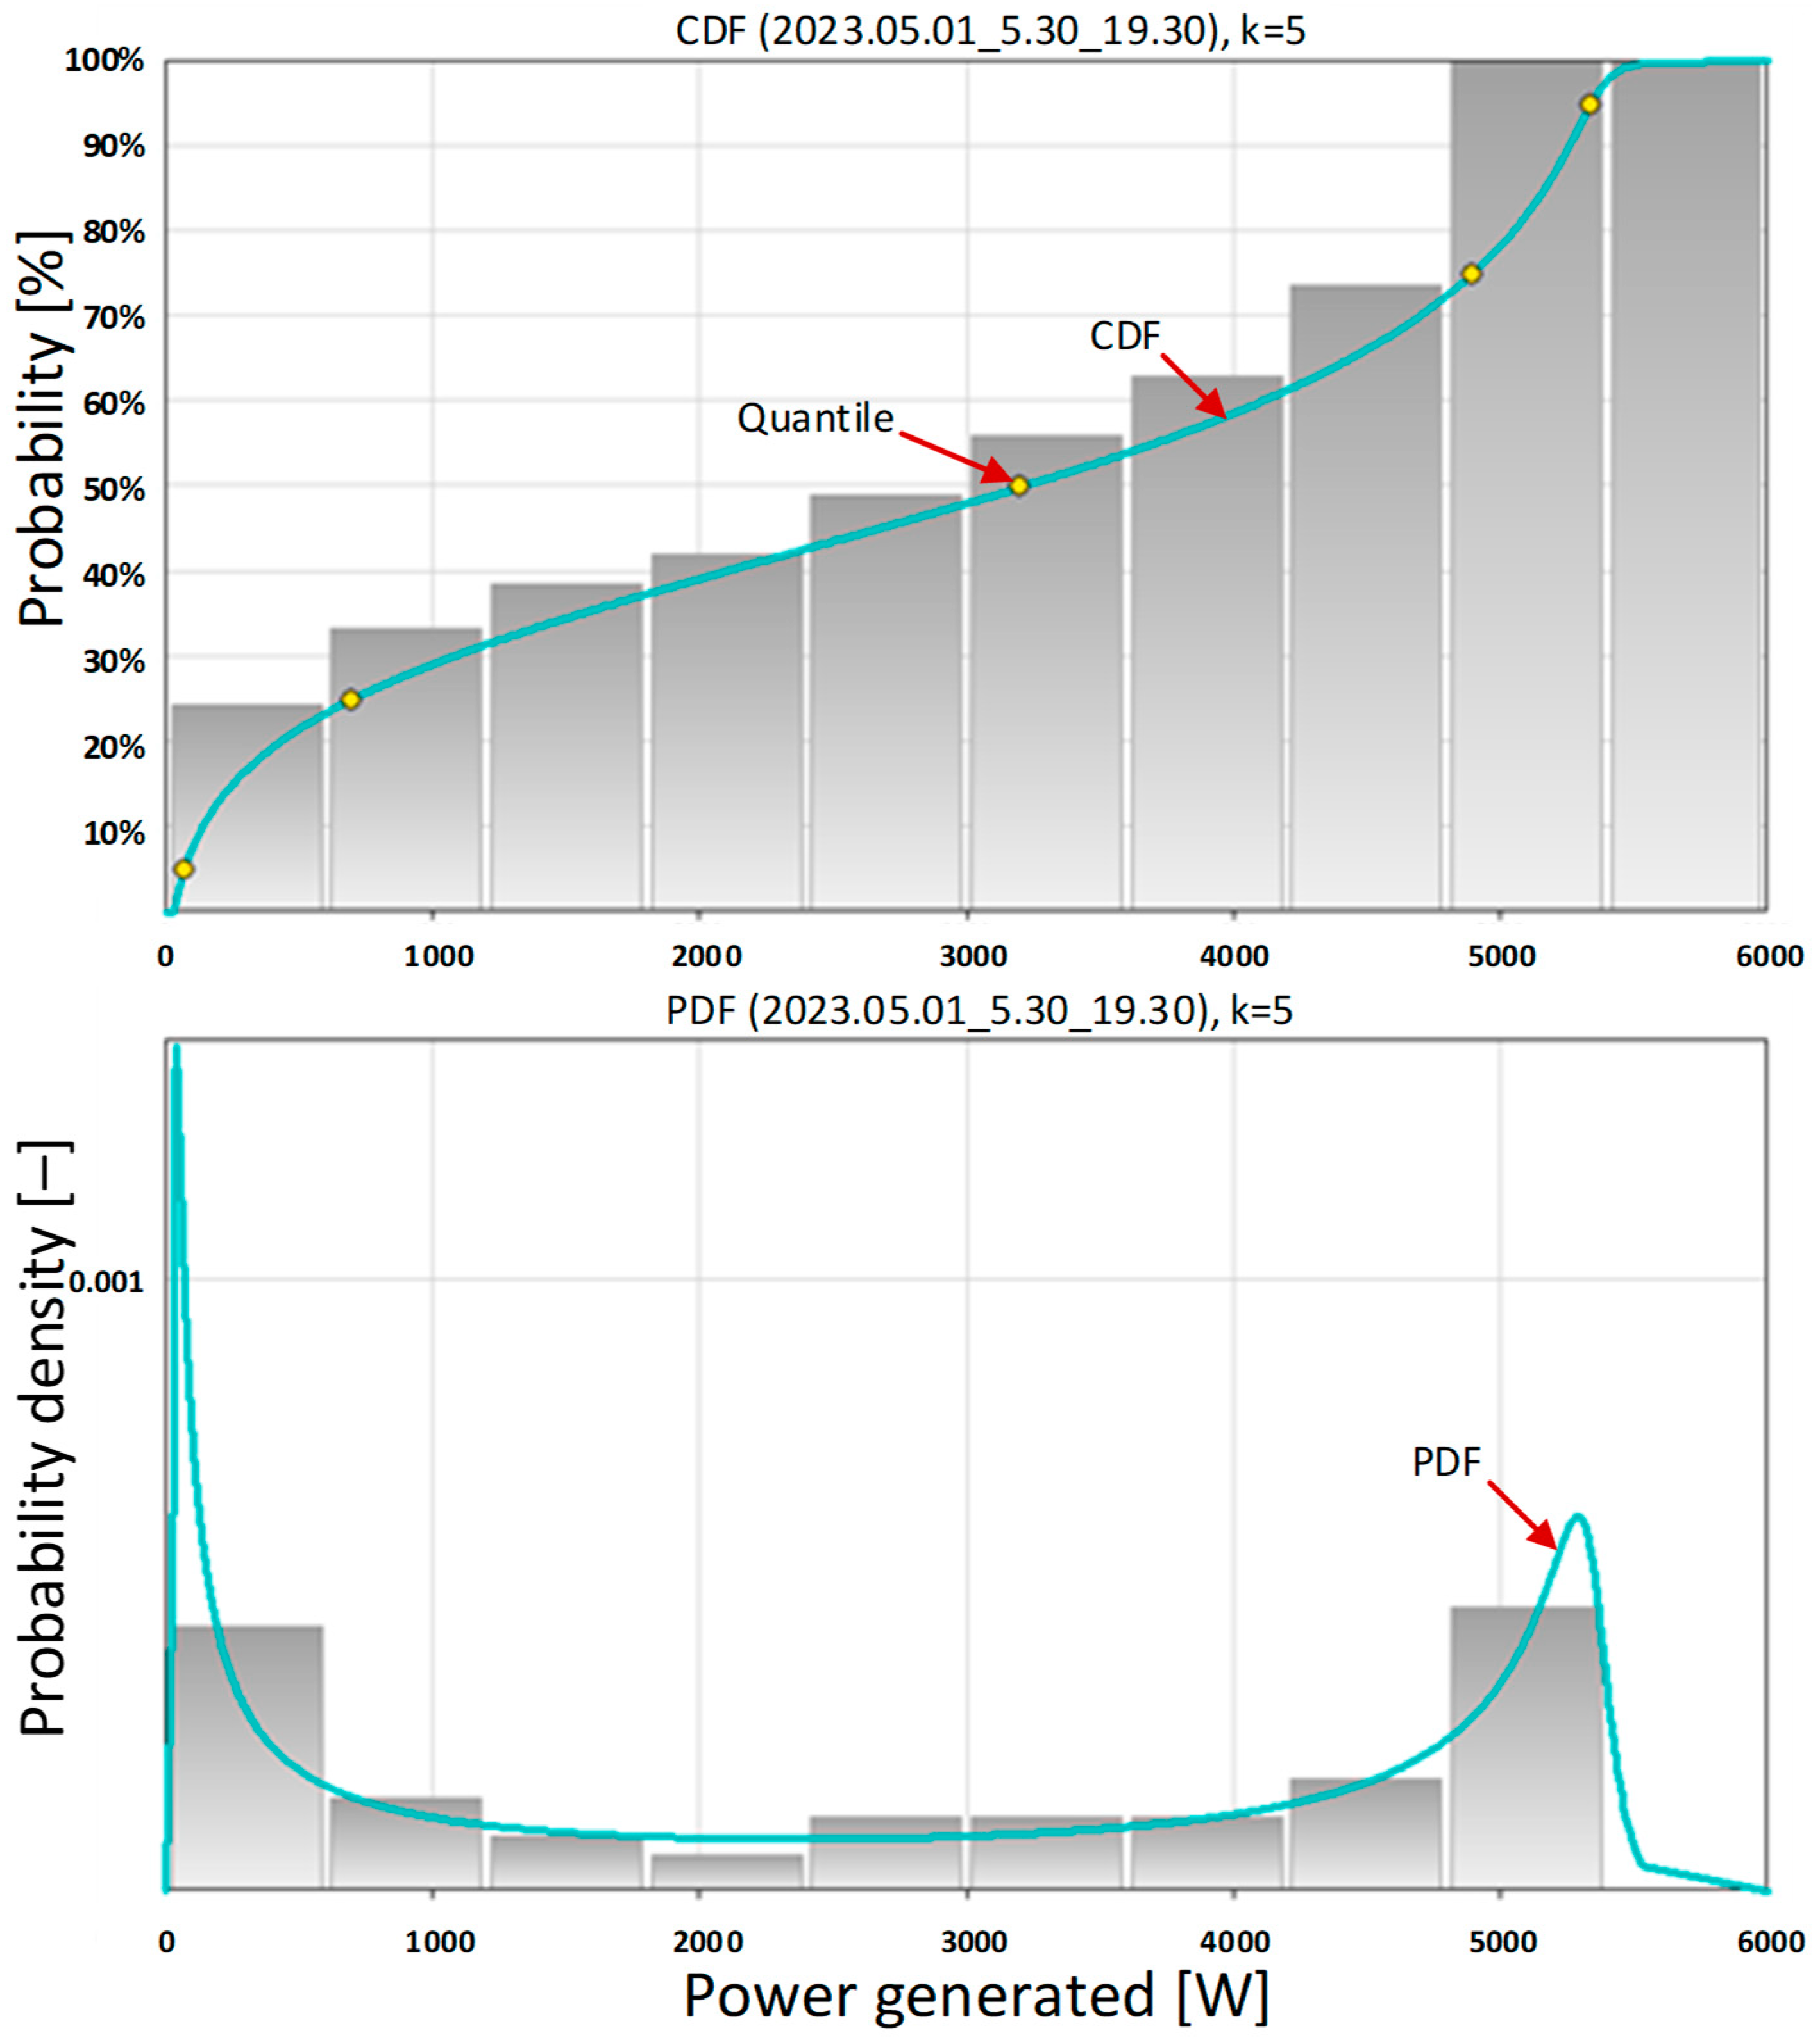
Table 13) of the instantaneous power generated by the photovoltaic system on 1 May 2023 provide extensive information. For these calculations, a time window was assumed that constitutes the entire operating time of the photovoltaic system. On that day, the photovoltaic system started working at 5:30 a.m. with sunrise and ended at 7:30 p.m. with sunset. The power generated during this period of time is characterized by high variability. The power starts from 0 W when the photovoltaic system starts and reaches a maximum value of 5349.1 W. The average value is 2827.57 W with a standard deviation of 2024.75 W. The average value of 2827.57 W is higher than the electrolyzer power of 2400 W. This means that the carport was capable of producing an amount of energy greater than the maximum energy requirement of the electrolyzer on that day.
Detailed information about the potential operation of a hydrogen generation system powered by a photovoltaic system is provided by the probability density function (
Figure 14 below). The PDF has a bimodal character, with one maximum located close to 0 W of power and the other located beyond 5000 W. The first maximum (close to 0 W) results from the very low power generated during sunrise and sunset. The second maximum (located above 5000 W) indicates a high probability density of the system generating power above 5000 W. With the known electrolyzer power of 2400 W, this means charging the energy storage when the carport power is greater than the electrolyzer power and releasing it when it is lower. This PDF shape also means that the warehouse is fully charged with excess energy and almost fully discharged. This case is the best use for the purchased energy storage and provides the fastest return on investment.
When inquiring at the knowledge base What is the probability of the carport generating power less than or equal to 2400 W?, we received the answer 0.4211 (last row in
Table 13). This means that the probability of generating power greater than 2400 W by the carport during the entire system operation time was 1 − 0.4211 = 0.5789 on that day. This would be the share of the energy from the carport in the total power demand of the selected electrolyzer. By using an energy storage facility, we can ensure that all the energy needed to produce hydrogen comes from the carport.
At this point, the question arises: What should be the optimal energy capacity of a stationary energy store? According to the authors, this should be the difference between the maximum daily amount of energy produced by the carport and the energy demand of the electrolyzer (14 h of operation × 2400 Wh = 33,600 Wh). In May 2023, a maximum daily energy production of 42,918 Wh was recorded. Therefore, the energy capacity of a stationary energy storage for a carport with a peak power of 6.15 kWp and an electrolyzer with a power of 2400 W should be not less than 42.918 Wh − 33.600 Wh = 9.318 Wh. However, the authors suggest choosing a storage unit with a capacity of 15 kWh to reduce the depth of its discharge, and thus, extend the time of its correct operation.
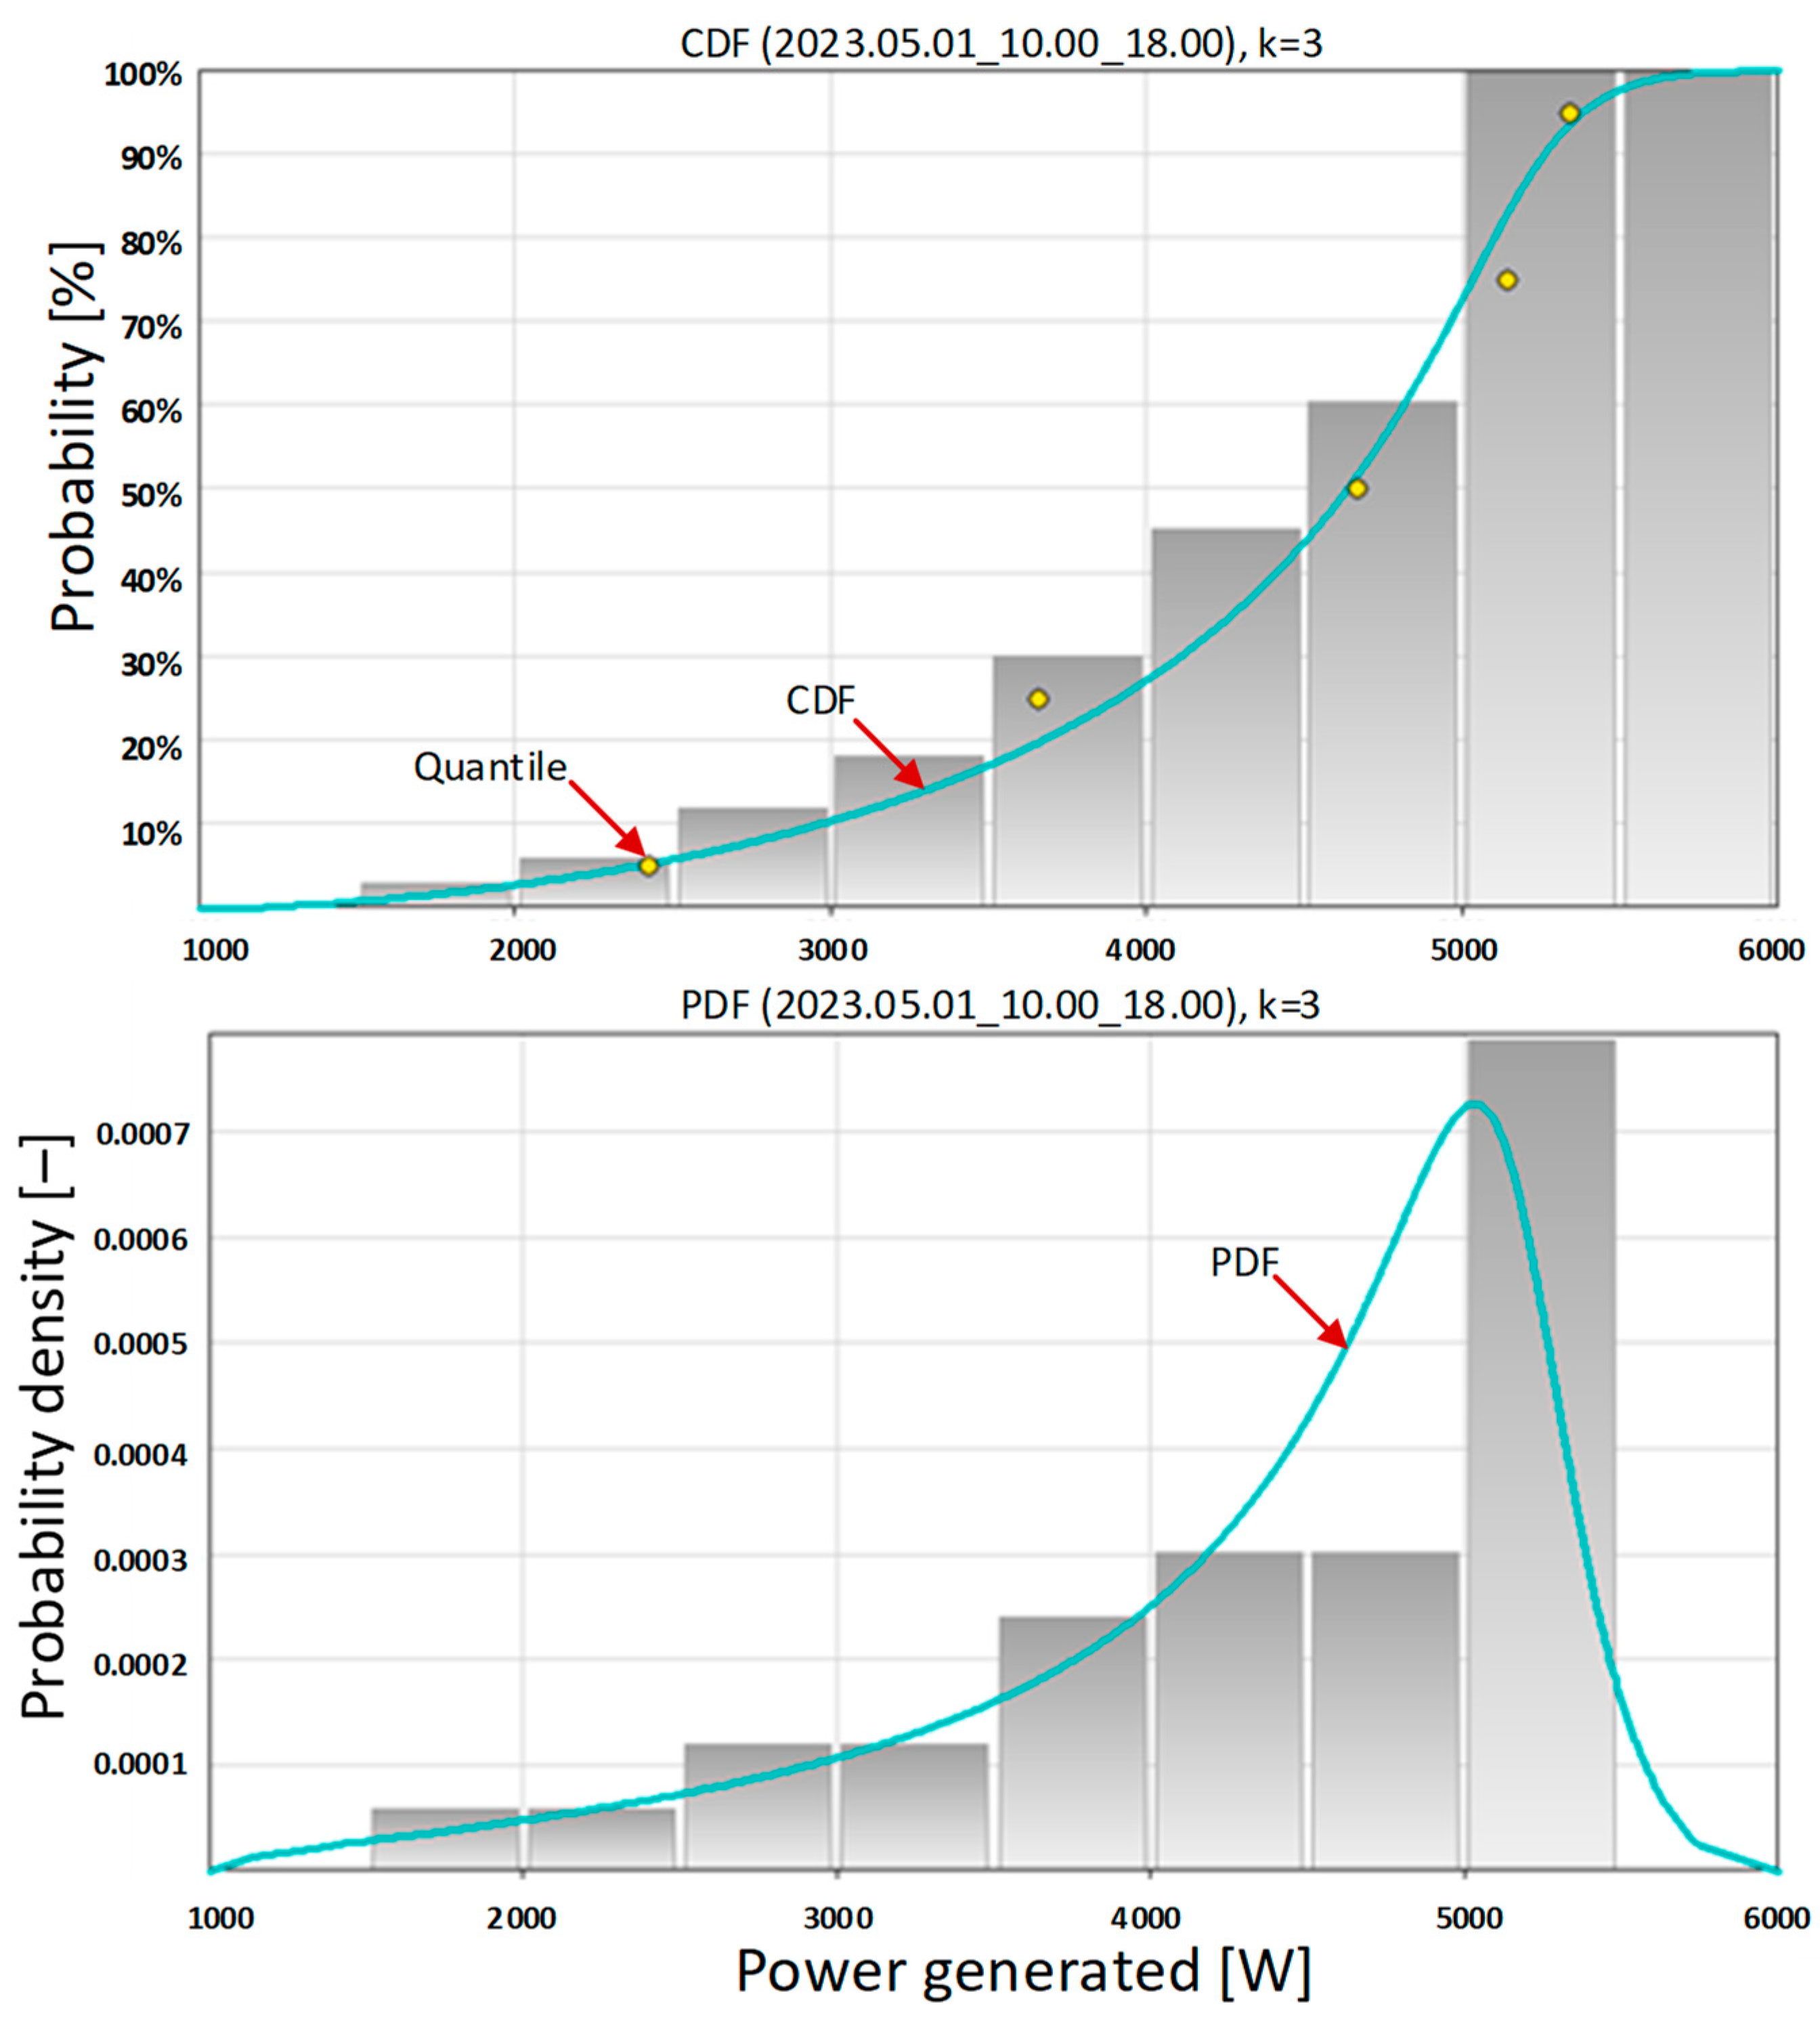
It is also worth considering the case of temporarily switching on the electrolyzer, for example, for 8 h of operation. For example, on 1 May 2023 from 10:00 a.m. to 6:00 p.m., the average value of the power produced by the photovoltaic system is much greater than the electrolyzer power (see
Table 14). Then, the hydrogen generation system could operate without the energy storage, with the probability of generating power through the carport greater than 2400 W being 1 − 0.0303 = 0.9697 (last row in
Table 15). However, this solution requires the excess energy produced by the carport to be transferred to the power grid. This is evidenced by the shape of the PDF in
Figure 15 (bottom). This is always an economically unfavorable situation compared to auto-consumption. Moreover, the electrolyzer would only work for one-third of the time per day, which radically reduces hydrogen production capabilities. The scenario of intermittent operation of the hydrogen generation system without energy storage should rather not be taken into account [
83].
The policy at the level of European Union countries assumes the use of new production capacities for hydrogen production. It is impossible to use the currently existing renewable energy generation infrastructure to supply electricity to hydrogen generators. Therefore, new hydrogen plants must be powered by new photovoltaic and/or wind systems [
84,
85]. Taking into account the very large amounts of energy needed to produce hydrogen [
86], the energy generation infrastructure will take the form of large ground-based photovoltaic farms. According to this assumption, all energy produced by a photovoltaic system can be used to produce hydrogen. Approximately 50 kWh of energy is required to produce 1 kg of hydrogen using electrolytic methods. Depending on the location of the photovoltaic system and the time of year, a photovoltaic system with a specific peak power will be needed to produce this amount of electricity. Hydrogen produced by electrolysis methods powered by energy from solar photovoltaic systems is called yellow hydrogen.
6. Conclusions
In this article, the authors presented a scientific solution to a very practical problem related to determining the size of a photovoltaic system for the assumed production of green hydrogen. The computational algorithm presented in the article will certainly be helpful to designers of photovoltaic systems connected to green hydrogen plants. The information contained herein can also be adopted by renewable energy developers and individual investors operating in the field of renewable energy and alternative fuels. The calculations presented in the article may also be useful to members of Hydrogen Valleys, whose goal is to build a hydrogen economy in various European Union countries.
In Polish geographical and climatic conditions, energy production by photovoltaic systems (including carports) takes place all year round. The analyzed photovoltaic system was able to produce daily amounts of energy at specific levels with different probabilities in individual months. The authors specifically selected daily energy generation levels of 12,500 Wh, 25,000 Wh, and 37,500 Wh, since they correspond to the energy needed to produce ¼ kg H2, ½ kg H2 and ¾ kg H2, respectively. The analyzed photovoltaic system with a peak power of 6.15 kWp is not able to produce the amount of energy equal to 50,000 Wh per day in Polish climatic conditions, which corresponds to the production of 1 kg of H2. A photovoltaic system with a peak power of 6.15 kWp working with an electrolyzer with a power of 2.4 kW requires energy storage of at least 10 kWh.
The algorithm presented by the authors for selecting a photovoltaic system for the required amount of green hydrogen produced is a method of calculation on which the hydrogen economy of a given company can be based. The major advantage of the presented method of calculation is its scalability, presented in the form of several levels of energy produced by the photovoltaic systems, which translate into the amount of hydrogen generated monthly.
The calculations presented in the article have great practical application. Based on them, the authors have designed a green hydrogen production system, which is to be built in the Lublin Science and Technology Park in the near future.
The authors intend to continue the research undertaken. The next step will be to analyze the possibilities of producing green hydrogen using the energy from an energy mix consisting of photovoltaic systems and wind turbines. The combination of the energy streams produced by various renewable energy sources will enable the production of green hydrogen throughout the day.
