Abstract
In September 2020, the Federal Energy Regulatory Commission (FERC) released Order 2222, which opens wholesale markets to small-capacity distributed energy resources (DERs), recognizing their potential in improving operational efficiency by providing bulk grid services. Therefore, a co-simulation capability that can connect transmission and distribution (T&D) simulations and evaluate the impacts of DER provision of bulk grid services is needed. In this paper, we present a new integrated T&D co-simulation platform that incorporates T&D system simulators, DER aggregator/group strategies, and a co-simulation coordinator. Industry-standard communication protocols are employed to mimic real-world conditions. Secondary frequency regulation is selected as the representative bulk grid service, and we simulate the responses of DERs to the frequency regulation signals. The simulation results for a solar-rich distribution feeder in Colorado, USA, demonstrate how the T&D co-simulation setup is used to evaluate the contributions of DERs to minimize the bulk grid frequency deviation.
1. Introduction
Traditionally, system operators have managed transmission and distribution (T&D) systems separately [1]. Meanwhile, recent grid modernization initiatives have led to the increased deployment of distributed energy resources (DERs) and grid-edge technologies, including electric vehicles, smart controllable loads, distributed generation, and advanced control technologies [2]. The impact of the increasing capacity of controllable DER assets in distribution systems has resulted in the introduction of the Federal Energy Regulatory Commission’s (FERC) Order 2222 [3], which requires independent system operators (ISOs) and regional transmission operators (RTOs) to open transmission wholesale markets to DERs and DER aggregators if their capacity is greater than 0.1 MW; therefore, DERs will become an important player in bulk grid operations in the foreseeable future, as depicted in Figure 1.
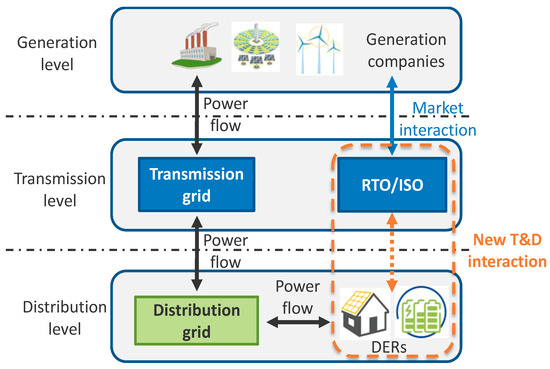
Figure 1.
Advanced T&D landscape.
Meanwhile, the impact of thousands of dispersed DERs on bulk grid operations remains a major challenge. In the existing grid operation paradigm, ISOs or transmission operators have no or very limited visibility of the resources at the distribution level; however, it is of great importance to recognize the interdependencies between T&D systems to exploit the full capability of DERs while maintaining the operational reliability and stability of both systems.
Various co-simulation frameworks have been reported in the literature for integrated T&D co-simulation. A review of integrated T&D modeling for steady-state and dynamic modeling of power systems is provided in [4]. Further, [5] reviews several technological dimensions for interconnecting cross-domain T&D simulation tools, considering stochastic optimization, high-performance computing, and high-level design software architecture uncertainties. A summary of comparative studies of interface techniques for T&D co-simulation and the required interface models (e.g., voltage or current source, Thevenin or Norton equivalent) considers whether the transmission network is a positive-sequence or a three-sequence transient stability model and whether the distribution system uses power flow [6]. The impact of distribution-side volt/VAR control on transmission systems using a quasi-static time-series power flow co-simulation framework is discussed in [7]. For seamless interfaces between different simulators within T&D co-simulations, HELICS is used to develop an open-source T&D dynamic co-simulation framework for DER frequency in [8]. A modeling framework is discussed in [9] for real-world distribution systems to enable large-scale T&D co-simulations. Further, decoupled, loosely coupled, and tightly coupled T&D quasi-steady-state power flow co-simulation algorithms and an iterative coupling method for this T&D co-simulation platform are discussed in [10]. An iterative power flow co-simulation algorithm is investigated in [11], considering the system voltage stability margin with distributed generation penetrations. An integrated grid modeling system [12] considering tightly coupled T&D power flow co-simulations using a HELICS-based interface between PowerWorld and OpenDSS is discussed in [13]. The authors of [14] discuss T&D power flow methods to study the dependence of transmission voltage on the location of photovoltaic (PV) units and electric vehicles (EVs). Recently, a real-time T&D co-simulation test bed was considered for simulating large grids in a high DER penetration environment for cross-platform data exchange and time synchronization using a communication framework based on the MQTT communication protocol [15]. A more detailed comparison is given in Table 1, where the literature is lacking one or more factors, such as considering synthetic T&D models, discussing the lack of industry-grade protocols for communications, and demonstrating integrated T&D-supported grid services using distribution-level DER control algorithms.

Table 1.
Detailed comparison of existing T&D co-simulation work.
To this end, this paper presents a T&D co-simulation platform to facilitate the development and evaluation of coordinated control strategies intended to provide essential ancillary service support to the bulk grid by harnessing the capabilities of distribution-level DERs. The T&D co-simulation platform consists of a transmission system simulator, a distribution system simulator, a DER aggregator/group, and a co-simulation coordinator, and it uses industry-standard communication protocols for data exchange. In the use case study, secondary frequency regulation is selected as the representative bulk grid service. The DER set points will be updated through the deployed control algorithm to respond to the frequency regulation signals. The main contributions of this paper include:
- We developed a T&D co-simulation platform to facilitate the development and evaluation of coordinated control strategies intended to provide essential ancillary service support to the bulk grid by harnessing the capabilities of distribution-level DERs.
- Secondary frequency regulation was selected as the representative bulk grid service.
- We performed a realistic laboratory evaluation, considering the real utility distribution model, the U.S. Western Interconnection model, and industry-grade communications for DER communications.
- To manage distribution-level DERs considering the area control error at the point of connection of the distribution system to the transmission system, a gradient-based control method proposed in this paper proved to be a fast and reliable solution to solving sophisticated real-time optimal power flow problems.
2. Coordinating DER Controls for Bulk Grid Services
2.1. Coordinating DER Responses
Because most DERs are owned or managed by private customers or third-party aggregators, ISOs and local utility operators have limited access to DER statuses, such as the remaining capacity in the battery and the available headroom for ramping up/down power; therefore, the DER responses need to be coordinated through appropriate mechanisms to ensure that the DERs are correctly responding to the bulk grid service calls and to minimize the risks of grid service delivery failures. It is also critical for local utility operators to monitor DER actions to ensure that operational constraints, such as line loading and voltage constraints, are fully accommodated. In this paper, we make the following assumptions to enable coordination among DERs:
- Each participating DER is equipped with the proper metering, control, and communication device to support the bulk grid service provision.
- DERs are managed by a DER aggregator for bulk grid services. The aggregator coordinates with the ISO and the distribution network operator (DNO) to update the set points for the DERs to provide the required grid services while complying with the distribution grid operating requirements.
- DERs are compensated/rewarded through programs with the DER aggregator. The design of such programs is outside the scope of this paper and will not be elaborated on. It is assumed that DERs will respond to grid service requests, as defined in the grid service programs.
- Among existing ancillary services at the bulk grid level, frequency regulation is selected in this co-simulation demonstration. Frequency regulation typically requires a response from the participants within minutes. The successful demonstration of frequency regulation will also prove the feasibility of using the same co-simulation platform for other bulk grid service studies [16].
2.2. DER Aggregator Algorithm
In this project, we propose implementing a centralized control structure where the DERs that participate in the bulk grid services are assumed to be managed by the distribution network operator via a DER aggregator; thus, the DER responses will be closely monitored during the real-time operation to mitigate potential reliability concerns at the local grid. To enable DERs to respond in a timely fashion to bulk grid service requests in real time, the DER control algorithm needs to be computationally efficient; therefore, we adopt a gradient-based control method that has been proven to be fast and reliable to solve sophisticated real-time optimal power flow problems [17]. For the bulk grid service provision, a generic DER control model can be formulated as follows, while a more comprehensive description can be found in [17]:
where the control objective, , contains two parts: (1) Function calculates the deviation from the received grid service request at the k-th control step and (2) function calculates the DER control cost for the m-th DER at the k-th control step. is an algebraic formulation of observable system outputs. denotes the feasibility region of control input . denotes the n-th physical constraints of the DER control.
Leveraging the gradient-based DER control method, the DER control can be updated through (4):
where is the projection function and is the step size for the gradient descent. The gradients are uniformly bounded and Lipschitz continuous with a common parameter, [17].
The generic model (1)–(3) is a compact model that can be used for a variety of DER control problems. For the selected frequency regulation service, distribution system operators will receive automatic generation control signals from the ISO. The desired frequency regulation service will be delivered through setting the appropriate substation power injection at the point of connect to the transmission system as the control target in accordance with the automatic generation control signal. For example, assume the original substation power injection is and the frequency regulation capacity is , which is predefined through market or other agreements. When the frequency regulation service is requested, the target substation power injection, , will be set to either or , depending on the directions of the automatic generation control signal. The control target, i.e., the net power injection at the substation level, will be set in accordance with the automatic generation control signal. The mismatch between the control target and the current power injection will be used as the input of function . can be formulated using the dispatch cost and opportunity cost associated with the grid service provision [18]. The constraints are the DER operating constraints, such as the power/capacity limit, and the distribution grid operating constraints, such as the voltage limit.
3. T&D Co-Simulation Setup
In this section, we discuss how the T&D co-simulation platform is built. The proposed T&D co-simulation setup, shown in Figure 2, uses different tools, which include a transmission system simulator, a distribution system simulator, a co-simulation coordinator, the DER control application, and a communication protocol converter.
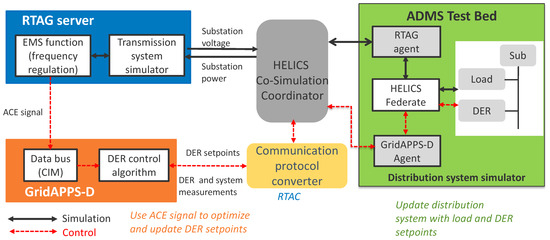
Figure 2.
T&D co-simulation platform.
The co-simulation setup in Figure 2 allows for modeling, simulating, and analyzing the coordinated control of distribution-level DERs to improved resilience, reliability, and efficiency at both the T&D levels. As shown in Figure 2, there is a communication protocol converter between the GridAPPS-D and HELICS co-simulation coordinator. The protocol converter is required for the data exchange through DNP3. The data workflow starts from the ADMS Test Bed data to the protocol converter (RTAC), and the DNP3 data from the converter are then pushed to GridAPPS-D. After the DER control algorithm finishes updating the DER set points in GridAPPS-D, the DNP3 control commands are invoked and sent back to the protocol converter. Finally, the ADMS Test Bed receives the updated DER set points from the HELICS. Additionally, in this co-simulation platform, a flat file exchange is used for the data exchange between RTAG and GridAPPS-D and between RTAG and the ADMS Test Bed. The details of the employed tools and the co-simulation implementation are discussed in the following subsections.
3.1. Co-Simulation Coordinator
The co-simulation is coordinated through the Hierarchical Engine for Large-Scale Infrastructure Co-Simulation (HELICS) framework developed by U.S. DOE national laboratories [19]. The HELICS is an open-source and scalable framework that supports different platforms, software and hardware interfaces, and communication requirements. Using HELICS, each simulator is regarded as a value federate, and a message federate is in charge of enabling the data exchange among value federates. More details on the HELICS can be found in [19].
3.2. Transmission System Simulator
We employed the NREL’s Real-Time Analytics for Bulk Grid (RTAG) tool for the transmission system simulation in this co-simulation platform. Figure 3 shows an example of the graphic user interface of RTAG. RTAG provides a real-time simulation and analysis capabilities for transmission system operations by leveraging the dynamic phasor application of the GE energy management system (EMS) and a real operating data set of the U.S. Western Interconnection [20]. For this co-simulation platform testing, we used the Western Interconnection grid model and historical EMS operating data to build the steady-state transmission power flow case as the baseline. To simulate the frequency regulation, we extracted the area control error (ACE) values from the EMS function in RTAG. The ACE signal is passed on to the DER control algorithm via a web-based interface.
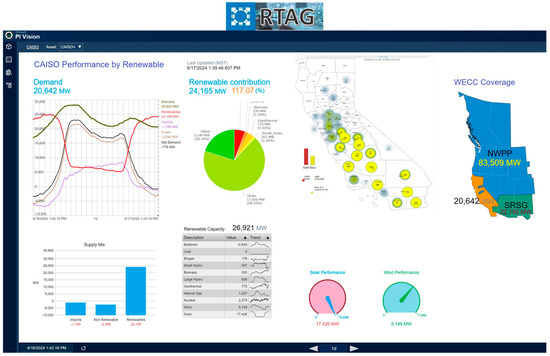
Figure 3.
Overview of RTAG tool.
3.3. Distribution System Simulator
In this co-simulation platform, we employ the NREL’s Advanced Distribution Management System (ADMS) Test Bed, shown in Figure 4, to simulate distribution systems [21]. The ADMS Test Bed enables the evaluation of commercial and precommercial grid control solutions, such as ADMS, in a realistic laboratory environment [22]. We do this through building a realistic, real-time model of a real or representative distribution power system that includes behind-the-meter and utility-scale DERs. We then interface the system model with commercial or precommercial grid management software—such as an ADMS, a DER management system, a virtual power plant, or an aggregator—through industry-standard communication protocols. The system model and grid management software can also be interfaced with power or controller hardware, such as battery inverters, capacitor bank controllers, electric vehicles, electric water heaters, or air conditioners. The ADMS Test Bed offers a selection of simulators, such as OpenDSS, which are used for the distribution system simulator in this T&D co-simulation platform. For the frequency regulation use case, we modeled a real, solar-rich Xcel Energy distribution feeder in Colorado, USA, in OpenDSS, and we increased the capacities of the solar power and batteries available on this distribution circuit.
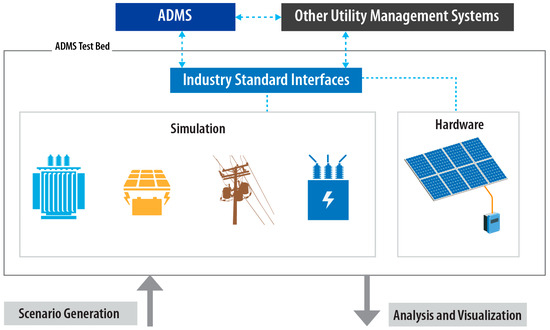
Figure 4.
Overview of ADMS Test Bed.
3.4. DER Aggregator Application Host
The DER aggregator algorithm discussed in Section 2.2 is hosted by an open-source platform, GridAPPS-D [23], that supports multiple communication standards and follows industry-accepted data structures, message payloads, and seamless information exchange capabilities within the T&D co-simulation platform. In the co-simulation setup, the master part of the Distributed Network Protocol 3 (DNP3) [24] is implemented and shown outside GridAPPS-D, as shown in Figure 5, to exchange data between the RTAG server and the Real-Time Automation Controller (RTAC) protocol converter. The data/message flow of the master DNP3 inside GridAPPS-D, as shown in Figure 5, consists of two elements: the SEL RTAC and the DNP3 service of GridAPPS-D. The distribution simulator discussed in Section 3.3 does not support industry-standard communication protocols, like DNP3, as needed in this study; thus, the SEL RTAC [25] protocol converter is used to convert User Datagram Protocol (UDP) messages into the DNP3 packets. Then, the DNP3 packets are converted to a Common Information Model (CIM)-readable format inside GridAPPS-D using its master DNP3 service. This service requires static data preparation, including a name and index number for each measurement (analog or digital data type) for both the input and output of a given RTAC device (RTU1,…, RTUn) in a Comma Separated Values (CSV) file with mutual understanding between the RTAC operator and the master DNP3 operator. Additionally, opendnp3 and pydnp3 open-source libraries are used to develop the master DNP3 service inside GridAPPS-D [26]. Based on static data inside the CSV file, conversion, model, and device port configuration dictionaries are created, as described in the following steps.
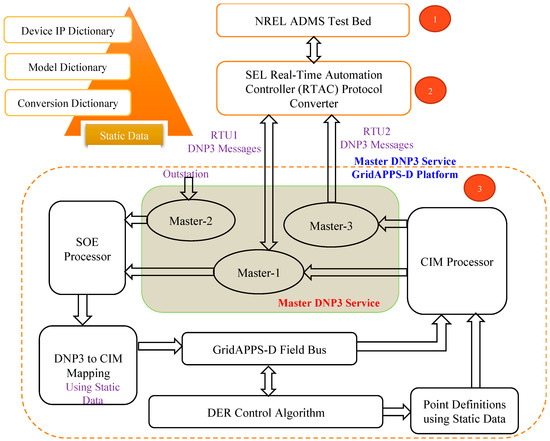
Figure 5.
Data flow inside GridAPPS-D.
(1) Conversion dictionary: The conversion dictionary stores the device name, input/output measurement details, and the type of measurement, which includes both digital and analog data types. In addition, the index dictionary is a crucial part of this schema because every measurement from the RTAC has a dedicated index number. It also stores the CIM-identifiable details of each device.
(2) Model dictionary: The model dictionary stores the CIM conventions of the device names. For example, suppose the CIM object of a given device is an energy consumer. In that case, for each phase, the VA type of measurement holds the active and reactive load powers. If the measurement type is PNV, it represents the phase-to-neutral voltage of the connected node. In the case of the switch type of device, the measurement-type POS is used to obtain a switch’s on/off position.
(3) Device port configuration dictionary: This dictionary is responsible for storing the Internet Protocol (IP) address of the external DNP3 device and the local port along with the internal and external DNP3 address.
Initially, the master DNP3 service launches multiple masters, having the capability of simultaneously exchanging data every 30 s (configurable). These masters provide more flexibility to the user because all masters need not exchange bidirectional data between the RTAC and GridAPPS-D. For example, Master 1, shown in Figure 5, exchanges DNP3 data packets in a bidirectional manner by having both analog input and output channels of DNP3 service within the T&D testbed. At the same time, Master 2 sends data using only an analog output channel, and Master 3 uses only an analog input channel to pool data from the outstation. Further, in the T&D platform, we use Master 1 for the DNP3 data packet exchange with the sequence of events (SOE) processor received from the outstation. It provides an interface between the application layer and the SOE callbacks from the master. Next, the DNP3 packets from the SOE are converted to the CIM format using static data and sent to the GridAPPS-D field bus output topic. Any application that needs this information can subscribe to the field output topic; in this case, the DER control algorithm subscribes to the field output topic. It processes the data, and the generated results are pushed back to the field bus. From there, point definitions are defined using the static data and sent back to the field input topic. Finally, the CIM to DNP3 conversion takes place at the CIM processor, which handles commands from the application and sends the values to the RTAC protocol converter through the master.
Further, in the co-simulation setup, for the frequency regulation test case, the ACE signal is sent using web interface to the data bus of GridAPPS-D, which is passed on to the DER control algorithm to determine the optimal DER control responses. The DER controls are updated by the control algorithm every 30 s. After the optimal DER set points are calculated, they are shared with the ADMS Test Bed through DNP3.
3.5. Communication Setup
The data flow within the co-simulation is described in Figure 6, and the case study demonstration results will be discussed in the next section. For ease of demonstration, we also employ a display interface to monitor the real-time T&D co-simulation results that illustrates key parameters, including the ACE signal, system frequency, etc. The display is shown in Figure 7.
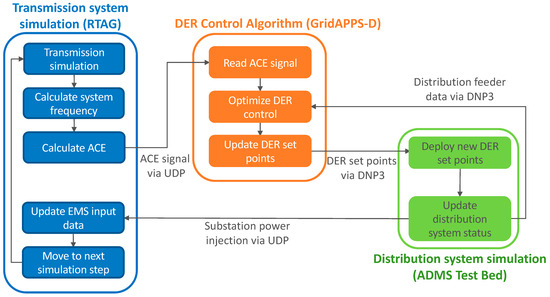
Figure 6.
Data flow diagram of the T&D co-simulation setup.
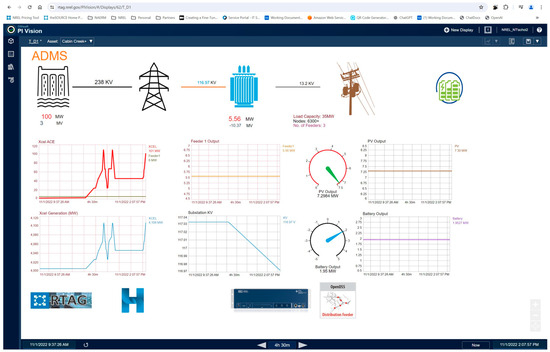
Figure 7.
T&D co-simulation interactive visualization.
4. Results and Case Study
4.1. Case Study Setup
The T&D co-simulation employs the Western Interconnection as the studied transmission system and a real distribution feeder in Colorado, USA, as the test distribution system. The simulated region is shown in Figure 8. The automatic generation control of the generating units inside Colorado are activated, while the automatic generation control of the generating units in the rest of the Western Interconnection is disabled, meaning that they will not ramp up/down to compensate for the power imbalance in the Colorado region. Detailed distribution feeder data is shown in Table 2. The simulation period starts at 12 pm, when the PV panels have the highest power output. Choosing a different time window with less PV generation will reduce the capacity of the DERs to provide frequency regulation, but it does not affect the T&D co-simulation test setup. For this analysis, it is also assumed that the initial battery state of charge is set to 50%, and the PV panels will generate approximately 50% of their available output capability. We intentionally set the low PV generation output to maximize the headroom for the frequency regulation service to amplify the impact of the DER response in this study. The frequency regulation capacity of the distribution system in the testing period is approximately 7 MW for both the regulation-up and regulation-down services. Note that the peak load capacity of U.S. Western Interconnection is around 140 GW in 2023 [27], which means the 7 MW frequency regulation capacity will have a minor impact on the system frequency profile. Thus, we will use the ACE signal as an indicator to verify the grid service performance. Distribution system operating constraints, such as line loading, and voltage constraints are incorporated into the DER control algorithm to ensure that the DER actions will not trigger grid constraint violations.
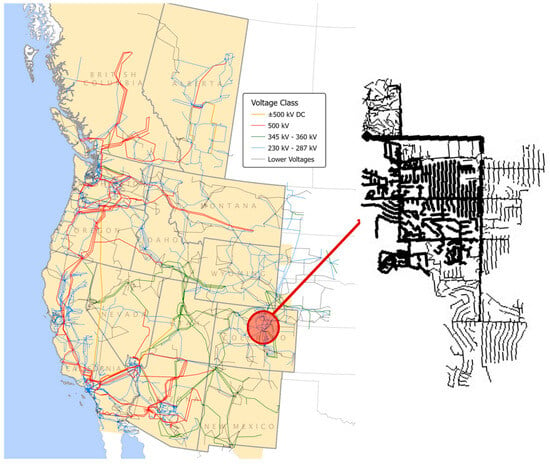
Figure 8.
Illustration of the test transmission and distribution systems.

Table 2.
Distribution system simulation data.
Before running the T&D co-simulation, the DER control algorithm discussed in Section 2 is first validated through offline testing, where a synthetic ACE signal is given to the control algorithm as input. The validation results are shown in Figure 8. The results indicate that the control error quickly decreased to near 0 within 10–20 iterations, where each iteration took less than 30 s. As shown in Figure 9, the employed DER control algorithm can effectively control the DERs to deliver the requested ramp-up/-down power and minimize the substation injection control error.
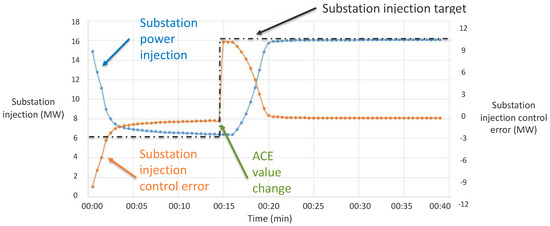
Figure 9.
DER control algorithm validation.
4.2. Co-Simulation Results
The co-simulation results using the setup discussed in Section 3 are shown in Figure 10. First, the co-simulation is initialized by establishing communication and manipulating the generation output of a selected generator to create a power imbalance. After the initialization, the ACE value is positive, meaning that the power generation is greater than the power demand; therefore, the power injection at the distribution substation, i.e., the active power net load, gradually increases to approach the control target explained in Section 2.2, which leads to a reduction in the power imbalance.
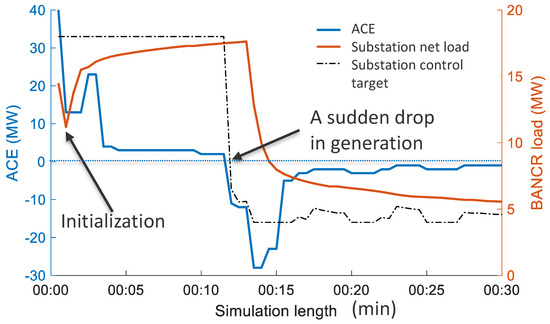
Figure 10.
T&D co-simulation result for the frequency regulation test case.
The control target is determined by the DER aggregator algorithm. The substation power is close to the control target within a few minutes of receiving the ACE signal, which meets the deployment delay requirement of the frequency regulation service. At 12 min of run time in the co-simulation, an event is created by tripping a power plant with 30 MW of generation output. This leads to a negative ACE value, meaning that the generation is now smaller than the power demand. The DER control algorithm observes the negative ACE signal and updates the DER set points, leading to a rapid drop in the substation net load consumption to make up for the loss of generation. After 20 min, the ACE value is stabilized at around 0 MW, which means that the generation and demand balance is restored.
Figure 10 illustrates the impact of the DER control on the bulk grid, which validates the feasibility of implementing DERs for bulk grid services. It is also concluded that the developed T&D co-simulation platform can successfully coordinate the T&D system simulators to test the T&D interactions and use cases. Throughout the simulation period, the voltage magnitudes in the distribution system are kept within the acceptable range from 0.95–1.05 p.u., as shown in Figure 11.
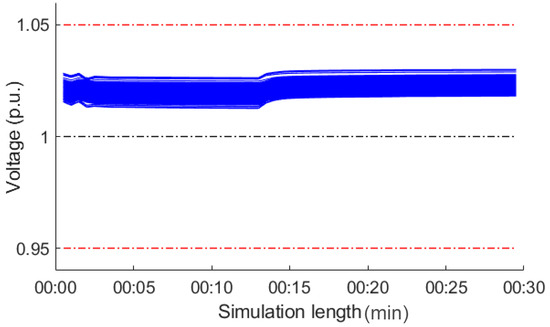
Figure 11.
Distribution system voltage profile during co-simulation.
Figure 12 demonstrates the control of the PV and battery during the co-simulation. In the first 12 min when the ACE is positive, the total power output of the PV is reduced to zero, and the batteries are ramping up their charging power to increase the power demand. After the sudden drop in the generation output at 12 min, the output of the PV rapidly ramps up to the maximum available output level. The batteries also switch from charging to discharging.
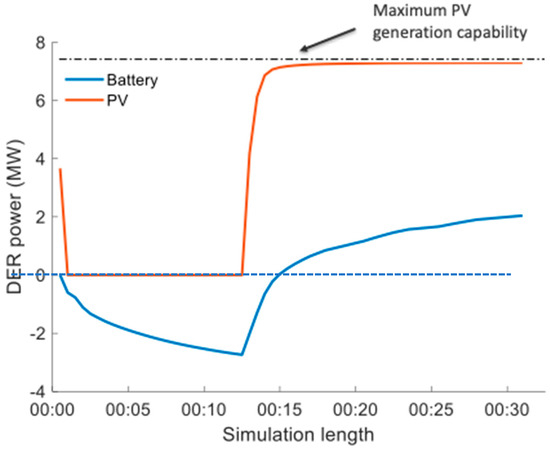
Figure 12.
Total power output from the PV and battery.
We also simulate another comparative case, the no-service case, where the DERs do not provide frequency regulation service. Figure 13 compares the ACE profiles of the grid service case to the no-service case. As shown, the ACE is much closer to zero in the grid service case, when the DERs are contributing to minimize the generation/demand imbalance. This shows that DERs are capable of providing quality ancillary services to the bulk grid, and their potential impact and contribution should not be underestimated.
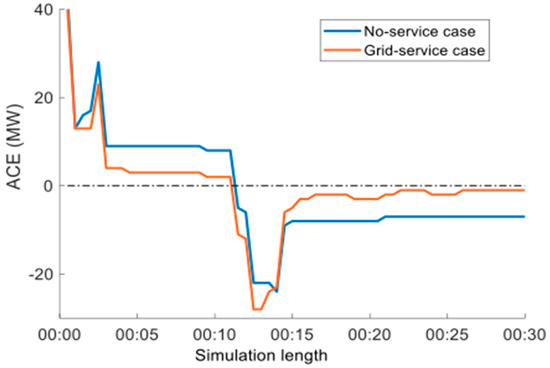
Figure 13.
ACE profile with and without service from DERs.
5. Conclusions
In this paper, we demonstrated a T&D co-simulation platform that coordinates different simulators and applications using HELICS in a realistic laboratory environment. The frequency regulation service is tested using the T&D co-simulation to validate the capability. The co-simulation results in this specific scenario showed that dispersed DERs can provide effective frequency support while maintaining voltage constraints in the distribution system with the proper control setup, and they illustrated the importance of analyzing the impact of DERs on T&D operations. The initial states of the PV units and batteries have been manipulated to create the maximum frequency regulation headroom for ease of demonstration. Appropriate DER aggregation and incentive programs should be in place to enable such scenarios in the real world. The developed T&D co-simulation platform has been proven to be efficient in simulating the interactions between T&D systems, and it can be used for future use case analyses, such as resilience studies and stability analysis.
Author Contributions
Methodology, V.R.M., W.L., J.H., H.V.P., U.K., S.L.C. and I.M.; Validation, V.R.M.; Project administration, W.L. All authors have read and agreed to the published version of the manuscript.
Funding
Funding provided by U.S. Department of Energy Office of Electricity, Advanced Grid Research & Development, grant number 31028.
Data Availability Statement
The original contributions presented in the study are included in the article, further inquiries can be directed to the corresponding author.
Acknowledgments
This work was authored by the National Renewable Energy Laboratory, operated by the Alliance for Sustainable Energy, LLC, for the U.S. Department of Energy (DOE) under Contract No. DE-AC36-08GO28308. Funding provided by the U.S. Department of Energy Office of Electricity, Grid Controls and Communications division. The views expressed in the article do not necessarily represent the views of the DOE or the U.S. Government. The publisher, by accepting the article for publication, acknowledges that the U.S. Government retains a nonexclusive, paid-up, irrevocable, worldwide license to publish or reproduce the published form of this work, or allow others to do so, for U.S. Government purposes. The authors thank Annabelle Pratt, NREL, ADMS Test Bed lead for providing support and feedback on the paper, Jeff Simpson, formerly with NREL, for the initial contribution of this T&D co-simulation work, and Xcel Energy for providing data and technical support.
Conflicts of Interest
The authors declare no conflict of interest.
References
- Bharati, A.K.; Ajjarapu, V.; Du, W.; Liu, Y. Role of distributed inverter-based-resources in bulk grid primary frequency response through HELICS based SMTD co-simulation. IEEE Syst. J. 2023, 17, 1071–1082. [Google Scholar] [CrossRef]
- Wang, J.; Padullaparti, H.; Veda, S.; Mendoza, I.; Tiwari, S.; Baggu, M. Performance evaluation of data-enhanced hierarchical control for grid operations. In Proceedings of the 2020 IEEE Power & Energy Society General Meeting (PESGM), Montreal, QC, Canada, 2–6 August 2020; 5p. [Google Scholar]
- Zhou, E.; Hurlbut, D.; Xu, K. A Primer on FERC Order No. 2222: Insights for International Power Systems. National Renewable Energy Laboratory. NREL/TP-5C00-80166. Available online: https://www.nrel.gov/docs/fy21osti/80166.pdf (accessed on 15 May 2024).
- Jain, H.; Bhatti, B.A.; Wu, T.; Mather, B.; Broadwater, R. Integrated Transmission-and-Distribution System Modeling of Power Systems: State-of-the-Art and Future Research Directions. Energies 2021, 14, 12. [Google Scholar] [CrossRef]
- Mohseni-Bonab, S.M.; Hajebrahimi, A.; Kamwa, I.; Moeini, A. Transmission and distribution co-simulation: A review and propositions. IET Gener. Transm. Distrib. 2020, 14, 4631–4642. [Google Scholar] [CrossRef]
- Huang, Q.; Huang, R.; Fan, R.; Fuller, J.; Hardy, T.; Huang, Z.; Vittal, V. A Comparative Study of Interface Techniques for Transmission and Distribution Dynamic Co-Simulation. In Proceedings of the 2018 IEEE Power & Energy Society General Meeting (PESGM), Portland, OR, USA, 5–10 August 2018; pp. 1–5. [Google Scholar] [CrossRef]
- Balasubramaniam, K.; Abhyankar, S. A combined transmission and distribution system co-simulation framework for assessing the impact of Volt/VAR control on transmission system. In Proceedings of the 2017 IEEE Power & Energy Society General Meeting, Chicago, IL, USA, 16–20 July 2017; pp. 1–5. [Google Scholar] [CrossRef]
- Wang, W.; Fang, X.; Cui, H.; Li, F.; Liu, Y.; Overbye, T.J. Transmission-and-Distribution Dynamic Co-Simulation Framework for Distributed Energy Resource Frequency Response. IEEE Trans. Smart Grid 2022, 13, 482–495. [Google Scholar] [CrossRef]
- Zhu, X.; Emmanuel, M.; Giraldez, J.; Krad, I.; Wang, W.; Palmintier, B.; Chen, W.-H.; Hirayama, A.; Asano, M. Real-World Distribution System Modeling Framework for Transmission-and-Distribution Cosimulation, National Renewable Energy Laboratory. NREL/CP-5D00-74839. Available online: https://www.nrel.gov/docs/fy20osti/74839.pdf (accessed on 15 May 2024).
- Sadnan, R.; Krishnamoorthy, G.; Dubey, A. Transmission and Distribution (T&D) Quasi-Static Co-Simulation: Analysis and Comparison of T&D Coupling Strength. IEEE Access 2020, 8, 124007–124019. [Google Scholar] [CrossRef]
- Bharati, A.K.; Ajjarapu, V. Investigation of Relevant Distribution System Representation With DG for Voltage Stability Margin Assessment. IEEE Trans. Power Syst. 2020, 35, 2072–2081. [Google Scholar] [CrossRef]
- Liu, Y.; Huang, R.; Du, W.; Singhal, A.; Huang, Z. Highly Scalable Transmission and Distribution Dynamic Co-Simulation With 10,000+ Grid-Following and Grid-Forming Inverters. IEEE Trans. Power Deliv. 2024, 39, 578–590. [Google Scholar] [CrossRef]
- Jain, H.; Palmintier, B.; Krad, I.; Krishnamurthy, D. Studying the Impact of Distributed Solar PV on Power Systems Using Integrated Transmission and Distribution Models. In Proceedings of the 2018 IEEE/PES Transmission and Distribution Conference and Exposition (T&D), Denver, CO, USA, 6–19 April 2018; pp. 1–5. [Google Scholar] [CrossRef]
- Yip, J.; Nguyen, Q.; Santoso, S. Analysis of effects of distribution system resources on transmission system voltages using joint transmission and distribution power flow. In Proceedings of the 2020 IEEE Power & Energy Society General Meeting (PESGM), Montreal, QC, Canada, 2–6 August 2020; pp. 1–5. [Google Scholar]
- Paduani, V.; Kadavil, R.; Hooshyar, H.; Haddadi, A.; Jakaria, A.; Huque, A. Real-Time T&D Co-Simulation for Testing Grid Impact of High DER Participation. In Proceedings of the 2023 IEEE PES Grid Edge Technologies Conference & Exposition (Grid Edge), San Diego, CA, USA, 10–13 April 2023. [Google Scholar]
- U.S. Department of Energy. Quadrennial Energy Review: Transforming the Nation’s Electricity System: The Second Installment of the QER; 2017. Available online: https://www.energy.gov/sites/prod/files/2017/02/f34/Quadrennial%20Energy%20Review--Second%20Installment%20%28Full%20Report%29.pdf (accessed on 15 May 2024).
- Bernstein, A.; Dall’Anese, E. Bi-Level dynamic optimization with feedback. In Proceedings of the 5th IEEE Global Conference on Signal and Information Processing (GlobalSIP), Montreal, QC, Canada, 14–16 November 2017; 5p. [Google Scholar]
- Plazas, M.A.; Conejo, A.J.; Prieto, F.J. Multimarket optimal bidding for a power producer. IEEE Trans. Power Syst. 2005, 20, 2041–2050. [Google Scholar] [CrossRef]
- Palmintier, B.; Krishnamurthy, D.; Top, P.; Smith, S.; Daily, J.; Fuller, J. Design of the HELICS high-performance transmission-distribution-communication-market co-simulation framework. In Proceedings of the 2017 Workshop on Modeling and Simulation of Cyber-Physical Energy Systems (MSCPES), Pittsburgh, PA, USA, 21 April 2017; 6p. [Google Scholar]
- National Renewable Energy Laboratory. Control Room of the Future. Available online: https://www.nrel.gov/grid/control-room.html (accessed on 15 May 2024).
- National Renewable Energy Laboratory. Advanced Distribution Management Systems. Available online: https://www.nrel.gov/grid/advanced-distribution-management.html (accessed on 15 May 2024).
- Pratt, A.; Baggu, M.; Ding, F.; Veda, S.; Mendoza, I.; Lightner, E. A test bed to evaluate advanced distribution management systems for modern power systems. In Proceedings of the IEEE EUROCON 2019—18th International Conference on Smart Technologies, Novi Sad, Serbia, 1–4 July 2019; 6p. [Google Scholar]
- Melton, R.B.; Schneider, K.P.; Vadari, S. GridAPPS-D™ a distribution management platform to develop applications for rural electric utilities. In Proceedings of the 2019 IEEE Rural Electric Power Conference (REPC), Bloomington, MN, USA, 28 April–1 May 2019; pp. 13–17. [Google Scholar]
- IEEE 1815-2012; Standard for Electric Power Systems Communications—Distributed Network Protocol (DNP3). IEEE: Piscataway, NJ, USA, 2012.
- Emma, R.; Prabakar, K.; Tiwari, S.; Mendoza, I.; Padullaparti, H.; Mather, B.; Vaidhynathan, D.; Li, J.; Brozek, M.; Tarres, M. Enabling Realistic Communications Evaluations for ADMS. National Renewable Energy Laboratory: Golden, CO, USA. NREL/TP-5D00-80474. 2021. Available online: https://www.nrel.gov/docs/fy21osti/80474.pdf (accessed on 15 May 2024).
- Singh, A.; Motakatla, V.R.; Allwardt, C.H.; Padullaparti, H.; Mendoza, I.; Sharma, P. A Framework to Demonstrate a DNP3 Interface With a CIM-based Data Integration Platform. In Proceedings of the 2024 IEEE PES General Meeting, Seattle, WA, USA, 21–25 July 2024. [Google Scholar]
- U.S. Energy Information Administration. Peak Hourly U.S. Electricity Demand in July was the Second Highest Since 2016. Available online: https://www.eia.gov/todayinenergy/detail.php?id=60602 (accessed on 15 May 2024).
Disclaimer/Publisher’s Note: The statements, opinions and data contained in all publications are solely those of the individual author(s) and contributor(s) and not of MDPI and/or the editor(s). MDPI and/or the editor(s) disclaim responsibility for any injury to people or property resulting from any ideas, methods, instructions or products referred to in the content. |
© 2024 by the authors. Licensee MDPI, Basel, Switzerland. This article is an open access article distributed under the terms and conditions of the Creative Commons Attribution (CC BY) license (https://creativecommons.org/licenses/by/4.0/).