1. Introduction
The power output from solar cells is easily affected by climate and lighting. The quality of the power supply is more unstable than the supply from thermal generation systems because the power generated by photovoltaics (PVs) is intermittent and only generates electricity during the day. A high number of PV power sources may cause grid instability and threaten the security of the grid. The addition of a large amount of PV power also makes adjustment of the system frequency more sensitive. When a large-scale accident occurs, a decrease in the power system frequency is more significant, so maintaining the reliability of system operation is more challenging.
In order to reduce the impact of a large amount of PV power being added to the system, accurate PV power estimation is necessary to reduce the instability in the power generation system. If the power forecast is too high, the energy management system (EMS) must reserve more power for the grid, increasing operating costs. However, if the power forecast is too low, insufficient power reservation will cause system instability.
Precise parameter estimation for PV modules allows for accurate power estimation and reduces the instability for the EMS. Because weather conditions change regularly, an accurate and reliable parameter predictive model to represent the actual behavior of a PV power system is crucial [
1]. When PV modules are produced, the manufacturer specifies the parameters for the standard test condition (STC), such as the open-circuit voltage, the short-circuit current, the output voltage and current for the maximum power point, the temperature coefficient for the short-circuit current and the temperature coefficient for open-circuit voltage. These parameters may change over a period of operation. A correction is required to produce an accurate PV power output.
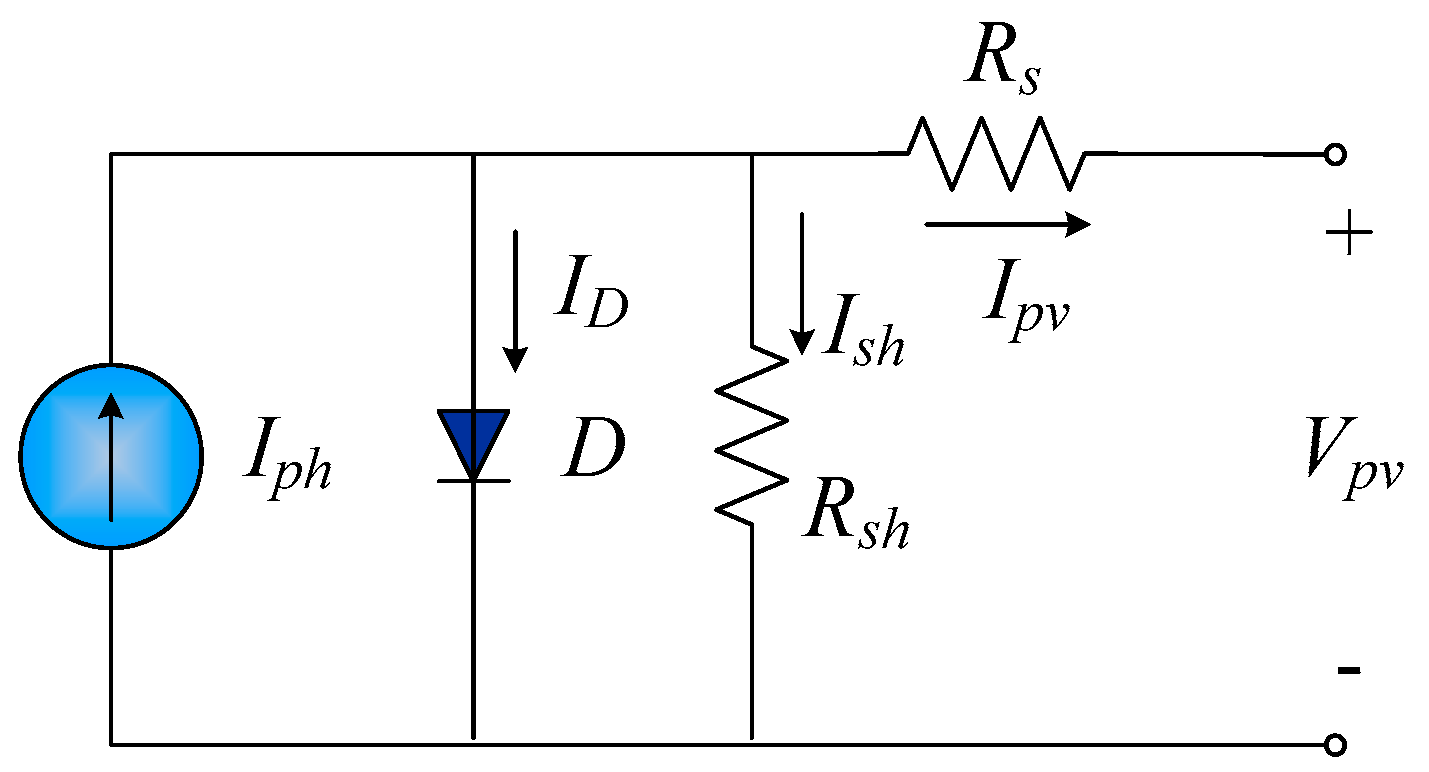
The physical models of PV modules presented in the literature include a single-diode model, a two-diode model and a three-diode model. The single-diode model [
2,
3,
4,
5] is the most widely used method, which consists of a four-parameter model and a five-parameter model. The internal parameters for a four-parameter model include photocurrent, dark saturation current, ideality factor and series resistance. This model assumes that the parallel resistance is infinite, so the open-circuit voltage decreases and does not fully reflect the leakage current for a P-N junction, which results in a large difference between the predicted and actual power. The five-parameter model considers the effect of parallel resistors, so the complexity of the model increases, but the predicted power is more accurate than that of a four-parameter model.
The two-diode model [
6,
7,
8,
9] is more complex than the single-diode model because there is an extra diode. For a two-diode model, the dark saturation current corresponds to two diodes and is produced by diffusion and recombination in the space charge region. This model gives an accurate prediction if there is low irradiance and shading, but there is an extra exponential term in the mathematical model, so the computational burden is increased. For a three-diode model [
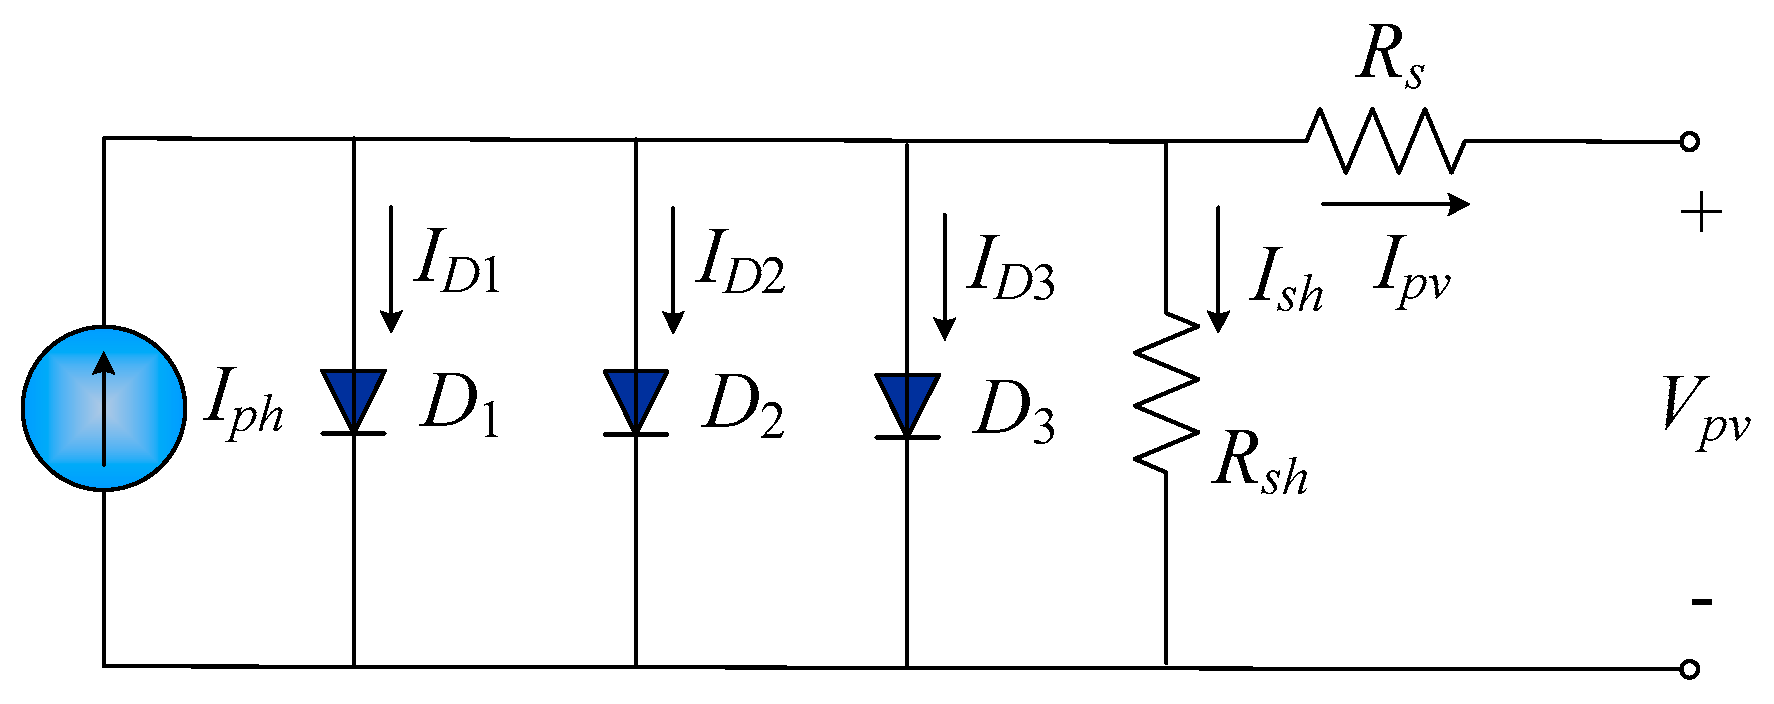
10,
11,
12,
13,
14,
15], the dark saturation current is generated by three diodes and includes the diffusion and the recombination current for the emitter and the P-N junction, the recombination current for the depletion region and the current that is generated by the leakage current and the grain boundary effect. A three-diode model additionally uses the grain boundary effect and the influence of the leakage current, so it is more accurate. However, the number of parameters increases to nine, so the model is more complicated.
In addition to diode models, one study [
16] used an analytical method to determine the internal parameters of solar cells via I–V (current–voltage) curves. This method may not perform well for a certain range of solar cell fill factors (FFs). Taking this problem into account, study [
17] used an explicit two-piece quadratic model (ETPQM) to improve the accuracy of the I–V curves with higher consistency over a wider FF range. To further improve the accuracy of the ETPQM model and shorten the execution time, a low-complexity search-based parameter extraction method was proposed in study [
18]. This method used a new I–V point condition to allow all the model parameters to be expressed as functions of auxiliary parameters belonging to a subset of unit intervals, whose complexity is further reduced. Most methods that use I–V curves to extract parameters only focus on five-parameter models, which may not be sufficient to accurately represent the characteristics of solar cells. The three-diode model used in this study considers nine parameters and can provide more accurate estimates than using the I–V curve method.
In addition to providing accurate power estimation results, precise parameter estimation also aids in preliminary fault diagnosis for PV modules. The main internal parameters of PV modules consist of the photocurrent, dark saturation current, ideality factor, series resistance and parallel resistance. If the estimated series resistance increases, the efficiency of the PV modules will decrease, and the solar cells begin to degrade. If the estimated parallel resistance is reduced, the solar cells may become oxidized due to thermal cycles. When the estimated values for the ideality factor and dark saturation current increase, this means that the PV modules will degrade faster.
The use of parameter estimation results for preliminary fault diagnosis of PV modules is cost-effective. Possible faults in PV power generation systems include module faults, power electronics (converter) faults or grid-side faults [
19]. This study involves preliminary fault diagnosis for PV modules. To address the preliminary fault diagnosis problem, one study [
20] proposed a low-cost I–V curve tracking method. An I–V curve with 26 points can be constructed within 200 ms. The real-time measurement data are used to extract the fault features for the five parameters of a single-diode model or the main characteristics of the I–V curves. The results show that the method using the main characteristics can accurately determine the degradation of the series and shunt resistances, while the method using the estimated parameters can be used to monitor long-term degradation effects. Using measurements for I–V curves, one study [
21] proposed a fault diagnosis program that defines the current ratio (the ratio of the maximum current to the short-circuit current) and the voltage ratio (the maximum voltage to the open-circuit voltage). Possible faults are determined by accurately calculating the current ratio and the voltage ratio. In study [
22], a standard error method was proposed to compare the difference in the I–V curves for normal operation and shading, which is used to determine whether there is a shading fault. Another study [
23] provides a literature review of parameter estimation and fault detection for PV systems.
As mentioned in [
10,
11,
12,
13,
14,
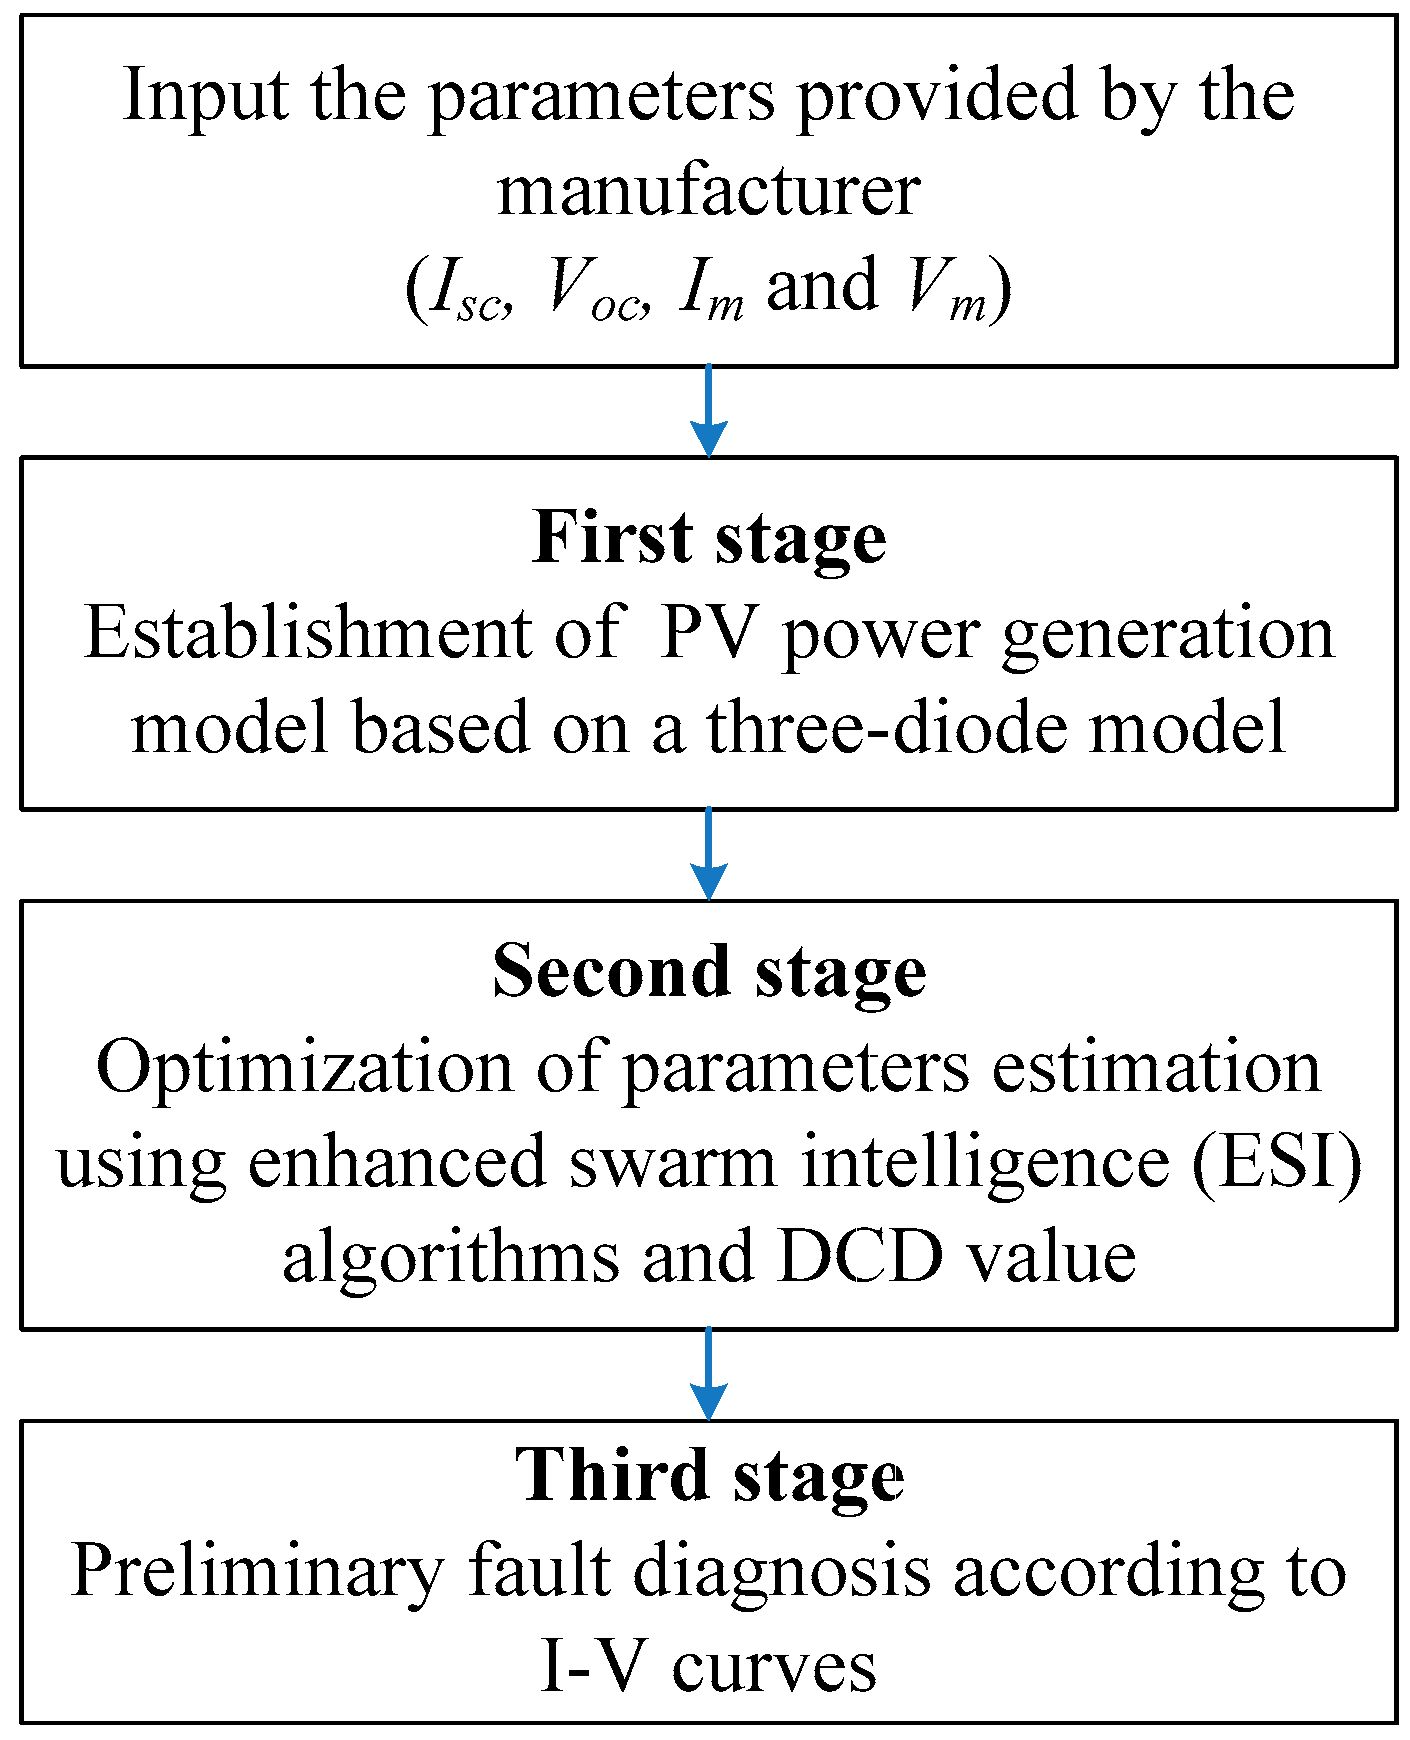
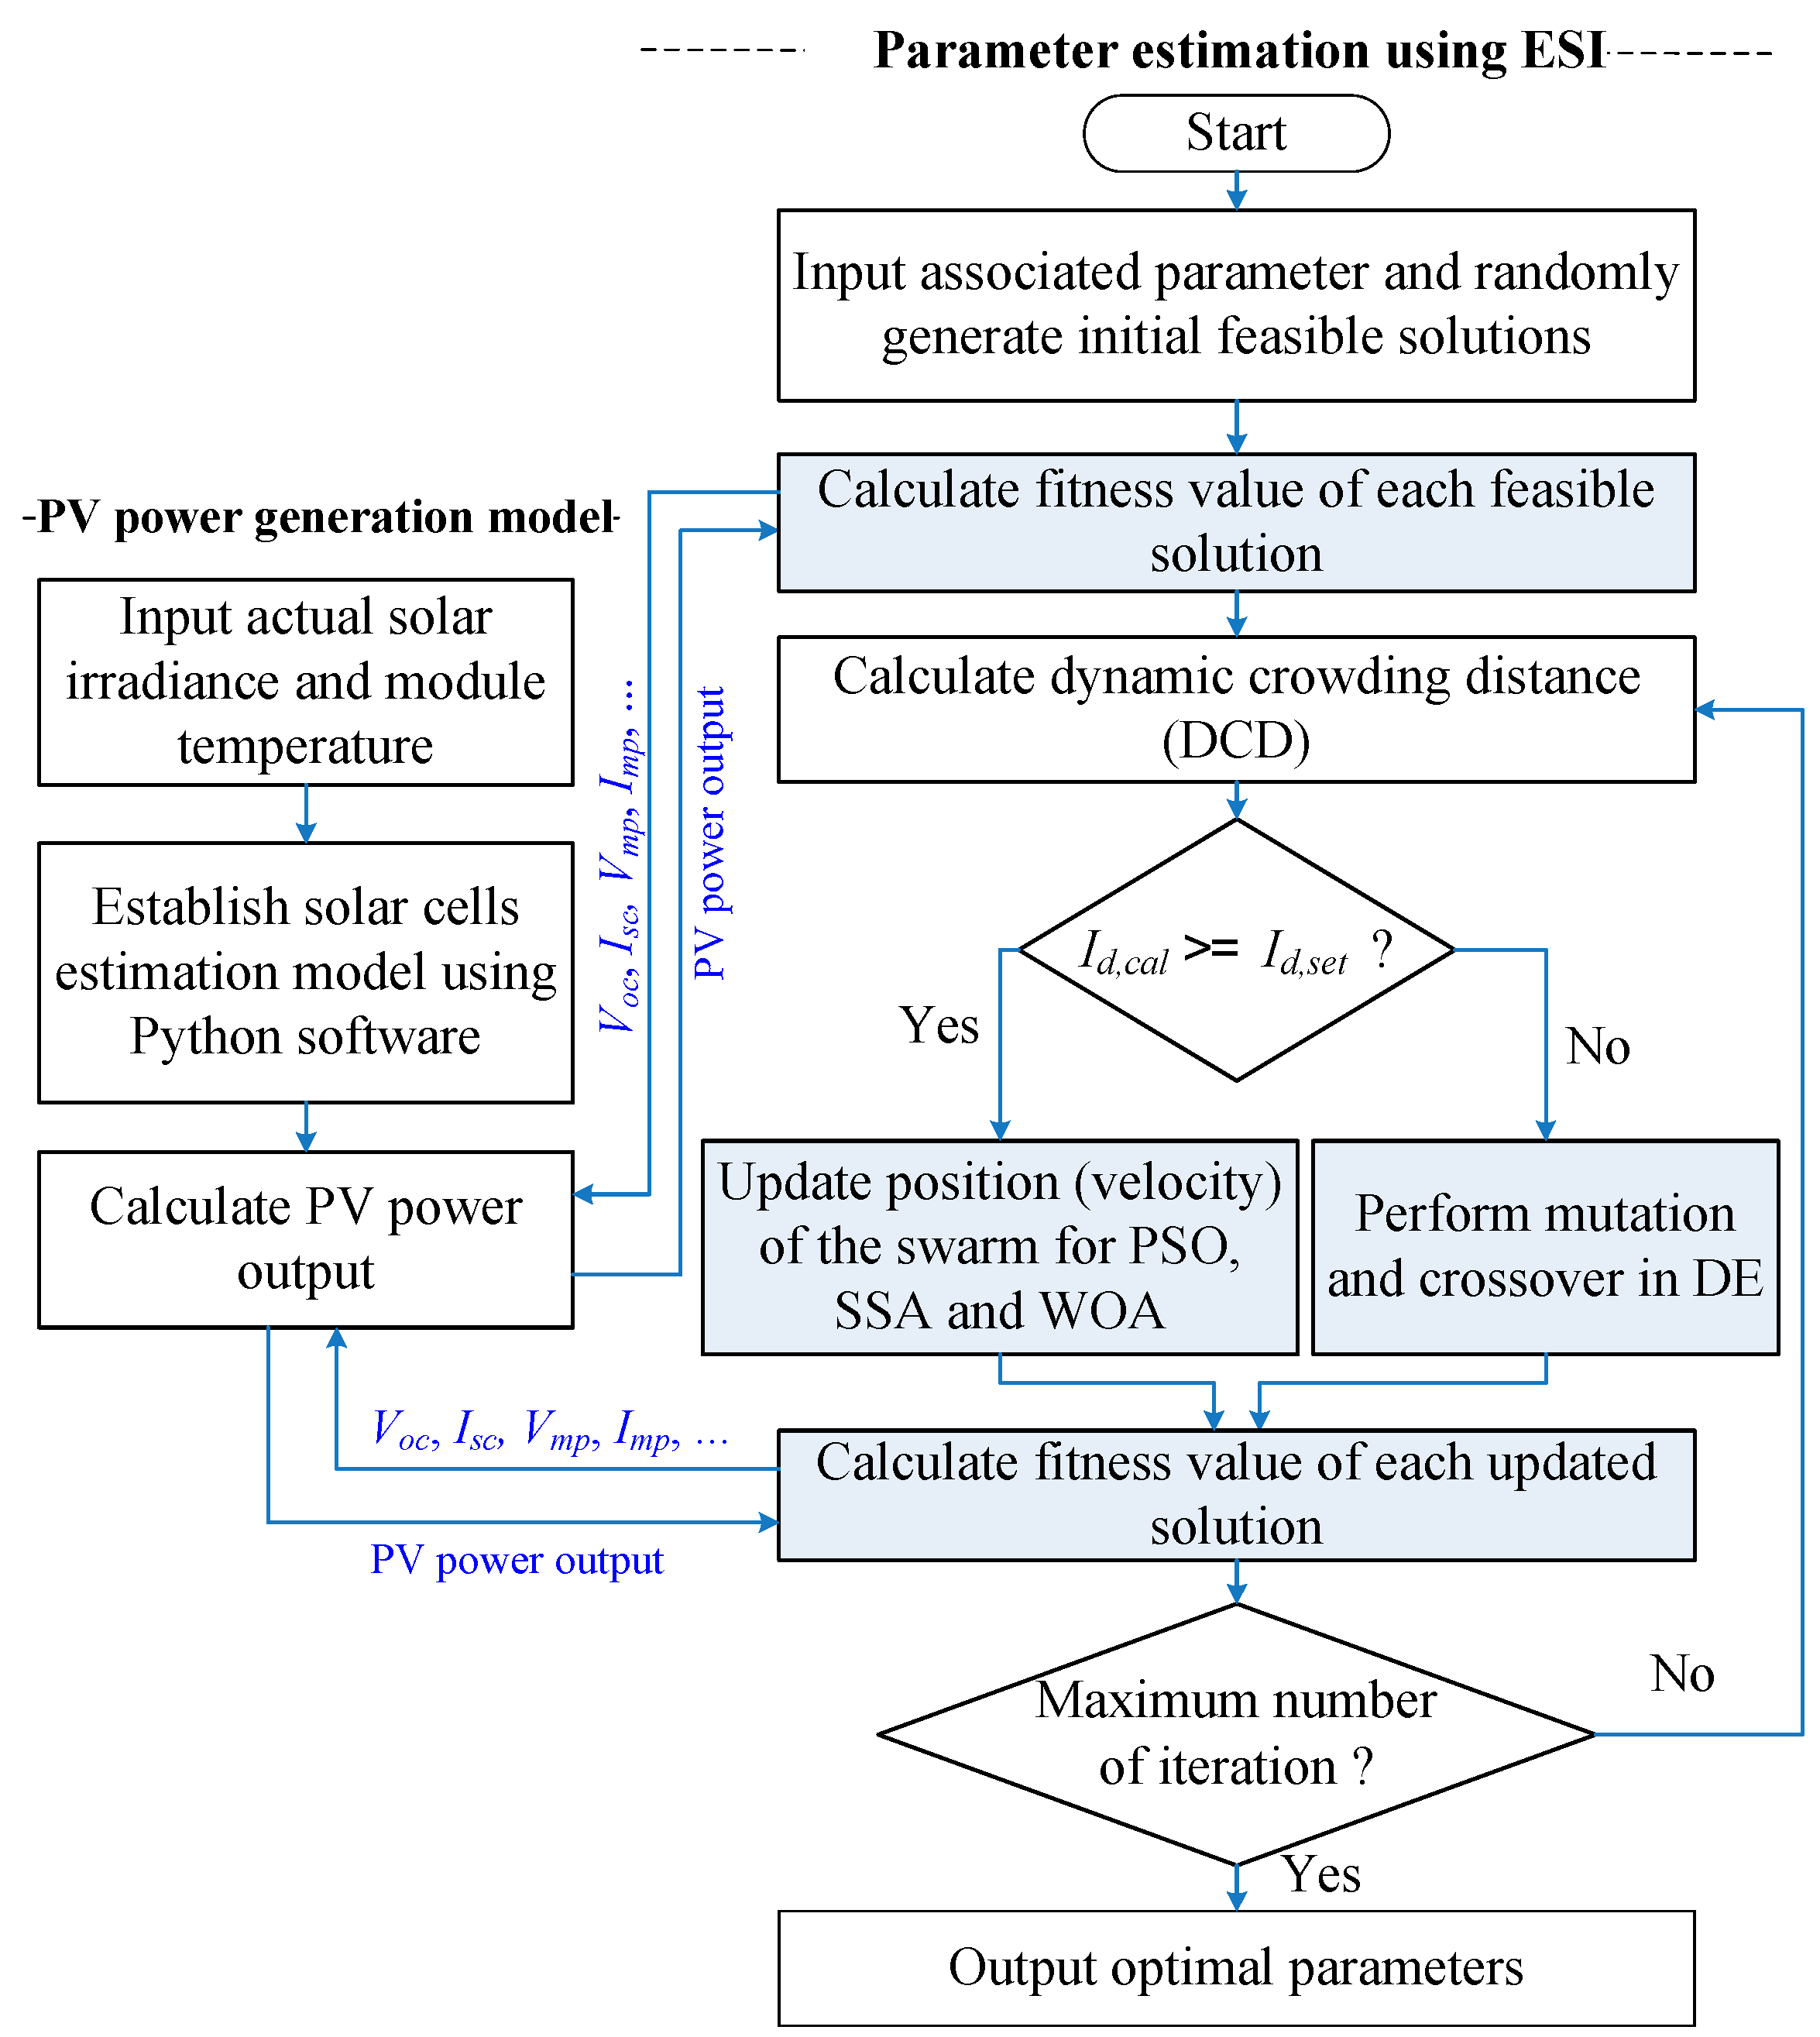
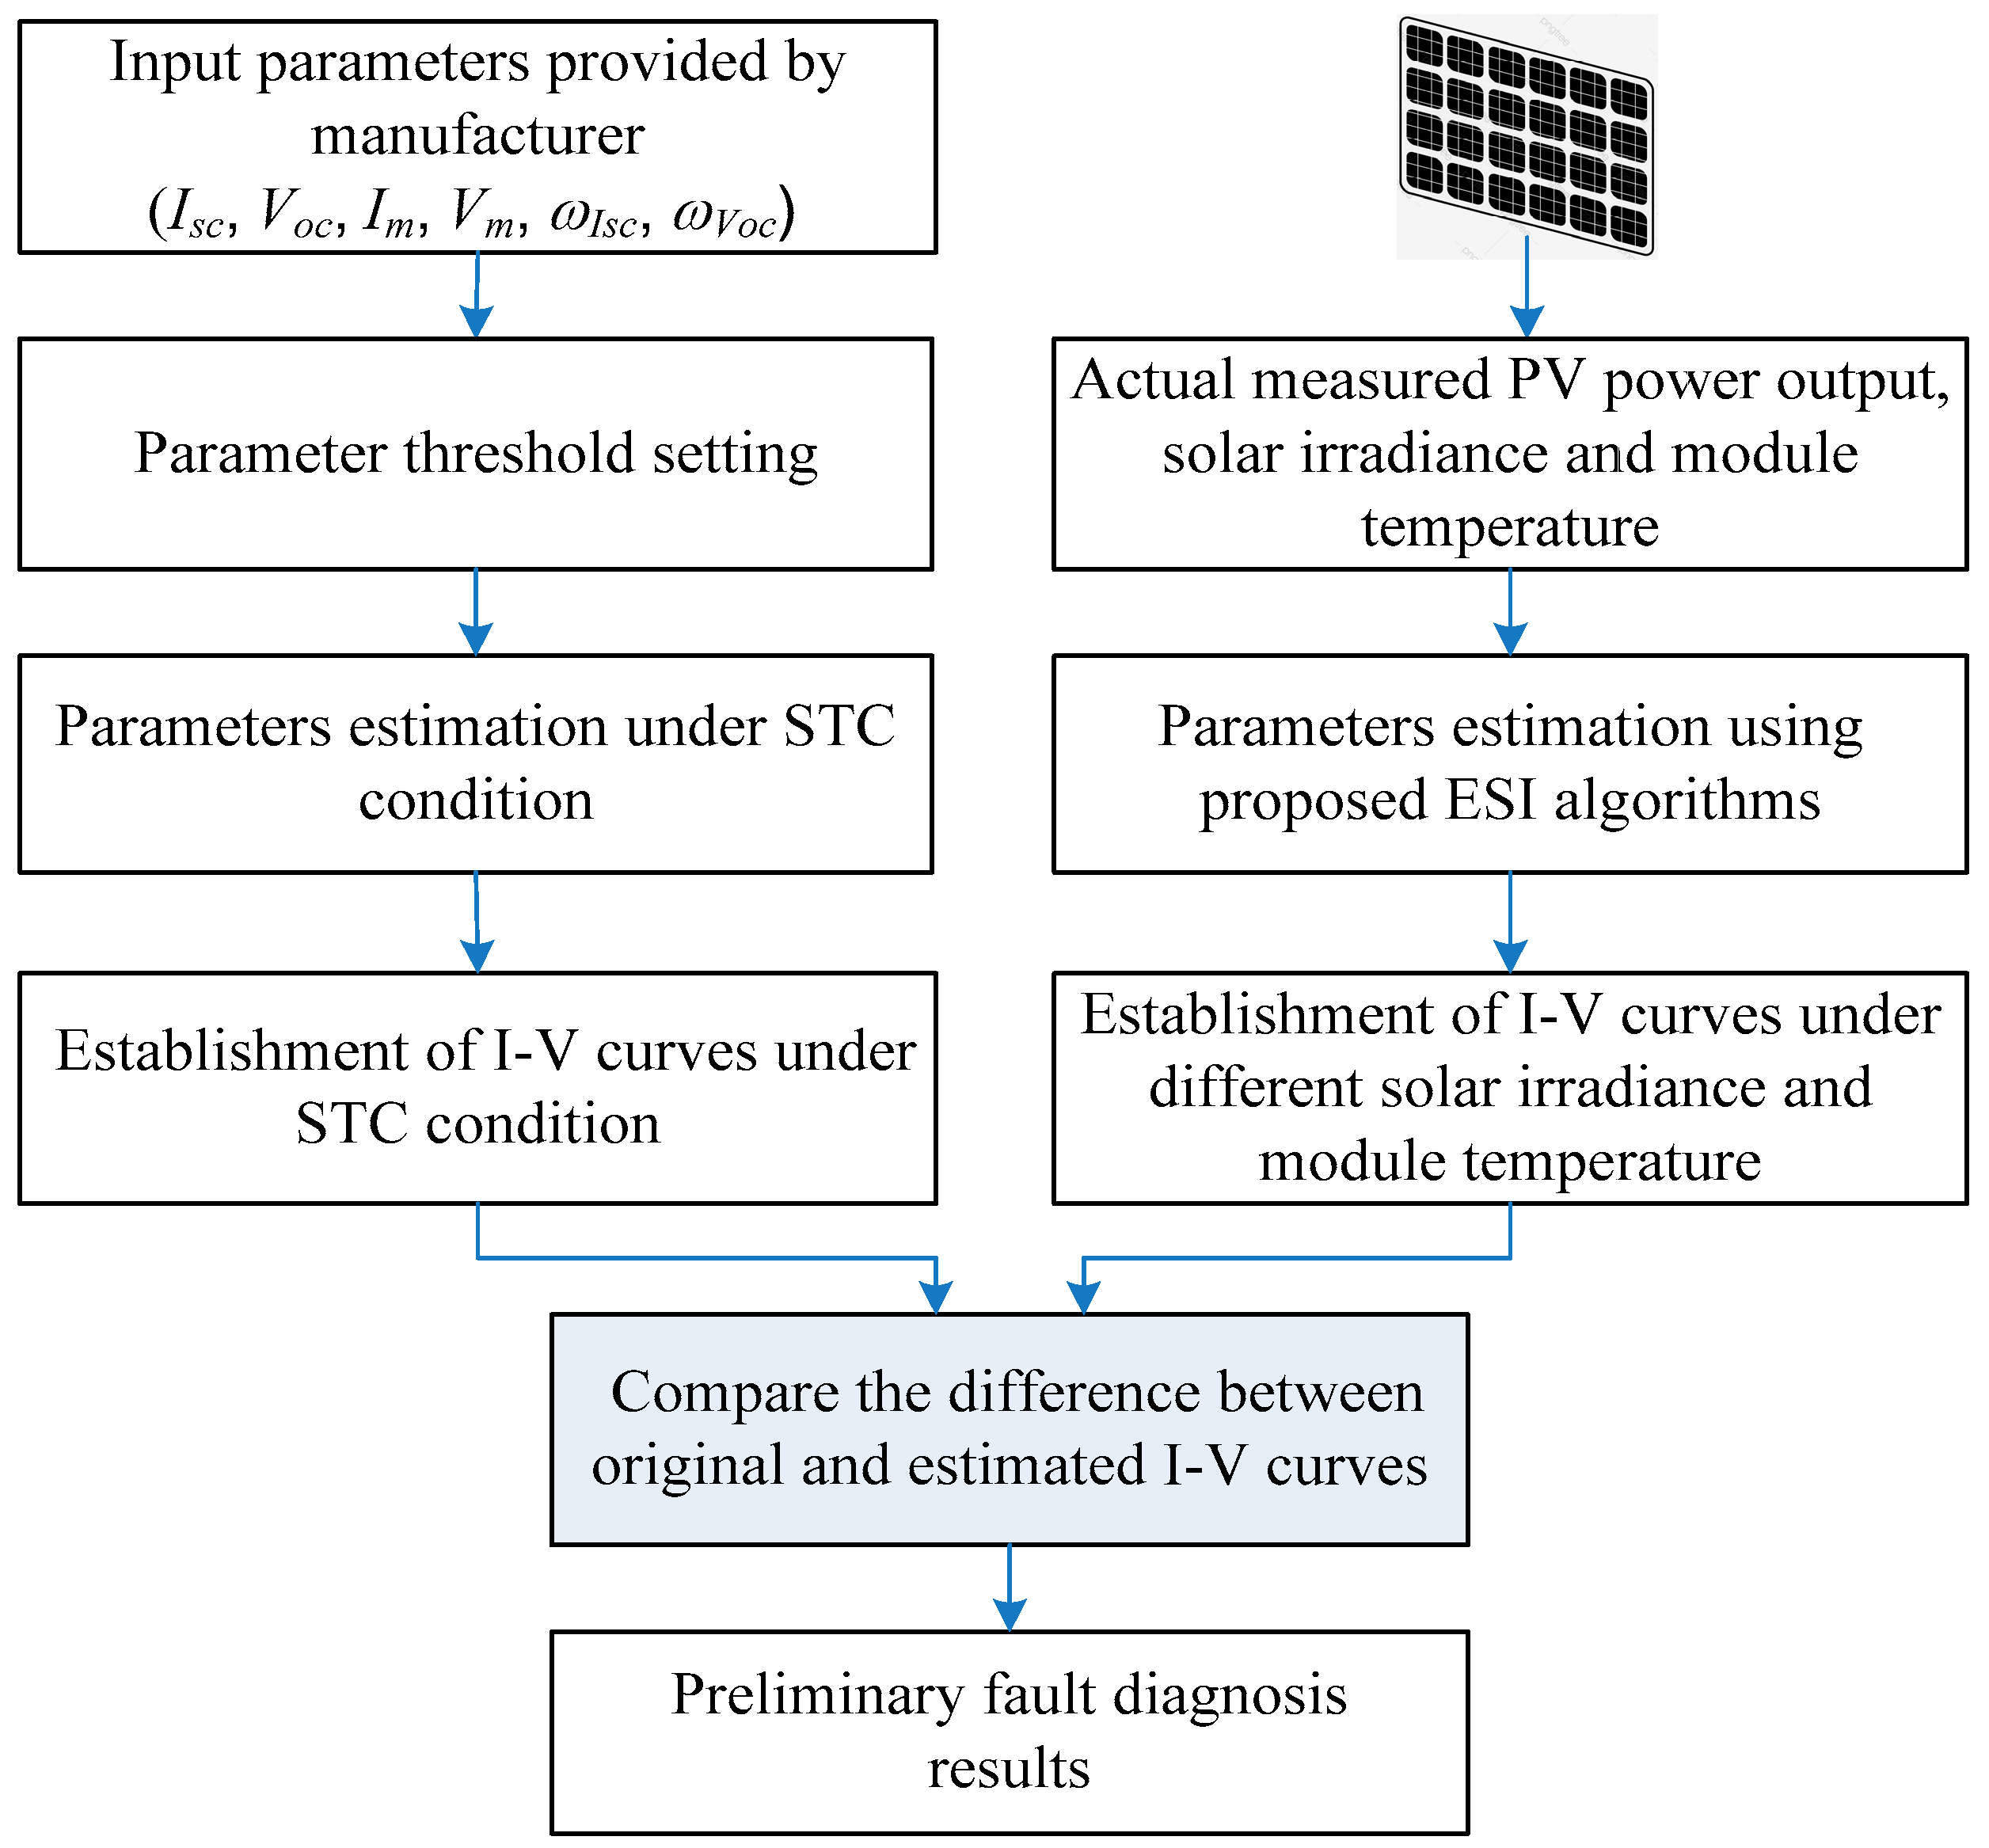
15], distinct optimization algorithms have been proposed to optimize the nine parameters for a three-diode model. In this study, to create a more refined estimation model, the 9 parameters are transformed into 16 parameters for different solar irradiances and module temperatures. To accurately estimate the parameter values, an enhanced swarm intelligence (ESI) algorithm is used to optimize these parameters. An index of the dynamic crowing distance (DCD) is used to check whether the mutation and crossover operations in DE are performed to increase the estimation accuracy of the three-diode model. The enhanced swarm intelligence algorithms that are used are enhanced particle swarm optimization (EPSO), the enhanced salp swarm algorithm (ESSA) and the enhanced whale optimization algorithm (EWOA). When the parameters of the three-diode model are accurately estimated using an ESI algorithm, the I–V curves for different solar irradiances are established using the obtained parameters. Possible faults for PV modules are then predicted at an early stage using changes in the I–V curves.
The main contributions of this paper are the following:
Three different diode models are used to establish a PV power generation model using the same database. The three-diode model is confirmed to be more accurate than single- and two-diode models. Different from the existing methods, the 9 parameters of the three-diode model are transformed into 16 parameters to further provide more accurate and refined estimates.
Three enhanced swarm intelligence (ESI) algorithms such as EPSO, ESSA and EWOA are used to compare the differences in parameter estimation results. In ESI, the mutation and crossover operations in DE are used to enhance the randomness and variability of the population based on an index of the dynamic crowing distance. The reliability of the proposed ESI algorithms is confirmed using different testing data sets.
The proposed preliminary fault diagnosis method does not require any additional detection devices, which is cost-effective for predicting possible preliminary faults in PV modules at an early stage. Changes in the I–V curve as well as changes in the series resistance, parallel resistance, ideality factor and dark saturation current indicate that the PV modules may be oxidized and degraded, which must be further addressed by maintenance operators.
The rest of this paper is organized as follows.
Section 2 introduces the PV power generation models, including single-, two- and three-diode models.
Section 3 describes the proposed ESI algorithms for parameter estimation. The preliminary fault diagnosis method is also introduced in this section. In
Section 4, the simulation results for a 200 kWp PV power generation system are presented. Conclusions are given in
Section 5.
4. Numerical Results
The proposed method is applied to a 200 kWp PV power generation system. Data were collected in 2019 from January to December with a resolution of one hour and include historical PV power output, solar irradiance and module temperature, which were provided by the cooperation company. The historical PV power data are collected using a Hioki power meter, while the data on solar irradiance and module temperature are collected using a Fluke luminometer which satisfies the international test requirements [
39]. When outlier data are deleted, 80% of the remaining data are used for training, and 20% are used for testing. During the training stage, ESI algorithms are used to determine the parameter values for a three-diode power generation model. During the testing stage, data for 10 days, which include five different weather types, such as sunny, light cloud, cloudy, heavy cloud and rain, are used to verify the performance of the constructed PV power generation model. These five weather types are taken from the weather forecasts of the Taiwan Central Weather Administration (TCWA). The program is executed using Python version 3.9.12 software in a Win-11 system with i7-10700 CPU.
The criterion for the mean relative error (MRE) is used to determine the estimation accuracy.
where
is the actual power,
is the estimated power,
is the capacity of the PV power generation system and
is the number of data to be estimated.
4.1. Parameter Estimation Results
The PV manufacturer specifies values for six basic parameters: open-circuit voltage (
), short-circuit current (
), maximum voltage (
), maximum current (
), the temperature coefficient for a short-circuit current (
) and the temperature coefficient for open-circuit voltage (
). Values for other parameters that are not provided by the manufacturer must be set according to the experience of the operators or determined using a Newtonian iteration method.
Table 2 shows the range of parameter settings for a three-diode power generation model.
Table 3 shows the parameter values for the PSO algorithm, SSA and WOA.
The optimization process uses a population size of 60 and 1000 iterations.
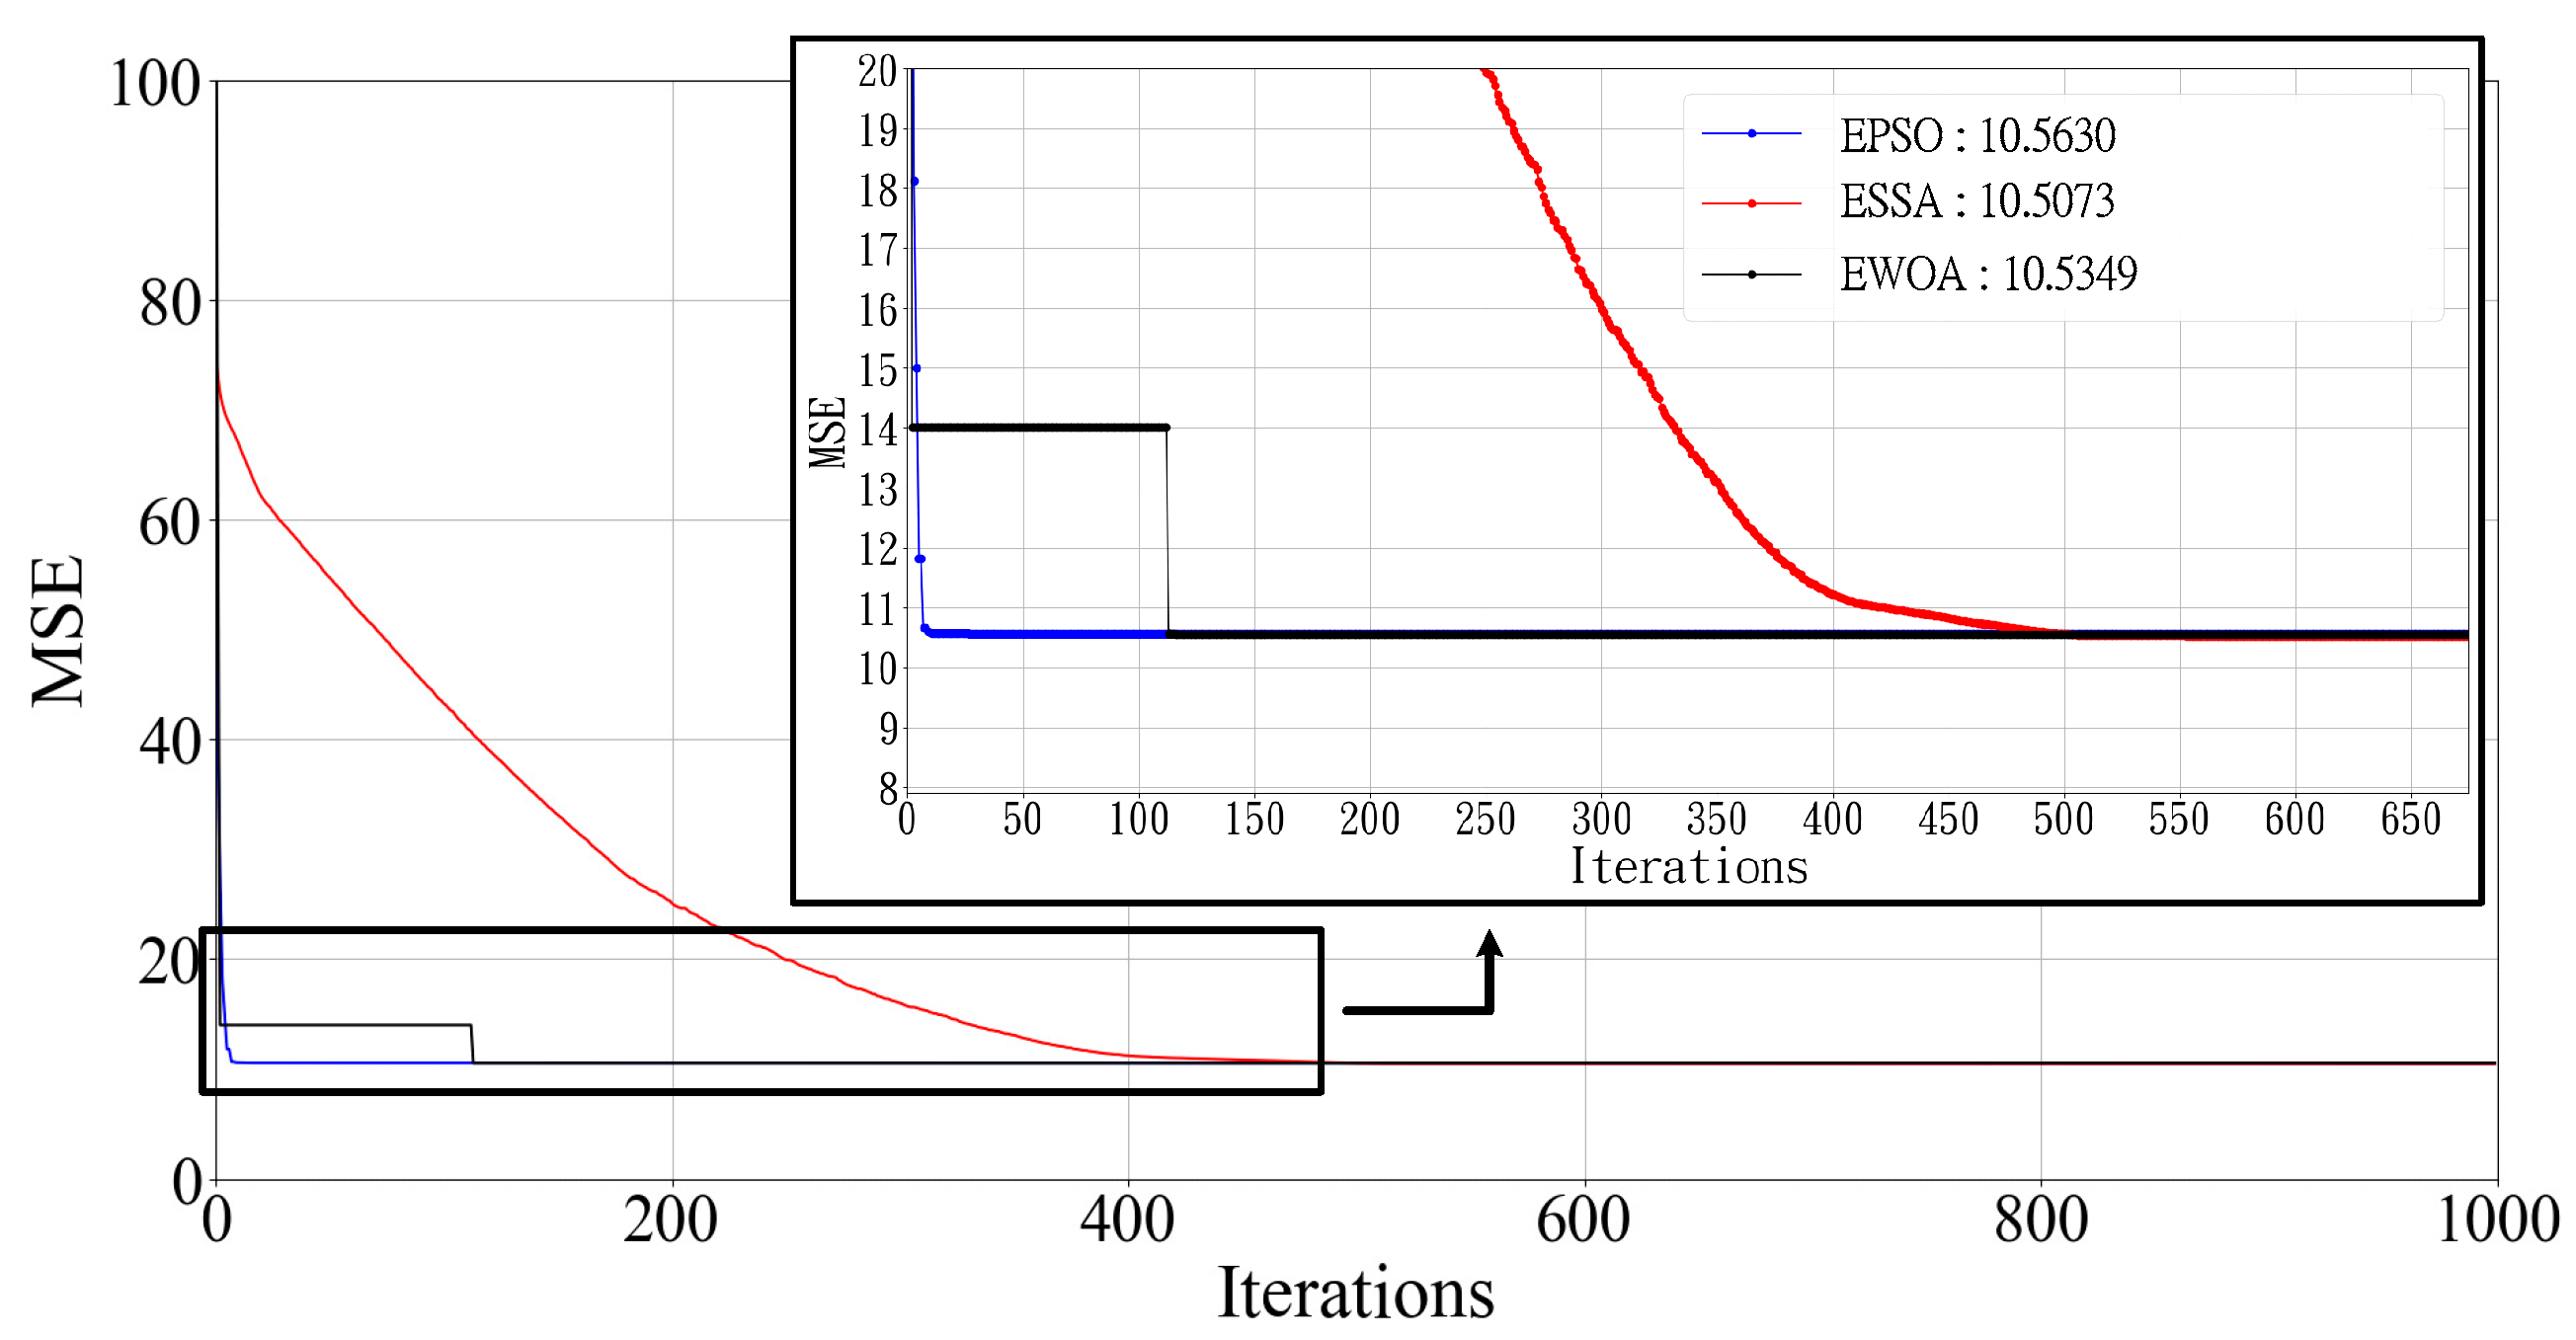
Figure 8 shows the convergence of the three optimization algorithms. EPSO converges faster than the ESSA and EWOA methods. The execution time for 1000 iterations of each of the three algorithms is about 1 h 20 min to 1 h 30 min. The respective fitness values (MSE) using EPSO, the ESSA and the EWOA are 10.563, 10.507 and 10.535.
Table 4 shows the parameter values before and after optimization.
Figure 9 shows the estimation results for four different weather types. The curves marked with “Actual” in the figure represent the actual measured values of the PV power data. Regardless of the weather conditions, the estimation results for the three ESI methods are very close.
Table 5 shows the estimation results for 10 testing days. The respective average estimation errors for EPSO, the ESSA and the EWOA are 1.159%, 1.142% and 1.148%, which is better than the estimation error of 3.565% using the Newtonian iteration method. However, the estimation errors produced by using Newtonian iteration method on two rainy days are so small that the three ESI algorithms are unable to find parameters that produce lower estimation errors.
To affirm the reliability of the proposed ESI algorithms, another 10 days of data from five different weather types are used for testing. As shown in
Table 6, the respective average estimation errors for EPSO, the ESSA and the EWOA are 1.171%, 1.149% and 1.152%, which gives a better estimation accuracy than the Newtonian iteration method. Compared with the results in
Table 5, the estimation results of the proposed ESI algorithms are stable, and the estimation errors are very close. Similarly, the proposed ESI algorithms cannot find better estimates than the Newtonian iteration method on two rainy days.
In addition, to verify the effect of DE on the proposed ESI algorithms, the results for the swarm intelligence (SI) and ESI algorithms for a three-diode model are provided in
Table 7. The results show that the average estimation errors for PSO, EPSO, the SSA, the ESSA, the WOA and the EWOA are 1.189%, 1.159%, 1.184%, 1.142%, 1.203% and 1.148%, respectively. These results show that the proposed ESI algorithms have better search capabilities and give lower estimation errors than the SI algorithms.
4.2. Comparisons of Different Diode Models
To evaluate the estimation results for models with different numbers of diodes, the proposed algorithms are also used to optimize the parameter values of different models.
Table 8 shows the estimation results using an EPSO algorithm. Except for two rainy days on Jan. 21 and March 11, the EPSO algorithm gives a better estimate for the three different diode models. The respective average estimation errors for the single-, two- and three-diode models are 1.194%, 1.167% and 1.159%, all of which are more accurate than the estimation error of 3.565% using the Newtonian iteration method. The three-diode model produces more accurate estimation results than the single- and two-diode models. Note that there are 12, 14 and 16 parameters to be optimized for the single-, two- and three-diode models, respectively.
Table 9 shows the estimation results using an ESSA. Similarly, except for the two rainy days, the SSA gives better estimates for the three different diode models. The respective average estimation errors for the single-, two- and three-diode models are 1.182%, 1.146% and 1.142%. The three-diode model gives better estimation results than the other two diode models.
Table 10 shows the estimation results using an EWOA, which gives similar results for the 10 testing days.
To verify the reliability of parameter estimation for different diode models, the results of another 10 days of testing data are provided in
Table 11. The respective average estimation errors for the single-, two- and three-diode models are 1.443%, 1.338% and 1.171%, all of which are more accurate than the estimation error of 3.495% using the Newtonian iteration method. Similar to the results shown in
Table 8,
Table 9 and
Table 10, EPSO failed to produce better estimates than the Newtonian iteration method on two rainy days. Overall, the three-diode model produces more accurate estimates than the other diode models in term of average MRE values.
4.3. Comparison Using Different Number of Parameters
As described previously, to create a more refined estimation model, this study transforms the 9 parameters into 16 parameters for a three-diode model. Similarly, the 5 parameters in a single-diode model and the 7 parameters in a two-diode model can be transformed into 12 and 14 parameters, respectively.
Table 12 shows a comparison of the different numbers of parameters used by different diode models. All the diode models are optimized using the same EPSO algorithm. As shown in the table, the respective average estimation errors for the 5-, 7- and 9-parameter models are 1.757%, 1.610% and 1.392%, while the proposed 12-, 14- and 16-parameter models obtained are 1.194%, 1.167% and 1.159%, respectively. The results show that the diode models converted into finer models provide better estimates than the unconverted diode models. Even a single-diode model using 12 parameters gives a better estimation accuracy than a three-diode model using 9 parameters.
The average execution time after 1000 iterations for the 5-, 7- and 9-parameter models is about 50 min to 1 h, while the proposed 12-, 14- and 16-parameter models need about 1 h 10 min to 1 h 30 min.
4.4. Preliminary Fault Diagnosis Results
The I–V curve for solar cells is affected by solar irradiance, module temperature and the equivalent impedance of the material.
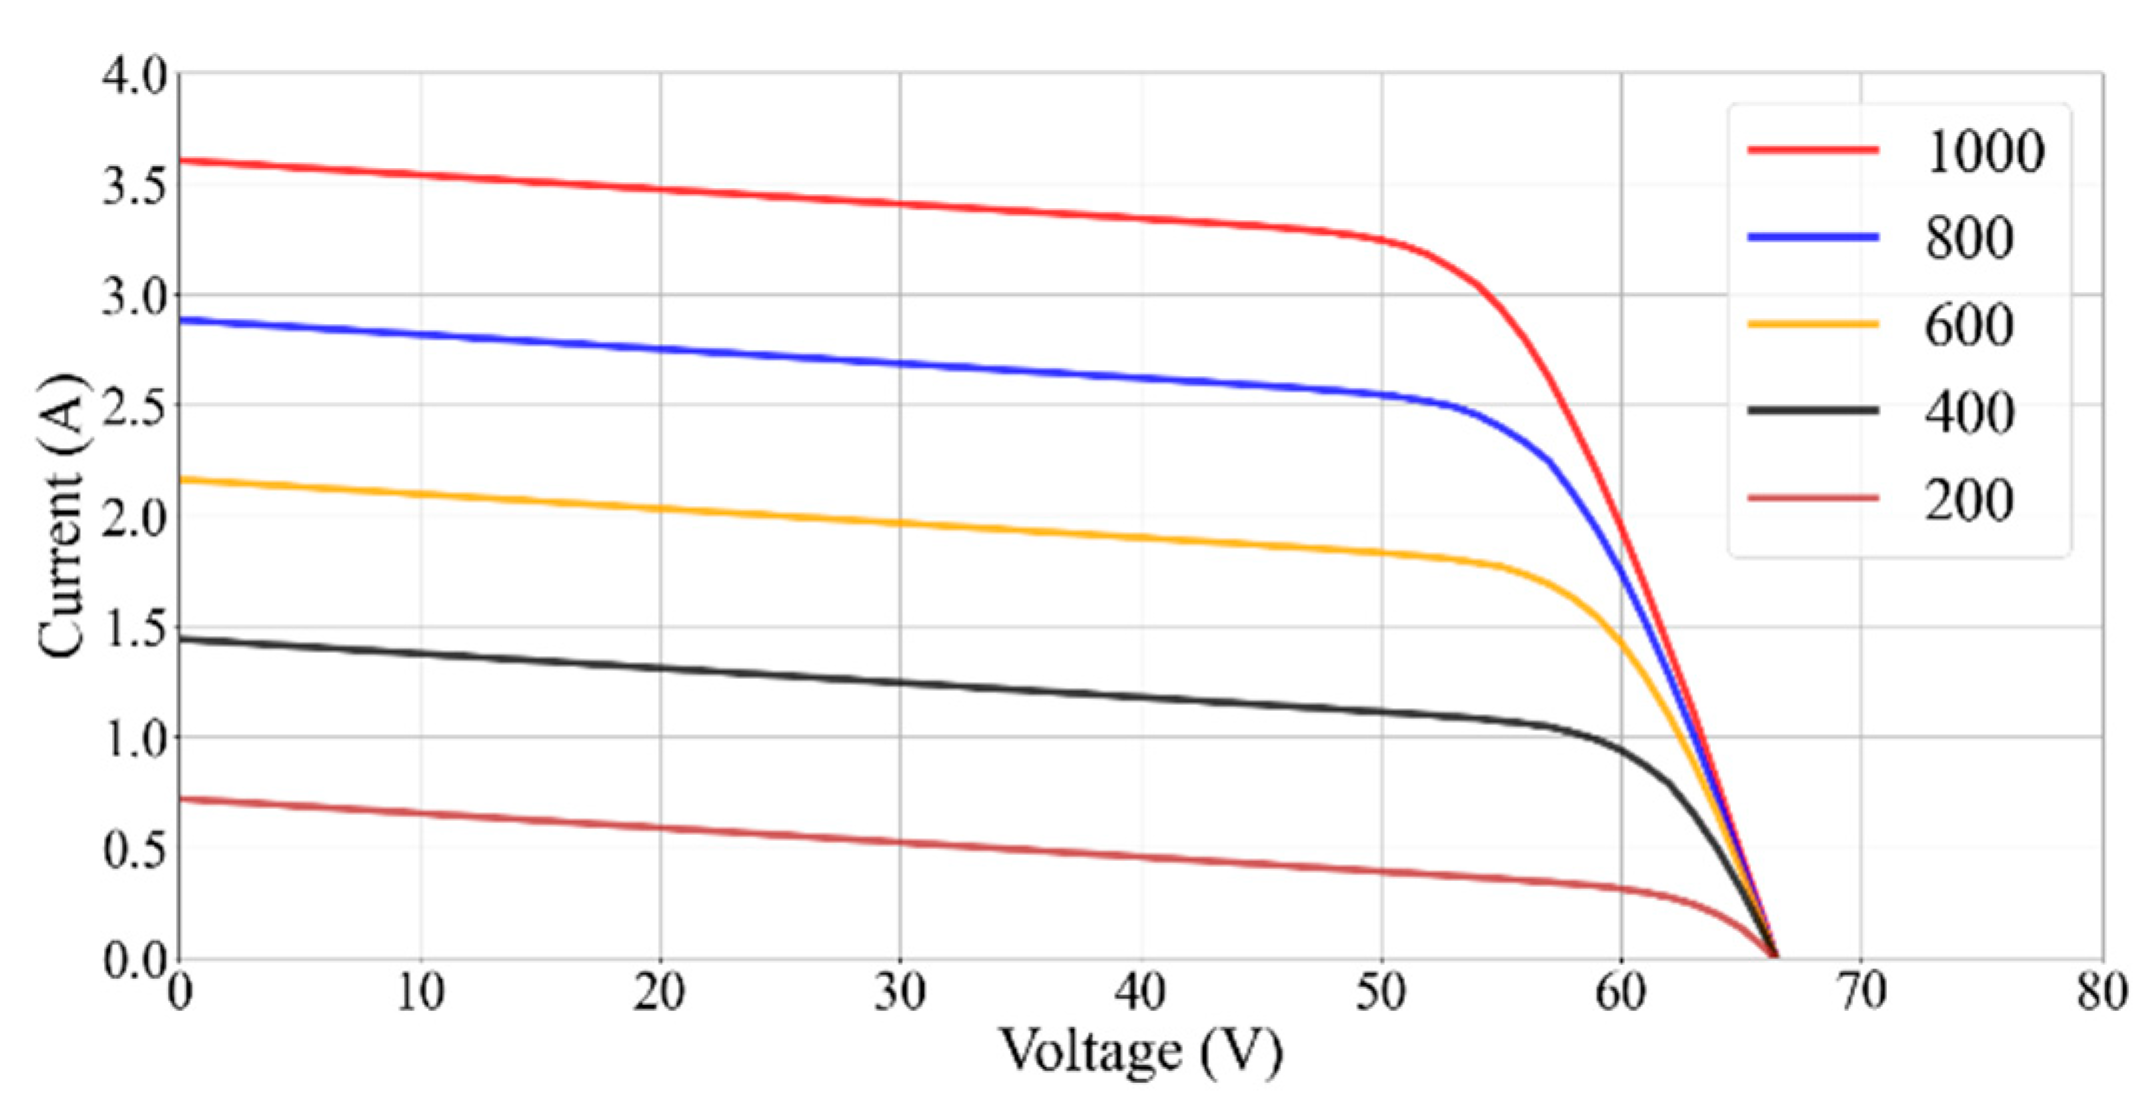
Figure 10 shows the I–V curves for different solar irradiance values for a fixed module temperature of 298 (K) using the parameter values that are provided by the manufacturer. The current and power are significantly affected by the amount of solar irradiance, but the voltage for the solar cells does not change significantly.
Figure 11 shows the I–V curves for different module temperatures and a constant solar irradiance of 1000 (W/m
2). If the model temperature of a solar cell increases, the current increases slightly, but the voltage decreases significantly. Therefore, power output is significantly affected by solar irradiance but only slightly affected by the module temperature. As shown in
Figure 10 and
Figure 11, the I–V curves constructed using the parameters that are provided by the manufacturer are consistent with the actual situation of PV power generation.
Figure 12 shows the I–V curves for different solar irradiances for a temperature of 298 (K) using the proposed ESI algorithms and a three-diode model. The preliminary fault diagnosis analysis in
Section 3.2 shows that the change in parameters is reflected in the I–V characteristic curves.
Figure 12a shows the I–V curves for the three ESI algorithms for a solar irradiance of 1000 (W/m
2). The original I–V curve for the STC is also shown for comparison. The curves marked with “Original” in the figure represent that the curves were produced using the original parameters provided by the PV manufacturer. The gradient of the I–V curves at around 40–60 volts is changed because the series resistance increases, so the current decreases significantly during this interval. If the module temperature is constant but the solar irradiance decreases to 800 (W/m
2) and 600 (W/m
2), as shown in
Figure 12b,c, the current also decreases significantly. These results show that the PV modules may be oxidized and degraded, so maintenance is required to increase the power output.
4.5. Discussions
The following observations are yielded from the above results:
For the single-diode model, the average estimation error for the EWOA is 1.165%, which is the lowest error for the three ESI algorithms. However, the ESSA, which allows for better exploration and exploitation strategies, gives the best estimation results for the two- and three-diode models.
The single-diode model gives better estimates on sunny days, and the two- and three-diode models give a more accurate estimate for the other four weather types. Overall, the average estimation error for the three-diode model is smaller than that of the single- and two-diode models. Similar results are verified on another 10 testing days using the EPSO algorithm, as shown in
Table 11.
In terms of the estimation results for two rainy days, the errors that are produced using the original parameters provided by the manufacturer are quite small, so the three ESI algorithms cannot find parameters to produce a lower estimation error.
As mentioned in the literature, most methods that use I–V curves to extract parameters only focus on a five-parameter model. Converting the I–V curves into a nine-parameter model is possible but may not be accurate enough to represent the characteristics of solar cells.
The preliminary fault diagnosis results indicate that the PV modules may be oxidized and degraded, so maintenance is required to increase their power output. Since there are many factors that cause the oxidation and degradation of PV modules, the practical fault factors and fault locations still require further inspection by the operators.
