Abstract
The traditional fixed value assessment of the renewable distributed energy hosting capacity of a distribution network cannot accurately and comprehensively reflect the change in hosting capacity; therefore, we propose the interval assessment method for the renewable distributed energy hosting capacity of a distribution network. The renewable distributed energy hosting capacity interval consists of an optimistic upper boundary and a pessimistic lower boundary. First, the optimistic upper bound is described by a deterministic model that takes into account the constraints of safe system operation. Second, the pessimistic lower bound is portrayed by a two-layer robust assessment model that accounts for the DG temporal uncertainty, DG spatial uncertainty, and active distribution network flexible resource dispatch uncertainty. Each pessimistic sub-model was constructed in turn, and then the model was solved by linear simplification using pairwise transformation, as well as McCormick relaxation. Finally, simulations were carried out in the IEEE 135 system, and the results validated the effectiveness and practicality of the proposed method.
1. Introduction
With the proposal of the “dual-carbon” goal and the overall promotion of renewable distributed generation (DG), DG represented by wind turbines (WTs) and photovoltaics (PVs) is developing rapidly due to its low-carbon characteristics [1,2,3]. However, with the continuous increase in the penetration rate of DG in the distribution network, due to the randomness and volatility of DG, the form of the active distribution network is gradually becoming more complicated; the operation situation is becoming more diversified; and the distribution network will produce a series of problems, such as a voltage limit and line current overload [4,5,6]. Accurate assessment of the DG hosting capacity of a distribution network is of great practical value to promote the coordinated development of DG and a distribution network and ensure the safety and stability of distribution network operation under the installation of a large amount of DG. The DG hosting capacity (HC) of a distribution network refers to the construction of a DG hosting capacity assessment model under safe operation constraints, which can realize the quantitative calculation of the maximum access capacity of DG [7,8,9]. DG output fluctuation, unknown DG access location, and sudden fault off-grid of active distribution flexible resources are three very important uncertainties to be considered in the process of DG hosting capacity assessment in distribution networks. Therefore, it is of great significance to comprehensively consider three factors, namely, the DG temporal uncertainty, DG spatial uncertainty, and scheduling uncertainty of active distribution flexible resources, to carry out the assessment of the hosting capacity of DG sources [10,11,12].
Previous studies established a DG hosting capacity assessment model for distribution networks, and the maximum access capacity of DG was calculated. In [13], an AC tidal current sensitivity factor is proposed, through which a linear optimization model was constructed, and thus, the carrying capacity of the distributed PV was calculated. In [14], a method for calculating the maximum access capacity of distributed power sources in distribution networks based on sensitivity analysis is proposed, with the aim of solving the problem of node voltage that may be caused by the access of distributed power sources. In [15], a second-order cone relaxation solution method was used to model the maximum carrying capacity of distributed renewable energy sources that satisfy distribution network operation constraints. In [16], an access capacity allocation model with the objective of maximizing the capacity of DG access to the grid was constructed to derive the limiting capacity of the distribution grid that is allowed to be accessed while ensuring that the branch power and node voltage are not exceeded. In [17], a model was developed for calculating the maximum capacity of distributed power sources that are allowed to be connected to the distribution network based on the optimal current of the distribution network. The study of [18] considered the impact of distributed power access on the distribution network voltage, taking into account the node voltage security constraints, and established a calculation model for the maximum permitted capacity of distributed power access in the distribution network. A method for assessing the maximum capacity of distributed PV based on typical access methods for PV poverty alleviation projects using low-voltage distribution networks is proposed in [19], but it does not take into account the PV output uncertainty.
The studies mentioned above are single-constant-value assessments without analyzing uncertainties, which suffer from the following two main problems:
- The above studies should consider the interval assessment of the DG hosting capacity of the distribution network, rather than a single-fixed-value assessment. Due to the existence of uncertainties, the decision makers of distribution networks cannot accurately obtain the assessment value of the renewable energy installation capacity of distribution networks, and thus, it is necessary to use the DG hosting capacity interval assessment in the operation and management of distribution networks, as well as in the planning of the future development of distribution networks. If decision makers use the fixed value of a DG hosting capacity assessment, the assessment results cannot accurately and comprehensively reflect the change in the DG hosting capacity. At the same time, the use of the traditional DG hosting capacity assessment will have the problem of poor applicability and flexibility of the method.
- The above studies should have taken into account three important factors in distribution network operation, namely, the DG temporal uncertainty, DG spatial uncertainty, and active distribution network flexible resource scheduling uncertainty. The DG temporal output fluctuation changes under the influence of weather. Neglecting the temporal fluctuation of the DG output can lead to the problem of wind and solar energy abandonment of the DG installed in the distribution network [20]. The uncertainty of various installation locations of DG needs to be comprehensively considered due to the differences in geographic factors and user willingness. If the renewable energy is centrally connected to a certain location without regard to the uncertainty of various installation locations of DG, it may increase the risk of overloading and failure of the distribution grid at that location, thus reducing the reliability and security of the distribution grid [21]. In actual operation, distributed flexible resources may fail off-grid at some point in time, and thus, the uncertainty of flexible resource scheduling needs to be taken into account. If the uncertainty of flexible resource scheduling is not taken into account, the failure of flexible resources will lead to their inability to execute scheduling commands, which affects the stability of distribution network operation [22].
On the basis of the above research, this paper proposes an interval assessment method for the hosting capacity of distribution networks for DG. The contributions of this paper are summarized as follows:
- The interval multidimensional assessment method adopted in this study took into account a variety of uncertainties. This assessment method is more flexible and widely applicable than the traditional method of assessing the hosting capacity of DG resources in distribution grids with a single fixed value.
- This paper provides the ranges of the hosting capacities of DG intervals under the scenarios of whether or not the flexible resources of the distribution grid are accessible, different DG installation schemes, and different load level scenarios. This will help decision makers to understand the stability and reliability of the distribution network under different conditions. By clarifying the range of hosting capacity of DG, decision makers can formulate corresponding measures according to the actual situation to ensure the reliable operation of the distribution grid and the optimal use of DG and flexible resources.
2. Methodological Framework Formulti-Scenario Assessment of Intervals
The interval multi-scenario assessment includes optimistic upper bound and pessimistic lower bound assessments. The optimistic upper bound assessment of the distribution network hosting capacity for DG was described by a deterministic model. The objective function of the deterministic assessment model, i.e., optimistic model I, was used to maximize the access capacity of DG. The model took into account the linear simplified tidal equation constraints and its own DG capacity constraints, as well as the flexible resource capacity constraints.
The pessimistic lower bound assessment of the distribution network hosting capacity for DG was portrayed by considering a double-layer robust model with multiple uncertainties. The purpose was to find the hosting capacity of the distribution network for DG under a pessimistic scenario. The assessment model involved constructing three pessimistic sub-models based on different uncertainty variables, which were pessimistic sub-model II, pessimistic sub-model III, and pessimistic sub-model IV.
For pessimistic sub-model II, the objective function was the maximum access capacity for assessing the DG hosting capacity of the distribution network under the fluctuation of distributed renewable energy output. The uncertainty variable was the renewable energy output. The set of uncertainty variables was the set of polyhedra taking into account the time dependence. The model constraints were the set of polyhedra and all the constraints of optimistic model I. The sub-model described the time scenario with lower bound 1 of the hosting capacity interval.
For pessimistic sub-model III, the objective function was used to evaluate the maximum access capacity of the distribution network DG hosting capacity under the unknown number and location of renewable energy access. The uncertainty variable was the renewable energy access location. The set of uncertainty variables was based on a fuzzy set of probability distributions for multiple discrete scenarios. The model constraints were this fuzzy set and all the constraints of optimistic model I. The sub-model described the spatial scenario with lower bound 2 of the hosting capacity interval.
For pessimistic sub-model IV, the objective function was the maximum access capacity for assessing the DG hosting capacity of the distribution network when a fault occurred in the flexible resource transfer. The uncertainty variable was the grid connection status of the energy storage. The set of uncertainty variables was the set of polyhedra. The model constraints were the set of polyhedra and all constraints of optimistic model I. The sub-model described lower bound 3 of the hosting capacity interval for the multi-energy scenario. The framework of the DG hosting capacity interval assessment method for distribution networks that considered time, space, and multiple energy scenarios is shown in Figure 1.
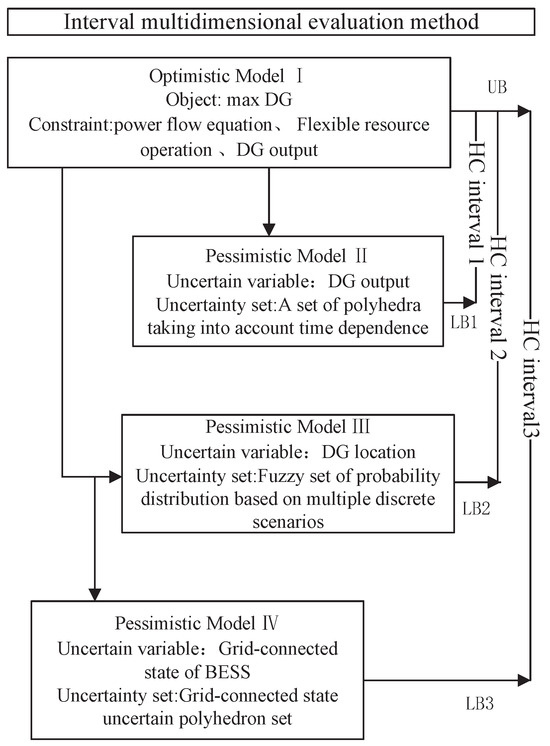
Figure 1.
A methodological framework for the interval assessment of renewable energy hosting capacity of distribution grids.
3. Deterministic Assessment Model
3.1. Objective Function
The optimistic upper bound of the DG maximum hosting capacity interval (i.e., optimistic assessment model I) takes into account various operational constraints in the distribution network and calculates the maximum capacity of DG that can be accommodated by the distribution network. The objective function of the deterministic model is shown in Equation (1):
where is the value of the DG capacity accepted by the distribution network, i is a distribution network node, is the set of DG access points in the distribution network, and is the apparent power of the DG installed at node i.
3.2. Constraints
- Distribution network tidal equation constraints
For distribution network currents, a linear current equation was constructed based on the literature [23].
For , :
For , :
where t is the operating moment of a dispatch cycle T; is the set of distribution network nodes; l is the distribution network branch; is the set of distribution network branches; is the mapping from the set of distribution network branches to the set of nodes at the first end of the line; is the mapping from the set of distribution network branches to the set of nodes at the last end; and are the injected active and injected reactive powers of node i at time t, respectively; is the PV active output of node i at time t; is the wind turbines active output of node i at time t; and are the energy storage charging and discharging powers of node i at time t, respectively; denotes the reactive power of SVG of node i at time t; and are the active and reactive powers of the electrical load of node i at time t, respectively; and are the active and reactive currents of distribution network line l at time t, respectively; is the node voltage magnitude; is the rated voltage of the distribution system; and and are the resistance and reactance of the distribution lines, respectively.
- 2.
- Branch transmission capacity constraint
The original branch power constraint is a nonlinear constraint, which indicates that the limiting feasible domain of the branch power is the interior of a quadratic circle. It can be transformed into a linear constraint by polygonal linear simplification, which significantly improves the solution efficiency. The simplification is shown below [22]:
Since this positive dodecagon is internally connected to a quadratic circle, the coordinates of the vertices of this positive dodecagon and the coefficients of Equation (8) can be found.
- 3.
- Nodal voltage constraints
For :
where and are the upper and lower limits of the voltage amplitude at node i.
- 4.
- Energy storage operational constraints
- 5.
- Safe operation constraints for reactive power compensation equipment
In this study, SVG was used for reactive power compensation. Its safe operation constraints can be described as follows:
where and denote the maximum and minimum values of the reactive power compensation of SVG at node i, respectively.
- 6.
- Safe operation constraints for DG sourceswhere and denote the upper and lower limits of the PV active output at node i at time t, respectively, and and denote the upper and lower limits of the wind power output at node i at time t, respectively.
3.3. Model Solving
Optimistic modeling calculates the maximum accessible capacity of the distribution network for DG in the determined case. The model is a single-level linear programming model, which is relatively simple to solve. The evaluation model was programmed in the Matlab R2016b platform through the YALMIP toolbox and solved by using a commercial Gurobi 10.1 solver; then, the upper bound solution of the distribution network to DG hosting capacity interval was obtained.
4. Robust Hosting Capacity Assessment Model Taking into Account Multiple Uncertainties
4.1. Hosting Capacity Assessment Modeling Taking into Account DG Time Uncertainty
4.1.1. Modeling of DG Time Uncertainty
DG time uncertainty considers the random fluctuations of DG active power output in time. Due to the influence of wind speed, light intensity, temperature, and air humidity, the DG active power output has strong volatility and randomness, which is difficult to predict accurately. In this paper, in order to quantify the uncertainty of DG active power output, Equation (18) is used to describe the uncertainty of the DG active power output:
where is the value of the DG active power output at node i at time t; is the expected value of the DG active power output at node i at time t; and denote the maximum deviation and minimum deviation of the DG active power output prediction at node i at time t, respectively; and and denote the 0–1 decision variables of the maximum deviation and minimum deviation, respectively.
The constraints on the maximum deviation and minimum deviation are shown in Equation (19), which ensure that and do not occur at the same time and that the number of times both occur throughout the scheduling period T cannot exceed the uncertainty budget value :
It is generally assumed that the uncertainty parameters are independently distributed at each moment in time. In reality, the uncertainty parameters are also correlated with time. Therefore, the DG active power output time correlation constraint is considered as shown in the following equation [24]:
where is the output value of the DG at node i at time , is the slope of the upper and lower boundary lines, and and are the intercepts of the upper and lower boundary lines.
In summary, the renewable energy time–output uncertainty polyhedral set is constructed as shown in the following equation:
4.1.2. Objective Function and Constraints
The pessimistic sub-model II proposed in this section portrays the maximum capacity of DG that can be accommodated by the distribution network under fluctuating DG output, where the objective function is shown in the following equation:
where u is the set of uncertainty variables (DG active power output), and x is the set of decision variables (including the location of DG access, line currents, node voltages, and the operation strategy of flexible resources).
The model constraints not only need to consider the distribution network current constraints, branch transmission capacity constraints, node voltage constraints, safe operation constraints of energy storage devices, safe operation constraints of reactive power compensation devices, and safe operation constraints of DG in optimistic model I but also include all the constraints of the set of uncertainty polyhedra , where the DG active power output deterministic variable in the active power balance constraints in optimistic model I needs to be modified into the uncertain variable of the following equation:
In summary, Equations (4)–(17) and Equations (21)–(23) together constitute a model for assessing the hosting capacity, taking into account the temporal uncertainty of the renewable energy source.
4.2. Hosting Capacity Assessment Model Taking into Account Spatial Uncertainty of DG
4.2.1. Renewable Energy Spatial Uncertainty Modeling
DG spatial uncertainty considers the uncertainty of renewable energy installation locations. Modeling for renewable energy spatial uncertainty uses fuzzy sets based on the probability distribution of multiple discrete scenarios. Assuming that there are N nodes in the distribution network, in addition to the balancing node, when e nodes are connected to the distribution network, it generates installation scenarios, where each installation scenario occurs with a different probability size that is greater than or equal to 0, with all scenarios summing up to 1, as shown in Equation (24):
where is the probability that the kth access scenario occurs.
The probability of occurrence of the kth access scenario is bounded by the empirical probability to satisfy the following equation:
where is the empirical probability that the kth access scheme occurs, M denotes the total number of historical samples, is the confidence that the one-parameter constraint holds, and is the confidence that the ∞-parameter constraint holds.
In summary, the fuzzy set based on the probability distribution of multiple discrete scenarios is shown in the following equation:
Since the constraint Equation (25) is nonlinear, in order to facilitate the solution, auxiliary variables and auxiliary constraints are introduced to convert the nonlinear constraints to linear constraints. Therefore, the auxiliary variables and auxiliary constraints are added as follows:
where and are 0–1 variables corresponding to one-paradigm constraints, and are 0–1 variables corresponding to ∞-paradigm constraints, and and are the positive and negative offsets of the occurrence probability with respect to the candidate probability .
The transformed one-parameter and ∞-parameter constraints are shown in Equations (28) and (29), respectively:
4.2.2. Objective Function and Constraints
The pessimistic sub-model III proposed in this section portrays the maximum capacity of DG that can be accommodated by the distribution network under the uncertainty of the DG installation location, where the objective function is shown in the following equation:
Similar to Section 3.1, the model constraints need to consider not only the constraints in optimistic model I but also all the constraints of the uncertainty fuzzy set .
In summary, Equations (3)–(17) and Equations (26)–(30) together constitute a model for the hosting capacity assessment, taking into account the spatial uncertainty of renewable energy sources.
4.3. Hosting Capacity Assessment Models Accounting for Flexible Resource Scheduling Uncertainty
4.3.1. Flexible Resource Scheduling Uncertainty Modeling
The flexible resource scheduling uncertainty takes into account the case of a device failing to leave the network and introduces the 0–1 variables and . The variable denotes the amount of failure indication of node i accessing the flexible resource at time t, 1 denotes the beginning of failure at that moment, and 0 denotes the beginning of non-failure at that moment. The variable denotes the fault status of node i accessing the flexible resource at time t. A 1 denotes the moment when the flexible resource fails to leave distribution network, and 0 denotes the moment when the flexible resource is normally accessible to the network. Assuming that each device is off-grid with at most one fault in the whole scheduling cycle, the relationship between and is as follows:
where denotes the restoration time required for the flexible resource of access node i to be removed from the distribution network from the moment of fault initiation to the installation of the distribution network.
According to Claude Shannon, the information entropy is the information measure, which is the information brought about by a specific event that has occurred. The entropy is the expectation of the amount of information that may be produced before the result is known when considering all possible values of the random variable, i.e., the expectation of the amount of information brought about by all possible events. The amount of information satisfies the criterion that a low probability event corresponds to a high amount of information. Then, the choice of the logarithm is arbitrary. In this paper, we simply follow the general tradition of information theory and use the number 2 as the logarithm base to establish the fault off-grid uncertainty budget W [25]:
where is the flexible resource failure probability of access node i at time t, and is the set of flexible resource nodes.
In summary, the flexible resource scheduling uncertainty set U is as follows:
4.3.2. Objective Function and Constraints
The pessimistic sub-model IV proposed in this section describes the maximum capacity of DG that can be accommodated by the distribution grid under the possibility that a flexible resource may fail off-grid during a certain time period, resulting in an inability to respond to the dispatch instructions from the distribution grid, where the objective function is shown in the following equation:
The nodal active power balance constraints of optimistic model I are modified into the following equation:
The other constraints remain unchanged while accounting for all constraints of the flexible resource scheduling uncertainty set U.
In summary, Equations (3)–(17) and Equations (33)–(35) together form a hosting capacity assessment model that takes into account the uncertainty of flexible resource scheduling.
4.4. Algorithms for Solving
- Pairwise transformation
Vector u denotes the vector composed of uncertainty variables in the three pessimistic sub-models (including the DG output, probability of occurrence of DG access scheme, and flexible resource failure state). The vector x denotes the vector composed of other decision variables and state variables in the system (including line currents, node voltages, and operation strategies of other devices). The pessimistic models II and III’s compact forms can be expressed as follows:
where C is the matrix of coefficients of the objective function Equations (22) and (30); A, B, and d are the matrices or vectors of constant coefficients of the corresponding inequality constraints; and D, E, and h are the matrices or vectors of constant coefficients of the corresponding equality constraints.
The inner function is the maximum pairwise function, as follows:
where is a vector of pairwise multipliers of inequality constraints containing both the vector x consisting of decision variables and the vector u consisting of uncertainty variables, and is a vector of pairwise multipliers of inequality constraints containing both the vector x consisting of decision variables and the vector u consisting of uncertainty variables.
The inner and outer layers are combined after pairing, as in the following equation:
The pessimistic model IV’s compact form can be expressed as follows:
where F is the coefficient matrix of the objective function Equation (34); J is the constant coefficient matrix corresponding to inequality constraints; L is the constant coefficient matrix of the corresponding equality constraint, where the result of multiplying J and L with the vector x of the decision variable does not contain the variable of the flexible resource output; K is the constant coefficient matrix corresponding to inequality constraints; M is the constant coefficient matrix of the corresponding equation constraints, where the result of multiplying K and M with the vector x of the decision variables only contains the variable of flexible resource output; p is the constant coefficient vector of the corresponding inequality constraint; and q is the constant coefficient vector of the corresponding equation constraint.
The inner function is the max pairwise function, as follows:
where is the pairwise multiplicative vector of inequality constraints containing both the vector x composed of decision variables and the vector u composed of uncertainty variables, and is the pairwise multiplicative vector of inequality constraints containing both the vector x composed of decision variables and the vector u composed of uncertainty variables.
The inner and outer layers are combined after pairing, as in the following equation:
where r is the vector of constant coefficients of the equation constraints after the pairwise transformation.
- 2.
- McCormick relaxation
After the aforementioned transformation, the inner and outer layers are combined into one min problem, but nonlinear terms, such as , , , and , appear. Therefore, the McCormick relaxation is adopted to transform them, and the transformed objective function and constraints are in a linear form, which can be solved by using the commercial Gurobi solver.
5. Results and Discussion
5.1. Algorithms for Solving
The main objective of this study was to assess the value of the hosting capacity interval of the distribution network for newly installed distributed power sources of renewable energy types. In order to verify the validity of the interval assessment method of the distribution network’s hosting capacity for DG sources proposed in this paper, an improved IEEE 135-node distribution network, as shown in Figure 2, was used for the simulation and analysis and the six distributed power sources with a capacity of 1 MW in the distribution network topology diagram were gas turbines or diesel generators. Four renewable energy access points were planned, with node 49 and node 59 accessing PVs and node 44 and node 73 accessing wind turbines. The desired curves of the loads and renewable energy sources (PV and wind turbine) are given in Figure 3. The capacity of the BESS was 2 MW and it was connected to node 90, node 129, node 116, and node 125. The system reference voltage was 13.8 kV, and the reference capacity was 10 MVA. The upper and lower limits of the nodal voltages of the distribution network were set to 1.05 p.u.–0.95 p.u.
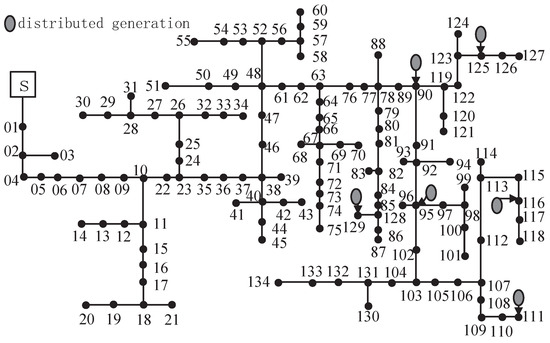
Figure 2.
Diagram of the 135-bus distribution system.
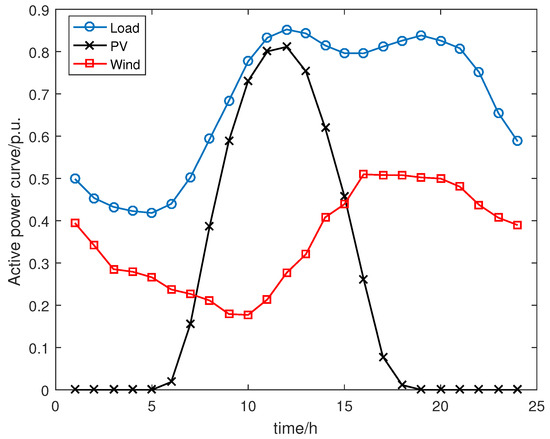
Figure 3.
Load and renewable energy active power expectation curves.
5.2. Changes in Hosting Capacity Interval 1 under Different Uncertainty Budgets
In order to explore the effect of uncertainty budget on DG hosting capacity interval 1 constituted by optimistic model I and pessimistic model II, we set up the following four scenarios shown in Table 1.

Table 1.
Scenario setting for fluctuations in distributed renewable energy output.
According to robust optimization theory, the larger the value of the uncertainty budget is, the more conservative the whole model evaluation result is, which means that the maximum access capacity of DG that can be connected to the distribution network is smaller. Conversely, the larger the value of , the larger the capacity that can be accessed. The relationship between the maximum accessible capacity of DG that can be connected to the distribution network and the parameter is specifically analyzed below, and the simulation results are shown in Figure 4. When ≤ 2, the maximum access capacity of the distribution grid to DG sources increased rapidly in each scenario as the uncertainty parameter decreased. When = 0 was the most optimistic case, the maximum capacity value of DG accessed in each scenario was the evaluation result of optimistic model I, which was regarded as the upper bound of the DG hosting capacity interval; when 2 < < 5, the maximum access capacity of the distribution grid for DG sources decreased rather slowly in each scenario as the uncertainty parameter increased. When = 5, in this zone, the robust conservative degree was the most pessimistic situation, and the DG maximum access capacity value, that is, the pessimistic model II assessment result, was regarded as the lower boundary of DG hosting capacity interval. At the same uncertainty budget value, the maximum access capacity of DG sources decreased sequentially for scenario 1, scenario 2, scenario 3, and scenario 4. This means that the fewer the number of fluctuating DG units at the same moment of time with the same uncertainty budget, the more favorable the lower bound of the hosting capacity interval.
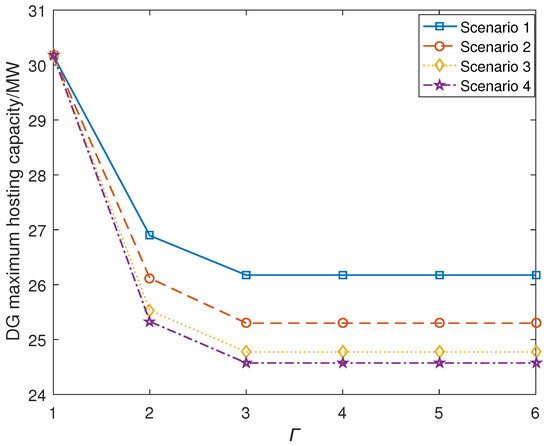
Figure 4.
Maximum renewable energy access capacity for each scenario under different conservative scenarios.
The distribution network decision maker can adjust the value of parameter to change the value of the assessment range of the DG hosting capacity interval 1. However, it should be noted that the smaller the value of parameter , the less robust the assessment results are. The DG hosting capacity interval 1 assessment range values composed of optimistic model I and pessimistic sub-model II are shown in Table 2.

Table 2.
Assessment range values of renewable energy hosting capacity interval 1 under different scenarios.
5.3. Changes in Hosting Capacity Interval 2 with Different Confidence Levels
The impact of the confidence parameter on DG hosting capacity interval 2 constituted by optimistic model I and pessimistic III sub-model is shown in Figure 5. With the growth of , the range of changes in the likelihood of the renewable energy conservative access scheme increased. This was due to the fact that the higher the , the higher the probability of selecting a DG conservative access program and the smaller the results of the DG hosting capacity assessment of the corresponding access program. When = 90%, that is, the most pessimistic scenario, at this time, the DG assessment produced 23.713 MW as the lower boundary of the hosting capacity interval 2; when = 10%, that is, the optimistic scenario, at this time, the DG assessment produced 30.175 MW as the upper boundary of the hosting capacity interval 2. By changing different access schemes, the maximum capacity of DG that could be accessed by the system varied within the range of [23.713, 30.175] MW.
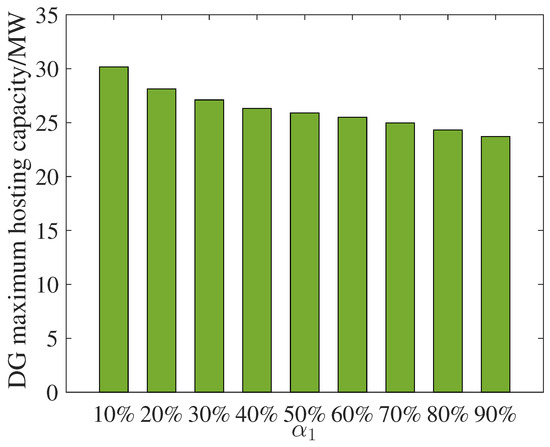
Figure 5.
Maximum access capacity of renewable energy sources under different confidence scenarios.
5.4. Changes in the Hosting Capacity Interval 3 under Different Uncertainty Budgets
According to Section 3.3, the impact on the DG hosting capacity of the distribution grid was the worst when the energy storage equipment was taken off-grid and out of operation due to a fault during the noon hour, and a fault occurred only once within each hour. In order to explore the impact of the uncertainty budget W on DG hosting capacity interval 3 constituted by optimistic model I and pessimistic model IV, we set up the following six scenarios shown in Table 3.

Table 3.
Scenario setting for flexible resource failure repair time.
Figure 6 shows that the hosting capacity of the distribution network for DG sources tended to decrease in a stepwise manner as the uncertain budget W increased in each scenario.
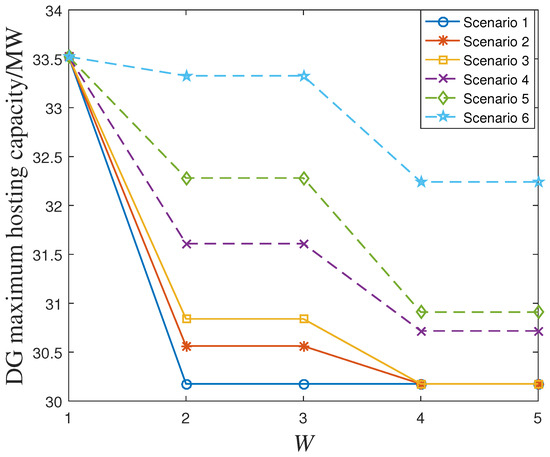
Figure 6.
Maximum renewable energy access capacity for each scenario under different uncertainty budgets.
When W ≤ 2, the maximum access capacity of the distribution grid for DG sources increased rapidly in each scenario as W decreased. When 4 ≤ W ≤ 5, in addition to scenario 6, for each scenario relative to W = 2, when the maximum access capacity of DG was reduced, at this time, the model with the highest degree of robust conservatism was the most pessimistic scenario, that is, the maximum access capacity of DG value was found in the pessimistic model IV assessment results. This value was regarded as the lower bound of DG hosting capacity interval 3. When W < 4, the maximum access capacity of the DG in scenario 1, scenario 2, scenario 3, scenario 4, scenario 5, and scenario 6 decreased sequentially with the increase in the repair fault repair time. Therefore, the fault repair time was also an important factor that affected DG access capacity interval 3.
Based on the comparative analysis of the results of different scenarios obtained by optimistic model I and pessimistic sub-model IV composed of DG hosting capacity interval 3 assessment, the range values are shown in Table 4.

Table 4.
Assessment range values of renewable energy hosting capacity interval 3 under different scenarios.
5.5. Analysis of Influencing Factors of DG Hosting Capacity Interval
In order to explore the influence of access to flexible resources (BESS, SVG) on the range values of hosting capacity intervals 1 and 2, two cases of no access to flexible resources and access to flexible resources were set up, and the results are shown in Table 5. The upper range value of DG hosting capacity interval 1 after accessing flexible resources was increased by 14.6% and the lower range value was increased by 22% relative to the upper range value without accessing flexible resources. The upper range value of the DG hosting capacity interval 2 after accessing flexible resources was increased in the same way as the upper range value of DG hosting capacity interval 1 after accessing flexible resources, which was due to the fact that both of them were the results of the same optimistic model assessment, while the lower range value was increased by 23.2%.

Table 5.
Comparison of DG hosting capacity interval 1 and 2 range values for access to flexible resources.
The following Figure 7 and Figure 8 show the voltage distributions with and without access to flexible resources when evaluating the lower bound of DG hosting capacity interval 1. The maximum system voltage offset was reduced from 5% to 3.9% after the flexible resources were connected compared with the before situation. Since the corresponding energy storage and SVG active and reactive outputs could be adjusted to support the access of DG resources, the current distribution of the system improved, and the voltage fluctuation was smoothed out; thus, the DG hosting capacity interval was improved.
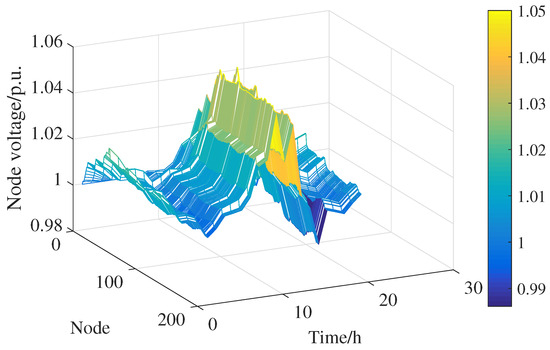
Figure 7.
Node voltage distribution by time period without access to flexible resources.
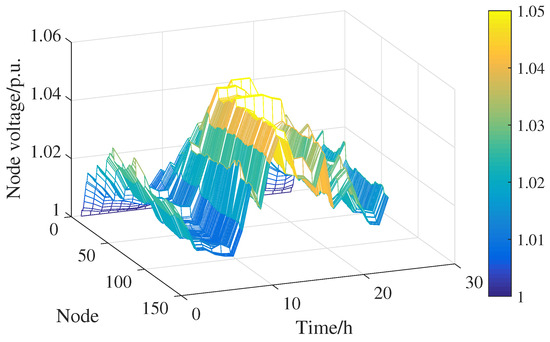
Figure 8.
Node voltage distribution by time period with access to flexible resources.
The installation capacity and load size of traditional distributed power in the distribution network have an impact on the DG hosting capacity of the distribution network, and it is also necessary to specifically analyze these factors. We set access to 6 MW, 7 MW, and 8 MW traditional distributed power capacities, and set 90%, 100%, and 110% load levels, respectively, to study the traditional distributed power access capacity and load level on DG hosting capacity intervals 1 and 3. The results are shown in Table 6 and Table 7. The upper and lower bounds of both the DG hosting capacity interval 1 and DG hosting capacity interval 3 increased with the level of load and decreased with the increase in the capacity of the traditional distributed power sources. This was due to the fact that as the load grew, the distribution network operation required more power sources to meet the demand. DG, as a renewable energy source, satisfies part of the load while reducing the pressure on traditional power sources, thus improving the acceptance of DG in the distribution network. However, as the access capacity of traditional distributed power sources (e.g., coal-fired power generation and thermal power generation) increases, they will take up more space for the access of DG. This means that the space available for DG access in the distribution network is relatively reduced when traditional distributed power sources have already been admitted. Therefore, the increase in traditional distributed power sources will limit the hosting capacity of the distribution grid for DG.

Table 6.
DG hosting capacity interval 1 range values for different system configurations.

Table 7.
DG hosting capacity interval 3 range values for different system configurations.
5.6. Validation of the Accuracy of the HC Interval Assessment Method
Four scenarios of HC interval 1 composed of optimistic model I and pessimistic model II were taken as examples to validate the accuracy of the evaluation method in this paper. Under the uncertainty of renewable energy output, three DGs output values were randomly generated for each scenario to calculate the real hosting capacity, and the validation results are shown in Table 8.

Table 8.
Validation of the accuracy of interval assessment methods.
It is known that the results calculated regarding the conventional hosting capacity are accurate to within plus or minus 5%. The accuracy of the conventional hosting capacity was about 70%, while the accuracy of the interval assessment in this study was 100%. The evaluation accuracy was 100% because the actual hosting capacity value was necessarily included in the hosting capacity interval proposed in this article. As long as the actual hosting capacity was within the interval, it was considered correct.
6. Conclusions
This paper proposes an interval assessment method for the hosting capacity of distribution networks for DG sources. The renewable distributed energy hosting capacity interval consists of an optimistic upper boundary and a pessimistic lower boundary. First, the optimistic upper bound is described by a deterministic model that takes into account the constraints of safe system operation. Second, the pessimistic lower bound is portrayed by a two-layer robust assessment model that accounts for the DG temporal uncertainty, DG spatial uncertainty, and active distribution network flexible resource dispatch uncertainty. Each pessimistic sub-model was constructed in turn, and then the model was solved by linear simplification using pairwise transformation, as well as McCormick relaxation. Finally, they were analyzed on the IEEE 135-node distribution system and the following conclusions were obtained:
- The range values of the DG hosting capacity intervals in different scenarios had obvious differences. The larger the uncertainty budget was, the more conservative the robust optimization solution was while the lower bound value of each DG hosting capacity interval was lower. Accordingly, the validity of the interval assessment method of the distribution network hosting capacity for the renewable distributed energy proposed in this paper was verified.
- Flexible resources, the installed capacity of traditional distributed power sources, and the size level of loads all had impacts on the range values of the intervals of DG hosting capacity of the distribution network. Access to flexible resources and increased load levels had increasing effects on the upper and lower boundaries of the DG hosting capacity interval range values of the distribution grid. An increase in the installed capacity of conventional gas turbines or diesel generators reduced the upper and lower bounds of the range of DG hosting capacity values on the distribution network.
For this study in the future, EV charging and discharging uncertainty and load uncertainty factors can be further considered to make the scenario applicability of the evaluation method wider. Another research direction is to investigate the problem of how to integrate these pessimistic sub-models into one big pessimistic model.
Author Contributions
Conceptualization, D.W.; methodology, D.W. and S.P.; software, H.Z.; validation, H.D., P.L. and C.T.; writing—original draft preparation, H.Z.; writing—review and editing, D.W.; supervision, P.L. All authors read and agreed to the published version of this manuscript.
Funding
This work is supported by State Grid Hunan Electric Power Company Science and Technology Project 5216A522000M.
Data Availability Statement
Data are contained within this article.
Conflicts of Interest
Author Wan Dai was employed by the company Electric Power Research Institute, State Grid Hunan Electric Power Company. The remaining authors declare that the research was conducted in the absence of any commercial or financial relationships that could be construed as a potential conflict of interest.
Abbreviations
The following abbreviations are used in this manuscript:
| DG | Distributed generation |
| PV | Photovoltaic |
| WT | Wind turbine |
| HC | Hosting capacity |
| UB | Upper boundary |
| LB | Lower boundary |
References
- Runa, A.; Zhang, Z.; Zhang, H. Carbon emission peak and carbon neutrality under the new target and vision. In Proceedings of the 2021 International Conference on Advanced Electrical Equipment and Reliable Operation (AEERO), Beijing, China, 15–17 October 2021; IEEE: Piscataway, NJ, USA, 2021; pp. 1–5. [Google Scholar]
- Zhao, C.; Wan, C.; Song, Y. Cost-oriented prediction intervals: On bridging the gap between forecasting and decision. IEEE Trans. Power Syst. 2021, 37, 3048–3062. [Google Scholar] [CrossRef]
- Zhang, Z.; Zuo, K.; Deng, R.; Teng, F.; Sun, M. Cybersecurity analysis of data-driven power system stability assessment. IEEE Internet Things J. 2023, 10, 15723–15735. [Google Scholar] [CrossRef]
- Gandhi, O.; Kumar, D.S.; Rodriguez-Gallegos, C.D.; Srinivasan, D. Review of power system impacts at high PV penetration Part I: Factors limiting PV penetration. Solar Energy 2020, 210, 181–201. [Google Scholar] [CrossRef]
- Xiang, J.; Liu, S.; Zhou, C. Capacity Limit Calculation of Grid-connected Photovoltaic Power Station Based on Cassette Robust Optimization. Hunan Electr. Power 2019, 39, 27–30. [Google Scholar]
- Ismael, S.M.; Aleem, S.H.A.; Abdelaziz, A.Y.; Zobaa, A.F. State-of-the-art of hosting capacity in modern power systems with distributed generation. Renew. Energy 2019, 130, 1002–1020. [Google Scholar] [CrossRef]
- Chen, X.; Wu, W.; Zhang, B.; Lin, C. Data-driven DG capacity assessment method for active distribution networks. IEEE Trans. Power Syst. 2016, 32, 3946–3957. [Google Scholar] [CrossRef]
- Bollen, M.H.; Hassan, F. Integration of Distributed Generation in the Power System; John wiley & Sons: Hoboken, NJ, USA, 2011. [Google Scholar]
- Dan, Y.; Haifeng, L.; Jing, L.; Xing, Z. Study on Carrying Capacity Analysis of Hunan Power Grid. Hunan Electr. Power 2018, 38, 63–66. [Google Scholar]
- Oskouei, M.Z.; Şeker, A.A.; Tunçel, S.; Demirbaş, E.; Gözel, T.; Hocaoğlu, M.H.; Abapour, M.; Mohammadi-Ivatloo, B. A critical review on the impacts of energy storage systems and demand-side management strategies in the economic operation of renewable-based distribution network. Sustainability 2022, 14, 2110. [Google Scholar] [CrossRef]
- Maharjan, M.; Banerjee, A.; Kavasseri, R.G. Uncertainty Analysis in Distribution Networks Integrated with Renewables by Probabilistic Collocation Method. In Proceedings of the 2020 52nd North American Power Symposium (NAPS), Tempe, AZ, USA, 11–13 April 2021; IEEE: Piscataway, NJ, USA, 2021; pp. 1–6. [Google Scholar]
- Ochoa, L.F.; Dent, C.J.; Harrison, G.P. Distribution network capacity assessment: Variable DG and active networks. IEEE Trans. Power Syst. 2009, 25, 87–95. [Google Scholar] [CrossRef]
- Keane, A.; O’Malley, M. Optimal utilization of distribution networks for energy harvesting. IEEE Trans. Power Syst. 2007, 22, 467–475. [Google Scholar] [CrossRef]
- Trinh, P.H.; Chung, I.Y. Integrated Active and Reactive Power Control Methods for Distributed Energy Resources in Distribution Systems for Enhancing Hosting Capacity. Energies 2024, 17, 1642. [Google Scholar] [CrossRef]
- Dorostkar-Ghamsari, M.R.; Fotuhi-Firuzabad, M.; Lehtonen, M.; Safdarian, A. Value of distribution network reconfiguration in presence of renewable energy resources. IEEE Trans. Power Syst. 2015, 31, 1879–1888. [Google Scholar] [CrossRef]
- Sun, L.; Zhao, M.; Wang, N.; Jia, Q.; Du, G. Research of permitted capacity of distributed photovoltaic generation based on voltage deviation chance constrained. Trans. China Electrotech. Soc. 2018, 33, 1560–1569. [Google Scholar]
- Vovos, P.N.; Harrison, G.P.; Wallace, A.R.; Bialek, J.W. Optimal power flow as a tool for fault level-constrained network capacity analysis. IEEE Trans. Power Syst. 2005, 20, 734–741. [Google Scholar] [CrossRef]
- Liu, K.; Liu, Y.; Sheng, W.; Meng, X. Maximal allowable DG penetration capacity calculation considering voltage constraints. Electr. Power Autom. Equip. 2016, 36, 81–87. [Google Scholar]
- Chang, G.W.; Chinh, N.C.; Sinatra, C. Equilibrium optimizer-based approach of PV generation planning in a distribution system for maximizing hosting capacity. IEEE Access 2022, 10, 118108–118122. [Google Scholar] [CrossRef]
- Hu, S.; Gao, Y.; Wang, Y.; Yu, Y.; Bi, Y.; Cao, L.; Khan, M.F.; Yang, J. Optimal Configuration of Wind–Solar–Thermal-Storage Power Energy Based on Dynamic Inertia Weight Chaotic Particle Swarm. Energies 2024, 17, 989. [Google Scholar] [CrossRef]
- Wang, L.; Yuan, M.; Zhang, F.; Wang, X.; Dai, L.; Zhao, F. Risk assessment of distribution networks integrating large-scale distributed photovoltaics. IEEE Access 2019, 7, 59653–59664. [Google Scholar] [CrossRef]
- Hu, R.; Wang, W.; Wu, X.; Chen, Z.; Jing, L.; Ma, W.; Zeng, G. Coordinated active and reactive power control for distribution networks with high penetrations of photovoltaic systems. Solar Energy 2022, 231, 809–827. [Google Scholar] [CrossRef]
- Zhao, L.; Wan, C.; Yu, P.; Wu, M.; Zhao, S. Assessment of distributed photovoltaic hosting capacity in integrated electricity and heat systems considering uncertainty. IET Energy Syst. Integr. 2021, 3, 317–326. [Google Scholar] [CrossRef]
- Zhu, C.; Wang, L.; Huang, J.; Cheng, H.; Hou, G.; Zhang, S.; Liu, H. Feasibility analysis of PV and energy storage system integration for flexible distribution networks: A moment-based distributionally robust approach. Energy Rep. 2023, 9, 89–98. [Google Scholar] [CrossRef]
- Wang, S.; Bo, R. A resilience-oriented multi-stage adaptive distribution system planning considering multiple extreme weather events. IEEE Trans. Sustain. Energy 2023, 14, 1193–1204. [Google Scholar] [CrossRef]
Disclaimer/Publisher’s Note: The statements, opinions and data contained in all publications are solely those of the individual author(s) and contributor(s) and not of MDPI and/or the editor(s). MDPI and/or the editor(s) disclaim responsibility for any injury to people or property resulting from any ideas, methods, instructions or products referred to in the content. |
© 2024 by the authors. Licensee MDPI, Basel, Switzerland. This article is an open access article distributed under the terms and conditions of the Creative Commons Attribution (CC BY) license (https://creativecommons.org/licenses/by/4.0/).