Abstract
Concentrating photovoltaic (CPV) systems have emerged as a transformative technology that incorporates radiation concentrators into the photovoltaic system to enable radiation to be concentrated onto a receiver—the solar cells. Different concentrator configurations have different impacts on the performance of the solar photovoltaic system. This research work aims to analyze the impact of different concentrators, comparing and identifying the most efficient structures for capturing and concentrating solar energy. Aiming at a deep analysis and comparison among concentrators shapes, this research work presents a unique investigation and revision among different structures such as flat, triangular, LFR, and parabolic concentrators. Moreover, since, in the UV–visible–NIR region, metals’ reflectance varies with the incident wavelength, five metals were considered: aluminum, gold, platinum, copper, and silver. Additionally, the research focuses on studying the effects of parameters critical to the quality of the concentration on the power obtained and on the uniformity of the radiation distribution on the surface of the receiver, as well as on the number of solar rays that reach the receiver. The power on the receiver increases proportionally with the number of reflector concentrators in the system and their reflectance. For parabolic geometries, the optical efficiency is affected by the receiver’s shadow on the concentrator and, in the case of the LFR, by a non-ideal alignment of the reflectors in relation to the receiver. However, in parabolic concentrator geometries, uniformity is usually lower, since in these configurations, the radiation is focused on specific areas of the receiver, usually the central zone.
1. Introduction
The quest for energy remains an ongoing challenge for humanity. Alongside the growth in electricity consumption, there is growing concern about climate change, the rapid depletion and high cost of conventional energy sources, and the environmental degradation caused by their excessive exploitation.
Systems using renewable energy sources differ significantly from one another, both technically and economically, and in terms of maturity and reliability [1,2,3,4]. Technologies using solar energy are currently the most promising. Not only are they starting to enjoy lower production costs, associated with their mass manufacture, but they also benefit from the properties of solar energy, namely its abundance and free availability [1,2,3,5,6].
These technologies have been subject to improvements aimed at enhancing their performance and increasing their efficiency, namely through the introduction of concentrators in these systems [2,7,8,9,10,11,12]. Thus, the relevance of this research, which consists of studying and modeling concentrators for solar photovoltaic systems, becomes evident [2,10,11,12].
2. Background
The aim of this article focuses on the study of the influence of the reflectance, optical errors, and the concentrator’s configuration as ascertained by its optical efficiency and its geometric and optical concentration factors. Therefore, some theoretical background about the spectral reflectance of materials and the optical errors is provided.
2.1. Spectral Reflectance
The efficiency of solar energy systems is strongly influenced by the optical properties of the components involved, such as the absorbance of the solar cells, the reflectance of the concentrator’s material, and the transmittance of the glass film (if applicable) [2,5,6,10,11,12,13,14]. The reflectance, R, represents the proportion of solar radiation incident on a surface that is reflected [13].
In photovoltaic applications, photons with energy below the solar cell’s band gap energy do not contribute effectively to the conversion of electrical energy. Silicon cells, commonly used in low-concentration solar applications, have a band gap energy of around . Therefore, photons with wavelengths longer than do not generate electrical energy efficiently [2,5,6].
It is then noted that the reflectance of a reflecting surface is dependent on the wavelength of the radiation incident on it, . This phenomenon can be referred to as spectral reflectance, and different materials have different spectral reflectance characteristics, so some materials can reflect certain wavelengths more efficiently than others [5,6].
For this reason, the spectral reflectances of five metals, aluminum (Al), gold (Au), copper (Cu), platinum (Pt), and silver (Ag), were selected and compared, having obtained the results illustrated in Figure 1, which shows the characteristics of the five metals for a range of wavelengths from 200 to 10,000 nm [13].
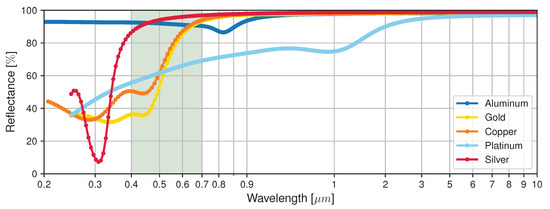
Figure 1.
Spectral reflectance of five metals: aluminum (Al), gold (Au), copper (Cu), platinum (Pt), and silver (Ag).
Some relevant points in the characteristics of the five metals discussed are also displayed in Table 1. These points correspond to the minima and maxima of the different curves, as well as the reflectance values of the five metals for a wavelength of , corresponding to the wavelength above which silicon solar cells do not produce electrical energy and in which all the absorbed optical energy is converted into electricity without having energetic surplus converted, for instance, into heat. Also, a wavelength of approximately is presented, corresponding to wavelengths around the solar spectral maximum irradiance [13,14].

Table 1.
Specific reflectance values for five metals: aluminum (Al), gold (Au), copper (Cu), platinum (Pt), and silver (Ag).
Of the metals presented, silver and aluminum have the best reflectance in the visible zone of the solar spectrum, which makes them preferable for CPV applications. Although aluminum has a lower reflectance than silver, it is the metal most often used in concentrators. It is the most abundant metal in the Earth’s crust, is cost-effective, has good mechanical properties, and is lightweight, highly reflective, and easy to recycle. Also, although it has a quite fast oxidation and corrosion responses, its reflection properties might also be analyzed considering other material forms as aluminum oxides. However, currently, there are some treatments such as paints or polishing that allow us to have aluminum for a long time.
2.2. Optical Errors
Solar concentration with reflectors relies on specular reflection to redirect the beam of sunlight towards a target—the receiver. Various errors in a solar concentrator lead to an angular deviation of the reflected solar rays from the direction of specular reflection, degrading concentration performance. The sources of errors in the reflected rays can be classified into four groups: specularity error, slope error, shape error, and tracking error [14,15].
Tracking errors, as the name implies, cover defects related to tracking that can be occasional and time-varying, for example an incorrect indication of the Sun’s position or an imperfect actuation of moving mechanisms [14,15].
Shape error and slope error are similar and difficult to differentiate. However, it can be said that shape error is more related to the total surface, which implies errors during the construction, assembly, and alignment of the concentrators, while slope error is more related to the local surface [14,15].
The specularity error is related to defects and imperfections whose characteristic wavelength scale is less than or comparable to that of the solar spectrum. These defects and imperfections lead to the scattering of solar radiation reflected from the surface. Slope error, on the other hand, translates into errors in the vector normal to the incidence surface, which is caused by topographical deviations on a larger scale than the solar spectrum, as illustrated in Figure 2 [14,15].
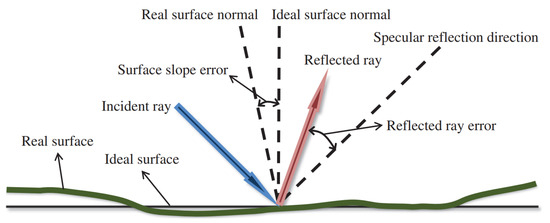
Figure 2.
Schematic diagram of a reflected ray error; an incident ray is deflected from the specular reflection direction mainly due to the surface slope error; adapted from [15].
3. Methodology
The concentrators to be studied were selected because they are comprehensive enough to show the influence of these parameters on their behavior.
The systems chosen, therefore, include flat geometries, namely flat, triangular, and LFR concentrators, and parabolic geometries, namely parabolic trough and parabolic dish concentrators. The decision to approach the study of flat and parabolic geometries separately stems from the perception that these configurations are more comparable to each other.
In an initial approach, in order to provide a starting point for future comparisons, simulations of the chosen geometries are presented for an ideal standard scenario. This means that, for all the simulations carried out, certain parameters have been kept constant, namely the DNI with a value of 1000 /; the receiver has always a unitary area, and its optical properties are those of an ideal absorber (null transmittance, null reflectance and null optical errors); the seed value of the simulation was kept constant; the concentrator was considered an ideal reflector (unitary reflectance, null transmittance and zero optical errors); the simulated Sun is positioned perpendicular to the XY plane, centered on the origin, at a height determined by the program that guarantees coverage of the entire system—concentrator and receiver. Disregarding the value of the half-angle of the solar disc, it is assumed that the simulated Sun covers everything with full intensity. Furthermore, this consistency between parameters makes it possible to gauge the comparison between the different geometries discussed.
Subsequently, the reflectance of the concentrator’s material was studied. SolTrace allows for the change of this optical parameter in the simulations, thus enabling the comparison of different reflectance values on the incident power and uniformity in the receiver’s surface. Theoretically, the higher the reflectance, the greater the proportion between the radiation flux incident on a surface and the flux that is reflected is.
In concentrating photovoltaic technology, when reflectors are used to concentrate the incident radiation, optical errors cause the reflected ray to deviate from the direction of specular reflection and, eventually, from a target, such as a receiver. Therefore, it was also sought after to understand the relationship between the optical errors modeled by SolTrace and the way in which the Sun’s rays are reflected since this reflection is central to evaluating the optical performance of solar concentrators.
In all the previous simulations, the shape of the Sun has been disregarded. This means that the simulated Sun was perfectly incident on the concentrator, ensuring that it was covered with full total intensity. Finally, for that reason, we studied how the shape of the simulated Sun, with a uniform distribution with a solar half-angle of , affects the irradiance and uniformity on the surface of the receiver.
4. Simulations
The simulations were carried out via SolTrace, a software tool developed by NREL to model concentrating solar power systems and analyze their optical performance. The SolTrace code uses the Monte Carlo ray-tracing methodology. The user specifies a certain number of solar rays to be traced, and the program generates each ray. The traced rays then travel through the system undergoing optical interactions with the different geometries present there. The traces of the studied geometries are portrayed in the figures presented in this section. The receivers, shown in red in these figures, are rectangles with a unitary area with a length of 100 and a width of .
Figure 3 presents the simulation for a flat concentrator. This concentrator is a rectangular reflector, 1 wide by long, and is orientated so that it makes an angle of 135 ° with the XY plane. The receiver is a square of unit area and is perpendicular to the XY plane. The solar rays coming from the fictitious Sun descend on the XY plane, so orientating the concentrator diagonally ensures that the rays are redirected so that they fall perpendicularly on the receiver, increasing the incident power. In other words, the concentrator is oriented at an angle of 135 ° to the XY plane to maximize the number of solar rays falling on the receiver and, consequently, the power incident on it.
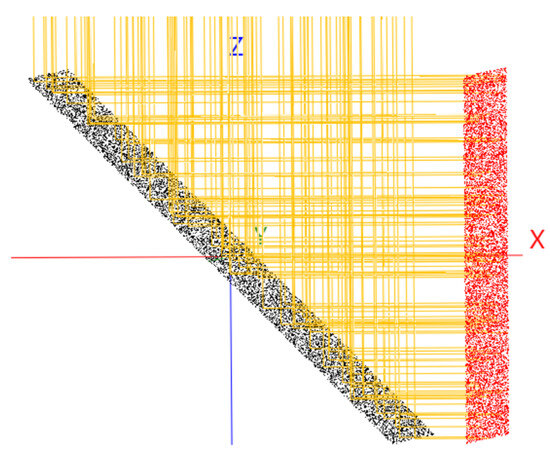
Figure 3.
Flat concentrator (black) and receiver (red); simulation in SolTrace.
The triangular concentrator, in Figure 4, consists of two flat concentrators, one on each side of the receiver—front and back. The purpose of this simulation is to see if, by doubling the useful area of the receiver—front and back—the concentration factor doubles as expected.
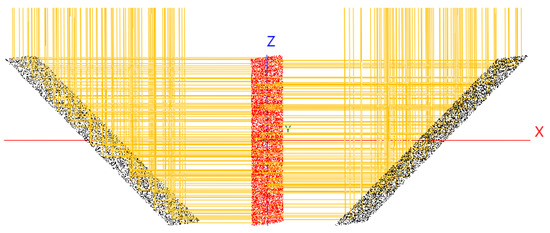
Figure 4.
Triangular concentrator (black) and receiver (red); simulation in SolTrace.
The linear Fresnel reflector (LFR) illustrated in Figure 5 has six reflectors, all square with unitary area, separated from each other by 2 and ordered from left to right; the reflectors are oriented concerning the XY plane, with the following angles: 158°, 164°, 174.5°, 5.5°, 16° and 22°.
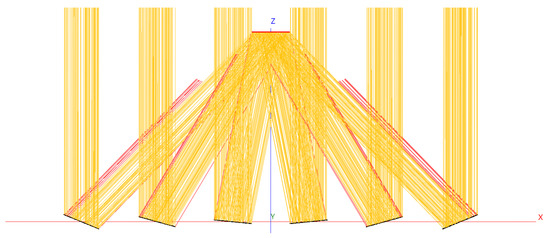
Figure 5.
Linear Fresnel reflector (black) and receiver (red); simulation in SolTrace.
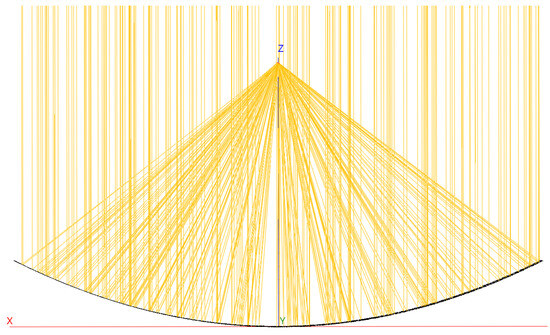
Figure 6.
Parabolic trough concentrator (black) and receiver (red); simulation in SolTrace.
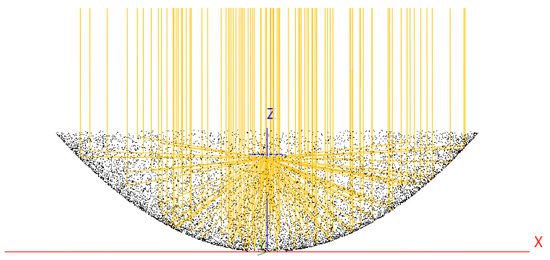
Figure 7.
Parabolic dish concentrator (black) and receiver (blue); simulation in SolTrace.
The first, the parabolic trough concentrator, focuses the incident radiation along a line at the height of the focal point, f, of the parabola. It is, therefore, essential to place the receiver at the height of the focal point. It has a rectangular opening with dimensions of 100 long by 1 wide and has a parabolically shaped surface described by , where for this simulation, and were considered. The focal point can be found from , obtaining . In other words, the receiver must be placed at a height of . According to these dimensions, a geometric factor of is expected.
The parabolic dish concentrator has a parabolic surface also described by , but with and in order to form the disc configuration with axial symmetry. In addition, the aperture of this concentrator is not rectangular, but circular with an area of 100 , so the diameter of the aperture is approximately . The receiver is square with unit area and is placed at the height of the focal point (, ).
5. Results
The results obtained from the simulations are now displayed and categorized into four parts: the ideal scenario, the effect of the reflectance of the concentrator’s material, the reflection’s optical errors, and the Sun’s shape.
5.1. Ideal Simulation
Table 2 summarizes the information and the values obtained for flat and parabolic geometries in the SolTrace simulation for the aforementioned ideal scenario.

Table 2.
Values obtained for flat and parabolic geometries in SolTrace simulation.
In all five geometries, 10,000 rays reflected from the concentrator are expected to hit the receiver, since this is the value specified by the program. However, it can be seen from Table 2 that, in the case of the linear Fresnel reflector, around 12% of the Sun’s rays from the concentrator were lost. This loss is evident in Figure 3, Figure 4 and Figure 5, where it can be seen that only in the LFR are there rays illustrated in red, which correspond to rays that miss the receiver; in the other two flat geometries, all the rays are yellow, symbolizing the intersection with the receiver. This loss of solar rays can be attributed to the positioning and orientation of the reflectors that make up the LFR. Although the orientation angles of the reflectors were determined in order to maximize the number of solar rays incident on the receiver, these angles were established experimentally and never reached an ideal value, corresponding to all the rays reflected from the concentrator intersecting the receiver.
For the parabolic geometries, this loss is 0.9% for the trough concentrator and 1.1% for the dish concentrator. Both values for the parabolic geometries are negligible, perhaps due to the choice of receiver area, which in both cases is 100-times smaller than the concentrator, causing less shadowing.
Increasing the number of flat concentrators directing radiation to a receiver leads to higher peak, average, and minimum irradiance in that receiver, along with more powerful traced rays and higher power per ray. The rise in the number of concentrators proportionally increases the average flux and ray power. For instance, transitioning from one to two concentrators, as seen from the flat concentrator to the triangular concentrator, both the average flow and ray power double. Similarly, for the LFR compared to the flat concentrator, there is a sixfold increase in the average flow and ray power. However, some non-linearity is observed due to the 12% loss of reflected rays. The same proportionality applies to the concentration factors; by doubling the useful area of the receiver in the triangular geometry, the concentration factors doubled. The same occurred for the LFR, except the results were not as perfect.
As shown in Table 2, the three flat geometries share identical uniformities, as for the parabolic geometries, the value recorded for the uniformity in both receivers is comparatively much higher. This was not expected, since one of the supposed advantages of using flat reflectors in photovoltaic systems is the more uniform distribution of irradiance in the receiver compared to when curved reflectors are used. The uniformity is calculated by the program as the ratio between the standard deviation and the mean of the fluxes, so this result might be due to the high precision at which the radiation is focused onto the receiver, leading to a greater dispersion of the data set (the lowest flux is zero, and the highest flux is six orders of magnitude higher), increasing the standard deviation. However, this precision is not realistic and is only a result of the ideality of the simulation (absence of optical errors, disregarding the Sun shape and maximum reflectance of the reflective materials), so these uniformity values should be interpreted with a grain of salt.
In addition to the 3D plots of the intersections of the Sun’s rays with the CPV elements, SolTrace also provides 2D maps of the flux incident on the surface of the receivers. Below is Figure 8, which shows the flux maps for the receivers of the flat and parabolic concentrators.
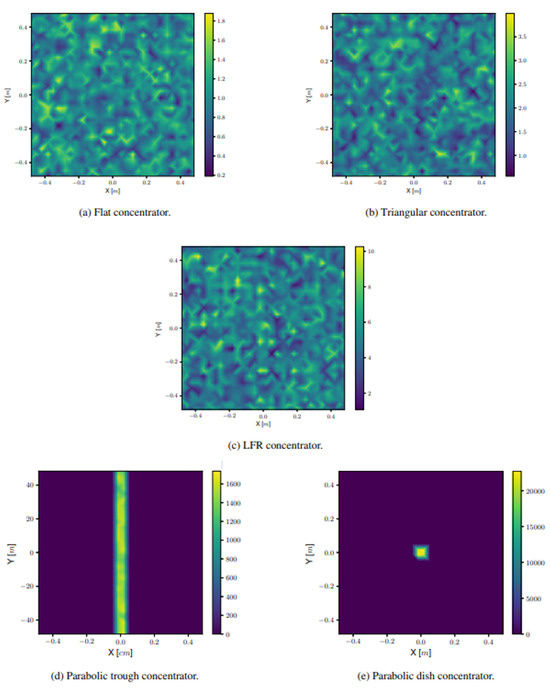
Figure 8.
Flux maps for the different geometries.
The flux distribution on the surface of the receiver of the other two flat geometries is similar to that of the flat concentrator. In the three flat configurations studied, the predominant colors on the maps are green and blue, corresponding to the average irradiance values, and yellow and dark blue, referring to the maximum and minimum irradiance values, respectively.
The distribution in the parabolic trough concentrator receiver is similar to the distribution of radiation in the flat geometry receivers, however, centered in the longitudinal section of the receiver; in this area, there is a greater concentration of radiation, typical of this geometry. On the other hand, in the parabolic dish concentrator receiver, the point and circular nature of the focus of the radiation reflected from the concentrator can be clearly identified.
5.2. Reflectance Simulations
While the previous standard simulation used a unit reflectance for the concentrator’s material, which made it possible to establish a theoretical limit (unattainable in practice), the variation in reflectance influences the power received by the receiver and the distribution of the flux on its surface. In Figure 9 and Figure 10, respectively, the characteristics and the uniformity of the incident radiation distribution in the receiver’s surface for the five studied geometries are represented.
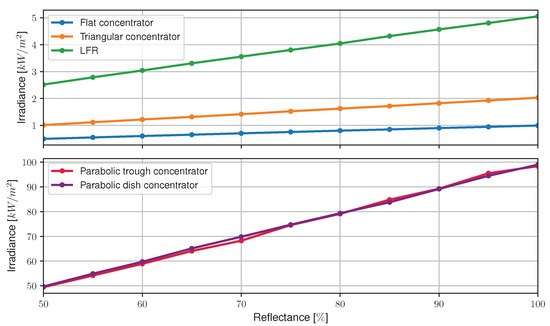
Figure 9.
characteristics in the receiver’s surface of the five studied geometries.
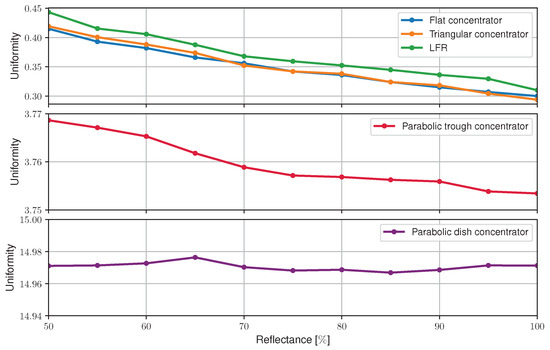
Figure 10.
Uniformity of the incidentradiation distribution on the receiver’s surface as a function of the concentrator’s reflectance for the five studied geometries.
There is a linear and proportional relation between the power incident on the surface of the receiver and the reflectance of the concentrator in its CPV.
The flat geometries all have a uniformity that varies inversely with the reflectance of the concentrator. It is known that uniformity is given by dividing the standard deviation by the average flux and that a decrease in reflectance causes a decrease in irradiance at the receiver. Thus, a possible explanation for this phenomenon is that, although the standard deviation of the distribution remains the same (since all the irradiance values decrease in the same way), decreasing the reflectance reduces the average flux and, therefore, induces an increase in uniformity.
Regarding the parabolic geometries, these have a more constant uniformity characteristic as a function of reflectance than the previous ones, although an inversely proportional nature in the parabolic trough concentrator can still be spotted.
Regarding the flux distribution maps on the surface of the receiver, the results obtained for the three geometries are presented: flat concentrator (Figure 11), parabolic trough concentrator (Figure 12), and parabolic dish concentrator (Figure 13). To avoid redundancy, it was chosen to display only the maps for the lowest reflectance obtained from the five metals studied—the reflectance of aluminum at , with a value of —and an intermediate reflectance—that of gold at , with a value of . This choice intends to emphasize the differences found between the responses for minimum, intermediate, and maximum reflectance (unit reflectance of the ideal standard scenario).
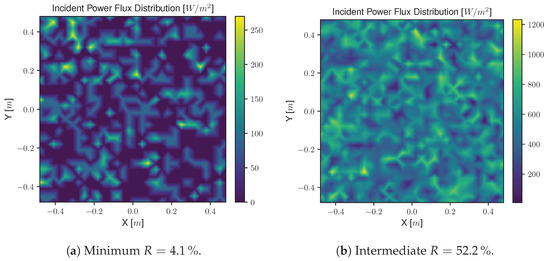
Figure 11.
Flux distribution maps on the receiver’s surface for the flat concentrator.
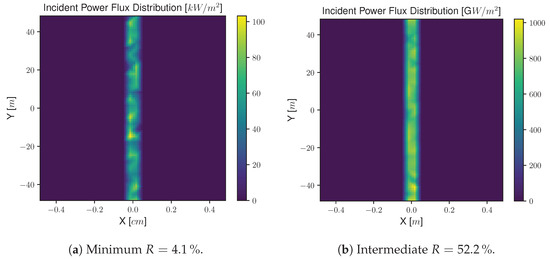
Figure 12.
Flux distribution maps on the receiver’s surface for the parabolic trough concentrator.
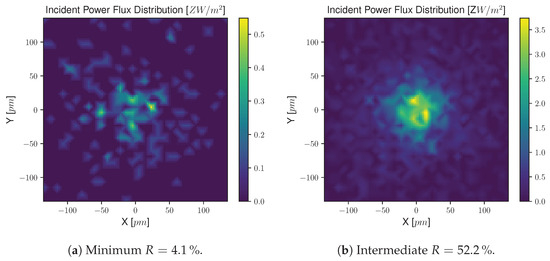
Figure 13.
Zoom of the flux distribution maps on the receiver’s surface for the parabolic dish concentrator.
The color differences in the incident flux distribution maps of the receiver of the flat and parabolic trough geometries are clear. The figures on the left, which refer to the scenario with minimum reflectance, are dominated by purple and dark blue, referring to zero or lower irradiance values. In the figures on the right, the maps are lighter, with yellow, light blue, and green, corresponding to higher irradiance values. To better understand the difference in the colors for the parabolic dish concentrator, the scale of the map is enlarged, resulting in Figure 13.
Graphically speaking, the differences between the figures are once again quite clear. In the figure on the left, the minimum reflectance has a much lower presence of the light colors, green, light blue, and yellow, indicating that the irradiance on this surface is lower. It should also be noted that, despite the colors being different, the zones where the radiation hit are the same; there was no radiation deviation or scattering because the optical errors in these simulations are null.
Figure 13 shows a zoomed map of the flux distribution on the surface of the receiver. This amplification is performed automatically by SolTrace, and the process changes the values given by the program for the maximum, average, and minimum flux. These values become absurdly high and no longer make rational sense; this is only because, expanding the window, even if only for illustrative purposes, causes the program to take these values into account as the new area of the receiver for the irradiance calculation. This means that, even if the incident power remains the same (which is the case since the map was only zoomed), decreasing the area of the window—and therefore, of the receiver—causes the value of the incident irradiance to increase enormously (per unit area).
5.3. Optical Errors’ Simulations
The first law of reflection states that the direction of the incident ray and the direction of the reflected ray make the same angle to the normal to the surface of incidence. In other words, in an ideal reflector, the angle of incidence and the angle of reflection are equal [13].
This type of reflection is called specular reflection. The other type of reflection is diffuse reflection, where the angle of reflection is random and independent of the angle of incidence.
Only two of the four types of errors are modeled in SolTrace, namely the surface slope error and the specularity error. The specularity errors are particularly relevant for the parabolic trough and dish concentrators because the light will not be as precisely reflected at the line or focal point, respectively, leading to a decrease in the radiation incident on the receiver and, consequently, a decrease in the optical and electrical performance of the CPV. Therefore, in addition to the flat concentrator, the variation of the optical errors mentioned for the two parabolic configurations was also tested.
Firstly, one may change the optical properties of the concentrators of the chosen geometries to analyze the variation of the specularity error. To achieve this, the angle of the optical parameter relating to the specularity error was changed to the following values: , , , and . This process is then repeated for the slope error, once again varying the error by the angles indicated above. Finally, both errors are added together to explore the effect of their combination on the total optical error of the concentrator surfaces. The results obtained from these simulations were also compared to the standard scenario with zero optical errors.
Figure 14 shows the influence that the errors mentioned have on the average irradiance of the receiver surface for flat concentrator reflectance values ranging from 50% to 100%.
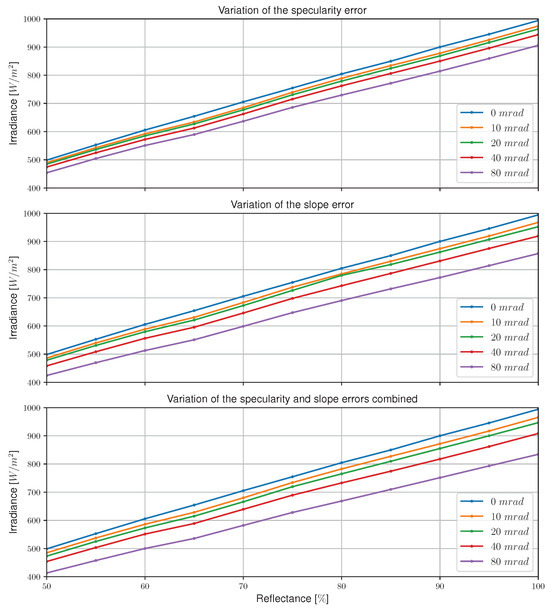
Figure 14.
Variation of irradiance as a function of flat concentrator reflectance for different values of specularity error, slope error, and total error.
The greater the error (the greater the standard deviation , and ), the lower the power incident on the surface of the flat concentrator geometry receiver is. This is because the geometric deviation leads to a reduction in rays incident on the receiver surface.
In relation to the different components of the total optical error and their weights, it should be noted that the specular error has less influence on the geometric deviation of the reflected rays than the slope error. Therefore, the total optical error, made up of both the specularity error and the slope error, has a similar effect on the receiver’s average irradiance to that of the slope error, since this component is the most significant.
This process is repeated again for the parabolic geometries. However, the angles of the optical parameters for the specularity and slope errors were varied by , , and . The choice to use these angles is due to the fact that they are representative enough, and because angles greater than result in errors that cause a decrease in irradiance so great that the conclusions become repetitive.
Also, having concluded that the error that has the greatest impact on the performance of the optical system is the slope error, as can be seen in Figure 14, the variation of the average irradiance and flux distribution on the receiver’s surface is studied for both errors together in parabolic geometries, as opposed to studying the two errors individually as previously done.
Figure 15 shows the results obtained for the average irradiance on the receiver surface with the variation of the specularity error and the slope error combined for the parabolic trough concentrator and the parabolic dish concentrator.
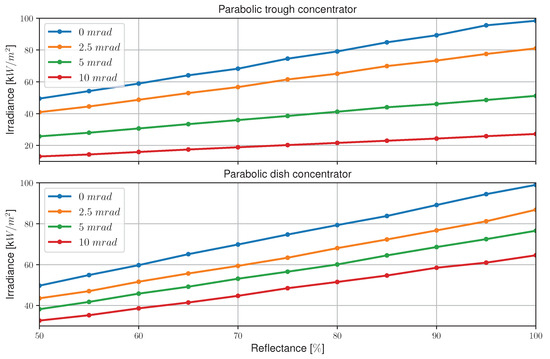
Figure 15.
characteristics for the parabolic concentrators for different values of total error—combination of specularity error and slope error.
The hypothesis that the presence of errors is more pronounced in parabolic geometries is confirmed. Due to the geometric deviation of the Sun’s rays, the light is not concentrated as precisely on the respective focal points of the geometries, causing a reduction in the rays that reach the receiver and, consequently, a reduction in the irradiance on its surface.
It should be noted that the chosen angles, although smaller than those used in the flat concentrator variation, have a greater effect on reducing the irradiance on the receivers of parabolic geometries. This is because these systems require greater precision in the reflection of the Sun’s rays from the concentrator to the receiver than the flat concentrator, and in the presence of errors, this precision decreases considerably. These results reinforce the need for a tracking system for both parabolic geometries.
Below are the flux distribution maps—Figure 16 and Figure 17—for different total optical errors. These values were taken under unitary reflectance.
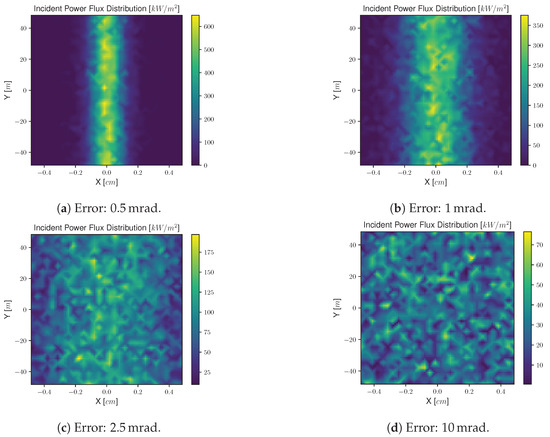
Figure 16.
Flux distribution maps on the receiver’s surface for the parabolic trough concentrator for different values of total optical error—combination of specularity error and slope error.
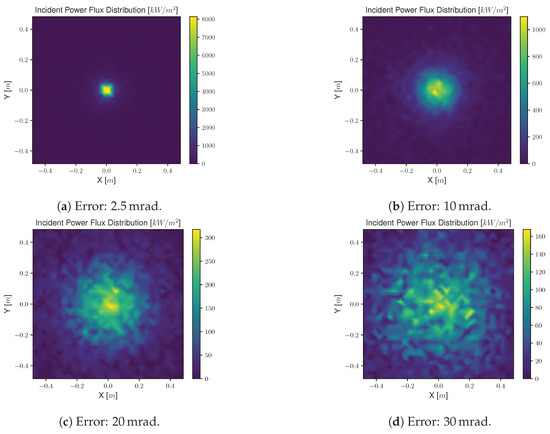
Figure 17.
Flux distribution maps on the receiver’s surface for the parabolic dish concentrator for different values of total optical error—combination of specularity error and slope error.
It can be verified that the greater the angular deviation (the greater the error), the greater the scattering of the incident power on the surface of the receiver is. Figure 16a,b still show the superior incidence of solar rays in the central area of the receiver, typical of the parabolic trough geometry, but from onwards, this distribution becomes unnoticeable—Figure 16c,d.
The conclusions drawn for the parabolic dish concentrator are similar to those for the trough concentrator. It should be noted, however, that with the trough geometry, the optical error has to be higher to achieve a dispersion of the incident power similar to that obtained for the parabolic trough concentrator receiver. Perhaps this is because, although both receivers have the same area, the width of the trough geometry receiver ( 10 ) is much smaller than the width of the dish geometry receiver ( 1 ). Therefore, the concentration of the Sun’s rays on the surface of the parabolic trough receiver has to be much more precise, and consequently, a deviation of is enough to see a spread of the radiation on the surface, which is not the case with the parabolic dish concentrator receiver.
5.4. Sun Shape
The selection of the shape of the simulated Sun depends on the geometry and, in particular, the concentration level of the concentration solar systems. High-concentration systems have low acceptance angles and, therefore, see less of the radiation around the solar disk. The impact of solar distribution is much greater in high-concentration systems. Still, for many high-concentration systems, choosing a Sun with a uniform distribution is more than adequate. For low-concentration systems, the impact is smaller, since the system has a high acceptance angle and much of the circumsolar radiation finds its way to the receiver or concentrator aperture.
In all the simulations presented so far, the shape of the Sun has been disregarded. In other words, the simulated Sun was perfectly incident on the concentrator, ensuring that it was covered with radiation at full intensity. Now, we study how the shape of the simulated Sun, with a uniform distribution and a half-angle of , affects the irradiance and uniformity on the surface of the receiver.
Figure 18 and Figure 19 show the irradiance and uniformity of the radiation distribution on the receiver surface as a function of reflectance for the flat concentrator and for concentrators with parabolic geometries.
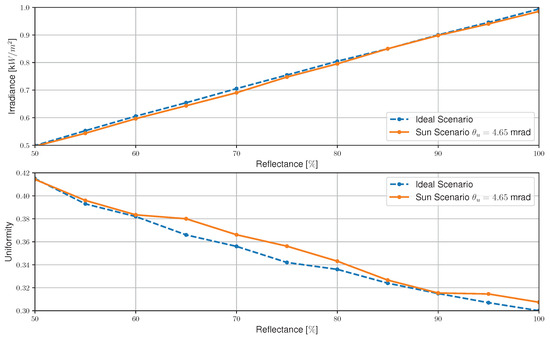
Figure 18.
Irradiance and uniformity at the receiver as a function of the reflectance of the flat concentrator, for the ideal scenario and the scenario with a fictitious Sun with a solar half-angle of .
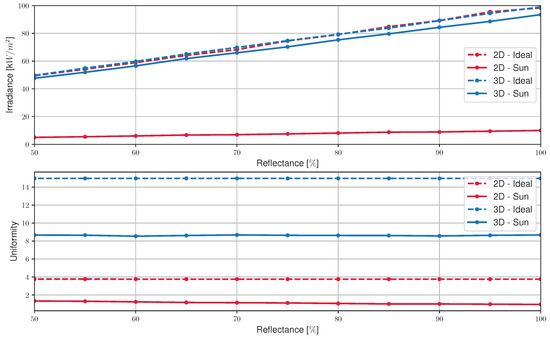
Figure 19.
Irradiance and uniformity at the receiver as a function of the reflectance of the parabolic trough concentrator—2D—and the parabolic dish concentrator—3D—for the ideal scenario and the scenario with a fictitious Sun with a solar half-angle of .
The results found for the flat geometry are very similar to those recorded for the ideal scenario. Thus, the simulations presented so far for low-concentration geometries are assumed to remain valid, since the ideal scenario is a good approximation of the scenario that includes the Sun shape for the simulations for low-concentration systems—flat geometries.
With regard to parabolic configurations—with a high concentration—the results are not so similar. Particularly for the parabolic trough concentrator, the differences are considerable, so the previous simulations would have to be reperformed if the shape of the Sun were to be considered in these geometries. As for the parabolic dish concentrator, the irradiance is similar, but the uniformity is almost half that of the ideal scenario. Even so, in the case of this geometry, it would be acceptable to maintain the values of the previous simulations.
The difference between the results of these two geometries is probably due, once again, to the difference in the width of the receivers of both geometries. The receiver of the parabolic trough concentrator tolerates geometric deviations in the incident radiation less than the receiver of the parabolic dish concentrator.
6. Conclusions
If it is possible to reduce the cost of the photovoltaic module or reduce the number of solar cells needed, without compromising the amount of energy produced, solar technology becomes viable and affordable. The most suitable solution to this problem is concentrating on photovoltaic technology.
The use of concentrators makes it possible to capture sunlight from a large area and focus it on a receiver of a smaller area. Five CPV structures were studied via simulation. These configurations were analyzed and compared using certain parameters that characterize them, namely the number of solar rays that hit the receiver, the irradiance that reaches the concentrator and receiver, the uniformity of the radiation distribution in the receiver, the optical and geometric concentration factors of these systems, and their optical efficiency.
In the first simulation, where the five geometries were compared for an ideal and standard scenario, the results obtained are all very close to ideality, given the concentrator’s unitary reflectance, the absence of optical errors in the reflection, and the disregarding of the Sun shape, which guarantees constant and maximum solar intensity over all the elements of the geometry. The following conclusions can, therefore, be drawn from the shape of the concentrators alone:
- The number of ray hits and, consequently, the power incident on the receiver’s surface increase proportionally with the number of reflector concentrators in the system;
- The uniformity of the radiation distribution in the receiver of the three flat configurations studied is very similar;
- The optical efficiency of these systems is nearly maximum, being affected either by the receiver’s shadow on the concentrator, in the case of parabolic geometries, or, in the case of the LFR, by a non-ideal alignment of the reflectors in relation to the receiver, which reduces the number of solar rays incident on the concentrator, which are then reflected back to the receiver.
- The uniformity of the incident radiation on the receiving surface is very high in the parabolic geometries; however, due to the ideality of the simulation in the standard scenario, these values are not as expected and are not plausible. In fact, in the parabolic concentrator geometries, uniformity is usually lower, since in these configurations, the radiation is focused on specific areas of the receiver—the central zone.
The efficiency of CPV systems is limited by the optical efficiency of their components, making it crucial to choose materials that maximize the concentrators’ optical performance. With regard to the reflective materials used in concentrators, they must meet several requirements. These include a high reflectance of the material and the ability to reflect as much of the useful solar radiation as possible that will be incident on the photovoltaic cells, and they have to be low cost compared to the solar cells on which the reflector concentrates the radiation.
When studying the effect of the reflectance of the concentrator’s constituent materials on the system’s performance, of the metals discussed, the one that seems to be the most suitable is aluminum, both because of its low cost and its abundance compared to the other metals, as well as its spectral reflectance response.
In view of the effect of the reflectance and optical errors of the concentrator surface, the following was also concluded:
- The number of ray hits and, consequently, the average flux recorded on the surface of the receiver decreases proportionally as the reflectance of the concentrator’s reflective material decreases;
- The increase in optical errors on the concentrator’s surface causes a geometric deviation in the path of the Sun’s rays, which leads to a slight decrease in the incident power receiver’s surface;
- The uniformity of the flux distribution on the receiver’s surface varies inversely proportional to the reflectance;
- The specularity error is less influential on the concentrator’s performance than the slope error;
- The optical–geometric deviation caused by the concentrator’s optical errors causes significant changes in the mean incident flux distribution on the receiver’s surface. This effect is particularly noticeable in the parabolic trough geometry, whose rays scatter from the central area to the edges of the receiver with increasing optical errors.
This work has shown that certain optical parameters affect the incident irradiance on the receiver’s surface and the way the radiation is distributed over its surface. Recalling that, in concentrating solar technologies, the receiver is the photovoltaic cells, it is possible to establish a correlation between the results obtained through simulations for the receiver and the behavior of the solar cell.
Author Contributions
Conceptualization: A.F.M.d.C. and R.A.M.L.; methodology: A.F.M.d.C. and R.A.M.L.; validation: A.F.M.d.C., R.A.M.L., C.P.C.V.B., J.P.N.T. and M.S.; investigation: A.F.M.d.C., R.A.M.L.; writing—original draft: A.F.M.d.C.; writing—review and editing: R.A.M.L., C.P.C.V.B., J.P.N.T. and M.S.; supervision: J.P.N.T. and M.S. All authors have read and agreed to the published version of the manuscript.
Funding
This research received no external funding.
Institutional Review Board Statement
Not applicable.
Informed Consent Statement
Not applicable.
Data Availability Statement
Data will be made available upon request.
Acknowledgments
This work was supported in part by FCT/MCTES through national funds and in part by cofunded EU funds under Project UIDB/50008/2020. Also, this work was supported by FCT under the research grant UI/BD/151091/2021.
Conflicts of Interest
The authors declare no conflicts of interest.
References
- Suman, S.; Khan, M.K.; Pathak, M. Performance enhancement of solar collectors—A review. Renew. Sustain. Energy Rev. 2015, 49, 192–210. [Google Scholar] [CrossRef]
- Marques Lameirinhas, R.A.; Torres, J.P.N.; de Melo Cunha, J.P. A Photovoltaic Technology Review: History, Fundamentals and Applications. Energies 2022, 15, 1823. [Google Scholar] [CrossRef]
- Ferreira, R.F.; Lameirinhas, R.A.M.; Bernardo, C.P.C.V.; Torres, J.P.N.; Santos, M. Agri-PV in Portugal: How to combine agriculture and photovoltaic production. Energy Sustain. Dev. 2024, 79, 101408. [Google Scholar] [CrossRef]
- dos Santos Castilho, C.N.; Torres, J.P.; Ferreira Fernandes, C.A.; Marques Lameirinhas, R.A. Study on the Implementation of a Solar Photovoltaic System with Self-Consumption in an Educational Building. Energies 2021, 14, 2214. [Google Scholar] [CrossRef]
- Flores-Pacheco, A.; López-Delgado, R.; Álvarez Ramos, M.E. Determination of power conversion efficiency of CdTe QDs luminescent solar concentrators by analytic model and COMSOL photogeneration model. Optik 2021, 248, 168024. [Google Scholar] [CrossRef]
- Chen, C.F.; Lin, C.H.; Jan, H.T. A solar concentrator with two reflection mirrors designed by using a ray tracing method. Optik 2010, 121, 1042–1051. [Google Scholar] [CrossRef]
- Shahabi, T.; Heidarzadeh, H.; Bahador, H. Dual metallic-based plasmonic back reflector to broaden the absorption spectra of a thin film amorphous silicon solar cell. Opt. Commun. 2023, 544, 129623. [Google Scholar] [CrossRef]
- Shen, X.; Wang, Z.; Wangyang, P.; Zhou, H. Light harvesting in thin film solar cells via designing nanostructured geometries. Opt. Commun. 2023, 545, 129624. [Google Scholar] [CrossRef]
- Aoyu, Z.; Ziming, C.; Fuqiang, W.; Weixin, X.; Huaxu, L. Radiative property investigation of metal nanoparticles embedded in absorption layer for thin-film solar cell with the consideration of medium absorption and dependent scattering. Opt. Commun. 2023, 545, 129654. [Google Scholar] [CrossRef]
- Yin, P.; Xu, X.; Jiang, Z.; Hai, Y. Ray-leakage-free discal solar concentrators of a novel design. Opt. Commun. 2017, 405, 378–386. [Google Scholar] [CrossRef]
- Li, D.; Xuan, Y. Concept design and simulation of a concentration lens with uniform square irradiance. Opt. Commun. 2017, 400, 9–19. [Google Scholar] [CrossRef]
- Tsai, C.Y. Enhanced irradiance distribution on solar cell using optimized variable-focus-parabolic concentrator. Opt. Commun. 2013, 305, 221–227. [Google Scholar] [CrossRef]
- Lameirinhas, R.A.M.; Torres, J.P.N.; Baptista, A.; Martins, M.J.M. A New Method to Analyse the Role of Surface Plasmon Polaritons on Dielectric-Metal Interfaces. IEEE Photonics J. 2022, 14, 1–9. [Google Scholar] [CrossRef]
- Mota, F.; Neto Torres, J.P.; Ferreira Fernandes, C.A.; Marques Lameirinhas, R.A. Influence of an aluminium concentrator corrosion on the output characteristic of a photovoltaic system. Sci. Rep. 2020, 10, 21865. [Google Scholar] [CrossRef] [PubMed]
- Lee, H. The geometric-optics relation between surface slope error and reflected ray error in solar concentrators. Sol. Energy 2014, 101, 299–307. [Google Scholar] [CrossRef]
Disclaimer/Publisher’s Note: The statements, opinions and data contained in all publications are solely those of the individual author(s) and contributor(s) and not of MDPI and/or the editor(s). MDPI and/or the editor(s) disclaim responsibility for any injury to people or property resulting from any ideas, methods, instructions or products referred to in the content. |
© 2024 by the authors. Licensee MDPI, Basel, Switzerland. This article is an open access article distributed under the terms and conditions of the Creative Commons Attribution (CC BY) license (https://creativecommons.org/licenses/by/4.0/).