Abstract
One of the food preservation technologies is the drying process, which requires heat and is significantly energy-intensive, resulting in high costs. This caused the search for new design solutions for dryers, which requires continuous experimental research and the creation of new decision-supporting models for the optimization of drying processes. In this work, four models of the kinetics of convective onion drying were developed using Artificial Neural Networks (ANNs), taking into account pre-treatment before drying and the different temperatures of the drying agent. The moisture content in the dried material at a specific moment in time was taken as the dependent variable (ANN output). The following were accepted as independent variables (ANN inputs): drying temperature, initial sample thickness, initial moisture content, initial mass of the sample, time of drying, and material pre-treatment (no pre-treatment—blanching–osmotic dehydration). Four semantic models were formulated, the general Ann1 model taking into account all input variables and three detailed Ann2 models for individual types of pre-treatment. For the best Ann1, the MAPE values were 5.88–7.02% (for different data: Training, Test, Validation). For the detailed Ann2 models, the error values were more than twice lower. The MAPE values ranged from 1.14% to 3.12%.
Keywords:
drying process; convective drying; onion; ANN; moisture content; blanching; osmotic dehydration 1. Introduction
One of the oldest and most frequently used technologies for food preservation and processing in the agri-food industry is the drying process. During this process, by reducing the water content and inhibiting biochemical and disease processes, the storage time of dried plant materials is extended and the dimensions are reduced. This facilitates their storage and transport. It is a thermal process that requires heat and is very energy-intensive, which results in high costs [1,2,3].
Research on the drying process of various plant materials is carried out in several main areas:
- Searching for new drying methods and methods for material pre-treatment [4,5,6].
- Determining the impact of drying parameters on the product quality, including sensory properties (e.g., appearance, texture, taste, and aroma), nutritional and health-promoting properties (e.g., content of bioactive compounds: total content of polyphenols, flavonoids, glycosides, vitamin C and volatile compounds), and physico-mechanical properties (e.g., shrinkage; microstructure) [7,8,9].
- Study of the kinetics of the drying process [10,11,12].
- Drying modeling and optimization [13,14,15].
Therefore, in order to obtain dry material of the highest possible quality, which would be similar to the properties of fresh raw material, and, at the same time, to obtain low drying costs, innovative drying technologies were sought.
The convective drying method with forced circulation of the drying agent is commonly used [16,17,18].
Hybrid systems are increasingly used, combining convection drying with microwave drying and high-frequency currents, which improves the quality of the dried fruit [10,19].
Sustainable development influences changes in energy sources in dryers, which in turn requires design changes. New design solutions influence the drying process, and this requires continuous experimental research and the creation of new models supporting decisions regarding the optimization of drying processes—in this case, plant materials [14,20].
1.1. Drying Vegetables
The choice of the appropriate method and device depends on the types of plant material, its properties, and the intended use of the dried material. Vegetables are one of the species that are dried [15,21,22].
These are highly hydrated materials containing vitamins, sugars, essential oils, and dyes, in which qualitative changes may occur under the influence of temperature as a result of enzymatic reactions and other biochemical reactions [23].
Drying often causes a significant loss of vitamins and essential oils. There are also difficulties related to water drainage due to changes in the structure of the material and its physical and mechanical properties. The material has other quality features, such as taste, appearance, smell, etc., which affect the usefulness of such dried material. This is especially the case with dried vegetables, which are also used as an intermediate product for the production of soups, sauces, etc. Such an intermediate product must meet certain parameters that affect further both its processing and the final product [24].
1.2. Drying Onions
One of the vegetables that is subjected to drying is onion, which is widely used for food and health purposes. It is a bulbous vegetable. The specific layered structure causes it to deform unevenly and delaminate during drying. Water is drained along the thickness of the slices, because each layer is covered with a film that protects against moisture loss. As this vegetable contains many valuable nutrients and health-promoting ingredients, it is subjected to appropriate pre-treatment and dried using a method that minimizes any quality losses [25,26,27,28,29]. Therefore, numerous studies have been carried out on the kinetics of onion drying in order to determine the optimal drying parameters and make an appropriate decision regarding the drying method depending on the intended use of the dried product [30,31,32]. Drying kinetics determines changes in water content and drying rate during the process. Based on the research, it was found that changes in water content occur in two drying periods: the first is a constant drying rate and surface mass transfer, and the second is internal diffusion of water to the product surface and decreasing drying rate [33,34].
1.3. Drying Models—Kinetics
Mathematical models are useful for analyzing and explaining the drying process. However, they can only inform us about the tendency of changes in water content, without the possibility of explaining this process (empirical and semi-empirical models). Other such useful models include structurally similar models derived from the laws of mass and heat transfer and process thermodynamics [34]. Both types of models used to describe the kinetics of onion drying are presented in the literature [31,32,35,36]. The semi-empirical models of Pabis and Henderson, Newton, Lewis, and Page are often used to describe the kinetics of onion drying [30,35]. Models of changes in water content and material temperature were also formulated for convective drying, based on the law of conservation of mass and Fick energy [31,32,37].
1.4. Modeling of Drying Kinetics Using ANNs
One of the goals of modeling is decision support and process optimization. In such cases, information models (“black box” models) are often used. They do not explain the occurring phenomena but very precisely simulate the behavior of the system (process course). One of the tools for creating such models is Artificial Neural Networks (ANNs), which are artificial intelligence methods. Models using ANNs are characterized by very high accuracy (they show smaller errors than traditional mathematical models) and are successfully used in almost all scientific fields, including, for example, bioinformatics, biochemistry, medicine, meteorology, economic sciences, robotics, aquaculture, food security and climatology bioinformatics, biochemistry, medicine, meteorology, economic sciences, robotics, aquaculture, food security, climatology, agriculture, agrophysics, or agricultural engineering [38,39,40].
Many scientists have successfully used ANNs to model the drying process of plant materials, especially fruits and vegetables [41,42].
The following plants’ drying processes were modeled using ANNs: potatoes [43,44,45], celeriac (Apium graveolens L.) [46], garlic [45], pumpkins (Cucurbita moschata) [47,48,49], watermelon rind pomace [50], tomatoes [51], red bell peppers (Capsicum annuum L.) [52], apples [44,53,54], cantaloupe slices [45,55], banana slices [56], persimmon fruits (Diospyros kaki) [57], graviola fruits (Annona muricata) [58], soursop fruit [59], figs [60], quinces [61,62], Aonla slices (Phyllanthus emblica L.) [63], white mulberry [64], konjac (Amorphophallus konjac) [65], plantain and taro (Colocasia antiquorum) [66], tobacco [67], linden leaves [68], spearmint (Mentha spicata L.) [56,69], Moringa olifera leaves [70].
ANNs were also successfully used to model the drying of onion [71,72,73].
Studies on modeling the drying of plant products showed that the errors for ANN were smaller compared to other types of mathematical models.
The disadvantage of traditional empirical models of drying kinetics is their relatively narrow scope of application (limited to the conditions in which the experiment was performed). However, ANN models allow for a more general description of the drying process. They have the ability to generalize.
Abbaspour-Gilandeh et al. [61] examined the process of drying quince fruit slices about 3 mm thick in a hot air dryer. They conducted experiments at three temperatures (50 °C, 60 °C, 70 °C) and three air velocities (0.6 m/s, 1.2 m/s, 1.8 m/s). They modeled the relative humidity (MR) using 10 traditional mathematical models (Newton, Henderson and Pabis, Page, Logarithmic, Two-term, Wang and Singh, Midilli et al. Parabolic, Logistic, Demir et al. [61]) and unidirectional multilayer ANNs. The best mathematical model was the model of Midilli et al., for which the average value of the coefficient of determination (R2) was 0.9992 and the root mean square error RMSE was equal to 0.0091. For the remaining models, the R2 value varied from 0.9947 to 0.9987, and RMSE from 0.0099 to 0.0219. However, for the best ANN-type FFBP (Feed Forward Back Propagation), the R2 value was 0.9993 and RMSE was equal to 0.0016.
In the study of the thin-layer convective-infrared drying behavior of white mulberry, Jahedi Rad et al. [64] compared the accuracy of five mathematical models (Demir et al., Midilli et al., Wang and Singh, Logistic, Two-term [64]) and multilayer perceptron (MLP) ANNs for describing MR lesions. The tests were carried out for three drying temperatures (40 °C, 55 °C, 70 °C), three air speeds (0.6 m/s, 1.2 m/s, 1.8 m/s), and three infrared power levels (500 W, 1000 W, 1500 W). The model of Midilli et al. showed the highest average; for all experimental conditions, the R2 value = 0.9986 and the lowest average RMSE value = 0.04795. For the remaining models, R2 = 0.9933–0.9978, and RMSE = 0.07485–0.16340. For the best ANN, the value of R2 = 0.9990 and RMSE = 0.01988.
Mahesh et al. [58] compared semi-empirical mathematical models with ANN models for drying slices of soursop fruits with a thickness of about 5 mm. The drying process was carried out at three temperatures (40 °C, 50 °C, 60 °C). Of the mathematical models tested (Page, Henderson and Pabis, Midlli et al., Newton, Weibulls, Peleg, Wang and Singh, Logarithmic, Modified Page, Approximation of diffusion [58]), the most accurate was the Page model, for which R2 = 0.9697–0.9990 for various experiment conditions. The ANN model obtained R2 = 0.9999.
Sasikumar et al. [52] tested the drying process of red bell pepper cubes subjected to pre-treatment using ultrasound. The drying process was carried out at three temperatures (50 °C, 60 °C, 70 °C) and three air speeds (1.5 m/s, 2 m/s, 2.5 m/s). Five mathematical models were developed to predict MR values (Midlli et al., Approximation of diffusion, Modified Page, Two-term, Logarithmic [52]). They also developed an MLP-type ANN for determining MR and MC (moisture dontent). For an air speed of 1.5 m/s, the best mathematical model was the Midilli et al. model (R2 = 0.9988, RMSE = 0.013497). The two-term model was best for speeds of 2 m/s and 2.5 m/s. These models obtained values of R2 = 0.9995 and RMSE = 0.00166 (for 2 m/s) and R2 = 0.9998 and RMSE = 0.00003 (for 2.5 m/s). The best ANN model achieved R2 values of 0.9989 (training subset) and 0.9997 (testing subset).
1.5. Aim of the Paper
The aim of this study was to develop an ANN-driven model of the kinetics of convective drying of onions, which would describe changes in water content during drying. The developed model was used to take into account pre-treatment before drying and different temperatures of the drying agent.
2. Materials and Methods
The research covered onions in order to determine the influence of the type of pre-treatment and the temperature of the drying agent during convection drying with forced air flow. The research involved laboratory measurements during drying of onion slices and then the development of ANN models using experimental data (Figure 1).
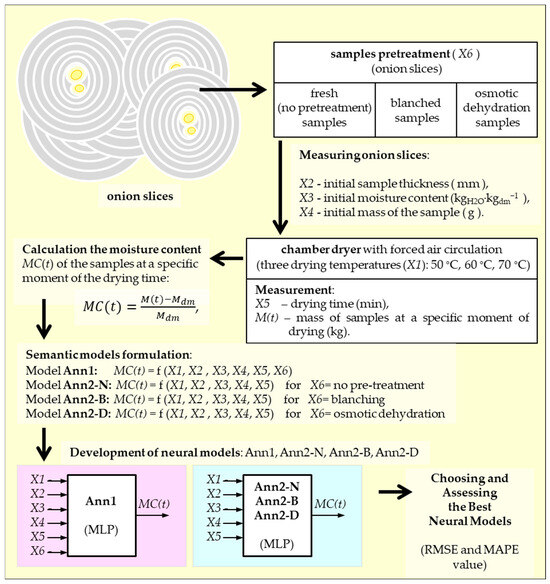
Figure 1.
Diagram of the performed research.
Thermal preservation of vegetables, such as drying, causes a number of quality changes in the product (taste, smell, color, etc.). Therefore, methods are used to minimize changes related to, for example, color, nutrient content, but also the structure of the material. These include, among others, preliminary processing by blanching in hot water, steam, osmotic dehydration, e.g., in a salt solution, and, in recent years, attempts have been made to use electromagnetic waves to preheat the raw material, which, as scientific research shows, cause positive changes in the internal structure, facilitating the diffusion of water from the dried material and significantly shortening the drying time, minimizing quality losses (e.g., enzymatic reactions, losses of vitamins sensitive to high temperatures, etc.) of the product (dried material).
Blanching in hot water is most often used in the production processes of dried vegetables, and osmotic dehydration is most often used for the production of dried fruit, but attempts are being made to combine osmotic dehydration of vegetables that contain ingredients that easily evaporate or enter in a reaction with oxygen, or because of the improvement in the taste of such vegetables.
Therefore, this study attempted to analyze the impact of a commonly used method for the pre-treatment of onions before drying and one that is used for other vegetables or fruits and can be used in the process of producing dried onion, i.e., osmotic dehydration, in order to improve its quality characteristics. (color, taste, smell) on the kinetics of convective drying of this vegetable. Samples dried without blanching served as comparative material. The development of ANN models will enable designers and technologists to analyze the drying process depending on the processing method and drying parameters.
2.1. Research Material and Its Preparation
The experimental material was onion of the Wolska variety. After cleaning, the material was peeled and cut into 5 mm thick slices (±0.5 mm) using a laboratory guillotine. The onion was cut into slices transversely into layers, and the slices for experimental tests were obtained from the central part of the onion (for the maximum diameter). The patches used in the experimental studies had approximately the same diameter. The material prepared in this way was divided into three parts: the first, fresh, unblanched samples; the second, material blanched in water at 90 °C for 3 min; and the third, material subjected to osmotic dehydration in a 5% sodium chloride solution at atmospheric pressure at a temperature of 40 °C for 24 h. Samples in the form of slices, after blanching and osmotic dehydration, were dried on paper towels before being subjected to drying. Onion samples prepared in this way were subjected to convection drying in an ELKON KC 100N chamber dryer with forced air circulation at three temperatures: 50 °C, 60 °C, and 70 °C (Figure 2a). The flow speed of the drying agent was 0.12 m·s−1 and was constant. Five samples were dried at each temperature. The tested samples were placed on metal meshes and dried in a single layer. Before drying, each sample was weighed on a WPE 300 electronic scale by RADWAG (Figure 2b), with an accuracy of ±0.01 g, and then every 5 min, each sample was taken out and weighed. Drying continued until a constant mass of dried material was obtained in several subsequent readings. The measurement of changes in the weight of the samples was used to indirectly determine changes in the water content in each of the 5 dried samples.
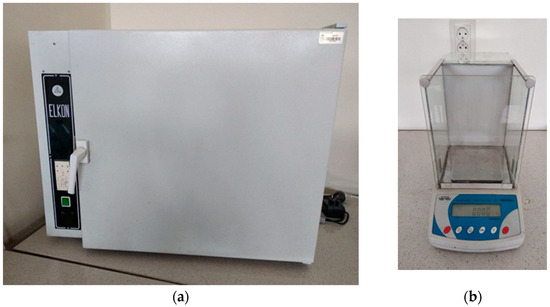
Figure 2.
Equipment used during experimental tests: (a) “ELKON” Łódź type KC 100 N chamber dryer; (b) analytical balance.
The moisture content of the samples at a specific moment of the drying time was calculated from the following equation [74,75]:
where:
MC(t)—moisture content in the sample at time t (kgH2O·kgdm−1).
t—drying time (min).
M(t)—mass of samples at a specific moment of drying t (kg).
Mdm—mass of dry substance (kg).
The thickness of the dried discs was determined using a caliper with an accuracy of ±0.0001 m.
2.2. Semantic Models Formulation
The first step in creating models using ANNs is to adopt a general semantic model. This requires the adoption of independent variables (ANN inputs) and a dependent variable or variables (ANN outputs). Of course, these variables are determined on the basis of existing theory describing the modeled phenomenon or researchers’ experiences with the modeled process [38,40,76,77].
In this work, the moisture content in the dried material at specific moments during the drying process was adopted as the dependent variable (ANN output). The following independent variables (ANN inputs) were assumed: drying temperature, initial sample thickness, initial moisture content, initial mass of the sample, time of drying, and material pre-treatment (no pre-treatment—blanching–osmotic dehydration). Four semantic models were formulated:
where: MC(t)—moisture content in the sample at time t (kgH2O·kgdm−1).
Model Ann1: MC(t) = f (X1, X2, X3, X4, X5, X6)
Model Ann2-N: MC(t) = f (X1, X2, X3, X4, X5) for X6 = no pre-treatment
Model Ann2-B: MC(t) = f (X1, X2, X3, X4, X5) for X6 = blanching
Model Ann2-D: MC(t) = f (X1, X2, X3, X4, X5) for X6 = osmotic dehydration
X1—drying temperature (°C).
X2—initial sample thickness (mm).
X3—initial moisture content (kgH2O·kgdm−1).
X4—initial mass of the sample (g).
X5—time of drying (min).
X6—material pre-treatment.
The variable X6 (material pre-treatment) is a qualitative variable that can take three values: no pre-treatment—blanching—osmotic dehydration.
2.3. Selection of the ANN Type and the Learning Process
Since preliminary research has shown that multilayer perceptron neural networks (MLP) show smaller errors than radial basis function networks, MLP networks were used to develop ANN models. The number of inputs and outputs in a neural network determines the number of neurons in the input and output layers. The number of neurons in the input and output layers is determined by the number of inputs and outputs in the neural network. Therefore, the number of neurons in the input layer for the Ann2-N, Ann2-B, and Ann2-D models was 5 (5 quantitative input variables), and 8 neurons for the Ann1 model (variable X6 is a qualitative variable that can take three values—3 neurons). Neural networks had one neuron in the output layer. The learning process was repeated many times, with the number of neurons in the hidden layer changing (from 3 to 11).
Neural models were developed using the Statistica Neural Networks software (Dell Inc. (2016) Dell Statistica (data analysis software system), version 13, software.dell.com. StatSoft, Inc., Tulsa, OK, USA).
The Statistica-Automatic Designer program used to develop ANN enables the use of one hidden layer in MLP networks. The authors’ research to date shows that this is sufficient to model the drying process and similar phenomena. The training process was carried out using the BFGS (Broyden–Fletcher–Goldfarb–Shanno) algorithm [76].
To generate the initial weight values, a random weight initialization method based on a normal distribution was used (the initial weight values had a normal distribution with a mean of 0 and a variance of 1).
Since the initial ANN weights are generated randomly, in order to obtain the most accurate neural models, we used the procedure of repeating the training process many times using the “Automatic Designer” function. For each of the four semantic models (Ann1, Ann2-N, Ann2-B, Ann2-D), 100 ANNs with different architectures were developed, with the 10 most accurate networks retained for further analysis.
The data obtained from the measurements consisted of three sets: data for onion slices not subjected to pre-treatment, data for blanched slices, and data for osmotically dehydrated slices. Each set contained 645 patterns: 3 drying temperatures (50 °C, 60 °C, 70 °C) times 5 repetitions of the drying process for each temperature (samples: 1, 2, 3, 4, 5) times 43 measurements (measurement every 5 min, for a drying time of 210 min). A total of 1935 patterns were obtained. In each of these three subsets, a random division was made into training, testing, and validation data, in the proportion of 50%, 25%, and 25%. Such divided patterns were used in the process of training and evaluating ANNs.
In each of the three subsets (no pre-treatment slices, blanched slices, and osmotically dehydrated slices), a random division was made into training, testing, and validation data in proportions of 50%, 25%, and 25%. The division was made in the Statistica program. which will randomly assign cases to subsets in the desired proportion (percentage of the number of individual subsets). Such split patterns were used in the ANN training and evaluation process.
The training subset is the only subset used to create neural models in the ANNs. The test subset is used to select the best ANNs, while the validation subset is used in order to assess ANNs’ ability to generalize knowledge acquired during training, measuring the accuracy of the neural network for new data.
In the learning process, four different activation functions were used (Table 1).

Table 1.
Activation functions of ANNs’ neurons.
2.4. Selection of the Best Neural Models
As the criterion for selecting the best ANN, the value of root mean square error (RMSE) was selected for testing the neural network, as it is a commonly used statistical error to evaluate a model’s performance. It has been measured independently for the four adopted semantic models, as calculated.
The best ANNs were selected based on the root mean square error (RMSE) values for the test subset. This error is commonly used to assess the accuracy of various mathematical models. RMSE was calculated independently for the four adopted semantic models (Ann1, Ann2-N, Ann2-B, Ann2-D), according to the formula [65,66,68,72,73,76]:
where [76]:
RMSE—root mean-square error (kgH2O·kgdm−1).
MCME,i—measured value of moisture content (kgH2O·kgdm−1).
MCANN,i—calculated by ANN value of moisture content (kgH2O·kgdm−1).
n—number of observations (−).
The accuracy of neural networks is often assessed using RMSE [78,79,80,81].
Mean absolute percentage error (MAPE) was used to analyze selected ANNs (Ann1, Ann2-N, Ann2-B, Ann2-D) [66,73,76]:
where [76]:
MAPE—mean absolute percentage error (%).
| … |—absolute value (−).
MCME,i—measured value of moisture content (kgH2O·kgdm−1).
MCANN,i—calculated by ANN value of moisture content (kgH2O·kgdm−1).
n—number of observations (−).
Sensitivity analysis was performed to assess the independent variables adopted in the semantic models [76].
3. Results
Figure 3, Figure 4, Figure 5 and Figure 6 show the RMSE values for the top 10 ANNs calculated for the training and testing subsets. Based on the RMSE values for the test data, the best ANNs were selected for the Ann1, Ann2-N, Ann2-B, and Ann2-D models.
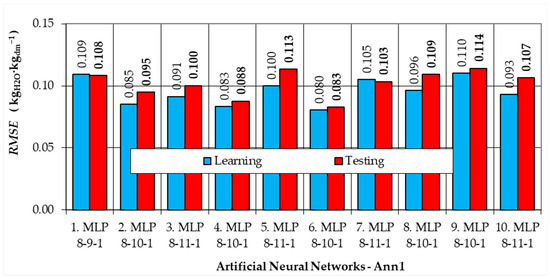
Figure 3.
RMSE values for the dependent variable, for the semantic model Ann1 (ANN with 6 inputs) for the learning and testing data subsets.
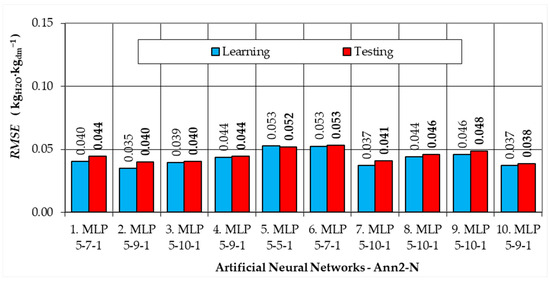
Figure 4.
RMSE values for the dependent variable, for the semantic model Ann2-N (ANN with 5 inputs) for the learning and testing data subsets.
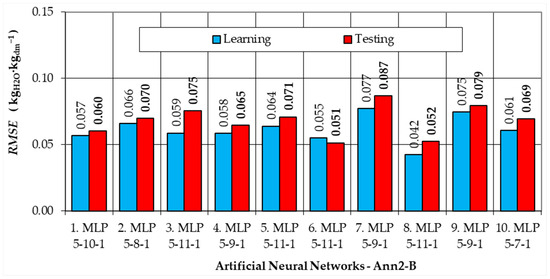
Figure 5.
RMSE values for the dependent variable, for the semantic model Ann2-B (ANN with 5 inputs) for the learning and testing data subsets.
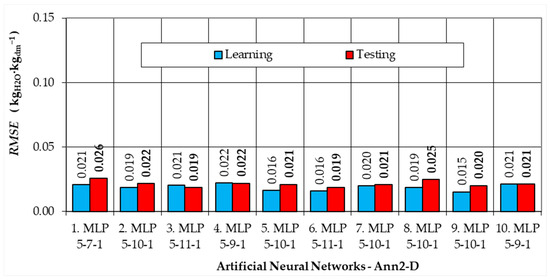
Figure 6.
RMSE values for the dependent variable, for the semantic model Ann2-D (ANN with 5 inputs) for the learning and testing data subsets.
For Ann1 (Figure 3), for the testing subset, the smallest RMSE value = 0.083 (kgH2O·kgdm−1) was calculated for the neural network number 6, MLP 8-10-1.
For Ann2-N (Figure 4), the smallest RMSE value = 0.038 (kgH2O·kgdm−1), for the test subset, was calculated for neural network number 10, MLP 5-9-1.
For Ann2-B (Figure 5), the lowest RMSE values for the test subset were calculated for neural networks number 6 (0.051 kgH2O·kgdm−1) and for network number 8 (0.052 kgH2O·kgdm−1). Because network number 8, MLP 5-11-1, has a much smaller RMSE for the training subset, it was chosen as the best model.
For Ann2-D (Figure 6), the lowest RMSE values for the test subset were calculated for neural networks number 3 and 6 (0.019 kgH2O·kgdm−1). Because network number 6, MLP 5-11-1, has a much smaller RMSE for the training subset, it was chosen as the best model.
The top four ANNs selected above (Ann1 No. 6. MLP 8-10-1, Ann2-N No. 10. MLP 5-9-1, Ann2-B No. 8. MLP 5-11-1, Ann2-D No. 6. MLP 5-11-1) were subjected to further analysis. Figure 7 and Figure 8 present the RMSE (Figure 7) and MAPE (Figure 8) values for the four selected ANN models, for the training, test, and validation subsets.
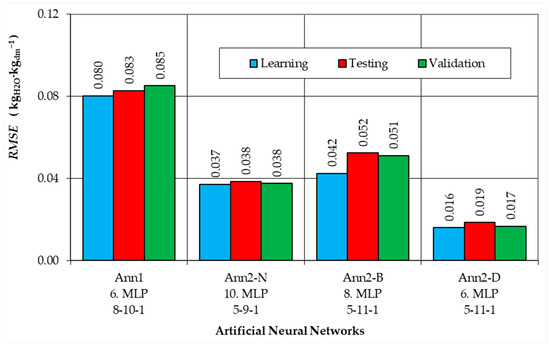
Figure 7.
RMSE values for the best ANNs for the learning, testing and validation data subsets.
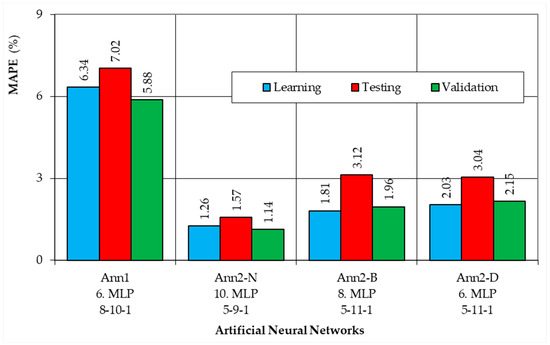
Figure 8.
MAPE values for the best ANNs for the learning, testing and validation data subsets.
The sensitivity analysis results for selected neural networks Ann1 (6. MLP 8-10-1), Ann2-N (10. MLP 5-9-1), Ann2-B (8. MLP 5-11-1), and Ann2-D (6. MLP 5-11-1) are presented in Table 2. Error ratio values (greater than 1) indicate that all adopted semantic models are correct.

Table 2.
Sensitivity analysis for selected neural models, for the all-data subset.
The next three figures present the MAPE values for individual samples (three drying temperatures, five repetitions), for the training, test, and validation subsets. MAPE values were calculated for the Ann2-N (Figure 9), Ann2-B (Figure 10), and Ann2-D (Figure 11) models.
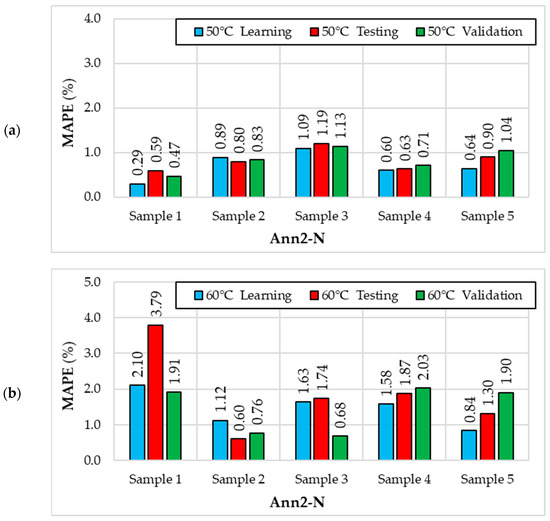
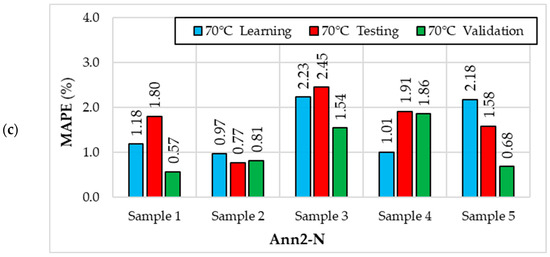
Figure 9.
MAPE values for the Ann2-N (10. MLP 5-9-1) neural network in individual samples for different drying temperatures (X1): (a) 50 °C; (b) 60 °C; (c) 70 °C.
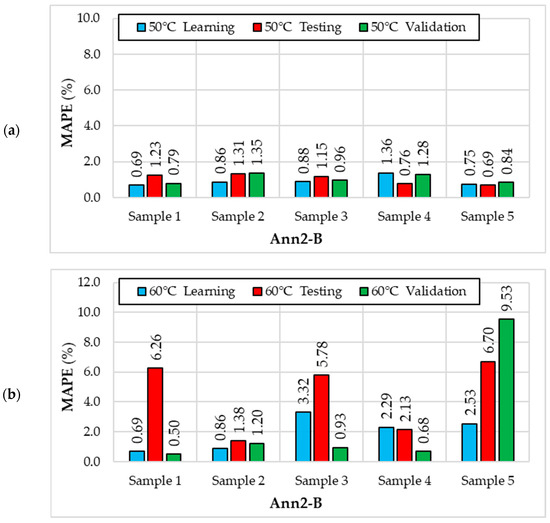
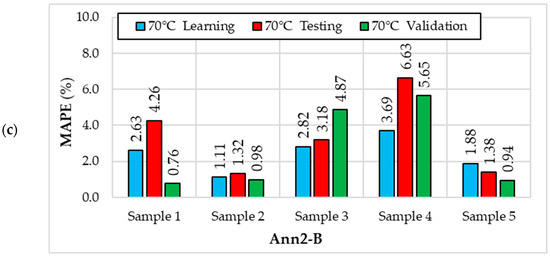
Figure 10.
MAPE error values for the Ann2-B (8. MLP 5-11-1) neural network in individual samples for different drying temperatures (X1): (a) 50 °C; (b) 60 °C; (c) 70 °C.
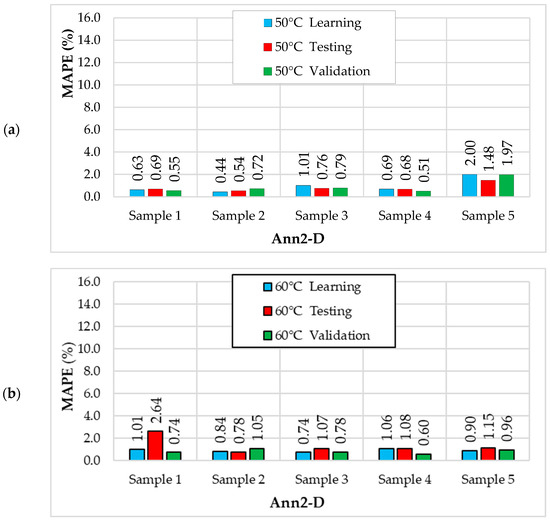
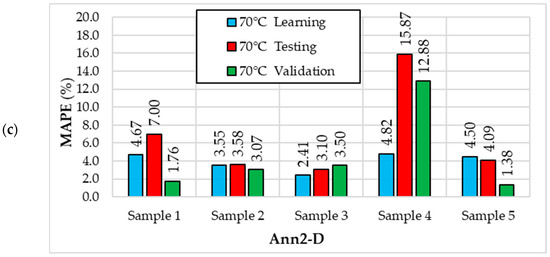
Figure 11.
MAPE values for the Ann2-D (6. MLP 5-11-1) neural network in individual samples for different drying temperatures (X1): (a) 50 °C; (b) 60 °C; (c) 70 °C.
Figure 12 compares the MC values while drying onion slices (without pre-treatment) obtained from measurements and those generated by the Ann2-N model. Samples with the highest MAPE values for three drying temperatures were selected. Similarly, Figure 13 and Figure 14 show the drying kinetics for the Ann2-B and Ann2-D models, respectively.
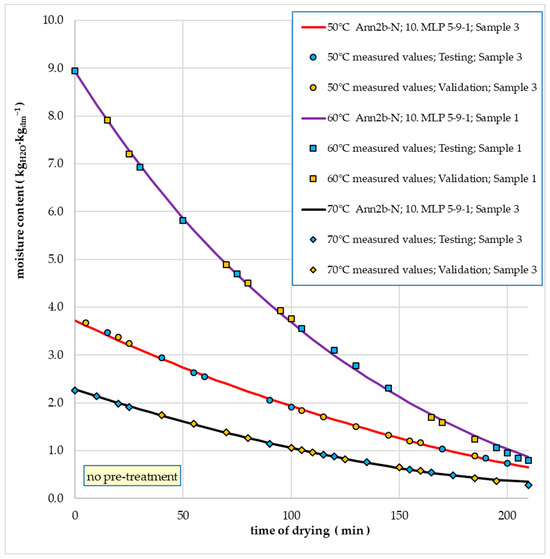
Figure 12.
Example trajectories of water content changes during convective drying depending on time for empirical values and values calculated using the Ann2-N model (onion slices without pre-treatment).
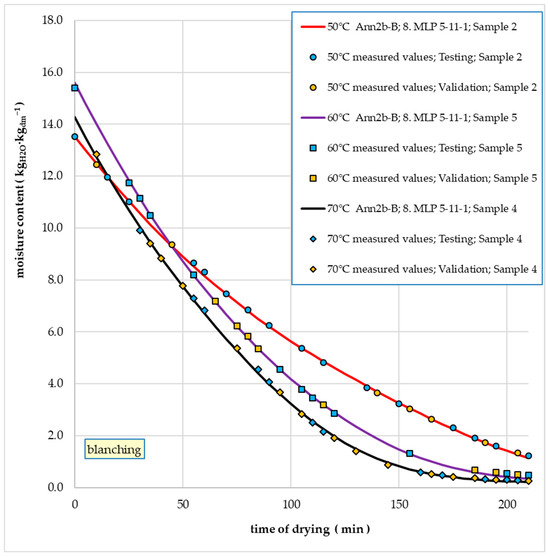
Figure 13.
Example trajectories of water content changes during convective drying depending on time for empirical values and values calculated on the basis of the Ann2-B model (blanched onion slices).
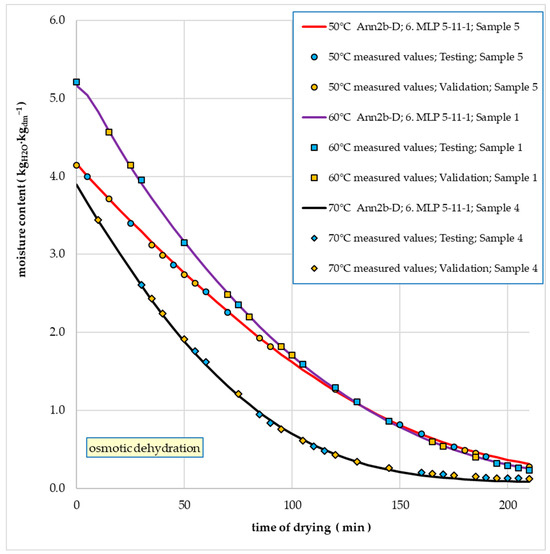
Figure 14.
Example trajectories of water content changes during convective drying depending on time for empirical values and values calculated on the basis of the Ann2-D model (osmotically dehydrated onion slices).
4. Discussion
Based on the conducted sensitivity analysis (Table 1), it was demonstrated that four semantic models were correctly adopted—all input variables are important for the accuracy of the selected neural models, Ann1 (6. MLP 8-10-1), Ann2-N (10. MLP 5-9-1), Ann2-B (8. MLP 5-11-1), and Ann2-D (6. MLP 5-11-1)
Neural networks developed according to the Ann1 semantic model are characterized by RMSE error values from 0.083 kgH2O·kgdm−1 to 0.114 kgH2O·kgdm−1 for test data (Figure 3). The smallest error values were calculated for the Ann1 model number 6 MLP 8-10-1, which has 10 neurons in the hidden layer. The RMSE values in the training and validation subsets are similar and amount to 0.080 and 0.085 kgH2O·kgdm−1, respectively (Figure 7). This network has a logistic activation function in the hidden layer, whereas in the output layer, there is an exponential activation function.
Neural networks developed according to Ann2 semantic models show lower RMSE values.
Thus, for the Ann2-N model, RMSE = 0.038–0.053 kgH2O·kgdm−1 for the test subset (Figure 4). The smallest error values were calculated for the Ann2-N model number 10, MLP 5-9-1 (9 neurons in the hidden layer, Exponential activation functions in the hidden and output layers). This network for the training and validation data has almost identical RMSE values, 0.037 and 0.038 kgH2O·kgdm−1, respectively (Figure 7).
For the Ann2-B model, RMSE = 0.051–0.087 kgH2O·kgdm−1 for the test subset (Figure 5). The smallest error values were calculated for Ann2-B model number 8, MLP 5-11-1 (11 neurons in the hidden layer, activation functions in the hidden and output layers, respectively: Hyperbolic Tangent and Exponential). For the training data, Ann2-B-8 has a significantly smaller RMSE = 0.042 kgH2O·kgdm−1 (Figure 7). However, for the validation data, this value was comparable (RMSE = 0.051 kgH2O·kgdm−1—Figure 7).
For the Ann2-D model, RMSE = 0.019–0.026 kgH2O·kgdm−1 for the test subset (Figure 6). The smallest error values were calculated for Ann2-D model number 6, MLP 5-11-1 (11 neurons in the hidden layer, activation functions in the hidden and output layers, respectively: Hyperbolic Tangent and Logistic). Slightly lower RMSE values were calculated for the training and validation data, 0.016 kgH2O·kgdm−1 and 0.017 kgH2O·kgdm−1, respectively (Figure 7).
The second measure for assessing the quality of ANNs was the MAPE value (Figure 8). For the Ann1-6 network, the calculated MAPE values were at the level of 6-7% (6.34% for training data, 7.02% for test data, and 5.88% for validation data).
For the Ann2 models, the MAPE values were more than two-times smaller (Figure 8). The lowest MAPE values were calculated for Ann2-N-10: 1.26%, 1.57%, and 1.14% (for training, test, and validation data). For Ann2-B-8, the MAPE values were 1.81%, 3.12%, and 1.96% for individual subsets. For Ann2-D-6, the MAPE values were similar and were 2.03%, 3.04%, and 2.15% (Figure 8).
The above analysis of the RMSE and MAPE values showed that the models developed for individual types of onion slices (Ann2-N—no pre-treatment, Ann2-B—blanching, Ann2-D—osmotic dehydration) are better than the general model Ann1 for all types of pre-treatment. Therefore, further analyses were performed for the Ann2 models. The MAPE values were calculated for individual samples, independently for data from the training, test, and validation subsets.
For the Ann2-N model, the smallest error values were calculated for a drying temperature of 50 °C (Figure 9). The lowest MAPE values for a drying temperature of 50 °C occurred for Sample 1 (from 0.29% to 0.59%) and the highest for Sample 3 (from 1.09% to 1.19%). For a drying temperature of 60 °C, the lowest MAPE values occur for Sample 2 (from 0.60% to 1.12%) and the highest for Sample 1 (from 1.91% to 3.79%). However, for a drying temperature of 70 °C, the lowest MAPE values occur for Sample 2 (from 0.77% to 0.97%) and the highest for Sample 3 (from 1.54% to 2.45%).
For the Ann2-B model, the smallest error values were also calculated for a drying temperature of 50 °C (Figure 10). The lowest MAPE values for a drying temperature of 50 °C occur for Sample 5 (from 0.69% to 0.84%) and the highest for Sample 2 (from 0.86% to 1.35%). For a drying temperature of 60 °C, the lowest MAPE values occur for Sample 2 (from 0.86% to 1.38%) and the highest for Sample 5 (from 2.53% to 9.53%). However, for a drying temperature of 70 °C, the lowest MAPE values occur for Sample 2 (from 0.98% to 1.32%) and the highest for Sample 4 (from 3.69% to 6.63%).
For the Ann2-D model, the smallest error values were calculated for drying temperatures of 50 °C and 60 °C (Figure 11). The lowest MAPE values for a drying temperature of 50 °C occur for Sample 2 (from 0.44% to 0.72%) and the highest for Sample 5 (from 1.48% to 2.00%). For a drying temperature of 60 °C, the lowest MAPE values occur for Sample 2 (from 0.78% to 1.05%) and the highest for Sample 1 (from 0.74% to 2.64%). However, for a drying temperature of 70 °C, the lowest MAPE values occur for Sample 3 (from 2.41% to 3.50%) and the highest for Sample 4 (from 4.82% to 15.87%).
Figure 12, Figure 13 and Figure 14 show graphs of moisture content changes (Drying Kinetics graphs) for the Ann2-N, Ann2-B, and Ann2-D models. Samples with the highest MAPE values were selected. The measured values (data from the test and validation subsets) and the values generated by individual ANNs models were compared.
Modeling of onion drying kinetics was also carried out by other scientists (Table 3).

Table 3.
Comparison of the research results of other authors on modeling the kinetics of onion drying using ANNs.
Kaveh et al. [72] used ANNs to predict changes in the moisture ratio (MR) during drying onion slices on a Multi-Stage Semi-Industrial Continuous Belt dryer (Table 3). Drying was carried out at temperatures of 40 °C, 55 °C, and 70 °C, at various air and belt speeds. The authors adopted air temperature, air velocity, belt linear speed, and distance traveled as input variables for ANN. The best ANN model for MR estimation had four input neurons, six neurons in the first hidden layer, six neurons in the second hidden layer, and one output neuron (4-6-6-1 topology). The authors state that this network was characterized by “a high correlation coefficient and low average squared errors” and provided values of 0.9995 and 0.0019.
Jafari et al. [71] also studied the drying of onion slices using ANNs. They developed a neural model with two inputs (time and air temperature) and one output (moisture ratio). For the best ANN (2-5-1 topology), they obtained a correlation coefficient value of R = 0.9996 and RMSE = 0.0000394 for an air speed of 2 m·s−1, and R = 0.9991 and RMSE = 0.0000625 for an air speed of 3 m·s−1 (Table 3).
However, Zalpouri et al. [73] applied neural modeling to the convective drying of onion puree. In their study, “onions were peeled, washed, cut into quarters, hot water blanched, and pureed”. They used two input variables (puree thickness, drying time) and one output variable (moisture ratio). For convective drying (at 50 °C), the best ANN for predicting MR was characterized by a very good fit—the correlation coefficient was R(Learn) = 0.9999, R(Valid) = 0.9997 and R(Test) = 0.9961 (Table 3). The ANN model also had very low RMSE values, ranging from 0.0001 to 0.0004 for different puree thicknesses. For convective drying, the ANN model had a 2-18-1 topology.
In our study, the developed neural models Ann2-N, Ann2-B and Ann2-D had very high values of the correlation coefficient (R). For the Ann2-N model (samples without pretreatment), R = 0.9998 and 0.9999 (for test and validation data). For the Ann2-B (blanched samples) and Ann2-D (osmotically dehydrated samples) neural models, the correlation coefficient values were 0.9999 for both test and validation data. This indicates a very good fit of the model to the experimental data, similar to the studies of other authors cited above.
The RMSE values calculated for the ANNs developed by us were higher than those in the cited studies. They were as follows: for Ann2-N RMSE = 0.037–0.038 kgH2O·kgdm−1, for Ann2-B RMSE = 0.0042–0.052 kgH2O·kgdm−1, and for Ann2-D RMSE = 0.016–0.0198 kgH2O·kgdm−1.
Below are sample results for modeling the drying kinetics of other agricultural products.
Kaveh et al. [45] developed one universal drying model for sliced potato, garlic, and cantaloupe cubes. The drying process was carried out in a convection dryer at four temperatures (40 °C, 50 °C, 60 °C, 70 °C) and three air speeds (0.5 m/s, 1.0 m/s, 1.5 m/s). The best ANN for MR (moisture ratio) prediction obtained R2 values of 0.9952 (for test subset) and 0.9927 (for learning subset), and the RMSE value = 0.0224. It was an FFBP (Feed Forward Back Propagation) ANN, with four input variables: air temperature, air velocity, drying time, product type.
Beigi and Ahmadi [46] developed the FFBP-ANN model to predict moisture content (MC) for the vacuum drying of celery slices. The input variables were air temperature, chamber pressure, and drying time. The best network with a 3-6-9-1 topology obtained RMSE = 0.0578 and an R value (correlation coefficient) of 0.99995.
Chasiotis et al. [62] developed ANNs to determine MC during the convective drying of 10 mm thick quince slices. The drying process was carried out at three temperatures (40 °C, 50 °C, 60 °C) and three air speeds (1 m/s, 2 m/s, 3 m/s). The input variables were temperature, flow velocity, and time. For the best ANN, they obtained RMSE = 0.06 kgwater/kgdry matter and R2 = 0.991.
Saglam and Cetin [54] modeled the drying of slices (1.4 mm thick) of different apple cultivars (Golden Delicious (GD), Oregon Spur (OS), Granny Smith (GS)). Developed for convective drying (at a temperature of 70 °C, air flow 0.5m/s), the MLP-type ANN for MR prediction obtained R equal to 0.8826 (GD), 0.9766 (OS), 0.9796 (GS) and RMSE equal to 0.0175 (GD), 0.0074 (OS), 0.0039 (GS). For MC (moisture content) prediction, they obtained R equal to 0.8697 (GD), 0.9962 (OS), 0.9248 (GS) and RMSE equal to 0.1749 (GD), 0.0148 (OS), 0.0765 (GS).
5. Conclusions
We developed neural models of convective drying kinetics: general Ann1 (for all three types of pre-treatment) and three dedicated to specific types of pre-treatment of onion slices; i.e., Ann2-N (without pre-treatment), Ann2-B (blanched), and Ann2-D showed a very good fit to the empirical data.
Due to the fact that the MAPE values for the general Ann1 model are approximately twice as high as those for the dedicated Ann2 models, the latter ANNs should be used when predicting the moisture content in convection-dried onion slices.
The ANNs we developed can be used in practice to simulate and optimize the drying process of onion slices. Neural models of drying kinetics make it possible to take into account parameters (independent variables) that are not present in other mathematical models. In the case of the ANNs we developed, in addition to the drying time and temperature of the drying agent (taking into account in traditional mathematical models), we also included initial sample thickness, initial moisture content, and initial mass of the sample as independent variables (ANN inputs). Additionally, we included pre-treatment material in the universal (general) Ann1 model.
Further research conducted by us in the area of modeling the drying process will be aimed at developing more universal ANN models, characterized by the highest possible accuracy.
Author Contributions
Conceptualization, S.F. and B.Ł.-K.; methodology, S.F. and B.Ł.-K.; software, S.F. and G.B.; validation, S.F., B.Ł.-K., M.H. and R.F.; investigation, S.F. and B.Ł.-K.; data curation, S.F. and R.F.; writing—original draft preparation, S.F., B.Ł.-K. and A.Z.; writing—review and editing, S.F., B.Ł.-K., M.H., G.B., A.Z. and R.F.; visualization, S.F., M.H. and G.B.; supervision, S.F. and B.Ł.-K. All authors have read and agreed to the published version of the manuscript.
Funding
Article processing charges were financed from the subsidy of the Ministry of Education and Science for the Agricultural University of Hugo Kołłątaj in Krakow for the year 2024.
Data Availability Statement
Data is contained within the article. Further inquiries can be directed to the corresponding authors.
Conflicts of Interest
The authors declare no conflicts of interest.
References
- Radojčin, M.; Pavkov, I.; Bursać Kovačević, D.; Putnik, P.; Wiktor, A.; Stamenković, Z.; Kešelj, K.; Gere, A. Effect of Selected Drying Methods and Emerging Drying Intensification Technologies on the Quality of Dried Fruit: A Review. Processes 2021, 9, 132. [Google Scholar] [CrossRef]
- Mujumdar, A.S. Drying technology in agriculture and food science. Dry. Technol. 2001, 19, 1217–1218. [Google Scholar] [CrossRef]
- Tulej, W.; Głowacki, S. Modeling of the Drying Process of Apple Pomace. Appl. Sci. 2022, 12, 1434. [Google Scholar] [CrossRef]
- Abouelenein, D.; Acquaticci, L.; Alessandroni, L.; Borsetta, G.; Caprioli, G.; Mannozzi, C.; Marconi, R.; Piatti, D.; Santanatoglia, A.; Sagratini, G.; et al. Volatile Profile of Strawberry Fruits and Influence of Different Drying Methods on Their Aroma and Flavor: A Review. Molecules 2023, 28, 5810. [Google Scholar] [CrossRef] [PubMed]
- Ozsan Kilic, T.; Boyar, I.; Dincer, C.; Ertekin, C.; Onus, A.N. Effects of Different Osmotic Pre-Treatments on the Drying Characteristics, Modeling and Physicochemical Properties of Momordica charantia L. Slices. Agriculture 2023, 13, 1887. [Google Scholar] [CrossRef]
- Thonglit, W.; Suanjan, S.; Chupawa, P.; Inchuen, S.; Duangkhamchan, W. Enhanced Quick-Cooking Red Beans: An Energy-Efficient Drying Method with Hot Air and Stepwise Microwave Techniques. Foods 2024, 13, 763. [Google Scholar] [CrossRef] [PubMed]
- Zawiślak, A.; Francik, R.; Francik, S.; Knapczyk, A. Impact of Drying Conditions on Antioxidant Activity of Red Clover (Trifolium pratense), Sweet Violet (Viola odorata) and Elderberry Flowers (Sambucus nigra). Materials 2022, 15, 3317. [Google Scholar] [CrossRef]
- Dziki, D.; Habza-Kowalska, E.; Gawlik-Dziki, U.; Miś, A.; Różyło, R.; Krzysiak, Z.; Hassoon, W.H. Drying Kinetics, Grinding Characteristics, and Physicochemical Properties of Broccoli Sprouts. Processes 2020, 8, 97. [Google Scholar] [CrossRef]
- Francik, S.; Francik, R.; Sadowska, U.; Bystrowska, B.; Zawiślak, A.; Knapczyk, A.; Nzeyimana, A. Identification of phenolic compounds and determination of antioxidant activity in extracts and infusions of salvia leaves. Materials 2020, 13, 5811. [Google Scholar] [CrossRef]
- Bialik, M.; Wiktor, A.; Rybak, K.; Witrowa-Rajchert, D.; Latocha, P.; Gondek, E. The Impact of Vacuum and Convective Drying Parameters on Kinetics, Total Phenolic Content, Carotenoid Content and Antioxidant Capacity of Kiwiberry (Actinidia arguta). Appl. Sci. 2020, 10, 6914. [Google Scholar] [CrossRef]
- Guo, H.-L.; Chen, Y.; Xu, W.; Xu, M.-T.; Sun, Y.; Wang, X.-C.; Wang, X.-Y.; Luo, J.; Zhang, H.; Xiong, Y.-K. Assessment of Drying Kinetics, Textural and Aroma Attributes of Mentha haplocalyx Leaves during the Hot Air Thin-Layer Drying Process. Foods 2022, 11, 784. [Google Scholar] [CrossRef] [PubMed]
- Jayasuriya, H.; Pathare, P.B.; Al-Attabi, Z.; Al-Hamdani, A. Drying Kinetics and Quality Analysis of Coriander Leaves Dried in an Indirect, Stand-Alone Solar Dryer. Processes 2023, 11, 1596. [Google Scholar] [CrossRef]
- Golisz, E.; Wielewska, I.; Roman, K.; Kacprzak, M. Probabilistic Model of Drying Process of Leek. Appl. Sci. 2022, 12, 11761. [Google Scholar] [CrossRef]
- Hao, W.; Liu, S.; Mi, B.; Lai, Y. Mathematical Modeling and Performance Analysis of a New Hybrid Solar Dryer of Lemon Slices for Controlling Drying Temperature. Energies 2020, 13, 350. [Google Scholar] [CrossRef]
- Raponi, F.; Moscetti, R.; Monarca, D.; Colantoni, A.; Massantini, R. Monitoring and Optimization of the Process of Drying Fruits and Vegetables Using Computer Vision: A Review. Sustainability 2017, 9, 2009. [Google Scholar] [CrossRef]
- Ozgen, F.; Celik, N. Evaluation of Design Parameters on Drying of Kiwi Fruit. Appl. Sci. 2019, 9, 10. [Google Scholar] [CrossRef]
- Savas, E. The Modelling of Convective Drying Variables’ Effects on the Functional Properties of Sliced Sweet Potatoes. Foods 2022, 11, 741. [Google Scholar] [CrossRef] [PubMed]
- Moura, J.d.S.; Sousa, R.P.E.; Martins, L.H.; Costa, C.E.F.d.; Chisté, R.C.; Lopes, A.S. Thermal Degradation of Carotenoids from Jambu Leaves (Acmella oleracea) during Convective Drying. Foods 2023, 12, 1452. [Google Scholar] [CrossRef]
- Musielak, G.; Mieszczakowska-Frąc, M.; Mierzwa, D. Convective Drying of Apple Enhanced with Microwaves and Ultrasound—Process Kinetics, Energy Consumption, and Product Quality Approach. Appl. Sci. 2024, 14, 994. [Google Scholar] [CrossRef]
- Strumiłło, C. Perspectives on Developments in Drying. Dry. Technol. 2006, 24, 1059–1068. [Google Scholar] [CrossRef]
- Alfeo, V.; Planeta, D.; Velotto, S.; Palmeri, R.; Todaro, A. Cherry Tomato Drying: Sun versus Convective Oven. Horticulturae 2021, 7, 40. [Google Scholar] [CrossRef]
- Radhakrishnan, G.; Breaz, T.O.; Al Mahrouqi, A.W.A.; Al Zakwani, N.A.; Al Fahdi, M.H.; Al Shuraiqi, A.S.; Al Awamri, S.A.; Al Aamri, R.S.; Karthikeyan, K.R. A Comparative Management Analysis on the Performance of Different Solar Drying Methods for Drying Vegetables and Fruits. Sustainability 2024, 16, 775. [Google Scholar] [CrossRef]
- Talens, C.; Arboleya, J.C.; Castro-Giraldez, M.; Fito, P.J. Effect of microwave power coupled with hot air drying on process efficiency and physico-chemical properties of a new dietary fibre ingredient obtained from orange peel. LWT-Food Sci. Technol. 2017, 77, 110–118. [Google Scholar] [CrossRef]
- Mitra, J.; Shrivastava, S.L.; Rao, P.S. Onion dehydration: A review. J. Food Sci. Technol. 2012, 49, 267–277. [Google Scholar] [CrossRef] [PubMed]
- Lewicki, P.P.; Witrowa-Rajchert, D.; Nowak, D. Effect of drying mode on drying kinetics of onion. Dry. Technol. 1998, 16, 59–81. [Google Scholar] [CrossRef]
- Raj, D.; Subanna, V.C.; Ahlawat, O.P.; Gupta, P.; Huddar, A.G. Effect of pre-treatments on the quality characteristics of dehydrated onion rings during storage. Int. J. Food Agric. Environ. 2006, 4, 30–33. [Google Scholar]
- Tsamo, C.V.P.; Bilame, A.-F.; Ndjouenkeu, R. Air Drying Behaviour of Fresh and Osmotically Dehydrated Onion Slices (Allium Cepa) and Tomato Fruits (Lycopersicon esculentum). Int. J. Food Prop. 2006, 9, 877–888. [Google Scholar] [CrossRef]
- Sahoo, N.R.; Bal, L.M.; Pal, U.S.; Sahoo, D. Impact of pretreatment and drying methods on quality attributes of onion shreds. Food Technol. Biotechnol. 2015, 53, 57–65. [Google Scholar] [CrossRef] [PubMed]
- Baroni, A.F.; Hubinger, M.D. Drying of onion: Effects of pretreatments on moisture content. Dry. Technol. 1998, 16, 2083–2094. [Google Scholar] [CrossRef]
- Demiray, E.; Seker, A.; Tulek, Y. Drying kinetics of onion (Allium cepa L.) slices with convective and microwave drying. Heat Mass Transf. 2017, 53, 1817–1827. [Google Scholar] [CrossRef]
- Lee, J.H.; Kim, H.J. Drying kinetics of onion slices in a hot-air dryer. J. Food Sci. Nutr. 2008, 13, 225–230. [Google Scholar] [CrossRef]
- Compaoré, A.; Putranto, A.; Dissa, A.O.; Ouoba, S.; Rémond, R.; Rogaume, Y.; Zoulalian, A.; Béré, A.; Koulidiati, J. Convective drying of onion: Modeling of drying kinetics parameters. J. Food Sci. Technol. 2019, 56, 3347–3354. [Google Scholar] [CrossRef] [PubMed]
- Mujumdar, A.S.; Devahastin, S. Fundamental Principles of Drying. In Mujumdar’s Practical Guide to Industrial Drying; Exergex: Brossard, QC, Canada, 2000; pp. 1–22. [Google Scholar]
- Pabis, S. Theoretical models of vegetable drying by convection. In Drying of Porous Materials; Kowalski, S.J., Ed.; Springer: Dordrecht, The Netherlands, 2007; pp. 77–87. ISBN 978-1-4020-5480-8. [Google Scholar]
- Boyar, İ.; Kovaci, T.; Dikmen, E.; Şencan Şahin, A. Using Gene Expression Programming (GEP) for Modelling the Drying Characteristics of Onion Slices (Allium Cepa). Kahramanmaraş Sütçü İmam Üniversitesi Tarım Ve Doğa Derg. 2022, 25, 1134–1145. [Google Scholar] [CrossRef]
- Attkan, A.K.; Raleng, A.; Yadav, Y.K. Drying Kinetics of Onion (Allium cepa L.) Slices using Low-humidity Airassisted Hybrid Solar Dryer. J. Agric. Eng. 2021, 58, 262–273. [Google Scholar] [CrossRef]
- Kalbasi, M. Heat and Moisture Transfer Model for Onion Drying. Dry. Technol. 2003, 21, 1575–1584. [Google Scholar] [CrossRef]
- Wrobel, M.; Fraczek, J.; Francik, S.; Slipek, Z.; Mudryk, K. Modelling of unit contact surface of bean seeds using Artificial Neural Networks. In Proceedings of the Engineering for Rural Development, Jelgava, Latvia, 23–24 May 2013; pp. 287–291. [Google Scholar]
- Sharabiani, V.R.; Kaveh, M.; Taghinezhad, E.; Abbaszadeh, R.; Khalife, E.; Szymanek, M.; Dziwulska-Hunek, A. Application of Artificial Neural Networks, Support Vector, Adaptive Neuro-Fuzzy Inference Systems for the Moisture Ratio of Parboiled Hulls. Appl. Sci. 2022, 12, 1771. [Google Scholar] [CrossRef]
- Francik, S.; Łapczyńska-Kordon, B.; Francik, R.; Wójcik, A. Modeling and Simulation of Biomass Drying Using Artificial Neural Networks. In Renewable Energy Sources: Engineering, Technology, Innovation; Mudryk, K., Werle, S., Eds.; Springer International Publishing AG: Berlin/Heidelberg, Germany, 2018; pp. 571–581. ISBN 9783319723716. [Google Scholar]
- Sun, Q.; Zhang, M.; Mujumdar, A.S. Recent developments of artificial intelligence in drying of fresh food: A review. Crit. Rev. Food Sci. Nutr. 2019, 59, 2258–2275. [Google Scholar] [CrossRef] [PubMed]
- Przybył, K.; Koszela, K. Applications MLP and Other Methods in Artificial Intelligence of Fruit and Vegetable in Convective and Spray Drying. Appl. Sci. 2023, 13, 2965. [Google Scholar] [CrossRef]
- Šovljanski, O.; Lončar, B.; Pezo, L.; Saveljić, A.; Tomić, A.; Brunet, S.; Filipović, V.; Filipović, J.; Čanadanović-Brunet, J.; Ćetković, G.; et al. Unlocking the Potential of the ANN Optimization in Sweet Potato Varieties Drying Processes. Foods 2024, 13, 134. [Google Scholar] [CrossRef]
- Rahman, S.M.A.; Nassef, A.M.; Al-Dhaifallah, M.; Abdelkareem, M.A.; Rezk, H. The Effect of a New Coating on the Drying Performance of Fruit and Vegetables Products: Experimental Investigation and Artificial Neural Network Modeling. Foods 2020, 9, 308. [Google Scholar] [CrossRef]
- Kaveh, M.; Rasooli Sharabiani, V.; Amiri Chayjan, R.; Taghinezhad, E.; Abbaspour-Gilandeh, Y.; Golpour, I. ANFIS and ANNs model for prediction of moisture diffusivity and specific energy consumption potato, garlic and cantaloupe drying under convective hot air dryer. Inf. Process. Agric. 2018, 5, 372–387. [Google Scholar] [CrossRef]
- Beigi, M.; Ahmadi, I. Artificial neural networks modeling of kinetic curves of celeriac (Apium graveolens L.) in vacuum drying. Food Sci. Technol. 2019, 39, 35–40. [Google Scholar] [CrossRef]
- Onwude, D.I.; Hashim, N.; Janius, R.B.; Nawi, N.; Abdan, K. Modelling the convective drying process of pumpkin (Cucurbita moschata) using an artificial neural network. Int. Food Res. J. 2016, 23, S237–S243. [Google Scholar]
- Sadeghi, E.; Movagharnejad, K.; Haghighi Asl, A. Mathematical modeling of infrared radiation thin-layer drying of pumpkin samples under natural and forced convection. J. Food Process. Preserv. 2019, 43, e14229. [Google Scholar] [CrossRef]
- Dhurve, P.; Tarafdar, A.; Arora, V.K. Vibro-Fluidized Bed Drying of Pumpkin Seeds: Assessment of Mathematical and Artificial Neural Network Models for Drying Kinetics. J. Food Qual. 2021, 2021, 7739732. [Google Scholar] [CrossRef]
- Fabani, M.P.; Capossio, J.P.; Román, M.C.; Zhu, W.; Rodriguez, R.; Mazza, G. Producing non-traditional flour from watermelon rind pomace: Artificial neural network (ANN) modeling of the drying process. J. Environ. Manag. 2021, 281, 111915. [Google Scholar] [CrossRef]
- Salmeron, J.L.; Ruiz-Celma, A. Elliot and Symmetric Elliot Extreme Learning Machines for Gaussian Noisy Industrial Thermal Modelling. Energies 2019, 12, 90. [Google Scholar] [CrossRef]
- Sasikumar, R.; Mangang, I.B.; Vivek, K.; Jaiswal, A.K. Effect of ultrasound-assisted thin bed drying for retaining the quality of red bell pepper and compare the predictive ability of the mathematical model with artificial neural network. J. Food Process Eng. 2023, 46, e14468. [Google Scholar] [CrossRef]
- Winiczenko, R.; Kaleta, A.; Górnicki, K. Application of a MOGA Algorithm and ANN in the Optimization of Apple Drying and Rehydration Processes. Processes 2021, 9, 1415. [Google Scholar] [CrossRef]
- Sağlam, C.; Çetin, N. Machine learning algorithms to estimate drying characteristics of apples slices dried with different methods. J. Food Process. Preserv. 2022, 46, e16496. [Google Scholar] [CrossRef]
- Yang, T.; Zheng, X.; Xiao, H.; Shan, C.; Yao, X.; Li, Y.; Zhang, J. Drying Temperature Precision Control System Based on Improved Neural Network PID Controller and Variable-Temperature Drying Experiment of Cantaloupe Slices. Plants 2023, 12, 2257. [Google Scholar] [CrossRef] [PubMed]
- Chen, J.; Zhang, M.; Xu, B.; Sun, J.; Mujumdar, A.S. Artificial intelligence assisted technologies for controlling the drying of fruits and vegetables using physical fields: A review. Trends Food Sci. Technol. 2020, 105, 251–260. [Google Scholar] [CrossRef]
- Khaled, A.Y.; Kabutey, A.; Selvi, K.Ç.; Mizera, Č.; Hrabe, P.; Herák, D. Application of computational intelligence in describing the drying kinetics of persimmon fruit (Diospyros kaki) during vacuum and hot air drying process. Processes 2020, 8, 544. [Google Scholar] [CrossRef]
- Mahesh, J.S.; Ramalakshmi, K.; Balakrishnaraja, R. Investigation of mass transfer parameters, phytochemical analysis of dried ripen graviola fruit (Annona muricata) and its comparative approach by using statistical tools: ANN and mathematical modelling. Chem. Pap. 2023, 77, 7085–7098. [Google Scholar] [CrossRef]
- Mahesh, J.S.; Rengaraju, B.; Kuathooran, R.; Tarafdar, A. Phytochemical studies and mass transfer phenomenon of raw soursop fruit at different drying temperatures and kinetics evaluation by ANN and mathematical modeling. Biomass Convers. Biorefinery 2023. [Google Scholar] [CrossRef]
- Şahin, U.; Öztürk, H.K. Comparison between Artificial Neural Network model and mathematical models for drying kinetics of osmotically dehydrated and fresh figs under open sun drying. J. Food Process Eng. 2018, 41, e12804. [Google Scholar] [CrossRef]
- Abbaspour-Gilandeh, Y.; Jahanbakhshi, A.; Kaveh, M. Prediction kinetic, energy and exergy of quince under hot air dryer using ANNs and ANFIS. Food Sci. Nutr. 2020, 8, 594–611. [Google Scholar] [CrossRef] [PubMed]
- Chasiotis, V.K.; Tzempelikos, D.A.; Filios, A.E.; Moustris, K.P. Artificial neural network modelling of moisture content evolution for convective drying of cylindrical quince slices. Comput. Electron. Agric. 2020, 172, 105074. [Google Scholar] [CrossRef]
- Singh, A.; Mehta, A.; Singh, A.P.; Prabhakar, P.K. Ultrasonic modulated osmotic dehydration of Aonla (Phyllanthus emblica L.) slices: An integrated modeling through ANN, GPR, and RSM. J. Food Process. Preserv. 2022, 46, e16247. [Google Scholar] [CrossRef]
- Jahedi Rad, S.; Kaveh, M.; Sharabiani, V.R.; Taghinezhad, E. Fuzzy logic, artificial neural network and mathematical model for prediction of white mulberry drying kinetics. Heat Mass Transf. Stoffuebertragung 2018, 54, 3361–3374. [Google Scholar] [CrossRef]
- Zeng, Z.; Chen, M.; Wang, X.; Wu, W.; Zheng, Z.; Hu, Z.; Ma, B. Modeling and optimization for konjac vacuum drying based on response surface methodology (RSM) and artificial neural network (ANN). Processes 2020, 8, 1430. [Google Scholar] [CrossRef]
- Moheno-Barrueta, M.; Tzuc, O.M.; Martínez-Pereyra, G.; Cardoso-Fernández, V.; Rojas-Blanco, L.; Ramírez-Morales, E.; Pérez-Hernández, G.; Bassam, A. Experimental Evaluation and Theoretical Optimization of an Indirect Solar Dryer with Forced Ventilation under Tropical Climate by an Inverse Artificial Neural Network. Appl. Sci. 2021, 11, 7616. [Google Scholar] [CrossRef]
- Martínez-Martínez, V.; Baladrón, C.; Gomez-Gil, J.; Ruiz-Ruiz, G.; Navas-Gracia, L.M.; Aguiar, J.M.; Carro, B. Temperature and Relative Humidity Estimation and Prediction in the Tobacco Drying Process Using Artificial Neural Networks. Sensors 2012, 12, 14004–14021. [Google Scholar] [CrossRef] [PubMed]
- Selvi, K.Ç.; Alkhaled, A.Y.; Yıldız, T. Application of Artificial Neural Network for Predicting the Drying Kinetics and Chemical Attributes of Linden (Tilia platyphyllos Scop.) during the Infrared Drying Process. Processes 2022, 10, 2069. [Google Scholar] [CrossRef]
- Karakaplan, N.; Goz, E.; Tosun, E.; Yuceer, M. Kinetic and artificial neural network modeling techniques to predict the drying kinetics of Mentha spicata L. J. Food Process. Preserv. 2019, 43, e14142. [Google Scholar] [CrossRef]
- Tarafdar, A.; Jothi, N.; Kaur, B.P. Mathematical and artificial neural network modeling for vacuum drying kinetics of Moringa olifera leaves followed by determination of energy consumption and mass transfer parameters. J. Appl. Res. Med. Aromat. Plants 2021, 24, 100306. [Google Scholar] [CrossRef]
- Jafari, S.M.; Ganje, M.; Dehnad, D.; Ghanbari, V. Mathematical, Fuzzy Logic and Artificial Neural Network Modeling Techniques to Predict Drying Kinetics of Onion. J. Food Process. Preserv. 2016, 40, 329–339. [Google Scholar] [CrossRef]
- Kaveh, M.; Chayjan, R.A.; Golpour, I.; Poncet, S.; Seirafi, F.; Khezri, B. Evaluation of exergy performance and onion drying properties in a multi-stage semi-industrial continuous dryer: Artificial neural networks (ANNs) and ANFIS models. Food Bioprod. Process. 2021, 127, 58–76. [Google Scholar] [CrossRef]
- Zalpouri, R.; Singh, M.; Kaur, P.; Kaur, A.; Gaikwad, K.K.; Singh, A. Drying Kinetics, Physicochemical and Thermal Analysis of Onion Puree Dried Using a Refractance Window Dryer. Processes 2023, 11, 700. [Google Scholar] [CrossRef]
- Jeguirim, M.; Dutournié, P.; Zorpas, A.A.; Limousy, L. Olive Mill Wastewater: From a Pollutant to Green Fuels, Agricultural Water Source and Bio-Fertilizer—Part 1. The Drying Kinetics. Energies 2017, 10, 1423. [Google Scholar] [CrossRef]
- Stephenus, F.N.; Benjamin, M.A.Z.; Anuar, A.; Awang, M.A. Effect of Temperatures on Drying Kinetics, Extraction Yield, Phenolics, Flavonoids, and Antioxidant Activity of Phaleria macrocarpa (Scheff.) Boerl. (Mahkota Dewa) Fruits. Foods 2023, 12, 2859. [Google Scholar] [CrossRef] [PubMed]
- Francik, S.; Łapczyńska-Kordon, B.; Pedryc, N.; Szewczyk, W.; Francik, R.; Ślipek, Z. The Use of Artificial Neural Networks for Determining Values of Selected Strength Parameters of Miscanthus × Giganteus. Sustainability 2022, 14, 3062. [Google Scholar] [CrossRef]
- Francik, S.; Kurpaska, S. The Use of Artificial Neural Networks for Forecasting of Air Temperature inside a Heated Foil Tunnel. Sensors 2020, 20, 652. [Google Scholar] [CrossRef] [PubMed]
- Allouhi, A.; Choab, N.; Hamrani, A.; Saadeddine, S. Machine learning algorithms to assess the thermal behavior of a Moroccan agriculture greenhouse. Clean. Eng. Technol. 2021, 5, 100346. [Google Scholar] [CrossRef]
- Codeluppi, G.; Davoli, L.; Ferrari, G. Forecasting air temperature on edge devices with embedded Ai. Sensors 2021, 21, 3973. [Google Scholar] [CrossRef] [PubMed]
- Mahmood, F.; Govindan, R.; Bermak, A.; Yang, D.; Khadra, C.; Al-Ansari, T. Energy utilization assessment of a semi-closed greenhouse using data-driven model predictive control. J. Clean. Prod. 2021, 324, 129172. [Google Scholar] [CrossRef]
- Nisar, K.; Sabir, Z.; Zahoor Raja, M.A.; Ag Ibrahim, A.A.; Rodrigues, J.J.P.C.; Refahy Mahmoud, S.; Chowdhry, B.S.; Gupta, M. Artificial neural networks to solve the singular model with neumann–robin, dirichlet and neumann boundary conditions. Sensors 2021, 21, 6498. [Google Scholar] [CrossRef]
Disclaimer/Publisher’s Note: The statements, opinions and data contained in all publications are solely those of the individual author(s) and contributor(s) and not of MDPI and/or the editor(s). MDPI and/or the editor(s) disclaim responsibility for any injury to people or property resulting from any ideas, methods, instructions or products referred to in the content. |
© 2024 by the authors. Licensee MDPI, Basel, Switzerland. This article is an open access article distributed under the terms and conditions of the Creative Commons Attribution (CC BY) license (https://creativecommons.org/licenses/by/4.0/).