Abstract
This paper aims at estimating the life of extruded HVDC cable insulation subjected to fast and slow voltage polarity reversals (VPRs). An ad hoc MATLAB code is used for the transient electric field simulation in the cable insulation thickness by solving numerically Gauss, ohm, and current continuity equations beside a macroscopic conductivity equation. A transient temperature is also considered during slow VPR transients. The results show a significant localized reduction in the life of the inner insulation, making the life distribution non-monotonous inside the insulation thickness. The results show that fast VPRs are the most stressing transients in this study. The longer the duration of the zero-voltage period in slow VPR, the less stressed the insulation, hence, the longer the local life in the inner insulation of the cable. The latter is justified by the charge relaxation during slow VPRs.
Keywords:
HVDC cables; reliability; life estimation; aging; cable insulation; transients; polarity reversal 1. Introduction
High-voltage direct current (HVDC) transmission systems have been progressively developed in the last decades due to their high efficiency in bulk power transmission over long distances [1]. Furthermore, the boom of renewable energy has brought attention to the development of HVDC cable systems either by raising the cable rating or by raising the operating voltage [2]. Many HVDC transmission systems are currently being installed at a rated voltage of 525 kV in the framework of the German corridors project [3] in addition to a higher voltage, i.e., the 640 kV fully qualified HVDC cable system that appears in [4]. This progressive increase in the operating voltage is pushed by the development of new insulating materials that are able to withstand not only the rated DC voltage but also the impulses superimposed on the DC voltage during electrical transients in the power grid, i.e., superimposed switching impulses, temporary overvoltages, voltage polarity reversals, etc., which might lead to localized high field points inside the insulation. The latter justifies the importance of the investigation of the effect of different types of transients on the life of cable insulation. The authors investigated the effect of electrical transients (here, voltage polarity reversal (VPR) events) on the life-based geometric design of HVDC cables using simplified exponential models of the transient and an approximated analytical electric field equation [5]. In [6], the effect of transient overvoltages on the partial discharge activity in HVDC joints is investigated. In [7,8] the authors used the same analytical electric field calculation to find the loss of life of the cable insulation during fast VPR events only. On the contrary, in this paper, the authors use numerical methods for transient electric field calculations, giving more accurate development of the electrical transient and hence, more accurate results of the electric field calculations. Additionally, in this paper, the transient temperature calculations also consider the temperature reduction in the conductor and the insulation during the period when the current is switched off. In [9,10,11], numerical simulations show the voltage transients and the related effects on the electric field distribution in HVDC cables. In [12], a test campaign was carried out to compare the performance of extruded cables with that of mass impregnated non-draining (MIND) cables when subjected to VPRs mixed with load cycles. A similar polarity reversal test was performed on 525 kV high-performance thermoplastic elastomer (HPTE) cables in [13]. In other studies [14,15,16,17], it was found that impulses accelerate the aging process in HV extruded cables, leading to lower breakdown strength, higher conductivity, and more ability to accumulate space charges. This paper investigates the effect of both fast and slow VPR events on the electric field distribution inside the insulation, and thus, on the life of extruded HVDC cable insulation. The paper is structured as follows: first, the authors introduce the theoretical framework development, including the characteristics of the VPRs in addition to the algorithm development, starting from the temperature and electric field calculations up to the loss-of-life fractions and life estimation of the cable insulation. Then, the case study, which highlights the characteristics of the cable and its surrounding environment, is discussed, followed by the results of the simulation with the relevant discussion. Finally, the conclusion emphasizes and summarizes the outcomes of this study.
2. Theoretical Framework Development
In this section, the authors present a theoretical overview of the polarity reversal events in addition to the algorithm used for the field calculation and life estimation of cable insulation.
2.1. Voltage Polarity Reversals (VPRs)
Voltage polarity reversals (VPRs) are transient events in HVDC cable systems that use line commutated converters (LCCs) to reverse the power flow in the electrical grid. Fast VPR events take place as a response to serious contingencies to keep the grid frequency within its operational limit in both unsynchronized and synchronized grids, while slow VPRs are scheduled transient events that aim to reverse the power flow to meet the electricity market’s needs [8]. As the fast VPR events are linked to contingencies, they are not frequent in HVDC systems, unlike the slow VPR events, which are linked to frequent variations in the electricity market. In fast VPRs, the voltage is switched off and reversed from U0 to −U0 within a few hundred milliseconds, as shown in Figure 1a between the time markers (1) and (2), creating two electric field transients, Tr 1 and Tr 2, due to the residual space charge accumulated before the VPR under DC voltage. In slow VPRs, the voltage is switched off, from U0 to 0, within few hundred milliseconds during Tr 1 (1) → (2), and then the voltage is kept at 0 for some minutes during Tr 2 (2) → (3), followed by a voltage reversal from 0 to −U0 within a few hundred milliseconds during Tr 3 (3) → (4). The period at which the voltage is kept at zero (t0) serves as a relaxation period for the space charge accumulated in the cable insulation, revealing the electrical stress to which the cable is subjected during Tr 4, as shown in Figure 1b.
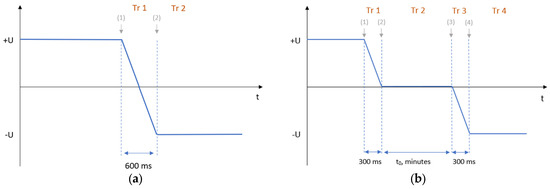
Figure 1.
Voltage wave shape in: (a) fast polarity reversal and (b) slow polarity reversal. The markers (1), (2), (3), and (4) are the beginning instants of the transients Tr 1, Tr 2, Tr 3, and Tr 4, respectively.
2.2. Temperature Calculations
The temperature distribution in the insulation radius (r) is calculated by solving the heat transfer Equation (1) in 1-dimension polar coordinates in the steady-state form:
where r is the generic radial coordinate in cable insulation, is the thermal resistivity of the insulation, T is the temperature, and is the per-unit volume power generated due to insulation losses, which is neglected under design electric field strengths and temperatures [18]. The thermal properties of the cable and the environment are reported in Section 3. A cross-section of the cable is shown in Figure 2 highlighting the main temperature drops in the cable’s thermal circuit, i.e., the insulation, thermoplastic sheath, and soil.
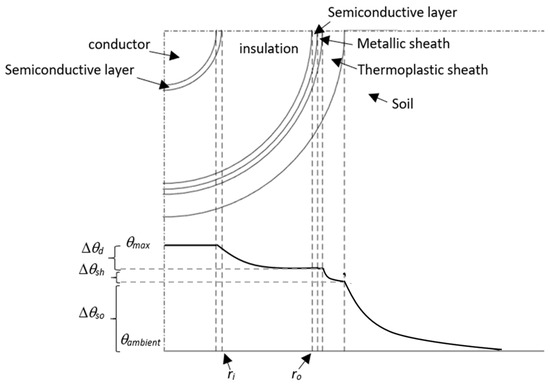
Figure 2.
The cross-sectional structure of the XLPE high-voltage direct current (HVDC) cable, with the temperature drops in the insulation, sheath, and soil.
2.3. Electric Field Calculations
The electric field in the insulation is calculated numerically by solving Gauss, ohm, and current continuity equations (Equations (2)–(4)) in addition to the macroscopic conductivity Equation (5), which macroscopically describes the relationship between the conductivity from one side and the temperature and the field from the other side. Figure 3 shows a flowchart of the transient electric field calculation during the VPR transients.
where E is the electric field strength (), is the vacuum permittivity, is the relative permittivity of the insulation, J is the direct conduction current density vector (), is the free charges density (), σ is the electrical conductivity of the insulation (), is the value of σ at 0 °C and for an electric field equal to 0 kV/mm, a is the temperature coefficient of electrical conductivity (1/K or 1/°C), and b is the electrical stress coefficient of electrical conductivity (mm/kV or m/MV).
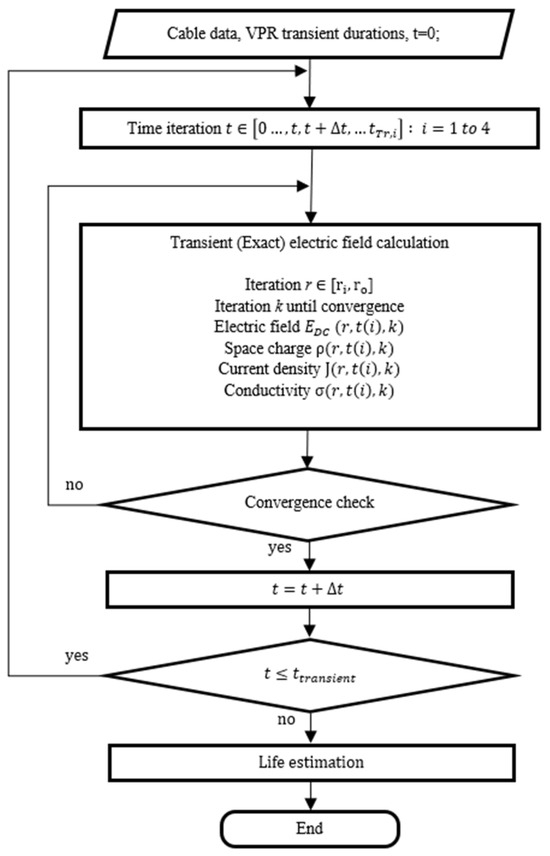
Figure 3.
Flowchart of the transient electric field calculation and the life estimation.
2.4. Life Estimation
The lifetime of the cable is estimated according to the electrical inverse power model (IPM) and the Arrhenius thermal model, as expressed in the following equation [19]:
where: is life at a DC electric field E and temperature T (in K); ED, TD, and LD are the design electric field, temperature, and life, respectively; is the value of the voltage endurance coefficient (VEC) at temperature TD; ; is the activation energy of the main thermal degradation reaction (in J); and is the Boltzmann constant. The life is estimated at each infinitesimal time interval in the range of the total transient period . Then, the loss of life during one transient, , can be calculated according to Miner’s law of the cumulative aging during all infinitismal time intervals [20], as follows:
The loss of life during the steady-state period of the cable’s operation can be estimated similarly using the following equation:
where is calculated by subtracting the total period at which the cable is subjected to n transients from a reference period of time :
Accordingly, the loss of life during both the steady-state and the transient periods can be calculated as follows:
Then, the lifetime of the cable at each generic radius r can be calculated using the total reference period , as follows:
The life of cable is defined at the insulation radius, which has the shortest lifetime over the insulation thickness between the inner radius and the outer radius :
3. Case Study
Table 1 summarizes the main electrical and thermal characteristics of the 500-kV XLPE-insulated cable, in addition to the laying environment, that are used in the both the thermal and electrical calculations in this study. The temperature profile is calculated according to the transient thermal model of the cable layers in addition to the surrounding environment, as described in IEC Standard 60853-2 [21]. The insulation thickness is divided into 25 equally distributed points for finite difference method (FDM) simulation performed in the MATLAB environment. Various works in the literature highlight the numerical methods in both thermal and electrical calculations [22,23]. Because of the considerable differences in the time scale of the simulations before, during, and after the transient, the time is discretized using a variable time step (however, it is fixed to be constant within each period of the transient, i.e., Tr 1, Tr 2, Tr 3, and Tr 4) to achieve the stability of the solution. Both thermal and electrical simulations are conducted in 1D, namely, the radius of the insulation while the electric field is uniform in the angular axis of the polar coordinates for cables. The conductor’s temperature is assumed to be constant during the steady-state period ; however, it becomes transient during the slow VPR events for the sake of accuracy [24]. Figure 4 shows the temperature distribution inside the insulation thickness within 30 min of the period .

Table 1.
The characteristics of the case-study cable and the laying environment.
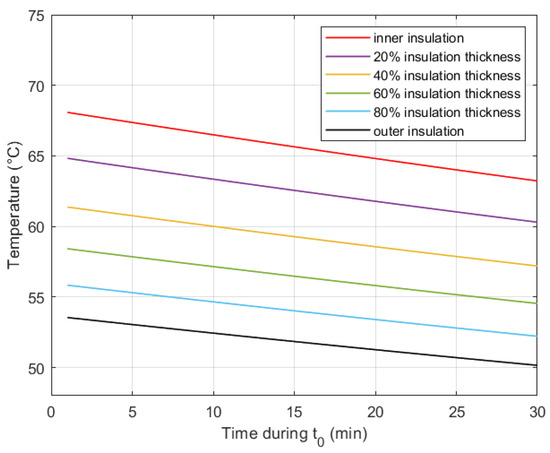
Figure 4.
Temperature distribution within the insulation thickness during 30 min of the zero-voltage period of the slow VPR.
Table 2 shows the characteristics of the fast and slow VPR events investigated in this study. The number of VPR events was chosen according to [26] to occur from many times per year to many times per week.

Table 2.
Characteristics of VPR events.
4. Results
4.1. Electric Field Distribution before, during and after VPRs
Figure 5 shows the transient electric field calculated inside the insulation thickness according to Equations (2)–(5) during one (a) fast VPR, (b) slow VPR with t0 = 10 min, (c) slow VPR with t0 = 20 min, and (d) slow VPR with t0 = 30 min. In all cases, at the initial point of the transient it is always assumed that the cable has already reached the resistive electric field distribution, as shown in the black solid curve in Figure 5. In Figure 5a, the fast VPR first transient Tr 1 lasts 600 ms, as illustrated in the dash-dotted curves, reaching the solid red curve at the end of Tr 1. Then, the transient Tr 2 starts leading to charge relaxation within the insulation (the dotted curves), recovering at the end the resistive electric field distribution. Figure 5b shows the field distribution during the slow VPR, wherein four transients take place: Tr 1, Tr 2, Tr 3, and Tr 4 (see Figure 1). The only difference from the fast VPR is that in the slow VPR, the period Tr 2 allows a charge relaxation while the voltage is zero, making the electric field low compared with the typical design fields of HVDC cables (see the dashed curves in Figure 5b). The latter reduces the electric field at the beginning of Tr 4 (the solid red curve) compared with that in the fast VPR in Figure 5a. Figure 5c,d shows more charges relaxation when t0 increases from 10 to 20 min; however, the difference becomes barely noticeable when t0 increases from 20 to 30 min.
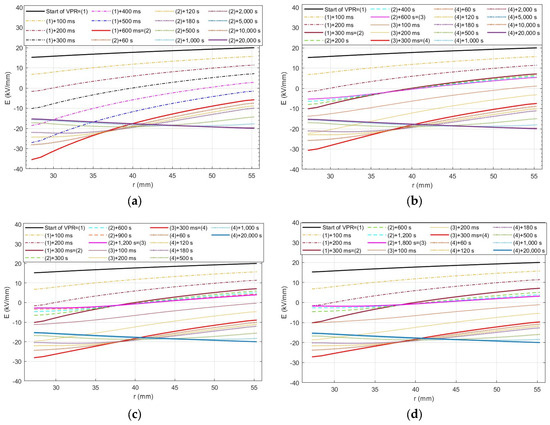
Figure 5.
The electric field distribution in the HVDC cable insulation thickness before, during, and after (a) fast VPR, (b) slow VPR with t0 = 10 min, (c) slow VPR with t0 = 20 min, (d) slow VPR with t0 = 30 min. The markers (1), (2), (3), and (4) are defined in Figure 1.
4.2. Loss of Life before, during and after VPRs
Figure 6 demonstrates the loss of estimated life inside the insulation thickness during one (a) fast VPR, (b) slow VPR with t0 = 10 min, (c) slow VPR with t0 = 20 min, (d) slow VPR with t0 = 30 min. In Figure 6a, the first transient, Tr 1, of the fast VPR (the green solid curve) causes a relatively high loss of life in the inner insulation, while it has a low loss of life in the outer half of the insulation thickness. Nevertheless, the main loss of life occurs during the second transient, Tr 2 (the red solid curve), whereby it dominates that of Tr 1. The latter can be justified by the duration of both transients Tr 1 and Tr 2, which last hundreds of milliseconds and minutes, respectively. Figure 5b–d shows similar patterns of the loss of life during slow VPR. The four transients Tr 1, Tr 2, Tr 3, and Tr 4 are highlighted in blue, green, yellow, and red, respectively. While Tr 1 stresses the outer insulation, Tr 3 stresses the inner insulation, and Tr 2 stresses the inner and the outer insulations. Tr 4 still has the main contribution in the loss of life, with many orders of magnitude higher values. It is worth noting that the loss of life during Tr 2 is always lower than that in both Tr 1 and Tr 2 together, although Tr 2 lasts for minutes while Tr 1 and Tr 3 last hundreds of milliseconds. The latter shows that slow VPR reduces the loss of life compared with the fast VPR due to the reduced electric stress during t0. Overall, only the transient after VPR (red solid curves) has a noticeable effect on the life of the cable.
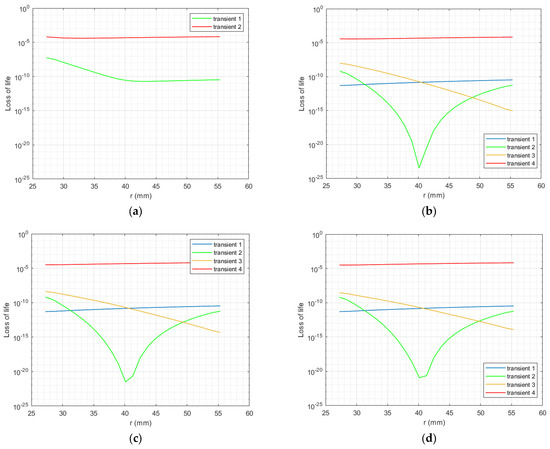
Figure 6.
The loss of life of the case-study HVDC cable during all transients of (a) 1 fast VPR, (b) 1 slow VPR with t0 = 10 min, (c) 1 slow VPR with t0 = 20 min, (d) 1 slow VPR with t0 = 30 min. The transients 1, 2, 3, and 4 are defined in Figure 1.
Figure 7 presents the total loss of life during the steady state and all transients (1 VPR/day) estimated according to Equation (10) for the fast (black curve) and slow VPRs, considering t0 = 10, 20, and 30 min (red, green, and blue curves, respectively). It can be noticed that both the fast and slow VPRs stress the inner insulation, although the outer insulation is still the most stressed point in all cases. One fast VPR/day makes the loss of life at the inner insulation just lower that that at the outer insulation, while one slow VPR/day has a lower effect on the loss of life of the insulation. The latter effect becomes lower when t0 increases until it becomes barely noticeable for t0 = 30 min.
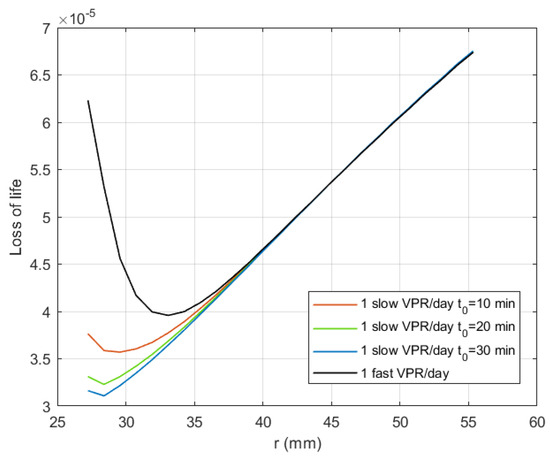
Figure 7.
The total loss of life of the case-study HVDC cable subjected to 1 VPR/day.
4.3. Total Life of Cable
Figure 8 shows the life of cable subjected to different numbers of VPR events according to Table 2: (a) fast VPR, (b) slow VPR with t0 = 10 min, (c) slow VPR with t0 = 20 min, and (d) slow VPR with t0 = 30 min. All figures have the same steady-state curve (black curve) whereby the cable is subjected to only the steady-state period without any transient. The cable life is defined by the life of the outer insulation, which is the most stressed point in this case. By increasing the number of transients, the inner insulation becomes more stressed until it reaches 44 years in the case of 1 fast VPR/day, 73 years for 1 slow VPR/day with t0 = 10 min, 83 years for 1 slow VPR/day with t0 = 20 min, 83 years for 1 slow VPR/day with t0 = 10 min, and 87 years for 1 slow VPR/day with t0 = 20 min. However, in all cases, the life of the cable is still 40 years as defined by the point that has the shortest life, i.e., the outer insulation.
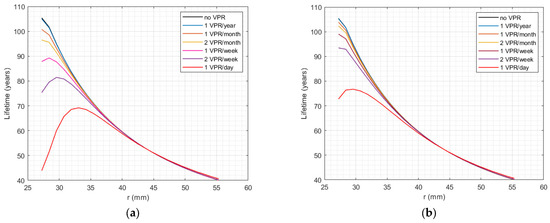
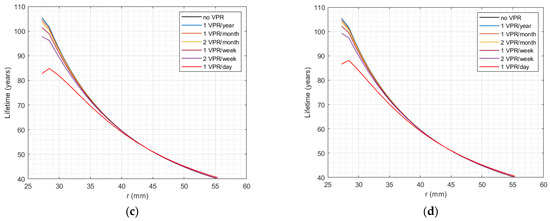
Figure 8.
The life of cable subjected to different numbers of VPRs, ranging from 1 VPR/year to 1 VPR/day, (a) fast VPR, (b) slow VPR with t0 = 10 min, (c) slow VPR with t0 = 20 min, (d) slow VPR with t0 = 30 min.
5. Discussion
The results presented in this paper highlight the effect of VPR events on the life of cable. The electric field distribution is significantly affected by the transients, leading to a non-monotonous life distribution inside the insulation thickness. Furthermore, the results demonstrate the significant effect of fast VPRs on the life of cable compared with that of slow VPRs. While one fast VPR/month reduces the local life in the inner insulation by ≈10%, one VPR/day causes a life reduction of 60%. The latter affirms the importance of avoiding the fast VPR as much as possible or replacing it with slow VPR where possible, because the same number of slow VPRs can enhance the life reduction by [40 ÷ 50]% compared with the fast VPRs. This is justified by the reduction in the maximum transient electric field after VPR because of the relaxation of the residual charges in the insulation during the period at which the voltage is kept to zero t0. The results of the exact transient electric field calculations reported in this paper confirm the conclusion of past studies, e.g., [5] wherein the authors studied the effect of fast VPRs on the life-based geometric design of HVDC cables using simplified analytical electric field calculations. The results also show that the reduction of the life loss by increasing t0 is more effective in the first 10 min, then it gradually decreases as t0 becomes longer (and the transient electric field becomes lower and the conductivity becomes lower), and then, the time constant of the insulation increases. In any case, the most stressed point inside the insulation is still the outer insulation within the considered number of VPRs. However, more points inside the insulation are becoming more aged, which in turn reduces the reliability of the cable and its endurance against other types of transients that it might encounter.
6. Conclusions
The authors in this paper investigate the life estimation in extruded HVDC cable insulation when subjected to fast and slow VPRs. The results show the following:
- (1)
- A noticeable effect of fast VPRs on the local life in the inner insulation.
- (2)
- The slow VPRs have less loss of life due to the electrical stress relieved as a result of space charge relaxation inside the insulation thickness.
- (3)
- The longer the zero-voltage period in slow VPRs, the less the electrical stress, and thus, the longer the inner insulation’s local life inside the insulation.
Future studies might consider the local homo- and hetero-space charge accumulation inside the insulation by using the bipolar charge transport equation instead of the macroscopic conductivity equation.
Author Contributions
Conceptualization, B.D. and G.M.; methodology, B.D. and G.M.; software, B.D. and G.M.; validation, B.D., G.M., M.M. and A.B.; formal analysis, B.D. and G.M.; investigation, B.D. and G.M.; resources, B.D., G.M., M.M. and A.B.; data curation, B.D., G.M., M.M. and A.B.; writing—original draft preparation, B.D.; writing—review and editing, B.D., G.M., M.M. and A.B.; visualization, B.D.; supervision, G.M.; project administration, G.M. All authors have read and agreed to the published version of the manuscript.
Funding
This research received no external funding.
Data Availability Statement
Data are contained within the article.
Conflicts of Interest
Authors Massimo Marzinotto and Antonio Battaglia were employed by the company TERNA. The remaining authors declare that the research was conducted in the absence of any commercial or financial relationships that could be construed as a potential conflict of interest.
References
- Hussein, I.I.; Ismael, I.; Essallah, S.; Khedher, A. The Impact of HVDC on the Current and Future Energy Markets. Int. J. Electr. Electron. Eng. Telecommun. 2022, 11, 426–434. [Google Scholar] [CrossRef]
- Diban, B. Models for Reliability Estimation of HVDC Cable Systems. Ph.D. Thesis, University of Bologna, Bologna, Italy, 2023. Available online: https://amsdottorato.unibo.it/10525/3/Diban_Bassel_thesis_PhD.pdf (accessed on 16 April 2024).
- 50Hertz Transmission GmbH; Amprion GmbH; Tennet TSO GmbH; TransentBw GmbH. Grid Development Plan. (GDP) 2030, 2nd Draft; Technical Report; German TSOs: Berlin, Germany, 2019. [Google Scholar]
- Jeroense, M. Fully Qualified 640 Kv Underground Extruded DC Cable System, Paper B1-309; CIGRÉ: Paris, France, 2018. [Google Scholar]
- Diban, B.; Mazzanti, G.; Seri, P. Life-based Geometric Design of HVDC Cables. Part 2: Effect of Electrical and Thermal Transients. IEEE Trans. Dielectr. Electr. Insul. 2022, 30, 97–105. [Google Scholar] [CrossRef]
- Rizzo, G.; Romano, P.; Imburgia, A.; Albertini, M.; Bononi, S.F.; Siripurapu, S.; Ala, G. The effect of Transient Over Voltages on the Partial Discharges activity in HVDC joints. In Proceedings of the 2021 AEIT HVDC International Conference (AEIT HVDC), Genoa, Italy, 27–28 May 2021; pp. 1–6. [Google Scholar] [CrossRef]
- Mazzanti, G.; Marzinotto, M.; Battaglia, A. A first step towards predicting the life of HVDC cables subjected to load cycles and voltage polarity reversal. In Proceedings of the 2015 IEEE Conference on Electrical Insulation and Dielectric Phenomena (CEIDP), Ann Arbor, MI, USA, 18–21 October 2015; pp. 783–786. [Google Scholar] [CrossRef]
- Battaglia, A.; Marzinotto, M.; Mazzanti, G. A Deeper Insight in Predicting the Effect of Voltage Polarity Reversal on HVDC Cables. In Proceedings of the 2019 IEEE Conference on Electrical Insulation and Dielectric Phenomena (CEIDP), Richland, WA, USA, 20–23 October 2019. [Google Scholar] [CrossRef]
- Naderiallaf, H.; Seri, P.; Montanari, G.C. Effect of Voltage Slew Rate on Partial Discharge Phenomenology During Voltage Transient in HVDC Insulation: The Case of Polymeric Cables. IEEE Trans. Dielectr. Electr. Insul. 2022, 29, 215–222. [Google Scholar] [CrossRef]
- Cambareri, P.; de Falco, C.; Rienzo, L.D.; Seri, P.; Montanari, G.C. Electric Field Calculation During Voltage Transients in HVDC Cables: Contribution of Polarization Processes. IEEE Trans. Power Deliv. 2022, 37, 5425–5432. [Google Scholar] [CrossRef]
- Mazzanti, G.; Diban, B. The Effects of Transient Overvoltages on the Reliability of HVDC Extruded Cables. Part 2: Superimposed Switching Impulses. IEEE Trans. Power Deliv. 2021, 36, 3795–3804. [Google Scholar] [CrossRef]
- Marzinotto, M.; Mazzanti, G.; Vercellotti, U.; Jahn, H. On the way to compare the polarity reversal withstand capability of HVDC Mass-Impregnated and extruded cable systems. In Proceedings of the 9th International Conference on Insulated Power Cables, Versailles, France, 21–25 June 2015; pp. 1–4. [Google Scholar]
- Albertini, M.; Cotugno, S.; Pietribiasi, D.; Remy, C. HPTE Extruded Cables Polarity Reversals Performance in LCC HVDC Systems. In Proceedings of the 2020 AEIT International Annual Conference (AEIT), Catania, Italy, 23–25 September 2020. [Google Scholar] [CrossRef]
- Dao, N.L.; Lewin, P.L.; Swingler, S.G. Lightning impulse ageing of HV cable insulation. In Proceedings of the 16th International Symposium on High Voltage Engineering, Johannesburg, South Africa, 24–28 August 2009; pp. 562–565. [Google Scholar]
- Hartlein, R.A.; Harper, V.S.; Ng, H.W. Effects of Voltage Impulses on Solid Dielectric Cable Life. IEEE Power Eng. Rev. 1989, 9, 39–40. [Google Scholar] [CrossRef]
- Ildstad, E.; Mauseth, F.; Olsen, E.T. Breakdown Voltage of Polymeric HVDC Insulation at DC Stress and Superimposed Lightning Impulse Voltages. In Proceedings of the 27th Nordic Insulation Symposium on Materials, Components and Diagnostics NordIS-22, Trondheim, Norway, 13–15 June 2022. [Google Scholar]
- He, D.; Tao, Z.; Fansong, M.; Li, Q.; Wang, W.; Liu, H.; Teyssedre, G. Space Charge Behaviours in Cable Insulation under a DC-Superimposed Pulsed Electric Field. High Voltage. 2020. Available online: https://hal.science/hal-03002410/document (accessed on 16 April 2024).
- Diban, B.; Mazzanti, G. The Effect of Insulation Characteristics on Thermal Instability in HVDC Extruded Cables. Energies 2021, 14, 550. [Google Scholar] [CrossRef]
- Mazzanti, G. The combination of electro-thermal stress, load cycling and thermal transients and its effects on the life of high voltage ac cables. IEEE Trans. Dielectr. Electr. Insul. 2009, 16, 1168–1179. [Google Scholar] [CrossRef]
- Miner, M.A. Cumulative damage in fatigue. J. Appl. Mech. 1945, 12, A159–A163. [Google Scholar] [CrossRef]
- IEC 60853-2:1989; Calculation of the Cyclic and Emergency Current Rating of Cables, Part 2: Cyclic Rating of Cables Greater Than 18/30 (36) kV and Emergency Ratings for Cables of All Voltages. International Electrotechnical Commission: Geneva, Switzerland, 1989.
- Ashraf, E.; Kabeel, A.E.; Elmashad, Y.; Ward, S.A.; Shaban, W.M. Predicting solar distiller productivity using an AI Approach: Modified genetic algorithm with Multi-Layer Perceptron. Solar Energy 2023, 263, 111964. [Google Scholar] [CrossRef]
- Shaalan, E.; Samy, M.; Ghania, M.; Ward, S.A. Analysis of electric field inside HV substations using charge simulation method in three dimensional. In Proceedings of the 2010 Annual Report Conference on Electrical Insulation and Dielectic Phenomena, West Lafayette, IN, USA, 17–20 October 2010; IEEE: Piscataway, NJ, USA, 2010. [Google Scholar]
- Li, G.; An, T.; Liang, J.; Liu, W.; Joseph, T.; Lu, J. Power reversal strategies for hybrid LCC/MMC HVDC systems. CSEE J. Power Energy Syst. 2020, 6, 203–221. [Google Scholar] [CrossRef]
- Hampton, R.N. Some of the considerations for materials operating under high-voltage direct-current stresses. IEEE Electr. Insul. Mag. 2008, 24, 5–13. [Google Scholar] [CrossRef]
- Recommendations to Improve HVDC Cable Systems Reliability. Available online: https://europacable.eu/wp-content/uploads/2021/01/Joint-paper-HVDC-Cable-Reliability-ENTSO-E-Europacable_FINAL_13.06.2019_.pdf (accessed on 16 April 2024).
Disclaimer/Publisher’s Note: The statements, opinions and data contained in all publications are solely those of the individual author(s) and contributor(s) and not of MDPI and/or the editor(s). MDPI and/or the editor(s) disclaim responsibility for any injury to people or property resulting from any ideas, methods, instructions or products referred to in the content. |
© 2024 by the authors. Licensee MDPI, Basel, Switzerland. This article is an open access article distributed under the terms and conditions of the Creative Commons Attribution (CC BY) license (https://creativecommons.org/licenses/by/4.0/).