1. Introduction
The increase in energy consumption over the years has directly contributed to the depletion of fossil fuel reserves such as coal, natural gas, and petroleum [
1]. This has resulted in a direct increase in greenhouse gas (GHG) emissions, affecting the environment negatively [
2,
3,
4]. This overreliance on fossil fuels has made it more expensive and inadequate in alleviating power outages [
5,
6]. In South Africa, institutions of higher education, such as universities, are grappling to maintain uninterrupted power supply on campuses and, by extension, lecture halls due to grid power outages [
7,
8]. This challenge has led to disruptions in academic activities and loss of lecture hours, limited access to resources, poor performance of students, safety challenges, negative impact on members of staff and students, institutional reputational damage, and negative impact on online-based teaching methods in some cases [
9]. Some studies have proposed diesel generators as backup supply, which has demonstrated significant setbacks such as increased CO
2 emissions, noise pollution, high maintenance and operational costs, continuous dependence on fossil fuels, and health challenges arising from diesel exhaust [
10]. However, these institutions are committed to sustainability goals that align with global initiatives for institutions of higher education to adopt environmentally friendly energy policies. These policies not only contribute to a reduction in carbon footprint but also improve energy reliability and reduce operational costs. Therefore, this study has proposed renewable energy resource (RER)-powered microgrids (μGs) to be integrated into lecture halls to ensure energy reliability, reduce CO
2 emissions, and lower the cost of energy supply.
Previous studies have concentrated on the proper scheduling of RERs, such as solar photovoltaic (PV), wind turbine, hydro turbine, biomass, and hydrogen, including energy storage systems (ESSs) and energy management system (EMS) design [
11,
12,
13,
14]. Some focused on the environmental benefits of their proposed model [
15,
16,
17,
18,
19], while others have evaluated the economic feasibility of μGs for entire university campuses and critical infrastructures [
20,
21,
22,
23]. However, none of these studies have investigated the techno-economic and environmental implications of μG applications, specifically in university lecture halls, their role in providing sustainable energy solutions and improving energy reliability, or their deployment in developing countries. Therefore, this study modelled and simulated a solar PV/Li-ion battery μG for three lecture halls of different capacities of 250, 196, and 400 seats at a university in the Western Cape province in South Africa. In Case 1, the lecture halls were supplied by the utility grid, while in Case 2, by both the solar PV and Li-ion battery μG; Case 3 was supplied by the solar PV, and Case 4 exclusively by the Li-ion battery. The study offers insight into energy consumption patterns in university lecture halls with associated environmental impact, economic implications, and technical feasibility. It also considers power outages in lecture halls during loadshedding and highlights the benefits of using the real-time energy consumption profile of lecture halls in a university in the Western Cape. The study was implemented in the MATLAB/Simulink Version 2023a environment using Cape Town weather conditions. The system configuration describing individual components used in this study is presented in
Section 3. The primary contributions of this study are:
Economic evaluation to determine the cost of maintaining a stable and reliable electricity supply to these lecture halls during peak load consumption and power outages by integrating the μG to the utility grid supplying the university.
Analysis of the carbon footprint and overall environmental sustainability impact of the system to ascertain the amount of CO2 reduction achieved due to the μG integration.
Proposing an EMS to ensure sustainability, efficiency, and reliability of power supply in the lecture halls through the implementation of the integrated μG.
The rest of the paper is structured as follows:
Section 2 presents the literature review.
Section 3 presents the materials and methods, including the system description and modelling.
Section 4 presents case studies and results.
Section 5 presents the discussion of results and analysis. Finally, concluding remarks, together with recommendations for further research, are presented in
Section 6.
2. Literature Review
RER-powered μGs are characteristically unpredictable due to changes in weather conditions, leading to unstable power output [
24], thus necessitating the integration of ESSs to ensure stable power supply. The past decade has experienced significant growth in ESS technology due to cutting-edge research [
25,
26,
27]. μGs are compact energy networks that include energy storage devices, a variety of loads, and distributed energy resources (DERs) that are either conventional and/or renewable [
28]. These conventional energy resources might be a combination of various diesel generators, while renewable resources largely consist of solar PV and wind power systems. A distribution network might combine and systematically integrate various μGs. These μGs, when equipped with distributed generators (DGs), ESSs, and demand response programmes, are actively used to reduce the cost of electricity and ease the load on distribution networks [
29].
μGs are either operated in off-grid or grid-connected mode and can be switched between both modes. In the off-grid mode, the active and reactive powers are generated by the DERs within the μG to meet the local load demand and the ESS can be used to stabilise the supply as needed if there is a shortfall in the DER generation [
30]. Ancillary services, such as frequency regulation, voltage regulation, etc., are enabled in grid-connected mode, with a focus on trade-offs between the μG and the grid [
31]. In South Africa, power outages have necessitated the integration of μGs in institutions of higher education, specifically to ensure power supply during grid outages in lecture halls, given the substantial availability of solar PV resources in the Western Cape, as shown in
Figure 1 [
32,
33].
Integrating RER-powered μGs in university lecture halls continues to be a major concern in the electricity configuration of institutions of higher education. One such challenge is the design of a suitable EMS that will ensure seamless integration, effective power distribution, and reduced cost. Hence, in reference [
35], the authors designed an EMS using conventional resources to support an optimal supply of power to meet the electrical load at a reduced cost by ensuring its participation in the operation of the μG. The study focused on the effective implementation of the EMS for a university μG consisting of DGs and ESSs. The EMS ensured the effective bidirectional flow of power between the grid and the university μG and ensured the charging and discharging of the ESS to reduce energy costs. The μG is connected to the local grid (Islamabad Electric and Supply Company, Islamabad, Pakistan) with an additional diesel generator and a wind turbine that operates as external sources. The results showed a reduction in electricity cost by 35% in summer and 29% in winter and a daily reduction in GHG emissions of 750.46 kg in summer and 730 kg in winter. The study evaluated the environmental and economic impact of adding solar PV, ESS, and different types of RERs but did not consider the specific impact of the different ESSs on the grid. A related study on the energy management of a combination of various campuses and smart μGs, including innovative and effective designs for operating and nonoperating grids in grid-connected and autonomous modes, was presented by reference [
36]. The study was implemented in the Savona Campus of the University of Genova in Italy. Its primary objectives were to improve grid efficiency by reducing energy losses, improving power quality, integrating renewable energy resources, and addressing issues related to sustainability and energy reliability without considering frequency regulation for the campus μG. The results showed a practical scenario of how to build a sustainable smart city. Reference [
37] proposed a model that consists of a solar PV, gas-powered microturbine, and ESS to efficiently regulate the charging, discharging, and effective integration of a few electric vehicles (EVs) while ensuring its suitability with transformers connected to the μG. The proposed model estimated the number of EVs charging at any time while regulating the transformer output using a linear programming method. This is made possible because by controlling the charging and discharging of EVs, grid operators can regulate transformer output more effectively, especially during peak demand periods. The transformer consistently supplied an average of 17.4 kW power and charged 30 EVs daily. The results showed that the model successfully achieved a demand response strategy by leveraging the EVs to balance electricity demand and supply. Again, it increased the number of EVs that could be supported by approximately 33%, maintained a high level of V2G technology, and ensured energy management scheduling. It improved demand response management on the grid where operational cost was required but did not consider the integration of smart charging infrastructure, evaluation of energy reliability, or its application in university lecture halls.
Furthermore, some studies investigated the cost-effectiveness of μG integration. A μG model was presented by reference [
38] for the University of Novi Sad, Serbia. The μG model consists of double wind-generating microturbines, two solar PV systems, a battery energy storage system (BESS), biogas-based turbines, an EV system that functions as a prosumer, a microcontroller that connects it to the grid, and consumers. The results showed that the model was economically feasible and reduced operational costs and GHG emissions. The study evaluated the economic viability of installation and operational costs and energy generation costs but did not assess the technical risks associated with its integration into the grid nor consider the amount of CO
2 emissions related to its implementation. In reference [
9], an EMS for a RER-powered μG at Malta University Campus was developed. The functionality of the model was evaluated using various operational controlling factors, including continuous power mode and peak controlling mode. The aim was to reduce the operational costs of the existing electricity infrastructure using an optimal demand response planning strategy and distributed generation (DG). The proposed algorithm used PV and wind turbines as non-dispatchable DGs and a diesel generator as a dispatchable DG, with ESS to support the model during periods of low solar irradiation. The results showed that the grid electricity price was reduced by 38%. Furthermore, the installation of 1000 kW and 2000 kW solar PV reduced GHG emissions by 365.34 kg of CO
2 and 700.68 kg of CO
2 daily, respectively. However, the strategy does not consider the impact of the ESS nor the charging/discharging using its state of charge (SOC). Again, reference [
39] developed a μG model for the University of Coimbra, Portugal. The model consists of solar PV, Li-ion battery, an EV, boost/buck-boost converters, and controllers. The primary objectives are the integration of RERs, the provision of sustainable energy, and cost-effectiveness. The results showed that the solar PV system supplied 22.3% of the annual electricity consumption and reduced energy consumption to 50 kWh/m
2. Nonetheless, the study did not consider the integration of advanced energy storage technologies, implementation of demand–side management strategies, and the operational impact of sustainable energy systems within the university campus μG. A study on the techno-economic feasibility of a solar PV generation system in the Sebelas Maret University campus in Indonesia was presented by reference [
40]. The primary objective of the study was to provide a sustainable solution to the growing energy demand of the University using RERs. This was implemented in the HOMER Pro Version 3.14 software environment using net present cost (NPC) and internal rate of return (IRR) methods. The results showed a 20% reduction in operational costs, and the PV μG was deemed technically feasible. However, the environmental implications of such a μG on the university were not studied.
In reference [
41], a μG model was developed to reduce the cost of energy generation, total NPC, and carbon footprints and supply both electrical and thermal load demands. The model consists of a solar PV, diesel generator, combined heat and power (CHP) plant, and ESS. The model was implemented using HOMER Pro Version 3.11 software in six major towns (Gilgit, Islamabad, Karachi, Lahore, Peshawar, and Quetta) in Pakistan to identify the most suitable city for the proposed model. The results showed that Gilgit has the lowest NPC in on/off-grid modes with the lowest cost of energy (COE) due to higher solar irradiance. However, the study did not consider its application in universities and environmental implications. Furthermore, reference [
42] studied the operational feasibility of μGs in some universities in China, India, Iran, Saudi Arabia, USA, etc., considering the technical characteristics, configuration, and types of loads. The model consists of a biogas plant, a diesel-based generator, solar PV, and BESS. Techno-economic feasibility was implemented using HOMER Pro Version 3.12 software. The results indicated that the levelized cost of energy (LCOE) for the grid-connected model ranged from ZAR 0.040–0.31 kWh, while the off-grid model varied between ZAR 2.64–ZAR 4.08 kWh. However, the study did not assess the impact of the BESS or its environmental impacts. Additionally, reference [
43] evaluated the daily operation of a μG on Pulau Ubin in Singapore. The model consists of a solar PV, three biodiesel generators, an ESS, and converters to enhance voltage regulation and power factor. The primary objective was to ensure economic sustainability and regulate voltage deviation, although it did not consider power enhancement or frequency regulation. The results showed that the μG could be implemented in the university as an integral part of its electricity architecture using hourly validated simulations. Nonetheless, factors related to power quality and smooth integration of the μG to the existing grid were not investigated.
Again, studies have been conducted to improve the reliability of energy supply systems using μG. In reference [
44], power quality and voltage regulation challenges often present in μGs were investigated. The study used a sensing system based on wireless sensors to remotely collect power system parameters, such as voltage, current, and battery SOC, to manage power distribution but did not evaluate the impact of frequency regulation. The results showed that the proposed model was efficient and effective, reduced the amount of energy consumed, and improved the power quality. Similarly, reference [
45] designed a 3D model μG project in a laboratory environment for STEM learning to evaluate the performance of a distribution management system comprising PV, wind, hydro, and ESS. The model records the power generated and load demands using proportional, integral, and derivative controllers. It monitors the system frequency as an indicator of power quality using different operational conditions suitable for μG performance evaluation. However, despite measuring frequency, the study did not evaluate the impact of voltage and other factors that affect power quality. To regulate peak load shaving at the Connecticut campus μG in the USA, reference [
46] proposed a distributed demand response-based strategy. The model consists of a co-generating power plant using an Alternating Directional Multiplier Method (ADMM)-based strategy to evaluate energy consumption patterns for each building on campus. The results showed a reduction in the energy consumption ratio in selected buildings and enhanced consumer satisfaction. However, the study did not analyse load demand patterns or evaluate scalability and robustness. At Aligarh Muslim University in India, reference [
47] proposed an affordable μG model solution considering several possible cases to optimise the energy supply schedule. Using HOMER Pro Version 3.11 software, the study analysed the most optimal solution for the campus, determining that a grid-connected solar PV and wind turbine configuration was the best solution. The annual NPC was USD 17.3 million, with 35,792 kg of CO
2 emissions, lower than other configurations. However, the study did not examine its application in specific university laboratories or lecture halls.
Furthermore, most of the studies concentrated on the economic and technical feasibility of μG integration on a university campus [
8,
36,
37,
38,
39,
40,
41,
42,
43,
44,
45,
46,
47]. Others focused on EV integration as a prosumer on the existing system and integration of multiple renewable energy resources. Integration of solar PV and Li-ion was considered mostly for operational cost reduction. Furthermore, previous studies did not comprehensively investigate the combined economic, environmental, and technical effects within a single study; instead, they rarely examined the economic, technical, and environmental impacts separately. Integrating μG has triggered power balance, proper sizing of components, and environmental, economic, and time of discharge concerns. Developing an effective EMS for the smooth integration of μG is a major concern. Therefore, this paper presents the economic, environmental, and technical impacts of integrating μG in lecture halls. An effective EMS is proposed to ensure optimal power supply in a continuous, reliable, and cost-effective manner.
3. Materials and Methods
This section presents the methodology used in the study to evaluate the feasibility, cost, CO
2 emission, and energy security that can be achieved as benefits of integrating a solar PV/Li-ion μG system in the existing grid network to supply university lecture halls. Solar PV was selected as the primary source due to Cape Town’s high solar irradiance and the regular sunlight experienced throughout the year, making it the most suitable renewable energy source. Furthermore, the Li-ion battery was chosen for its high energy density, long cycle life, and fast charging capabilities. The battery stores the excess energy generated by the solar PV and ensures a continuous, reliable, and sustainable power supply. Thus, the combination of solar PV and the Li-ion battery promotes sustainability in the electricity infrastructure of the university. This section offers a detailed description of the system and modelling of its components, including the energy consumption profile, solar energy resource, temperature profile, design of the solar PV, modelling of Li-ion battery, design of power converters, utility grid integration, and associated flowchart [
48,
49].
According to reference [
48], electricity costs from the city of Cape Town (CoCT), solar PV, and battery charging are ZAR 1.84/kWh, ZAR 0.91/kWh, and ZAR 1.8/kWh, respectively, while 1 kWh of electricity from the local utility grid (CoCT) generates 1.06 kgCO
2e [
49]. Therefore, as an example, the cost and emission related to consuming 500 kW of electricity for an hour from the grid are as follows:
These equations and calculations are used to determine the LCOE and associated CO2 emissions in each of the cases, as presented in the methodology and results sections, respectively. This process includes calculating the cost of purchasing electricity from the city of Cape Town (CoCT), solar PV, and battery charging, which serves as the basis for measuring the economic and environmental impacts of using electricity from the grid and other sources in the μG.
3.1. System Description
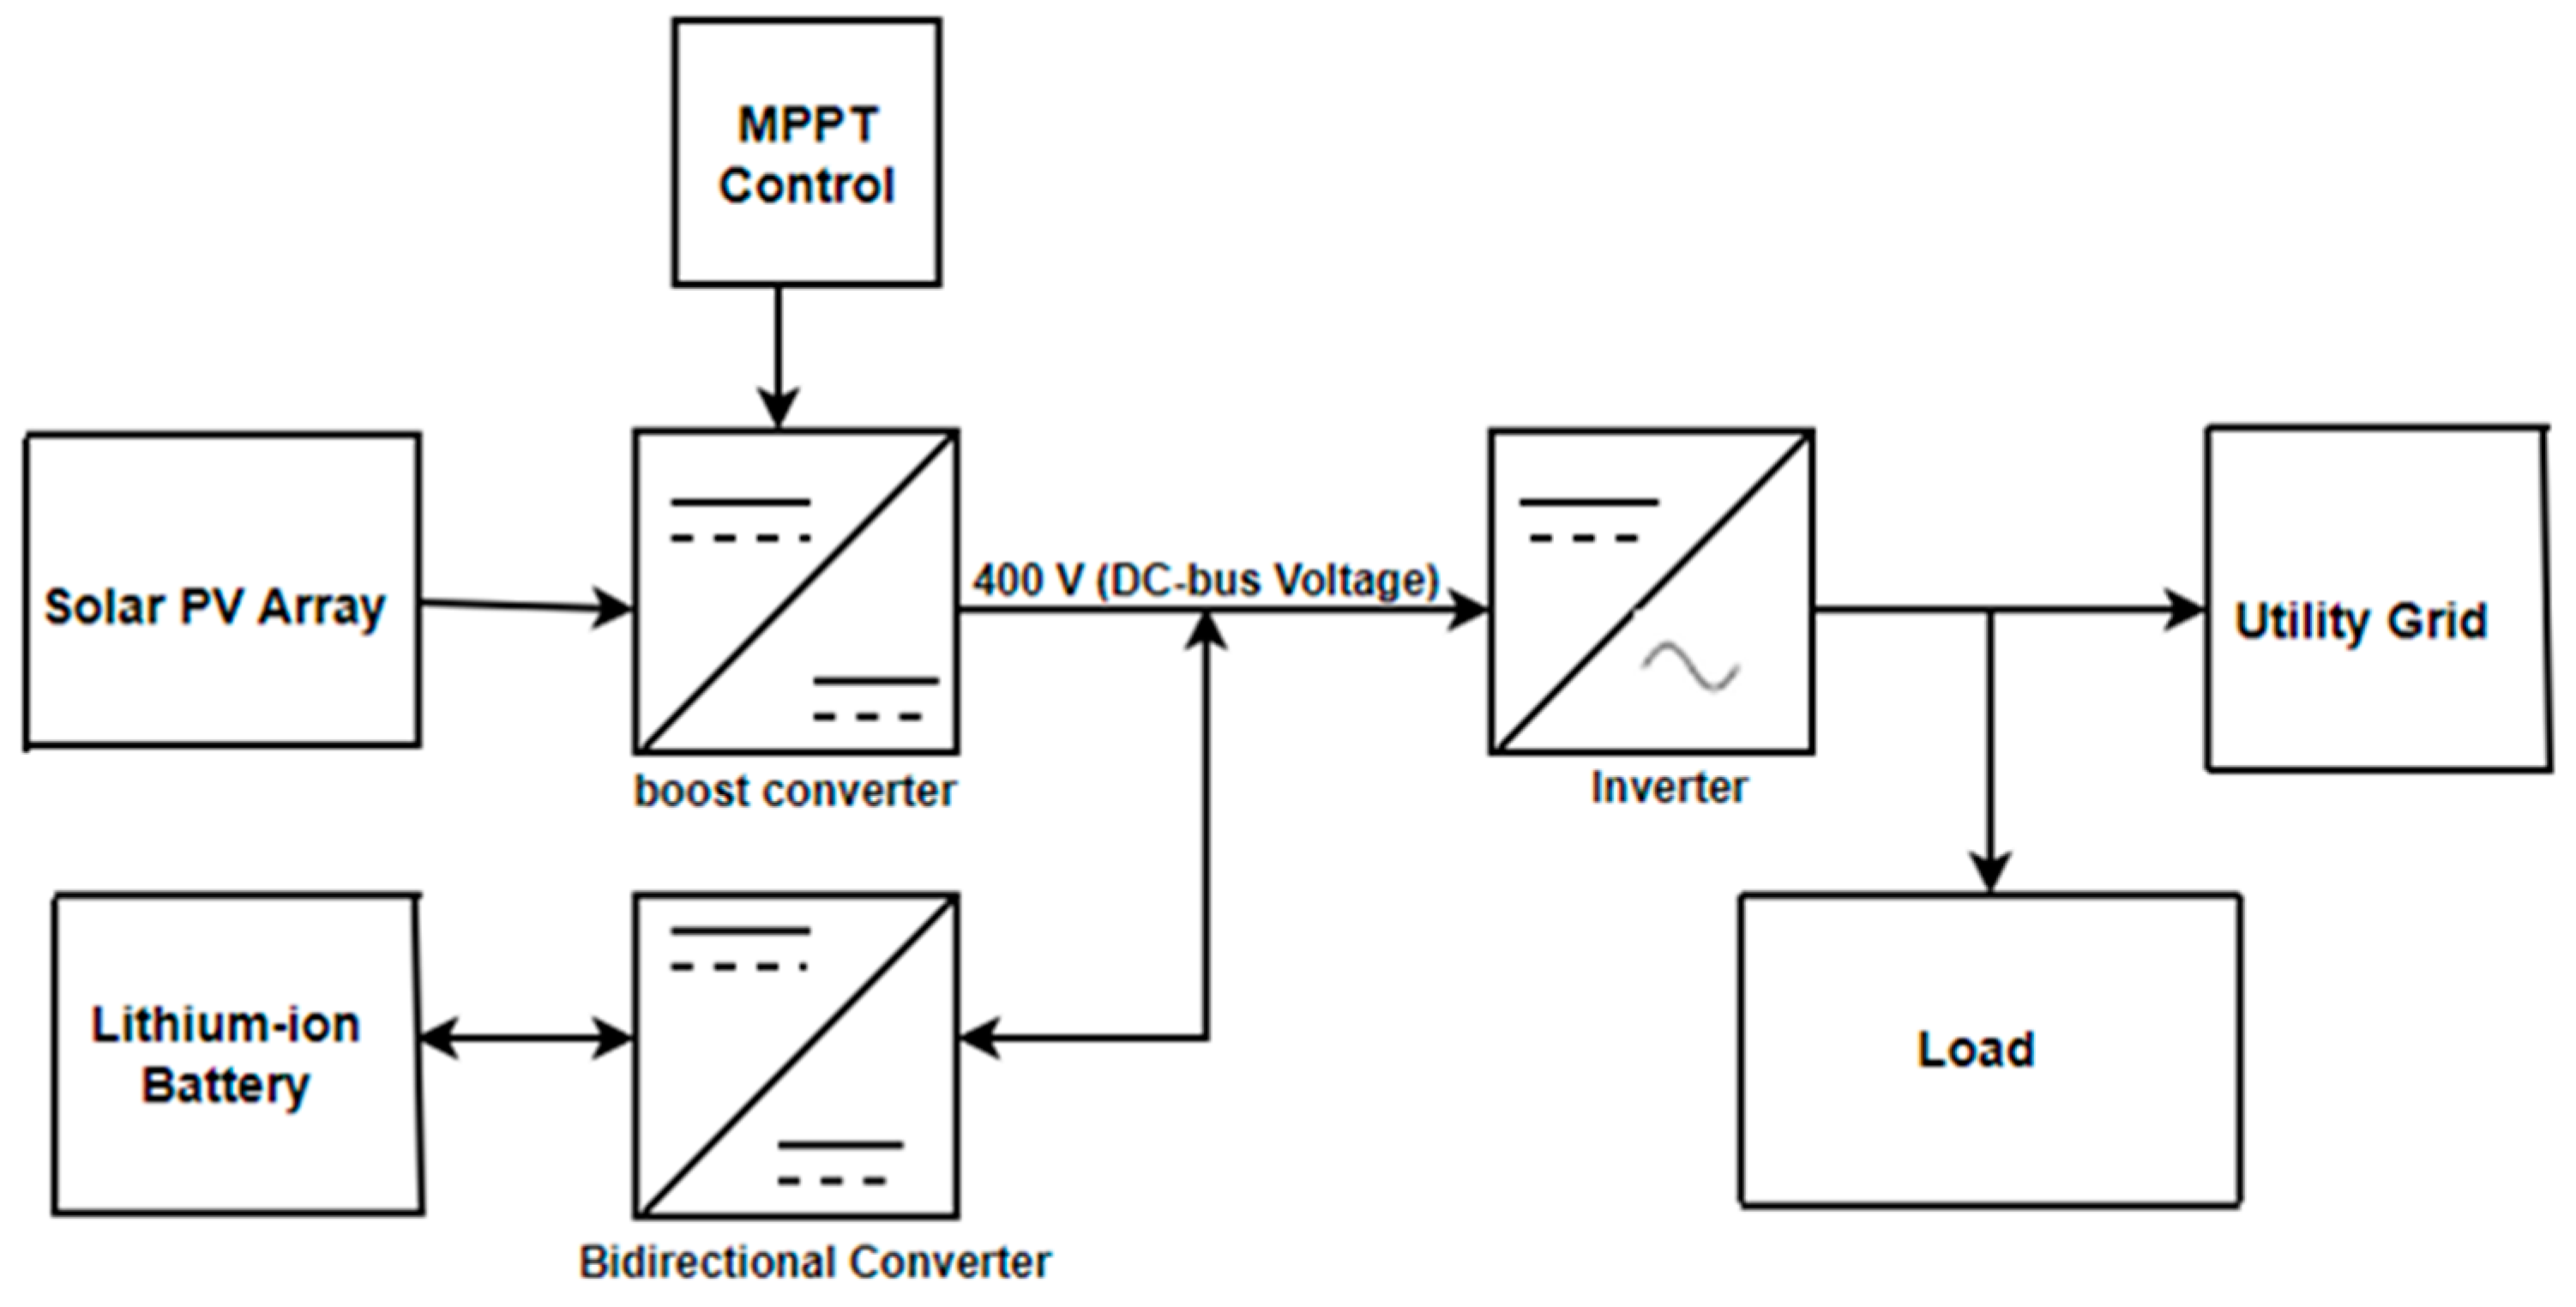
The μG in this study consists of a solar PV, Li-ion battery, power converters, and electrical load, operated in both grid-connected and off-grid modes, as shown in
Figure 2. They are designed to supply the demand for three lecture halls used for academic activities in a university located in the Western Cape in South Africa. In the grid-connected mode, the grid provides power to the loads, while during a power outage, the solar PV and/or Li-ion battery supplies power, depending on the weather conditions and battery SOC. The Li-ion battery serves as a backup, compensating for power shortages, covering transient load demands, and serving as an ESS when available power is greater than the load demand. Like other hybrid systems with an ESS, excess power in the system is used to charge the Li-ion battery when its SOC is less than 80% (BattSOC-max) and available power is greater than the load demand.
3.2. System Modelling
3.2.1. Load Profile
This section presents the load profiles for the selected lecture halls at the university for the year 2022. The daily load profiles for 23 February and 27 July 2022 were analysed to capture the seasonal variations in load demands for summer and winter, respectively. However, the load demand for a lecture day in winter (27 July 2022) was selected because winter seasons are characteristically cooler, leading to a higher load demand that requires the use of heating systems, such as electric heaters and/or HVAC systems, to maintain conducive indoor temperatures. Daily average load profiles and annual load profiles are presented for LH1 (
Figure 3a,b), LH2 (
Figure 4a,b), and LH3 (
Figure 5a,b), respectively. In LH1, the peak energy consumption is 126.182 kWh, with an average of 30.921 kWh. For LH2, the peak energy consumption is 267.056 kWh, with an average of 166.083 kWh and a minimum of 8.787 kWh. In LH3, the peak energy consumption is 63.942 kWh, with an average of 13.071 kWh and a minimum of 3.813 kWh. As shown in
Figure 4b and
Figure 5b, there are cases of non-zero minimum energy consumption of 119.6 kWh in January for LH2 and 3.813 kWh for LH3, as well as 8.787 kWh in August for LH2. These deviations from zero are due to maintenance activities and equipment testing conducted during those months.
3.2.2. Solar Energy Resource
Cape Town is in the southern hemisphere, with a latitude of approximately −33.9575° N and 18.4605° E.
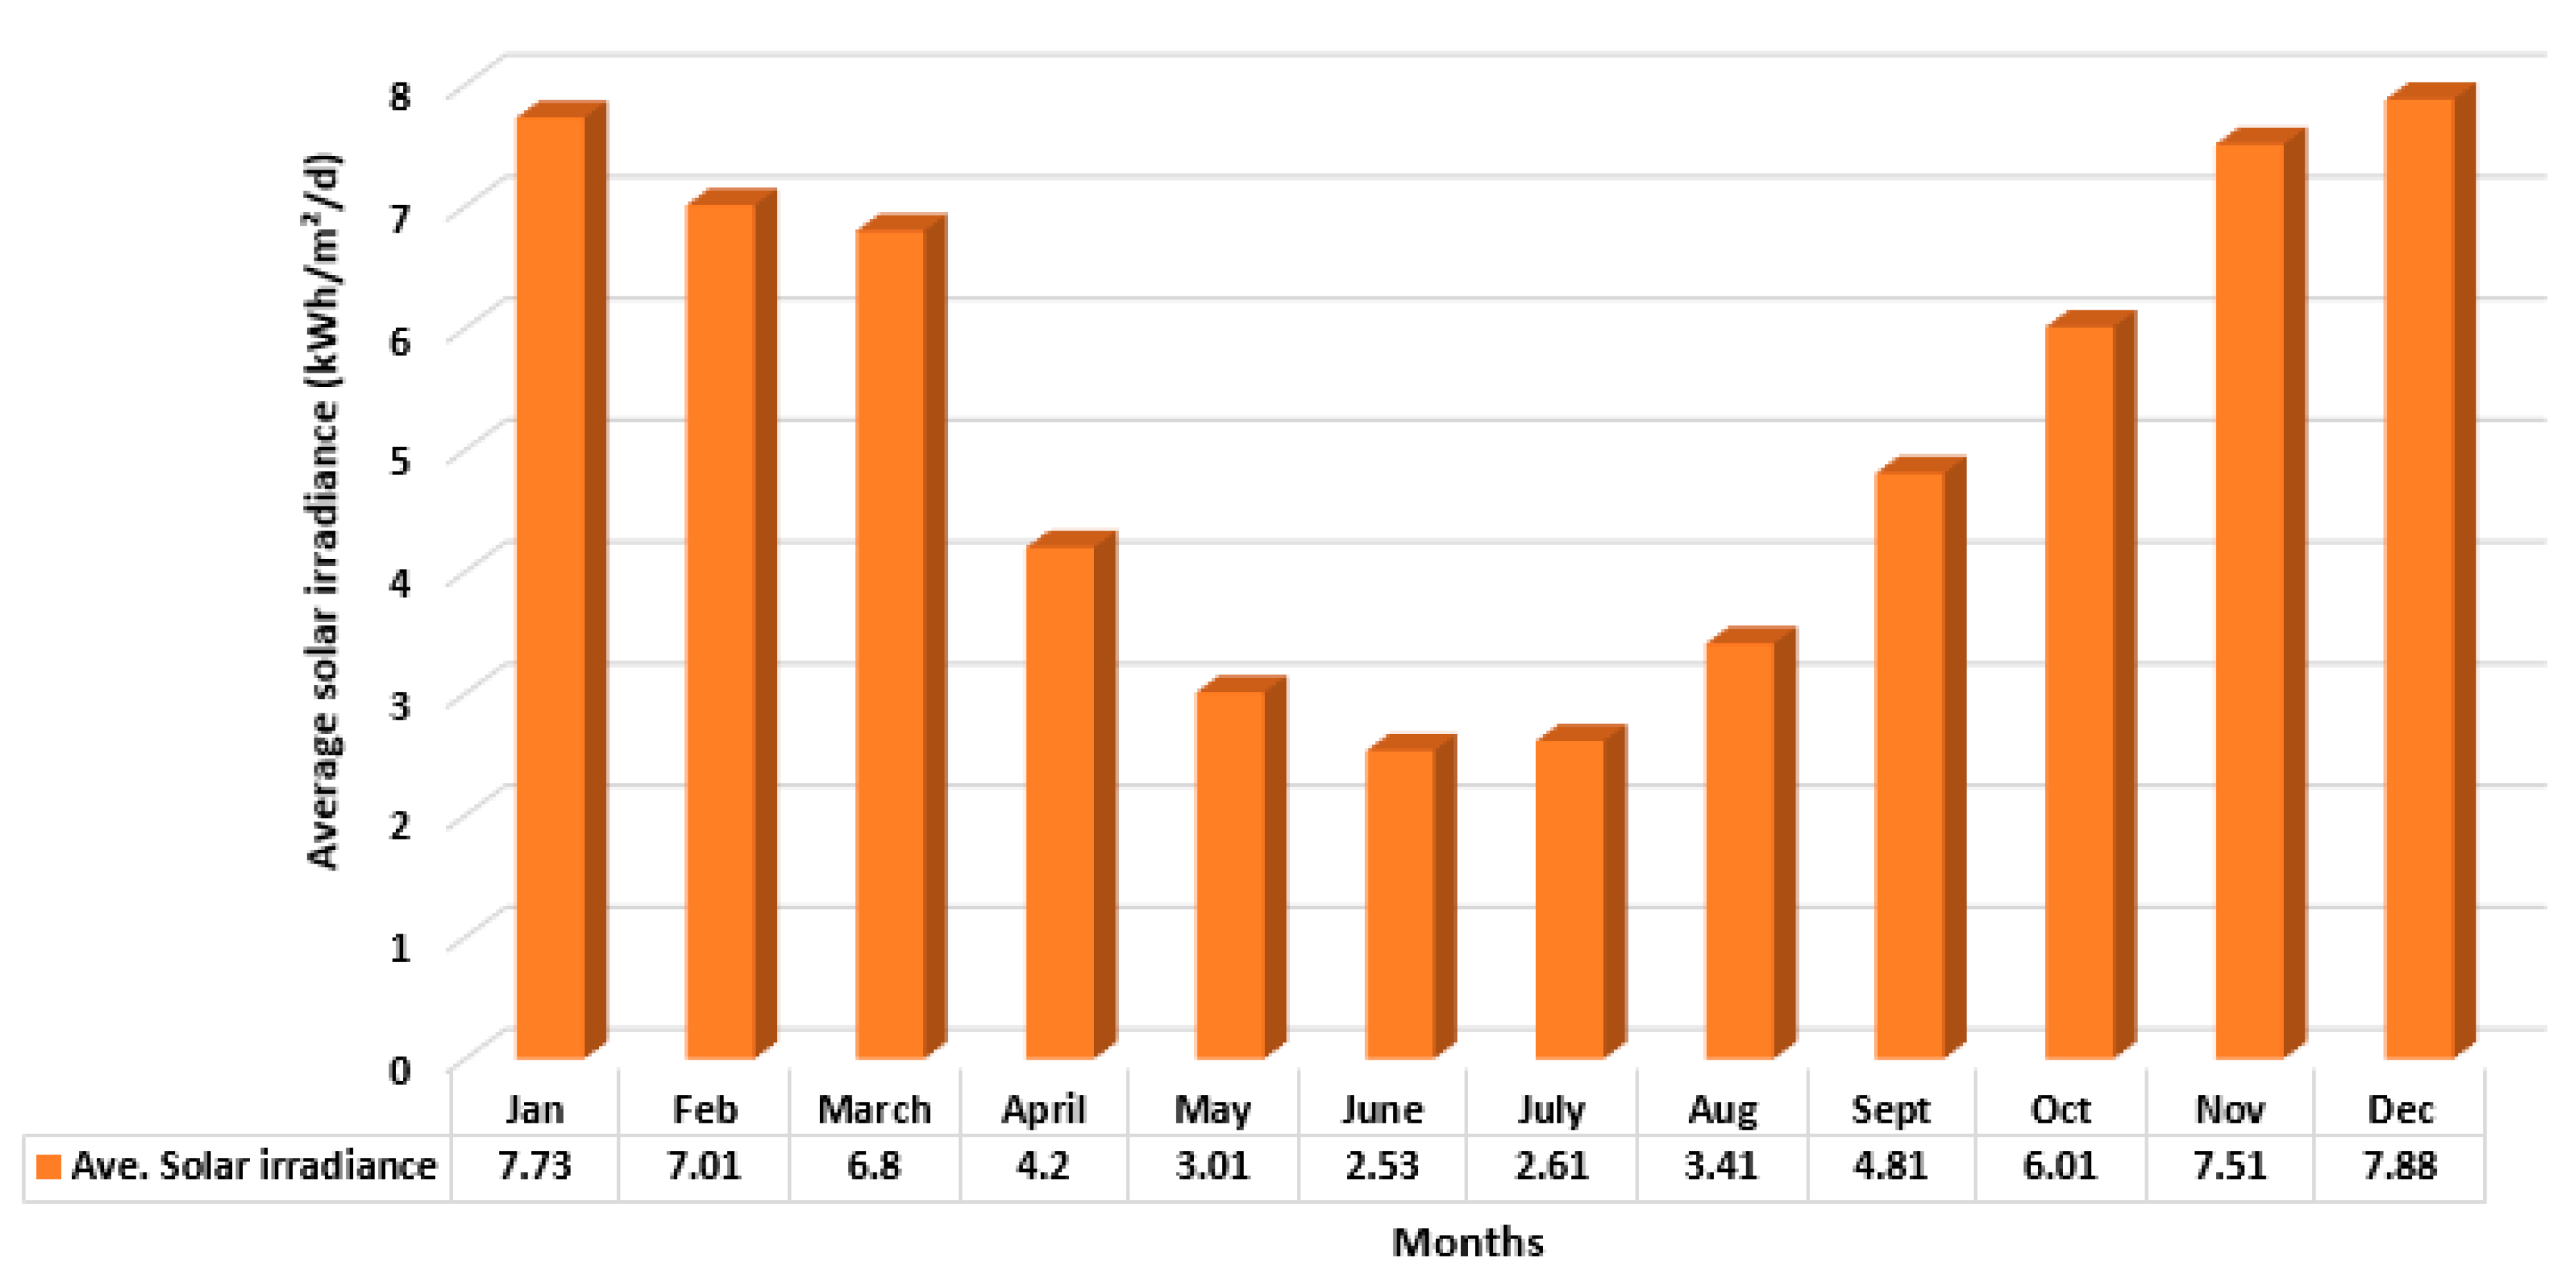
Figure 6 [
50] shows the annual average solar irradiance for the location, with peak solar irradiance during the extended summer months (October–March).
3.2.3. Temperature Profile
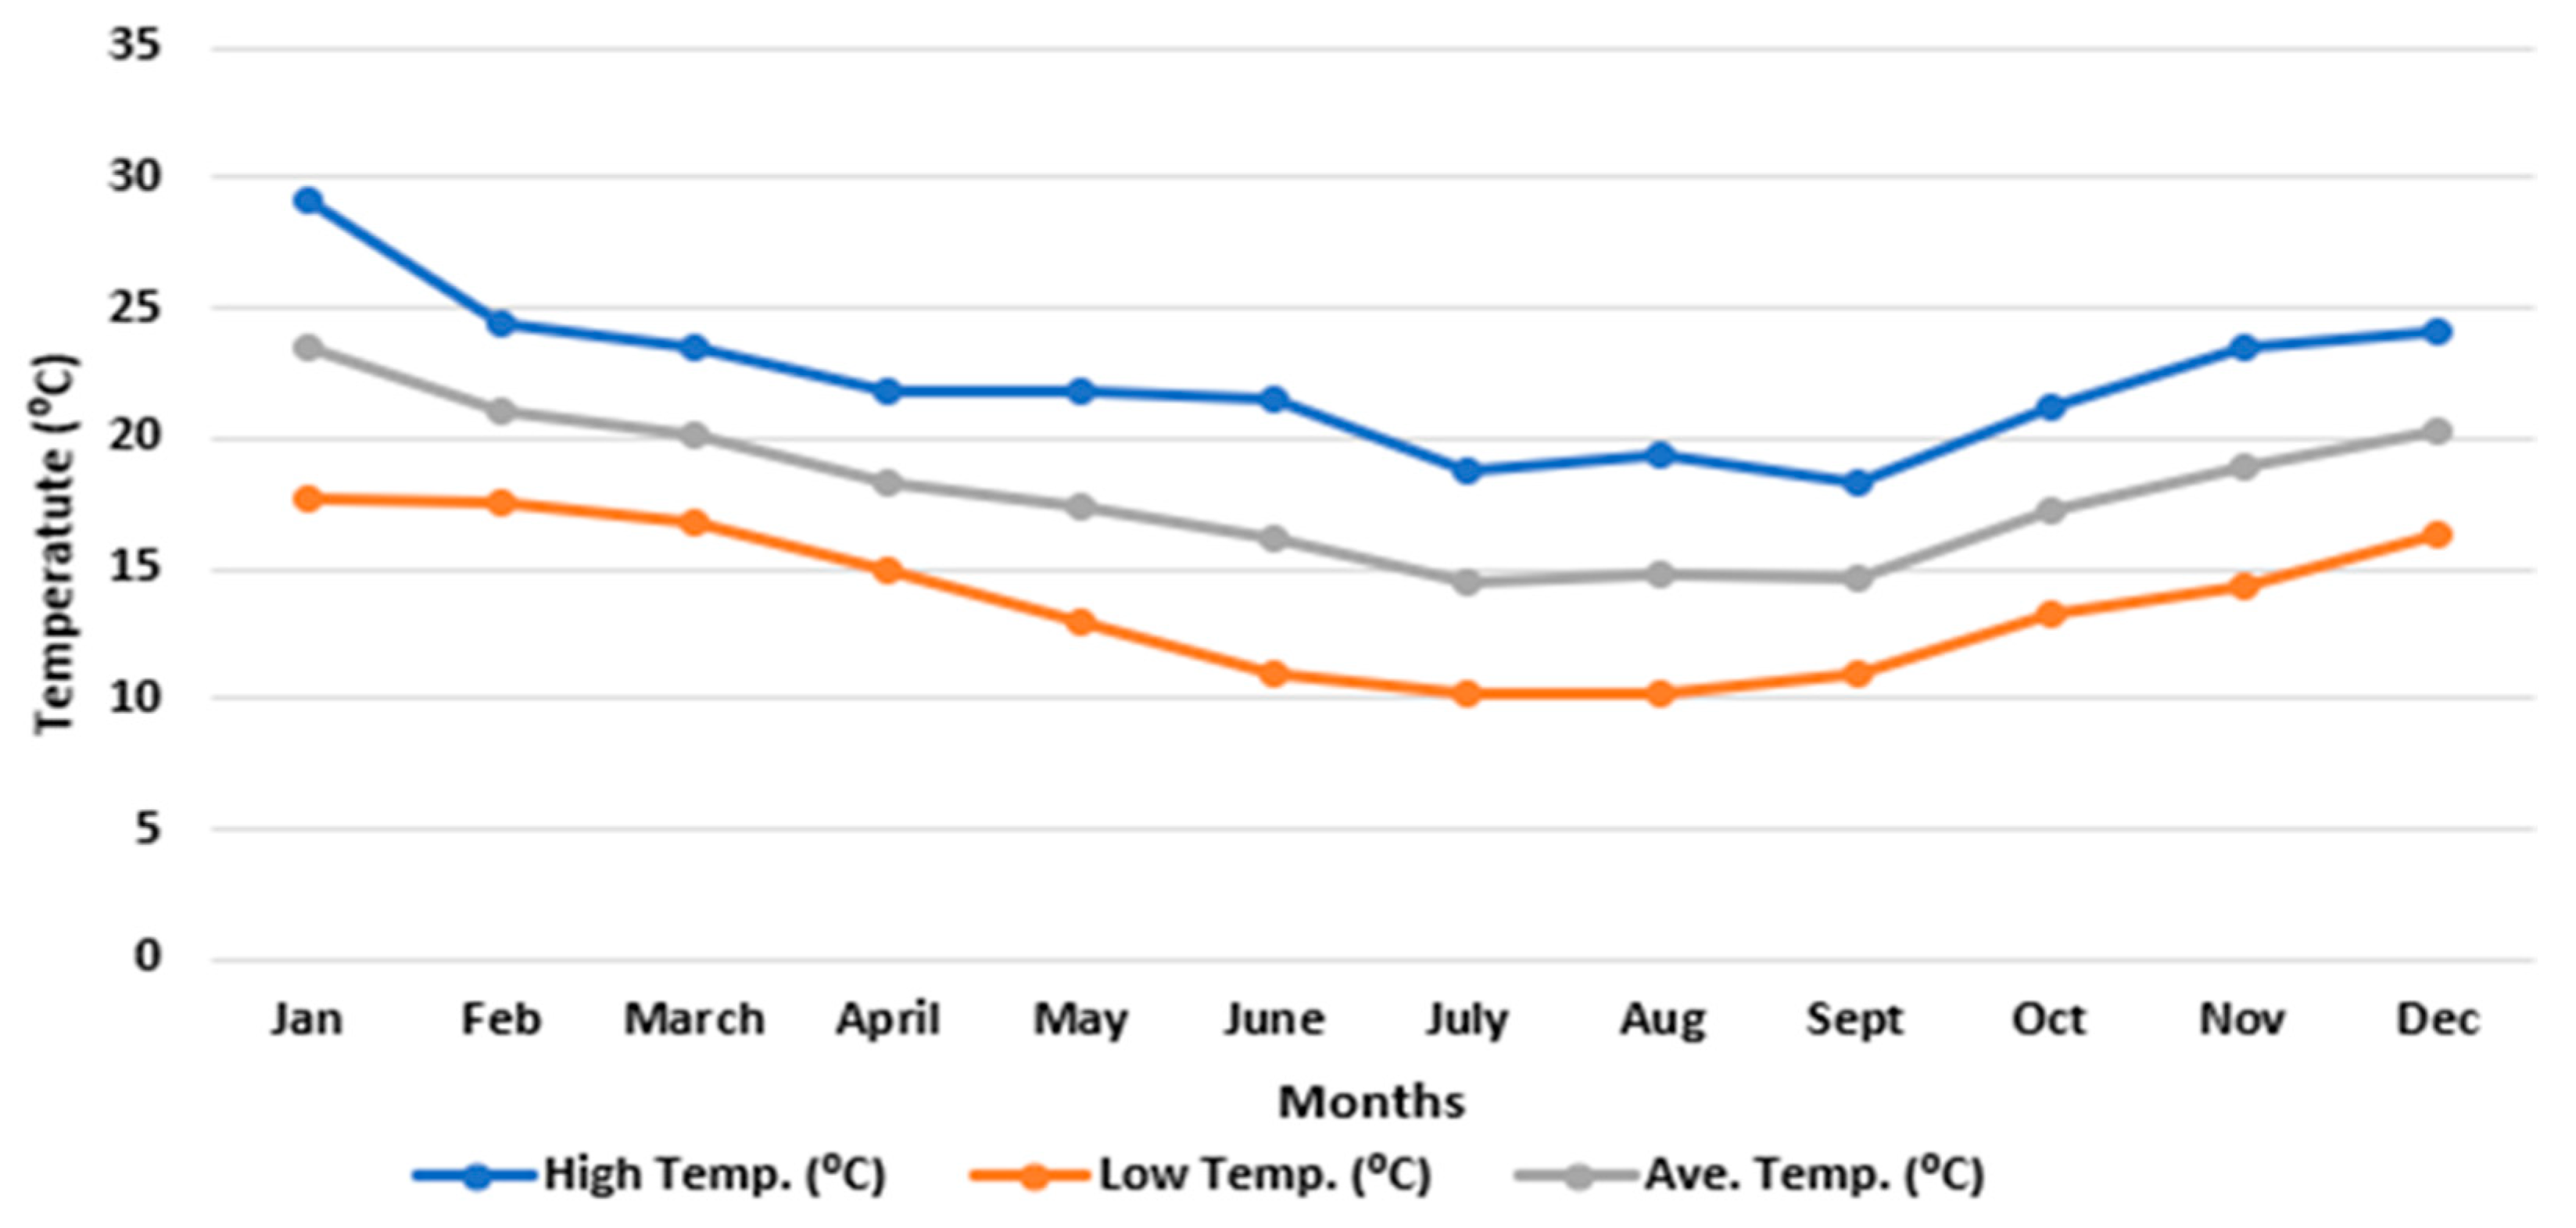
The Earth’s surface temperature at the location for 2022 was obtained from the NASA database, showing an annual average of 18.073 °C, with the lowest at 10.2 °C and the highest recorded at 29.16 °C, as shown in
Figure 7. The highest temperatures were recorded during the extended summer months (October–March), while the lowest recorded in the extended winter months (April–September).
3.2.4. Photovoltaic System
The power output of PV modules is normally defined using temperature and solar irradiance, and it can be calculated as follows [
51]:
where
is the PV power output (W),
is the efficiency of the inverter,
N is the total number of modules in the panel,
is the rated power of each module (W),
is the irradiance at a specific time (W/m
2),
is PV temperature coefficient (K
−1),
is the cell temperature during operation
is the cell temperature (°C) under standard test condition. Furthermore, the cell temperature
is expressed as [
40]:
where
is the ambient temperature (°C), and
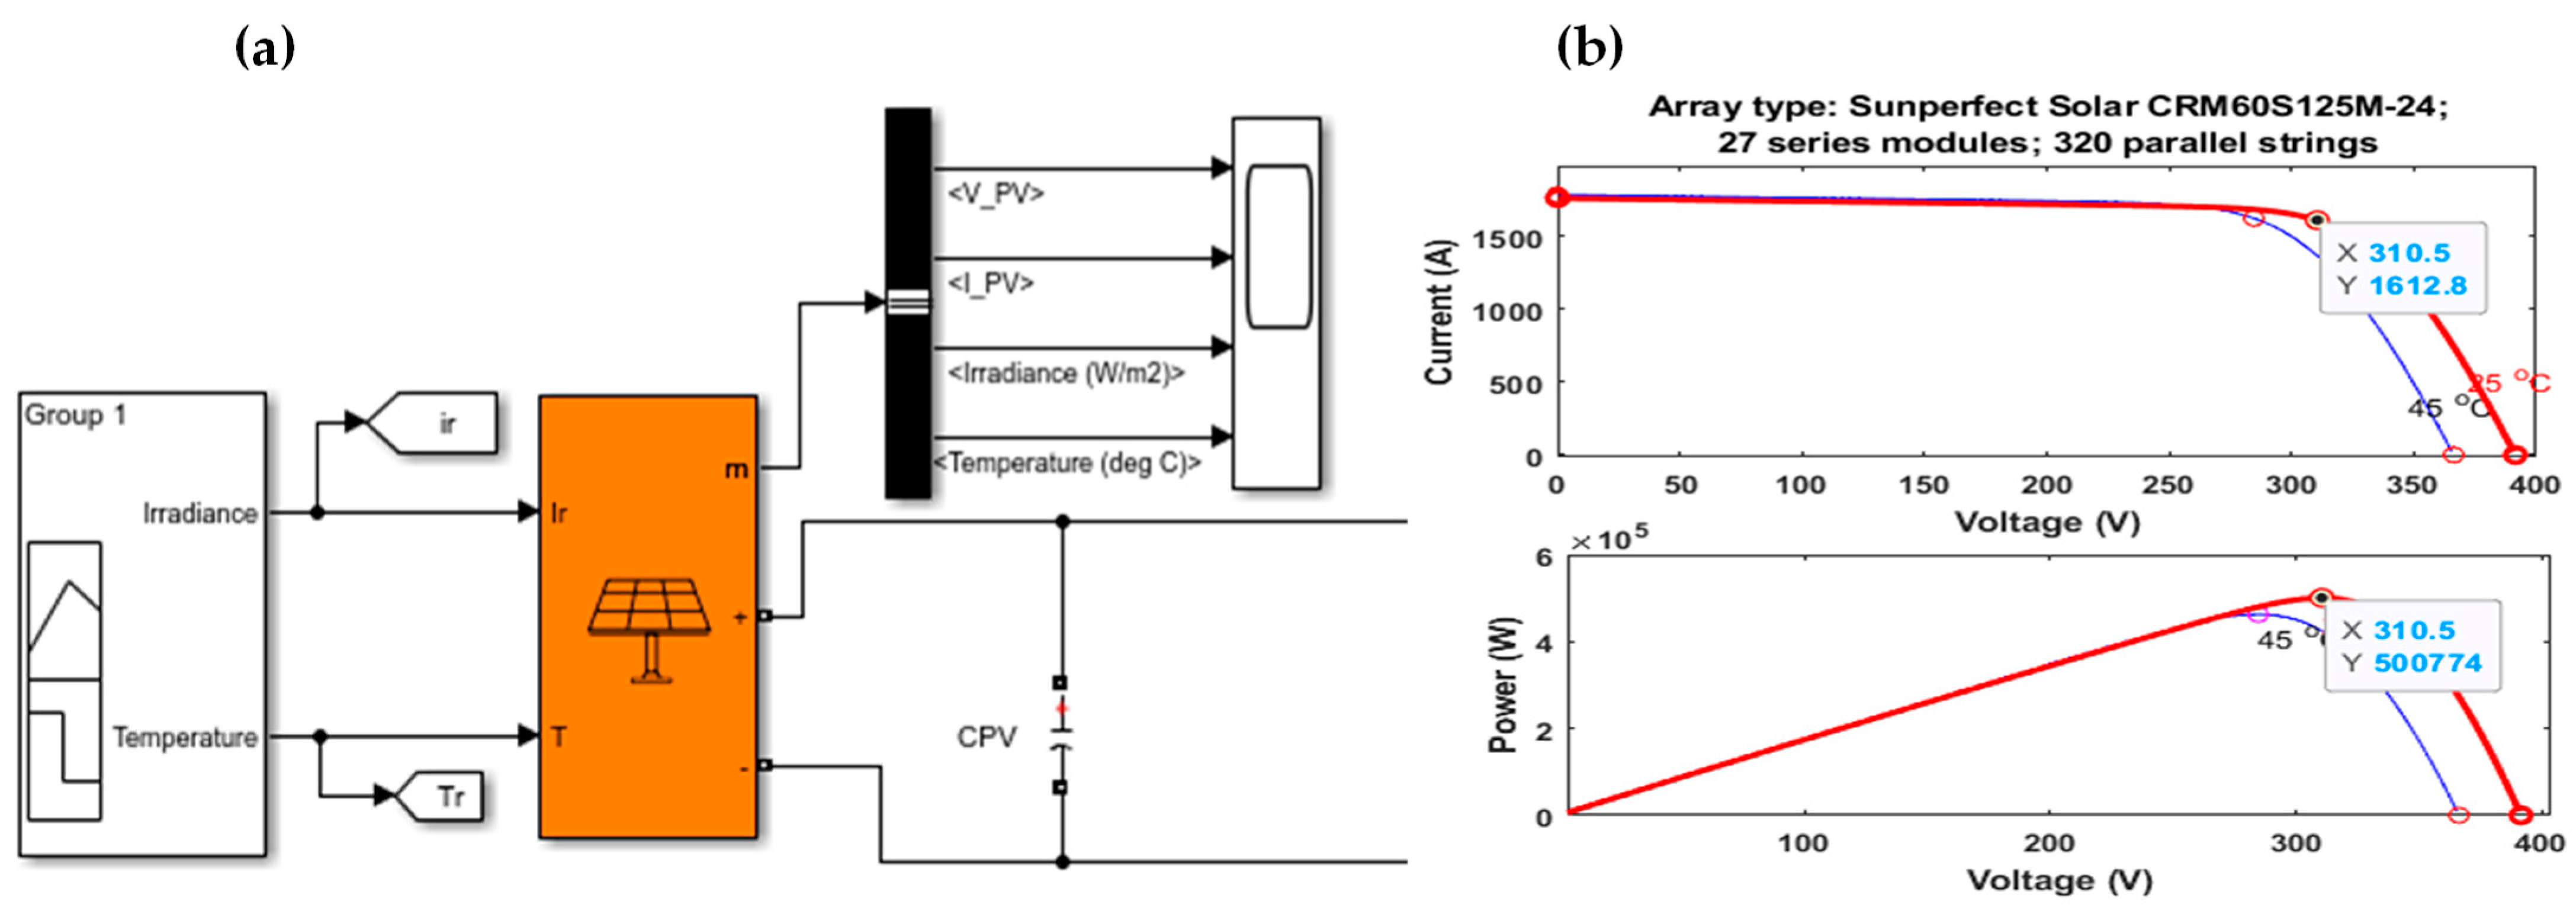
is the rated operating temperature (°C) of the cell. The solar PV and corresponding details at 25 °C and 45 °C are shown in
Figure 8a,b, respectively. In
Figure 8b, the red curve corresponds to 25 °C and the black curve corresponds to 45 °C. Furthermore, the sizing of the solar PV took into consideration the peak load demand, which is 457.18 kWh, and solar irradiance. However, a higher PV rating of 500 kW is used to compensate for power losses and enhance energy reliability and resilience. Therefore, to achieve the total number of modules required to generate the required power of 500 kW, the following calculation is used:
3.2.5. Lithium-Ion (Li-Ion) Battery
ESS technology plays a critical role in μG infrastructure due to the intermittent nature of renewable energy resources (RERs) [
51]. ESS applications include load levelling, peak shaving, uninterrupted power supply, and frequency regulation [
52]. Amongst the different technologies, such as compressed-air energy storage [
53], flywheels [
54], super capacitors [
55], and hydrogen energy storage [
56], Li-ion batteries have become increasingly prevalent in power systems and μGs over the past decade due to their high power and energy density, extended lifespan, low self-discharge rate, and improved reliability [
57,
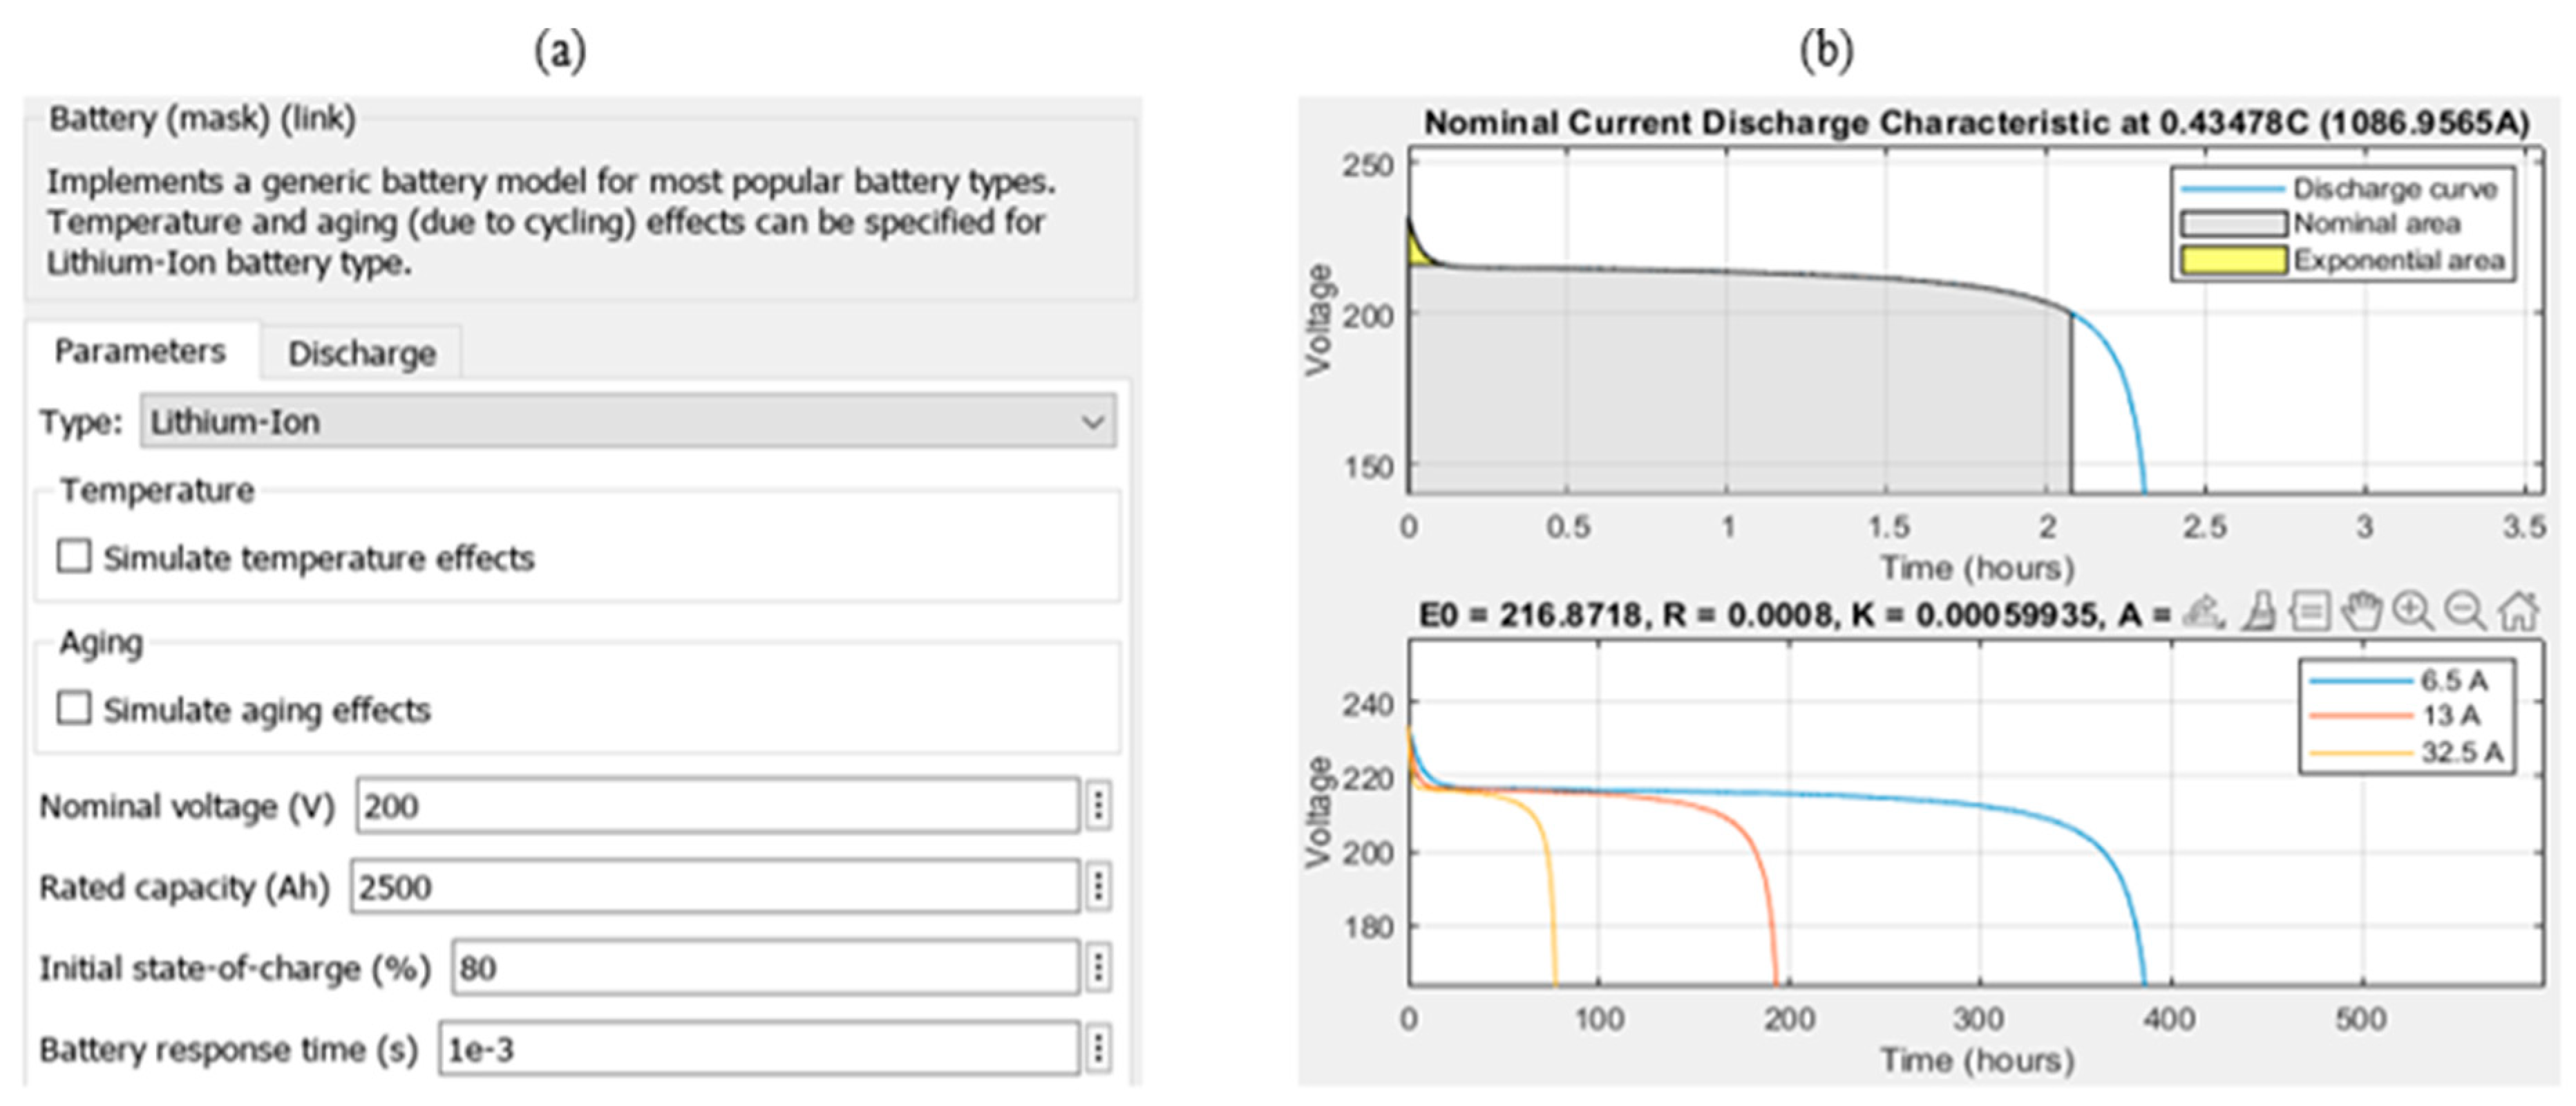
58]. In this study, a 500 kW, 200 V Li-ion battery, designed to supply power during outages or peak demand for an hour with recharging capabilities from either solar PV or the grid, is used. The battery size is determined based on the peak load demand of 457.18 kWh, multiplied by the desired autonomy period of an hour, resulting in the selection of a 500 kWh battery to ensure energy reliability and adequate supply. The Ah rating, indicating the amount of charge the battery can deliver over time, is calculated by dividing the total energy requirement (kWh) by the battery voltage. Battery parameters are shown in
Figure 9a,b, respectively.
Therefore, the charge is calculated as:
The discharge voltage of the battery is linked to an added factor ‘voltage polarisation’ that is meant to represent the impact of the battery SOC. The battery voltage is expressed as [
59]:
where
is the battery constant voltage (
),
is the polarisation constant
, Q is the battery capacity (
),
is the battery current (A),
is the actual battery charge capacity (
),
is the exponential voltage (
),
is the exponential zone dynamics
, and
is the battery internal resistance
.
Furthermore, battery degradation cost is a significant aspect of the economic impact of integrating a μG system. In this study, the battery degradation method used is simple and easy to understand, relying on readily available data such as initial cost, cycle life, and energy loss per cycle. It can be evaluated without extensive technical expertise, allowing for quick adoption without complex calculations or software requirements. Essential values are normally found in manufacturers’ datasheets and industry reports, reducing the need for extensive data collection. This method provides an accurate and broad assessment of degradation costs suitable for numerous applications, enabling quick decision-making with minimal computing effort, which is beneficial for businesses with limited resources. Its flexibility and adaptability to various types of batteries and use cases make it cost-effective, avoiding the need for significant empirical testing and complex modelling, thereby reducing total costs and enabling rapid integration into existing systems. To ensure the accuracy of the battery degradation cost, the study collects practical and up-to-date data on battery specifications, develops a degradation model considering cycle life and calendar aging, calculates the annualised cost, including maintenance, validates and updates the model with real-world data, and performs sensitivity analysis to identify and monitor critical factors affecting battery degradation, with more sophisticated approaches planned for further studies.
The battery degradation cost is estimated using a simple process with available data as follows:
.
.
where is the battery cost; is the installation cost; cycle life is the number of cycles; calendar life is the battery life span (years); is the energy loss due to degradation; is the energy cost per kWh; is the replacement cost; is the annual maintenance cost.
Therefore, the total degradation cost (TDC) is achieved using reference [
60]:
The following values were used in this study [
61,
62,
63,
64]:
= ZAR 1,425,000, = ZAR 285,000 (20% of ), initial cost (IC) = ZAR 1,710,000, life cycle = 7000, calendar life = 10 years, annual battery maintenance cost = 1% of = ZAR 14250, replacement cost = IC + = ZAR 1,995,000, replacement cost/cycle = , annual capacity loss = (1.5% of initial capacity (500 kWh)) = 7.5 kWh/year, energy loss per cycle due to degradation = 0.021 kWh/cycle, and cost of energy from the battery = ZAR 1.8/kWh.
Therefore, TDC
per cycle = CLD + ODC + RC = 244.29 + 0.0378 + 285 = ZAR 529.33/cycle
3.2.6. Power Converters
Power converters are used to convert DC power to AC and vice versa, creating system balance, ensuring stability, enabling effective energy transformation, and optimising general system performance. In this study, a DC-DC boost converter is used to amplify the solar PV voltage, ensuring compatibility with the DC bus voltage. The voltage drop across the DC-DC boost converter inductor is expressed using the following formulae:
Furthermore, Equation (7) is expressed using the small ripple approximation as:
where
is the input voltage (V),
is the inductor voltage (V),
is the capacitor current (A),
is the output voltage (V), and
is the resistor
. The duty cycle, inductor (L), and the capacitor are obtained using:
where
,
is assumed to be 30% of
,
is taken as 1% of
,
, and
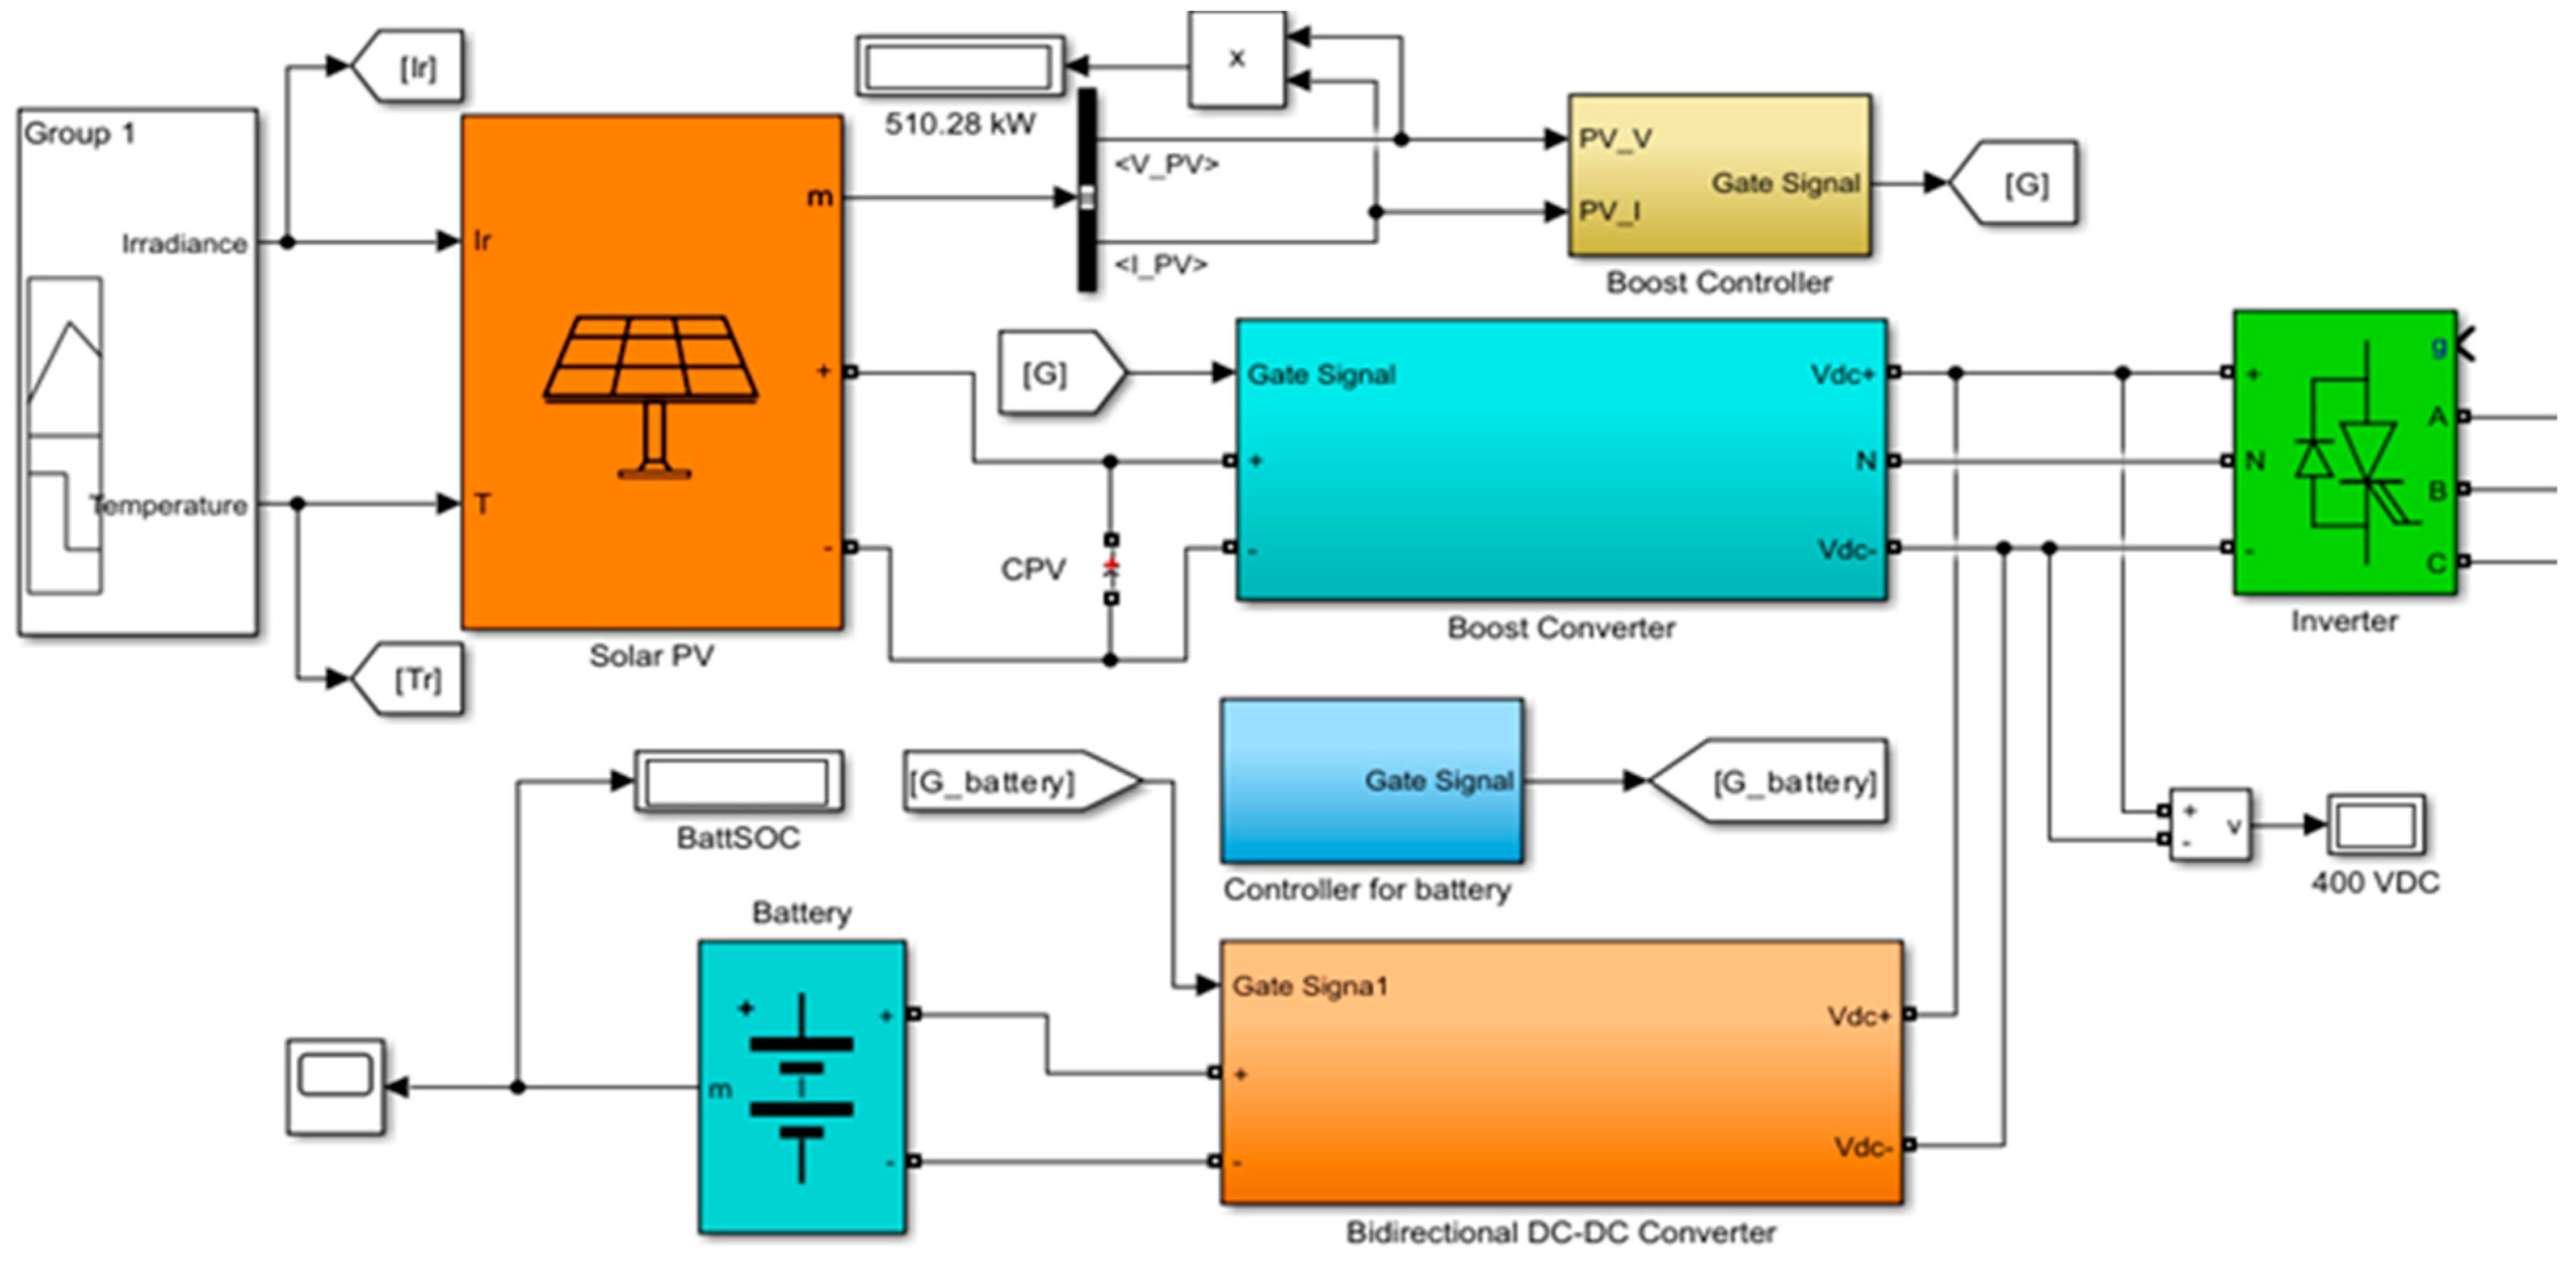
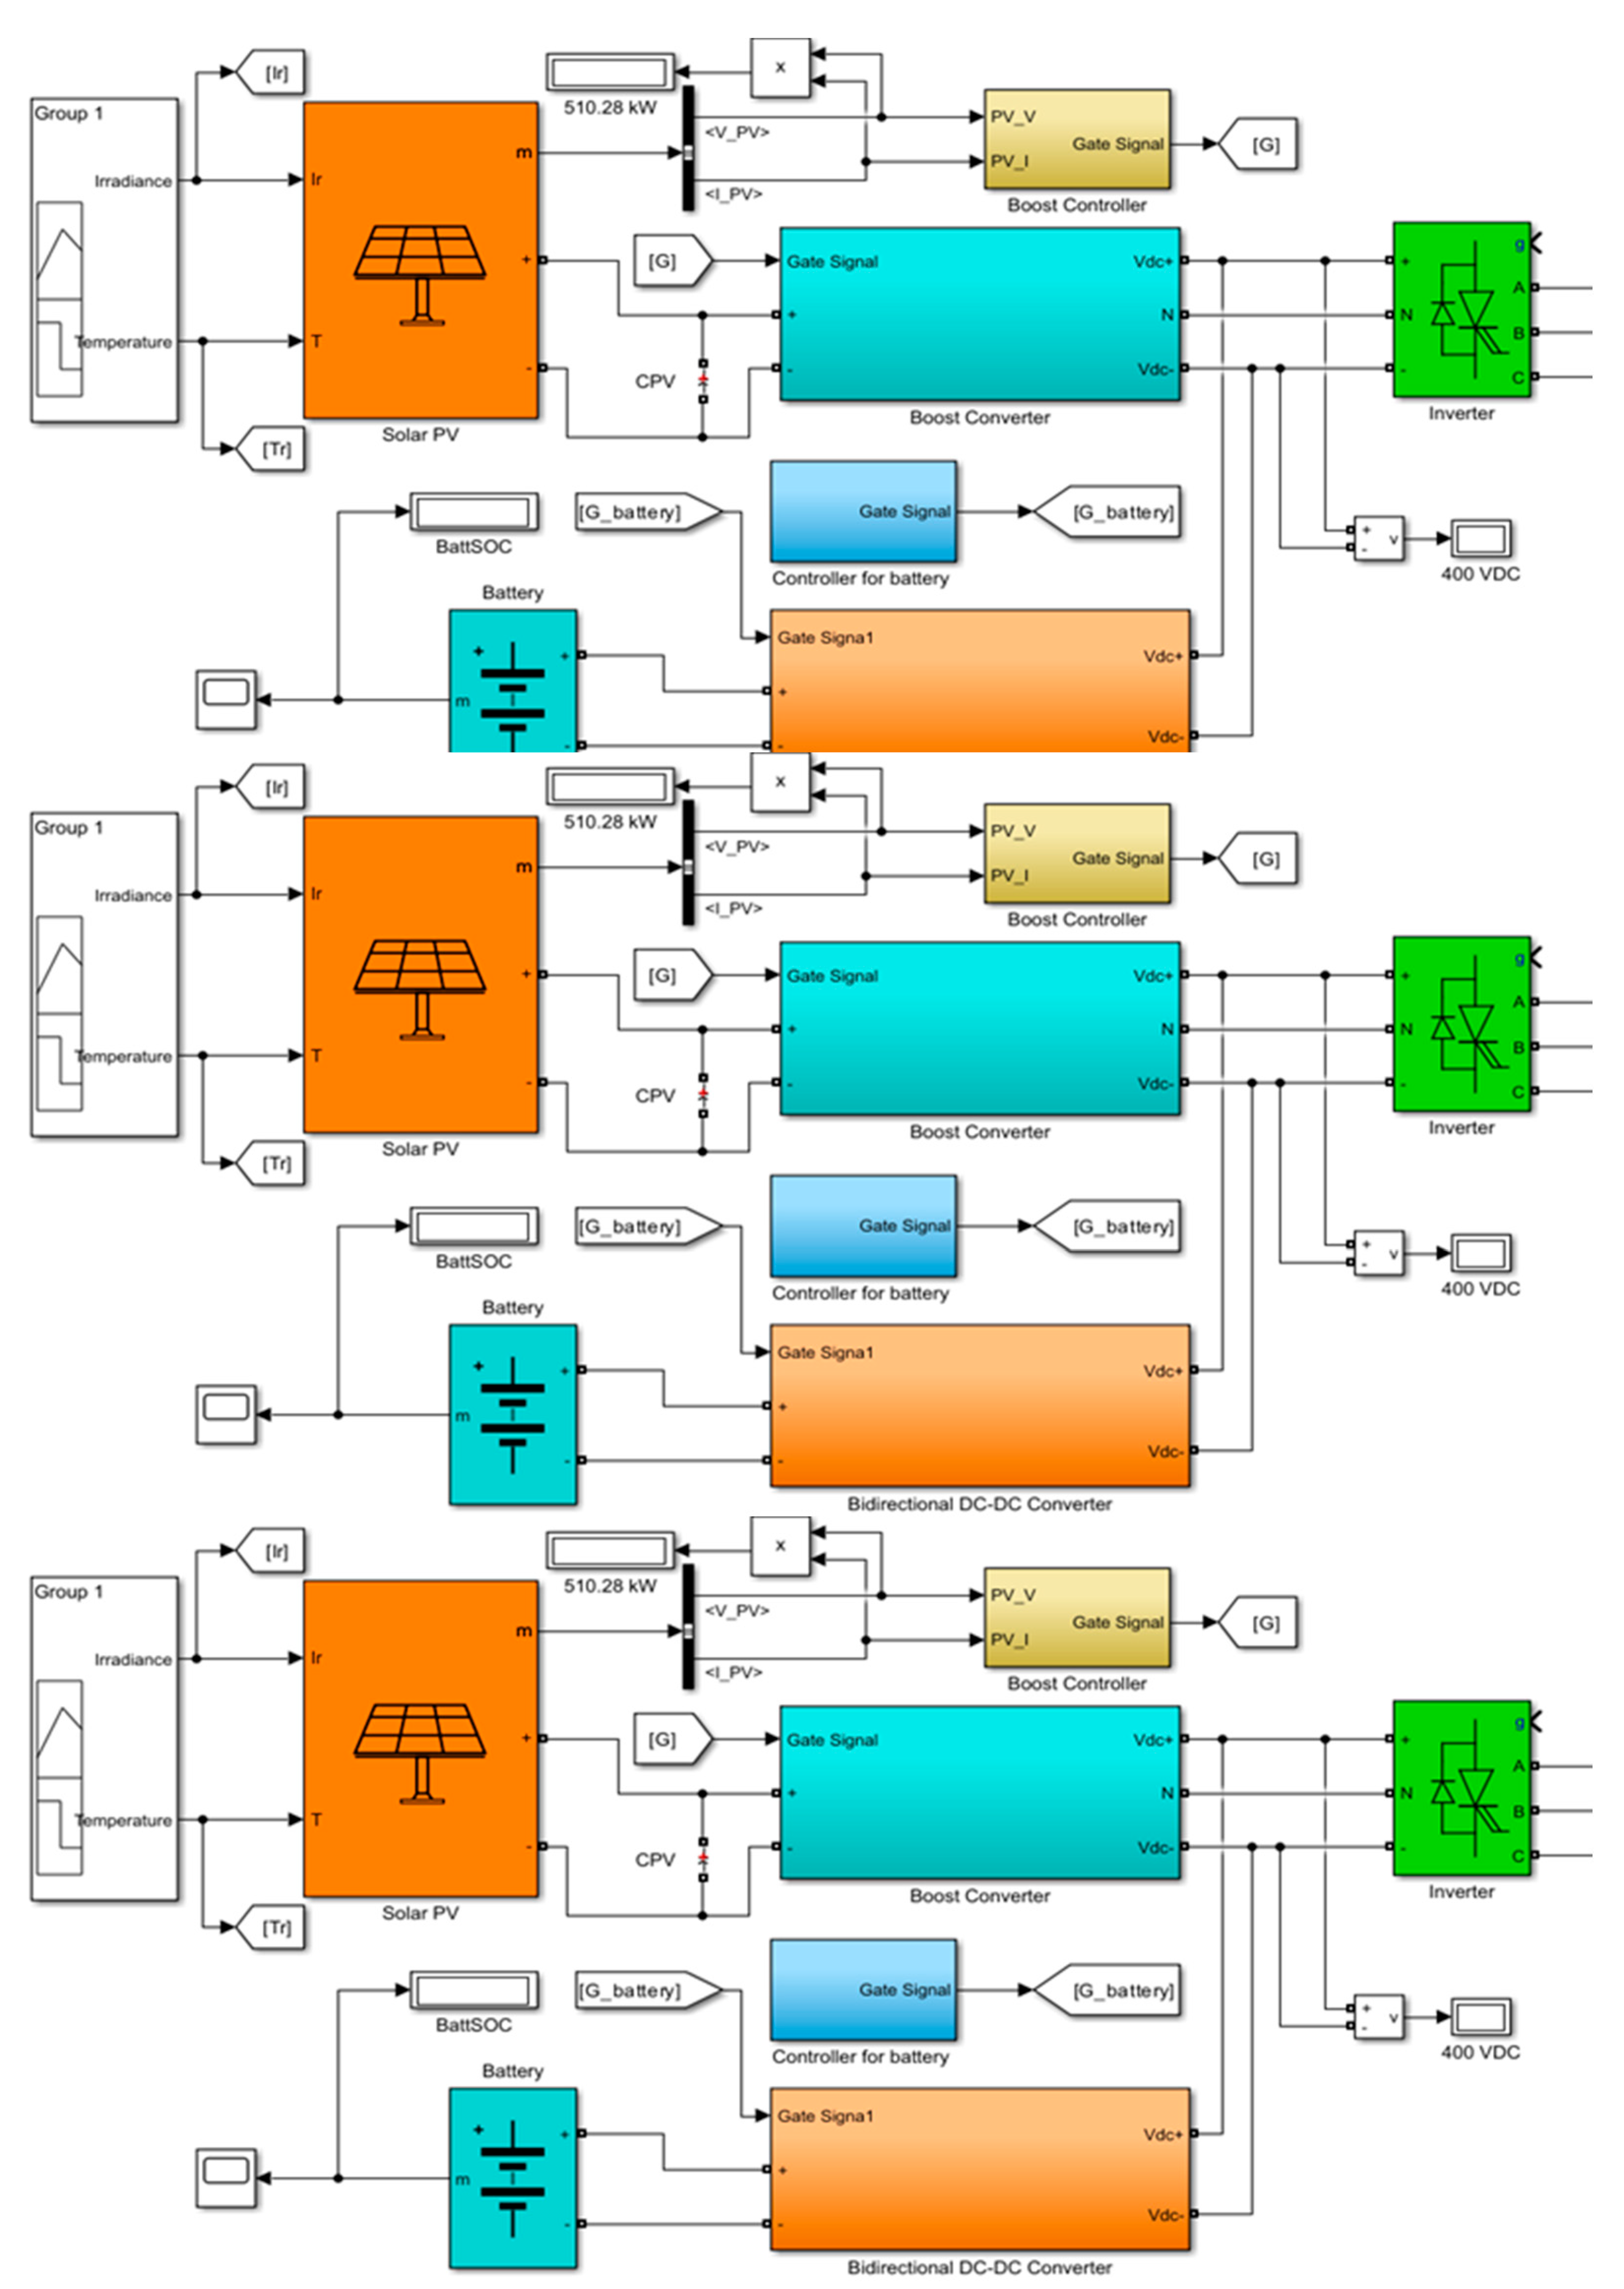
= 10 kHz. The inductance value is always selected to be 10 times higher than the calculated value to ensure continuous conduction for various voltages and loads. Additionally, a bidirectional converter simulated in Matlab is used for both charging and discharging of the battery, and an inverter is used to convert the DC to AC, as shown in
Figure 10.
A capacitor is connected in parallel across the solar PV and presented to the boost convert as a voltage source because the solar cell is a current source. An inverter converts the DC power from both the solar PV and battery into AC, ensuring compatibility with the AC load demand. The bidirectional converter operation is based on the availability of power from the solar PV, grid, and battery SOC. The capacitor and inductor values in the bidirectional converter are obtained using (12) and (13), respectively:
where
higher capacitance (F),
lower capacitance (F), D = duty cycle,
ripple voltage (V),
high voltage (V),
minimum inductance (H), and
critical power (W).
The input parameters for the boost converter design, based on the formulae provided earlier, are a duty cycle of 0.23, inductance of 150 µH, and capacitance of 23 mF. For the bidirectional converter, the capacitance and inductance values were set to 30 µF and 250 mH, respectively.
3.2.7. Utility Grid
Grids operate at various levels and sizes [
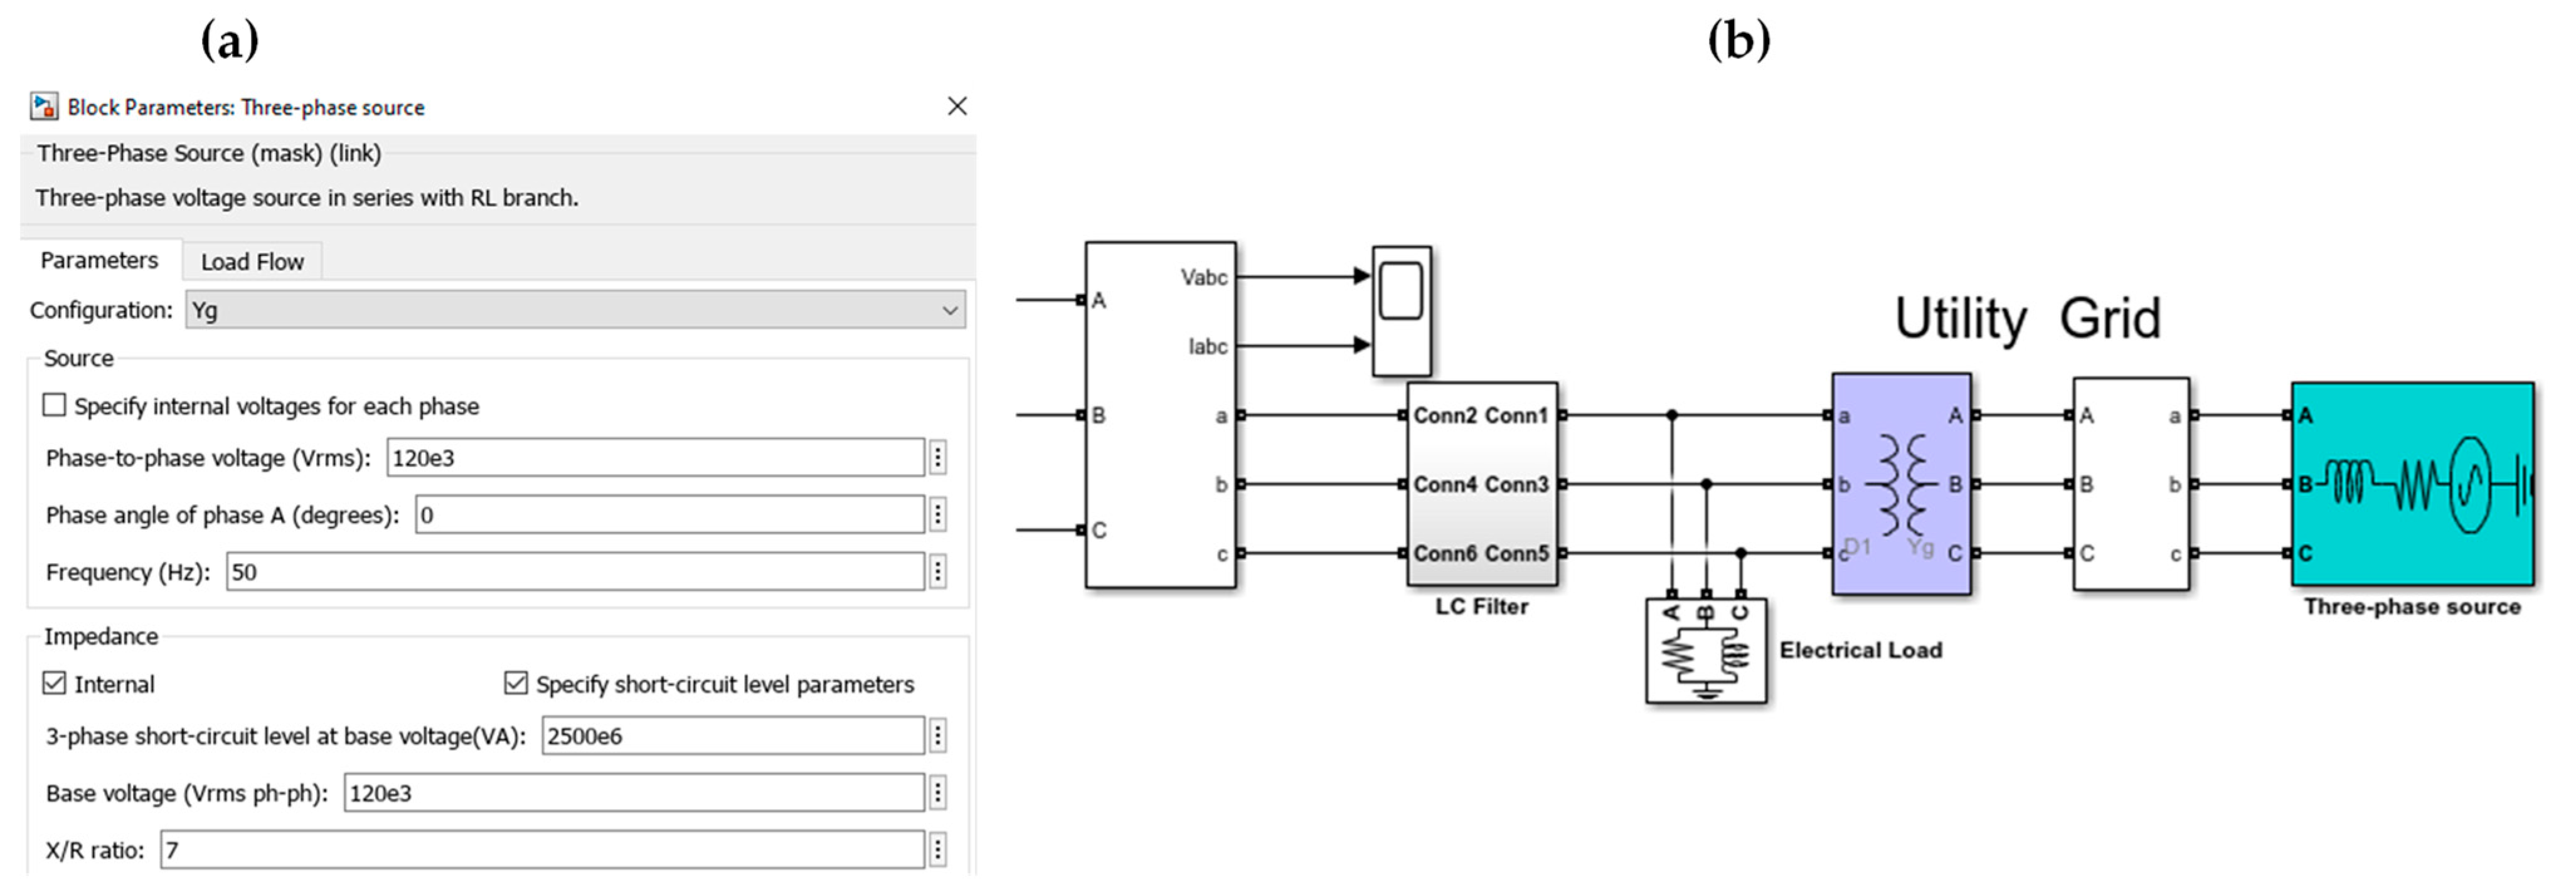
65]. In this study, a three-phase voltage source in series with an RL branch and LC filter represents the grid, operating at 2500 MVA. This assumption considers the operational capacity of the grid, representing a substantial portion of its total capacity and suitable for representing large-scale grid characteristics. Details of the grid configuration are provided in
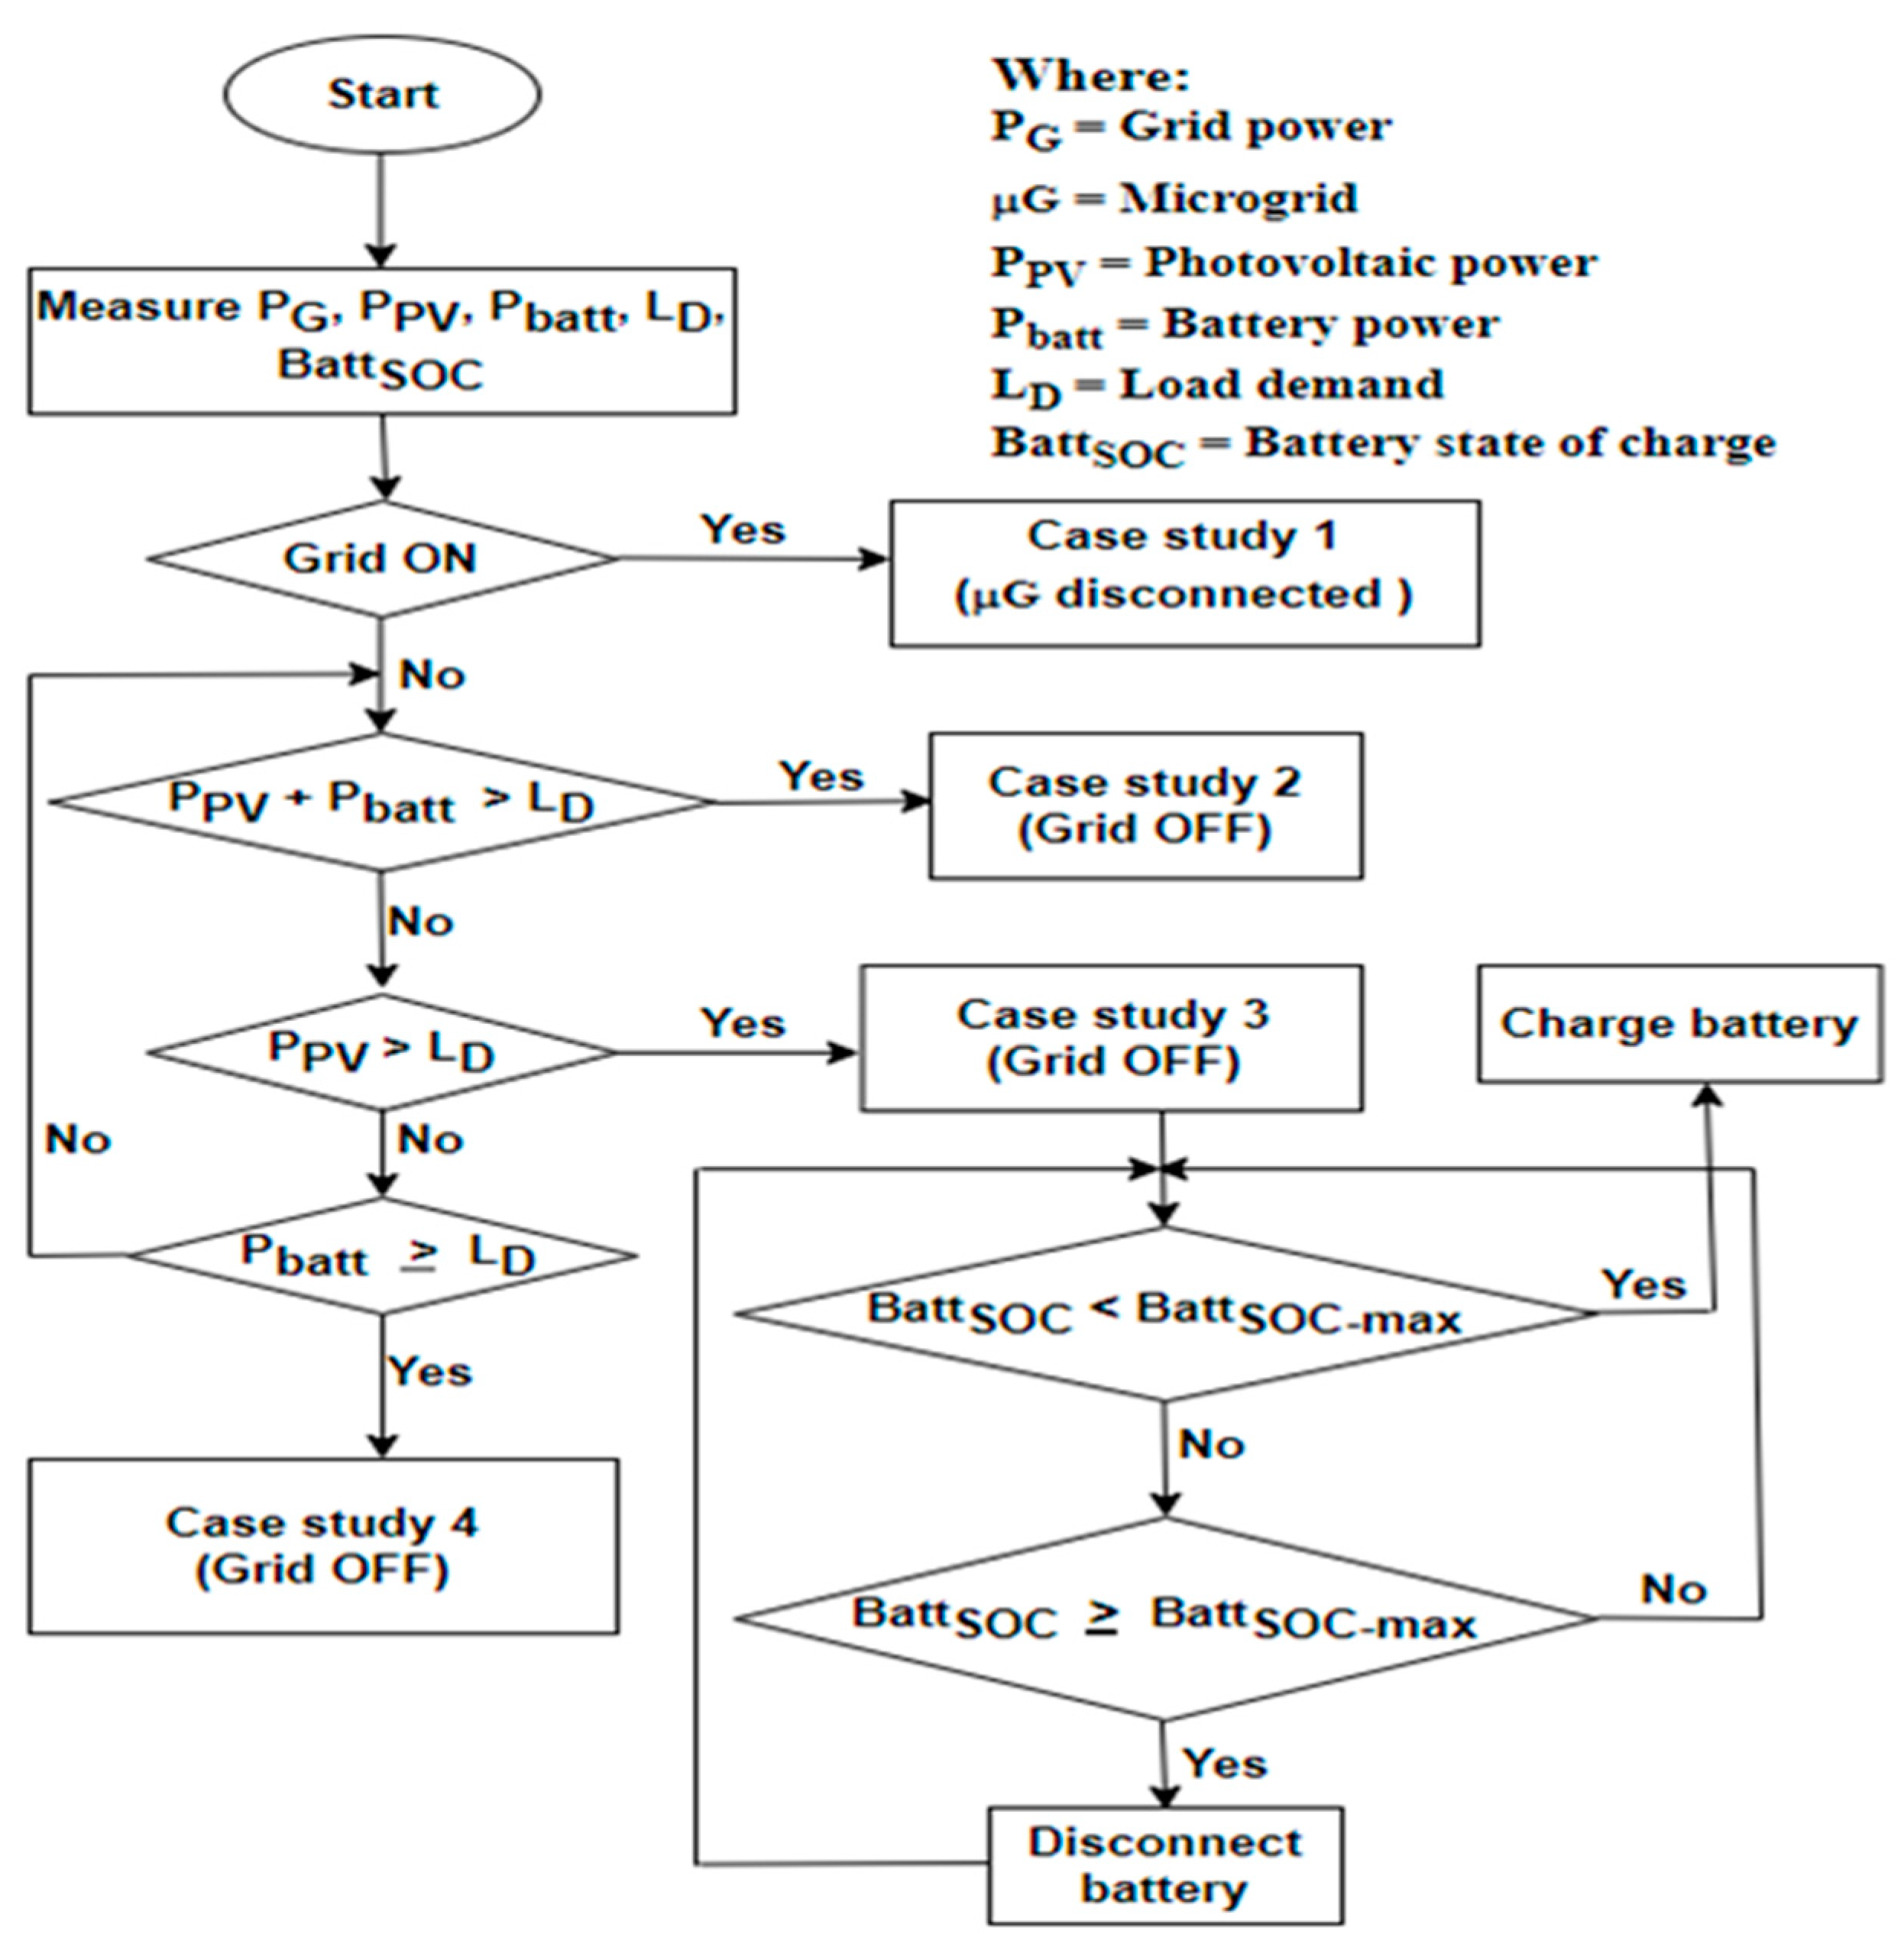
Figure 11a,b, while the proposed EMS flowchart used to determine the direction of power flow using the grid power, PV power, battery power, load demand, and the battery SOC is shown in
Figure 12.
Furthermore, it is imperative to differentiate the polarities of the different power sources and consumption within the system.
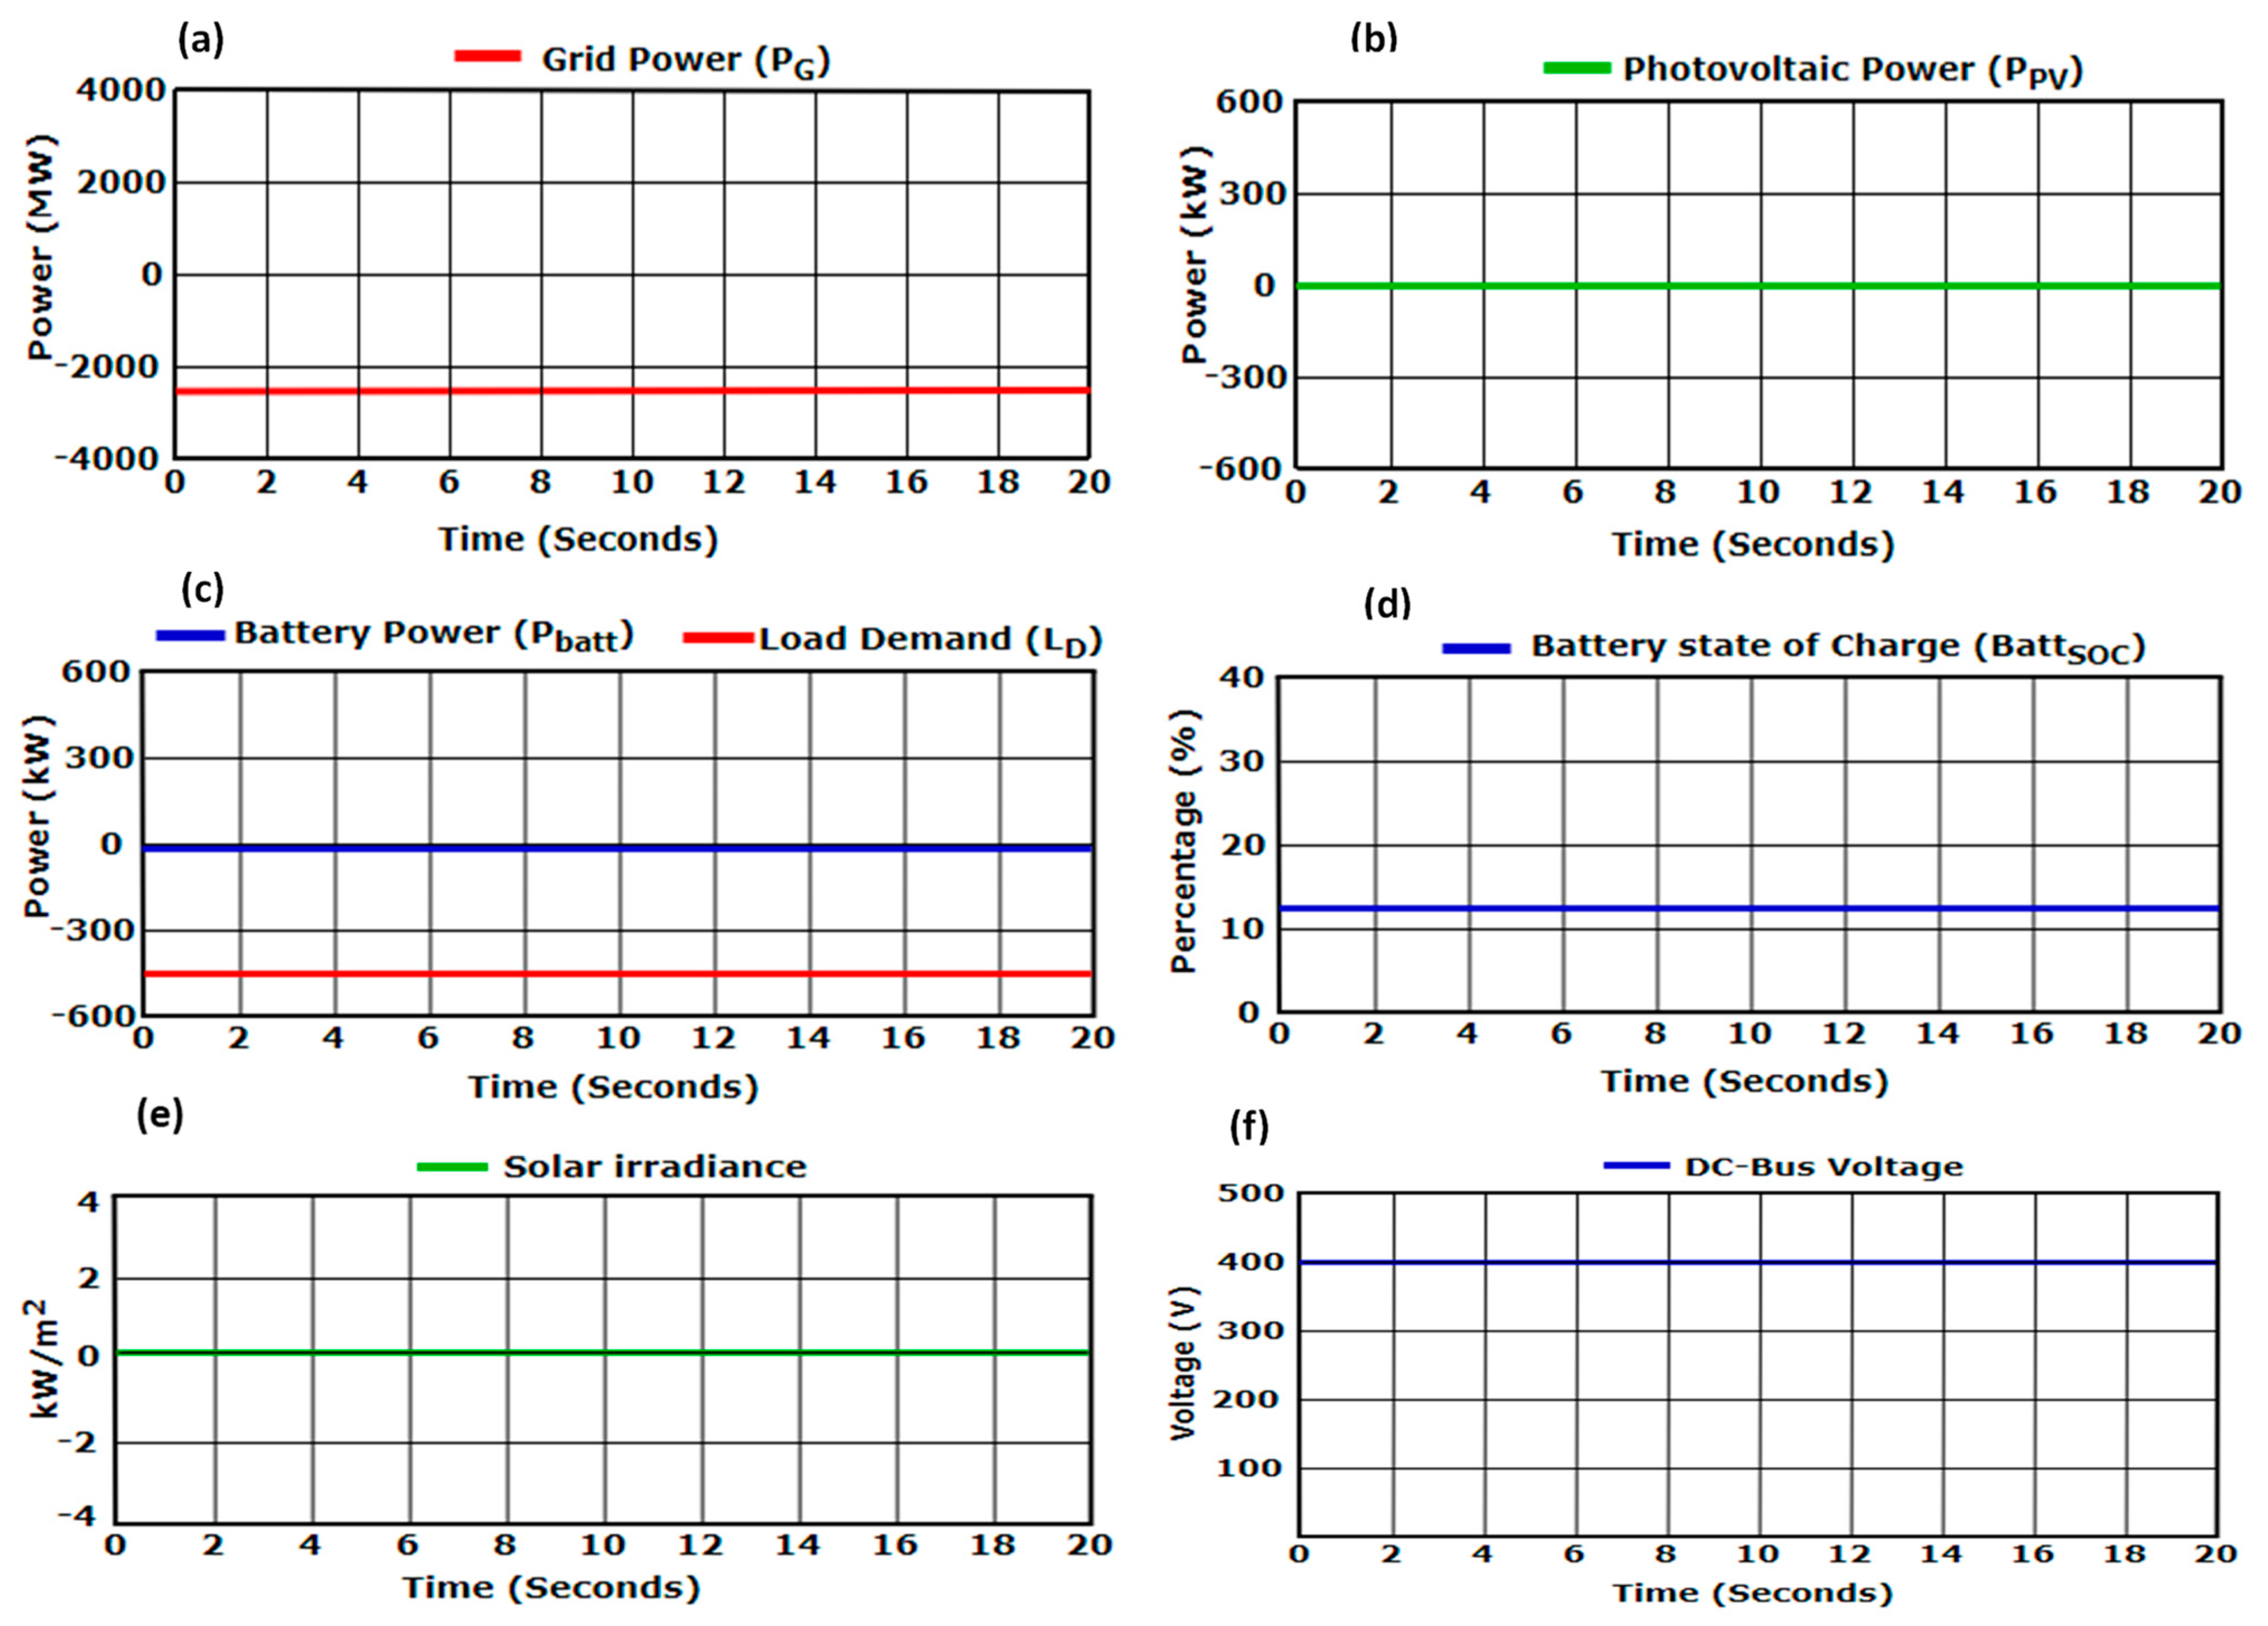
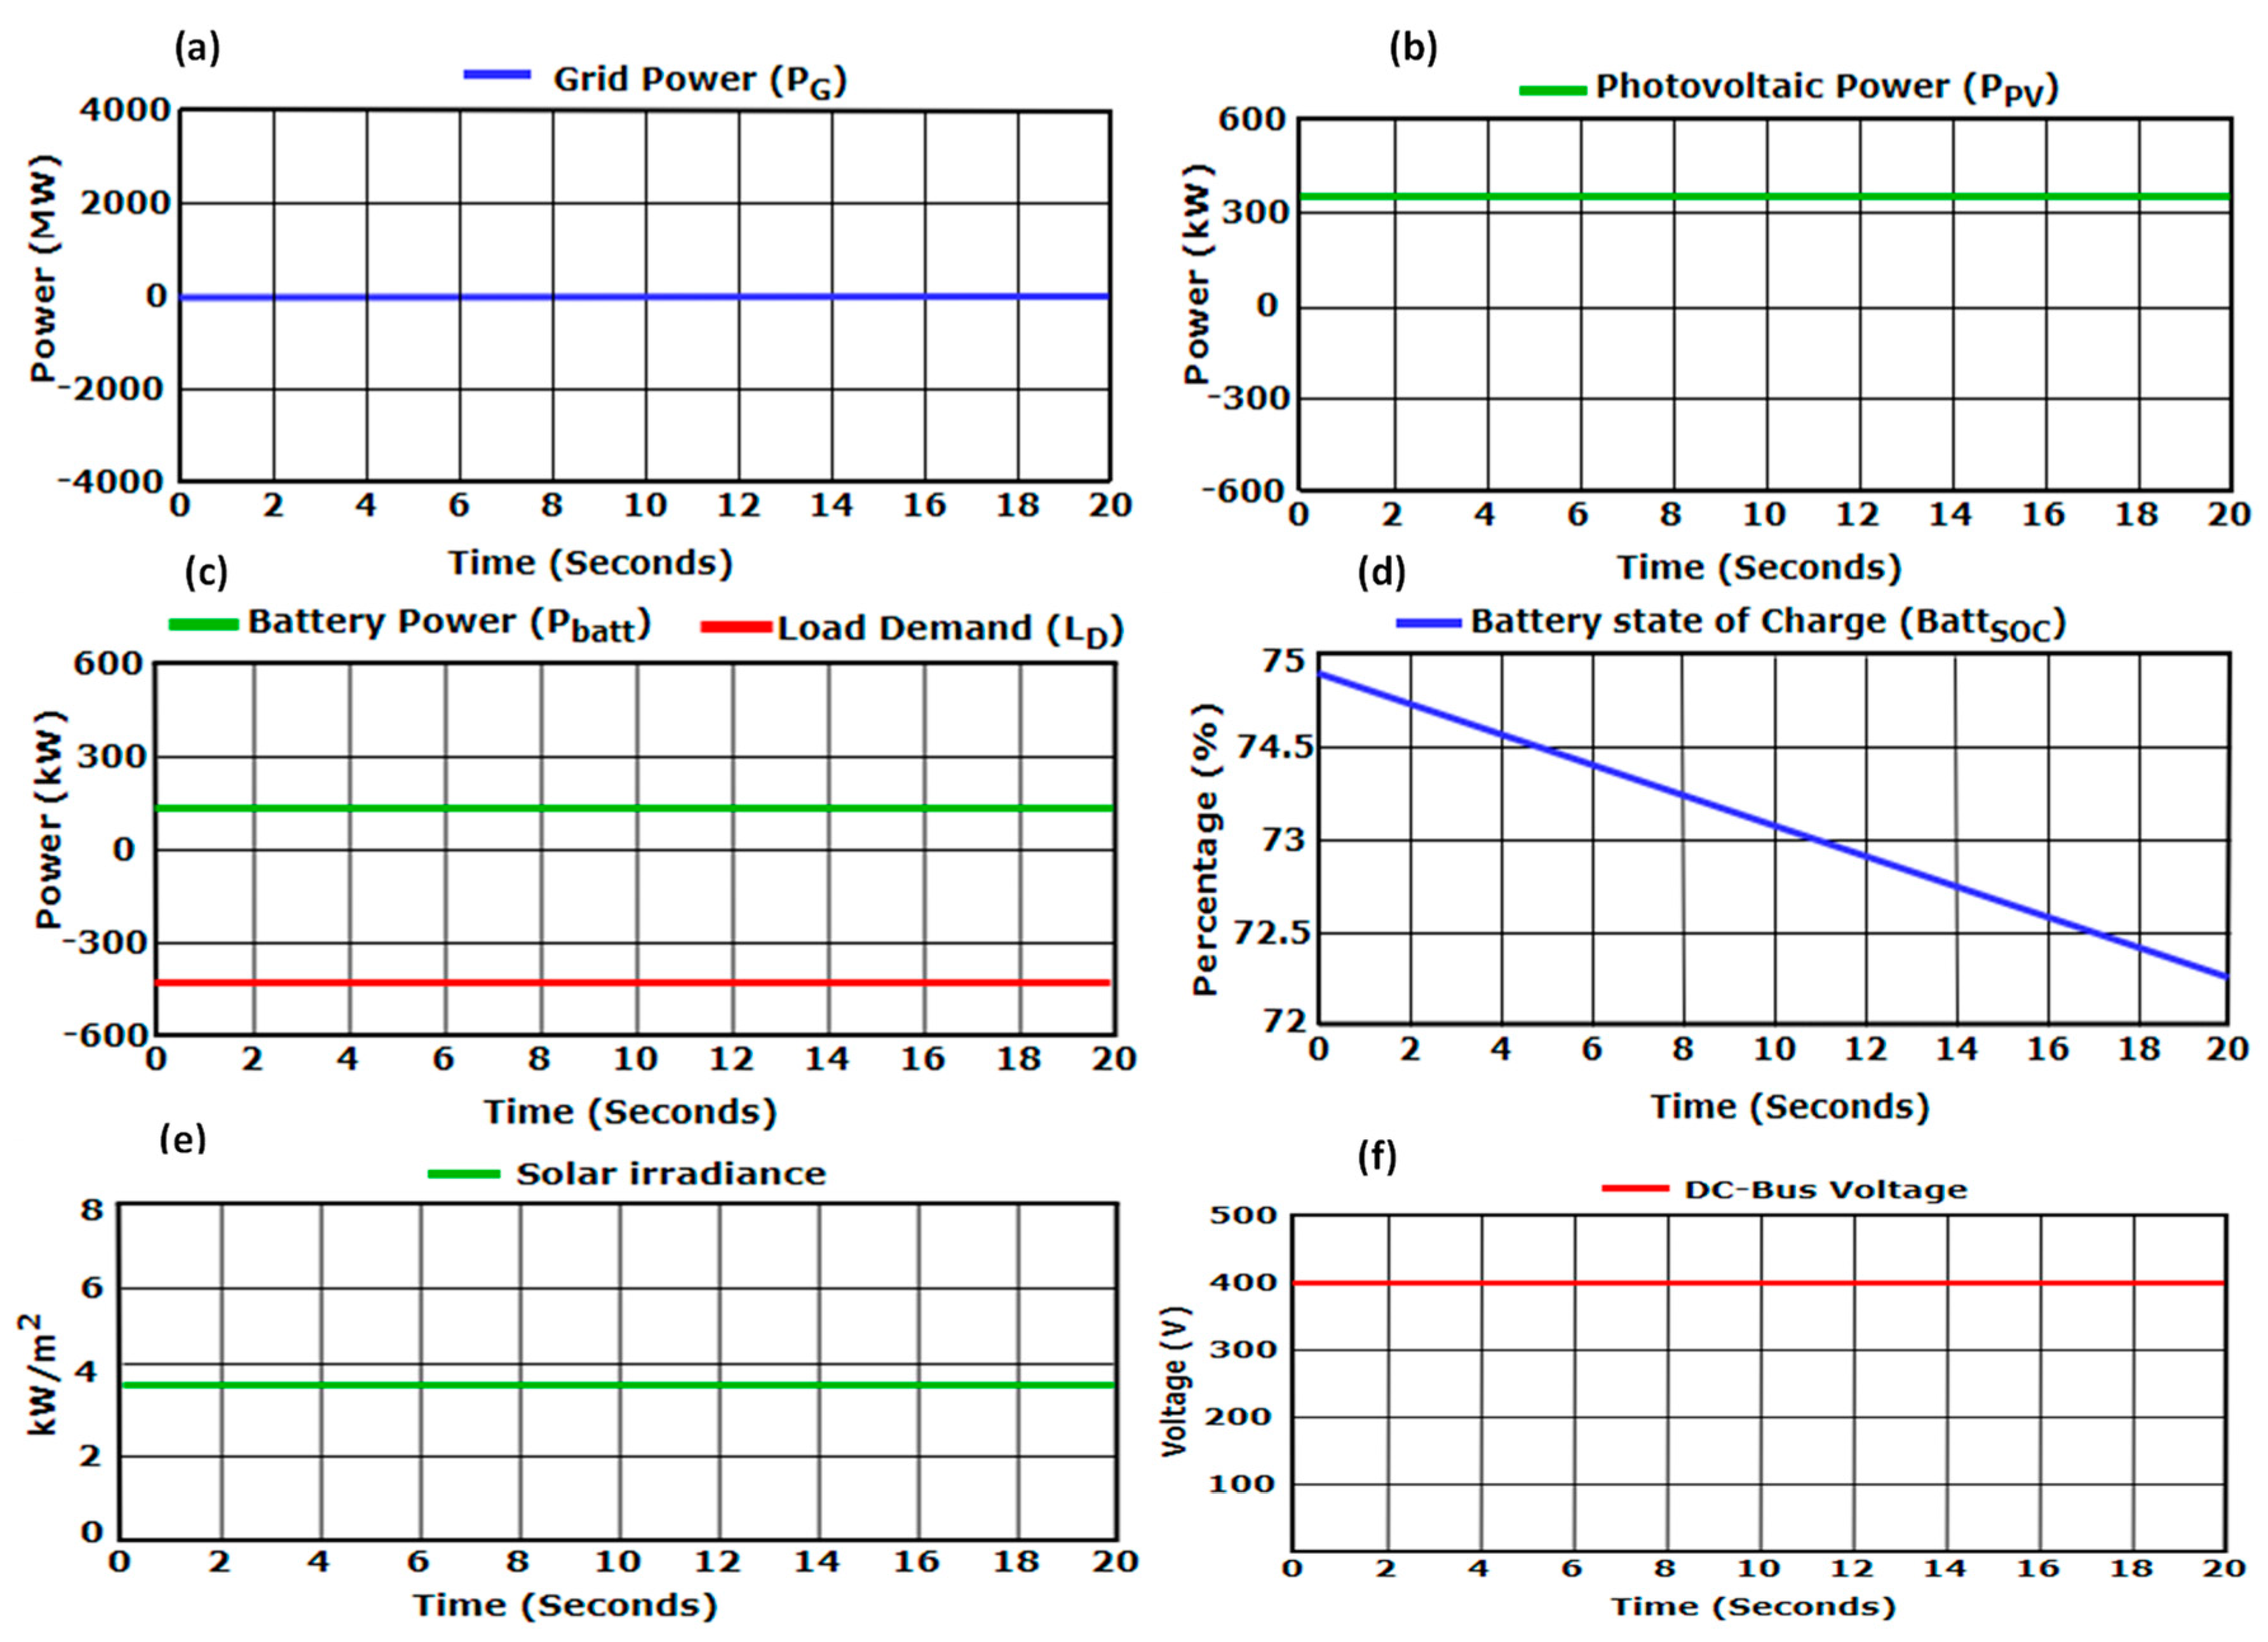
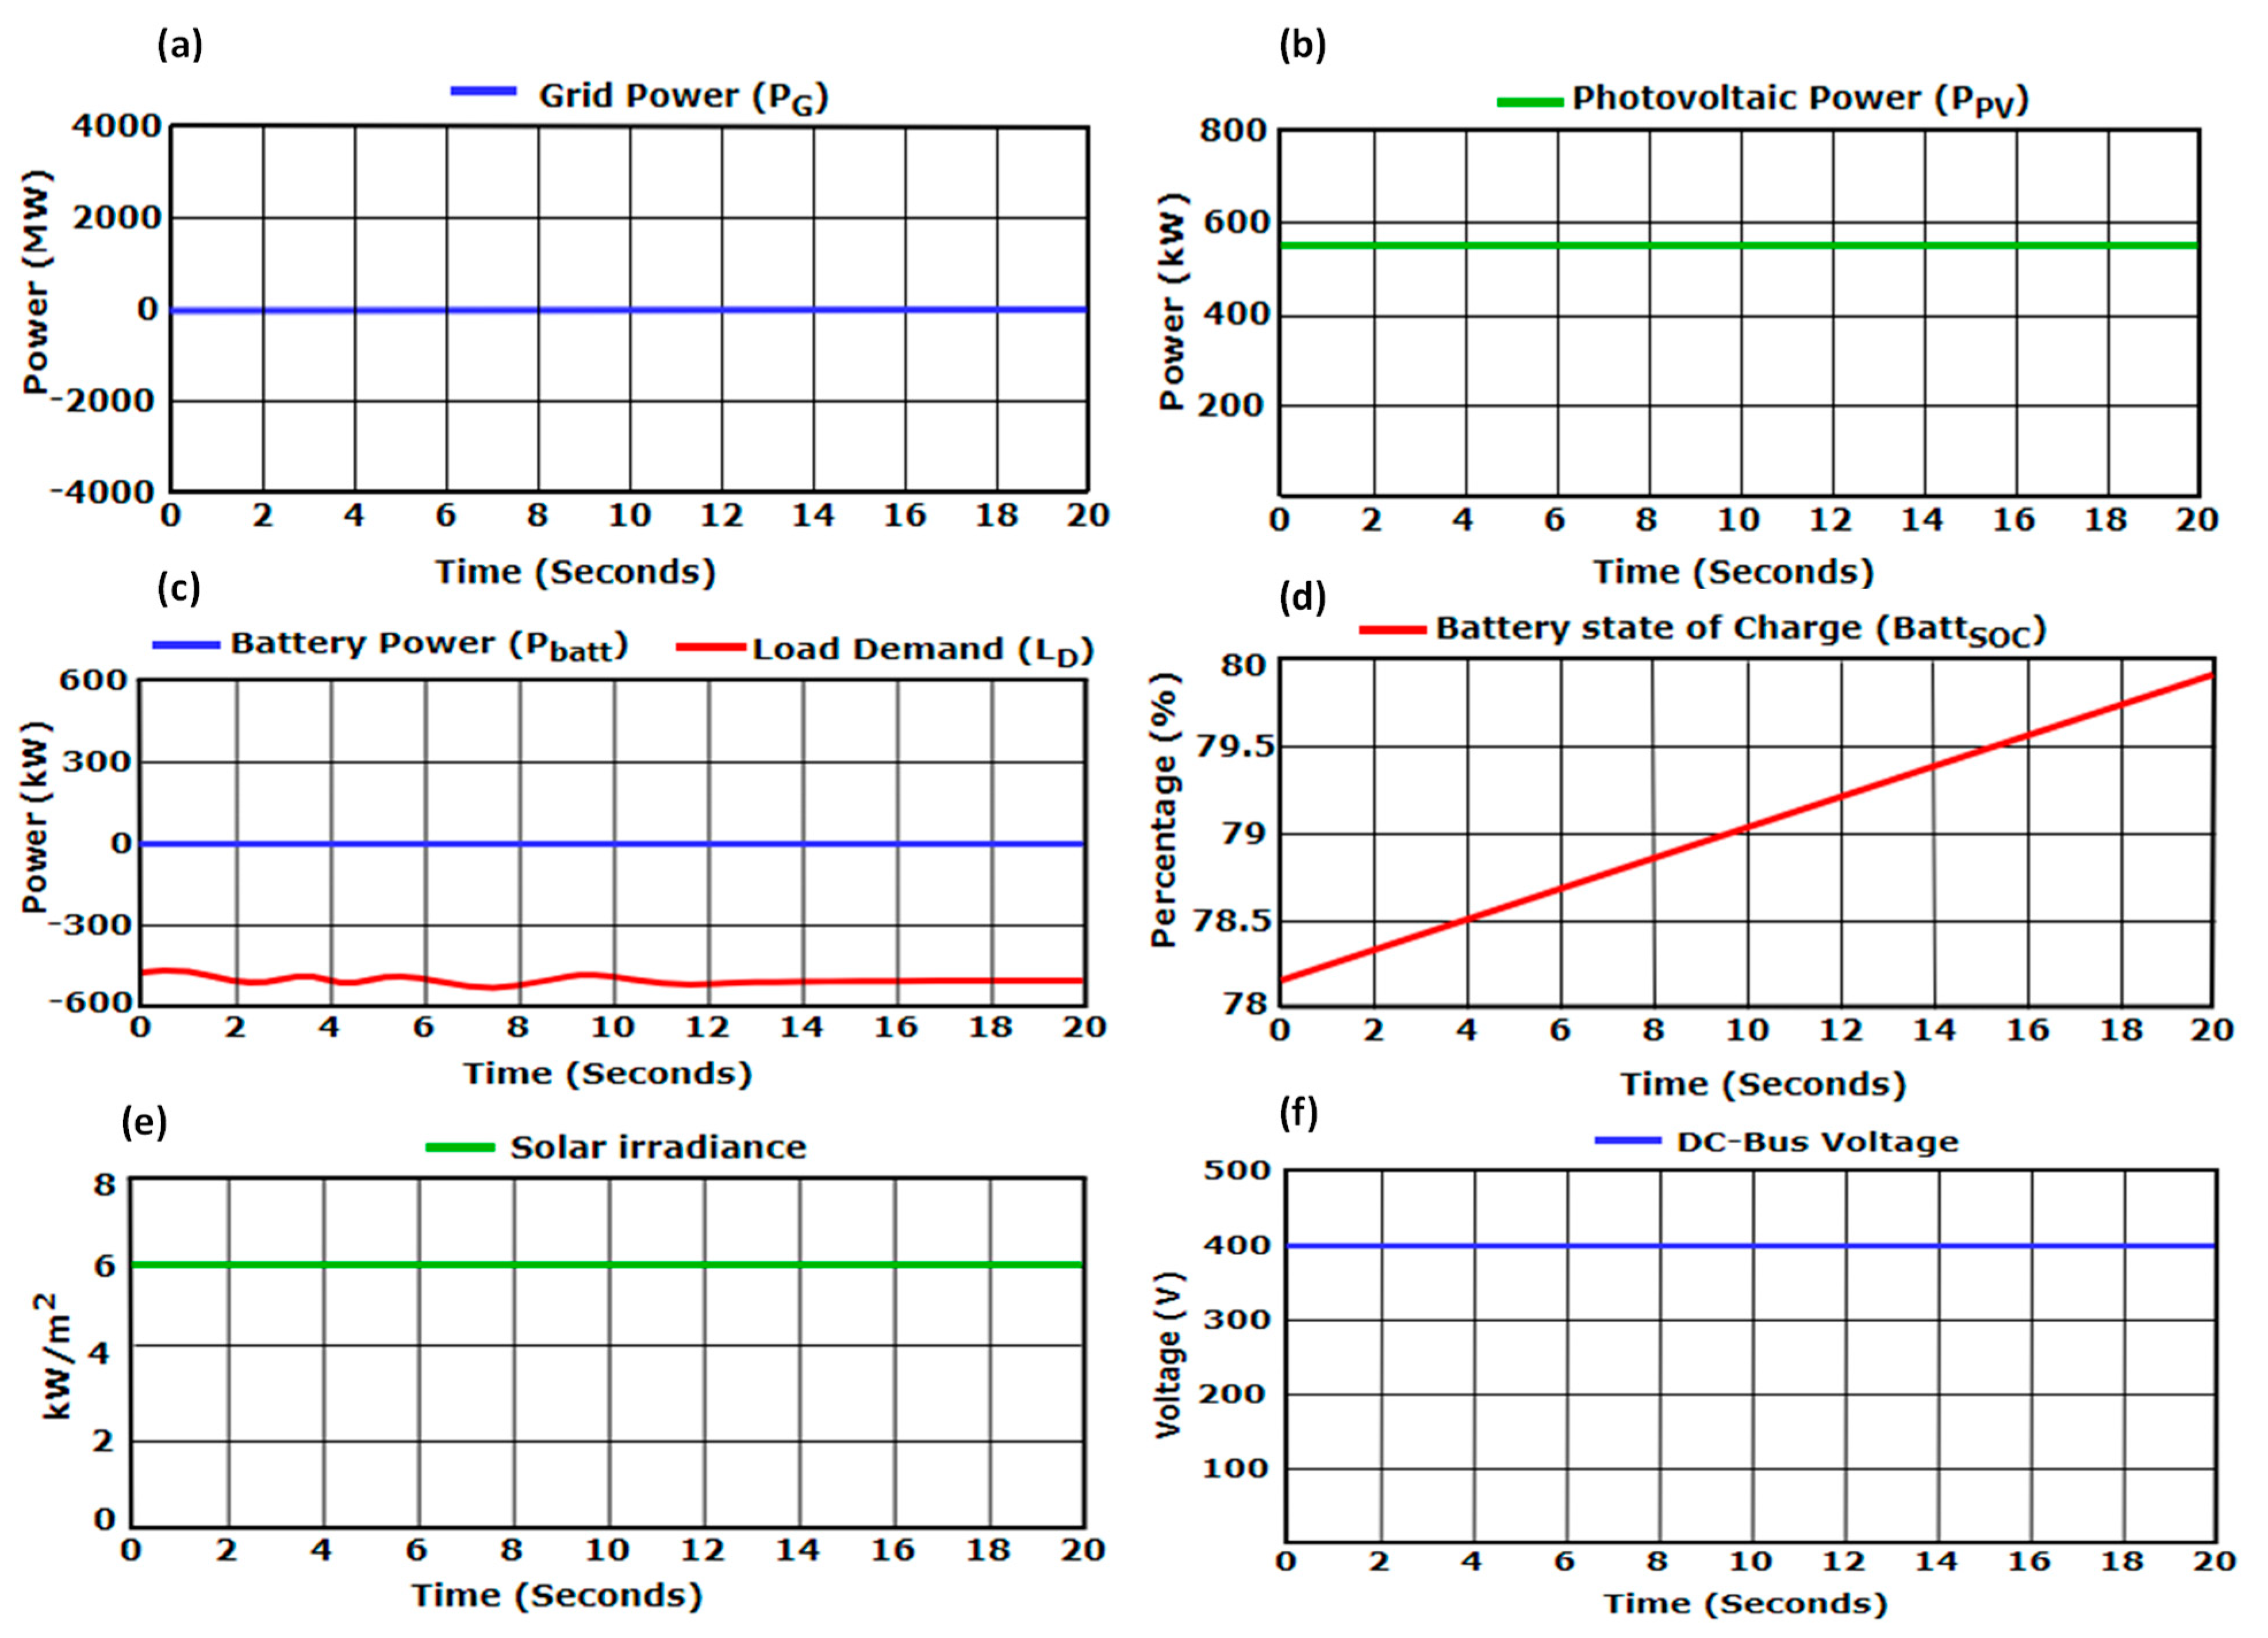
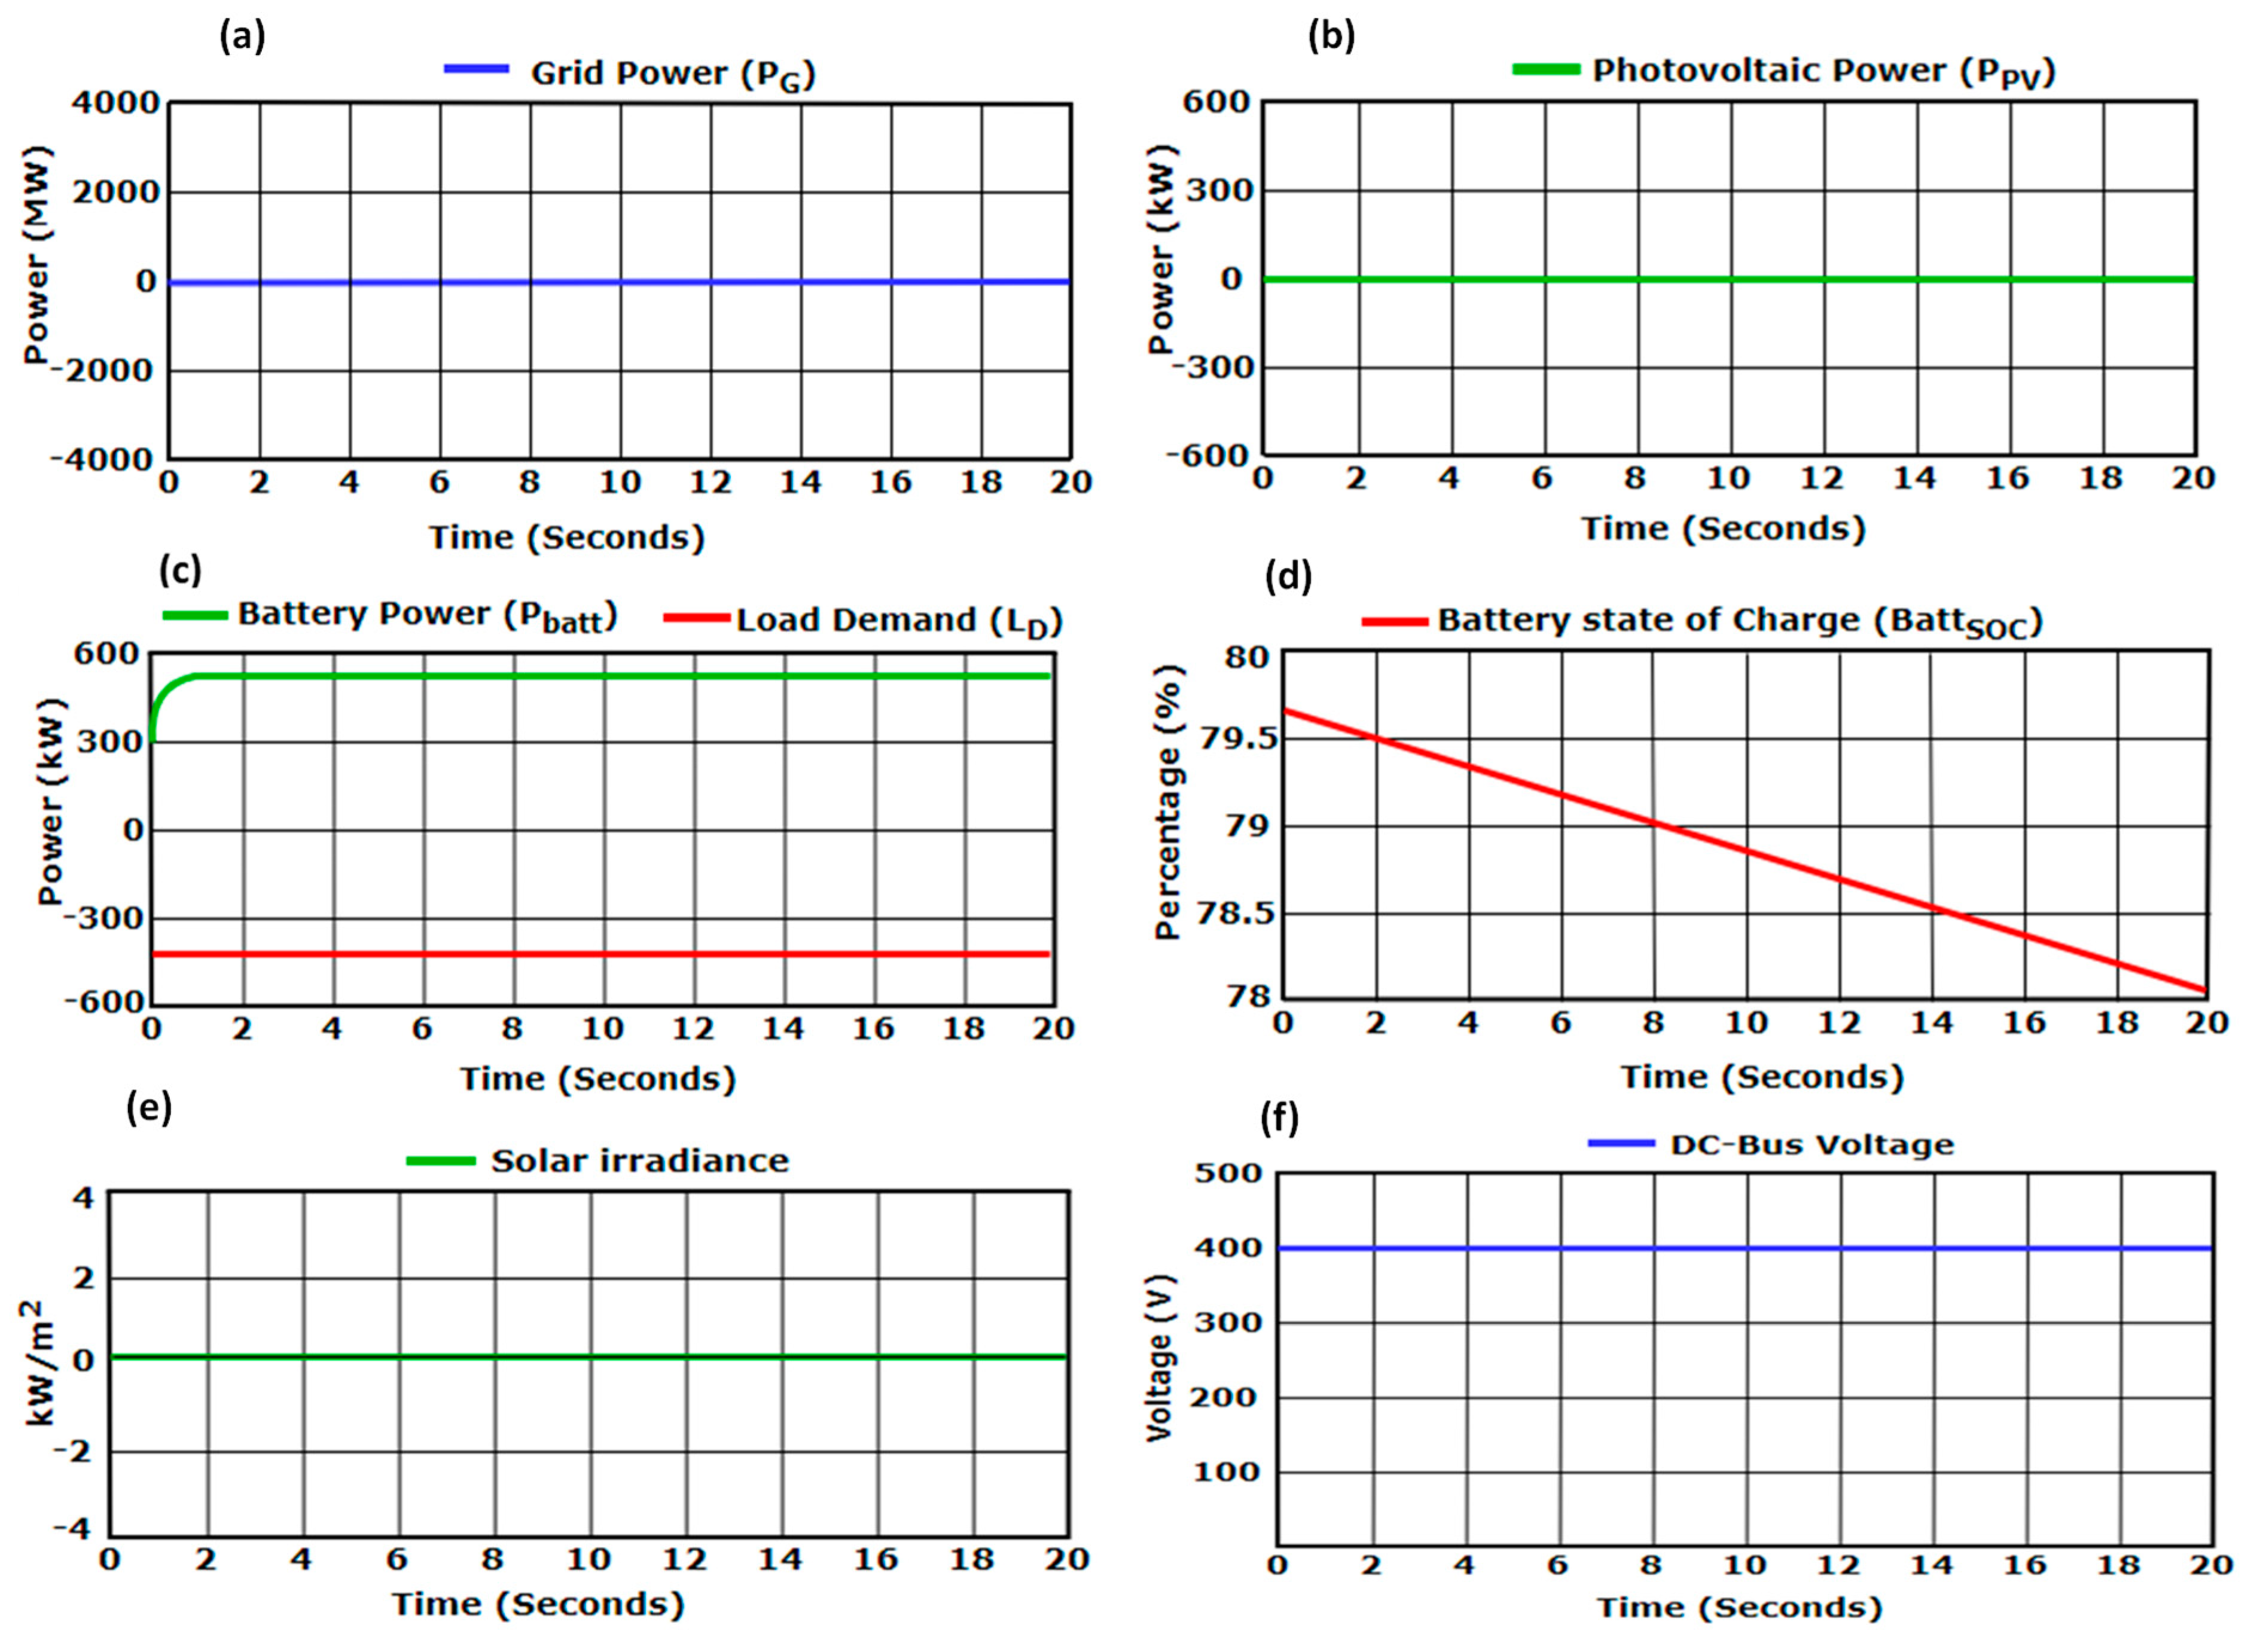
It is to be noted that solar PV exhibits positive values when supplying power to the system, while load demand values are negative when consuming power. The Li-ion battery is characterised by positive values when discharging power and negative values when charging. In contrast, the grid shows positive values when receiving power from the μG and negative values when supplying power to the system. The explanation is crucial for a detailed understanding of the power flow within the system. Furthermore, each case is evaluated with respect to the existing system (reference case) with regards to cost-effectiveness and environmental sustainability. The reference case here means when the entire load is supplied by the grid, the μG is not in operation.
5. Discussion
The case studies and associated results presented provide a comprehensive understanding of the economic and environmental impacts of integrating the μG. The system comprises a utility grid and a solar PV/Li-ion μG operated using four different case studies. When the grid is ON, the μG is disconnected, and during off-grid mode (grid power outage), the μG is connected to ensure an uninterrupted and stable power supply to the lecture halls. The economic and environmental impacts of all four cases are presented in
Table 2 to highlight the LCOE, total cost, cost savings, CO
2 emissions, and CO
2 savings for each case study, with formulae and calculations for the values provided in
Section 3. In comparing the results of the case studies, both off-grid and grid-connected modes were examined, considering factors such as peak load demand, solar irradiance, and battery state of charge.
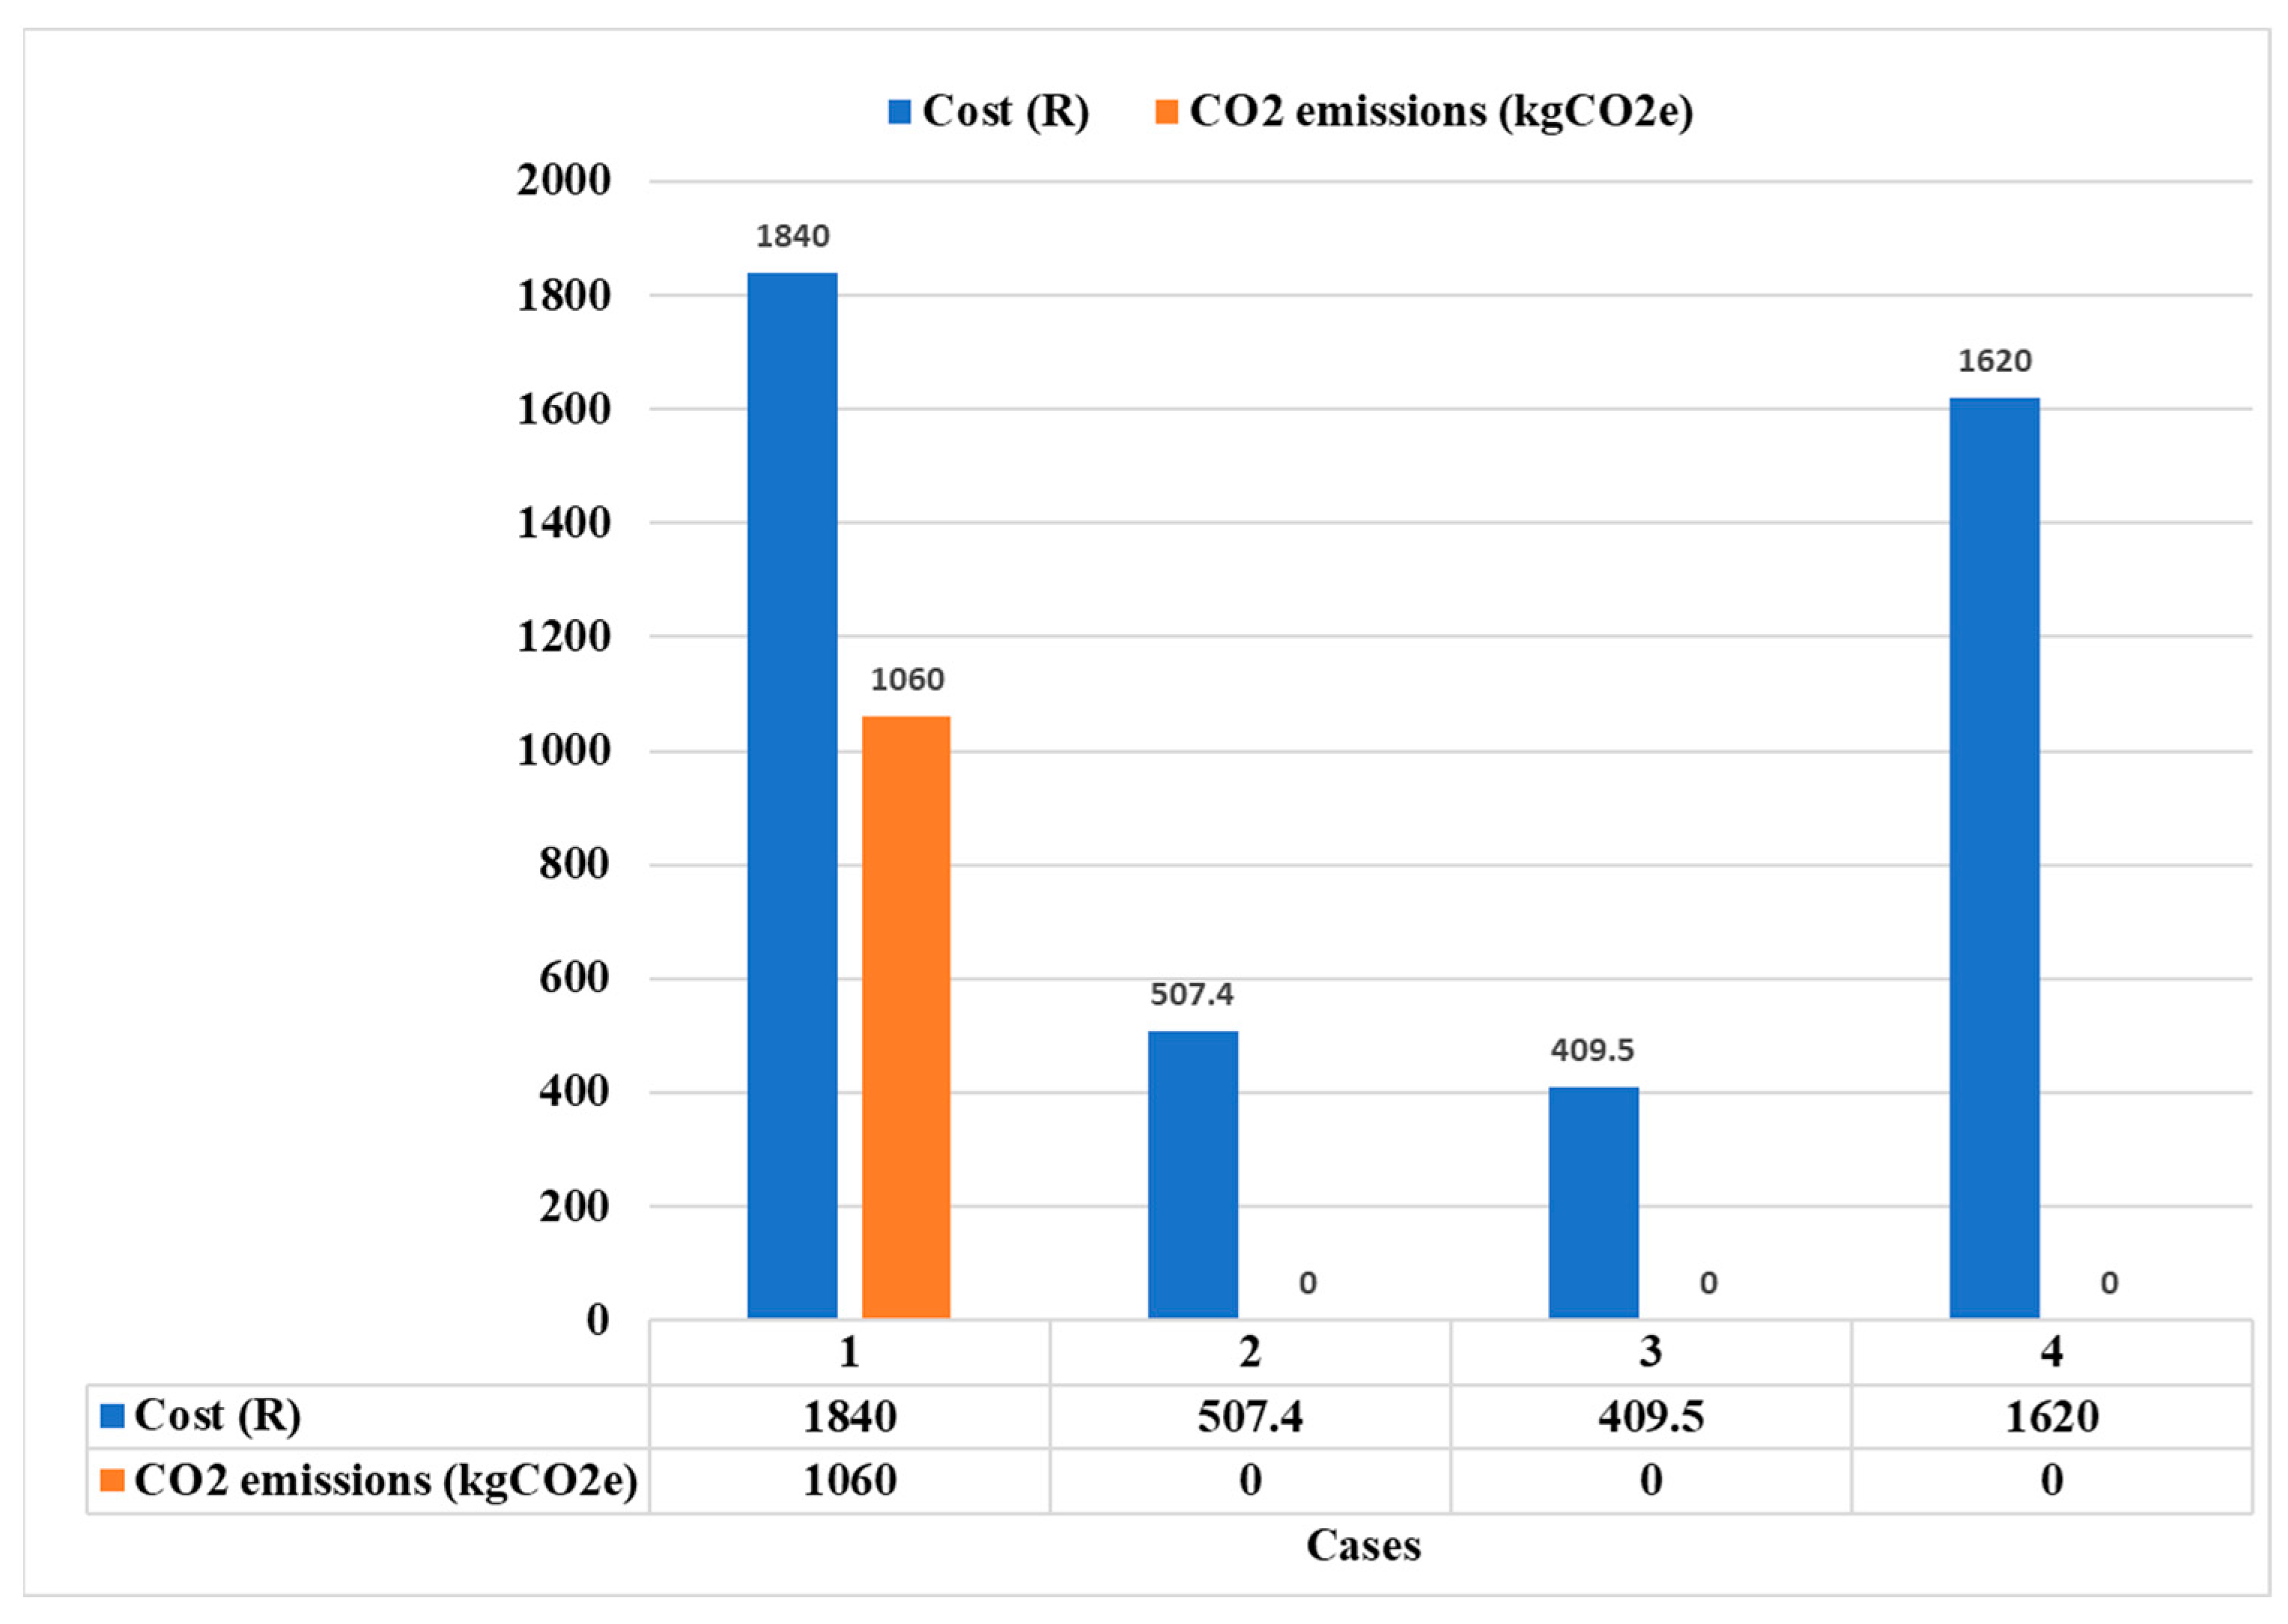
In Case 1, the grid is ON, and the μG is disconnected, resulting in a total energy cost of ZAR 1840 and CO
2 emissions of 1060 kgCO
2e. Conversely, when the grid is OFF, the μG is activated. When the available power is greater than the load demand, the excess energy is used to charge the battery, which is then discharged in the event of low solar PV power to meet the load demand, ensuring system stability. The comprehensive analysis and presentation of these case studies, as shown in
Table 2, provide a detailed understanding of the economic and environmental impact of integrating the μG, providing valuable insights into the benefits of solar PV/Li-ion μG systems for maintaining uninterrupted power supply in lecture halls at higher education institutions. Furthermore, a clear comparison of the cost and associated CO
2 emissions for each case study is shown in
Figure 17. This comparison offers valuable insights into the economic and environmental impacts of each case study, as presented in the study. Evaluating the CO
2 emissions allows decision-makers to evaluate the environmental sustainability of each case study.
The results showed that integrating the μG successfully mitigates the negative impact of grid power outages by smoothly transitioning to off-grid mode, thereby using power from both the solar PV and Li-ion battery to supply the load demand of the lecture halls. This interrupted power supply and energy security during grid power outages particularly highlight the ability of the μG to ensure a constant power supply, essential for effective academic activities and general university operations. Furthermore, simulating different case studies in both grid-connected and off-grid modes, using changing solar irradiance levels, and considering different battery SOC conditions, the study provides a detailed understanding of the performance of the system under various operational conditions. The choice of an appropriate solar PV and battery size based on the load demand and duration of grid power outage shows the rigorous task required in sizing the various components of a μG to ensure energy security and reliability. Essentially, the results highlight the need for energy security and sustainability goals of institutions of higher learning in South Africa. By adopting renewable energy-powered μGs, reducing overreliance on the grid, and mitigating CO2 emissions, this study aligns with the global effort to mitigate environmental pollution and support renewable energy-based μG systems. Furthermore, battery degradation cost and overall battery degradation significantly impact the economic assessment of batteries. These factors are determined by several variables, including depth of discharge (DOD), charge and discharge rates (C-rate), operating temperatures, battery chemistry, number of cycles, state of charge (SOC) range, calendar aging, and manufacturing quality. High DOD and C-rates, high temperatures, and low-quality manufacturing accelerate battery cell degradation, while effective SOC management and advanced thermal management systems can mitigate these effects, balancing initial and long-term costs. This work finds the annual battery degradation costs for Cases 2 and 4 are 6.08% and 14.19% of the initial cost, respectively.
In summary, this study has provided valuable information on the economic and environmental benefits of integrating solar PV/Li-ion μG systems, which can substantially enhance energy security and sustainability in institutions of higher learning. The study implemented an effective EMS that ensured continuous and stable power supply to lecture halls during grid power outages and disconnected the μG when grid power was restored. The results highlight the potential of effectively integrating solar PV/Li-ion μG into existing electricity infrastructure to improve energy security, resilience, and sustainable energy solutions for universities. Lastly, the conclusion combines the detailed literature review, summarises the results, and highlights potential future research.
6. Conclusions
This study presents a detailed design, modelling, and evaluation of a grid-connected solar PV/Li-ion battery μG system. The primary aim is to evaluate the economic and environmental impact of integrating μGs to ensure uninterrupted power supply to selected lecture halls in a university in the Western Cape, South Africa. This was achieved by using cases designed and simulated to ensure the effective integration of the μG, aimed at improving energy reliability, reducing operational costs, and mitigating CO
2 emissions. The results showed that the EMS carefully implements power distribution between the grid, solar PV, and Li-ion battery using the load demand, battery SOC, solar irradiance, and power outage. The μG system recorded a cost reduction of 51% and a decrease in greenhouse gas (GHG) emissions by 530 kgCO
2e per hour. From
Table 2, it is obvious that Case 3 is the most cost-effective, achieving a 51% reduction in cost while having zero environmental impact. The μG ensured uninterrupted and stable power supply to the lecture halls, enhanced energy reliability, and created a conducive learning environment. By reducing overreliance on the grid and mitigating CO
2 emissions, the study promotes environmental sustainability. Additionally, the μG enhanced the resilience of the energy infrastructure of the university by maintaining continuous academic activities even during grid power outages. Integrating solar PV/Li-ion-powered μG systems in the university creates a conducive learning environment for students and staff members, promoting innovation and creativity in sustainable energy technologies. These results contribute to the operational efficiency of the university’s electricity infrastructure and energy security while setting a foundation for other higher institutions to integrate renewable energy-powered μGs. This study will significantly advance sustainable and energy-reliable university lecture halls and support higher institutions in the Western Cape and South Africa in achieving their environmental sustainability goals of zero emissions.
This study also paves the way for future research in two possible areas, as described here; one is related to extending the work for different types of university buildings, and the other to identifying factors that could impact the practical implementation of such systems.
University lecture halls, student residences, and staff offices have different energy consumption patterns and needs. University lecture halls experience variable energy consumption determined by class timetables and university calendars, with peak demand during the day for lighting, audio–visual equipment, and HVAC systems, and are typically unoccupied during off-hours, weekends, and holidays. Student residences use more energy in the mornings and evenings due to personal electronics, heating/cooling systems, and kitchen appliances, with high and continuous occupancy. Staff offices, on the other hand, have peak energy consumption during weekday working hours, with regular use of computers, lighting, and HVAC systems, and less occupancy during evenings and weekends. Understanding these differences is crucial for designing an effective μG system.
Additionally, while the theoretical model shows substantial economic and environmental benefits, practical implementation may encounter challenges such as weather variability, system inefficiencies, battery performance degradation, maintenance and operational issues, grid interaction difficulties, economic factors, installation and site-specific restrictions (e.g., heritage buildings), load variability, integration complexities, and human factors. To achieve optimal performance and sustainability in real-world applications, these practical challenges must be considered when installing μG systems.
Future studies should address these difficulties to enhance the practicality and reliability of μG systems in higher institutions. This includes investigating the integration of more renewable energy sources and ESSs, perhaps expanding the scope to include student residences, staff offices, and possibly the entire university campus. Furthermore, future studies might focus on the actual implementation of the obtained results to address practical difficulties that may arise. Battery degradation cost affects the economic feasibility and operational efficiency of microgrid systems, influencing decisions on maintenance plans, replacement strategies, and entire system reliability and performance. Therefore, integrating a detailed battery degradation model into future work will accurately assess and manage the economic impact of these costs on the entire system.
