Article

Electrical Vehicle Smart Charging Using the Open Charge Point Interface (OCPI) Protocol

by
Sylvain Guillemin
*,
Romain Choulet
,
Gregory Guyot
and
Sothun Hing
Univ. Grenoble Alpes, CEA, Liten, Campus Ines, 73375 Le Bourget du Lac, France
*
Author to whom correspondence should be addressed.
Energies 2024, 17(12), 2873; https://doi.org/10.3390/en17122873
Submission received: 25 March 2024 / Revised: 2 May 2024 / Accepted: 15 May 2024 / Published: 12 June 2024

Abstract

:
This paper proposes a new approach to the design of smart charging systems. It aims to separate the role of the Smart Charging Service Provider (SCSP) from the role of the Charge Point Operator (CPO) to provide real flexibility and efficiency of mass deployment. As interoperability is required for this purpose, the challenge is to use standard equipment and protocols in the design of the smart charging Energy Management System (EMS). The use of an Open Charge Point Interface (OCPI) is crucial for an interface between the EMS and the Charge Point Operator. The smart charging EMS developed has been implemented and successfully tested with two CPOs, with different use cases: (1) EV charging infrastructure at office buildings, and (2) EV charging infrastructure installed at a public car park facility.

1. Introduction

Electric Vehicles (EVs) will continue to be deployed on a large scale around the world over the coming decades in order to reduce emissions caused by fossil-fuel-powered vehicles and to ensure the transition to a more renewable transport sector. The global EV market is expected to reach over one billion EVs by 2050 [1]. This projection poses three main challenges: the accessibility of charging for EV users, the availability of electric grid capacity to support the charging of electric vehicles, and the use of EV batteries as a source of flexibility for grid services [2]. To avoid a systematic reinforcement of the electricity grid due to the enormous power demand of EVs, several studies have been carried out in recent years on smart charging to manage the charging infrastructure for electric vehicles [1,3,4,5,6,7,8,9]. With smart charging management, EVs can be charged outside electricity market restrictions, so that local or global electricity markets and grids become more stable. The charge can be transferred as and when required, according to the user’s preferences, namely, their departure time and loading level. In a nutshell, smart charging avoids high power peak demand at the local grid, enabling significant cost reductions for the electricity contract. It may prioritize the local Renewable Energy Source (RES) for EV charging, with the objective of maximizing the self-production ratio and reducing CO2 emission, or may even be directly driven by the carbon emission market, as illustrated in [10].
The majority of studies present smart charging solutions integrated in the back-end of the Charging Point Operator (CPO) using the Open Charge Point Protocol (OCPP). In [5], the smart charging system is designed with four main functional components and directly incorporated in the CPO OCPP back-end. Smart charging is deployed in a real environment at SAP Labs France in Mougins to manage the enterprise EV fleets. References [10,11] propose an extension of the OCPP standard. This aims to include the user’s advance reservation in the charging optimization process and enable the optimization of power grid management, considering the user requests and constraints. As the above studies show, the smart charging solution is directly incorporated into the CPO back-end. It appears to be less flexible in terms of deployment, since each CPO has its own specific development using its private and closed OCPP back-end.
Our work proposes an approach to the design and implementation of a smart charging solution using an interoperability protocol. This design considers a Smart Charging Service Provider (SCSP) as an independent provider. It can interface with any CPO through a standard protocol. In our case, the protocol is the Open Charge Point Interface (OCPI). Our approach clearly defines the CPO’s responsibilities, the main purpose of which is to manage the charging infrastructure, and provides an implementation and testing flexibility by allowing the performances of smart charging solutions from different SCSP vendors to be evaluated before a large-scale deployment.
The remainder of the paper is organized as follows. Section 2 describes the new approach of smart charging solution architecture, including several factors such as e-Mobility Service Provider (eMSP), CPO and SCSP, and design. Section 3 presents the experimental setup of EV charging infrastructure located in office buildings at CEA-INES facilities, and the results that were obtained. Section 4 describes the potential benefits of our proposed solution. Finally, Section 5 presents the conclusions of this work.
This work has been conducted and founded by the eCharge4Drivers EU project.

2. Materials and Methods

2.1. Solution Architecture

The OCPI 2.2 specifications describe a communication architecture in which Smart Charging features and responsibilities can be delegated to a specific actor called the SCSP. In those specifications, the representation in Figure 1 is proposed.
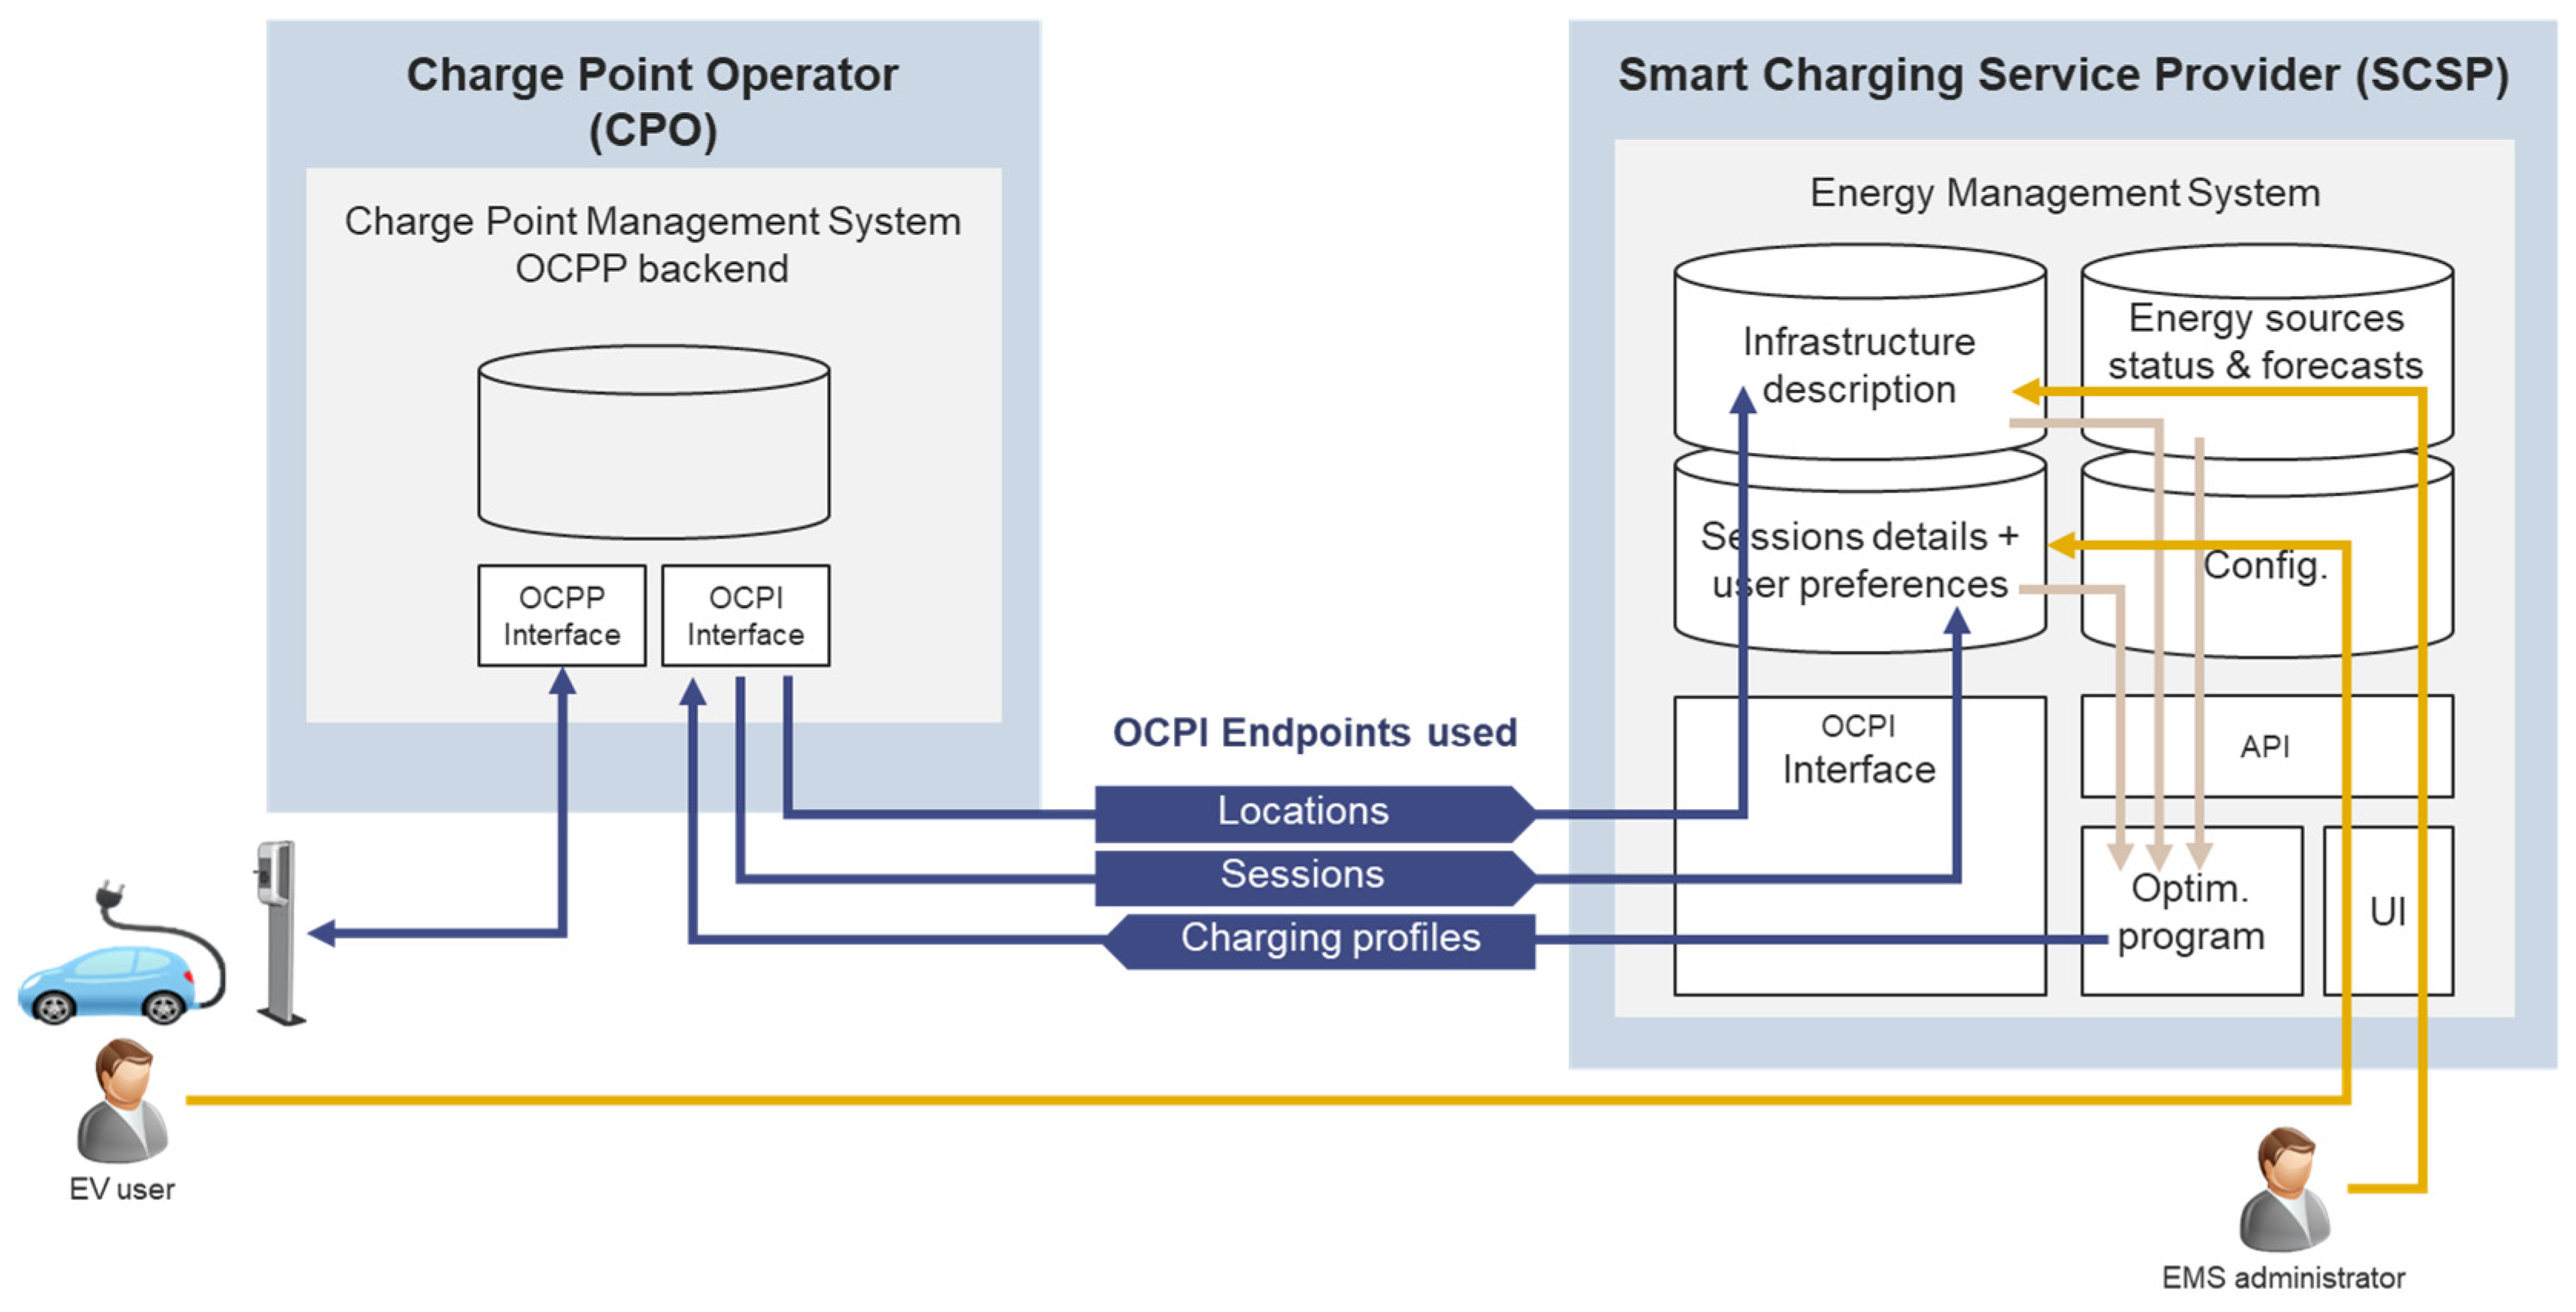
It is this architecture that we chose when implementing our EV Smart Charging solution. Figure 2, below, gives some more details about that architecture, naming the various information systems that exchange data through OCPI and listing the endpoints involved in these communications.
The CPO information system is called the “ChargePoint Management System” or CMS, or often OCPP back-end. The eMSP information system is called the “User Management System” or UMS. The SCSP information system is called the “Energy Management System” or EMS.
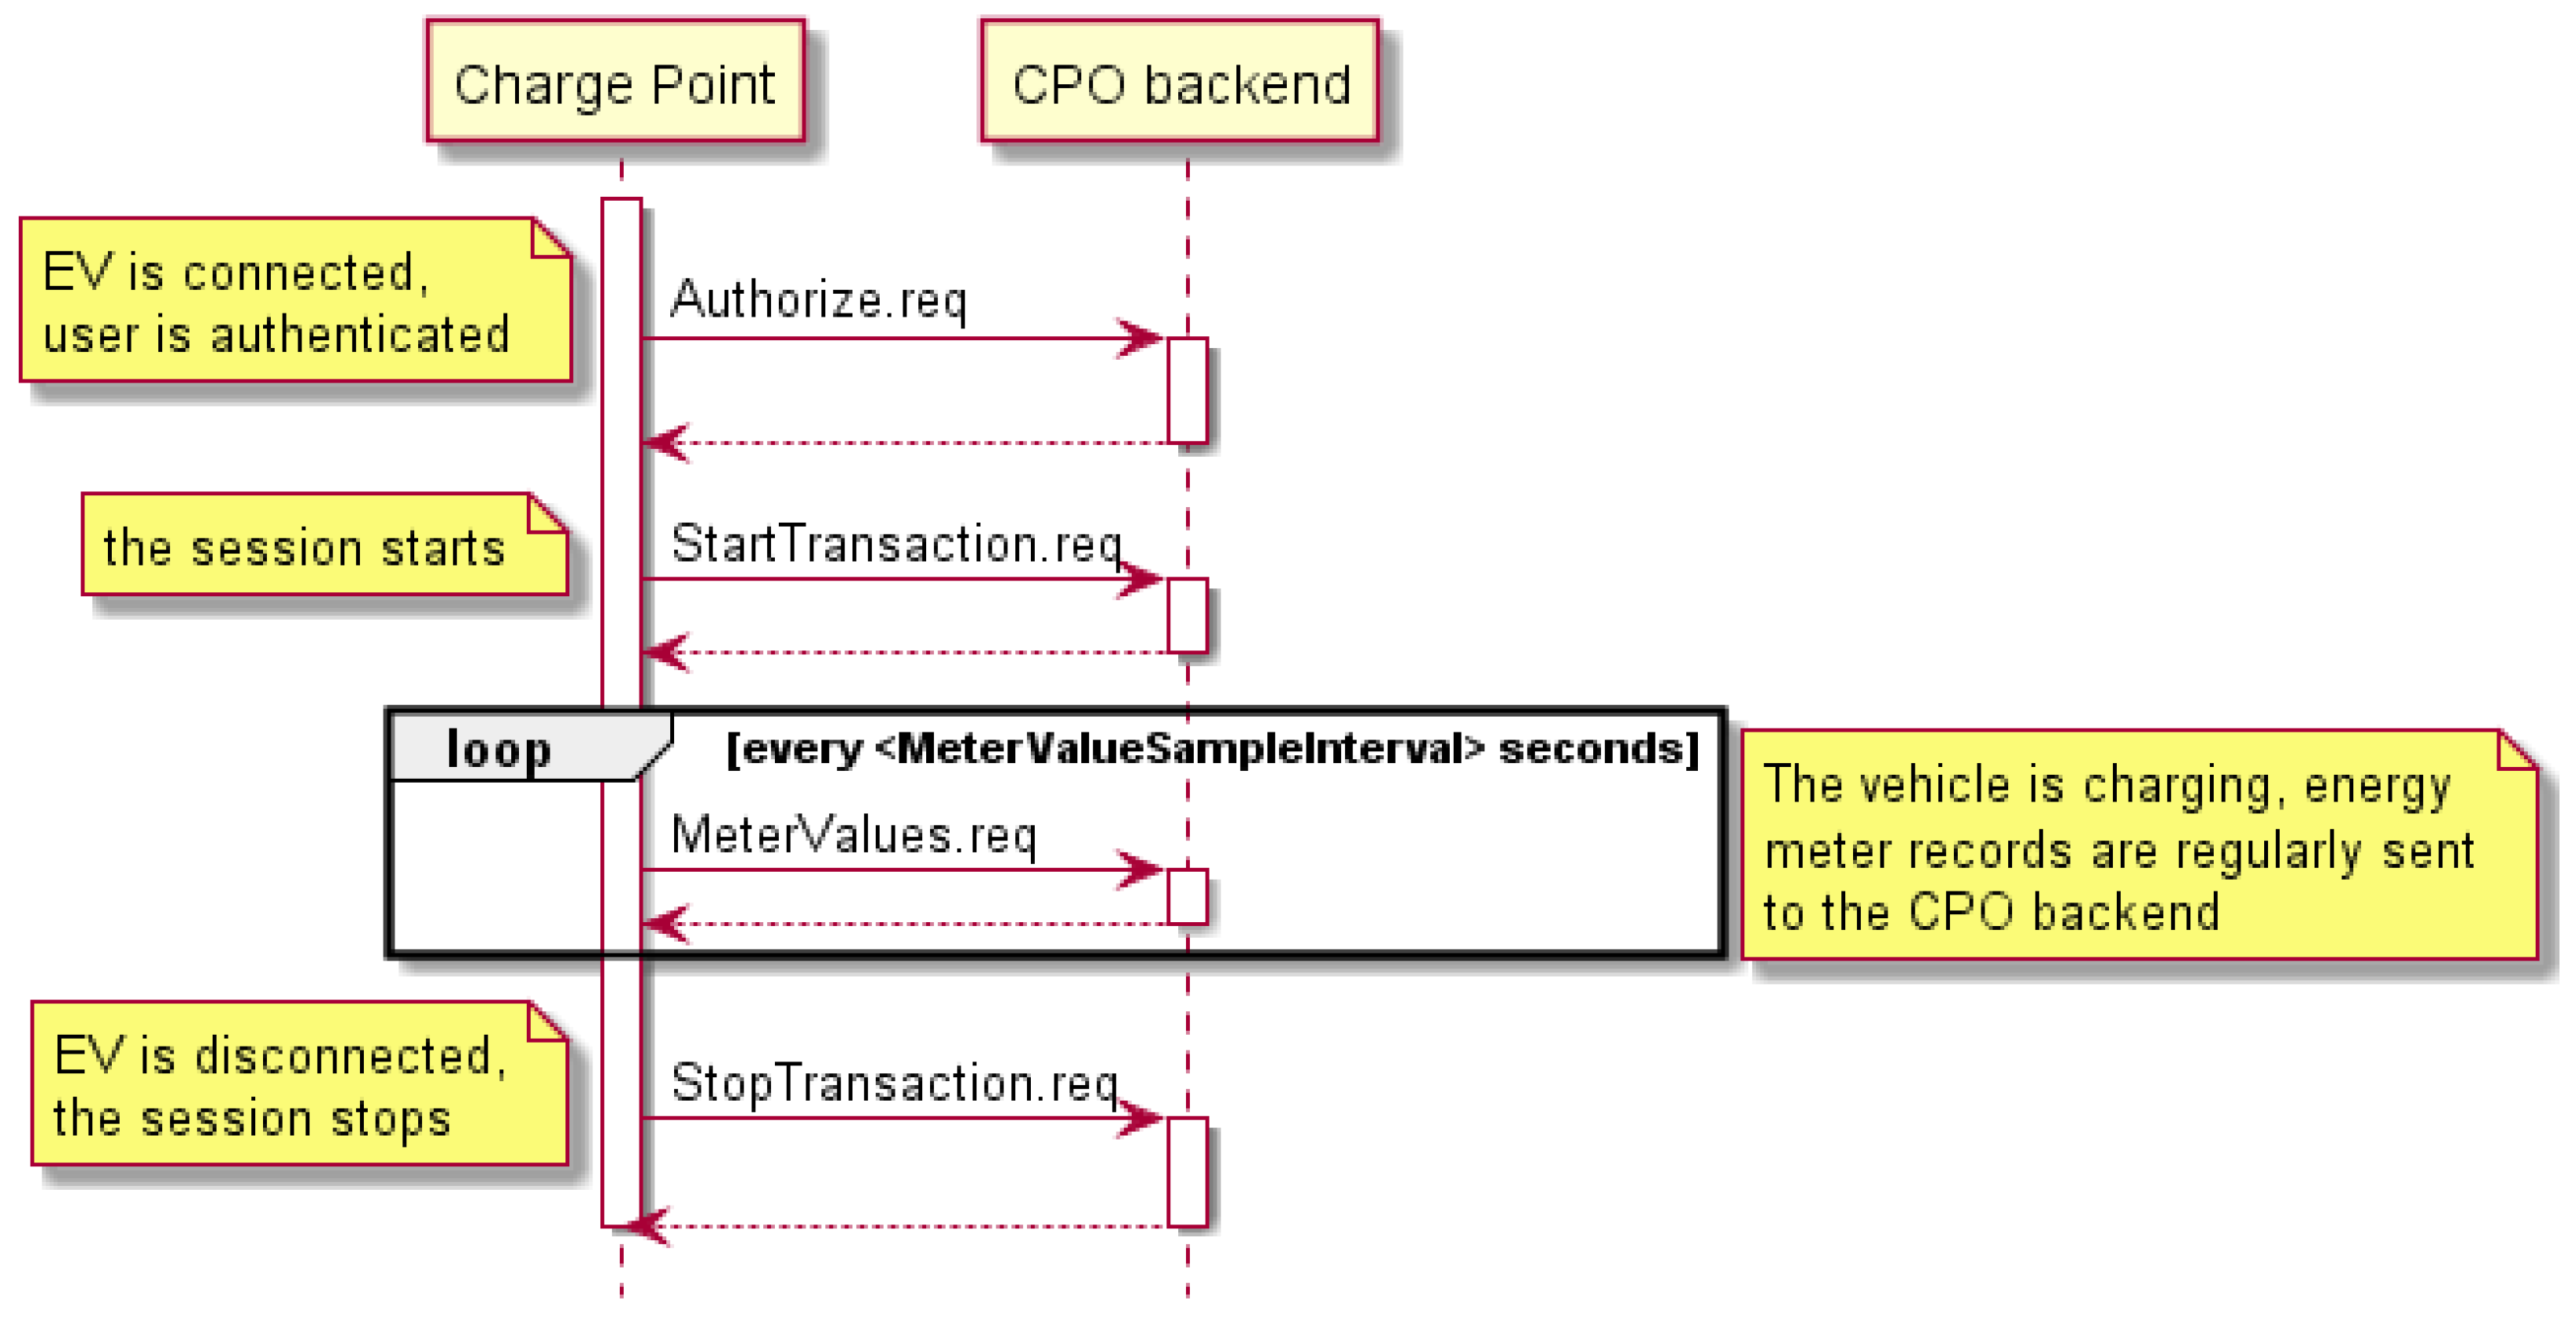
The charging stations communicate with the CPO back-end using OCPP. In a typical session, when an EV arrives, the charging station checks that its user is allowed to charge (Authorize message), and then informs the CPO back-end that the session has started (StartTransaction message), regularly communicates about the energy consumption (MeterValues message) and finally notifies when the user has disconnected his vehicle (StopTransaction message). These data exchanges are shown in Figure 3.
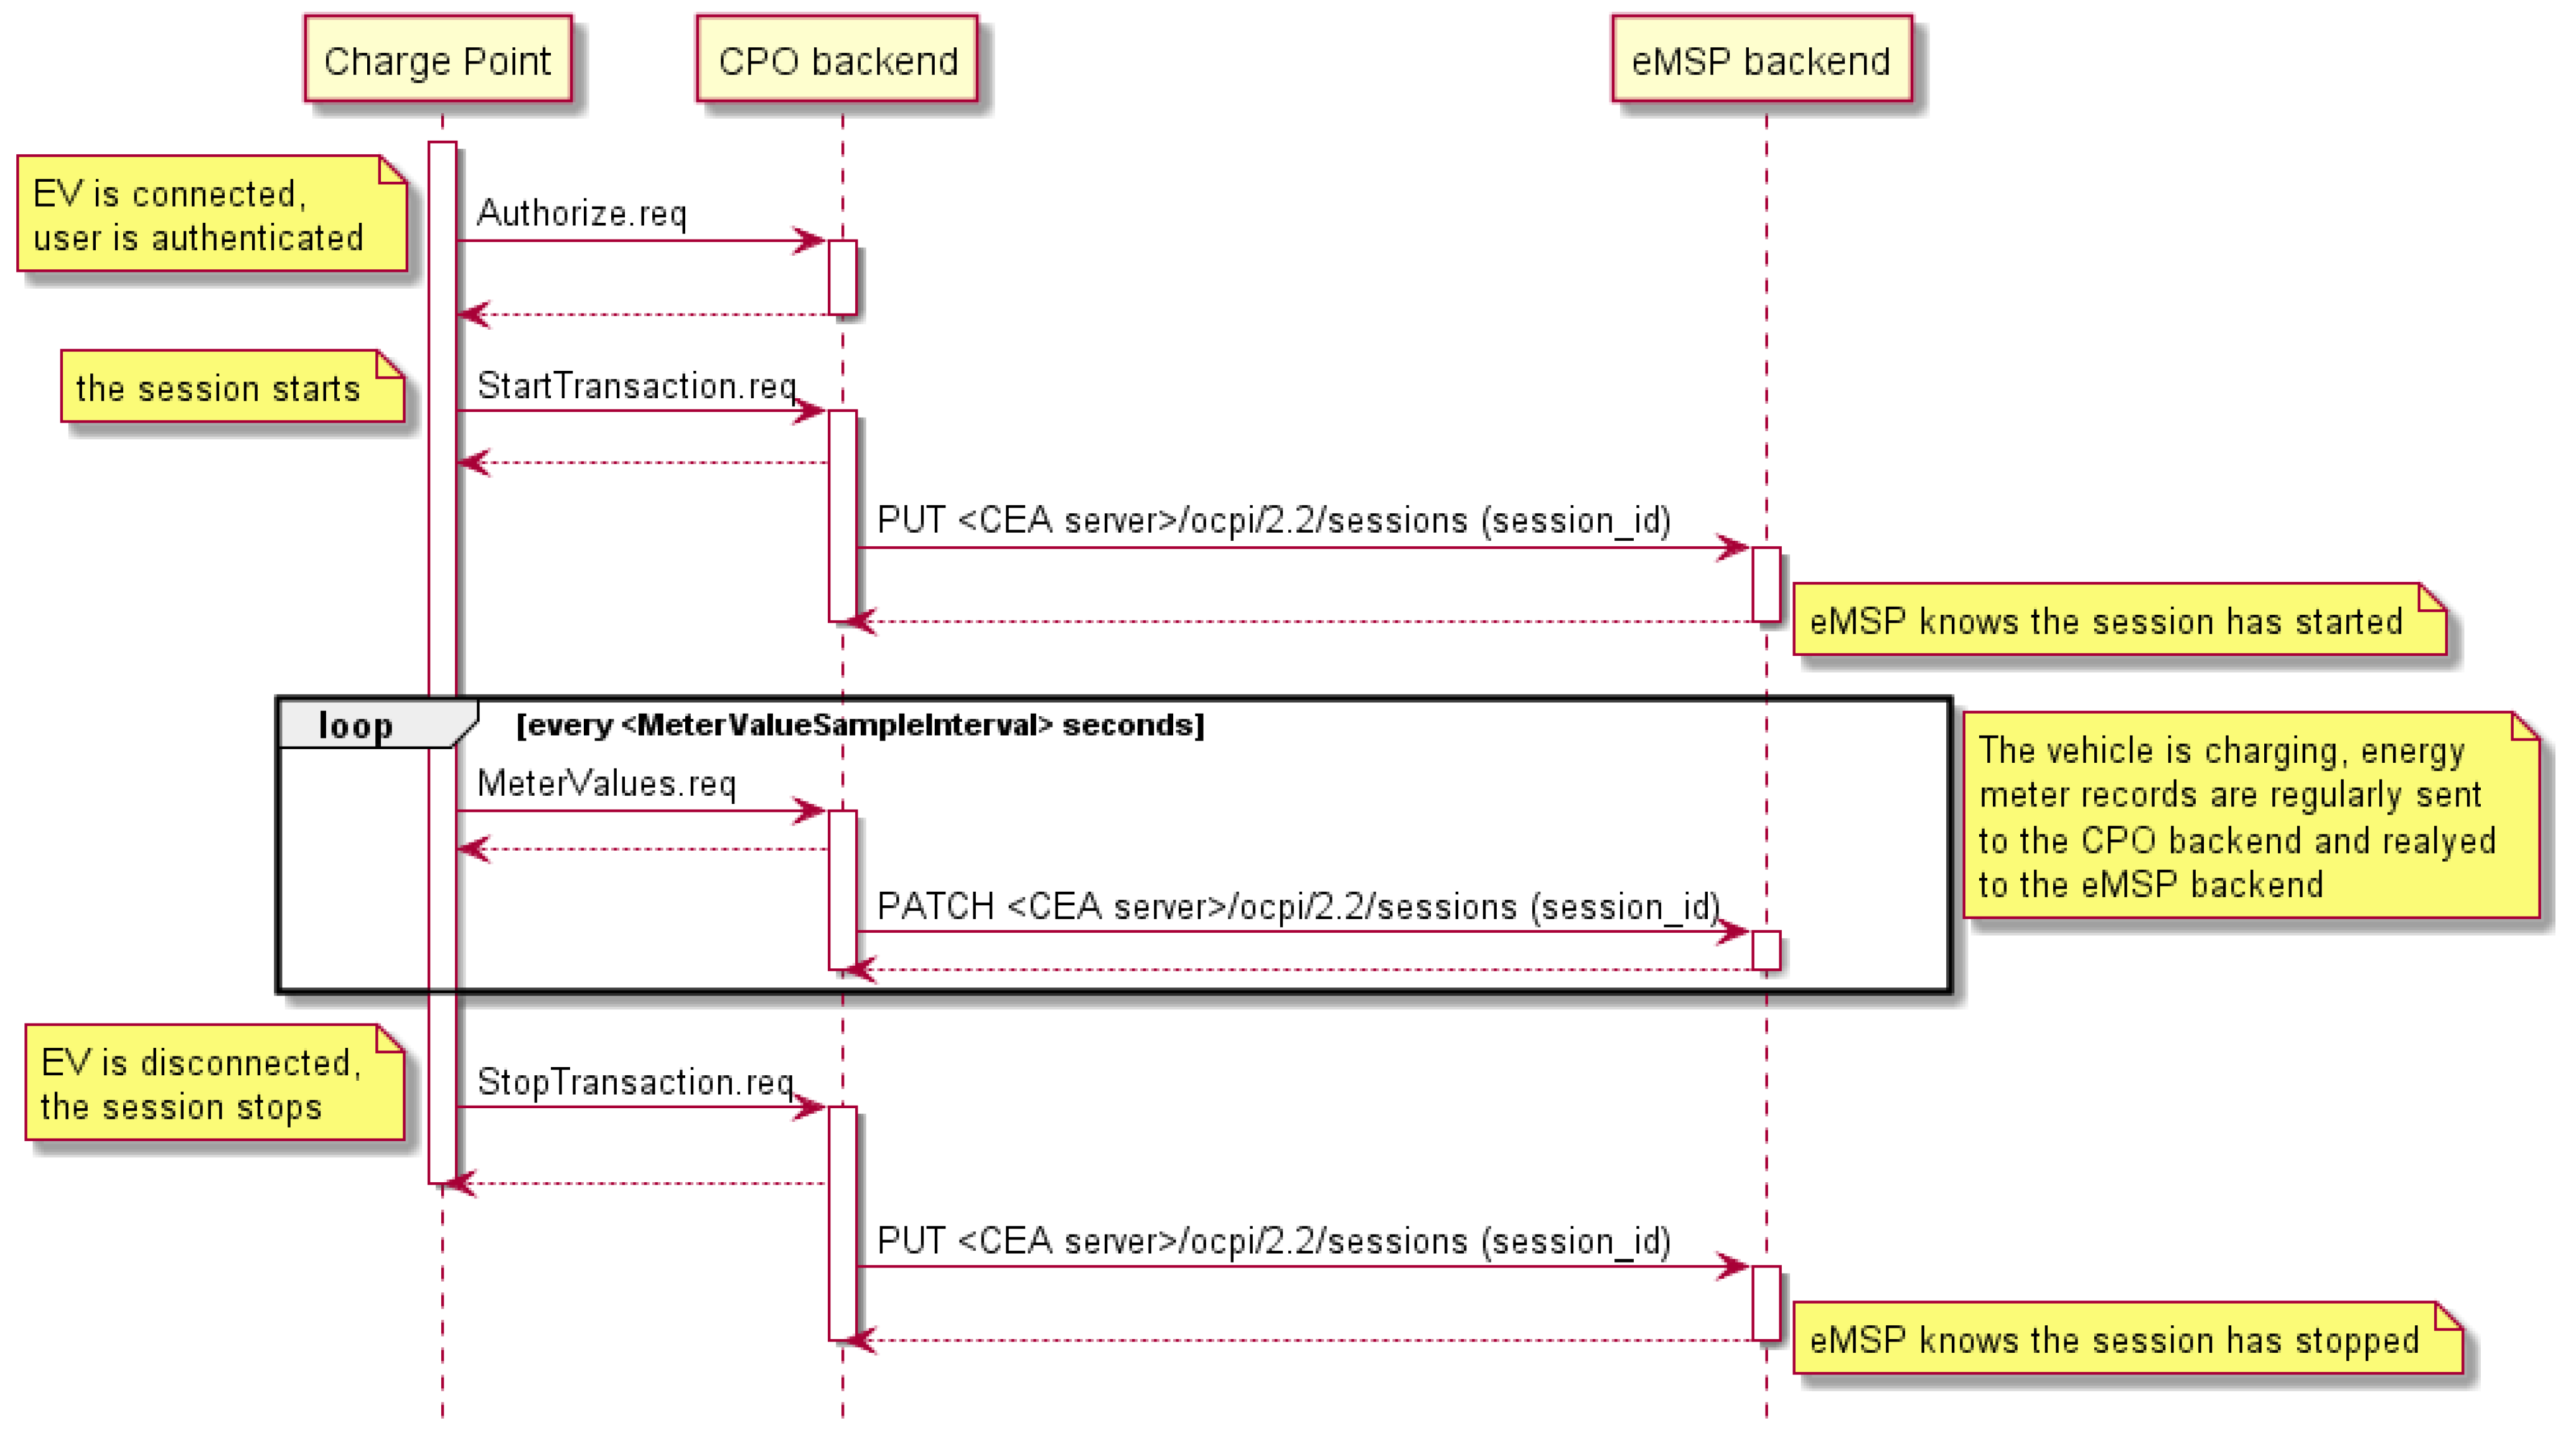
If the CPO back-end offers an OCPI interface, these sessions’ updates can be relayed to an eMSP information system. It is through such a link that an eMSP can allow its customers to access the CPO’s charging stations and handle billing and payment for EV charging sessions. The eMSP can also offer other services, such as a user interface allowing its customer to follow up their charging sessions in real time, for instance. Figure 2 shows that the “sessions” endpoint is used, among other things. The CPO back-end sends a request to that endpoint each time it receives either a StartTransaction, a MeterValues or a StopTransaction OCPP message from a charging station. This mechanism, illustrated in Figure 4, allows the eMSP to learn about its customers’ session statuses in real time.
The OCPI link between the CPO back-end and the EMS of the SCSP uses the same session updates principle that the eMSP uses. This means that the CPO back-end-relays the updates to both the eMSP and the SCSP. These session updates are key for the operations of the SCSP. They allow the EMS to (1) identify the user and then the type of vehicle being charged, and thus the vehicle battery capacity, and (2) know which amount of energy has already been transferred at what time during the session, allowing the processing of the actual average charging power between two session updates.
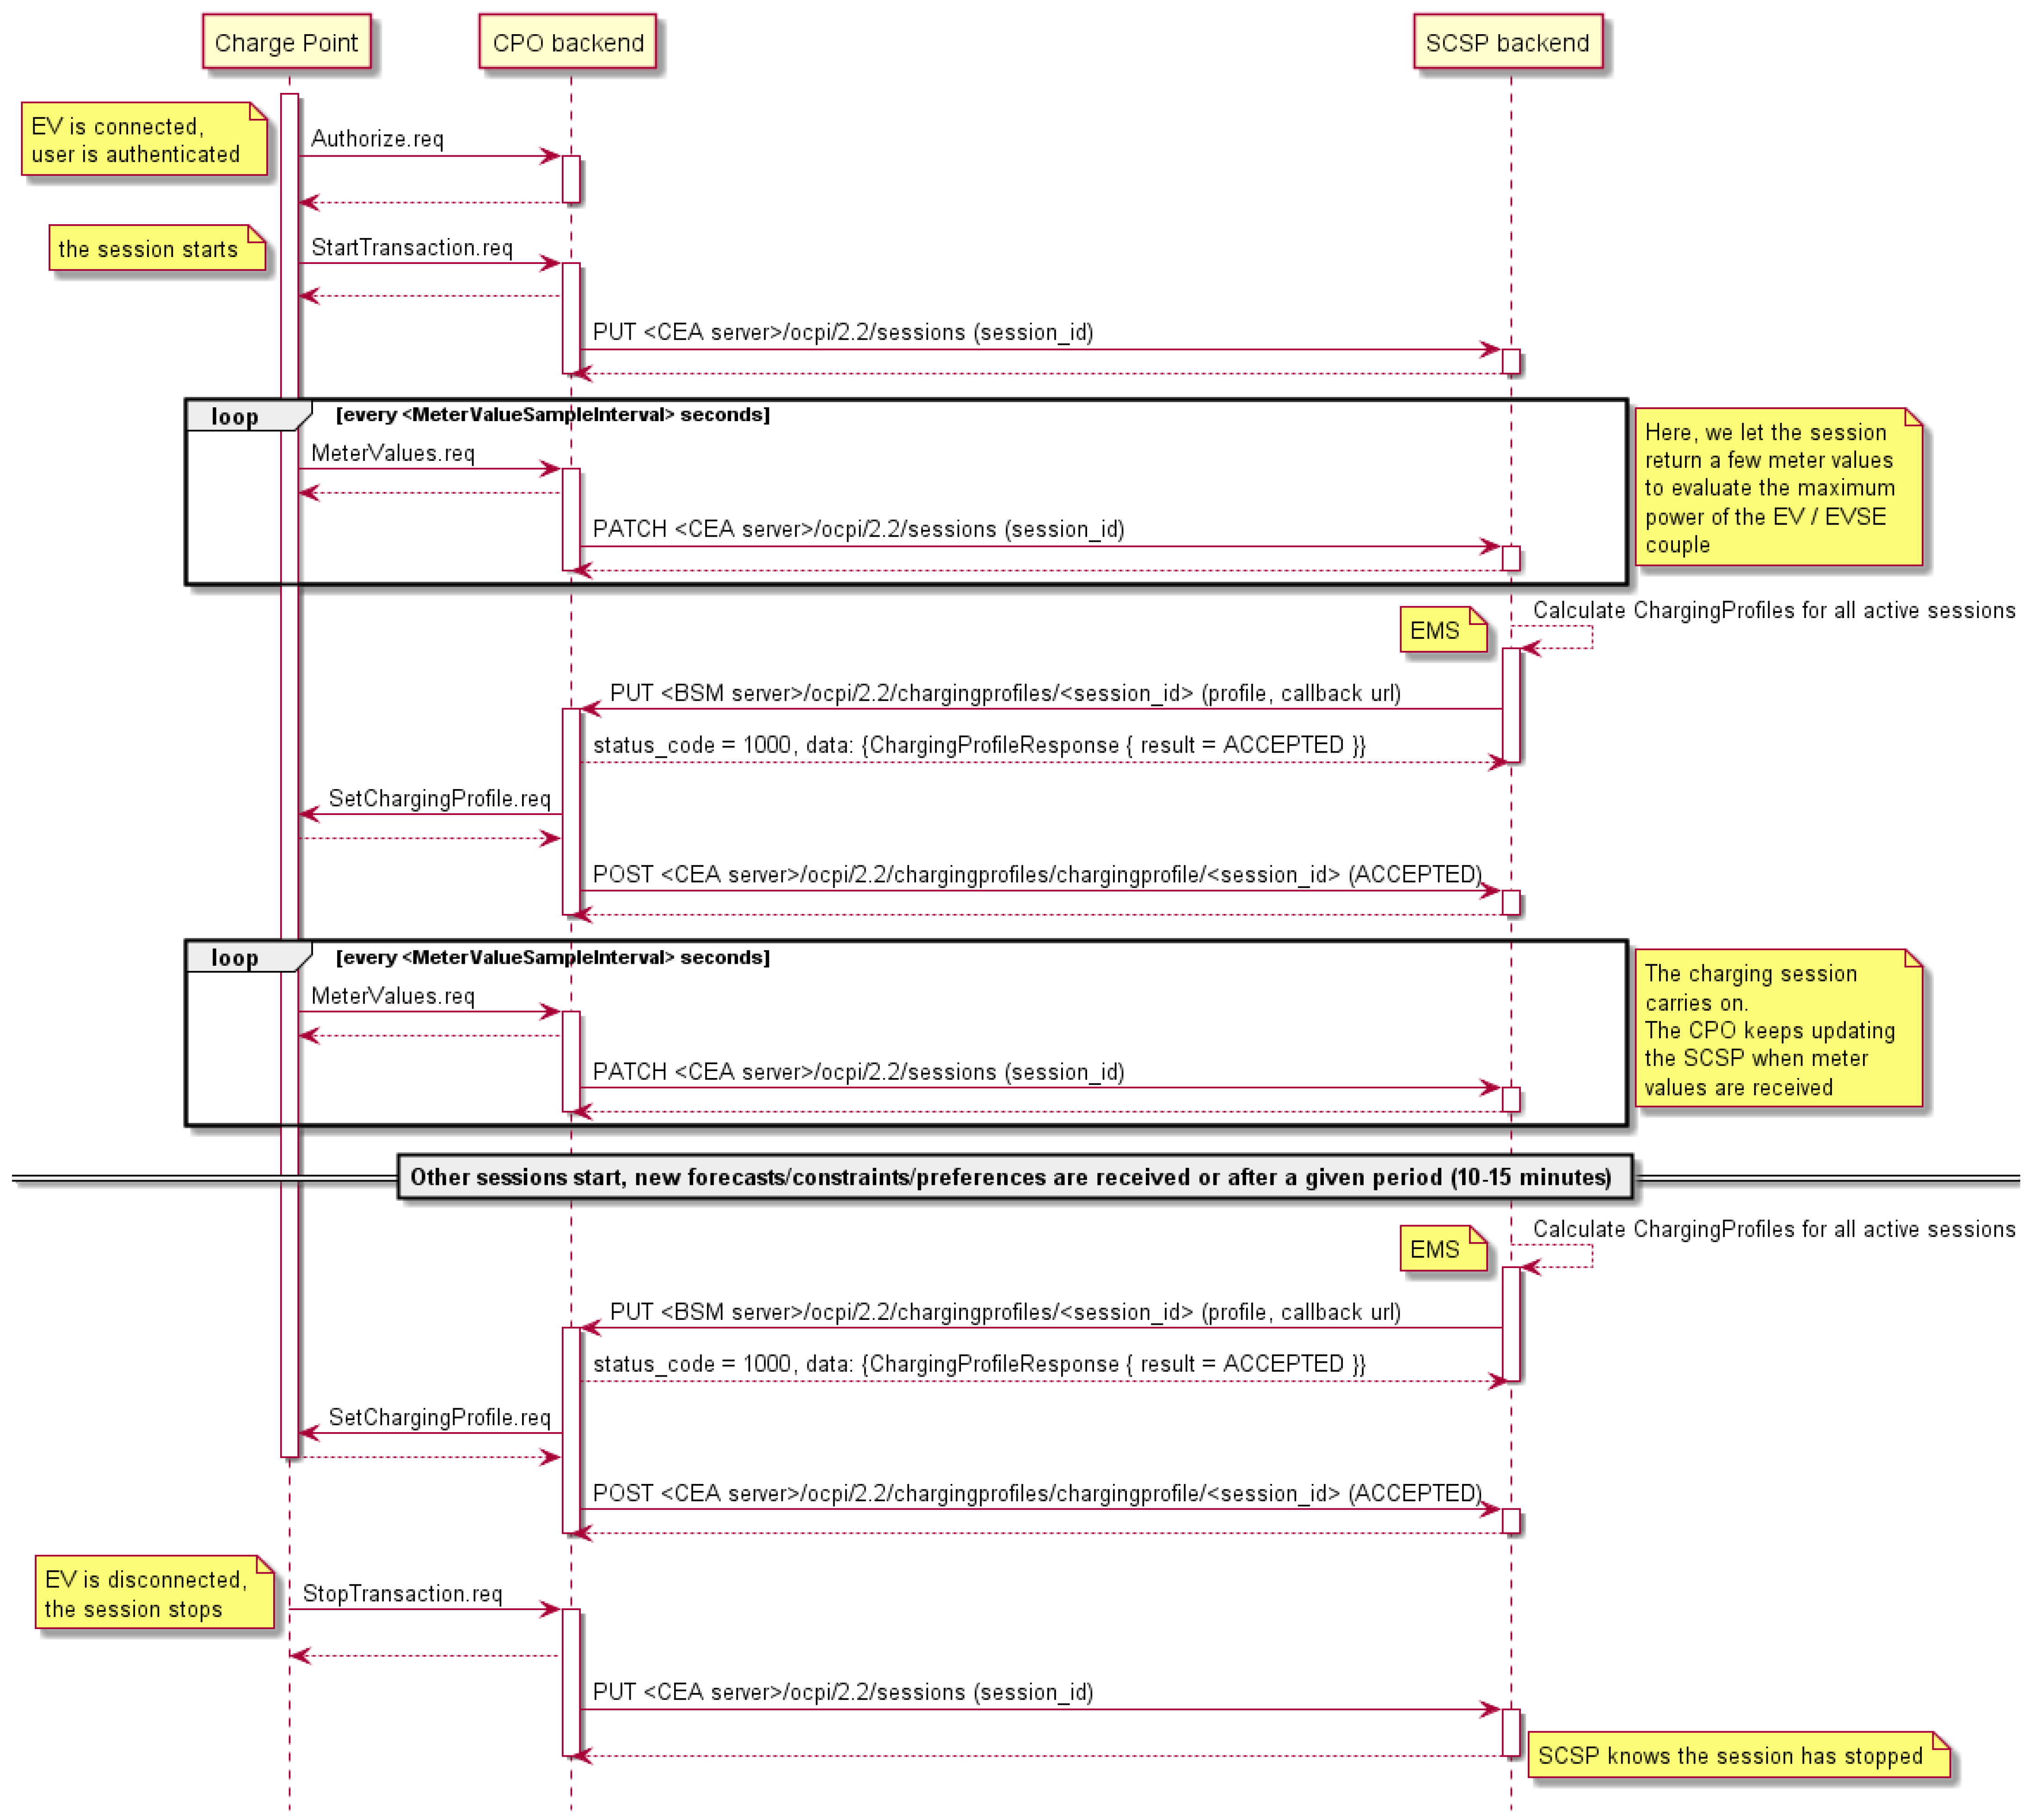
The EMS itself will use that OCPI link to send the optimized charging profiles it has calculated to the CPO back-end. The “chargingprofiles” endpoint implemented by the CPO back-end will then be used. These communications are illustrated in Figure 5.
After a call to its “chargingprofiles” OCPI endpoint, the CPO back-end acknowledges reception before transmitting the set points to the charging stations via SetChargingProfile OCPP messages. Then, the CPO back-end calls back the EMS to confirm that the profiles have been sent and accepted by the charging sessions.
The following paragraphs give details on how the EMS is architectured, as well as which data it manipulates.

2.2. EMS Architecture

The EMS is the information system of the SCSP. Its objective is to provide individual charging profiles for the charging sessions currently being executed by groups of charging stations in order to control the global power each group draws.
The grouping logic of charging stations can be of various forms depending on the optimization objectives: one might want to make sure that the charging stations at a given site keep their global power demand below the grid power available, or one might want to control the power of a whole territory, encompassing several charging sites. In our case, as our intent was to maximize the self-production ratio of the electricity produced by a local photovoltaic plant, we grouped together sessions executed at the same location.
Figure 6 reveals a representation of the internal architecture of the EMS.
Our EMS is made of several software components that we propose to detail hereafter to explain their utility. As a general rule, the idea is to hold the information that is needed by the optimization program, which is used to build the charging profiles.

2.2.1. OCPI Interface

First of all, as it is the main subject of this paper, it is important to mention that our EMS has an OCPI interface that it uses to communicate with the CPO back-end. It is through that interface that the EMS receives details about the infrastructure descriptions and the on-going charging sessions. That interface is (1) a set of web services which give access to the EMS database when the EMS acts as a server, and (2) a client program when it is necessary to call the CPO OCPI interface.

2.2.2. EMS Database/Infrastructure Description

Having a charging infrastructure description is a key feature for the EMS. The choice to power a given vehicle has an impact on the power flow of all upstream electrical nodes and protections. When powering several vehicles simultaneously, ensuring that these upstream nodes and protections are not overloaded is necessary and requires the availability of some models of the infrastructure electrical diagram.
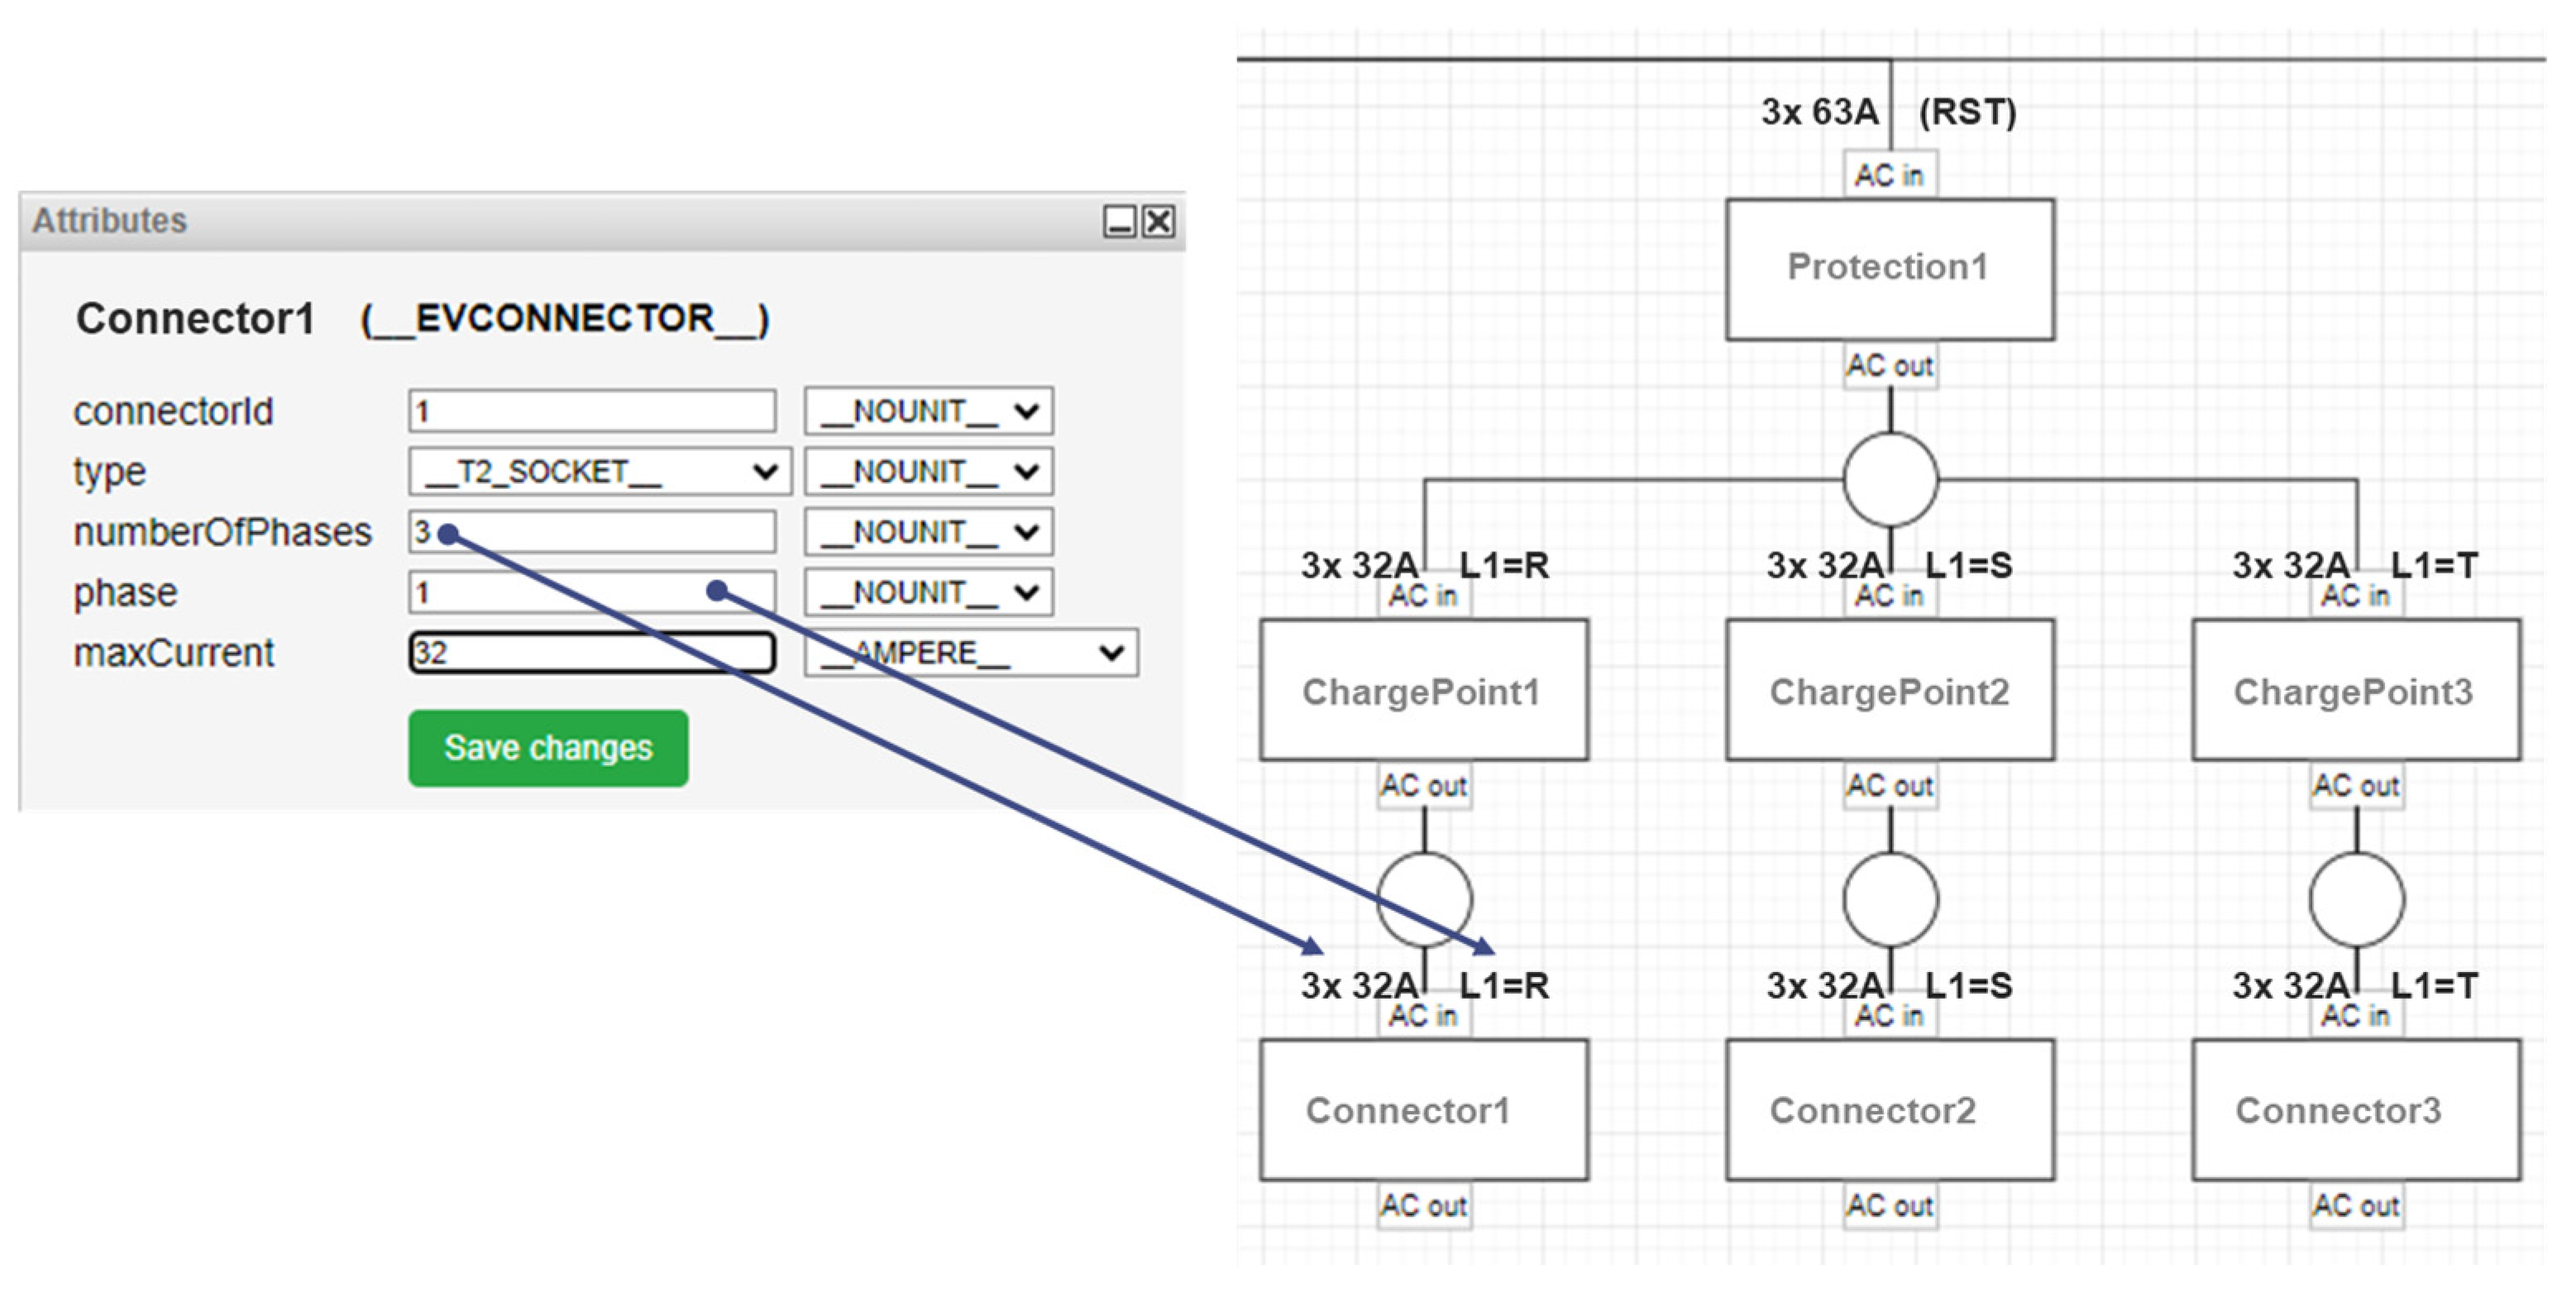
For instance, let us consider the following partial diagram in Figure 7, showing three charge points (ChargePoint1–3) powered through the same circuit breaker (Protection1).
When vehicles are to be charged through the connectors (Connector1-3), the ability to anticipate how much electrical current is drawn for each phase of circuit breaker Protection1 means that we know whether each charge point and connector is tri-phase or not, and also which phase of the network is wired to the first phase of the connector (i.e., one current will be drawn from if the vehicle is mono-phase).
The description held in the EMS database has to contain these phase details, as well as the fact that the charge points ChargePoint1-3 are powered through circuit breaker Protection1.
In Figure 7, which is a screenshot of our EMS operator interface, we can see the technical attributes that are held for one of the connectors (Connector1) modeled in our energy system. Here, we see that the connector has its three phases wired and that its first phase corresponds to the first phase (R) of the grid. We also see that the maximum current it can let through is 32A per phase.
Through the “locations” of OCPI endpoint, the CPO back-end lets its partners (eMSPs and SCSPs) know about the technical details and status of the charging stations it manages. Unfortunately, the information we obtain is generally not sufficient to rebuild the electrical diagram and perform proper energy management. CPO back-ends often lack a detailed description of the electrical wiring of the charging infrastructure, the circuit breaker details and the phase rotation configuration. This means that the charging infrastructure description has to be carefully modeled and set at the EMS level, justifying the need for a specialized SCSP information system if the CPO back-end cannot hold that information.
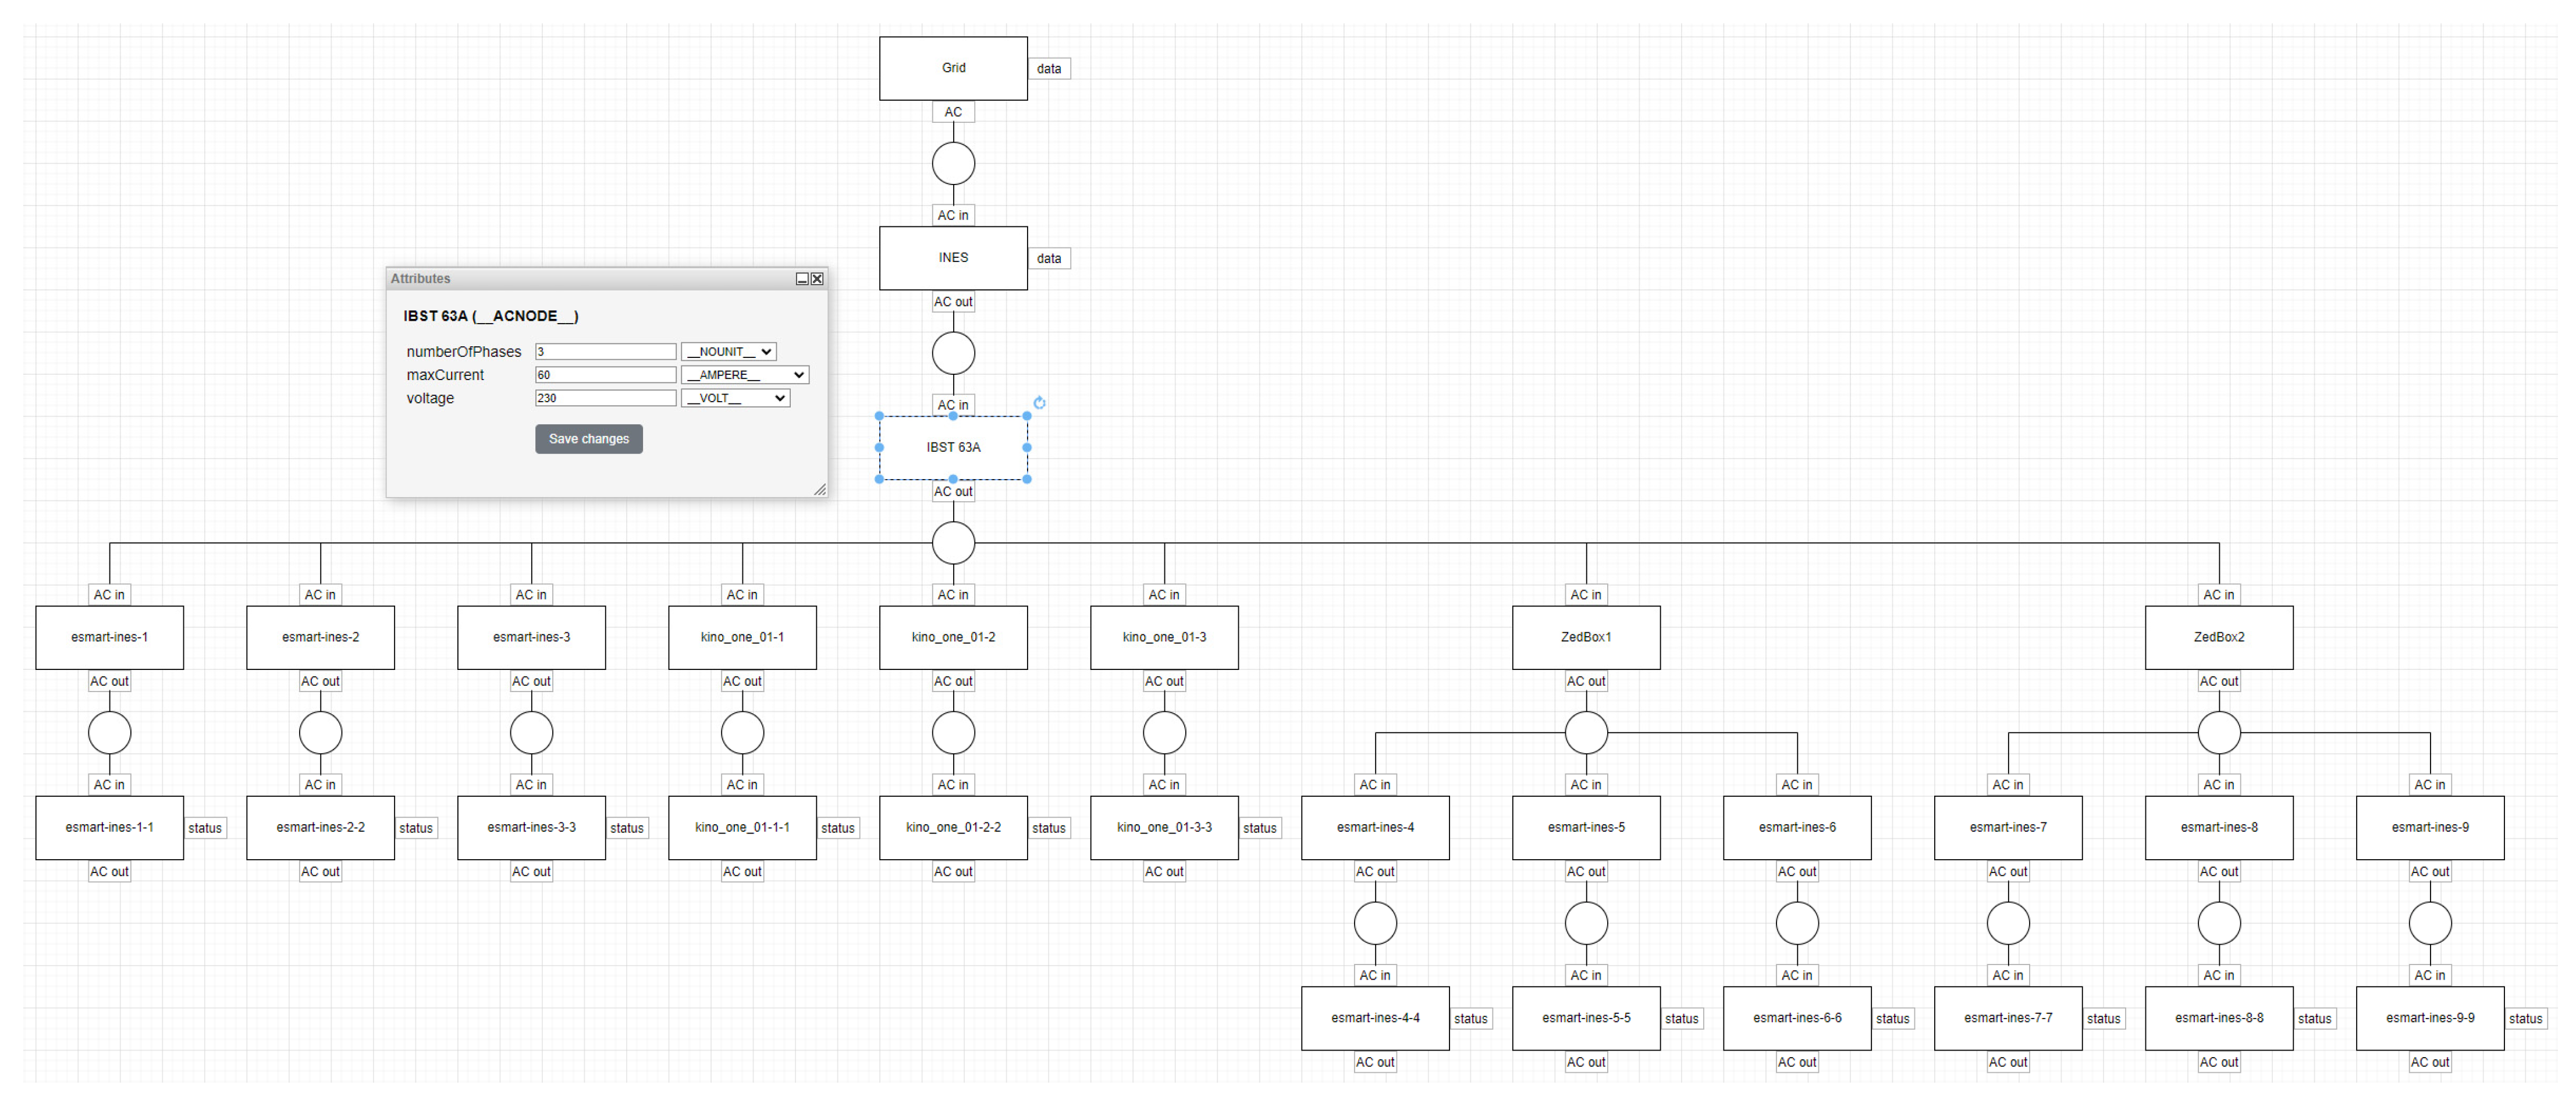
The infrastructure description will then be set and updated by both the CPO back-end through the OCPI interface and also the EMS administrator through the EMS UI (User Interface). Our EMS UI makes it possible to edit CIM-style (Common Information Model) electrical diagrams like the one shown in Figure 8.
This kind of description makes it possible for us to draw a list of all technical constraints that need to be respected by the optimized charging profiles that will be calculated.

2.2.3. EMS Database/Configuration Data

Each charging session references a “cdr_token” that was used to start the session. It is out of the scope of this paper to discuss the various types of tokens that can be used, and we will just consider that an RFID tag was used. That token can be used to identify which EV user, and then which type of vehicle, is being charged. In the “configuration data” part of our EMS database, we have the ability to host, among other details, the energy capacity of the vehicle associated with that token. That piece of information is either set by the EMS administrator through the UI based on what the eMSP was able to communicate, or estimated using the previous charging sessions that were performed for that EV user. If 20 kWh were transferred in a session for which the user had declared a 50% state of charge on arrival, the vehicle capacity can be roughly estimated to be 40 kWh. Obviously, that estimation will grow in accuracy with a growing number of sessions.
Which algorithm the optimization program should use for which group of charging stations, and other specific details, are also held in the “configuration data” part of the EMS database.

2.2.4. EMS Database/Session Details and User Preferences

In the EMS database, for each session, we hold the details needed for the optimization program to make decision on which EV vehicle to charge in what priority order, when and at what charging power.
These details require answers to the three following questions for each session:
-
How much energy will we still have to transfer to the EV?
-
By what time?
-
What are the minimum and maximum power set points we can use?
All this information is not necessarily directly available. To know how much energy is still to be transferred, we need to know:
-
The state of charge of the vehicle on arrival (obtained through the user interface);
-
The capacity of the vehicle’s battery (either learned from history or configured by the EMS administrator as a characteristic associated with the user identifier);
-
The amount of energy already transferred (directly accessible in the session OCPI update messages).
The UI interface used by the EV user is also the channel through which we will learn by what time the vehicle has to be charged.
By controlling the charge-point power limit, the SCSP can measure the maximum charging power which the charge point/vehicle couple can reach. That piece of information is key for the optimization program as it sets the boundaries of the charging profile it will be able to define. The maximum charging power value is also part of the data we host about each charging session.

2.2.5. EMS Database/Energy Source Forecasts

The optimization program objective is to distribute the energy, possibly available from many sources, in a smart manner. This implies that the amount of available energy for the time periods to come is known. These data might be obtained from the Distribution System Operator (DSO), the Transport System Operator (TSO), the electricity provider or from some other third-party data source. For the CEA-INES demonstrator, for which the objective is to maximize the self-production ratio of the infrastructure coupled with a photovoltaic plant, we can obtain photovoltaic production forecasts from a specialized company and automatically and regularly integrate them into the EMS database.
The prices at which this energy is available from the different sources are also a crucial indicator. They can be defined by contract and thus simply require a configuration by the EMS administrator, or can be much more dynamic and require that an automatic data flow is set up between the electricity providers and the SCSP.
The “Energy sources forecast” of the EMS database is then able to host time series representing the power that is supposed to be available for different time periods in the future and prices at which that energy is sold, as shown in Figure 9, below.

2.2.6. EMS User Interface

The EMS user interface addresses two types of users: the electrical vehicle users and the EMS administrators. The EV users need some way to let the EMS know how much energy they need and for how long their vehicle will stay connected to the charging infrastructure.
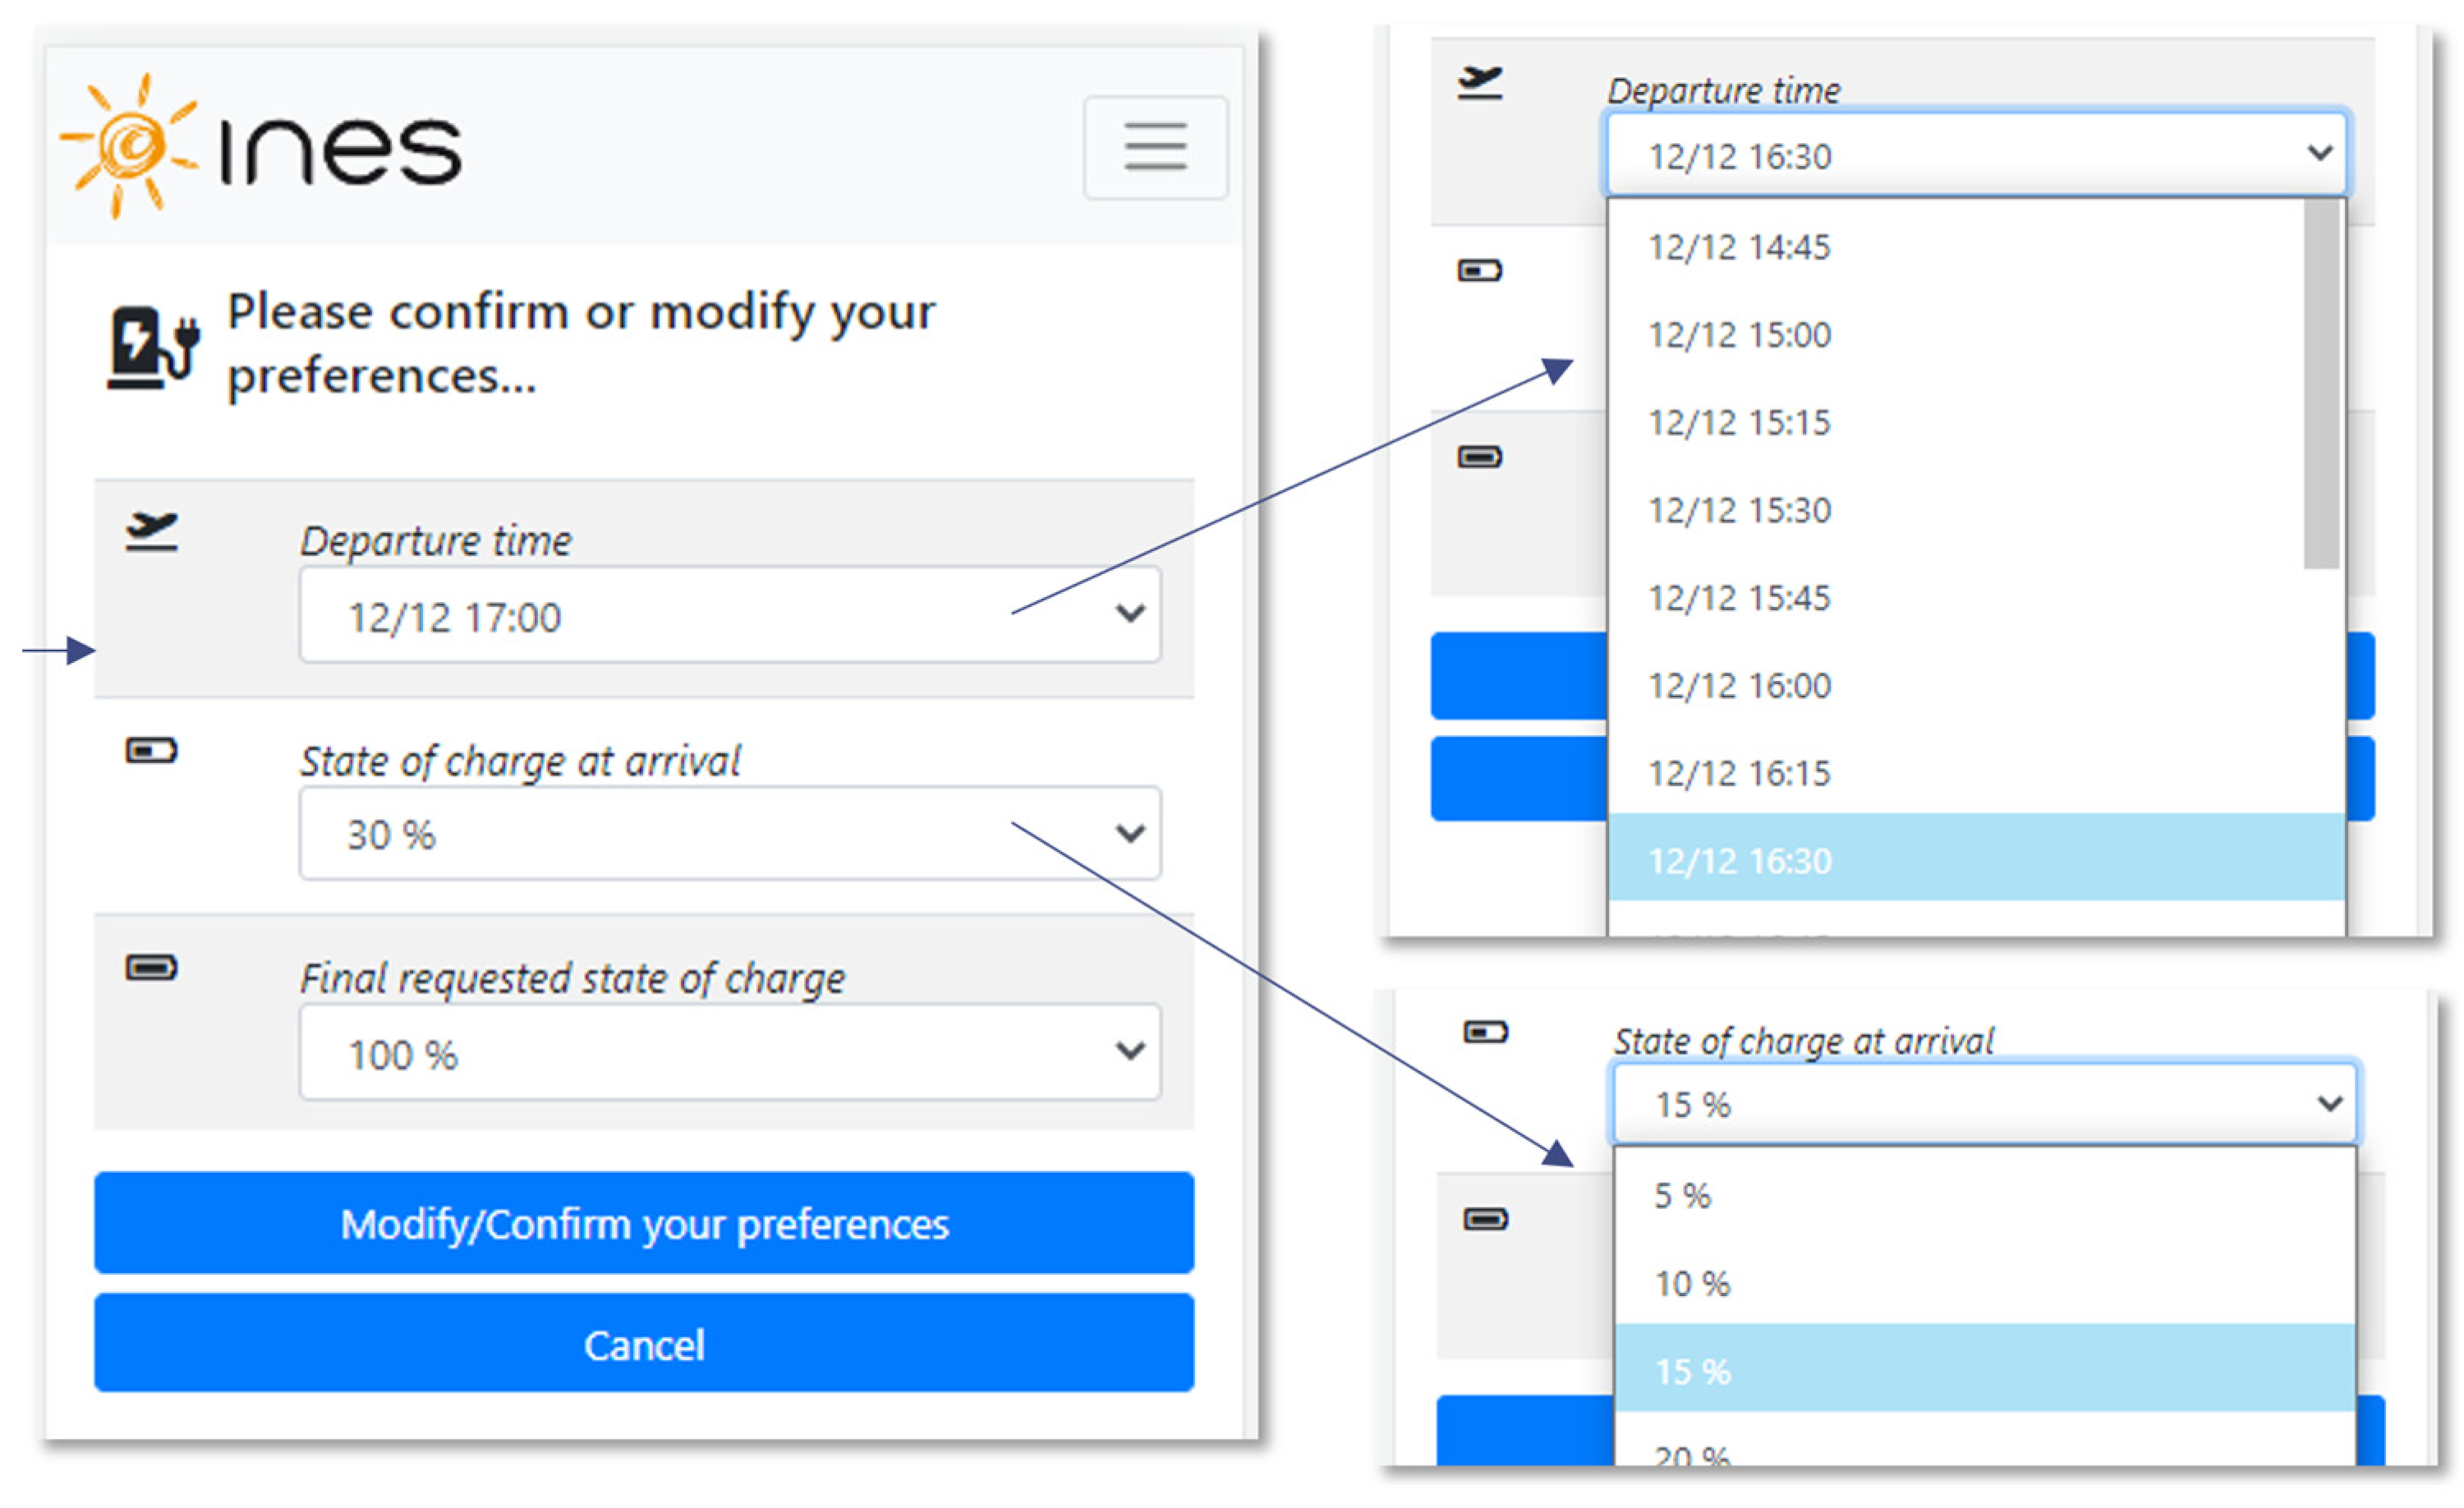
For the e-charge4driver project, our EMS was used for two charging sites, (1) at CEA-INES and (2) in Barcelona. At CEA-INES, we are our own eMSP and we integrated the possibility for the users to communicate the state of charge of their vehicles and their expected departure time through our User Management System mobile website, which embeds a web widget served by our EMS UI; see Figure 10.
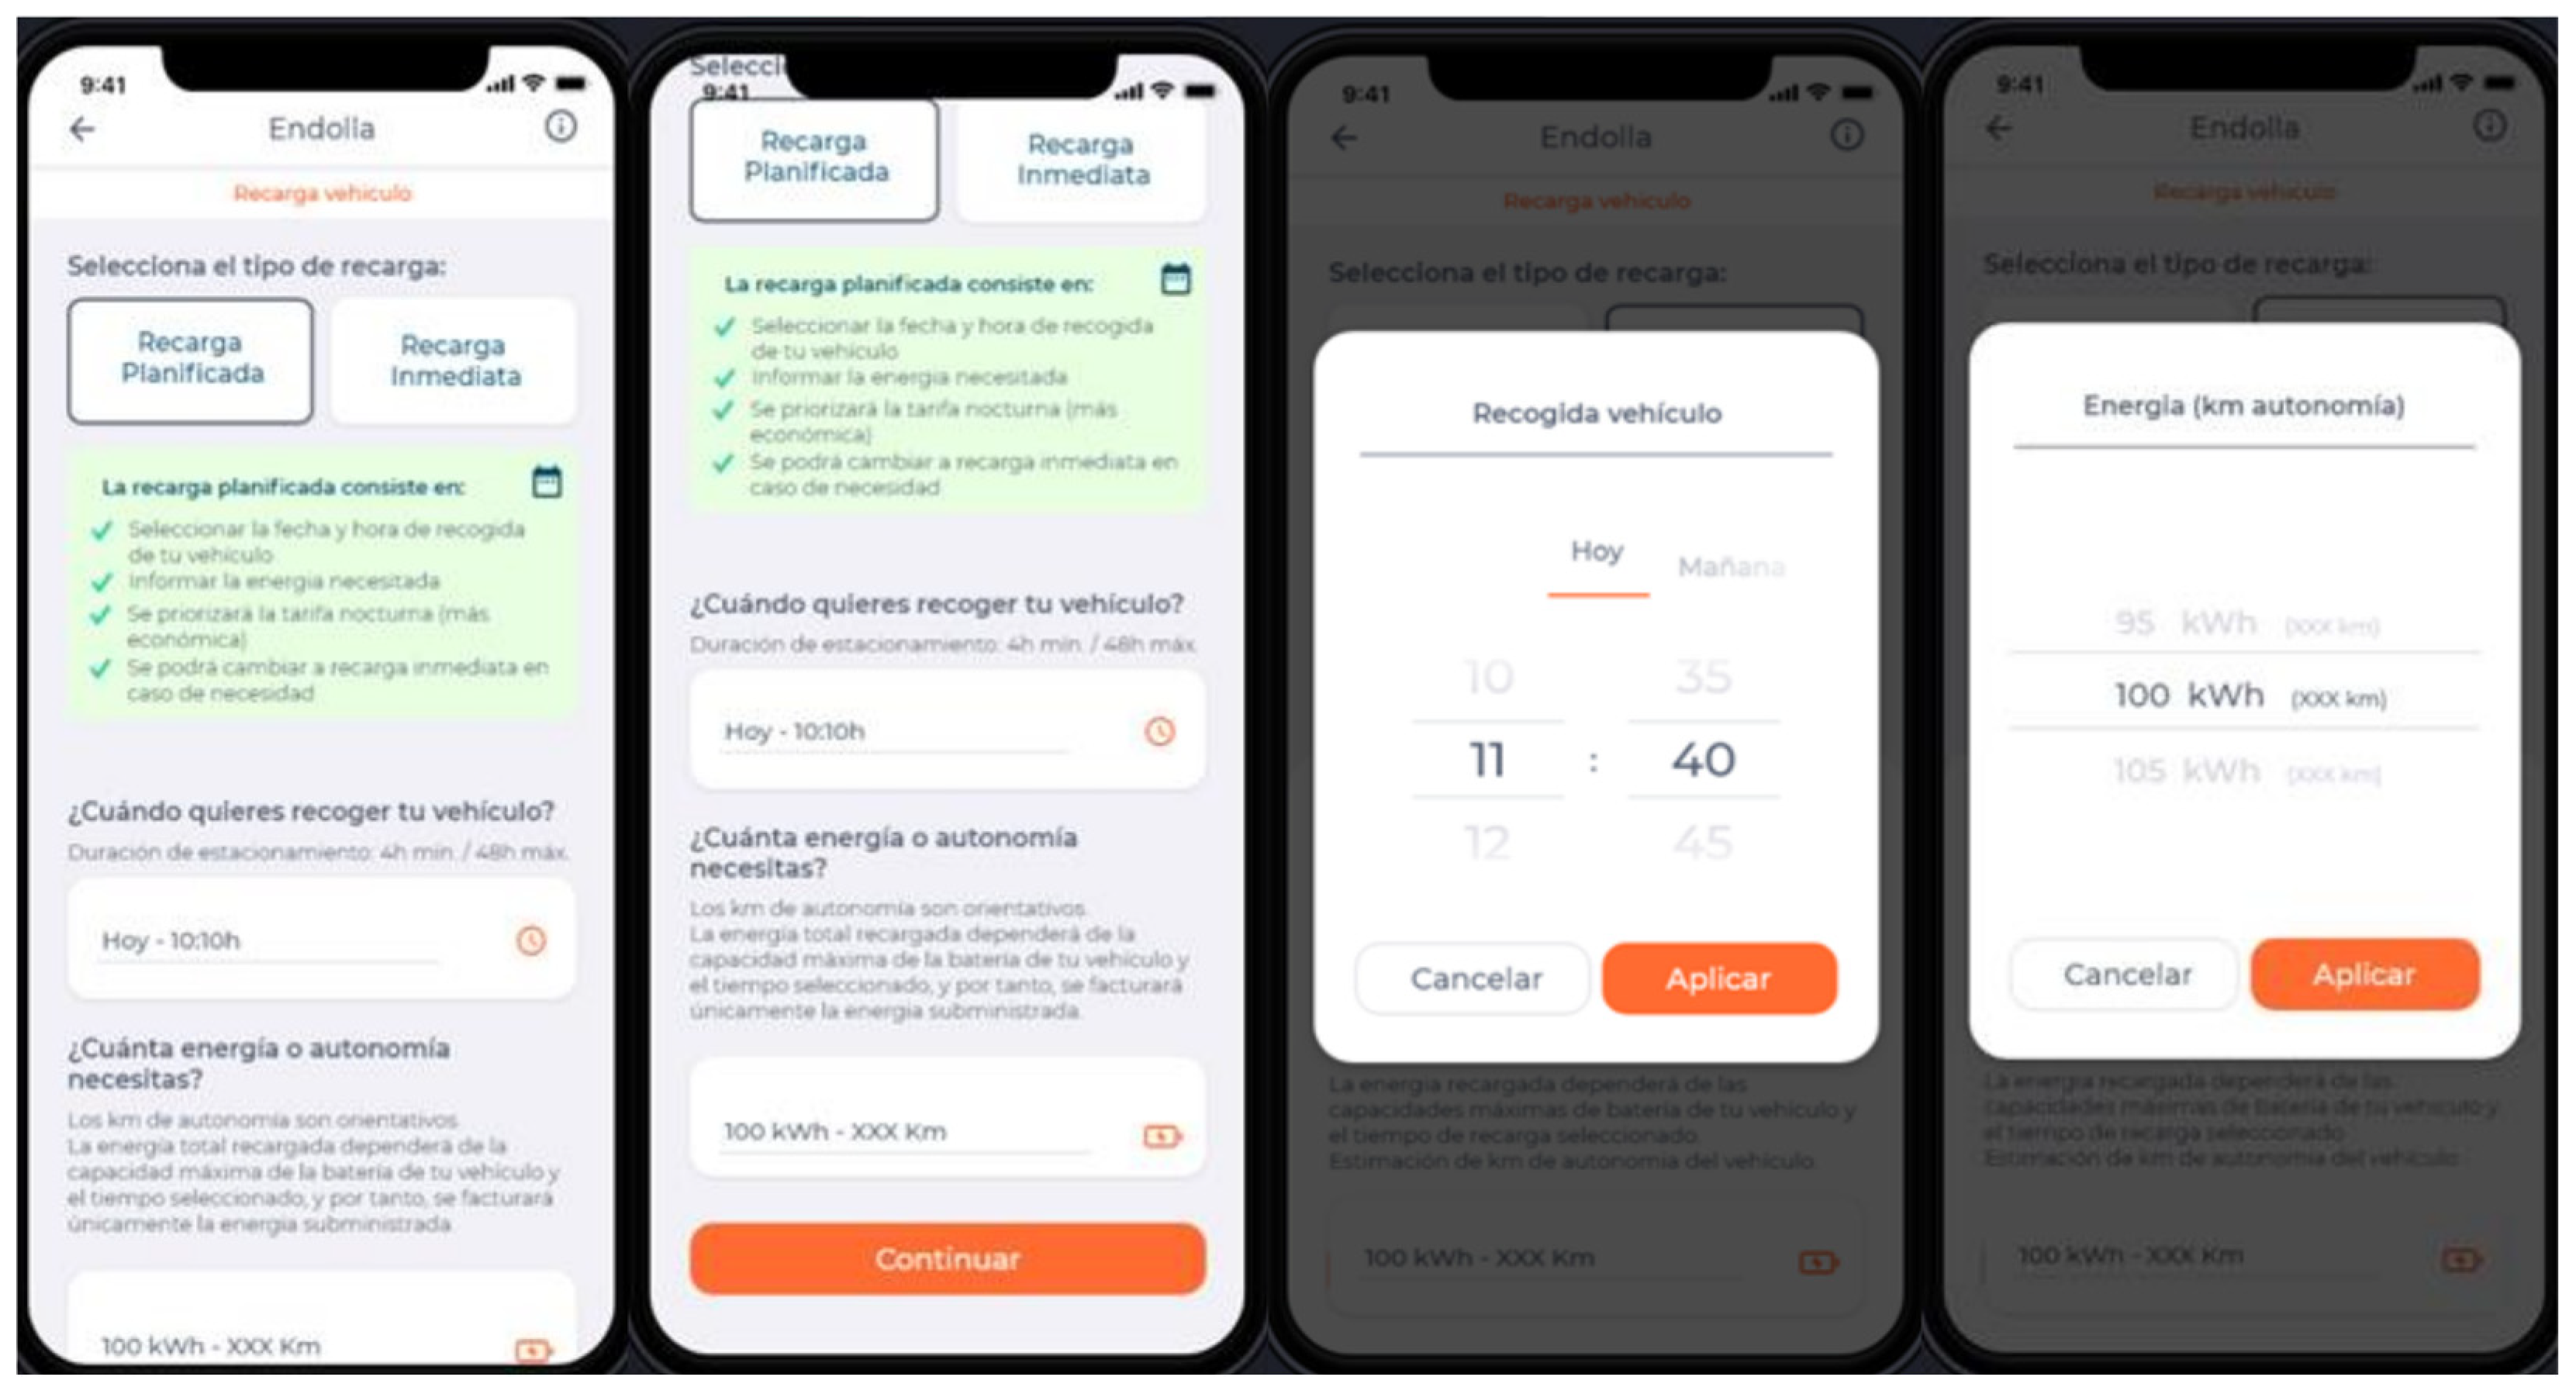
For the Barcelona demonstrator, the eMSP SMOU application used by EV users was amended to include those two questions, as shown in Figure 11. The requested amount of energy and the expected departure time were then communicated to the EMS by making use of an unused field (meter_id) of the OCPI session updates. This is a slight workaround for the fact that OCPI has not made provision for these details in its message structures.
Our EMS user interface is also designed to be used by EMS administrators. These users will edit the charging infrastructure electrical diagrams (see Figure 12) and set other parameters used by the optimization program.

2.2.7. Optimization Program

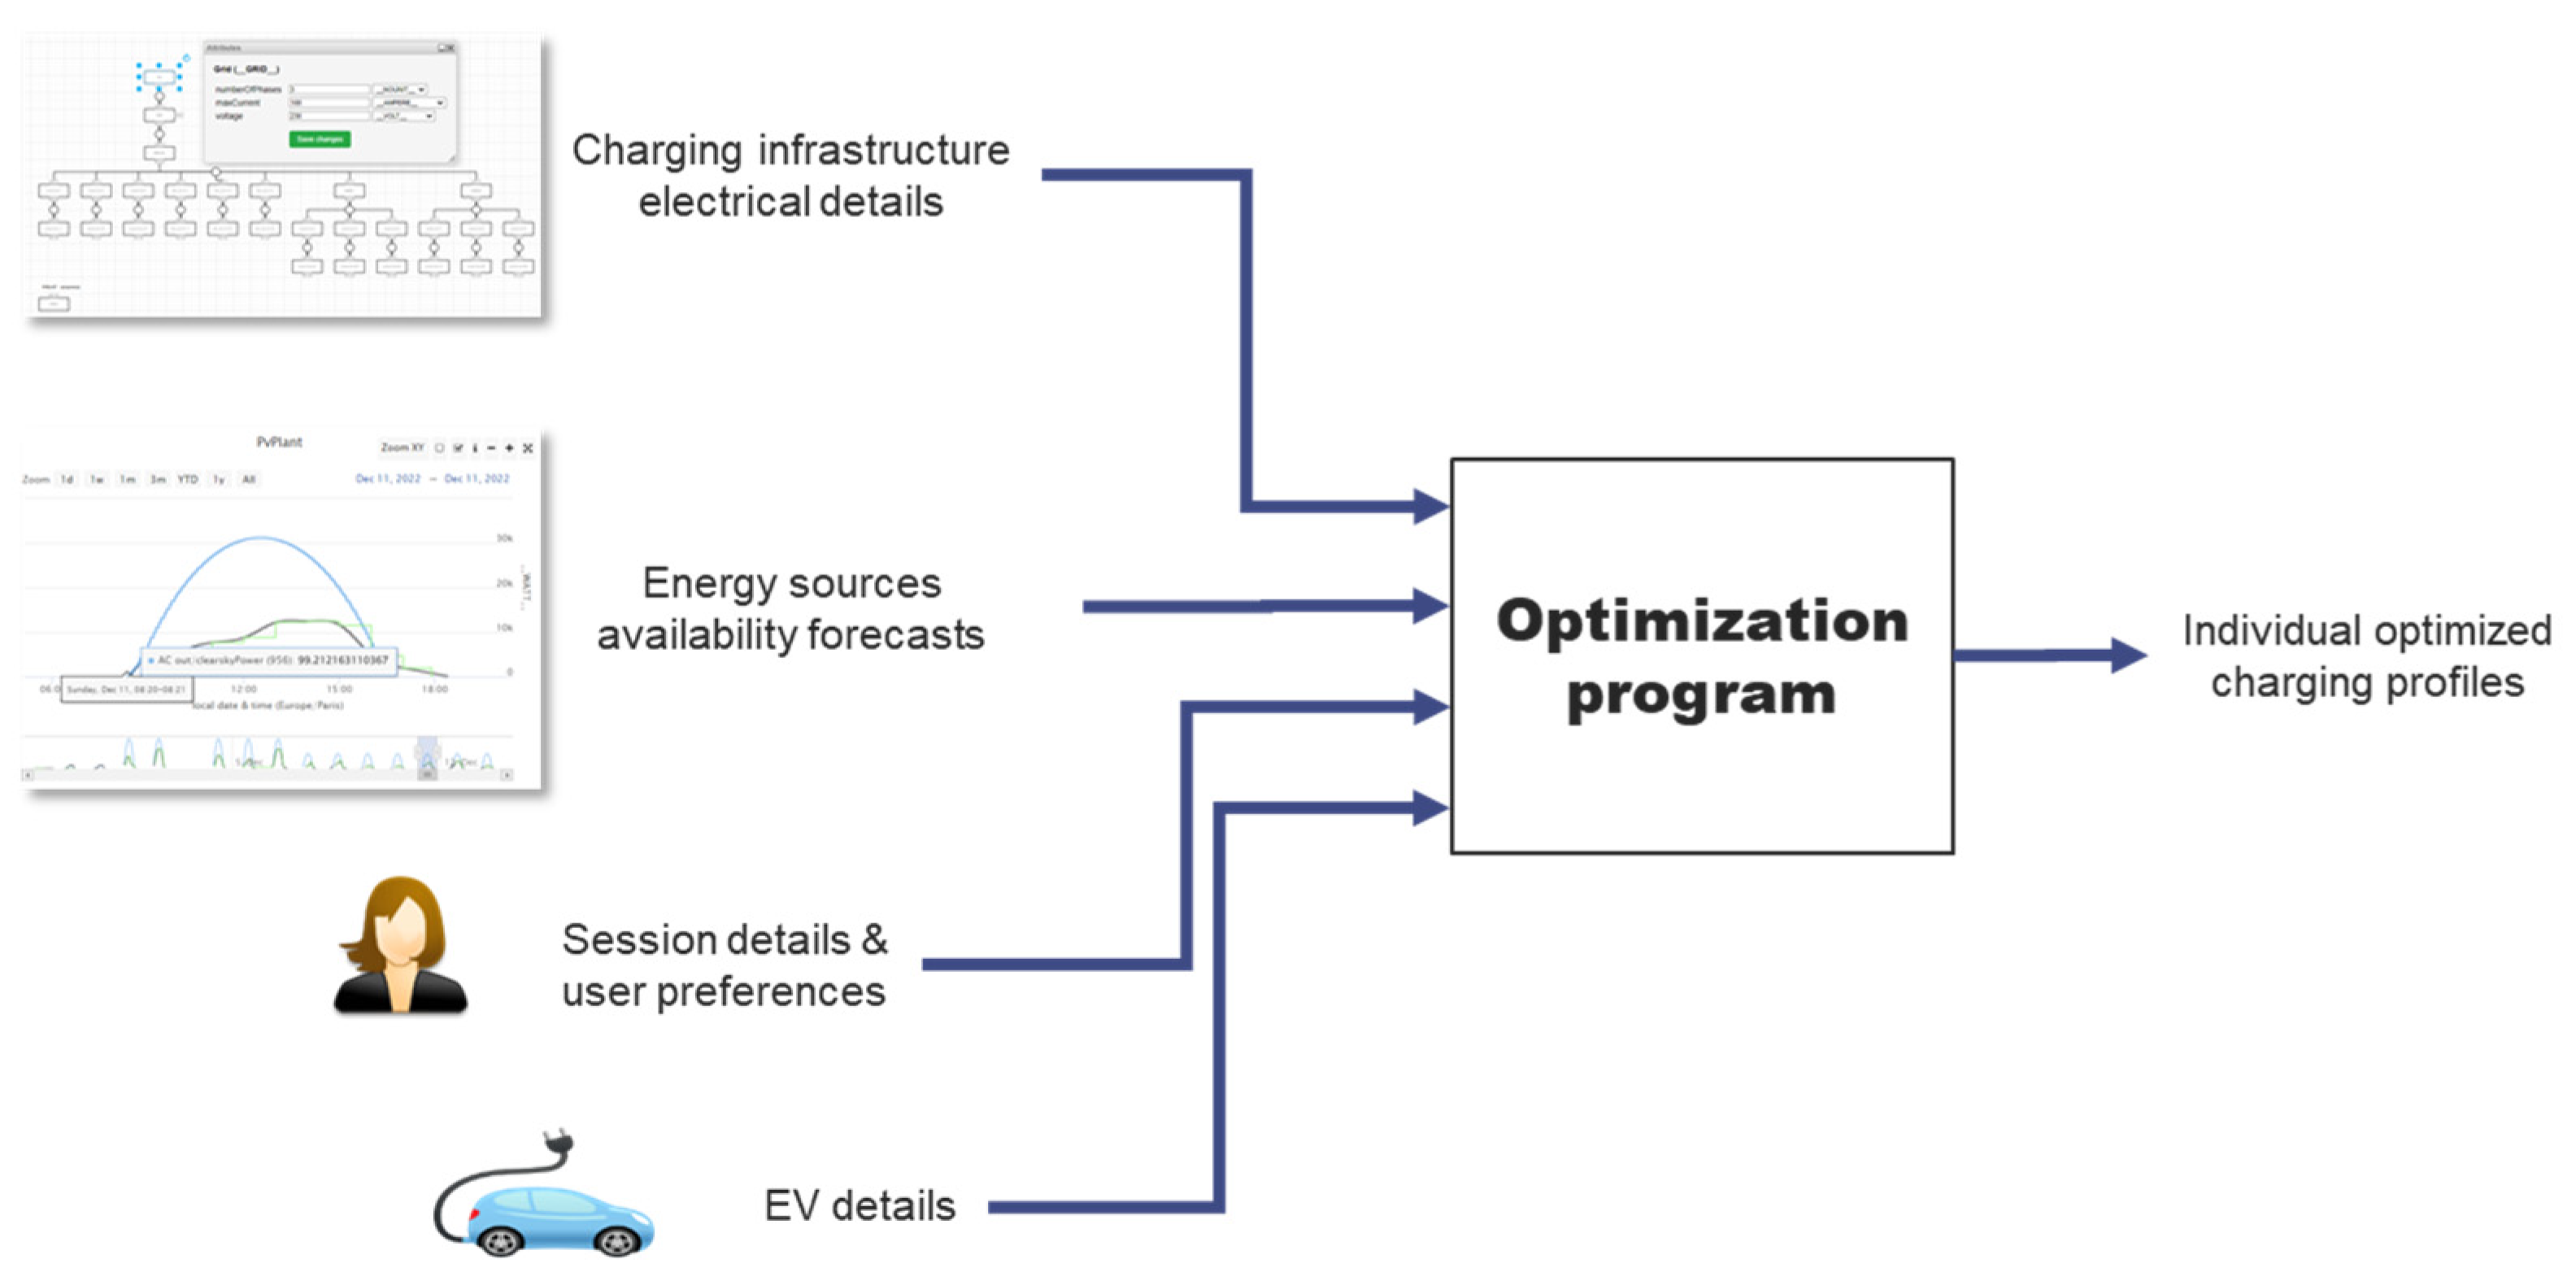
The optimization program calculates charging profiles for each and every charging session to be executed. Detailing how this program works internally is not in the scope of this paper. As described before, it makes use of the various data modeled and hosted in the EMS database and simulates the power flow within the infrastructure for the hours to come, aiming to minimize a cost function designed to translate the optimization objectives into numerical indicators. The data flow diagram of this program is shown in Figure 13.
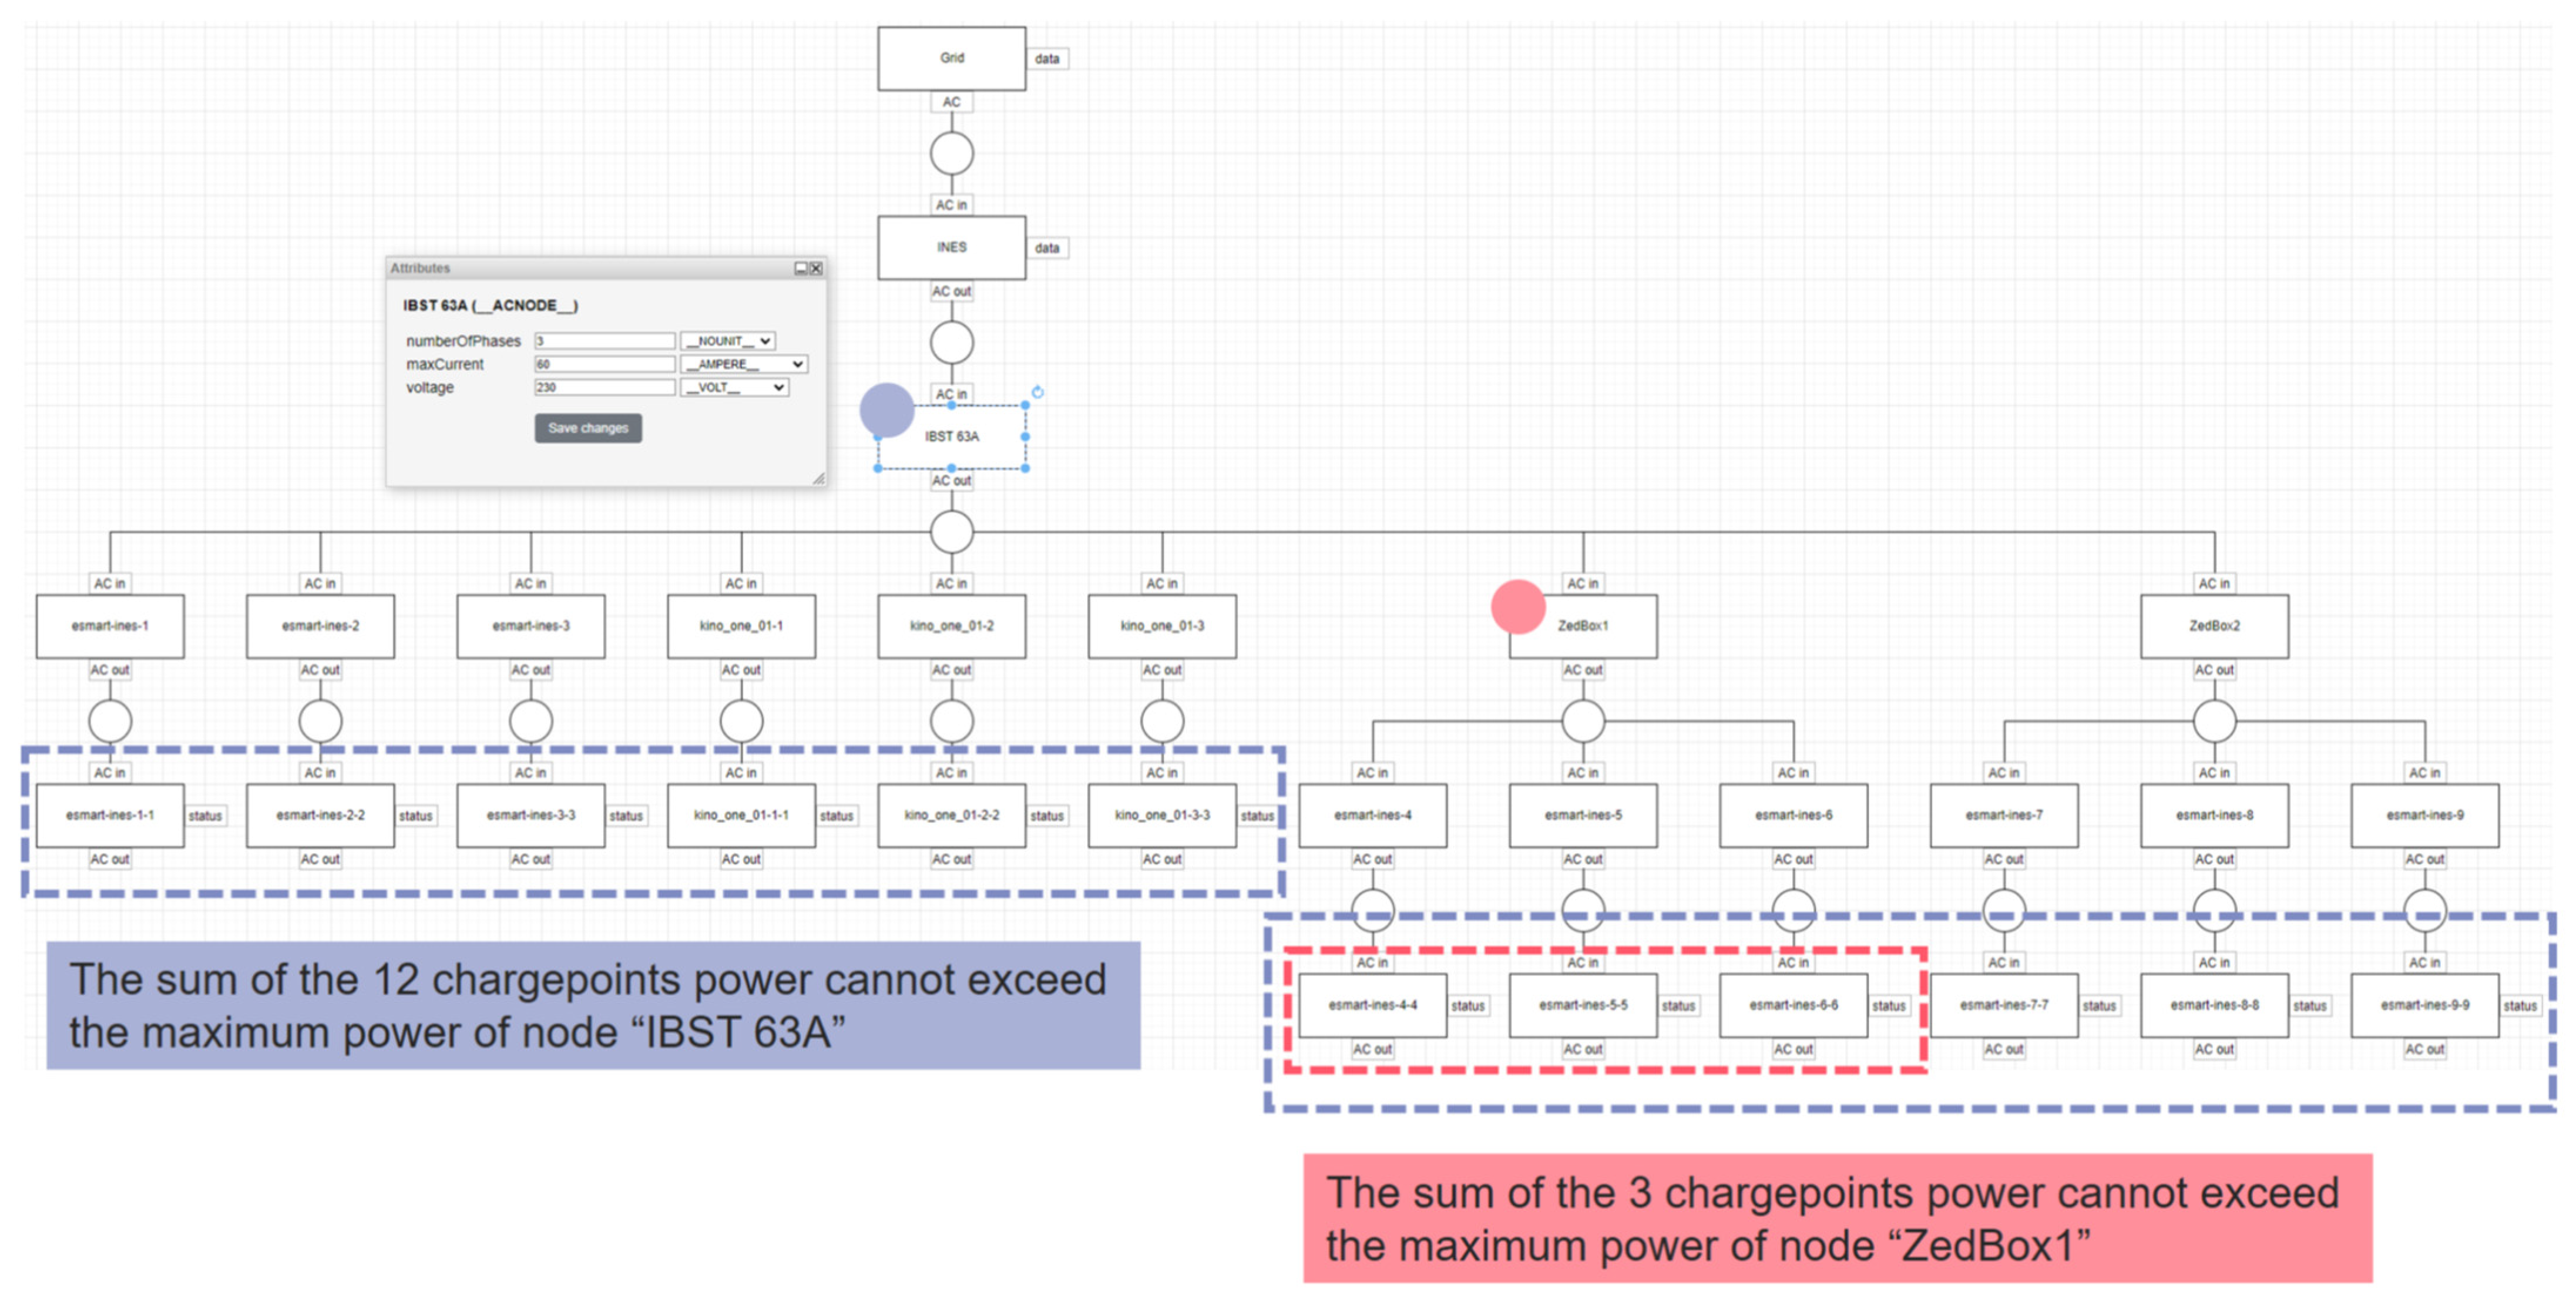
It exploits the infrastructure description to identify constraints that need respecting. In Figure 12, we have illustrated, in lavender, the fact that the power drawn by the 12 EV connectors must not overload the node named “IBST 63A”, and in red, the fact that connectors “esmart-ines-4-4”, “esmart-ines-5-5” and “esmart-ines-6-6” must not overload the node named “ZedBox1”. In the electrical diagram, the optimization program automatically identifies these constraints and makes sure that the charging profiles it generates respect them.
With forecasts for how much power will be available from the various energy sources and at what prices, and with estimations on the quantity or energy it has available to allocate to each charging session, by when and with what maximum power, the optimization program has the information it needs to build the set of charging profiles that best fits the optimization objectives.
Each time a new session starts or is stopped by an EV user, the global optimization problem changes and the optimized charging profiles need recalculating. This is when the optimization program is called by the EMS that detects those events.
When new charging profiles are ready, they are sent to the CPO back-end via OCPI for transmission to the charge points, as shown in Figure 5.

2.2.8. Digital Twin

Altogether, by modeling the equipment deployed on the charging infrastructure, by updating their status in real-time and by being able to simulate their physical behavior, these software components constitute a digital twin of the charging infrastructures managed by the EMS.

3. Results

3.1. Implementations

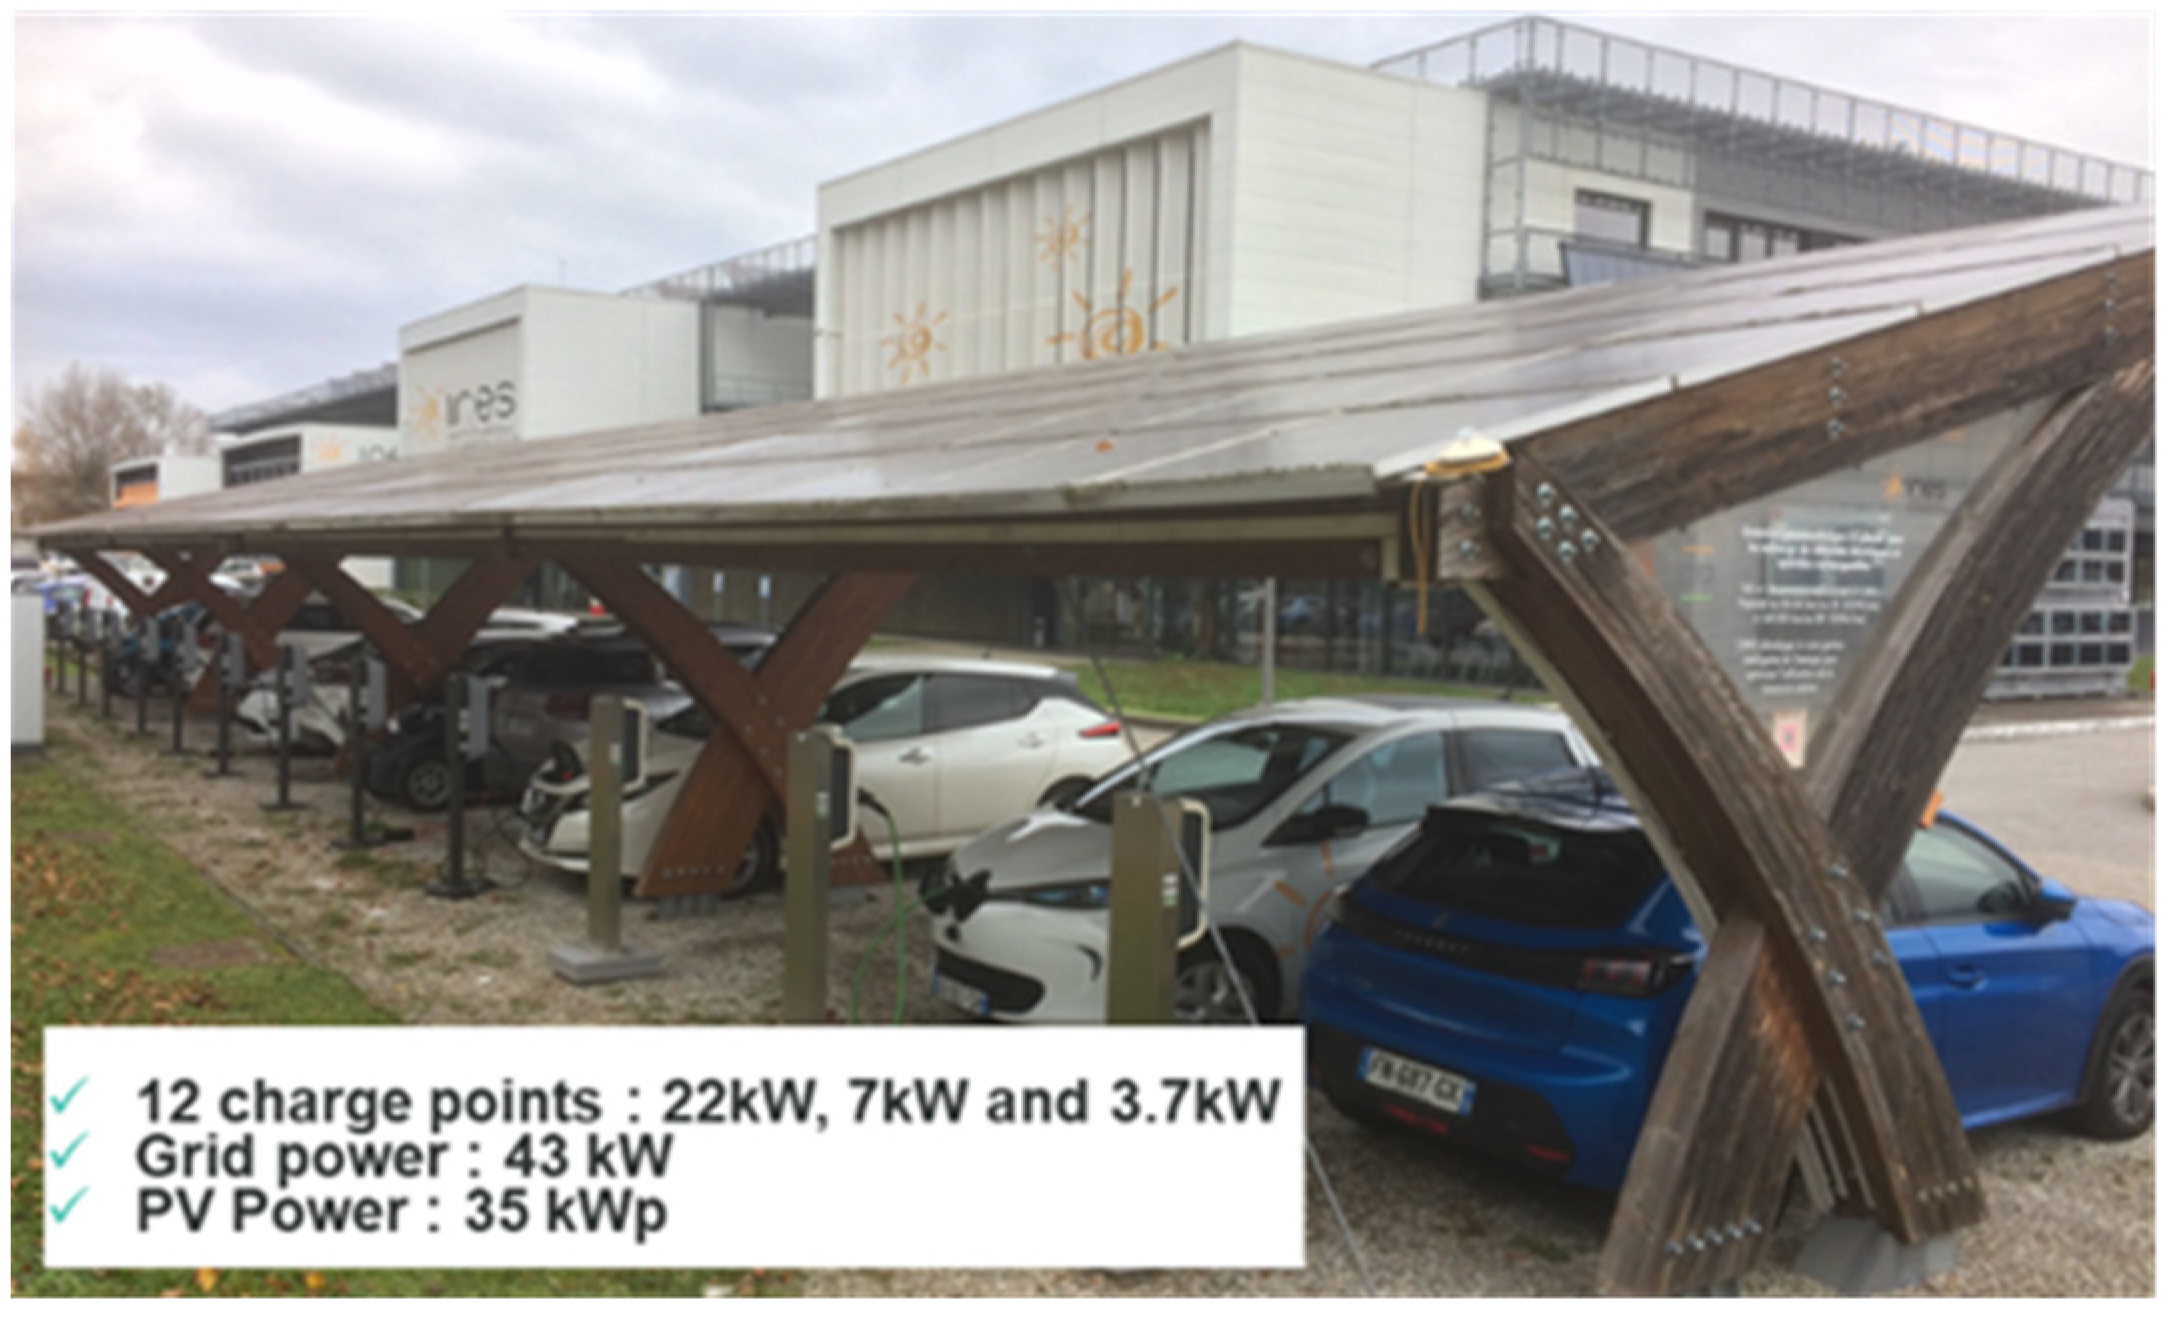
The smart-charging EMS and OCPI developed, capable of interfacing with the CPO back-end, was first tested in the laboratory on real-time simulators. It was then implemented on the CEA-INES research campus EV charging infrastructure in Chambéry, France. This infrastructure has a 43 kVA connection to the electricity grid and a local 35 kWp photovoltaic plant. It includes 12 AC charge points (3.7 kW, 7 kW and 22 kW) from different suppliers (Driveco and E-Totem). For this infrastructure, CEA-INES plays two roles: CPO and SCSP. We developed our own OCPP/CPO back-end, which offers an OCPI 2.2 interface able to link to our EMS. The complete system was set up so that the CEA-INES employees could charge their own vehicles at the office during the working day. More than 30 employees voluntarily took part in the evaluation test program, with vehicles from different car vendors (Renault, Nissan, Fiat, Volkswagen, Tesla, Hyundai, MG, Mazda, Peugeot, etc.).
After having been implemented and successfully tested at CEA’s charging infrastructure (Figure 14) since December 2022, the EMS developed was linked to Barcelona Municipality’s CPO back-end in order to manage one of their EV charging infrastructures. This infrastructure was equipped with five charge points of 3.7 kW and located at the Porta de Sarrià car park facility. The functional and operational tests were performed with success during the demonstration period of the eCharge4Drivers European project.

3.2. Results

As mentioned above, the developed smart charging EMS is capable of optimizing and controlling the charging infrastructure of electric vehicles, with the aim of maximizing the photovoltaic self-production ratio and minimizing the charging cost, while respecting user preferences and taking into account local grid constraints.
Over a 12-month test period, with smart-charging EMS, the self-production ratio can be increased to 56% on average and to 95% in some cases (on days when photovoltaic production is higher and the number of electric vehicles to be charged is greater).
Figure 15 illustrates the effect that smart charging has on the global consumption of CEA-INES’ charging infrastructure. In the right-hand-side figure, one can see the sums of the power consumption of 12 charging sessions carried out with smart charging. Each EV charging profile was calculated to use as much local renewable energy as possible for all vehicles charged before their planned departure time. The left-hand-side figure shows what would have happened without smart charging. This latter figure is obtained by simulating, for each session, the “uncontrolled” charging power. With each session’s maximum power and transferred energy amount, this simulation is pretty straight forward. In this case, a high peak power demand is observed at the beginning of the day, while the photovoltaic plant produces less energy, leading to a consequent withdrawal of energy from the grid and a probable overshoot of the subscribed power.

4. Discussion

Using the architecture we have illustrated in the current paper, CPOs can concentrate on their core responsibilities: developing and maintaining charging infrastructure and ensuring that it is operational. The development of Energy Management Systems requires knowledge of the optimization opportunities that exist to allow CPO and EV users to benefit from variable electricity prices. Additionally, it requires mathematical skills to implement the optimization algorithms that will exploit these opportunities. Also, energy regulations change as more and more electricity consumers also become producers. In France, for instance, there is now the possibility of buying electricity from nearby photovoltaic plants through Power Purchase Agreements (PPAs), so SCSPs will leverage their expertise in setting up these contracts and adapting their algorithms to accommodate the new rules that will undoubtedly emerge.
Our proposed solution architecture is highly relevant and advantageous for CPOs, as it enables them to quickly implement and test the performance of smart charging solutions offered by different SCSP suppliers with a mind to selecting them. CPOs will be able to choose those with the best performance for their final large-scale deployments. It also allows them to change the SCSP supplier without further development, even during the operation phase, as our solution is based on standard protocols, making it flexible and interoperable.
Delegating the energy management to a specific operator through the OCPI protocol also has another advantage: as already stated, OCPI can work with two communication models, push and pull. In the push model, the CPO updates the SCSP each time a charging session evolves. That way, the SCSP can integrate these messages in real time and will be fully aware of the details of the current active sessions. With the pull model, the SCSP can ask the CPO to provide the full list of active charging sessions that need energy (by submitting a GET request on the session endpoint of the CPO). This particular feature, which has no equivalent in OCPP, for instance, makes it possible to easily benchmark different SCSP solutions. Some information systems offering, even partially, the OCPI interface of a CPO back-end could serve various lists of fake active sessions to the SCSPs being evaluated in order to understand the differences between the different sets of charging profiles that the SCSPs will send back. Obviously, the different SCSPs will also need to be fed with the charging infrastructure descriptions and energy source forecasts, and they might differ in the level of detail that they can cope with or exploit here, and this might show in their results. For instance, an SCSP performing single-line optimization rather than one that properly models the three-phase electric distribution might propose charging profiles that lead to an under-usage of the available grid power or, in the opposite case, to protection overloads.

5. Conclusions

This paper presented a new design approach for a smart charging system based on the separation between the SCSP and the CPO roles. It allows better flexibility for the CPO by testing and evaluating the performance of the smart charging solution before its final large-scale deployment. In the design of the SCSP (EMS), the standard protocol OCPI interface is developed to connect with any CPO back-end and to receive all necessary information, such as the infrastructure descriptions and the on-going charging sessions, for EMS computing. A mobile application has been developed to enable EV users to interact with the EMS system by providing their user preferences (the state of charge of the vehicle on arrival, the scheduled departure time and the need for energy if required) and also to be able to monitor their on-going charging session or change the scheduled departure at any time. The EMS is designed by taking into account, as input data, all forecast data (the local photovoltaic production, the local load consumption and electricity price), the charging infrastructure power constraint and the local grid constraint, in its Optimization Program, and then providing an optimal charging profile for each EV connected at the charge point through the OCPI interface linked to the CPO back-end. In addition, the energy management system prioritizes charging sessions according to user preferences, ensuring that their vehicle is fully charged before they leave. As a modular structure in the design, the EMS can be easily configured with one objective given for the optimization or combining of several objectives for optimization, for example maximizing the self-production ratio using the local RES and reducing the charging cost. The EMS has already been successfully deployed and operated in two use cases: (1) EV charging infrastructure at the CEA research center in Chambéry, France, and (2) EV charging infrastructure installed in a public car park facility in Barcelona, managed by Barcelona Municipality. In the first use case, the EMS was configured to maximize the self-generation ratio, whereas in the second use case it was configured to minimize the charging cost. More than 10,000 smart charging sessions have been carried out since the EMS system was set up.

Author Contributions

Conceptualization, S.G.; methodology, S.G.; software, S.G. and R.C.; assessment and operation of the systems, S.H. and R.C.; writing—review and editing, S.G., S.H., R.C. and G.G.; supervision and review, S.H.; project administration, S.H. All authors have read and agreed to the published version of the manuscript.

Funding

This work has been realized in association with INES.2S within the French national program Investments for the Future (ANR-10-IEED-0014-01) and received funding from the European Union’s Horizon 2020 research and innovation program under the grant H2020-LC-GV-2019 program under Grant Agreement No. 875131.

Data Availability Statement

The original contributions presented in the study are included in the article, further inquiries can be directed to the corresponding author.

Conflicts of Interest

The authors declare no conflict of interest.

Abbreviations

AbbreviationMeaning
CEACommissariat à l’Energie Atomique
CPOCharge Point Operator
DSODistribution Service Operator
EMSEnergy Management System
eMSPE-Mobility Service Provider
EVElectrical Vehicle
INESInstitut National de l’Energie Solaire
kVAKilo Volt Ampere
kWKilo Watt
kWpKilo Watt Peak
kWhKilo Watt Hour
OCPIOpen ChargePoint Interface
OCPPOpen ChargePoint Protocol
PPAPower Purchase Agreement
RESRenewable Energy Source
SCSPSmart Charging Service Provider
TSOTransport Service Operator

References

  1. IRENA. Electric-Vehicle Smart Charging. In Innovation Landscape Brief; IRENA: Masdar City, United Arab Emirates, 2019. [Google Scholar]
  2. Grigorev, A.; Mao, T.; Berry, A.; Tan, J.; Purushothaman, L.; Mihaita, A.S. How will electric vehicles affect traffic congestion and energy consumption: An integrated modelling approach. In Proceedings of the 2021 IEEE Intelligent Transportation Systems Conference (ITSC), Indianapolis, IN, USA, 19–21 September 2021. [Google Scholar]
  3. CEER. CEER Report on Electric Vehicles: Network Management and Consumer Protection; CEER: Ljubljana, Slovenia, 2023. [Google Scholar]
  4. Amann, G.; Escobedo Bermúdez, V.R.; Boskov-Kovacs, E.; Gallego Amores, S.; Giannelos, S.; Iliceto, A.; Ilo, A.; Chavarro, J.R.; Samovich, N.; Schmitt, L.; et al. E-Mobility Deployment and Impact on Grids, Impact of EV and Charging Infrastructure on European T&D Grids—Innovation Needs; Publications Office of the European Union: Luxembourg, 2022. [Google Scholar]
  5. Fleck, T.; Gohlke, S.; Nochta, Z. A Smart Charging System to Efficiently Run EV Fleets. In Proceedings of the 36th International Electric Vehicle Symposium and Exhibition (EVS36), Sacramento, CA, USA, 11–14 June 2023. [Google Scholar]
  6. Frendo, O.; Graf, J.; Gaertner, N.; Stuckenschmidt, H. Data-driven smart charging for heterogeneous electric vehicle fleets. Energy AI 2020, 1, 100007. [Google Scholar] [CrossRef]
  7. Marinelli, M.; Calearo, L.; Ried, S.; Pfab, X.; Cabrera, J.C.D.; Spalthoff, C.; Braun, M.; Sæle, H.; Torsæter, B.N.; Astero, P.; et al. Electric Vehicles Demonstration Projects—An Overview Across Europe. In Proceedings of the 2020 55th International Universities Power Engineering Conference (UPEC), Turin, Italy, 1–4 September 2020; IEEE: Piscataway, NJ, USA; pp. 1–6. [Google Scholar]
  8. Robisson, B.; Guillemin, S.; Marchadier, L.; Vignal, G.; Mignonac, A. Solar Charging of Electric Vehicles: Experimental Results. Appl. Sci. 2022, 12, 4523. [Google Scholar] [CrossRef]
  9. Sadeghian, O.; Oshnoei, A.; Mohammadi-Ivatloo, B.; Vahidinasab, V.; Anvari-Moghaddam, A. A Comprehensive Review on Eletric Vehicles Smart Charging: Solutions, strategies, technologies, and challenges. J. Energy Storage 2022, 54, 105241. [Google Scholar] [CrossRef]
  10. Lei, X.; Yu, H.; Yu, B.; Shao, Z.; Jian, L. Bridging electricity market and carbon emission market through electric vehicles: Optimal bidding strategy for distribution system operators to explore economic feasibility in China’s low-carbon transitions. Sustain. Cities Soc. 2023, 94, 104557. [Google Scholar] [CrossRef]
  11. Flocea, R.; Hîncu, A.; Robu, A.; Senocico, S.; Traciu, A.; Remus, B.M.; Răboacă, M.S.; Filote, C. Electric Vehicle Smart Charging Reservation Algorithm. Sensors 2022, 22, 2834. [Google Scholar] [CrossRef] [PubMed]
Figure 1. CPO, eMSP and SCSP architecture proposed by OCPI specifications.
Energies 17 02873 g001
Figure 2. Global architecture including OCPI endpoints.
Energies 17 02873 g002
Figure 3. OCPP charge point/CPO back-end communication for a typical session.
Energies 17 02873 g003
Figure 4. Charge point/CPO back-end/eMSP back-end communication.
Energies 17 02873 g004
Figure 5. Charge point/CPO back-end/SCSP back-end communication.
Energies 17 02873 g005
Figure 6. CPO-SCSP link and EMS architecture overview.
Energies 17 02873 g006
Figure 7. Partial infrastructure electrical diagram.
Energies 17 02873 g007
Figure 8. Electrical diagram of the charging infrastructure.
Energies 17 02873 g008
Figure 9. Grid electricity prices (day ahead).
Energies 17 02873 g009
Figure 10. EV users’ UI interface used at CEA-INES.
Energies 17 02873 g010
Figure 11. SMOU application used as the EV users’ UI in Barcelona.
Energies 17 02873 g011
Figure 12. Power constraint identification.
Energies 17 02873 g012
Figure 13. Optimization program synopsis.
Energies 17 02873 g013
Figure 14. CEA-INES charging infrastructure.
Energies 17 02873 g014
Figure 15. Photovoltaic self-production results, without and with smart charging.
Energies 17 02873 g015
Disclaimer/Publisher’s Note: The statements, opinions and data contained in all publications are solely those of the individual author(s) and contributor(s) and not of MDPI and/or the editor(s). MDPI and/or the editor(s) disclaim responsibility for any injury to people or property resulting from any ideas, methods, instructions or products referred to in the content.