Article

Assessing Open Circuit Voltage Losses in PEMFCs: A New Methodological Approach

by
Francesco Mazzeo
*,
Luca Di Napoli
and
Massimiliana Carello
*
Innovative Electric and Hybrid Vehicles (IEHV) Research Group, Department of Mechanical and Aerospace Engineering (DIMEAS), Politecnico di Torino, 10129 Turin, Italy
*
Authors to whom correspondence should be addressed.
Energies 2024, 17(11), 2785; https://doi.org/10.3390/en17112785
Submission received: 7 May 2024 / Revised: 26 May 2024 / Accepted: 30 May 2024 / Published: 6 June 2024

Abstract

:
Proton-exchange membrane (PEM) fuel cells are increasingly used in the automotive sector. A crucial point for estimating the performance of such systems is open-circuit voltage (OCV) losses, among which the most influential are mixed potential, hydrogen crossover, and internal short circuits. These losses are often overlooked in the modeling of such electrochemical cells, leading to an inaccurate estimation of the real voltage that is calculated starting from the Nernst Equation. An innovative method is presented to estimate the losses based on the division of the membrane into two domains: solid and aqueous. The influence of the macro-parameters (temperature, pressure, and RH) was analyzed for each phenomenon and was linked to the membrane water content. For low levels of PEM hydration, internal short circuits were of the same order of magnitude as hydrogen crossover. The OCV model accuracy was assessed on a commercial stack, used on a vehicle prototype competing in the Shell Eco-Marathon challenge. The data of interest were obtained through laboratory tests and subsequent disassembly of the stack. A PEM thickness of 127 μm was measured corresponding to Nafion 115. For further validation, the model results were compared with data in the literature.

1. Introduction

The current economy in the energy sector is mainly based on fossil fuels; in order to reach the Net Zero Scenario 2050 Target, it is fundamental to decarbonize those sectors that are difficult to electrify, such as heavy, energy-intensive industry and heavy transport [1]. According to data from the International Energy Agency, the transport sector accounts for 23.0% of total CO2 emissions, with an increasing trend [2], which has led to doubling emissions over the past 30 years. This requires a powerful reduction in emissions to mitigate the mean global temperature rise and keep it below 2 °C compared to the pre-industrial era. To reach net zero emissions by 2050, a wider use of hydrogen and hydrogen-based fuels in existing applications is required, especially in heavy industry, heavy-duty transportation, shipping and aviation [3]. This will certainly encourage the inclusion of new zero-emission technologies such as fuel cells in these sectors.
A fuel cell is a system that can exploit these alternative fuels, converting their chemical energy directly to electricity through a chemical reaction that is characterized by high efficiency, simplicity, low emissions, and almost no noise [4]. Fuel-cell stack systems are under intensive development by several manufactures, with PEMFCs currently considered by many to be the most interesting technologies for ground vehicle applications [5,6], because they have no risk of electrolyte leakage and a short start-up time. PEMFCs are characterized by the use of a solid polymer electrolyte and can be divided in low-temperature PEMFCs (up to 90 °C) and high-temperature PEMFCs (up to 200 °C) [7].
The latter exhibit advantages due to high temperatures, which enhance performance by reducing mass and charge diffusion resistance, as well as by improving reaction kinetics [8]. In addition to the temperature, the relative humidity and the partial pressure of the reagents also affect the performance, so it is very important to study and model the behavior of FCs with the variation of these parameters to optimize the efficiency and the management of the main subsystems.
Although when we talk about losses for PEMFC, the attention falls on the various overvoltages linked to the kinetics of the reaction and mass transport, there are also other types of losses that are prevalent during moments of open-circuit operation. The gases in the anode and cathode compartments are separated by a polymer membrane, and the latter should ideally not allow mixing of the gases; however, a crossover phenomenon always occurs for hydrogen, oxygen and nitrogen, leading to reaction inefficiency. Furthermore, in OCV, the hydrogen that reaches the reaction sites releases protons and electrons and then recombines, as there is no closed path between the anode and cathode. Some of these electrons, however, pass through the membrane, giving rise to internal short circuits. These phenomena are directly connected to a decrease in the real voltage of the cell. Another phenomenon, partially reversible, is that of mixed potential, which concerns the oxidation of platinum at high cell voltages, which reduces catalytic activity.
Several studies have been carried out on this topic. J.J. Giner-Sanz [9] demonstrated the effect of cathodic and anodic pressure on hydrogen crossover phenomena and internal short circuits in a commercial PEMFC, while Saurabh A. Vilekar [10], using a theoretical model of mixed potential with a priori parameters, shows that open-circuit voltage losses can only be attributed to hydrogen crossover. E. Arato [11] demonstrated that voltage drops due to open-circuit losses associated with hydrogen crossover can be up to 30% of the effective voltage of an operating cell. Despite the importance of this topic, the estimation of these losses is often overlooked or omitted in PEMFC modeling [12,13]; this is common even in more advanced 1-D transient models, which, by not considering OCV losses, base the estimation of the actual voltage solely on the Nernst equation [14]. This is also a problem for the calculation of the voltage under load, which, in standard models, subtracts from the Nernst equation various losses due to reaction kinetics and mass transport. Having a wrong starting value results in inaccurate estimates of the system’s performance and efficiency. In other studies, only hydrogen crossover is considered and is modeled with diffusional theory or equivalent circuit models but separately from PEMFC models [9,15]. Furthermore, the extent of these losses is closely related to the thickness of the polymer membrane. The trend in the automotive market is to use ultra-thin membranes to achieve high-performance stacks [16]. As a result, it is essential to address these losses in practical applications to ensure the accurate and efficient operation of the systems.
The novelty of this work is to provide a methodology for the accurate estimation of the PEMFC voltage based on the calculation of the hydrogen crossover and internal short-circuit of a generic PEMFC considering the influence of all macro-parameters (temperature, pressure…) by dividing the PEM into two separate domains: solid and aqueous. These domains are exploited to calculate more precisely the hydrogen permeability and the electronic conductivity for nafion and water, thus arriving at a more precise estimate of the real OCV of the fuel cell. Furthermore, this approach can also be implemented in more complex electrochemical models, where the division of the domain for the PEM is important for modeling other phenomena, such as the conductivity of ions [17]. Moreover, PEMFCs’ compatibility with batteries has significantly heightened the focus on developing advanced-system energy-management solutions [18,19]. These technologies are integrated to meet the rising demand for efficient and clean energy sources, and the need for precise and realistic modeling becomes paramount. Our methodology for estimating the open-circuit voltage (OCV) loss enhances the accuracy and realism of simulation results, thereby providing more reliable insights for optimizing the performance and efficiency of PEMFC-based systems.
The model predictivity of the OCV was evaluated with comparison to other works of literature and through experimental data obtained in laboratory from a low-power PEMFC stack (Horizon H-500 type, Figure 1) [20] used in the automotive sector, in a vehicle prototype that competes in the Shell Eco-Marathon, one of the world’s leading student engineering competitions for energy efficiency [21]. During its use in the competition, the FC operated for a long time in open circuit; therefore, comprehending and modeling the extent of the losses that occur in this state is extremely useful for the correct management of the system and for improving its efficiency [22,23].
Small-scale PEMFCs have gained increasing attention as promising power sources due to their high power and energy densities and low pollution emissions. With the growing demand for electricity in various low-power devices, effective small-scale electricity storage solutions are needed, providing new opportunities for PEMFC technology [24]. The model was developed in MATLAB environment (version used: R2023b by The Mathworks, Inc., Natick, MA, USA) and is available, along with the experimental data, in the Supplementary Materials.

2. Experiments

2.1. Experimental Set-Up

The experimental setup for this measurement can be divided into three circuits: an anodic circuit, a cathodic circuit, and an electrical circuit. The hydrogen or anodic circuit consisted of a pressurized hydrogen storage at 200 bar with a dual-stage pressure regulator to set the desired pressure in the anode circuit [25] (Emerson, St. Louis, MO, USA), a flow meter to measure hydrogen consumption [26] (Vogtlin Instruments, Muttenz, Switzerland), and a closed valve at the anodic outlet of the stack. This configuration of the anode is referred to as “dead-end”, signifying that the stack operates under stoichiometric conditions, opening the valve solely to purge impurities. The cathodic circuit consisted only of fans, as the Horizon H-500 has an open-cathode design. Finally, the electrical circuit comprised an electronic load used to control the stack in current or voltage mode [27] (EA ELEKTRO-AUTOMATIK GMBH & CO. KG, Viersen, Germany) and an externally powered 12V electronic control board that allowed for variable-speed control of the fans and the purging valve. This setup is schematically depicted in Figure 2.

2.2. OCV Measurements

To investigate the model predictivity, the OCV as a function of temperature was measured, keeping constant the RH and the pressure of reactants. Before measuring the OCV, the PEMFC was conditioned using a polarization curve (Figure 3) up to the nominal current maintained until the target temperature was reached.
The polarization curve was obtained using a galvanostatic load. Current steps of 0.5 A were applied, and the time required to reach steady-state conditions was waited before recording the voltage. Throughout the test, hydrogen pressure was set to 1.5 absolute bar. The purging valve was opened for an approximate time of 100ms only to purge, towards the outside, the hydrogen and impurities accumulated in the anode at each step of current. It was decided to stop the test at about 0.2 A/cm2, corresponding to 0.64 V per cell, so as not to drop below the nominal voltage of 0.6 V per cell. When the PEMFC reached the target temperature, the loads and the fans for the air supply were turned off, and OCV measurement was performed after 10 s of stabilization. In Table 1, the main operating parameters are summarized, while the OCV trend is shown in the discussion of the results chapter.

2.3. Stack Disassembly

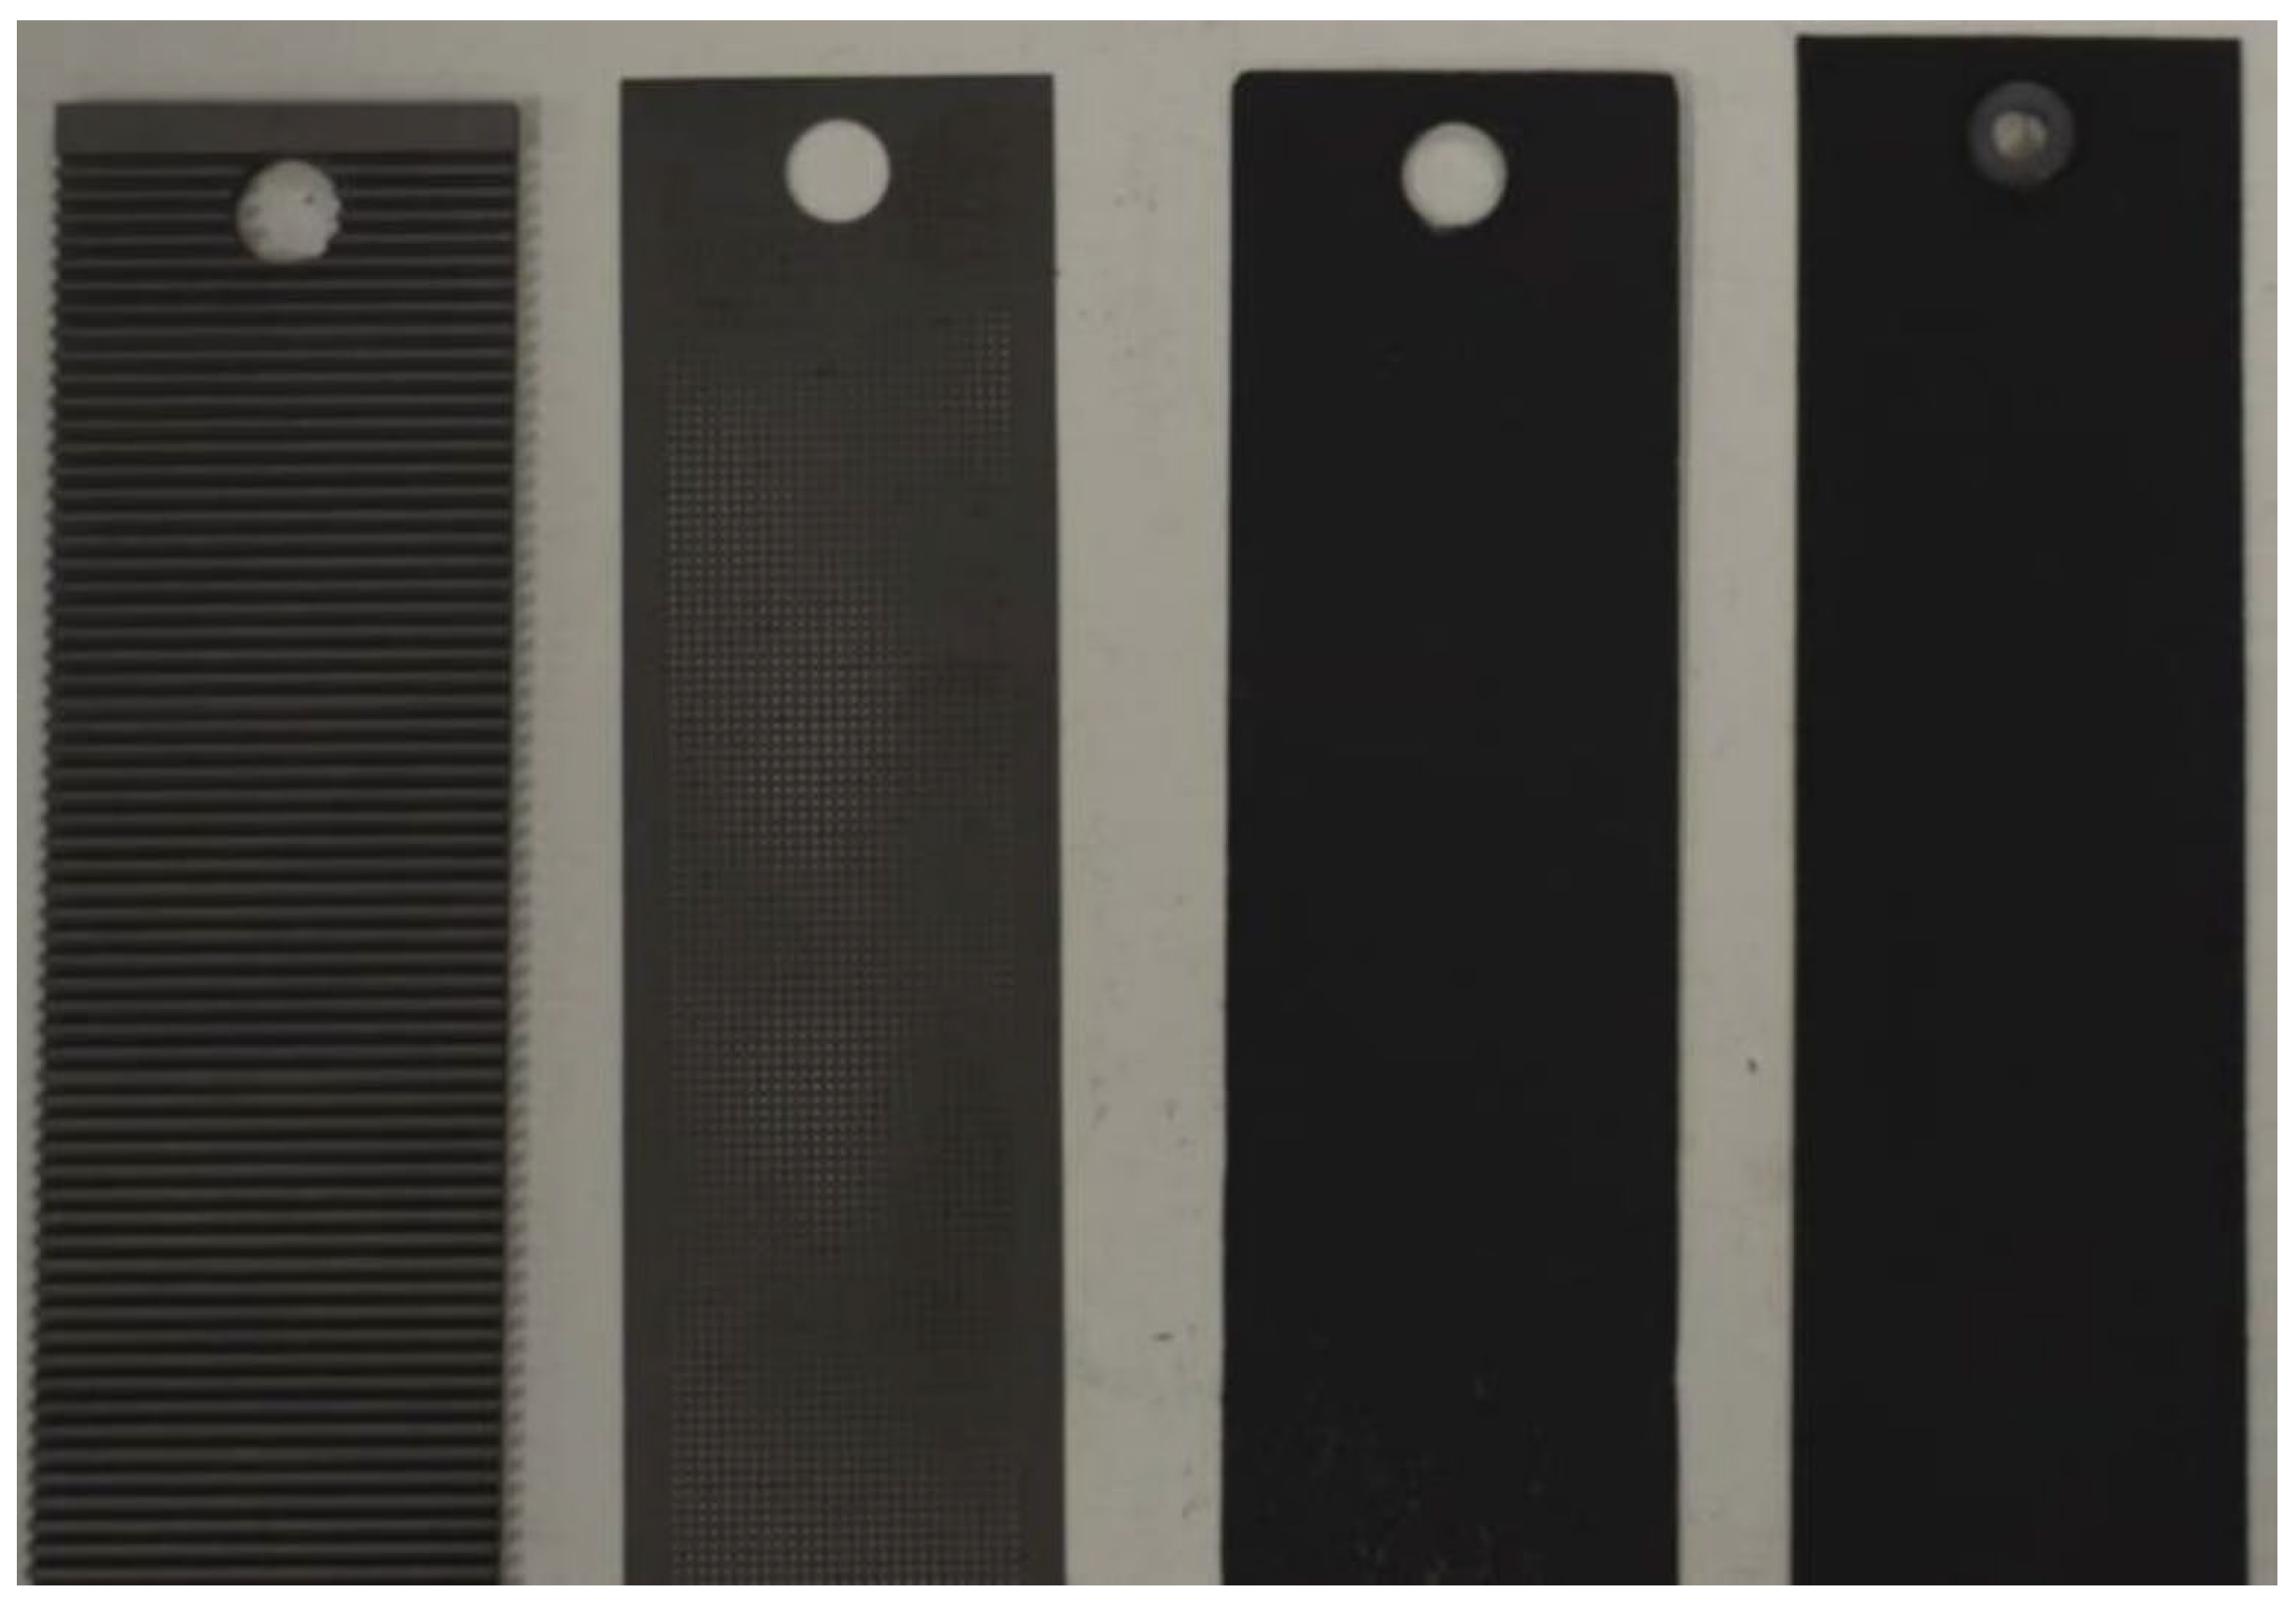
Following laboratory tests, the PEMFC stack was disassembled and analyzed to extract the important parameters needed for the model. The various layers are shown in Figure 4, and the extracted parameters are summarized in Table 2.
Thanks to the measurement of the thickness of the PEM, the material corresponding to Nafion 115 was identified.

3. OCV Calculation

3.1. OCV Calculation Methodology

A fuel cell is an electrochemical system that converts the chemical energy of the reactants into electrical energy. The Nernst equation describes the theoretical open-circuit voltage of a fuel cell (calculated at bulk):
O C V t h = G r e a c t n · F + R g a s · T · l n p H 2 · p O 2 0.5 p H 2 O
However, a real PEMFC exhibits open-circuit voltage (OCV) values lower than those obtained from the Nernst equation, as losses associated with hydrogen crossover, internal short circuits, and mixed potential must also be considered.
O C V = O C V t h V m i x e d   p o t V H 2 , c r o s s V i n t , S C
The losses due to hydrogen crossover and internal short circuits are modeled as a leakage current that the fuel cell must supply to compensate. For this reason, the dependence of the current must be introduced considering activation and ohmic losses. Concentration losses, in this study, can be neglected, as they dominate the PEMFC behavior at high current density, and a no-load condition is analyzed for the OCV losses.
The activation losses are related to the kinetic of the anode and cathode electrodes and are described by the Butler–Volmer equation, shown in Equation (3):
V a c t = 2 R g a s T n F sinh 1 i 2 i 0
where T is the temperature, n is the number of electrons exchanged in the considered half-reaction (anode or cathode) in the rate-determining step, F is the faraday constant, and i 0 is the exchange current density (i.e., the rate at which the half-reaction proceeds at the equilibrium). The latter parameter is the most important, as it describes the readiness of the electrode to proceed with the reaction and depends on temperature, concentration of the reactant, surface area and on the catalyst, so it is different for the cathode and anode electrodes. In a low-temperature PEMFC, the exchange current density of the oxygen reduction reaction (ORR) is the limiting factor, and consequently, the activation overpotential pertains to this reaction. The exchange current density was estimated by fitting Equation (4) to experimental data; however, the details are omitted, as they are the output of a much more complex model. For details, refer to other works in the literature [28,29,30].
The Ohmic losses are linked with the transport of charge through the fuel cell; these stem from the resistance to the flow of electrons in the various fuel cell components, as well as the resistance to the flow of ions in the electrolyte, which is the largest contribution [31]. The Ohmic resistance depends on the quantity of water inside the PEM, on the temperature and on the current [32], and can be modeled with Ohm’s Law:
V O h m = R e l e c t r o n + R i o n s · I = R o h m I
Combining Equations (1)–(4), the real OCV voltage can be calculated as follows:
O C V I l e a k = G r e a c t n F + R g a s T · l n p H 2 · p O 2 0.5 p H 2 O 2 R g a s T n F sinh 1 I l e a k 2 I 0 R o h m I l e a k V m i x e d   p o t
The leak current is an output of the model of hydrogen crossover and internal short-circuit. Starting from the operating condition of the PEMFC, the water and solid domains of the membrane were calculated and used to calculate the leakage current. A different approach was used for the mixed potential and considered as a voltage drop.

3.2. PEM Domain Division

The heart of this innovative approach for estimating open-circuit losses is to divide the PEM into two distinct domains, one solid and one aqueous, with different characteristics that depend on the FC macro-parameters. To quantify the water content of Nafion, λ is typically introduced, which is defined as the amount of water per sulfonic acid group [33] and is the sum of the number of water molecules exothermally solvating the ionic species ( λ L ) and the water molecules driven into the membrane by osmosis ( λ 0 ).
λ = λ L + λ 0
λ 0 = 1 ln R H p V H 2 O m R T
λ L = i = 1 5 j = 1 i θ j   w i t h   θ j = R H   e x p Δ H j p V H 2 O m R T 1 + R H   e x p Δ H j p V H 2 O m R T
where p is the internal swelling pressure, V H 2 O m is the molar volume of water m 3 / m o l , R H is the relative humidity [ ] , Δ H j is the molar heat of hydration (the values depend on the number of molecules of water absorbed and on temperature and pressure) and θ j is the coverage of the j t h water molecule adsorbing on the ( j 1 ) t h water molecule hydrating a sulfonic acid group.
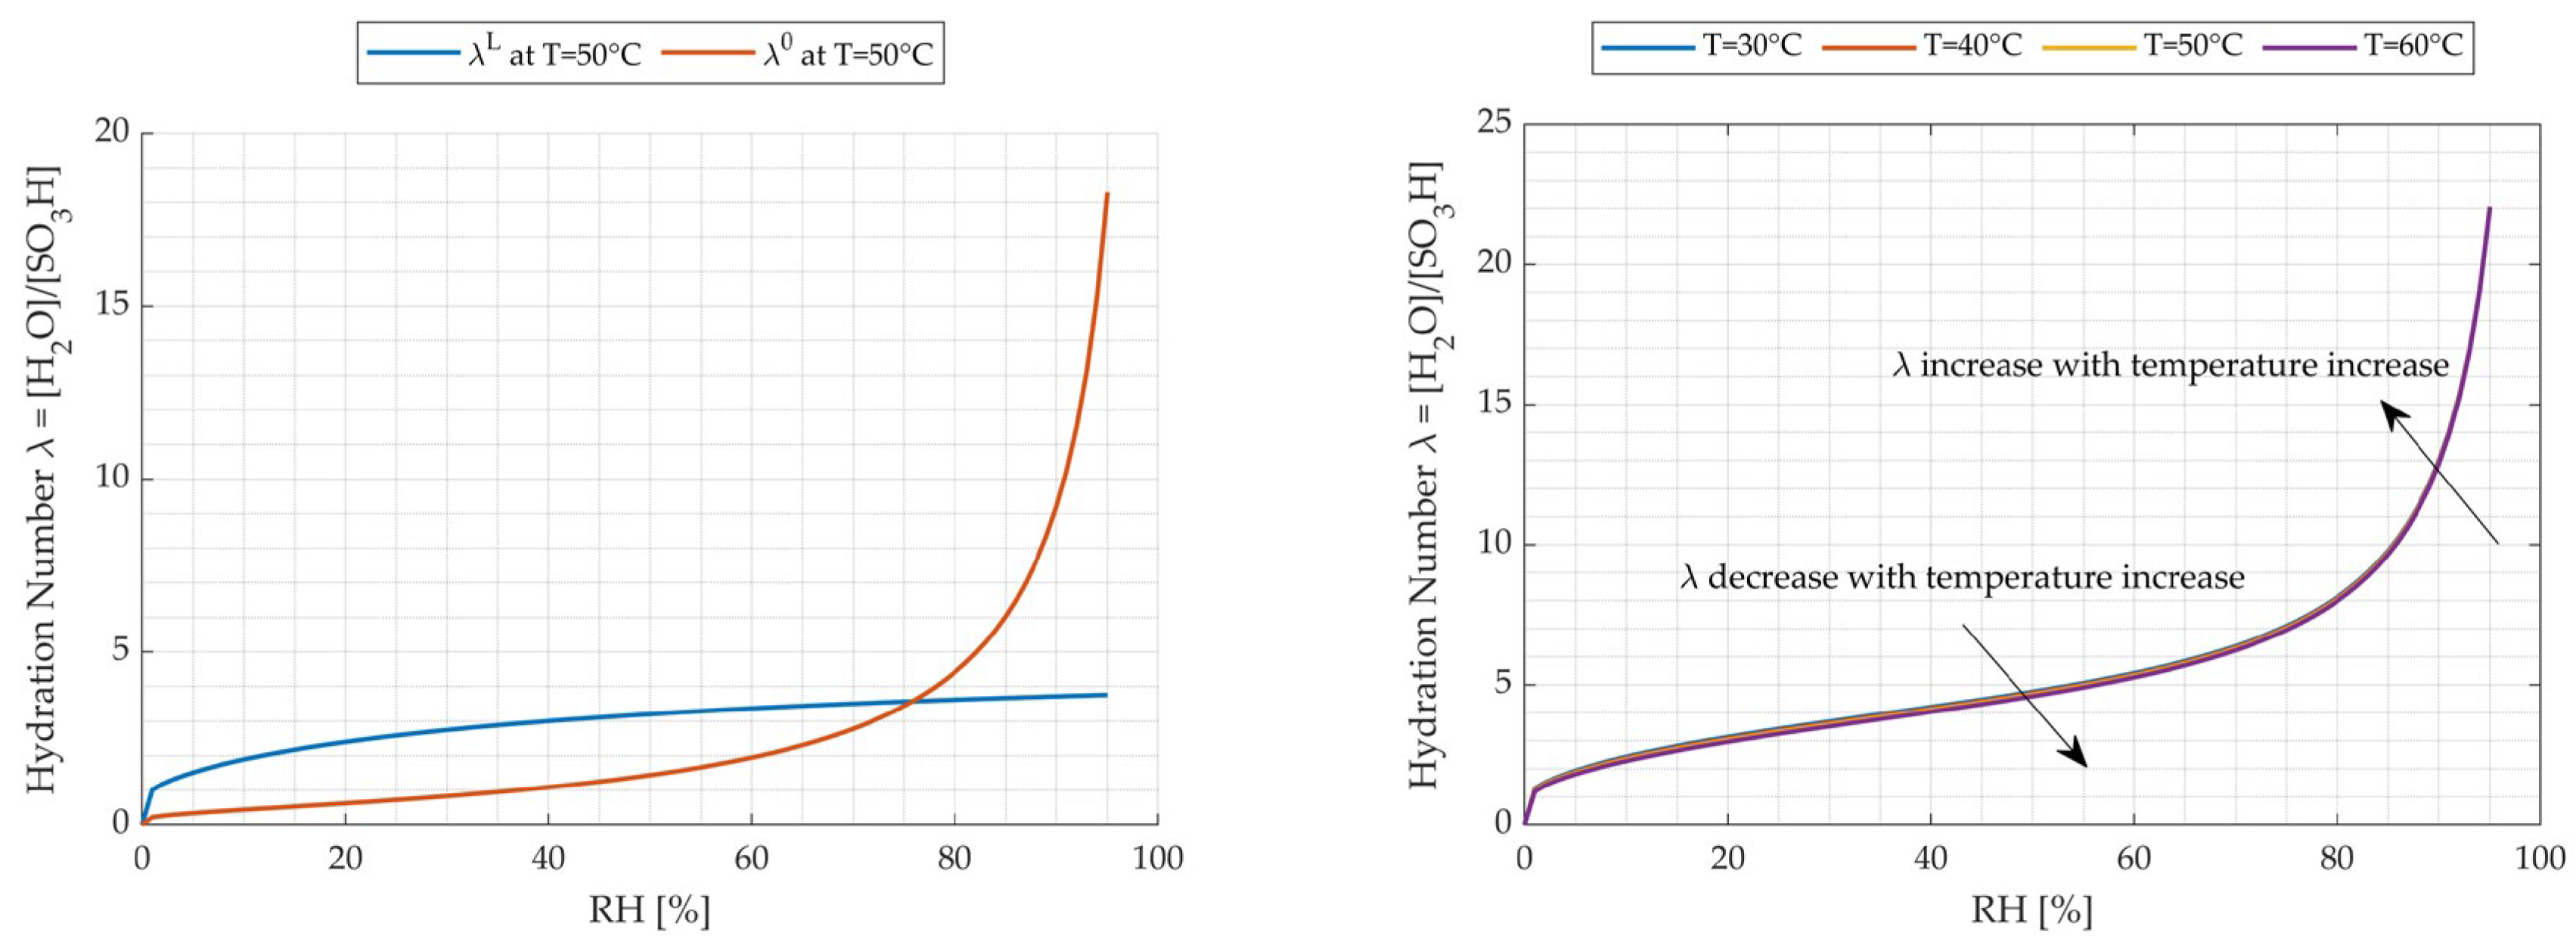
Figure 5 shows, on the left, a comparison between the λ L and λ 0 , while on the right, it shows the trend of λ . At lower RH, the solvating process ( λ L ) has a greater influence over osmosis ( λ 0 ), while as the humidity increases, osmosis becomes predominant. This effect is reflected in the hydration number λ (Figure 5 on the right), whose shape is the superposition of the two effects. Moreover, there is also a dependence on temperature: for lower RH, the hydration number λ decreases as T increases due to λ L (Equation (8)), whereas for higher values of RH, the hydration number λ slightly increases as T increases and can be considered almost constant; this is due to λ 0 (Equation (7)).
To define the solid and aqueous domains, it is necessary to know the molar volume of water, the Nafion molar volume per mole of sulphonic acid (SO3H) and the hydration number λ. To calculate the molar volume of Nafion, it is necessary to evaluate the molecular weight of Nafion, which is difficult to assess, and, for this reason, the equivalent weight is used, which is defined as the weight per mole of the sulphonic group [SO3H] and is obtained from the literature [14]. Knowing the equivalent weight (EW), the density of Nafion and the volume occupied by the PEM, it is possible to calculate the Nafion molar volume per mole of sulphonic acid [SO3H]. The values are shown in Table 3.
The density of Nafion is the experimental value obtained by analyzing the PEM under study and differs from the theoretical value of 3.5% (1968.5 kg/m3). The solid and aqueous volume ratio can be defined as follows:
x H 2 O = λ · V H 2 O , m λ · V H 2 O , m + V N a f , d r y , m  
x N a f = V N a f , d r y , m λ · V H 2 O , m + V N a f , d r y , m
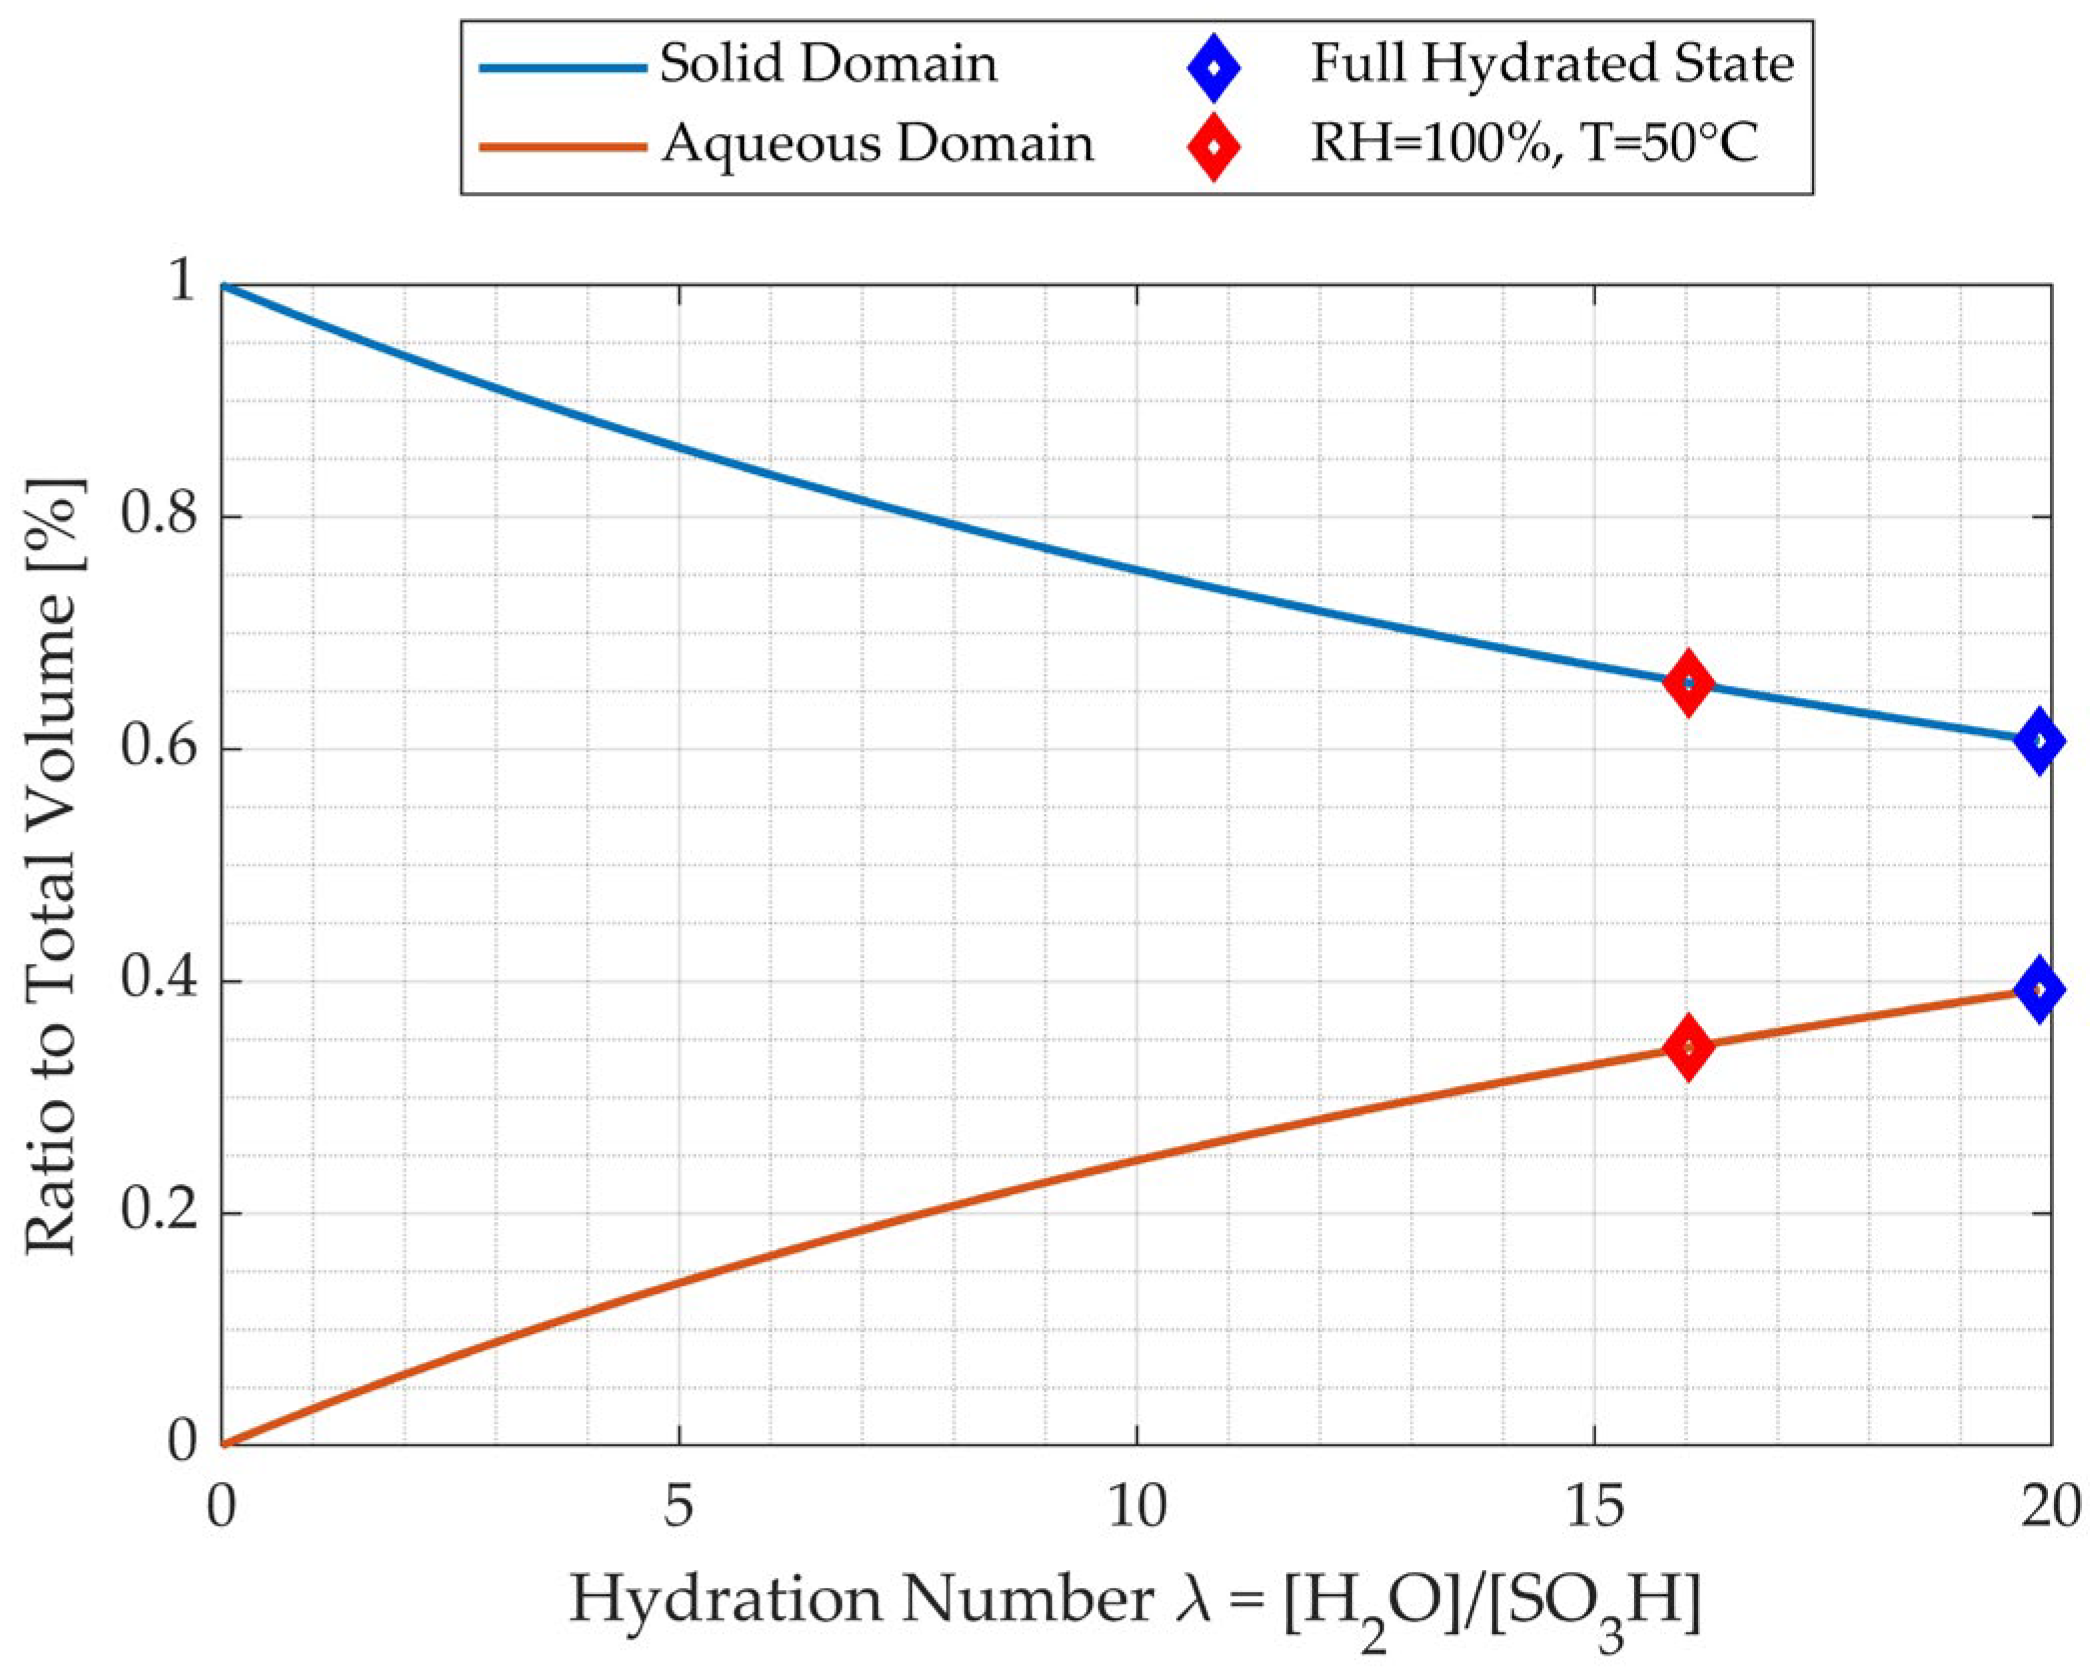
where V H 2 O , m is the water molar volume, and V N a f , d r y , m is the dry Nafion molar volume. The ratio between the two domains varies as the hydration number λ varies and therefore varies with respect to RH and temperature. Figure 6 shows, at T = 50 °C, how as the hydration increases, the aqueous domain increases. In particular, the percentage of aqueous and solid domains in the RH = 100% condition achieved λ ≈ 16, and in the full hydrated state, obtained λ ≈ 20 [33].

3.3. Gas Crossover

During the normal operation of a PEMFC, small amounts of reactants diffuse from one compartment to the other through the PEM, including the passage of hydrogen from the anodic to the cathodic zone and oxygen and nitrogen from the cathodic to the anodic zone; these diffusive fluxes are called gas crossovers [34]. Oxygen permeation through the membrane can cause the formation of peroxide and hyperoxide radicals that are sources of degradation, reducing the lifetime of PEMFC stacks [35]. Nitrogen crossover from the cathode to the anode side reduces the hydrogen concentration and can cause local fuel starvation [36]. However, the most relevant crossover that occurs in a PEMFC is related to the passage of hydrogen from anode to cathode, and since it has a smaller molecular size, this flow is orders of magnitude greater than that of the other gases; therefore, it is assumed that it is the only one of interest for modeling [37]. This phenomenon becomes less significant as the current increases, as the hydrogen consumption rate increases, and therefore, there is a decrease in the diffusion driving force. Moreover, as the current density increases, the influence on the total losses is also less significant. The side effects of this crossover phenomena are all linked and can be summarized as follows:
  • The hydrogen that permeates through the membrane does not react, releasing ions and electrons, thus leading to fuel inefficiency.
  • The hydrogen that reaches the cathode compartment is subject to an oxidation-reduction reaction with oxygen, which causes local hotspots and degradation as well as a reduction in the oxygen available for the electrochemical reaction with a consequent decrease in the voltage of the FC.
The oxidation reaction of the hydrogen that has crossed the membrane is shown in Equation (11):
H 2 , C r o s s 2 H + + 2 e
This reaction can be associated with a potential difference between the electrodes U C r o s s . As this increases (in addition, as the crossover voltage increases, the current required at the FC decreases, and therefore, the concentration of hydrogen at the anode (bulk) increases, increasing the amount of hydrogen that can pass through the membrane), the rate of oxidation of the crossover hydrogen also increases, leading to an increasing crossover current I C r o s s . This current tends towards a horizontal asymptote (limit value), which represents the condition in which all hydrogen crossed has been oxidized, and it is therefore associated with the mass transport limit. The crossover current is given by Equation (12):
I H 2 , C r o s s = A n F J H 2 , C r o s s
where A is the cell effective area, n is the number of exchanged electrons in the reaction, F is Faraday’s constant, and J H 2 , C r o s s represents the hydrogen crossover flux.

3.3.1. Hydrogen Crossover Model

H2 crossover is a diffusion phenomenon caused by a concentration gradient between anodic and cathodic compartments. It can be described by Fick’s law, which, rewritten in electrical analogy, becomes:
J H 2 C r o s s = C H 2 , a C H 2 , c R a c
where C H 2 , a and C H 2 , c are the concentration of hydrogen at the anode and cathode catalyst layer, respectively, while R a c is the total diffusion resistance between anodic and cathodic part. Considering a 1-D diffusion through infinite slabs in series, the diffusion resistance can be expressed as follows:
R i = t i D i e f f = t i D i ε i τ i
where t i is the thickness of the i-th layer, D i is the hydrogen diffusion coefficient of the i-th layer, while ε i and τ i are the porosity and tortuosity of the i-th layer, which reflects the real capacity to transport mass.
In the case under study, but more generally in a PEMFC, the greatest contribution to diffusion resistance is given by the PEM layer [38], so the H2 crossover flux can be expressed as follows:
J H 2 C r o s s = D P E M e f f t P E M · C H 2 , C l , a C H 2 , C l , c = D P E M e f f t P E M C H 2 , C l , a = D P E M e f f t P E M K H 2 P E M P H 2 , m
Given the assumption that the concentration of hydrogen at the cathode catalyst layer is negligible compared to that in the anode side, the concentration at the anode catalyst ( C H 2 , C l , a )   depends on the hydrogen-solubility constant of the PEM ( K H 2 P E M ) and the pressure exerted by the hydrogen on the membrane ( P H 2 , m ) . The crossover is therefore related to the gas solubility in the polymeric membrane and diffusive phenomena. The product of the solubility constant and the effective diffusion coefficient gives the so-called permeability coefficient of hydrogen in the PEM ( φ H 2 P E M ) . This coefficient relates the diffusion, absorption, and desorption phenomena that regulate hydrogen crossover. At the end, the crossover flux can be expressed as follows:
J H 2 C r o s s = φ H 2 P E M t P E M P H 2 , m
Since the PEM is divided into two separate domains (aqueous and solid), the hydrogen permeability coefficient in the PEM will be the weighted sum of the hydrogen permeability coefficient in the dry Nafion and in the water, respectively.

3.3.2. Influence of Pressure

Schalenbach et al. [39], using the electrochemical monitoring technique, demonstrate that the pressure difference between the anode and cathode (the study was conducted by analyzing a differential pressure in the range from 0 to 5 bar) does not act as a driving force for gas permeation through Nafion. Therefore, the H2 crossover depends, according to Equation (16), on the hydrogen pressure but not on the pressure difference, so the differential pressure did not push hydrogen through the membrane. This evidence occurs if the applied differential pressures are below the capillary pressure (it was estimated by Eikerling et al. [40] to be of the order of 100 bar), and it can be concluded that the crossover of hydrogen through PEM is mainly of a diffusive nature and increases linearly with the rise in hydrogen partial pressure. This dependence is illustrated for the typical operating range of 0.5–2 bar in the discussion of the results.

3.3.3. Influence of Relative Humidity (RH)

In general, the H2 permeability through the Nafion increases with increases in relative humidity; this means that the H2 crossover flux increases with the growth in the aqueous domain. When Nafion is hydrated, water tends to accumulate in the pores of the Nafion, creating water channels [39]; thus, gas can pass through the solid or aqueous domain. Since the permeability of water is greater than the permeability of dry Nafion, an overall increase in permeability will be seen as hydration increases. This concept is better shown in Figure 7, where the different possible paths for H2 permeation through the two different domains are illustrated.
In conclusion, the influence of relative humidity can be translated into a dependence of the permeability coefficient on the size of the solid and aqueous domains.

3.3.4. Influence of Temperature

The permeability coefficient encompasses the effects of surface and diffusion phenomena. The diffusion of a gas through a polymer is also due to the thermal movement of the gas molecules in the membrane structure. This movement is mainly due to thermally activated jumps across the potential barriers that the Van der Waals forces between the polymer chains comprise [41]. The temperature dependence of hydrogen permeability in dry Nafion and water can be described by an Arrhenius equation.
φ H 2 N a f T = φ H 2 N a f , 0 ( T ) · e E D + H S k B T = φ H 2 N a f , 0 ( T ) · e E A k B T
φ H 2 H 2 O T = φ H 2 H 2 O , 0 T · e ( E D + H S ) k B T = φ H 2 H 2 O , 0 · e E A k B T
where E D is the activation energy for the permeation, H S denotes the heat related to the absorption process, kB is the Boltzmann constant, E A is the activation energy, φ H 2 N a f , 0 is the proportional factor for the definition of temperature dependence of the permeability coefficient, and T is the temperature.
The pre-exponential proportional factors have a temperature dependency; however, for the water, hydrogen permeability can be assumed constant [39]. The parameters necessary to calculate the hydrogen permeability coefficient of Nafion and water were obtained from linear fits in the Arrhenius plot (ln( φ ) vs. 1/T) to the experimental data available in the literature [39,42,43], and these are shown in Table 4.

3.3.5. Evaluation of the Overall Permeability Coefficient

The overall H2 permeability is the weighted average of the permeability of the Nafion and water based on the size of the aqueous and solid domains.
φ H 2 P E M ( T , λ ) = φ H 2 H 2 O ( T ) · x H 2 O ( λ ) + φ H 2 N a f ( T ) · x N a f ( λ )
Inserting this value of permeability inside Equations (12) and (16) allows the evaluation of the H2 crossover current.

3.4. Internal Short-Circuits

During the normal operation of a fuel cell, the electrons produced by the oxidation of hydrogen at the catalyst layer should be collected by the electrode and pass into the external circuit. A small amount of electrons pass through the PEM causing an increase in hydrogen consumption to meet the load demand, this phenomena is called internal short-circuit. These losses, like the hydrogen crossover, are negligible at high current densities since are order of magnitude lower compared to the hydrogen consumption rate and the electric current, respectively [44]. The proper modeling of internal short-circuit currents is critical in suitably reproducing the experimental behavior of PEMFCs at low current densities. In this paper, the losses are modeled with the calculation of a short-circuit resistance as a function of the PEM solid and aqueous domains, and through Ohm’s law, it is translated to a short-circuit current. The internal short-circuit resistance is a function of anodic and cathodic pressure, relative humidity of the membrane and temperature. The pressure effect is like that of camping pressure on contact resistance. An increase in gas pressure leads to an increase in the effective contact area between the different layers, thus leading to a decrease in short-circuit resistance. Instead, an increase in gas pressure leads to a change in the morphology and porosity of the catalyst and GDL, which results in an increase or decrease in short-circuit resistance depending on the characteristics of the PEMFC.

Internal Short-Circuit Model

Mishra et al. [45] proposed a semi-empirical model for the effect of the clamping pressure on the contact resistance:
R c o n t a c t = A · B C · P D
where P denotes the clamping pressure, and A, B, C, D are experimental parameters that can be obtained by studying the effect of gas pressure to the effective interfacial contact area and on the morphology and porosity of the catalyst and GDL.
Following the analogy between the gas pressure–short-circuit resistance and the clamping pressure–contact resistance, the effect of pressures in the anode and cathode compartments on short-circuit resistance can be reproduced by readjusting Equation (20):
R S C = α · P a θ a · P c θ c
where α , θ a , θ c are the model parameters, equivalent to the A, B, C parameters of Mishra’s model, R S C is the internal short-circuit resistance, and P a and P c are, respectively, the anodic and cathodic pressure.
However, the value of these coefficients depends on the characteristics of the fuel cell, and therefore, experimental tests must be carried out to determine the value for each specific fuel cell. This greatly limits the application of this model; for this reason, a simplification of the short-circuit losses is proposed in this study by neglecting the effect of pressure. Therefore, only the parameter α has been estimated, which is equal to
R S C = α = r P E M · t P E M A P E M
where t P E M / A P E M is the ratio between the thickness and effective area of PEM, while r P E M is the electronic resistivity of the hydrated Nafion 115 (Ω cm) and depends on the size of the aqueous and solid domains.
r P E M ( λ ) = r H 2 O · x H 2 O ( λ ) + r N a f · x N a f ( λ )
Table 5 shows the electronic resistivity values considered for the two domains. In particular, the water resistivity is obtained from the work of Hristovski et al. [46], which studies the possibility of producing potable water from PEMFCs and considers various indicators, including the electrical conductivity of water calculated in other studies on various PEMFC systems in the US. The inlet and outlet values of electrical conductivity in water from systems with characteristics similar to ours were averaged to obtain the value in Table 5.
Furthermore, the electronic resistivity of dry Nafion was calculated starting from the work of Matos [47], using the DC imaginary part of the PEM dielectric constant calculated at T = 80 °C and RH = 100% using the following equation:
r P E M = 1 ε 0 · ε D C · 2 · π · f
where ε 0 is the vacuum permittivity, ε D C is the DC imaginary part of the PEM dielectric constant (at low frequency), and f is the frequency. Equation (23) is then used to obtain the dry Nafion resistivity, utilizing the solid and aqueous domains calculated under the previously specified conditions, along with the water resistivity.
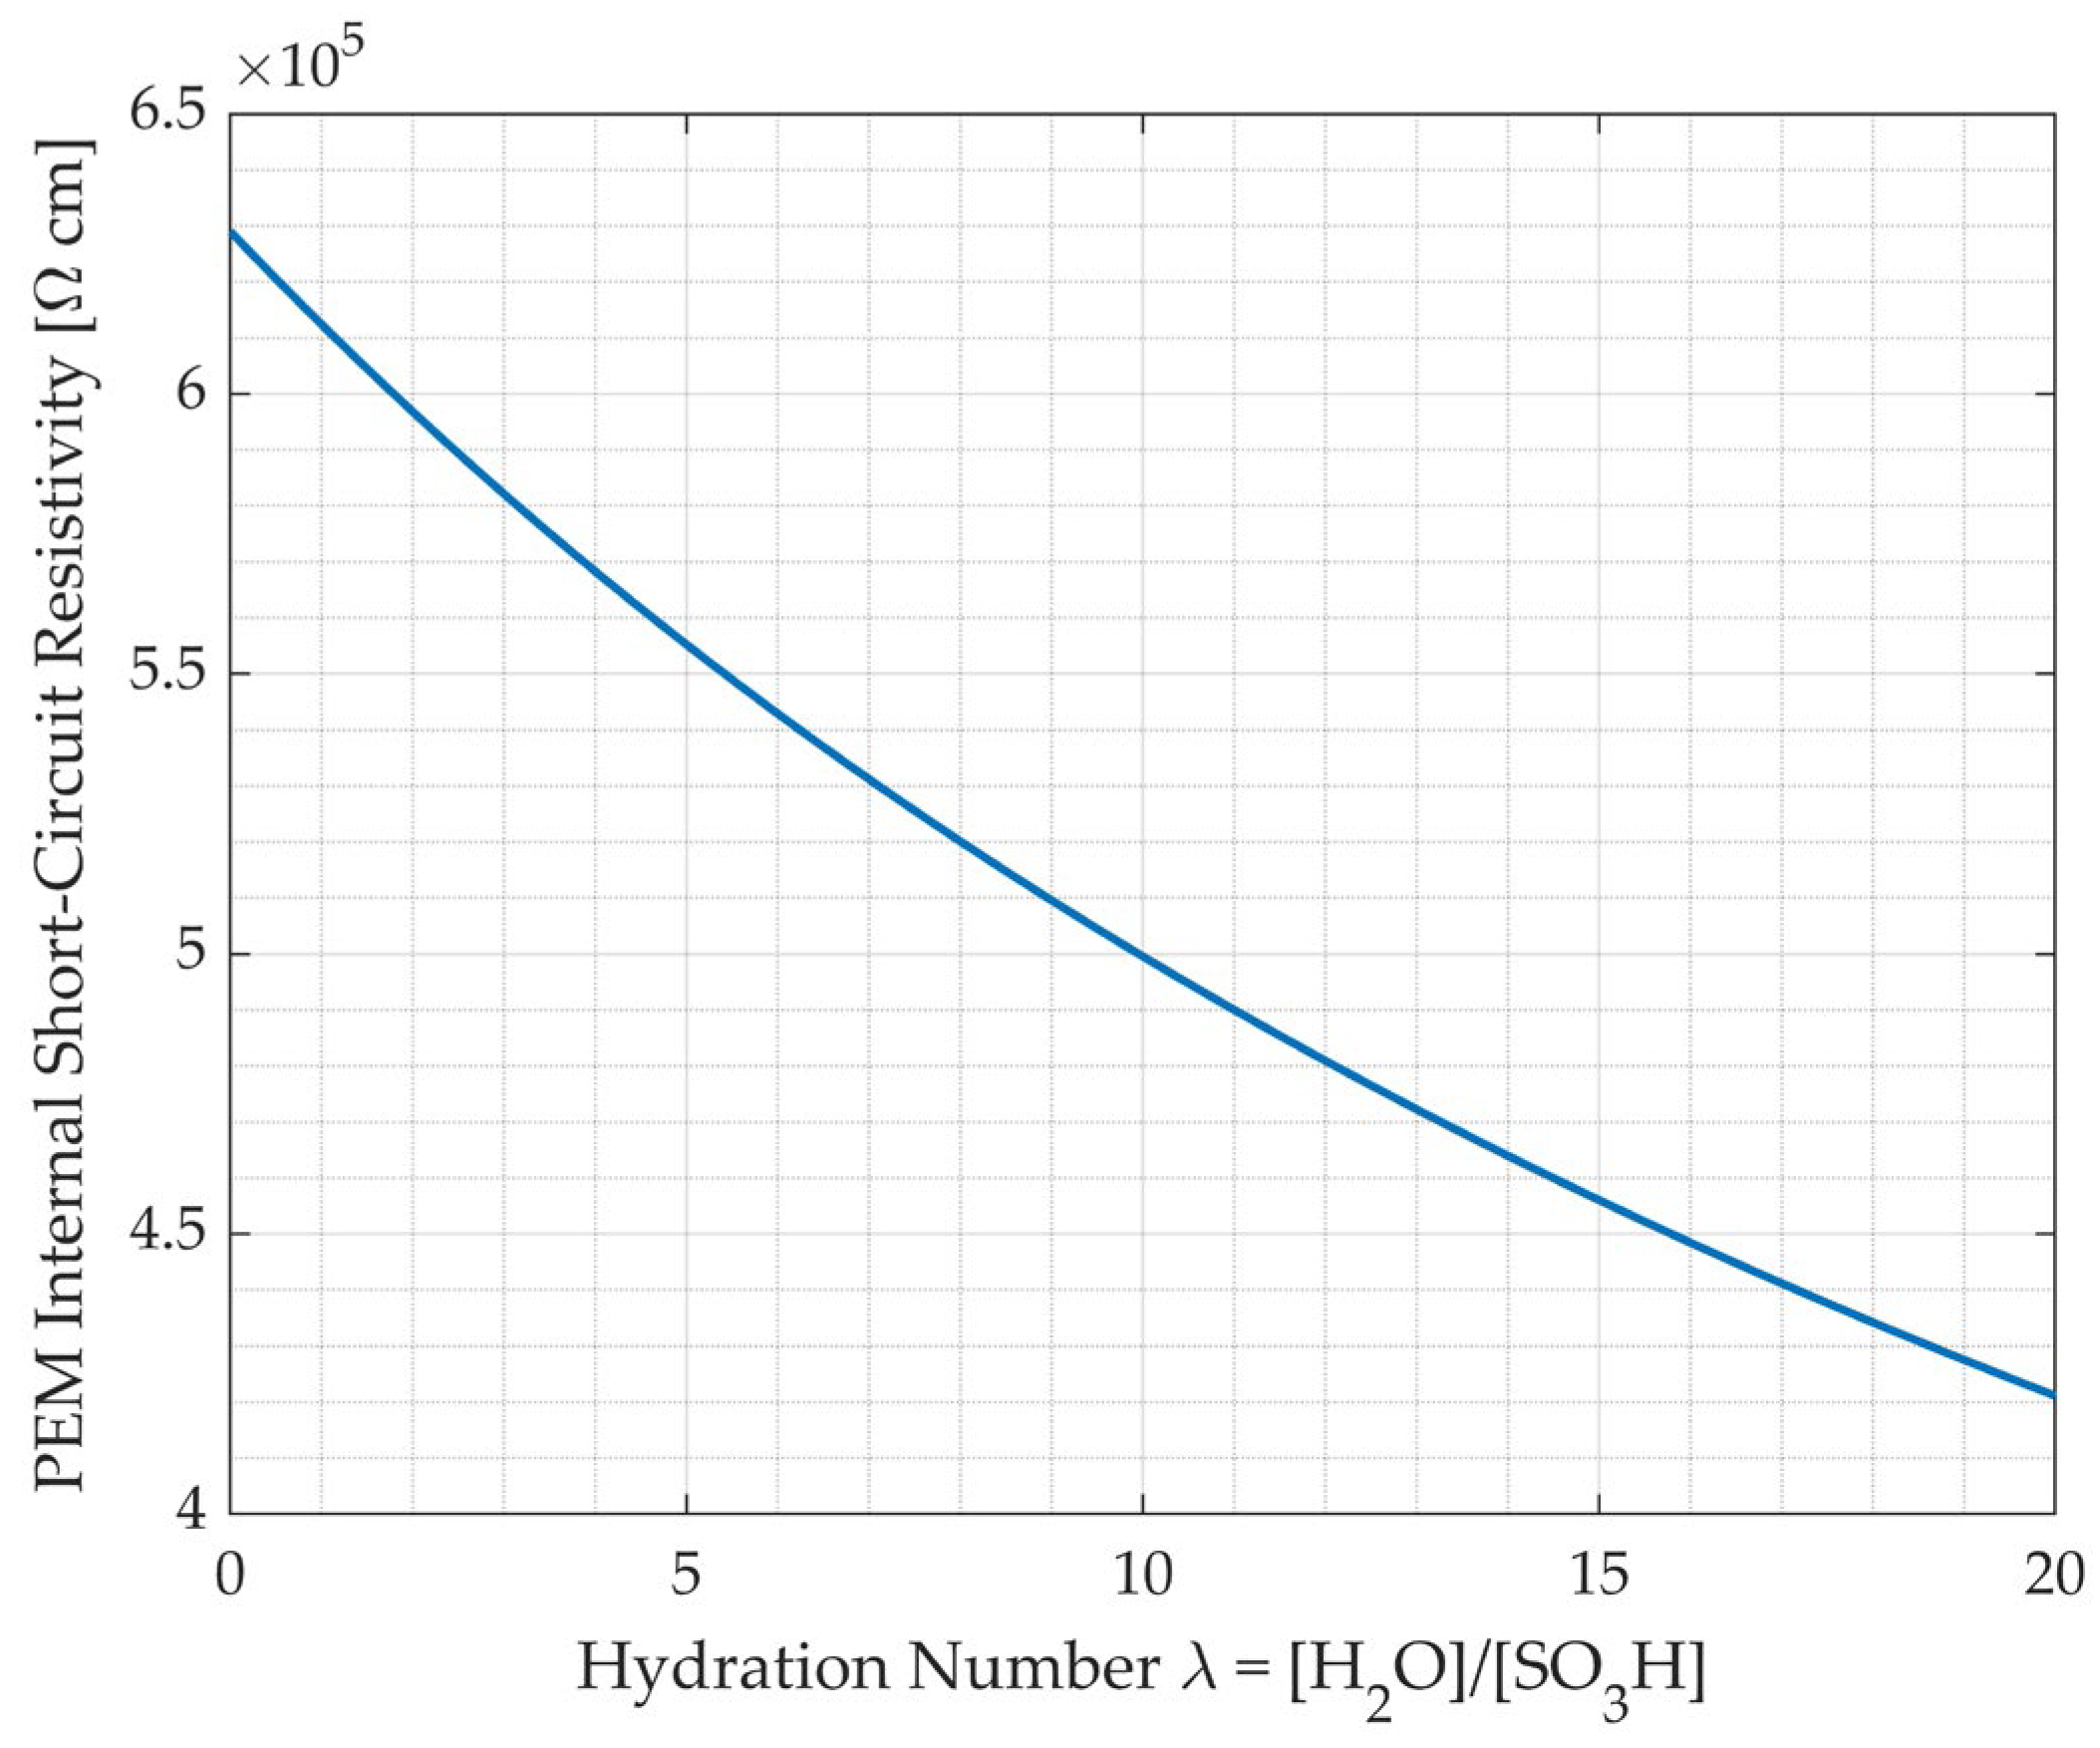
Figure 8 shows the electronic membrane resistivity (internal short-circuit resistivity) as a function of hydration number. It can be noted that as the quantity of water within the membrane increases, the electronic resistivity of the membrane decreases. This is because the electronic resistivity of water is lower than that of Nafion 115, as indicated in Table 5. It is crucial to clarify that in this model, the internal short-circuit resistance is influenced by temperature solely through the calculation of the aqueous and solid domains. The direct correlation between the resistivity values of water and Nafion with temperature has not been incorporated into the model due to insufficient literature data. However, this is not considered very impactful, since the resistivity values were estimated at a temperature of approximately 80 °C, which corresponds to the nominal operating temperature of LT-PEMFC systems [48]. Generally, with a decrease in temperature, an increase in resistivity of semiconductors and insulators is observed, resulting in a lower short-circuit current [49]. The leakage current due to the passage of electrons through the membrane can therefore be calculated using Ohm’s Law:
I S C = U F C R S C = U F C r P E M ( λ ) · t P E M A P E M  
where UFC is the voltage across the short circuit resistance that corresponds to the voltage between the electrodes of a cell.

3.5. Mixed Potential Treatment

The phenomenon of mixed potential is related to the reaction of platinum, which is a quasi-reversible degradation event. The degradation of the catalyst is caused by various mechanisms [50], but the main issue is related to chemical and structural changes of the cathode catalyst itself, for instance, by surface oxidation. The platinum is subjected to three electrochemical reactions [51]:
P t P t 2 + + 2 e
P t + H 2 O P t O + 2 H + + 2 e
P t O + 2 H + P t 2 + + H 2 O
Pt dissolution and PtO formation are reversible processes that depend on the voltage of the cell: if the potential is in the range of 0.85–1.15 V, there is a substantial presence of platinum oxide, while at potentials larger than 1.15 V, the chemisorbed oxygen completely covers the catalyst area [52]. Lowering the voltage, the dissolved Pt2+ ions can re-deposit in the case of reduced potential onto larger particles; these process lead to an increase in the mean particle size and a loss of catalyst active surface during system lifetime [52].
The potential of the O2/H2O half reaction and platinum oxidation is the cause of the mixed potential that causes a voltage drop compared to the pure platinum catalyst layer situation [34].
This phenomenon always leads to a voltage drop that is difficult to quantify, but being almost constant at OCV, an estimation methodology could be to consider it as the difference between the OCV measured experimentally and that from the model, which considers the losses due to hydrogen crossover and internal short circuits.

4. Results and Discussion

4.1. Hydrogen Crossover Model Results and Validation

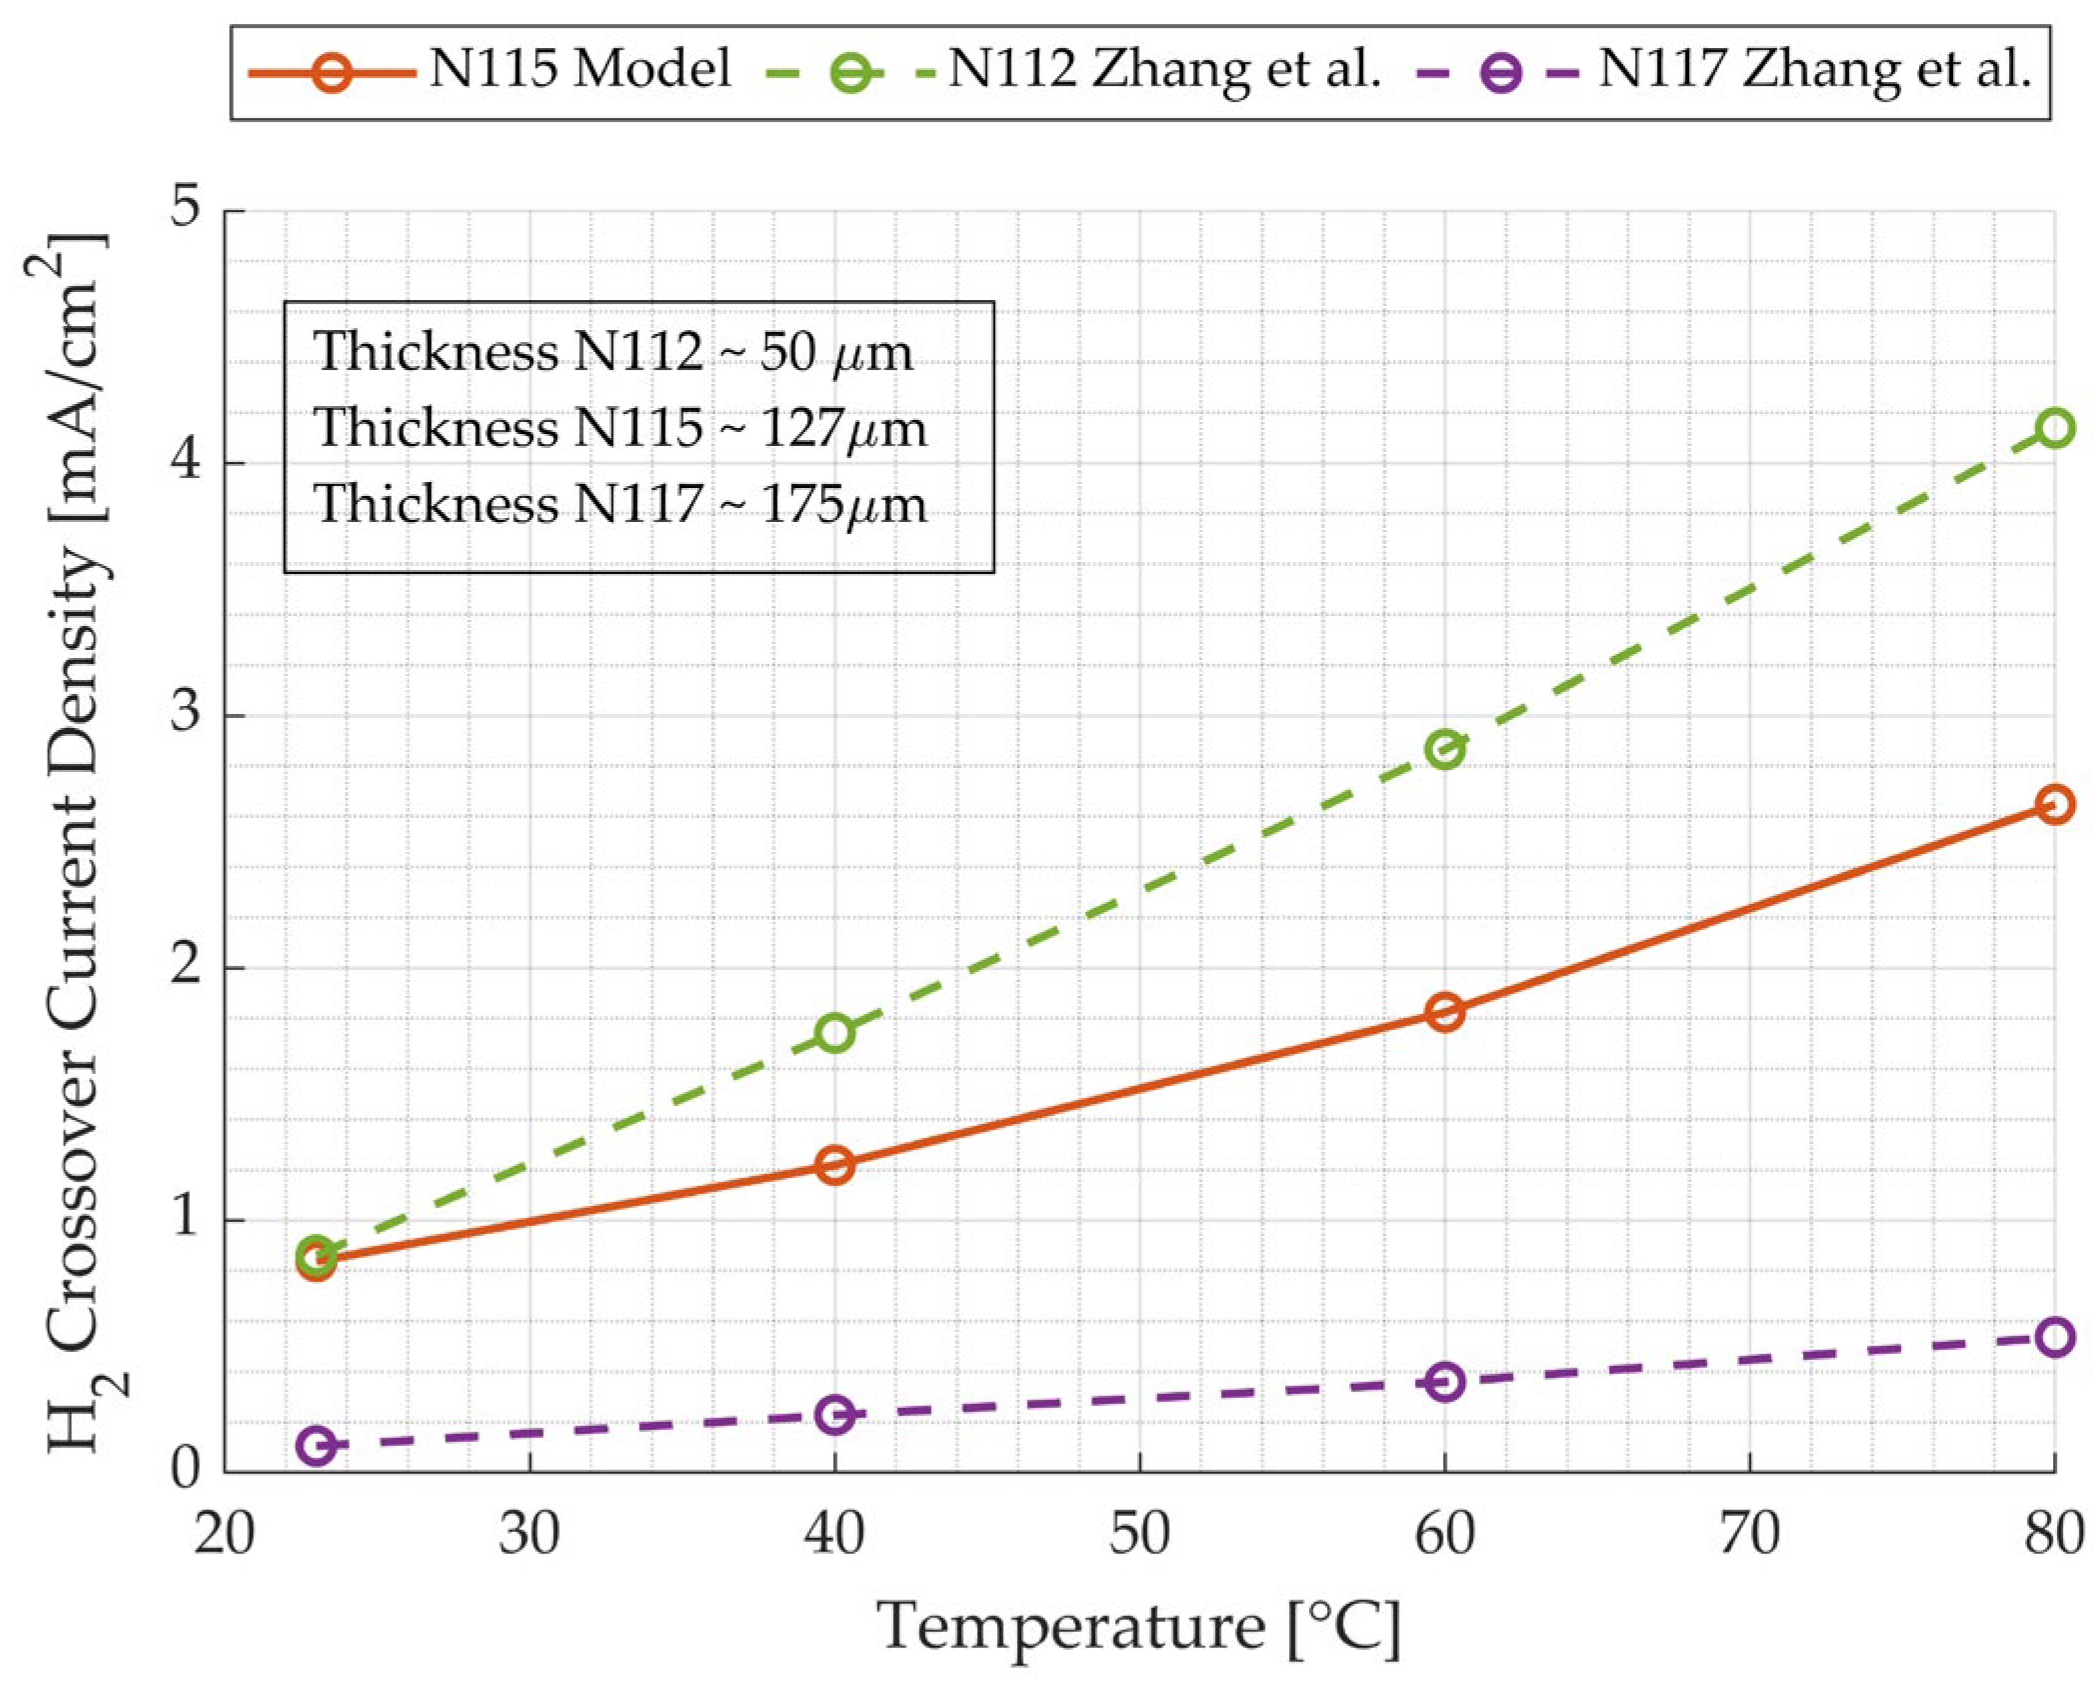
The hydrogen crossover current density obtained from the model with the parameters of H-500 PEMFC and the one obtained experimentally by Zhang et al. [34] are compared in Figure 9 in the same conditions (full wet state λ = 20 and p H 2 = 3   a t m ).
The values obtained for the Nafion 115 for temperatures between 23 °C and 80 °C are consistent with those of Nafion 117 and 112 measured by Zhang et al. [34]. In particular, the hydrogen crossover current density of N115 is approximately in the middle between N117 and N112; this difference is due to the thickness of the membrane (Equation (16)), which is larger than N112 and smaller than N117.
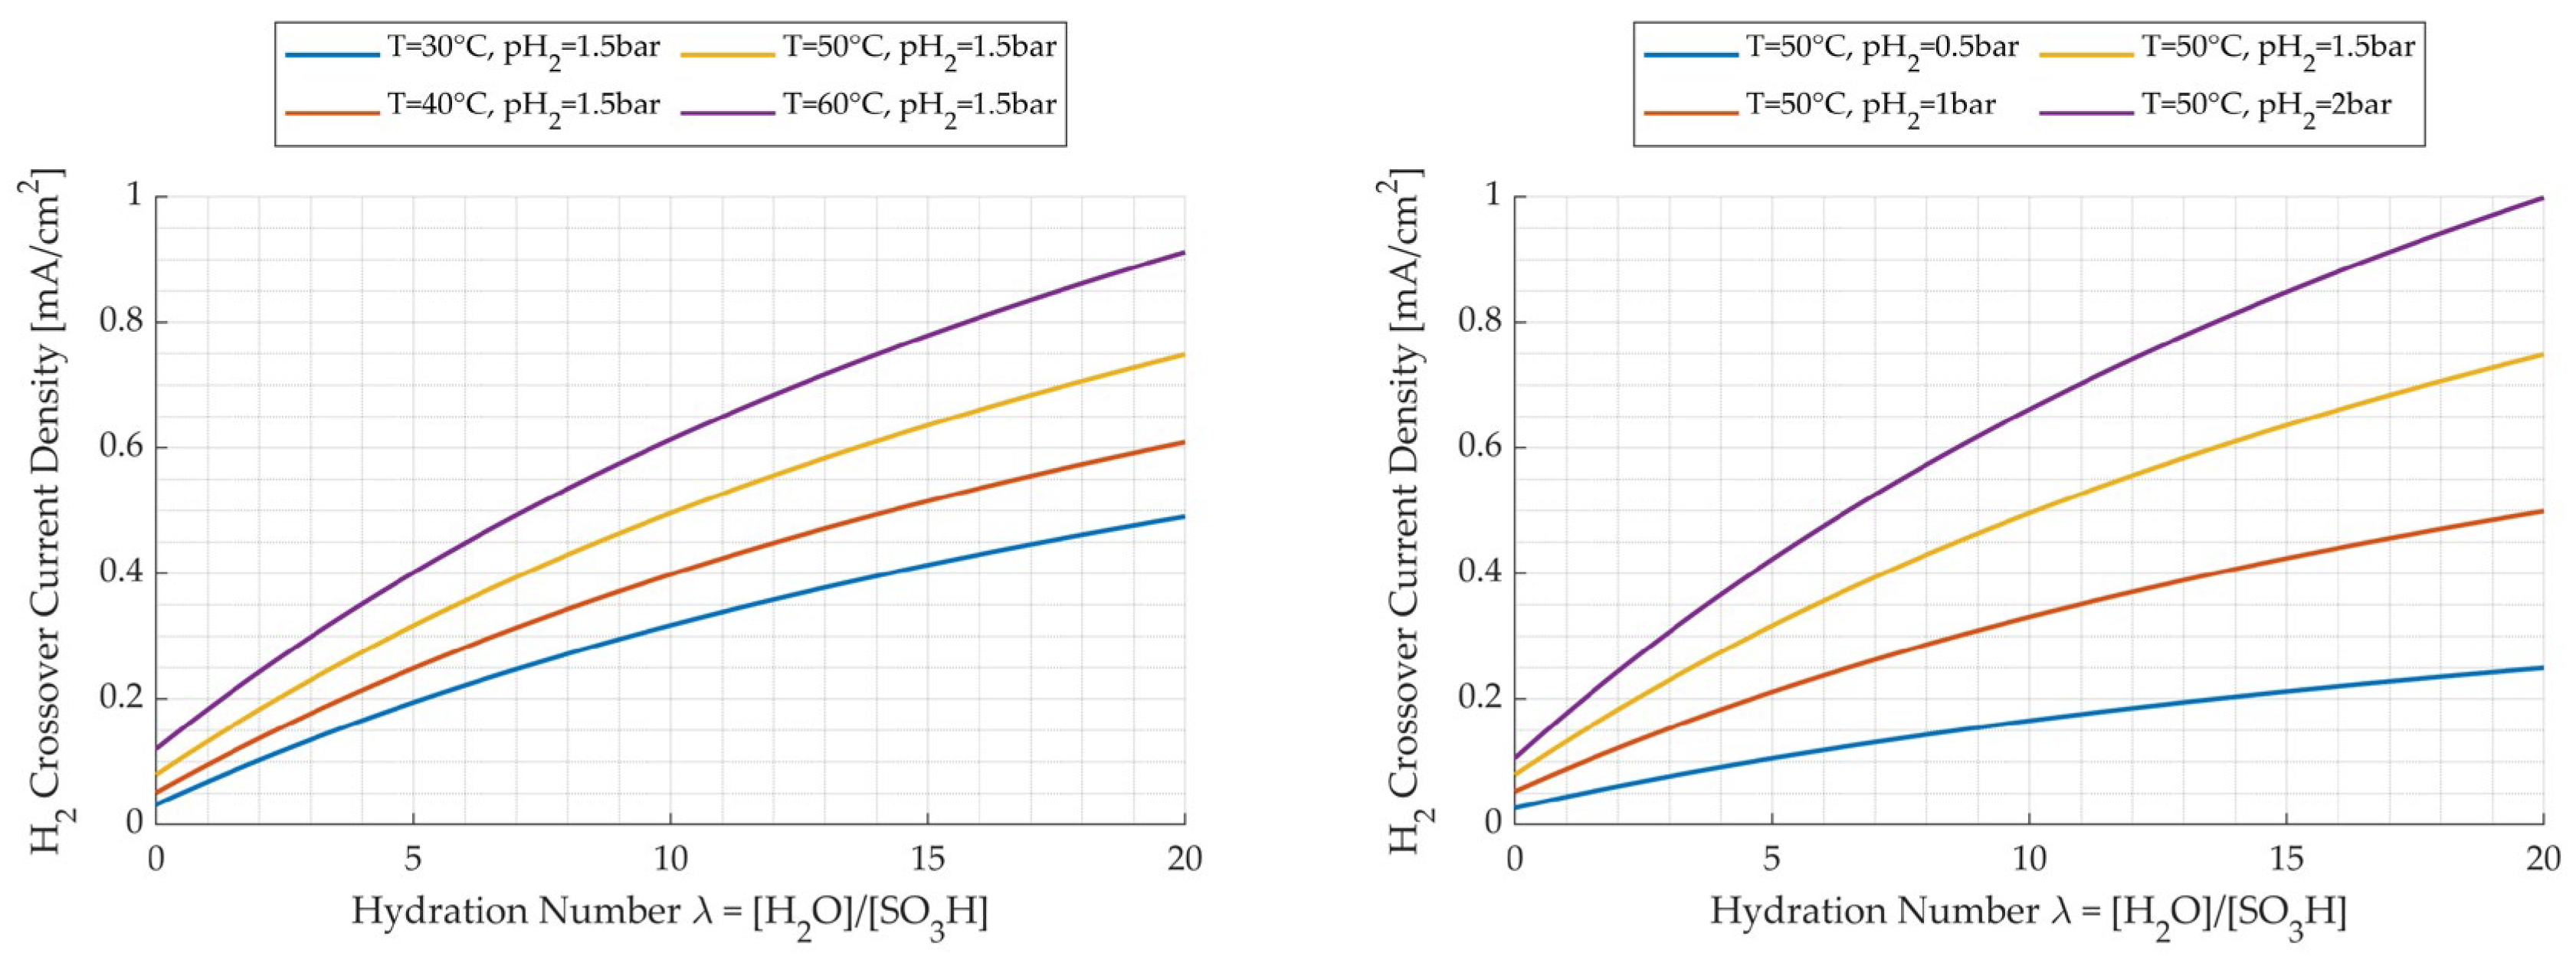
Moreover, Figure 10 shows the hydrogen crossover current as a function pf the quantity of water inside the PEM (λ), the temperature (on the left) and hydrogen partial pressure (on the right).
The temperature, water content and pressure have a positive effect on the hydrogen crossover current. In particular, temperature exhibits an exponential influence, while pressure affects the process linearly. However, within the temperature range of 30–60 °C, the pressure demonstrates a more pronounced effect, unexpectedly surpassing the influence of temperature. This result is significant, as temperature is often attributed as the primary phenomenon, which instead becomes secondary within the operating range of a low-temperature PEMFC. As a result, with the increase in these variables, the system had to provide additional current to compensate for the losses associated with diffusive flow.

4.2. Internal Short-Circuit Model Results

The internal short-circuit current is given by Ohm’s law, Equation (25), and is shown in Figure 11 as a function of quantity of water inside the PEM (λ). The trend is very similar to the hydrogen crossover but is approximately linear and much lower for high concentrations of water, while it appears to be of the same order of magnitude if not even greater (depending on the temperature) for low concentrations of water inside the PEM. As previously mentioned regarding internal short-circuit resistance, the temperature dependence of this leakage current is indirectly determined by the calculation of both the aqueous and solid domains (and consequently through λ), but no correlation has been considered for the resistance itself. The validation of these losses through experimental measurements or values from other studies is exceedingly difficult, as Nafion is typically considered solely as an ion conductor in the literature, and the possibility of internal short circuits is omitted. Nonetheless, indirect comparisons can be drawn from the research of J.J. Giner et al. [9]. In their study, the hydrogen crossover current values were obtained as the difference between the required current and that of the internal short circuits as the output of a similar model. These findings align with the results obtained in this study, providing further validation for the model’s predictions.

4.3. Hydrogen Crossover and Internal Short-Circuit Comparison

To better compare the influence of the two phenomena for the fuel cell under study, their ratio on the total leakage current is shown in Figure 12. The two currents are comparable for very low membrane hydrations; they are equal for λ = 1.5. Above this threshold, there is a greater influence of the hydrogen crossover on the total open circuit losses. This trend is due to the greater influence of the hydrogen crossover from the hydration number compared to the internal short-circuit phenomenon. In fact, comparing Figure 10 and Figure 11, it is clear how the additional current to be supplied due to hydrogen crossover is almost five times greater than the short-circuit one.
The finding that internal short circuits are of comparable magnitude to the crossover for low water content, as revealed by this study, is non-trivial. Such results are often absent from the literature and modeling efforts. This underscores the significance of our investigation in shedding light on an aspect of the phenomenon that has been frequently overlooked or underestimated. By highlighting this correlation, our study contributes valuable insights into the understanding of hydrogen crossover currents and internal short circuits in this context.

4.4. OCV Model Validation and Results

The results of the OCV trend of the model are calculated with Equation (5) and presented in Figure 13 together with the experimental values as function of temperature.
The actual trend of the OCV model closely resembles the experimental data, but it exhibits a more pronounced drop at higher temperatures due to the increase in OCV losses. The difference between the theoretical OCV and that of the model is mainly to be attributed to the phenomena of internal short circuit and hydrogen crossover, while the further difference between the OCV obtained from the model and that measured experimentally is all attributable to the phenomenon of mixed potential. This approach to estimating losses related to this phenomenon has been adopted in other studies as well. For instance, J. Zhang et al. [34], in their investigation of OCV trends across a temperature range of 23 °C to 120 °C, estimated the voltage drop attributed to mixed potential by comparing experimental and model values. Their analysis, focusing solely on the impact of hydrogen crossover, yielded voltage-drop results remarkably akin to those obtained in our study. This consistency across different studies underscores the robustness and reliability of the method in capturing the nuanced effects of these phenomena. For completeness, the OCV curves for Nafion 112 and Nafion 117 from the study of Zhang et al. [34] are also included Figure 13. The trend is similar, but the voltage is higher than the experimental one obtained in this study, this is primarily due to the higher operating pressure which is equal to 3 atm. Finally, the comparison underscores a significant disparity between the theoretical open-circuit voltage (OCV) calculated using the Nernst equation (Equation (1)) and actual values. This highlights the imperative need for explicit modeling of OCV loss in electrochemical models. The discrepancy emphasizes that relying solely on theoretical calculations may lead to substantial inaccuracies in predicting real-world behavior. Therefore, incorporating explicit OCV loss modeling is essential for enhancing the fidelity and reliability of electrochemical models. However, it becomes apparent that incorporating hydrogen crossover losses and internal short circuits, despite accurately reproducing the experimental trend, is not sufficient to match the experimental cell voltage. Although the mixed potential can be estimated from this voltage difference, a model that accounts for it is still necessary to faithfully reproduce the actual behavior of the PEMFC. This can be achieved by incorporating platinum oxidation reactions into the Butler–Volmer equation for activation losses (Equation (3)), as demonstrated in the recent literature [53,54]. Additionally, another limitation of the model concerns the electron conductivity of the reaction water. This conductivity strongly depends on the purity of the water used in the humidification system and on internal cell degradation phenomena that lead to the release of impurities, which can increase its conductivity over time [46,55].

5. Conclusions

In this paper, an alternative method of modeling the open circuit losses of a PEM-type fuel cell based on the subdivision of the membrane into a solid and an aqueous domain has been presented. The calculation of these domains depends on the main operating parameters of the fuel cell, such as temperature, pressure and relative humidity of the reactants and those of the membrane.
The model was built by extrapolating important data from a Horizon H-500 Fuel Cell, used in the automotive sector in a vehicle prototype developed at the Politecnico di Torino to compete at the Shell Eco-Marathon, which was tested and subsequently disassembled and analyzed in a laboratory. However, the developed methodology could be applied to all types of PEMFC.
The main results are as follows:
  • Hydrogen crossover and internal short circuits increase as the aqueous domain increases, as the hydrogen permeability and electronic conductivity of water are higher than those of Nafion.
  • The hydrogen crossover was modeled in a very accurate way, exploiting the data present in the literature, considering the dependence of the permeability of hydrogen in water and in Nafion with respect to temperature. The hydrogen crossover current density, the output of the model, was compared with values extracted from other literature studies with different membranes at different temperatures, confirming the validity of the results. Moreover, in the temperature range of 30–60 °C, the effect of pressure was more influential on hydrogen crossover losses.
  • The impact of internal short circuits is notably significant when water quantities are low, whereas they are predominantly governed by the H2 crossover phenomenon under conditions of high water quantities. Nonetheless, it is noteworthy that they contribute to a comparable extent, representing approximately 20% of the open-circuit voltage (OCV) loss current.
  • The OCV of the model perfectly follows the trend of the experimental one, decreasing as the temperature increases. This trend was also compared and validated with studies in the literature.
  • The Nernst equation for calculating the OCV is not precise enough for modeling real PEMFC systems.
The consideration of these additional losses is crucial not only for the accurate estimation of the performance of PEMFC systems, which are increasingly being integrated into hybrid systems with batteries and subjected to energy management studies, but also in the design phase of new materials for the PEM. By incorporating a new relationship between hydrogen permeability and electronic resistivity and temperature, an accurate prediction of crossover current and internal short circuit can be achieved, which is able to support the design of ultra-thin membranes where a trade-off between performance enhancement and the limitation of these performances is crucial. Moreover, this methodology can also be extended to PEM electrolyzers, where the crossover phenomenon is even more impactful due to the much higher pressure compared to fuel cells, resulting in a net loss of produced hydrogen and an increase in degradation phenomena and potential faults [56,57,58,59].
The model can be improved by including a representation of the losses associated with mixed potential and incorporating the temperature dependence of the electronic resistivity of Nafion and the water produced by the reaction. Additionally, a detailed experimental campaign measuring the crossover flow and the electronic resistivity of Nafion can provide more accurate validation of the model results, particularly when varying design parameters such as thickness and operational parameters (temperature, RH, pressure, etc.).

Supplementary Materials

The following supporting information can be downloaded at: https://www.mdpi.com/article/10.3390/en17112785/s1, OCV_exp_data and OCV_losses.

Author Contributions

Conceptualization, F.M., L.D.N. and M.C.; methodology, F.M. and L.D.N.; software, F.M. and L.D.N.; validation, F.M. and L.D.N. and M.C.; formal analysis, F.M. and L.D.N.; investigation, L.D.N. and M.C.; resources, F.M. and L.D.N.; data curation, F.M. and L.D.N.; writing—original draft preparation, F.M.; writing—review and editing, F.M., L.D.N. and M.C.; visualization, F.M.; supervision, M.C.; project administration, M.C.; funding acquisition, M.C. All authors have read and agreed to the published version of the manuscript.

Funding

This research received no external funding.

Data Availability Statement

The data and models may be provided upon request to the authors.

Acknowledgments

Thanks to the team H2politO that made possible the realization of the IDRAkronos vehicle and this research. The vehicle IDRAkronos is financially supported by the “Committee on Contributions and funds for students projects” of the Politecnico of Turin and other sponsors and technical partners (see also www.polito.it/h2polito, accessed on 4 June 2024).

Conflicts of Interest

The authors declare no conflicts of interest.

References

  1. Decarbonising Road Freight|Shell Global. Available online: https://www.shell.com/sustainability/our-climate-target/reducing-emissions-from-transport-and-industry/decarbonising-road-freight.html (accessed on 3 May 2024).
  2. CO2 Emissions in 2022—Analysis, IEA. Available online: https://www.iea.org/reports/co2-emissions-in-2022 (accessed on 3 May 2024).
  3. Global Hydrogen Review 2022—Analysis, IEA. Available online: https://www.iea.org/reports/global-hydrogen-review-2022 (accessed on 3 May 2024).
  4. Ball, M.; Weeda, M. The hydrogen economy—Vision or reality? Int. J. Hydrog. Energy 2015, 40, 7903–7919. [Google Scholar] [CrossRef]
  5. Pukrushpan, J.T.; Stefanopoulou, A.G.; Peng, H. Modeling and Control for PEM Fuel Cell Stack System. In Proceedings of the 2002 American Control Conference (IEEE Cat. No.CH37301), Anchorage, AK, USA, 8–10 May 2002; Volume 4, pp. 3117–3122. [Google Scholar] [CrossRef]
  6. Carello, M.; de Carvalho Pinheiro, H.; Longega, L.; Di Napoli, L. Design and Modelling of the Powertrain of a Hybrid Fuel Cell Electric Vehicle. SAE Int. J. Adv. Curr. Pract. Mobil. 2021, 3, 2878–2892. [Google Scholar] [CrossRef]
  7. Zhang, C.; Zhou, W.; Ehteshami, M.M.; Wang, Y.; Chan, S.H. Determination of the optimal operating temperature range for high temperature PEM fuel cell considering its performance, CO tolerance and degradation. Energy Convers. Manag. 2015, 105, 433–441. [Google Scholar] [CrossRef]
  8. Chen, C.-Y.; Lai, W.-H. Effects of temperature and humidity on the cell performance and resistance of a phosphoric acid doped polybenzimidazole fuel cell. J. Power Sources 2010, 195, 7152–7159. [Google Scholar] [CrossRef]
  9. Giner-Sanz, J.J.; Ortega, E.M.; Pérez-Herranz, V. Hydrogen crossover and internal short-circuit currents experimental characterization and modelling in a proton exchange membrane fuel cell. Int. J. Hydrog. Energy 2014, 39, 13206–13216. [Google Scholar] [CrossRef]
  10. Vilekar, S.A.; Datta, R. The effect of hydrogen crossover on open-circuit voltage in polymer electrolyte membrane fuel cells. J. Power Sources 2010, 195, 2241–2247. [Google Scholar] [CrossRef]
  11. Arato, E.; Costa, P. Transport mechanisms and voltage losses in PEMFC membranes and at electrodes: A discussion of open-circuit irreversibility. J. Power Sources 2006, 159, 861–868. [Google Scholar] [CrossRef]
  12. Kravos, A.; Ritzberger, D.; Hametner, C.; Jakubek, S.; Katrašnik, T. Methodology for efficient parametrisation of electrochemical PEMFC model for virtual observers: Model based optimal design of experiments supported by parameter sensitivity analysis. Int. J. Hydrog. Energy 2021, 46, 13832–13844. [Google Scholar] [CrossRef]
  13. Asensio, F.J.; San Martín, J.I.; Zamora, I.; Saldaña, G.; Oñederra, O. Analysis of electrochemical and thermal models and modeling techniques for polymer electrolyte membrane fuel cells. Renew. Sustain. Energy Rev. 2019, 113, 109283. [Google Scholar] [CrossRef]
  14. Lazar, A.L.; Konradt, S.C.; Rottengruber, H. Open-Source Dynamic Matlab/Simulink 1D Proton Exchange Membrane Fuel Cell Model. Energies 2019, 12, 3478. [Google Scholar] [CrossRef]
  15. Li, S.; Wei, X.; Jiang, S.; Yuan, H.; Ming, P.; Wang, X.; Dai, H. Hydrogen crossover diagnosis for fuel cell stack: An electrochemical impedance spectroscopy based method. Appl. Energy 2022, 325, 119884. [Google Scholar] [CrossRef]
  16. Fu, X.; Wei, J.; Ning, F.; Bai, C.; Wen, Q.; Jin, H.; Li, Y.; Zou, S.; Pan, S.; Chen, J.; et al. Highly flat and highly homogeneous carbon paper with ultra-thin thickness for high-performance proton exchange membrane fuel cell (PEMFC). J. Power Sources 2022, 520, 230832. [Google Scholar] [CrossRef]
  17. Nafion/PTFE Composite Membranes for a High Temperature PEM Fuel Cell Application|Industrial & Engineering Chemistry Research. Available online: https://pubs.acs.org/doi/10.1021/acs.iecr.1c01447 (accessed on 3 May 2024).
  18. Xu, Y.; Yang, Z.; Jiao, K.; Hao, D.; Du, Q. Development of a comprehensive transient fuel cell-battery hybrid system model and rule-based energy management strategy. Int. J. Green Energy 2023, 20, 844–858. [Google Scholar] [CrossRef]
  19. Guo, L.; Li, Z.; Outbib, R.; Gao, F. Function approximation reinforcement learning of energy management with the fuzzy REINFORCE for fuel cell hybrid electric vehicles. Energy AI 2023, 13, 100246. [Google Scholar] [CrossRef]
  20. H 500|Professional|Stack Fuel-Cell|H 500-2000|H2Planet—Re-Evolution Started—Hydrogen & Fuel-Cell Experience. Available online: https://www.h2planet.eu/it/detail/H500 (accessed on 3 May 2024).
  21. Shell Eco-Marathon. Available online: https://www.shellecomarathon.com/ (accessed on 3 May 2024).
  22. Carello, M.; De Vita, A.; Ferraris, A. Method for Increasing the Humidity in Polymer Electrolyte Membrane Fuel Cell. Fuel Cells 2016, 16, 157–164. [Google Scholar] [CrossRef]
  23. Ferraris, A.; Messana, A.; Airale, A.G.; Sisca, L.; de Carvalho Pinheiro, H.; Zevola, F.; Carello, M. Nafion tubing humidification system for polymer electrolyte membrane fuel cells. Energies 2019, 12, 1773. [Google Scholar] [CrossRef]
  24. Wang, Z.; Liu, Z.; Fan, L.; Du, Q.; Jiao, K. Application Progress of Small-Scale Proton Exchange Membrane Fuel Cell. Energy Rev. 2023, 2, 100017. [Google Scholar] [CrossRef]
  25. TESCOM Product Catalog Edition IV November 2018. Available online: https://www.emerson.com/cs-cz/automation/tescom (accessed on 4 June 2024).
  26. Hydrogen Flowmeter Red-y Compact 2 GCM, Mileage Challenge. Available online: https://mileage-challenge.com/flow-meters/32-flowmeter-red-y-compact-gcm.html (accessed on 26 May 2024).
  27. 2U, EA Elektro-Automatik. Available online: https://elektroautomatik.com/it/prodotti/serie-ea-10000/2u/ (accessed on 26 May 2024).
  28. Song, C.; Tang, Y.; Zhang, J.L.; Zhang, J.; Wang, H.; Shen, J.; McDermid, S.; Li, J.; Kozak, P. PEM fuel cell reaction kinetics in the temperature range of 23–120 °C. Electrochim. Acta 2007, 52, 2552–2561. [Google Scholar] [CrossRef]
  29. Arif, M.; Cheung, S.C.P.; Andrews, J. A systematic approach for matching simulated and experimental polarization curves for a PEM fuel cell. Int. J. Hydrog. Energy 2020, 45, 2206–2223. [Google Scholar] [CrossRef]
  30. Lee, H.; Han, C.; Park, T. Experimental investigation of charge transfer coefficient and exchange current density in standard fuel cell model for polymer electrolyte membrane fuel cells. Korean J. Chem. Eng. 2020, 37, 577–582. [Google Scholar] [CrossRef]
  31. Mennola, T.; Mikkola, M.; Noponen, M.; Hottinen, T.; Lund, P. Measurement of ohmic voltage losses in individual cells of a PEMFC stack. J. Power Sources 2002, 112, 261–272. [Google Scholar] [CrossRef]
  32. Springer, T.E.; Zawodzinski, T.A.; Gottesfeld, S. Polymer Electrolyte Fuel Cell Model. J. Electrochem. Soc. 1991, 138, 2334. [Google Scholar] [CrossRef]
  33. Kreuer, K.-D. The role of internal pressure for the hydration and transport properties of ionomers and polyelectrolytes. Solid State Ion. 2013, 252, 93–101. [Google Scholar] [CrossRef]
  34. Zhang, J.; Tang, Y.; Song, C.; Zhang, J.; Wang, H. PEM fuel cell open circuit voltage (OCV) in the temperature range of 23 °C to 120 °C. J. Power Sources 2006, 163, 532–537. [Google Scholar] [CrossRef]
  35. Gummalla, M.; Atrazhev, V.V.; Condit, D.; Cipollini, N.; Madden, T.; Kuzminyh, N.Y.; Weiss, D.; Burlatsky, S.F. Degradation of Polymer-Electrolyte Membranes in Fuel Cells: II. Theoretical model. J. Electrochem. Soc. 2010, 157, B1542. [Google Scholar] [CrossRef]
  36. Kaspar, R.B.; Wittkopf, J.A.; Woodroof, M.D.; Armstrong, M.J.; Yan, Y. Reverse-Current Decay in Hydroxide Exchange Membrane Fuel Cells. J. Electrochem. Soc. 2016, 163, F377. [Google Scholar] [CrossRef]
  37. Characterization of Gas Crossover and Its Implications in PEM Fuel Cells—Kocha—2006—AIChE Journal—Wiley Online Library. Available online: https://aiche.onlinelibrary.wiley.com/doi/full/10.1002/aic.10780 (accessed on 26 May 2024).
  38. Ye, D.; Gauthier, E.; Benziger, J.B.; Pan, M. Bulk and contact resistances of gas diffusion layers in proton exchange membrane fuel cells. J. Power Sources 2014, 256, 449–456. [Google Scholar] [CrossRef]
  39. Gas Permeation through Nafion. Part 1: Measurements|The Journal of Physical Chemistry C. Available online: https://pubs.acs.org/doi/10.1021/acs.jpcc.5b04155. (accessed on 3 May 2024).
  40. Eikerling, M.H.; Berg, P. Poroelectroelastic theory of water sorption and swelling in polymer electrolyte membranes. Soft Matter 2011, 7, 5976–5990. [Google Scholar] [CrossRef]
  41. Permeation of Gases and Vapours in Polymers|SpringerLink. Available online: https://link.springer.com/chapter/10.1007/978-94-009-4858-7_2. (accessed on 3 May 2024).
  42. Ito, H.; Maeda, T.; Nakano, A.; Takenaka, H. Properties of Nafion membranes under PEM water electrolysis conditions. Int. J. Hydrog. Energy 2011, 36, 10527–10540. [Google Scholar] [CrossRef]
  43. Wise, D.L.; Houghton, G. The diffusion coefficients of ten slightly soluble gases in water at 10–60 °C. Chem. Eng. Sci. 1966, 21, 999–1010. [Google Scholar] [CrossRef]
  44. Larminie, J.; Dicks, A. Fuel Cell Systems Explained, 2nd ed.; J. Wiley: Chichester, UK, 2003. [Google Scholar]
  45. Measurement and Prediction of Electrical Contact Resistance Between Gas Diffusion Layers and Bipolar Plate for Applications to PEM Fuel Cells|J. Electrochem. En. Conv. Stor|ASME Digital Collection. Available online: https://asmedigitalcollection.asme.org/electrochemical/article/1/1/2/463124/Measurement-and-Prediction-of-Electrical-Contact (accessed on 3 May 2024).
  46. Hristovski, K.; Dhanasekaran, B.; Tibaquirá, J.; Posner, J.; Westerhoff, P. Producing drinking water from hydrogen fuel cells. J. Water Supply Res. Technol.-AQUA 2009, 58, 327–335. [Google Scholar] [CrossRef]
  47. Matos, B.R. The genuine ac-to-dc proton conductivity crossover of nafion and polymer dielectric relaxations as a fuel cell polarization loss. J. Electroanal. Chem. 2020, 871, 114357. [Google Scholar] [CrossRef]
  48. Tawalbeh, M.; Alarab, S.; Al-Othman, A.; Javed, R.M.N. The Operating Parameters, Structural Composition, and Fuel Sustainability Aspects of PEM Fuel Cells: A Mini Review. Fuels 2022, 3, 28. [Google Scholar] [CrossRef]
  49. Dewangan, S.K.; Shrivastava, S.; Kadri, M.; Saruta, S.; Yadav, S.; Minj, N. Temperature effect on electrical conductivity(EC) & total dissolved solids (TDS) of water: A review. Int. J. Res. Anal. Rev. 2023, 10, 514–520. [Google Scholar]
  50. The Influence of Platinum Surface Oxidation on the Performance of a Polymer Electrolyte Membrane Fuel Cell—Probing Changes of Catalytically Active Surface Sites on a Polycrystalline Platinum Electrode for the Oxygen Reduction Reaction—Eckl—2022—Electrochemical Science Advances—Wiley Online Library. Available online: https://chemistry-europe.onlinelibrary.wiley.com/doi/full/10.1002/elsa.202100049 (accessed on 3 May 2024).
  51. Darling, R.M.; Meyers, J.P. Kinetic Model of Platinum Dissolution in PEMFCs. J. Electrochem. Soc. 2003, 150, A1523. [Google Scholar] [CrossRef]
  52. Schneider, P.; Sadeler, C.; Scherzer, A.-C.; Zamel, N.; Gerteisen, D. Fast and Reliable State-of-Health Model of a PEM Cathode Catalyst Layer. J. Electrochem. Soc. 2019, 166, F322. [Google Scholar] [CrossRef]
  53. Samris, A.; Mounir, H.; El Marjani, A. Effect of platinum dispersity, platinum loading and Pt-Oxide coverage on oxygen reduction reaction in PEMFC-Cathode. J. Electroanal. Chem. 2021, 895, 115414. [Google Scholar] [CrossRef]
  54. Dickinson, E.J.F.; Hinds, G. The Butler-Volmer Equation for Polymer Electrolyte Membrane Fuel Cell (PEMFC) Electrode Kinetics: A Critical Discussion. J. Electrochem. Soc. 2019, 166, F221. [Google Scholar] [CrossRef]
  55. Burye, T.E. Effect of PEM fuel cell exhaust water conductivity on catalyst degradation using thermal degradation resistant polymer membranes. Int. J. Hydrog. Energy 2020, 45, 11733–11748. [Google Scholar] [CrossRef]
  56. Martin, A.; Trinke, P.; Stähler, M.; Stähler, A.; Scheepers, F.; Bensmann, B.; Carmo, M.; Lehnert, W.; Hanke-Rauschenbach, R. The Effect of Cell Compression and Cathode Pressure on Hydrogen Crossover in PEM Water Electrolysis. J. Electrochem. Soc. 2022, 169, 014502. [Google Scholar] [CrossRef]
  57. Kuhnert, E.; Heidinger, M.; Sandu, D.; Hacker, V.; Bodner, M. Analysis of PEM Water Electrolyzer Failure Due to Induced Hydrogen Crossover in Catalyst-Coated PFSA Membranes. Membranes 2023, 13, 348. [Google Scholar] [CrossRef] [PubMed]
  58. Afshari, E.; Khodabakhsh, S.; Jahantigh, N.; Toghyani, S. Performance assessment of gas crossover phenomenon and water transport mechanism in high pressure PEM electrolyzer. Int. J. Hydrog. Energy 2021, 46, 11029–11040. [Google Scholar] [CrossRef]
  59. Dang, J.; Zhang, J.; Deng, X.; Yang, S.; Liu, B.; Zhu, X.; Li, Y.; Yang, F.; Ouyang, M. Hydrogen crossover measurement and durability assessment of high-pressure proton exchange membrane electrolyzer. J. Power Sources 2023, 563, 232776. [Google Scholar] [CrossRef]
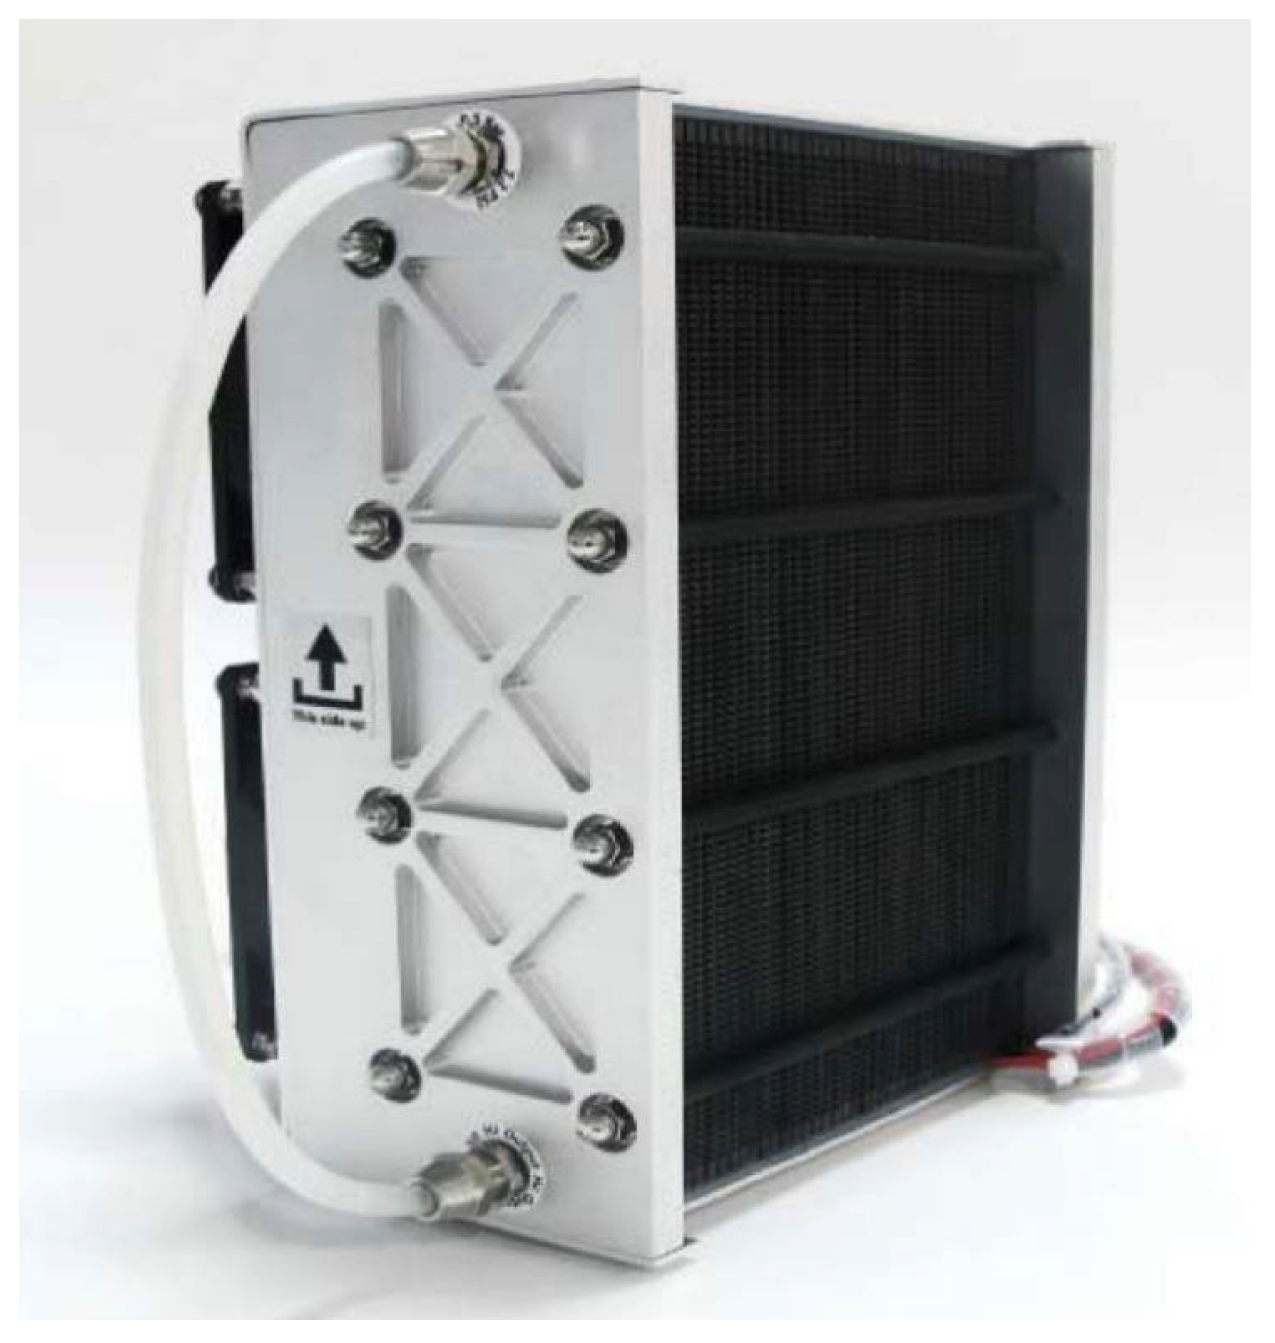
Figure 1. Fuel Cell Horizon H-500.
Energies 17 02785 g001
Figure 2. Experimental set-up of the test bench.
Energies 17 02785 g002
Figure 3. Polarization curve of a single cell of the Horizon H-500.
Energies 17 02785 g003
Figure 4. From left to right: cathode flow field plate, air filter, cathode gas diffusion layer and catalyst layer, PEM.
Energies 17 02785 g004
Figure 5. On the left, comparison between hydration by adsorption ( λ L ) and by osmosis ( λ 0 ) vs. relative humidity of the PEM at constant temperature of 50 °C. On the right, the sum of the effects ( λ ) which gives the total hydration level of the membrane vs. relative humidity of the membrane (RH) for different temperature.
Energies 17 02785 g005
Figure 6. Solid and aqueous domains vs. hydration number λ for Horizon H-500.
Energies 17 02785 g006
Figure 7. Possible hydrogen path through dry and hydrated PEMs [39].
Energies 17 02785 g007
Figure 8. Membrane electrical resistivity vs. hydration number λ .
Energies 17 02785 g008
Figure 9. H2 crossover current densities vs. temperature at OCV with pressure equal to 3 atm and full wet conditions. In red, the output of the model for the Horizon H-500; in green and purple, the measured values obtained by Zhang et al. [34] for a FC with N112 and N117 PEM, respectively.
Energies 17 02785 g009
Figure 10. On the left, hydrogen crossover current density in function of hydration number and temperature at hydrogen partial pressure of 1.5 bar. On the right, hydrogen crossover current density in function of hydration number and hydrogen partial pressure at fixed temperature of 50 °C.
Energies 17 02785 g010
Figure 11. Internal short circuit current density vs. hydration number.
Energies 17 02785 g011
Figure 12. Comparison between hydrogen crossover current and internal short-circuit current for different membrane water content.
Energies 17 02785 g012
Figure 13. OCV vs. temperature: Nernst, model, experimental and literature comparison from the work of Zhang et al. [34].
Energies 17 02785 g013
Table 1. Experimental parameters.
ParameterValueUnit of Measurement
Temperature20–70[°C]
Air Pressure (being an open-cathode PEMFC using a fan to provide oxygen from external air, the air pressure is function of the angular velocity of the fan itself)0.1[barg]
H2 Pressure0.5[barg]
RH inlet Air (the air humidity was kept constant by the laboratory humidification system)50[%]
RH inlet H2 (pure hydrogen with no humidification system was used for the test)0[%]
Table 2. H-500 PEMFC extracted geometric parameters.
ParameterValueUnit of Measurement
PEM thickness 127 μ m
Cathode flow field plat thickness 0.46 m m
Anode flow field plate thickness 1.87 m m
Active area 74.5 c m 2
Table 3. Water and Nafion molar volume and density.
ParameterValueUnit of Measurement
H2O Molar Volume1.82 × 10−5[m3/mol]
Nafion 115 Density1900[kg/m3]
Nafion 115 Molar Volume5.79 × 10−4[m3/mol[SO3H]]
Nafion 115 EW1.10[kg/mol[SO3H]]
Table 4. Activation energy and pre-factors for water and dry Nafion.
ParameterValueUnit of Measurement
H2O Molar Volume1.82 × 10−5[m3/mol]
Dry Nafion EA6.2 ± 0.1[10−20J]
Water EA2.68[10−20J]
Dry Nafion pre-exp. factor378 ± 18[10−8 mol cm−1s−1 bar−1]
Water pre-exp. factor3.17[10−8 mol cm−1s−1 bar−1]
Table 5. Nafion and water electron resistivity.
ParameterValueUnit of Measurement
Electronic resistivity in dry Nafion 115 at 80 °C6.29 × 105[Ω cm]
Electronic resistivity in water at 80 °C1.013 × 105[Ω cm]
Disclaimer/Publisher’s Note: The statements, opinions and data contained in all publications are solely those of the individual author(s) and contributor(s) and not of MDPI and/or the editor(s). MDPI and/or the editor(s) disclaim responsibility for any injury to people or property resulting from any ideas, methods, instructions or products referred to in the content.