Review

Review of Fault Diagnosis Methods for Induction Machines in Railway Traction Applications

1
SNCF Voyageurs, Direction de l’Ingénierie du Matériel, 6 Rue des Frères Amadéo, 69200 Venissieux, France
2
Universite Claude Bernard Lyon 1, Ecole Centrale de Lyon, INSA Lyon, CNRS, Laboratoire Ampère, UMR5005, 69100 Villeurbanne, France
3
ECAM Lasalle Site de Lyon, LabECAM, 69005 Lyon, France
*
Author to whom correspondence should be addressed.
Energies 2024, 17(11), 2728; https://doi.org/10.3390/en17112728
Submission received: 29 April 2024 / Revised: 18 May 2024 / Accepted: 28 May 2024 / Published: 4 June 2024

Abstract

:
Induction motors make up approximately 80% of the electric motors in the railway sector due to their robustness, high efficiency, and low maintenance cost. Nevertheless, these motors are subject to failures which can lead to costly downtime and service interruptions. In recent years, there has been a growing interest in developing fault diagnosis systems for railway traction motors using advanced non-invasive detection and data analysis techniques. Implementing these methods in railway applications can prove challenging due to variable speed and low-load operating conditions, as well as the use of inverter-fed motor drives. This comprehensive review paper summarizes general methods of fault diagnosis for induction machines. It details the faults seen in induction motors, the most relevant signals measured for fault detection, the signal processing techniques for fault extraction as well as some classification algorithms for diagnosis purposes. By giving the advantages and drawbacks of each technique, it helps select the appropriate method that could address the challenges of railway applications.

1. Introduction

Maintenance plays an important role in modern industry. It ensures the continuous operation of critical equipment, avoiding total replacement when a repairable defect occurs. This leads to a significant financial gain, as it reduces downtime and high replacement costs. In the railway sector, traction and auxiliary motors are part of the equipment most prone to failure [1,2]. This is in part due to the environmental conditions these motors are exposed to, such as varying temperatures and humidity, their continuous operation, severe vibration coming from poor track conditions and mechanical loads as well as the quality of the power supplied by the catenary–pantograph system. Their high cost and direct impact on the rolling stock make it important to elaborate a robust maintenance plan capable of keeping the motors running for the longest time possible, until a fault pattern appears.
Today, different strategies of railway motor maintenance are used, but the most common approaches are:
  • Corrective maintenance, which consists of unplanned maintenance operations that take place when an unexpected fault occurs. In the case of minor faults, corrective maintenance has the advantage of being low-cost and effective. Nevertheless, it cannot fully prevent catastrophic events from happening if the fault is more serious than expected.
  • Preventive maintenance, which involves planned interventions with the purpose of reducing fault occurrence. Contrary to corrective maintenance, preventive maintenance can be costly, as some interventions may not be necessary, but on the other hand, many catastrophic events can be avoided.
The ideal maintenance plan should combine the advantages of both corrective and preventive maintenance.
Condition-based maintenance (CBM) is a good candidate in the railway industry and has great potential. The idea behind CBM is to continuously monitor the equipment and elaborate a maintenance plan based on observed performance or behavioural changes. This way, maintenance can be scheduled according to specific conditions instead of following routine checks, reducing unnecessary maintenance cost and unexpected failures. This is performed by using an algorithm capable of on-line fault detection (FD).
On-line FD methods use measured signals from the machine to detect the presence, severity, and location of a fault. To do so, different signal processing techniques are used to extract what is known as a fault signature. Once the signatures are extracted, classification methods are employed to identify the fault.
Fault extraction and identification can be complex depending on the type of machine that is being monitored and its environment. The majority of railway motors, traction and auxiliary, are squirrel cage induction machines (IMs) working under conditions that make classic FD methods challenging:
  • Auxiliary and traction motors are inverter-fed (Figure 1), causing disturbances in the supply voltage signal due to the high switching frequency of the active components of the inverter [3].
  • Traction motors operate under low load, as they are sized for extreme conditions (i.e., to produce enough torque to climb a hill with a full payload) but rarely remain for an extended period at this full-load operating point. Thus, the motors spend most of their time below the full rated power or slip.
  • They also operate under non-steady state conditions that generate difficult-to-process signals.
These conditions make simple signal processing techniques, commonly used in FD, unsuitable for railway IMs and other IMs working in similar conditions. Frequency domain-based signature extraction methods do not work well in transient regimes and characteristic frequencies are difficult to identify at low slip, unless the sample time is long enough to compute the spectrum with a high resolution [5,6,7].
Other methods were suggested to counter these problems: the use of time-frequency or wavelet-based fault signature extraction methods, like the short-time Fourier transform (STFT), or the wavelet transform (WT), coupled with machine learning algorithms such as neural networks (convolutional—CNN, artificial—ANN, …) or fuzzy logic (FL) have proven to be very efficient.
The following review will present the process of elaborating an on-line FD system. In Section 2, the different IM faults will be listed, with emphasis on the most common faults found in the railway sector and their origins. In Section 3, the traditional approach to develop a FD system will be explained in four steps: data acquisition, signature extraction, feature reduction and classification. In each step, different methods will be listed and examples of their application to IMs will be given, including direct application to railway IMs.

2. Induction Motor Faults

An IM, although robust and efficient, is subject to internal, external, and environmental stresses that make it prone to failure. If undetected, these faults may lead to the total breakdown of the machine.
In this section, IM faults are presented and grouped into different categories, depending on their location on the machine: the stator, the rotor, or the bearings.

2.1. Stator Faults

The stator is made up of three main parts: the stator outer frame, the stator core, and the insulated stator windings.
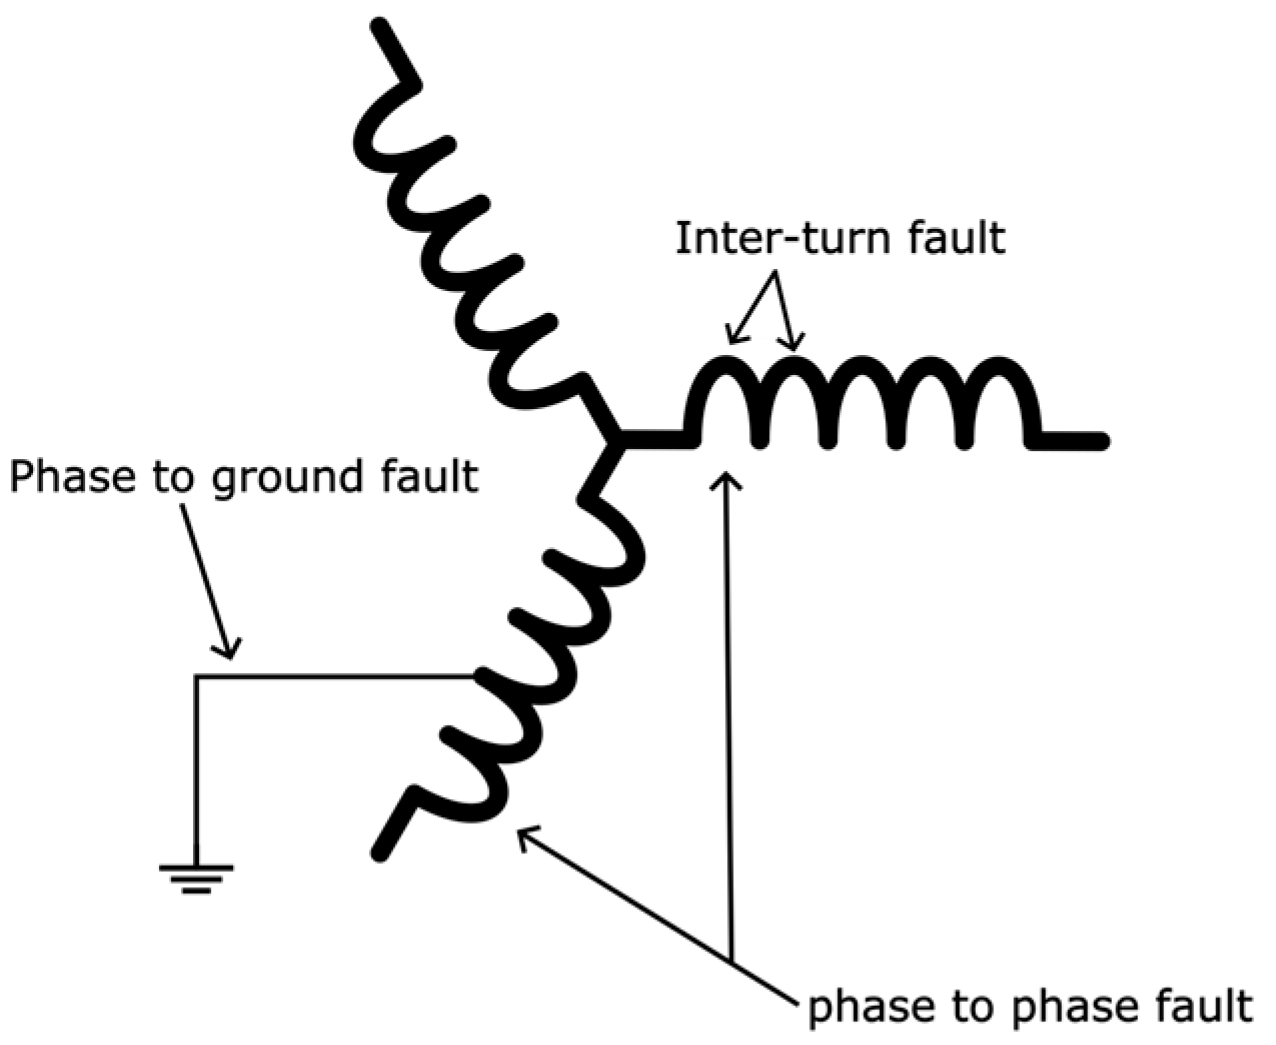
The majority of stator faults are located in the stator windings. These faults include insulation defects, open circuit faults, and short-circuit faults (interturn, phase to phase, phase to ground). Figure 2 shows different types of short-circuit stator faults.
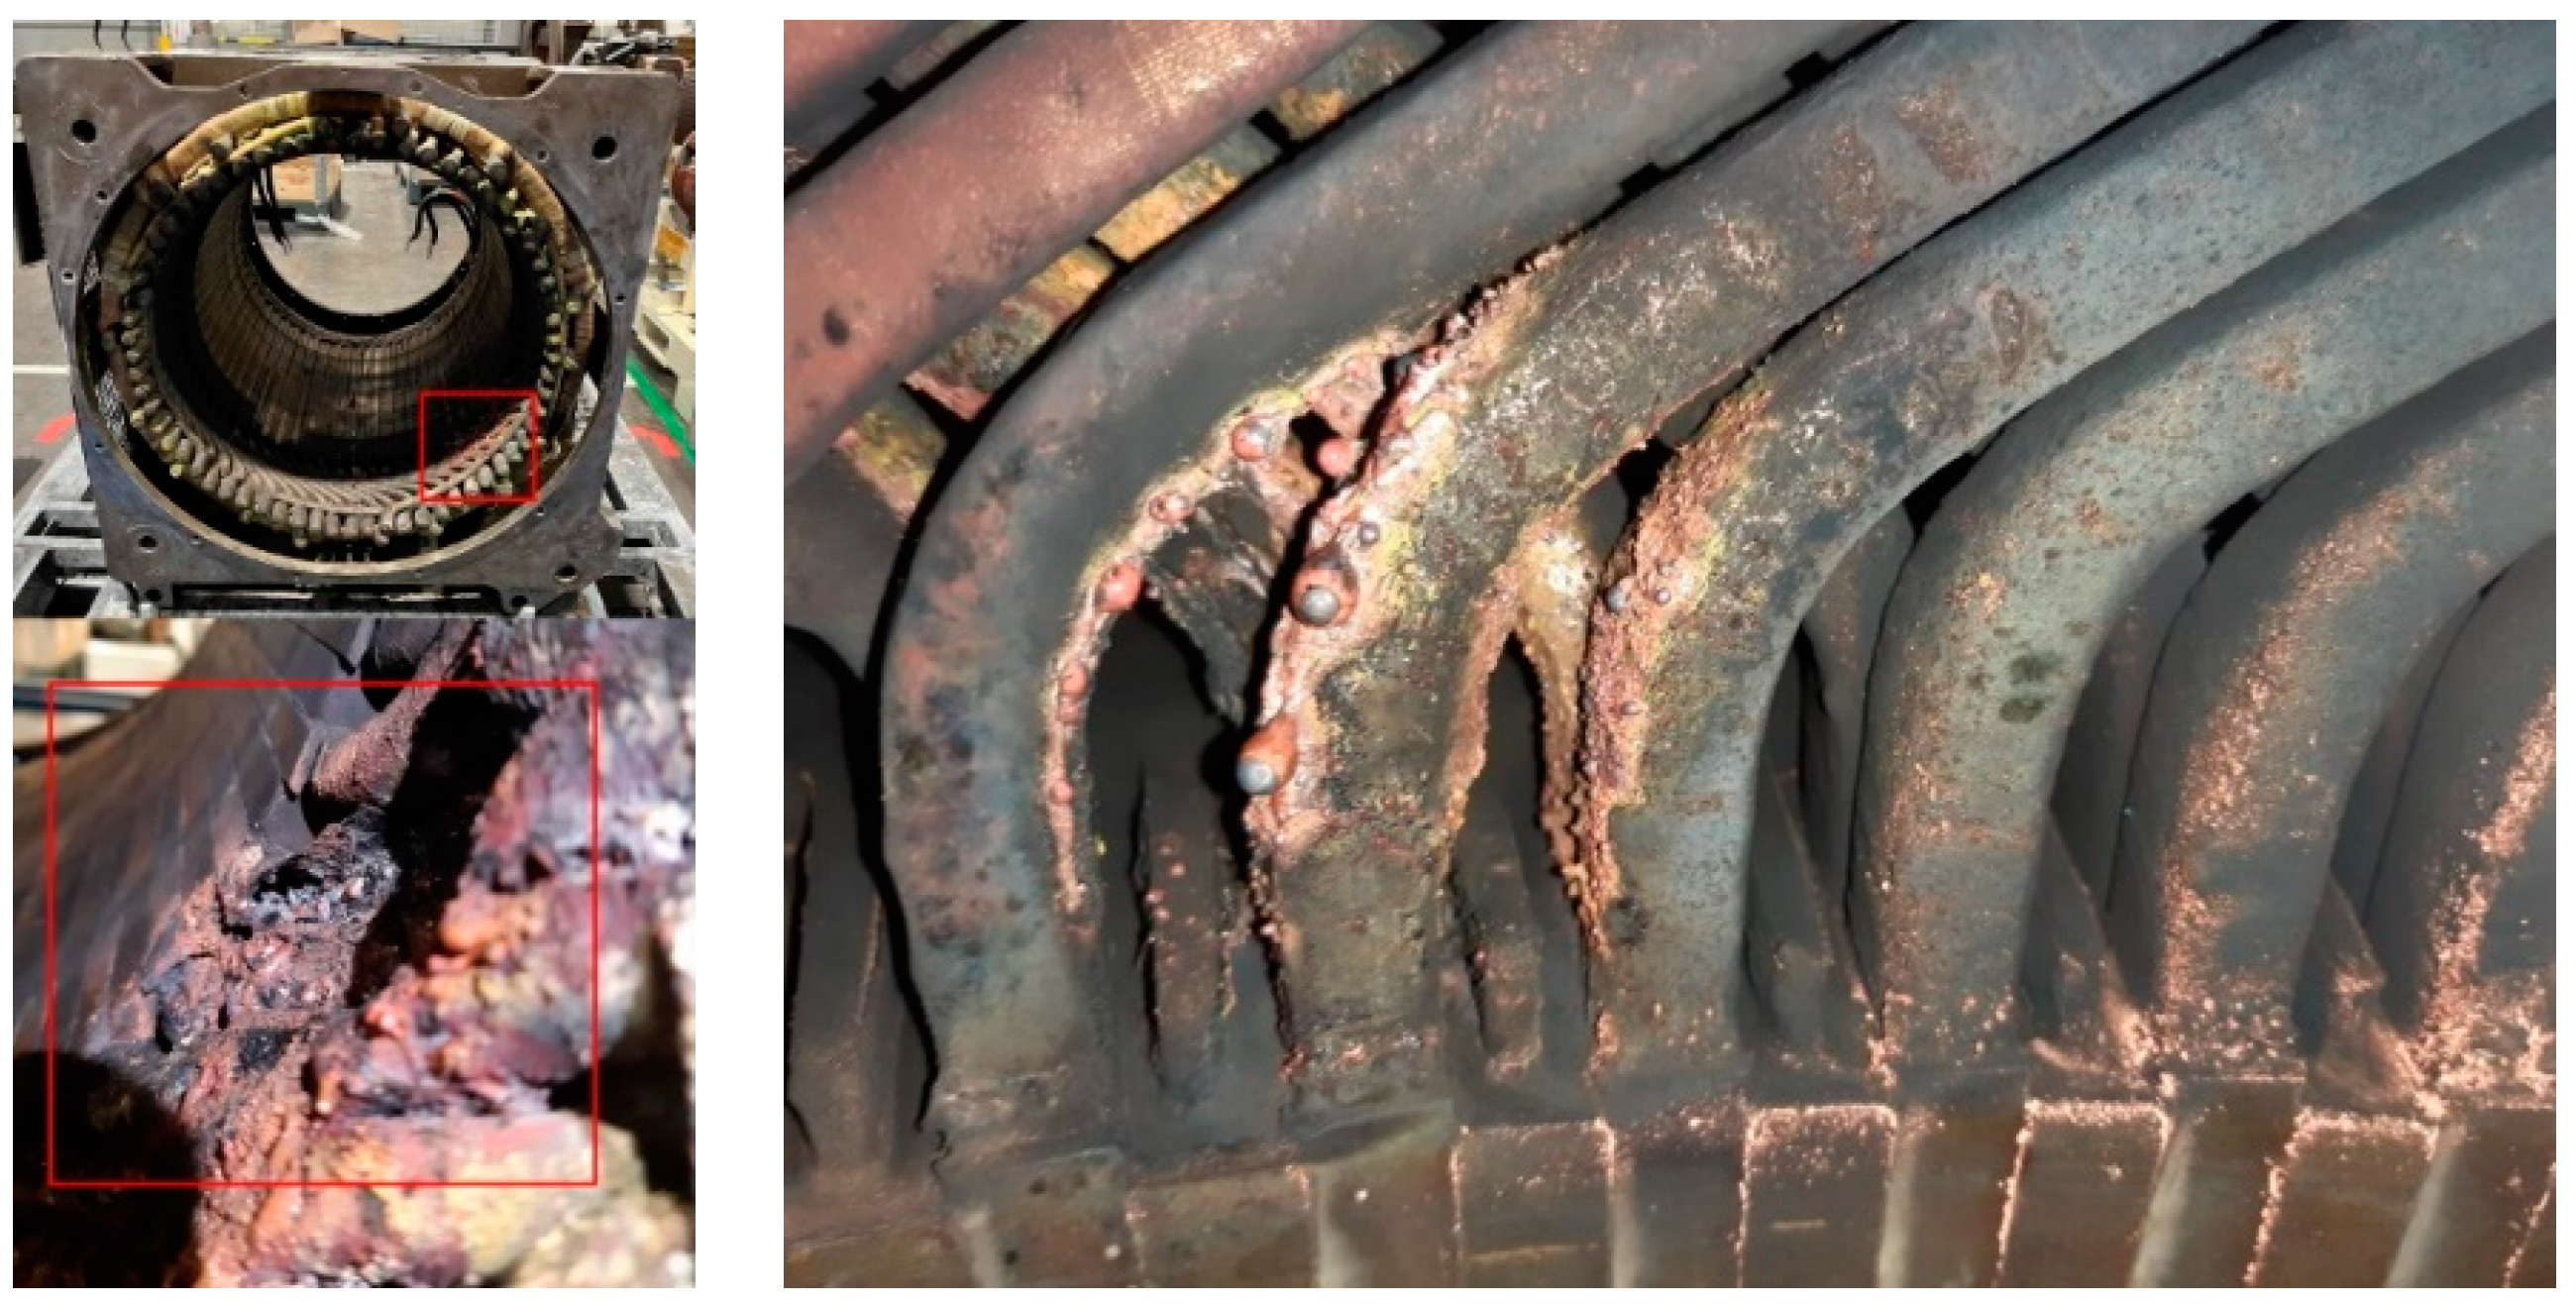
The degradation of the winding insulation is the primary reason behind stator faults as it causes local heating in the windings and eventually inter-turn short circuits. Subsequently, this results in high currents flowing through the machine, prompting further damage. An example of a stator fault in a railway electrical machine can be seen in Figure 3.
Stator faults can also be the consequence of the motor’s environment and human error in the fabrication process.

2.2. Rotor Faults

Squirrel cage IMs are made of conductive bars short-circuited at their extremities by end rings. Due to manufacturing defects and motor overload, faults may appear in the rotor. These faults include broken rotor bars (BRBs), broken end-rings, eccentricity, and misalignment.

2.2.1. Broken Rotor Bars

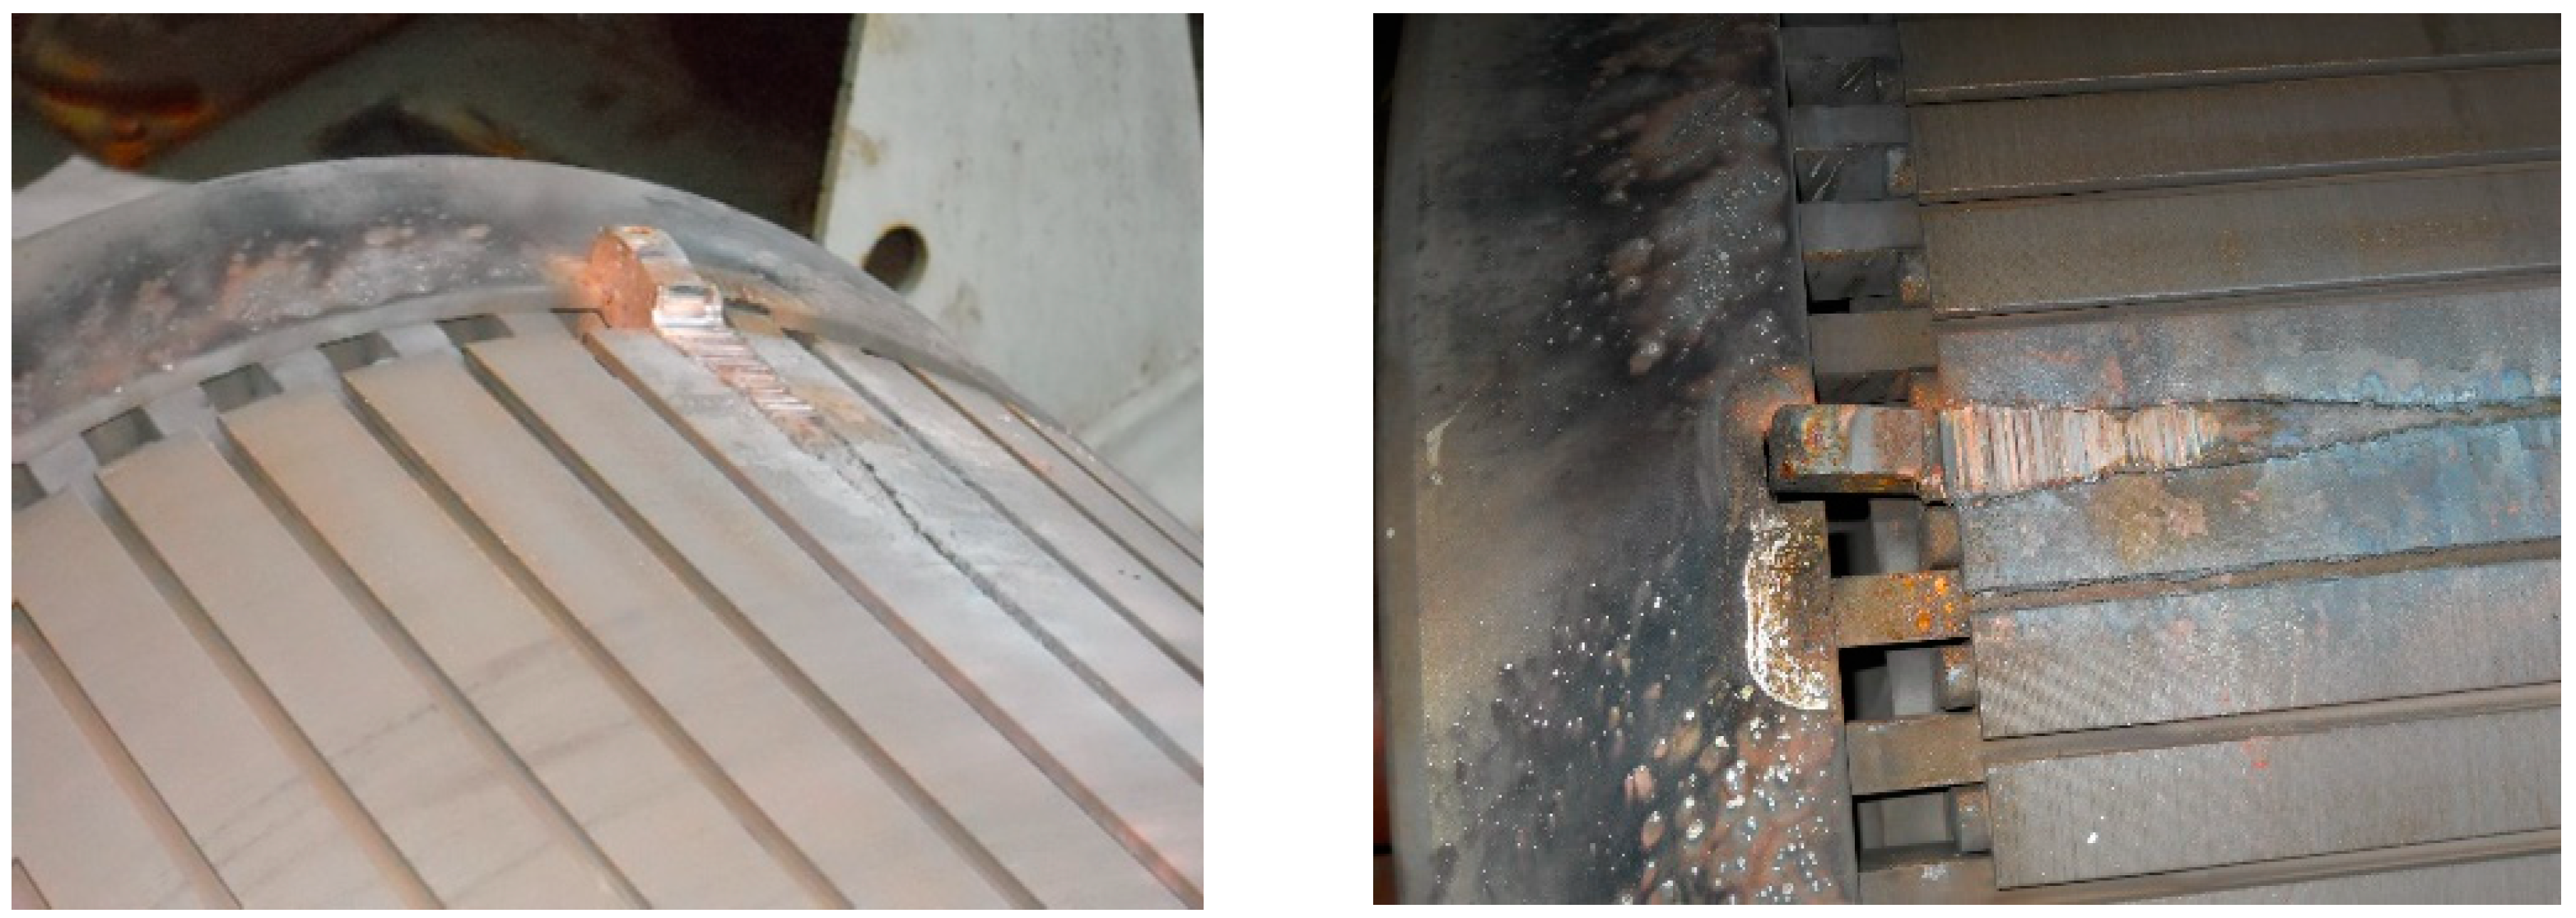
Manufacturing defects, porosity, machine overload and damage in the gears are the root causes of BRBs. When one or more bars break, the surrounding bars can rapidly become damaged as well. In some cases, it can result in catastrophic motor failure if they lift out of their slots while the motor is running. Figure 4 shows an example of a BRB that has lifted out of its slot on a railway IM.

2.2.2. Eccentricity Faults

Eccentricity faults occur when the air gap between the stator bore and the rotor, which is supposed to be uniform along the stator circumference, varies. This can be the result of a manufacturing defect, motor overload, or the degradation of the bearings. It causes vibrations, more bearing damage and can ultimately lead to contact between the rotor and the stator.
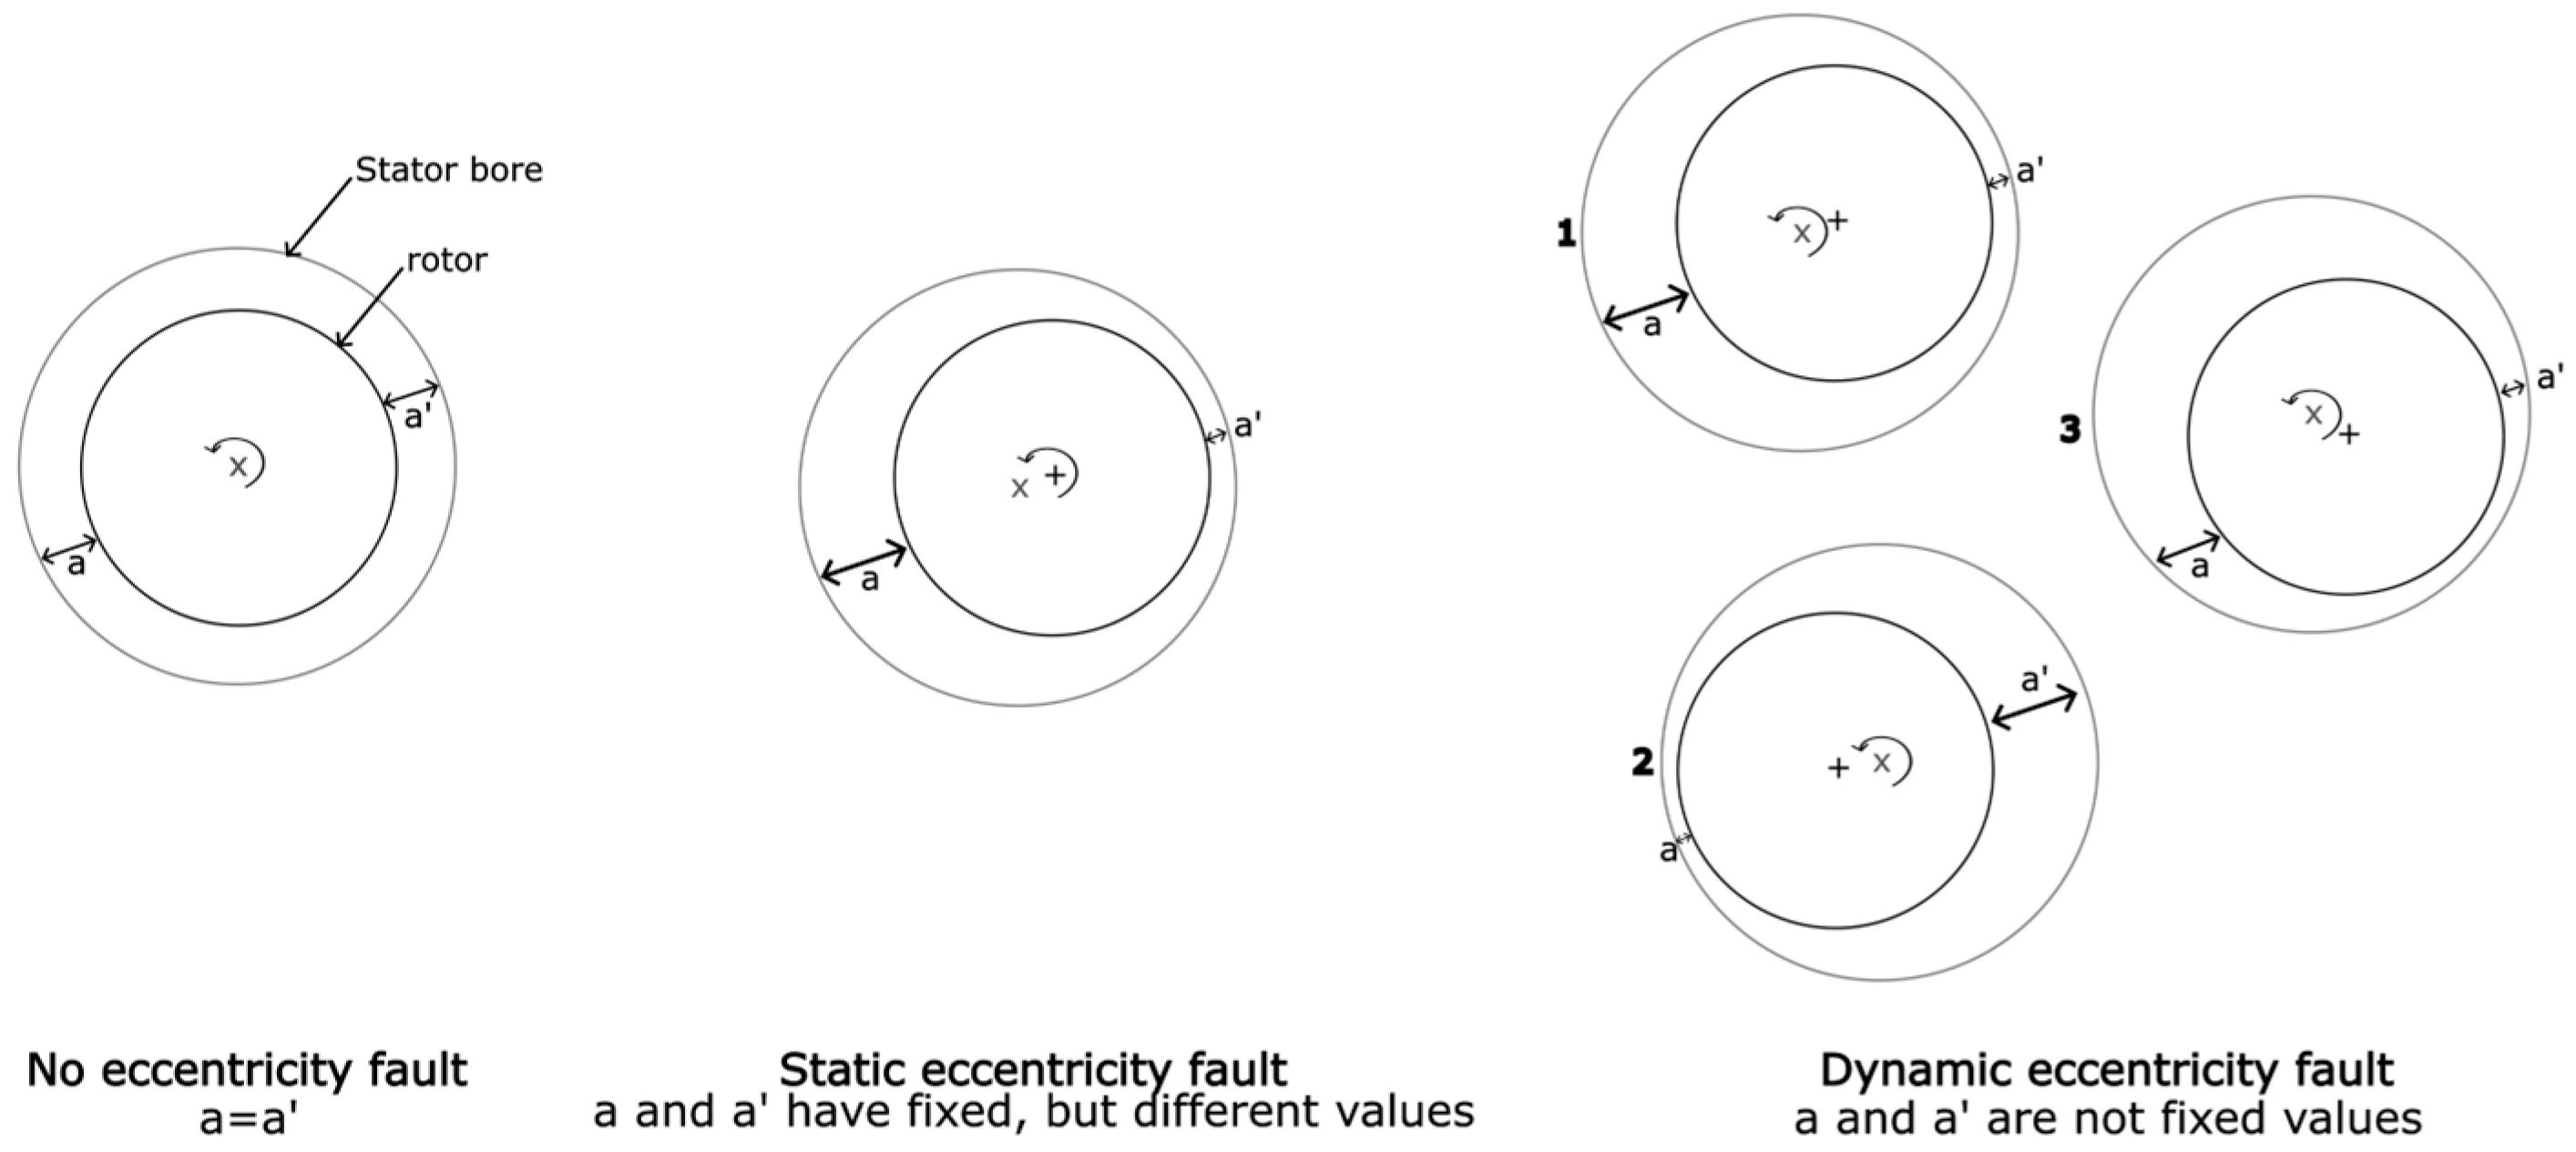
There are three different types of eccentricity faults: static eccentricity, dynamic eccentricity, and mixed eccentricity. Figure 5 shows a representation of static and dynamic eccentricity compared to a motor with no eccentricity fault.
In the case of static eccentricity, the rotation point of the rotor is fixed but not aligned with the centre of the stator bore. In the case of dynamic eccentricity, the rotation point of the rotor turns around the circumference of the stator.
Mixed eccentricity is a combination of both static and dynamic eccentricity.

2.2.3. Misalignment Faults

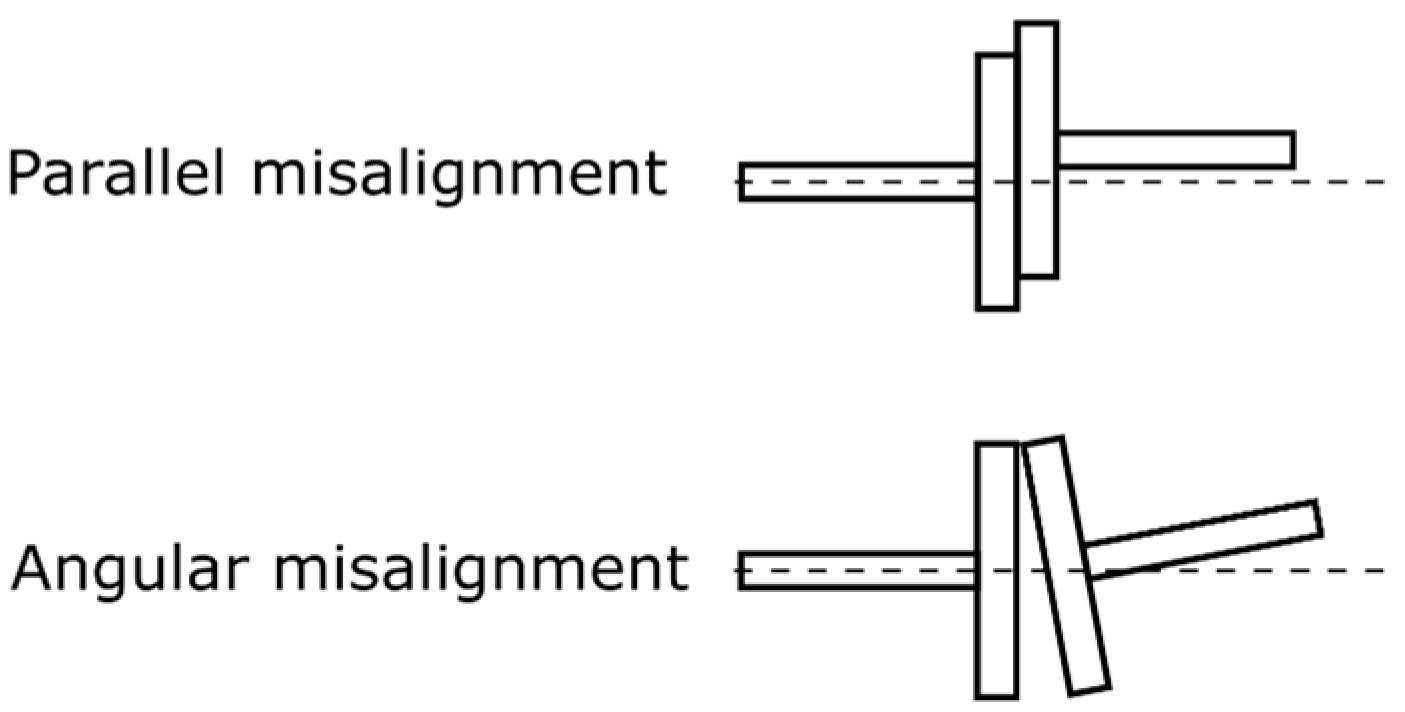
Misalignment is the result of an incorrect coupling of the motor and load shafts during assembly, or it can be the result of motor overload. Three types of misalignments can be seen: parallel misalignment, angular misalignment, and combined misalignment. Figure 6 illustrates both parallel and angular misalignments.
Misalignment can cause vibrations in the machine, which is the origin of other rotor and bearing faults.

2.3. Bearing Faults

Bearings are mechanical devices mounted on the rotor shaft of an IM to minimize friction during its rotation. They are located on either side of the machine rotor. An example of ball bearings and the different bearing elements can be seen in Figure 7.
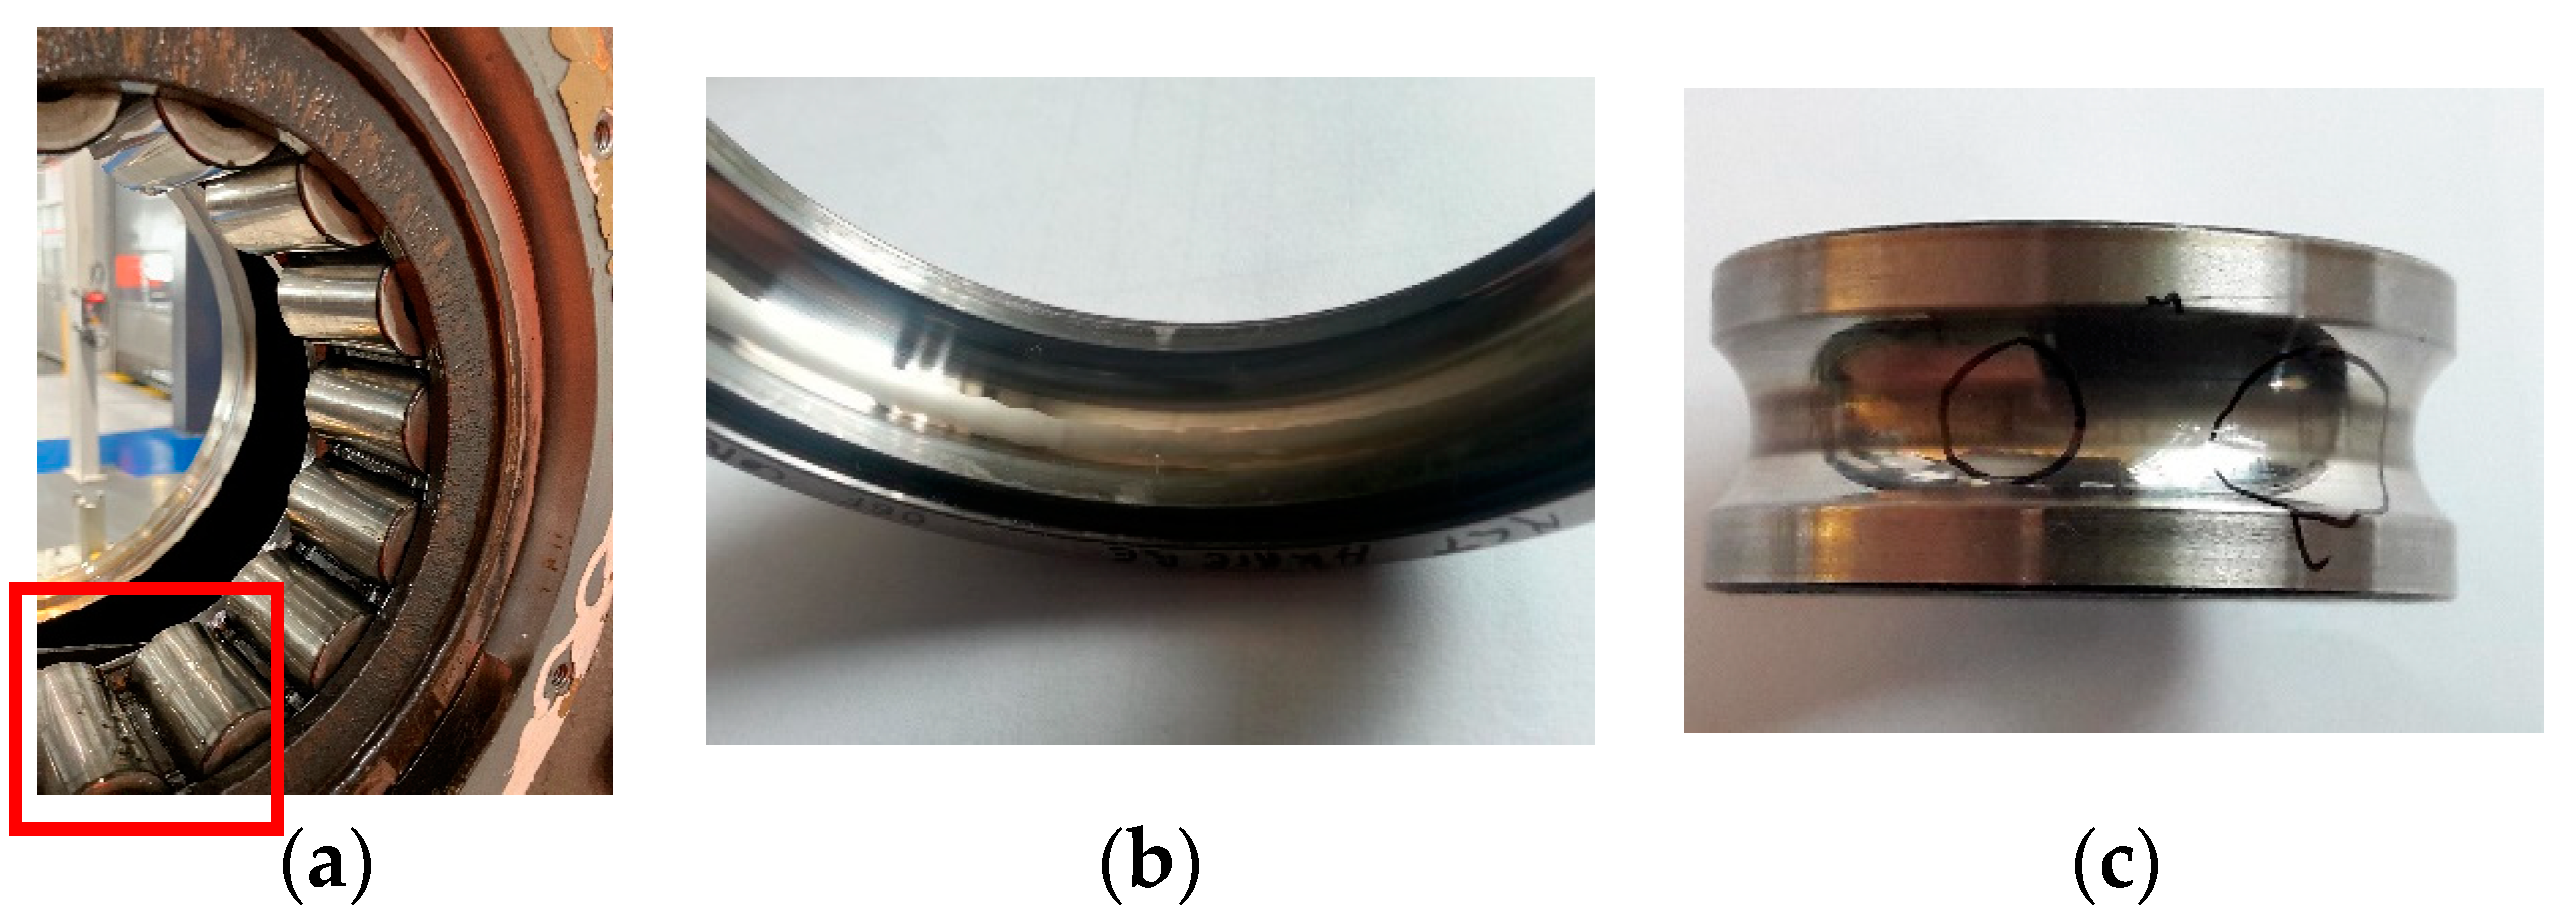
Different types of bearing faults exist, and they are classified according to their location: in the outer raceway, in the inner raceway, in the cage, or on the rolling element. In these cases, the fault is called a “localized fault”. Figure 8 shows three types of localized bearing faults: the first one can be seen in the rolling element (outlined by the red box). The second one is in the outer raceway and the third one in the inner raceway. A bearing fault can also be “distributed”, in which case it represents a series of irregularities in the geometry of the bearing.
Bearing faults are mainly the product of lubrication defects, under-sizing or of currents passing through the bearings.

2.4. Other Faults

Other elements can have an impact on the machine if they break down or present defects. These elements include the ventilation system, the power supply, and the gears.
A fault in the ventilation system can cause overheating, thus damaging the stator insulation and the windings.
A railway traction system is connected to a pantograph–catenary system that continuously supplies the train with power. This system can be subject to mechanical shocks and electrical arcing that impact the quality of its strips and contact wires and can also damage the equipment in the electrical train system, including the IM [8].
In addition, faulty components in the inverter and rapid switching frequencies could result in high voltage ringing. This causes high-frequency currents to pass through the motor bearings and eventually leads to the degradation of the insulation. It can also cause vibration and further stress on the bearings.
Lastly, faulty gears produce torsional vibration, impacting the speed and torque of the machine.
In traction IMs, stator faults, inner raceway bearing faults and BRBs are, respectively, the most frequent faults. This is not the case for auxiliary IMs, where stator faults and inner raceway bearing faults are, respectively, the most present faults, while rotor faults are rarely seen. This is due to difference in their power ranges, the loads, and the size of the machines.
The different IM faults that appear in this section are summarized in Table 1.

3. Overall Description of a Fault Detection System for Induction Machines

The faults listed in Section 2 have a considerable impact on the machine and can be identified by analysing variations in measured signals and internal parameters of the machine. From these signals and models, some features are extracted. They are called fault signatures or pattern vectors. There are different ways to extract the signatures. It can be performed through signal processing techniques in time, frequency, or time-frequency domains, through wavelet transforms, impedance analysis, or by using model-based methods.
Once extracted, scaled, and once the most important signatures are selected, they can be used in a classification algorithm that will detect the fault.
The choice of the fault extraction technique depends on the operating conditions and environment of the machine, as well as the specifications that the FD algorithm has to answer to in terms of complexity, calculation time, etc.
The elaboration of a fault diagnosis system can thus be decomposed into four different steps: data acquisition, signature extraction, feature selection/reduction and classification [9].

3.1. Data Acquisition

Data acquisition is an essential step in FD. In the case of a railway IM FD algorithm, the acquired data consist of measured signals on the IM. It should be noted that the ideal fault diagnosis system must be non-intrusive, making the use of some sensors, such as specific field sensors, unfeasible [9]. Also, CBM requires the signals to be continuously monitored, meaning the sensors should be mounted on all IMs while they are in use. This could become cost-prohibitive if the techniques used in the FD system require expensive sensors and embedded systems.
Once acquired, the signals are subject to different processing techniques: filtering, noise reduction and compression. If these techniques are not applied, information may be lost due to noise interference [10].
Most works in the literature use stator currents, voltage, vibration, speed, temperature, and axial field measurements to detect faults in IMs, as they can be acquired using non-invasive sensors.

3.2. Signature Extraction

Signature extraction is the second step of the FD algorithm construction. The measured signal is either directly manipulated using signal processing techniques to extract the fault signature, or it can be used to estimate other values through a model-based approach.

3.2.1. Time Domain Methods

Time domain methods are simple and do not involve any complex transformation of the signal. The signature can be found by calculating mathematical and statistical parameters of acquired signals.
Mathematical and statistical indicators provide information on quality and performance. A sudden change in these parameters can indicate the occurrence of a fault.
Statistical indicators include the root mean square (RMS) value, standard deviation (SD), variance, maximum or minimum amplitudes, kurtosis factor, crest factor, etc. By comparing the calculated indicators to fault thresholds, it is possible to differentiate healthy components from faulty ones. Examples of statistical indicators and their corresponding equations are presented in Table 2.
Statistical analysis in the time domain allowed the identification of stator short-circuit faults [11], rotor faults [12,13] and bearing faults [14] using stator currents and vibration signals. In [15], an inter-turn short-circuit fault was identified with a signature obtained from the local maxima and minima of the stator currents, Akima interpolation [16] and energy values.
Other time domain techniques focus on representing the measured signals in the direct quadrature (DQ) frame by using the Park’s vector transform. This way, additional fault indicators can be acquired using the signals represented by their direct and quadrature frame equivalents. This method was used to identify BRBs [17] and inter-turn stator winding faults [18].
Several authors used the negative-sequence component in stator currents to extract a fault signature. This allows the detection of stator faults such as imbalance in the windings [19] and inter-turn short circuits [20,21]. However, it should be noted that other external faults, such as supply voltage imbalance, and faulty current sensors can also introduce negative-sequence components. This can make IM stator FD challenging.
Table 3 summarizes the different time domain methods that were presented in this section.

3.2.2. Frequency Domain Methods

In some cases, fault indicators cannot be found using only time domain indicators. Some information is more readily observed in the spectrum of the signals.
Frequency domain methods use the spectrum computed from the discrete Fourier transform (DFT) or the fast Fourier transform (FFT) to extract fault signatures. The appearance of specific frequency components can indicate the presence of a fault.
Characteristic frequencies can identify localised bearing faults, stator faults, BRBs and eccentricity faults. In most cases, they are found in the stator current, mechanical vibration and axial flux spectra. Table 4 presents the characteristic frequencies corresponding to each fault, depending on the measured signal [22,23,24,25].
Frequency domain methods were tested on a simulation of a railway traction IM to detect BRBs in [25]. The authors computed the FFT on stator phase currents of an inverter-fed IM. They managed to identify the fault-related harmonic current components.
Most times, the frequency domain methods are ideal when the machine is functioning under nominal, steady-state operating conditions with large sampling periods. In other cases, it is difficult to use the FFT, as a short sampling period leads to low-frequency resolution in the spectrum. And when the machine is working at low slip, some characteristic frequencies are difficult to identify with low frequency resolution because they are located close to the supply frequency.
To counter this problem, the high-resolution multiple signal classification (MUSIC) and the estimation of signal parameters by rotational invariance techniques (ESPRIT) algorithms were used on data with short sampling periods. They were able to detect a BRB and eccentricity faults [26,27,28]. However, it can be difficult to implement these methods on digital controllers in the case of on-line fault diagnosis, as they have a high complexity.
Other solutions were proposed to counter the problems related to low resolution. In [29], the authors used a demodulation technique, eliminating spectral leakage and allowing the detection of a BRB fault under non-stationary conditions. In [30], a low complexity technique using the rectified current signal is used to reduce the spectral leakage and allows the detection of rotor asymmetries.
Another method was tested on railway motors in [31]. It uses octave band analysis on leakage currents to extract a fault signature capable of detecting inner raceway bearing faults.

3.2.3. Time-Frequency Domain Methods

Time-frequency (TF) techniques provide information as a function of both time and frequency. This can solve some problems faced when using time domain or frequency domain methods separately, where information from the other domain is lost.
A well-known TF method is the STFT. It consists of decomposing the signal into small windows, then computing the FFT for each one. Once the FFT is computed, a spectrogram of the signal can be plotted. It shows the strength of a signal associated with a specific frequency, over time. Contrary to frequency domain methods, TF methods can be used on non-steady-state applications, although these signals need to be slowly changing.
In [12], fault signatures using time and frequency domain methods were compared to signatures extracted using the STFT to detect BRBs under various loading conditions. The STFT method was proven to have a significantly higher accuracy compared to the time and frequency domain methods.
In [32], the author used the STFT on the vibration signals of deep-groove ball bearings. The bearing fault signature for an electric motor working under variable conditions was extracted using this method, and the signature was then used to diagnose the machine with high accuracy.
The STFT can also be used to detect misalignment faults using motor currents, as seen in [33].
Although the STFT has been shown to be useful in certain FD systems, it suffers from a trade-off between time and frequency resolutions: improving one automatically deteriorates the other (Heisenberg–Gabor uncertainty principle). Ref. [34] proposes a combination of both STFT and maxima’s location algorithm (MLA) to detect rotor faults under variable speed conditions. The proposed method has an improved performance compared to the conventional STFT method.
Another method is the Wigner distribution function (WDF), which has the advantage of giving the highest resolution possible in terms of both time and frequency. However, it has the disadvantage of generating cross terms between negative and positive frequencies. The WDF was used to detect mechanical load faults by analysing the stator current of an IM [35] and rotor asymmetry [36]. It served as a fault signature for IM mechanical faults, combined with the use of the Concordia and Hilbert transforms [37].
The Hilbert–Huang transform (HHT) is another time-frequency approach that counters certain disadvantages of the STFT. It is used to compute the instantaneous frequency and amplitudes of a signal, without any prior knowledge of the signal, contrary to the STFT, where the window size must be known in advance.
The HHT was used on stator currents to detect bearing faults in [38] and eccentricity faults in [39].
The different time-frequency methods mentioned in this section are summarized in Table 5.

3.2.4. Wavelet Transform

The wavelet transform (WT) is an approach that decomposes the signal into different windows, and each window is convoluted with a set of wavelets at different scales. Scales represent the position of the wavelet in time and its width. Much like the FT, there are two types of WT: the continuous wavelet transform (CWT) and the discrete wavelet transform (DWT).
WTs have the ability to adjust to signal variations, making them suitable for signal analysis in transient regimes. They provide frequency information with a high temporal resolution.
Different types of wavelets exist: some wavelets are more adept at representing smooth variations in the signal but may not work as well on signals with sharp discontinuities, and some require large computational time, giving more accurate results than other wavelets. The choice of the wavelet depends on the features that are sought in the signal.
The WT was used to detect different IM faults in non-steady-state conditions: BRBs using the stator current in [40,41]; bearing faults in [42,43], where a combination of the Park vector approach and the WT was used; and stator inter-turn faults in [44,45,46].
The wavelet packet transform (WPT) is an extension of the DWT that goes through additional high-pass filtering. This method was used to detect bearing faults in [47], and an improved approach based on DWT called multiple-windowed harmonic wavelet packet transform (MWHWPT) was presented and tested on BRBs in variable frequency drive-fed double-cage IMs in [48].
All wavelet-based methods mentioned in this section are summarized in Table 6.

3.2.5. Impedance Monitoring

Impedance monitoring has been studied by various authors for FD in IMs, especially for stator-related faults.
One method suggests continuously monitoring the sequence component impedance matrix, which is usually calculated using positive, negative and zero sequence components of voltage and current phasors [49]. When a fault occurs, an asymmetry appears in the machine, and the off-diagonal terms Z i j of the matrix become nonzero. They represent the impedance Z of the i sequence due to the j sequence, i and j being the positive, negative or zero-sequence components of the voltage and current phasors. In the article, the authors used the Z n p impedance, as it is slip-dependant, to detect a turn fault in the machine.
Another method is proposed in [50], where inter-turn short circuits are detected by monitoring the variation of the common mode (CM) impedance at a specific frequency of interest (FOI). If properly selected, an inter-turn short circuit can be detected by monitoring the impedance value at the FOI instead of monitoring it at a wide frequency range. This would allow a lower fault detection response time.
In [51], the impact of stator winding faults on differential mode (DM) noise is presented. When a winding fault occurs, the DM impedance of the machine changes and a DM-to-CM transformation may occur. This influences the DM noise emission, which allows stator winding fault detection.
In [52], a high-frequency modelling of an inverter-fed IM with stator winding faults is presented. This model is elaborated using high-frequency lumped motor impedances and a DQ model of an inter-turn short-circuited IM. Using the model and the discrete wavelet transform, it is possible to extract inter-turn short-circuit fault signatures.
Stator FD using impedance analysis can also be performed offline, as seen in [53]. The author presents a method that focuses on impedance imbalance. Six impedances are calculated after applying an AC voltage with six different voltage connections. Then, using the impedance values, the faulty phase is identified. With this method, the faulty phase can be detected without the need for prior healthy data.
Although most works in the literature use impedance monitoring to analyse stator faults, the authors in [54] used impedance variations to detect BRBs in inverter-fed IMs. The method consists of using a pulsating magnetic flux setup within the machine by adapting the switching strategy of the inverter and measuring the impedance at each rotor angle while the rotor is manually rotated. It is shown that an IM with a BRB has an impedance that varies sinusoidally with angular position, whereas that of a healthy motor is constant.
It is also possible to directly measure motor impedance with impedance analysers (IA) and vector network analysers (VNA). Accurately detecting certain faults may require analysing motor impedance at high frequencies. Traditional connection hardware such as Kelvin clip leads, or extension cables, are band-limited to approximately 1 MHz [55]. To facilitate accurate impedance measurement for high frequencies, the authors in [56] propose a suitable connection fixture allowing accurate measurement of impedance from 100 Hz up to 120 MHz.

3.2.6. Model-Based Feature Extraction

The methods presented in the previous sections all rely on the direct analysis of measured signals to extract the fault signatures. However, model-based approaches can also be applied to identify fault signatures. These methods include the following:
  • Observing some parameters of the model that could help determine the presence of faults;
  • Calculating a “residue”: the difference between a theoretical model of the machine’s parameters or estimated signals and the actual signals and parameters measured on the machine.
Observers are algorithms developed using the inputs/outputs of the observed system and are capable of estimating its state or the state of its internal parameters. They can only be used if the system is knowledge-based. The block diagram of an observer can be seen in Figure 9.
In [57], two types of Kalman filters were used to estimate the rotor resistance of an IM: the unscented Kalman filter (UKF) and the extended Kalman filter (EKF). The obtained value was then compared to its nominal value to detect the presence of a BRB. The EKF was also used in [58] to detect interturn short-circuit faults and the faulty phase.
In [59], the observed speed of an IM was used to detect faulty bearings. The author used a Luenberger observer to estimate the mechanical rotating speed, then computed the speed spectrum to identify characteristic frequencies related to bearing faults.
In traction applications, the sliding mode observer was presented as a stator winding incipient shorted-turn FD method. This method was tested on a traction motor simulation and proved to be effective [60]. Another method used the estimated rotor flux and magnetizing currents to diagnose BRBs on a traction IM in steady state and transient regimes [61].

3.3. Feature Reduction

Once the fault signatures have been collected, it is important to reduce the number of features by selecting the most significant ones. This reduces the dimension of the input data given to the classification algorithm. The information collected from signature extraction can be redundant, noisy or have little to no influence on the fault diagnosis. Having a large amount of data makes the classification complex and increases computational costs. It can also induce a faulty diagnosis.
An important step before feature reduction is scaling, normalizing, and standardizing the extracted signatures. Scaling reduces the data to the same scale, while eliminating outliers. Normalization brings the value of the features to a scale ranging from 0 to 1, while standardization uses the mean and standard deviation to compute the corresponding value of the feature. Once scaling is performed, different feature reduction methods can be applied.
Intercorrelation can be used as a tool to identify redundant parameters. This is performed by calculating the Pearson coefficient or the Spearman coefficient [9].
Principal component analysis (PCA) is a commonly used method for feature or dimensionality reduction. It transforms a large dataset into principal components, a new set of uncorrelated variables. The first few components are the ones capturing the most variance, and by preserving them, PCA reduces the dimensionality of the data while keeping the most relevant information.
PCA was used as a feature reduction technique in different FD algorithms: to detect stator inter-turn faults [62], BRBs [25] and bearing faults [63]. A combination of PCA reduction and the Bayesian classification method was used to detect electrical and mechanical faults under varying loading conditions [64].

3.4. Fault Classification

The last step of a FD algorithm is fault classification. After collecting all necessary data (fault signatures), machine learning algorithms are used to identify the fault in the IM. These algorithms can either be supervised or unsupervised.

3.4.1. Supervised Classification

Supervised classification is a machine learning approach that uses available, labelled data to find a correlation between input features and output labels. These labelled data form a learning database.
The advantage of supervised classification is the control it allows. The user can choose the different fault categories that the signatures will lead to. This makes it easier to identify errors in the algorithm while training it. Supervised classification is often trustworthy and more accurate than unsupervised learning, where the algorithm will create its own classes by deduction and could make faulty, difficult-to-verify assumptions.
However, with supervised classification, it is necessary to have a high understanding of the fault signatures used as the training set. This is difficult when the fault signatures are found using complex signal processing techniques such as the WVD, where visual or physical understanding of the signature is lost. Without accurate training data, the algorithm may lead to faulty classification.
Supervised learning algorithms can be grouped into two categories: regression and classification. A regression algorithm outputs numerical values, while a classification provides classes.

Logistic Regression

Logistic regression (LR) is a binary classifier that gives an output corresponding to “True” or “False”. It is possible to use LR as a FD algorithm, with two possible outputs: “healthy” or “faulty”. The algorithm calculates the probability of the input data belonging to one class or the other using different criteria, then chooses the class corresponding to the highest probability and attributes it to the data.
LR was used to determine the presence of a stator fault, using the WT as a signature extraction method, with an accuracy of 77.5% [65]. It was also compared to other machine learning algorithms in [66] to detect faulty power connections in an IM, where it showed the lowest accuracy rate.

K-Nearest Neighbour

The K-nearest neighbour (KNN) is a simple algorithm, based on similarity calculations. It uses a classified dataset as a reference to determine the future classes of the data. The algorithm calculates the distance between the new, unclassified data, and its K-nearest neighbours (K being an integer), then assigns the data to the category that most of its K-nearest neighbours belong to. The choice of K is critical, as a small value for K will give relevance to outliers, but a large value for K will give advantage to the category with the largest number of fault signatures.
The authors in [67] used the KNN algorithm to determine a faulty phase on IMs. Using this algorithm, they were able to determine the type, the severity, and the location of the fault on the machine. KNN was also proven to be the second most effective FD algorithm for power supply faults in [66].
KNN showed 100% accuracy for FD using the WT and matching pursuit as signal processing techniques on the current and vibrations signals to determine the fault signatures of single and multi-electrical and mechanical faults in IMs [68]. It was also used as a bearing fault detector using the DWT as a fault signature extraction method and showed good accuracy [69].

Support Vector Machines

Support vector machines (SVMs) are multi-dimensional classifiers that transform data dimension from a lower dimension to a higher dimension using kernel functions (linear, polynomial, radial, …). Once the transformation is performed, SVMs apply the principle of support vector classifiers (SVCs) to sort out data.
SVCs, or soft margin classifiers (SMCs), use margin (the distance between two tags) maximization to separate different classes in an n-dimensional plane. This allows the creation of a threshold to classify future input data.
SVMs were used to detect BRBs [70] and stator short circuits [71] on IMs, with kernels calculated using an artificial immune system approach. SVMs were also used to detect bearing failures using the FFT [72] and the stationary WPT (SWPT) [73]. The later was able to detect four different types of bearing failures with high accuracy. Also, SVMs were used to detect winding insulation failure, as shown in [74].

Neural Networks

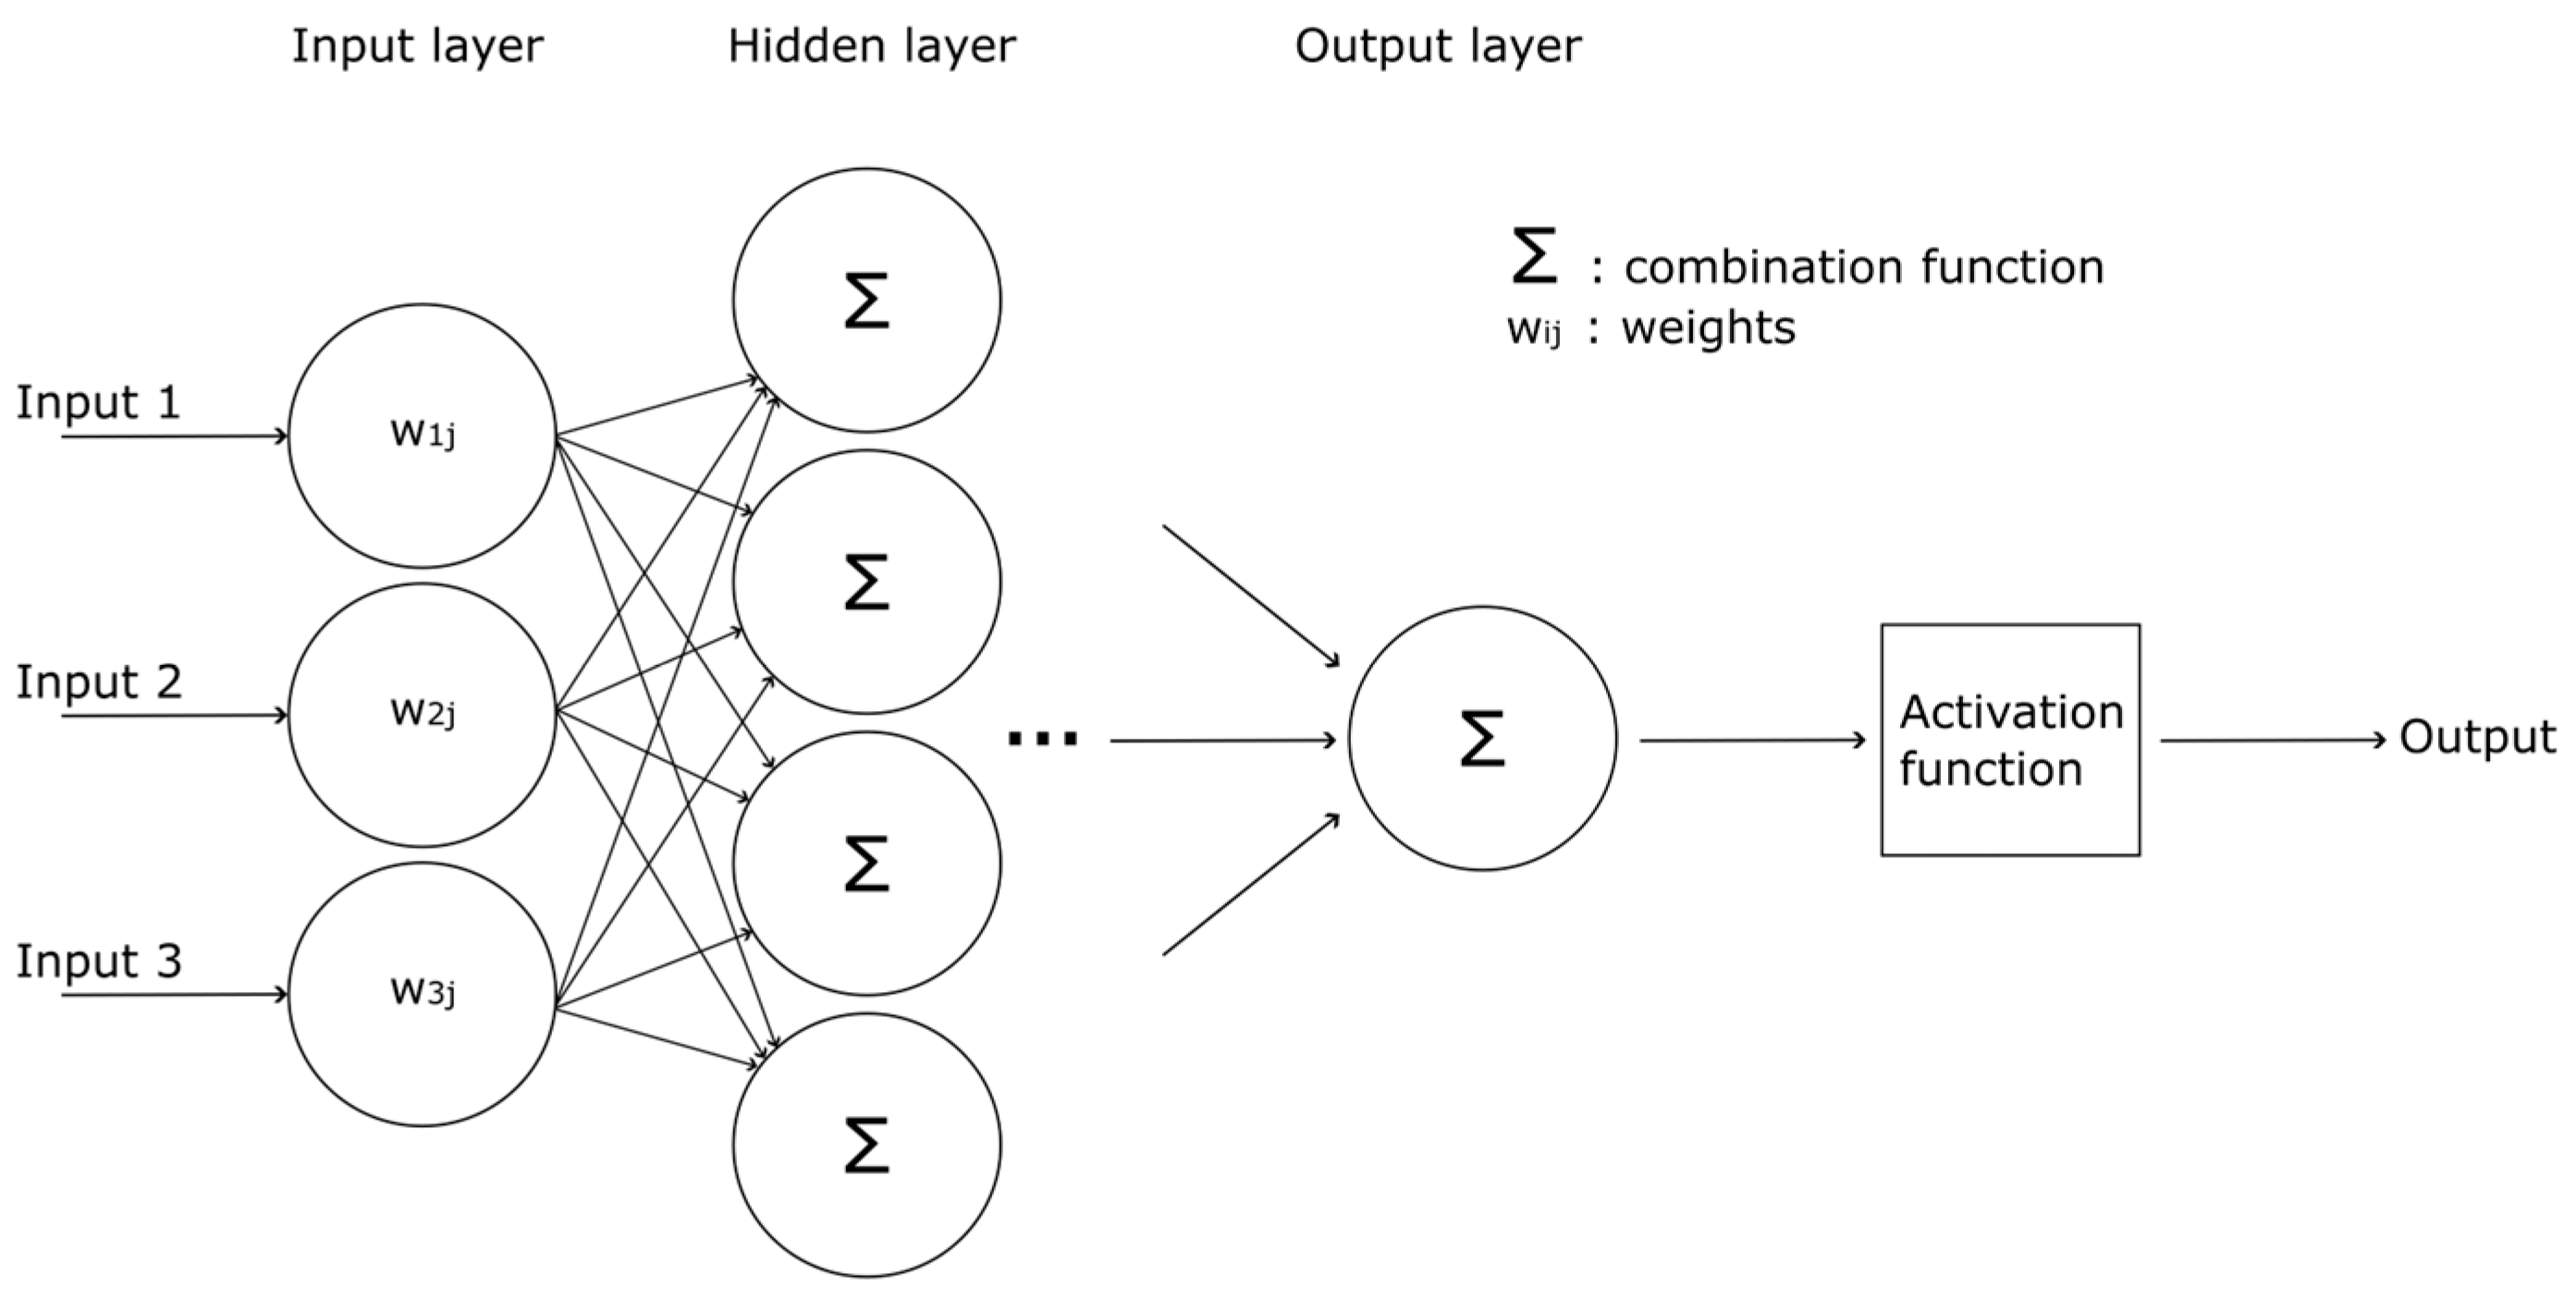
Artificial neural networks (ANNs) are interconnected groups of units that use adjustable parameters, defined as weights, and activation functions (rectified linear unit or ReLU function, sigmoid function, linear function, …), to calculate values that classify the network’s given inputs.
An ANN’s structure consists of different layers, weights, and neurons, as represented in Figure 10. ANNs can be single-layer (perceptron) or multi-layer (a combination of several perceptrons).
Each node receives an input, multiplies it by a weight, then injects it into the activation function to calculate a value. The calculated outputs correspond to the inputs of the following layer.
To obtain the optimal neural network, meaning the optimal weights, ANNs need to be trained. Training is based on iterative loss minimization. During each iteration, the ANN sets the values of the weights, then calculates a loss function. The purpose is to find the optimal weights capable of giving the lowest possible value calculated by the loss function.
ANNs were used to detect inter-turn short circuits in stator windings in [75,76] as well as rotor and bearing faults [77].
CNNs are based on the same concept and are often used to recognise images and grid-like data. Before classification, the input data go through convolutions and pooling. They are then given as inputs to the neural network. This reduces the size of the input data (from all the image’s pixels to only a few pixels containing the important information, for example) before giving them to the neural network.
CNNS were used to diagnose different faults in IMs, such as bearing faults and stator faults [78,79,80].

Decision Trees

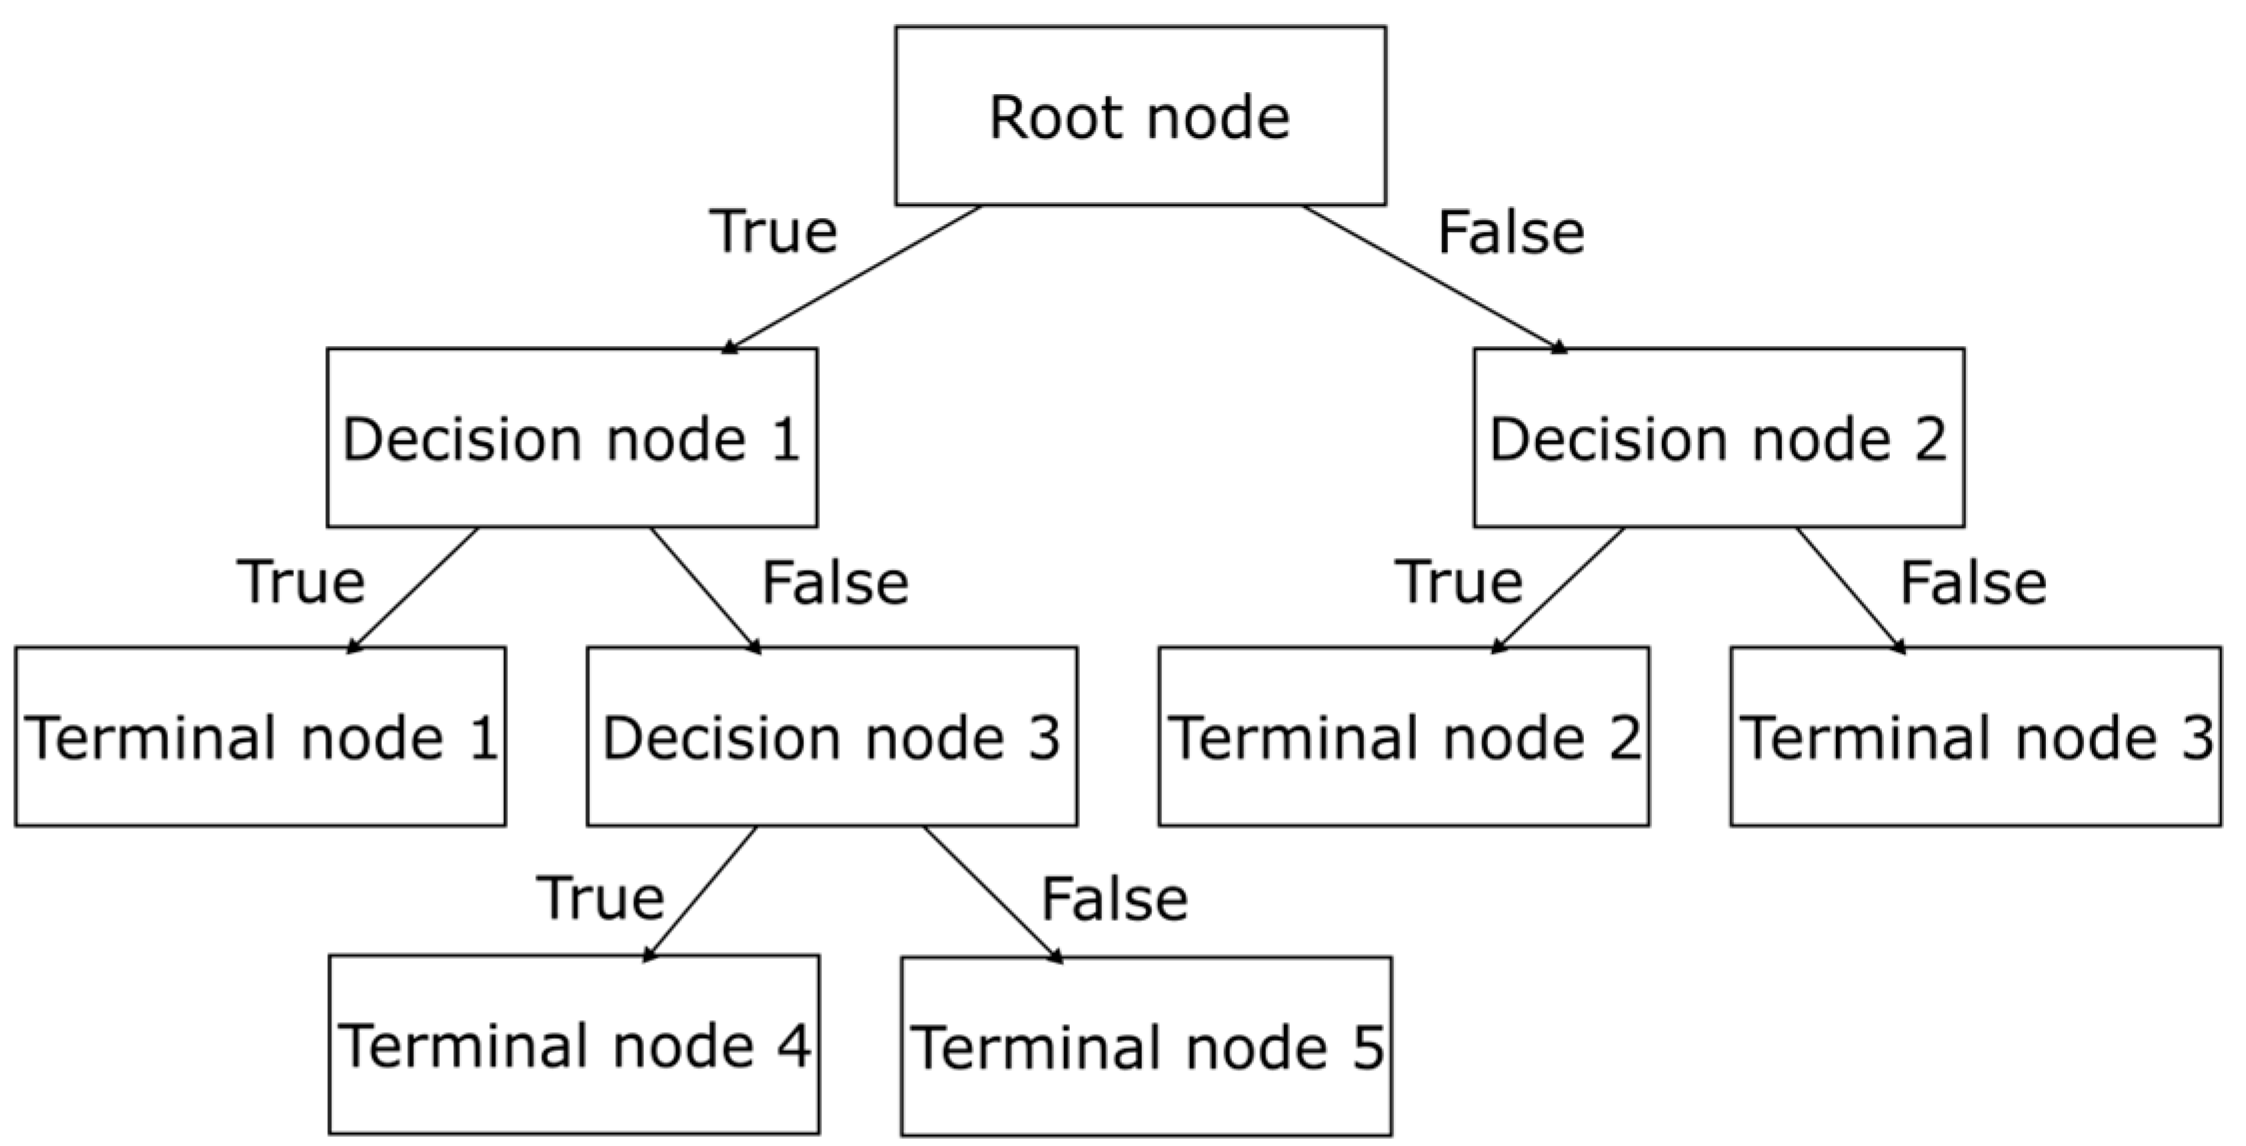
Decision trees (DTs) are a type of machine learning algorithm capable of classifying data into different categories by answering multiple true–or–false questions in a hierarchical structure (see Figure 11). The structure of the DT and the order taken into consideration is chosen by calculating the “Gini Impurity”. DTs can also predict numerical values and solve regression problems. They were used to diagnose faulty bearings [63,81], eccentricity faults and BRBs [82].

Random Forest

Random forest (RF) is a machine learning algorithm that takes its decision based on different DT results. The more decision trees are used, the more accurate the model is. RF algorithms are used when the data are complex, and they reduce overfitting, contrary to DT, where this problem is very much present.
RF proved to have a very high accuracy (almost 100%) in [83] in detecting bearing faults. The algorithm was also able to distinguish between the four different bearing faults. RF was also proven to be of very high accuracy in bearing FD in [84].

3.4.2. Unsupervised Classification

Unsupervised methods are machine learning algorithms, capable of grouping unlabelled data by finding a common pattern or similarity, without human intervention. These algorithms are used for clustering, dimension reduction or association.
For FD, clustering is a possible solution when there is no prior knowledge about the extracted signatures and what fault they correspond to.
Several types of clustering exist. Each method has its advantages and disadvantages depending on the data that need to be processed.

Centroid-Based Clustering: K-Means

This first method consists of building a partition with a precise number of clusters by grouping the data without any notion of hierarchy. One of the centroid-based clustering algorithms is K-means. This algorithm allows data to be grouped into K different clusters according to their similarities.
With the K-means method, the number of clusters is chosen by the user, which can be a disadvantage because this choice is not necessarily known in advance. However, there is a method known as the “Elbow Method” that can be used to find the optimal K. It consists of running the K-means algorithm N times, iterating the value of K each time, and calculating the variance of the different clusters to plot the evolution of the variance as a function of the number K of clusters. The curve associated with this evolution often has a marked elbow, the abscissa of which corresponds to the optimal theoretical K.
K-means also has the drawback that the clusters obtained depend on the initialisation of the first K centroids, which is performed randomly. For the same dataset, we can therefore find different results. The final configuration is not optimal, but we can only talk about a local optimum. To counter this problem, there are iterative approaches that compute the K-means algorithm several times, each time with a random initial configuration of the first K-centroids and the best result is retained (i.e., the result that produces the minimum of the sum of the variances of the clusters ). Furthermore, this type of algorithm is inclusive; it classifies all the data and does not consider the notion of noise. It assigns a cluster to each piece of data, even if it is very far from being similar to the data already present in the cluster.
Despite these drawbacks, this method is widely used for its ease of implementation, its flexibility, and its adaptation to large dimensions.
The K-means algorithm was used to detect inner race, outer race, and ball faults in bearings [85]. In [86], the clustering technique used the DWT as a fault signature extraction method to detect bearing faults. It was also able to determine the presence of BRBs with the FFT as a signature extraction method in [87].
In [88], a combination of both PCA and K-means, two unsupervised techniques for fault extraction and clustering were applied to detect BRBs and bearing faults.

Density-Based Clustering

This method identifies clusters based on the idea that there are areas with a high density of points, separated by other sparse areas.
Unlike centroid-based clustering, which seeks to group all the data into clusters, density-based clustering treats the data present in sparse areas as noise and does not group them into any clusters. This type of algorithm is also adaptive to the shape of the data clouds (a cluster does not necessarily have to be globular).
Density-based clustering algorithms include density-based spatial clustering of applications with noise (DBSCAN). Created in 1996, this was the first algorithm to use data density [89].
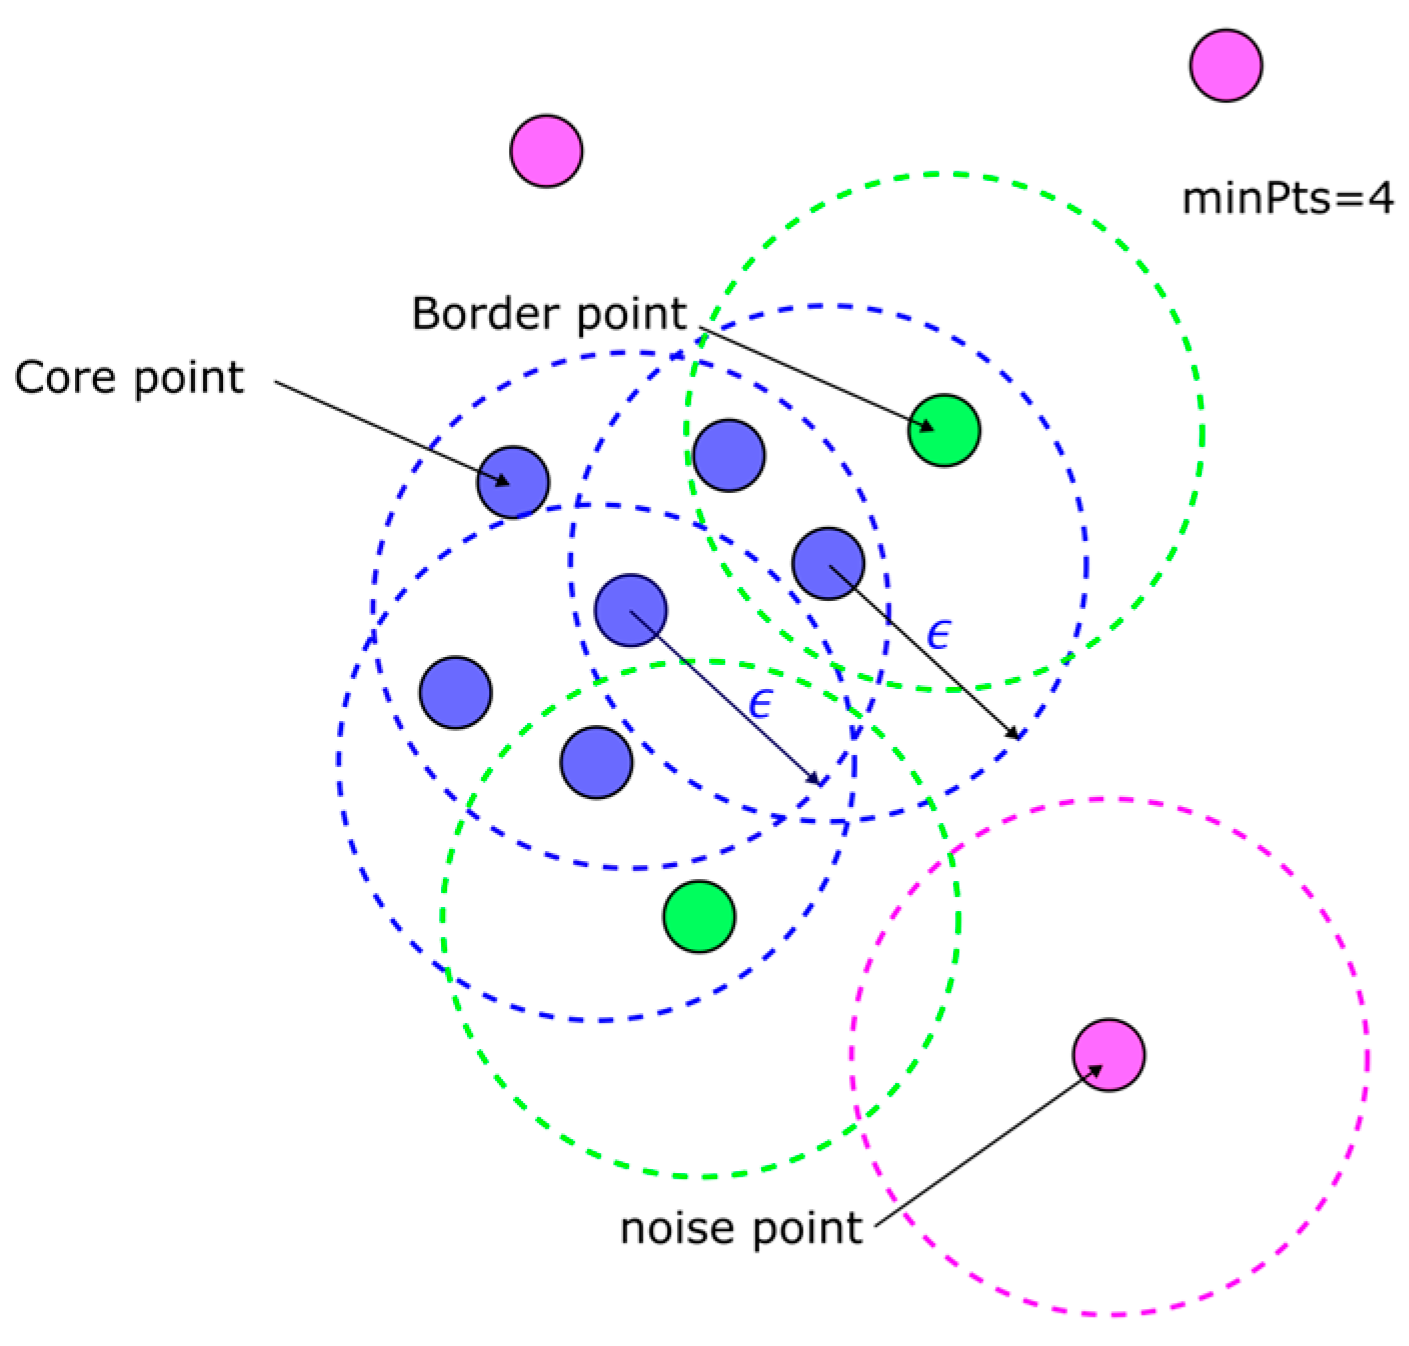
This algorithm defines density as a minimum number of points (minPts) located within a radius (ϵ). The name “core-points” is assigned to points, or data, that meet this density criterion. If they appear within a radius ϵ of a core-point but do not satisfy the minPts condition, they are given the name “border points”. The other points not satisfying any of the two conditions are considered as noise. Figure 12 below illustrates an example of the DBSCAN algorithm on a small set of points, for a radius equal to ϵ.
The algorithm takes values minPts and ϵ as two parameters and arbitrarily picks a point in the data set. It draws a circle of radius ϵ around the chosen point, then labels the data as core points, border points and noise. Once this is completed, all core and border points are grouped into the same cluster.
The algorithm then does the same thing with the remaining unclassified points until no more core and border points are detectable and no more clusters can be identified. In the end, all other noise points are considered outliers.
Although this algorithm is effective and simple to implement, it has the drawback of arbitrarily prioritising certain clusters over others. Indeed, when two core-points do not belong to the same cluster (i.e., their neighbourhoods do not intercept directly or indirectly), but an observation is found in the neighbourhood of these two core-points, the algorithm will assign the observation to the first cluster encountered. This model therefore lacks the idea of a hierarchy between the clusters that would allow a logical choice to be made as to whether the observation in question belongs to one or the other. Alternative algorithms have been proposed to solve these two problems and are described in the section on Hierarchical Clustering.
Another disadvantage of DBSCAN is its incompatibility with high-dimensional data.
In addition, ϵ represents a global density threshold. The algorithm does not recognise the notion of variable densities. In the same way as for the k of K-means, there is a method for determining the best parameter ϵ, based on the use of the K-nearest neighbour algorithm.
DBSCAN was used to detect rolling bearing faults of an IM in [90], combined with the adaptive symmetrized dot pattern method used to analyse the vibration signals.
The DBSCAN algorithm is often used with other classification algorithms like RF, to detect the presence of outliers, making the diagnosis more accurate [91].

Hierarchical Clustering

These algorithms group data by incorporating a notion of ascending or descending hierarchy. The starting point is to consider that all the points in the study are clusters. These clusters are then grouped two by two according to their proximity until a single cluster is obtained.
Proposed by [92] in 2013, hierarchical density-based spatial clustering of applications with noise (HDBSCAN) is an improvement on DBSCAN* [93], which works like DBSCAN but considers that border points are also noise. Unlike DBSCAN, which only works with a global density threshold, it is able to identify clusters with variable density by varying ϵ while respecting the minPts parameter.
Two distances need to be considered when performing HDBSCAN: the so-called “core distance”, which is the distance to the minPts nearest neighbour, and the “Mutual Reachability Distance”, which is the maximum between the core distances between the first and second objects, and the distance between these two objects. The Mutual Reachability Distance has the advantage of separating sparse data and therefore noise.
HDBSCAN is a more intuitive method than DBSCAN, because the only parameter that is given in advance is the minimum number of points in a cluster. DBSCAN requires the variable ϵ to be set, which is not necessarily easy to find unless the user is fairly familiar with the data and the distance delimiting a cluster. Finally, this last algorithm has the advantage of not classifying any points resembling noise, which DBSCAN could potentially have classified.
As seen in this section, the different algorithms cited can be used to detect almost all listed IM faults. The choice of the classification algorithms, and the feature extraction methods, all rely on the operating conditions of the IM and the specifications of the FD algorithm. The advantages and disadvantages of each method are summarized in Table 7 and Table 8 below.

4. Conclusions

This review summarized the general approach of a fault diagnosis system for IMs and provided a detailed description of the different steps and methods that can be used to elaborate one.
The advantages and disadvantages of each method were provided to help choose the appropriate fault extraction technique based on the quality of the measured signal, the operating conditions of the machine and the features that are sought.
However, other factors should be considered when elaborating a fault diagnosis system:
  • The purpose of the algorithm should be known in advance: is the algorithm supposed to detect an anomaly in the behaviour of the machine? Should it find the origin of the fault that has already occurred, or the behaviour that might lead to an eventual defect?
  • Is the algorithm elaborated for online use, when the machine is running, or offline, when it has already been sent into maintenance?
Another important factor that should be considered is the number and quality of the available data. The use of machine learning algorithms imposes the need for large, good-quality data samples. This is necessary to train the models and allows an accurate and effective classification. Having insufficient, noisy data can cause the model to perform well on training data but poorly on unseen data. However, collecting extensive databases can be challenging and time-consuming. This topic is discussed in [94], where the authors propose a new method capable of showing accurate fault diagnosis results on small and noisy datasets.
In the case of the railway sector, the operating conditions would suggest using fault extraction techniques capable of working with inverter-fed IMs, in transient regimes and sometimes under low load. The wavelet transform and the time-frequency domain seem to have strong potential in addressing the challenges of railway applications.
The most promising approach, however, would be a combination of several fault extraction techniques, as using them could help detect several faults and give more accurate results.
It is also important to pay attention to the robustness and reliability the system should provide, especially in the railway sector, where failures may result in harsh consequences and the need to ensure the safety of the passengers is the number one priority.

Author Contributions

Writing—review and editing: all authors; project administration: R.M. and E.L. All authors have read and agreed to the published version of the manuscript.

Funding

This research was funded by ANRT/Cifre-SNCF Voyageurs agreement no. 2023/1166.

Data Availability Statement

Not applicable.

Conflicts of Interest

Authors Razan Issa, Ryan Michaud, Eric Lorca and Christophe Magnette were employed by the company SNCF Voyageurs. The remaining authors declare that the research was conducted in the absence of any commercial or financial relationships that could be construed as a potential conflict of interest. The authors declare that this study received funding from SNCF and ANRT. The funder had the following involvement with the study: Ms. Razan Issa’s thesis is funded by the SNCF Voyageurs and subsidized by the ANRT (public agency).

References

  1. Gubarevych, O.; Duer, S.; Melkonova, I.; Woźniak, M.; Paś, J.; Stawowy, M.; Rokosz, K.; Zajkowski, K.; Bernatowicz, D. Research on and Assessment of the Reliability of Railway Transport Systems with Induction Motors. Energies 2023, 16, 6888. [Google Scholar] [CrossRef]
  2. Puzyr, V.; Datsun, Y.; Obozny, O.; Pyvo, V. Development of a repair technology for locomotive units on the basis of the theory of decision. IOP Conf. Ser. Mater. Sci. Eng. 2019, 664, 012029. [Google Scholar] [CrossRef]
  3. Sardar, M.U.; Vaimann, T.; Kütt, L.; Kallaste, A.; Asad, B.; Akbar, S.; Kudelina, K. Inverter-Fed Motor Drive System: A Systematic Analysis of Condition Monitoring and Practical Diagnostic Techniques. Energies 2023, 16, 5628. [Google Scholar] [CrossRef]
  4. Polater, N.; Tricoli, P. Technical Review of Traction Drive Systems for Light Railways. Energies 2022, 15, 3187. [Google Scholar] [CrossRef]
  5. Puche-Panadero, R.; Martinez-Roman, J.; Sapena-Bano, A.; Burriel-Valencia, J.; Pineda-Sanchez, M.; Perez-Cruz, J.; Riera-Guasp, M. New Method for Spectral Leakage Reduction in the FFT of Stator Currents: Application to the Diagnosis of Bar Breakages in Cage Motors Working at Very Low Slip. IEEE Trans. Instrum. Meas. 2021, 70, 1–11. [Google Scholar] [CrossRef]
  6. Niu, G.; Dong, X.; Chen, Y. Motor Fault Diagnostics Based on Current Signatures: A Review. IEEE Trans. Instrum. Meas. 2023, 72, 1–19. [Google Scholar] [CrossRef]
  7. Liu, Z.; Song, Y.; Gao, S.; Hui, W. Review of Perspectives on Pantograph-Catenary Interaction Research for High-Speed Railways Operating at 400 km/h and Above. IEEE Trans. Transp. Electrif. 2024. [Google Scholar] [CrossRef]
  8. Filippetti, F.; Bellini, A.; Capolino, G.-A. Condition monitoring and diagnosis of rotor faults in induction machines: State of art and future perspectives. In Proceedings of the 2013 IEEE Workshop on Electrical Machines Design, Control and Diagnosis (WEMDCD), Paris, France, 11–12 March 2013; pp. 196–209. [Google Scholar] [CrossRef]
  9. Strangas, E.G.; Clerc, G.; Razik, H.; Soualhi, A. Basic Methods and Tools. In Fault Diagnosis, Prognosis, and Reliability for Electrical Machines and Drives; Wiley-IEEE Press: Hoboken, NJ, USA, 2021; Available online: https://hal.science/hal-03319428 (accessed on 6 March 2024).
  10. Magsi, H.; Sodhro, A.H.; Chachar, F.A.; Abro, S.A.K. Analysis of Signal Noise Reduction by Using Filters. In Proceedings of the 2018 International Conference on Computing, Mathematics and Engineering Technologies (iCoMET), Sukkur, Pakistan, 3–4 March 2018. [Google Scholar] [CrossRef]
  11. Reyes-Malanche, J.A.; Villalobos-Pina, F.J.; Ramırez-Velasco, E.; Cabal-Yepez, E.; Hernandez-Gomez, G.; Lopez-Ramirez, M. Short-Circuit Fault Diagnosis on Induction Motors through Electric Current Phasor Analysis and Fuzzy Logic. Energies 2023, 16, 516. [Google Scholar] [CrossRef]
  12. Misra, S.; Kumar, S.; Sayyad, S.; Bongale, A.; Jadhav, P.; Kotecha, K.; Abraham, A.; Gabralla, L.A. Fault Detection in Induction Motor Using Time Domain and Spectral Imaging-Based Transfer Learning Approach on Vibration Data. Sensors 2022, 22, 8210. [Google Scholar] [CrossRef]
  13. Iglesias-Martínez, M.E.; Antonino-Daviu, J.A.; de Córdoba, P.F.; Conejero, J.A. Rotor Fault Detection in Induction Motors Based on Time-Frequency Analysis Using the Bispectrum and the Autocovariance of Stray Flux Signals. Energies 2019, 12, 597. [Google Scholar] [CrossRef]
  14. Sreejith, B.; Verma, A.K.; Srividya, A. Fault diagnosis of rolling element bearing using time-domain features and neural networks. In Proceedings of the 2008 IEEE Region 10 and the Third international Conference on Industrial and Information Systems, Kharagpur, India, 8–10 December 2008; pp. 1–6. [Google Scholar] [CrossRef]
  15. Chen, L.; Shen, J.; Xu, G.; Chi, C.; Feng, Q.; Zhou, Y.; Deng, Y.; Wen, H. Induction Motor Stator Winding Inter-Tern Short Circuit Fault Detection Based on Start-Up Current Envelope Energy. Sensors 2023, 23, 8581. [Google Scholar] [CrossRef] [PubMed]
  16. Akima, H. A New Method of Interpolation and Smooth Curve Fitting Based on Local Procedures. J. ACM 1970, 17, 589–602. [Google Scholar] [CrossRef]
  17. Messaoudi, M.; Flah, A.; Alotaibi, A.A.; Althobaiti, A.; Sbita, L.; El-Bayeh, C.Z. Diagnosis and Fault Detection of Rotor Bars in Squirrel Cage Induction Motors Using Combined Park’s Vector and Extended Park’s Vector Approaches. Electronics 2022, 11, 380. [Google Scholar] [CrossRef]
  18. ‘Inter-Turn Stator Winding Fault Diagnosis in Three-Phase Induction Motors, by Park’s Vector Approach | IEEE Journals & Magazine | IEEE Xplore’. Available online: https://ieeexplore.ieee.org/abstract/document/790920/authors#authors (accessed on 8 March 2024).
  19. Rajamany, G.; Srinivasan, S.; Rajamany, K.; Natarajan, R.K. Induction Motor Stator Interturn Short Circuit Fault Detection in Accordance with Line Current Sequence Components Using Artificial Neural Network. J. Electr. Comput. Eng. 2019, 2019, e4825787. [Google Scholar] [CrossRef]
  20. Cabanas, M.F.; Norniella, J.G.; Melero, M.G.; Rojas, C.H.; Cano, J.M.; Pedrayes, F.; Orcajo, G.A. Detection of stator winding insulation failures: On-line and off-line tests. In Proceedings of the 2013 IEEE Workshop on Electrical Machines Design, Control and Diagnosis (WEMDCD), Paris, France, 11–12 March 2013; pp. 210–219. [Google Scholar] [CrossRef]
  21. Bouzid, M.B.K.; Champenois, G. New Expressions of Symmetrical Components of the Induction Motor Under Stator Faults. IEEE Trans. Ind. Electron. 2013, 60, 4093–4102. [Google Scholar] [CrossRef]
  22. Supangat, R. On-Line Condition Monitoring and Detection of Stator and Rotor Faults in Induction Motors. Ph.D. Thesis, University of Adelaide, School of Electrical and Electronic Engineering, Adelaide, Australia, 2008. Available online: https://digital.library.adelaide.edu.au/dspace/handle/2440/50741 (accessed on 24 March 2024).
  23. Stack, J.R.; Habetler, T.G.; Harley, R.G. Fault classification and fault signature production for rolling element bearings in electric machines. In Proceedings of the 4th IEEE International Symposium on Diagnostics for Electric Machines, Power Electronics and Drives, 2003; SDEMPED 2003, Atlanta, GA, USA, 24–26 August 2003; pp. 172–176. [Google Scholar] [CrossRef]
  24. Gandhi, A.; Corrigan, T.; Parsa, L. Recent Advances in Modeling and Online Detection of Stator Interturn Faults in Electrical Motors. IEEE Trans. Ind. Electron. 2011, 58, 1564–1575. [Google Scholar] [CrossRef]
  25. Bruzzese, C.; Honorati, O.; Santini, E. Rotor bars breakage in railway traction squirrel cage induction motors and diagnosis by MCSA technique Part I: Accurate fault simulations and spectral analyses. In Proceedings of the 2005 5th IEEE International Symposium on Diagnostics for Electric Machines, Power Electronics and Drives, Vienna, Austria, 7–9 September 2005; pp. 1–6. [Google Scholar] [CrossRef]
  26. Xu, B.; Sun, L.; Xu, L.; Xu, G. Improvement of the Hilbert Method via ESPRIT for Detecting Rotor Fault in Induction Motors at Low Slip. IEEE Trans. Energy Convers. 2013, 28, 225–233. [Google Scholar] [CrossRef]
  27. Romero-Troncoso, R.J.; Garcia-Perez, A.; Morinigo-Sotelo, D.; Duque-Perez, O.; Osornio-Rios, R.A.; Ibarra-Manzano, M.A. Rotor unbalance and broken rotor bar detection in inverter-fed induction motors at start-up and steady-state regimes by high-resolution spectral analysis. Electr. Power Syst. Res. 2016, 133, 142–148. [Google Scholar] [CrossRef]
  28. Bracale, A.; Carpinelli, G.; Piegari, L.; Tricoli, P. A High Resolution Method for On Line Diagnosis of Induction Motors Faults. In Proceedings of the 2007 IEEE Lausanne Power Tech, Lausanne, Switzerland, 1–5 July 2007; pp. 994–998. [Google Scholar] [CrossRef]
  29. Garcia-Calva, T.A.; Morinigo-Sotelo, D.; Garcia-Perez, A.; Camarena-Martinez, D.; de Jesus Romero-Troncoso, R. Demodulation Technique for Broken Rotor Bar Detection in Inverter-Fed Induction Motor Under Non-Stationary Conditions. IEEE Trans. Energy Convers. 2019, 34, 1496–1503. [Google Scholar] [CrossRef]
  30. Puche-Panadero, R.; Martinez-Roman, J.; Sapena-Bano, A.; Burriel-Valencia, J. Diagnosis of Rotor Asymmetries Faults in Induction Machines Using the Rectified Stator Current. IEEE Trans. Energy Convers. 2020, 35, 213–221. [Google Scholar] [CrossRef]
  31. Sakaidani, Y.; Kondo, M. Bearing Fault Detection for Railway Traction Motors through Leakage Current. In Proceedings of the 2018 XIII International Conference on Electrical Machines (ICEM), Alexandroupoli, Greece, 3–6 September 2018; pp. 1768–1774. [Google Scholar] [CrossRef]
  32. Du, Y.; Wang, A.; Wang, S.; He, B.; Meng, G. Fault Diagnosis under Variable Working Conditions Based on STFT and Transfer Deep Residual Network. Shock. Vib. 2020, 2020, e1274380. [Google Scholar] [CrossRef]
  33. Mustafa, D.; Yicheng, Z.; Minjie, G.; Jonas, H.; Jürgen, F. Motor Current Based Misalignment Diagnosis on Linear Axes with Short-Time Fourier Transform (STFT). Proc. CIRP 2022, 106, 239–243. [Google Scholar] [CrossRef]
  34. Aimer, F. Induction motor’s rotor faults diagnosis at variable speed using an STFT-MLA combination. Int. J. Electron. Electr. Eng. Syst. 2018, 1, 1–5. [Google Scholar]
  35. Blodt, M.; Bonacci, D.; Regnier, J.; Chabert, M.; Faucher, J. On-Line Monitoring of Mechanical Faults in Variable-Speed Induction Motor Drives Using the Wigner Distribution. IEEE Trans. Ind. Electron. 2008, 55, 522–533. [Google Scholar] [CrossRef]
  36. Climente-Alarcon, V.; Antonino-Daviu, J.A.; Riera-Guasp, M.; Puche-Panadero, R.; Escobar, L. Application of the Wigner–Ville distribution for the detection of rotor asymmetries and eccentricity through high-order harmonics. Electr. Power Syst. Res. 2012, 91, 28–36. [Google Scholar] [CrossRef]
  37. Trajin, B.; Chabert, M.; Regnier, J.; Faucher, J. Wigner distribution for the diagnosis of high frequency amplitude and phase modulations on stator currents of induction machine. In Proceedings of the 2009 IEEE International Symposium on Diagnostics for Electric Machines, Power Electronics and Drives, Cargese, France, 31 August–3 September 2009; pp. 1–6. [Google Scholar] [CrossRef]
  38. Elbouchikhi, E.; Choqueuse, V.; Amirat, Y.; Benbouzid, M.E.H.; Turri, S. An Efficient Hilbert–Huang Transform-Based Bearing Faults Detection in Induction Machines. IEEE Trans. Energy Convers. 2017, 32, 401–413. [Google Scholar] [CrossRef]
  39. Antonino-Daviu, J.A.; Climente-Alarcón, V.; Pons-Llinares, J.; Pineda-Sánchez, M.; Jover-Rodriguez, P.; Arkkio, A. Application of TFD tools for the tracing of eccentricity-related components in induction machines. In Proceedings of the 2009 35th Annual Conference of IEEE Industrial Electronics, Porto, Portugal, 3–5 November 2009; pp. 1039–1044. [Google Scholar] [CrossRef]
  40. Siddiqui, K.M.; Giri, V.K. Broken rotor bar fault detection in induction motors using Wavelet Transform. In Proceedings of the 2012 International Conference on Computing, Electronics and Electrical Technologies (ICCEET), Nagercoil, India, 21–22 March 2012; pp. 1–6. [Google Scholar] [CrossRef]
  41. Bouzida, A.; Touhami, O.; Ibtiouen, R.; Belouchrani, A.; Fadel, M.; Rezzoug, A. Fault Diagnosis in Industrial Induction Machines Through Discrete Wavelet Transform. IEEE Trans. Ind. Electron. 2011, 58, 4385–4395. [Google Scholar] [CrossRef]
  42. Abid, F.B.; Braham, A. Advanced Signal Processing Techniques for Bearing Fault Detection in Induction Motors. In Proceedings of the 2018 15th International Multi-Conference on Systems, Signals & Devices (SSD), Hammamet, Tunisia, 19–22 March 2018; pp. 882–887. [Google Scholar] [CrossRef]
  43. Zarei, J.; Yousefizadeh, S. Fault detection in induction motors using Park’s vector approach and wavelet analysis. In Proceedings of the 2014 International Conference on Mechatronics and Control (ICMC), Jinzhou, China, 3–5 July 2014; pp. 1064–1068. [Google Scholar] [CrossRef]
  44. Kechida, R.; Menacer, A.; Talhaoui, H.; Cherif, H. Discrete wavelet transform for stator fault detection in induction motors. In Proceedings of the 2015 IEEE 10th International Symposium on Diagnostics for Electrical Machines, Power Electronics and Drives (SDEMPED), Guarda, Portugal, 1–4 September 2015; pp. 104–109. [Google Scholar] [CrossRef]
  45. Dawed, H.; Jaafari, K.; Beig, A. Stator Inter-Turn Short Circuit Fault Diagnosis using Wavelet Scattering Network Feature Extraction. In Proceedings of the 2023 IEEE International Electric Machines & Drives Conference (IEMDC), San Francisco, CA, USA, 15–18 May 2023; p. 6. [Google Scholar] [CrossRef]
  46. Cherif, H.; Menacer, A.; Bessam, B.; Kechida, R. Stator inter turns fault detection using discrete wavelet transform. In Proceedings of the 2015 IEEE 10th International Symposium on Diagnostics for Electrical Machines, Power Electronics and Drives (SDEMPED), Guarda, Portugal, 1–4 September 2015; pp. 138–142. [Google Scholar] [CrossRef]
  47. Maliuk, A.S.; Ahmad, Z.; Kim, J.-M. A Technique for Bearing Fault Diagnosis Using Novel Wavelet Packet Transform-Based Signal Representation and Informative Factor LDA. Machines 2023, 11, 1080. [Google Scholar] [CrossRef]
  48. Hmida, M.A.; Braham, A. Fault Detection of VFD-Fed Induction Motor under Transient Conditions Using Harmonic Wavelet Transform. IEEE Trans. Instrum. Meas. 2020, 69, 8207–8215. [Google Scholar] [CrossRef]
  49. Lee, S.B.; Tallam, R.M.; Habetler, T.G. A robust, on-line turn-fault detection technique for induction machines based on monitoring the sequence component impedance matrix. IEEE Trans. Power Electron. 2003, 18, 865–872. [Google Scholar] [CrossRef]
  50. Zhao, Z.; Fan, F.; Wang, W.; Liu, Y.; See, K.Y. Detection of Stator Interturn Short-Circuit Faults in Inverter-Fed Induction Motors by Online Common-Mode Impedance Monitoring | IEEE Journals & Magazine | IEEE Xplore’. Available online: https://ieeexplore.ieee.org/document/9380558 (accessed on 17 May 2024).
  51. Fan, F.; Zhao, Z.; Jie, H.; Sun, Q.; Tu, P.; Shu, Z.; Wang, W.; See, K.Y. Impact of Motor Stator Winding Faults on Motor Differential-mode Impedance and Mode Transformation. Chin. J. Electr. Eng. 2022, 8, 12–21. [Google Scholar] [CrossRef]
  52. Vinayak, B.A.; Alam, M.F.; Jagadanand, G.; Anand, K.A. Stator Inter Turn fault diagnosis by High-Frequency Modeling of Inverter Fed Induction Motor. In Proceedings of the 2020 IEEE International Conference on Power Electronics, Smart Grid and Renewable Energy (PESGRE2020), Cochin, India, 2–4 January 2020; pp. 1–5. [Google Scholar] [CrossRef]
  53. Gu, B.-G. Offline Interturn Fault Diagnosis Method for Induction Motors by Impedance Analysis. IEEE Trans. Ind. Electron. 2018, 65, 5913–5920. [Google Scholar] [CrossRef]
  54. Ralikalakala, L.; Barendse, P. Impact of Inverter Switching Harmonics in Detecting Changes in Impedance Due to Broken Rotor Bars. In Proceedings of the 2022 IEEE Energy Conversion Congress and Exposition (ECCE), Detroit, MI, USA, 9–13 October 2022; pp. 1–6. [Google Scholar] [CrossRef]
  55. Jie, H.; Gao, S.-P.; Zhao, Z.; Fan, F.; Sasongko, F.; Gupta, A.K.; See, K.Y. VNA-Based Fixture Adapters for Wideband Accurate Impedance Extraction of Single-Phase EMI Filtering Chokes. IEEE Trans. Ind. Electron. 2023, 70, 7821–7831. [Google Scholar] [CrossRef]
  56. Huamin, J.; See, K.Y.; Chang, Y.; Gao, X.-K.; Fan, F.; Zhao, Z. Enhancing motor impedance measurements: Broadening the spectrum from low to high frequencies. Meas. Sci. Technol. 2024, 35, 086008. [Google Scholar] [CrossRef]
  57. Duvvuri; Sarathbabu; Detroja, K. Model-Based Broken Rotor Bars Fault Detection and Diagnosis in Squirrel-Cage Induction Motors. In Proceedings of the 2016 3rd Conference on Control and Fault-Tolerant Systems (SysTol), Barcelona, Spain, 7–9 September 2016; pp. 537–539. [Google Scholar] [CrossRef]
  58. Duvvuri, S.S.S.R.S.; Detroja, K. Model-based stator interturn short-circuit fault detection and diagnosis in induction motors. In Proceedings of the 2015 7th International Conference on Information Technology and Electrical Engineering (ICITEE), Chiang Mai, Thailand, 29–30 October 2015; pp. 167–172. [Google Scholar] [CrossRef]
  59. Trajin, B.; Regnier, J.; Faucher, J. Detection of bearing faults in asynchronous motors using Luenberger speed observer. In Proceedings of the 2008 34th Annual Conference of IEEE Industrial Electronics, Orlando, FL, USA, 10–13 November 2008; pp. 3073–3078. [Google Scholar] [CrossRef]
  60. Zhang, K.; Jiang, B.; Yan, X.-G.; Mao, Z. Incipient Fault Detection for Traction Motors of High-Speed Railways Using an Interval Sliding Mode Observer. IEEE Trans. Intell. Transp. Syst. 2019, 20, 2703–2714. [Google Scholar] [CrossRef]
  61. Cruz, S.M.A.; Stefani, A.; Filippetti, F.; Cardoso, A.J.M. Diagnosis of rotor faults in traction drives for railway applications. In Proceedings of the 2008 18th International Conference on Electrical Machines, Vilamoura, Portugal, 6–9 September 2008; pp. 1–6. [Google Scholar] [CrossRef]
  62. Namdar, A. A robust principal component analysis-based approach for detection of a stator inter-turn fault in induction motors. Prot. Control. Mod. Power Syst. 2022, 7, 48. [Google Scholar] [CrossRef]
  63. Choudhary, A.; Goyal, D.; Letha, S.S. Infrared Thermography-Based Fault Diagnosis of Induction Motor Bearings Using Machine Learning. IEEE Sens. J. 2021, 21, 1727–1734. [Google Scholar] [CrossRef]
  64. Stief, A.; Ottewill, J.R.; Baranowski, J.; Orkisz, M. A PCA and Two-Stage Bayesian Sensor Fusion Approach for Diagnosing Electrical and Mechanical Faults in Induction Motors. IEEE Trans. Ind. Electron. 2019, 66, 9510–9520. [Google Scholar] [CrossRef]
  65. Pramesti, W.; Damayanti, I.; Asfani, D.A. Stator fault identification analysis in induction motor using multinomial logistic regression. In Proceedings of the 2016 International Seminar on Intelligent Technology and Its Applications (ISITIA), Lombok, Indonesia, 28–30 July 2016; pp. 439–442. [Google Scholar] [CrossRef]
  66. Gonzalez-Jimenez, D.; del-Olmo, J.; Poza, J.; Garramiola, F.; Sarasola, I. Machine Learning-Based Fault Detection and Diagnosis of Faulty Power Connections of Induction Machines. Energies 2021, 14, 4886. [Google Scholar] [CrossRef]
  67. Samanta, S.; Bera, J.N.; Sarkar, G. KNN based fault diagnosis system for induction motor. In Proceedings of the 2016 2nd International Conference on Control, Instrumentation, Energy & Communication (CIEC), Kolkata, India, 28–30 January 2016; pp. 304–308. [Google Scholar] [CrossRef]
  68. Ali, M.Z.; Shabbir, M.N.S.K.; Liang, X.; Zhang, Y.; Hu, T. Machine Learning-Based Fault Diagnosis for Single- and Multi-Faults in Induction Motors Using Measured Stator Currents and Vibration Signals. IEEE Trans. Ind. Appl. 2019, 55, 2378–2391. [Google Scholar] [CrossRef]
  69. Surti, K.V.; Naik, C.A. Bearing Condition Monitoring of Induction Motor Based on Discrete Wavelet Transform & K-nearest Neighbor. In Proceedings of the 2018 3rd International Conference for Convergence in Technology (I2CT), Pune, India, 6–8 April 2018; pp. 1–5. [Google Scholar] [CrossRef]
  70. Hamdani, S.; Mezerreg, H.; Boutikar, B.; Lahcene, N.; Touhami, O.; Ibtiouen, R. Rotor fault diagnosis in a Squirrel-Cage Induction Machine using support vector. In Proceedings of the 2012 XXth International Conference on Electrical Machines, Marseille, France, 2–5 September 2012; pp. 1817–1822. [Google Scholar] [CrossRef]
  71. Aydin, I.; Karakose, M.; Akin, E. Artificial Immune Based Support Vector Machine Algorithm for Fault Diagnosis of Induction Motors. In Proceedings of the 2007 International Aegean Conference on Electrical Machines and Power Electronics, Bodrum, Turkey, 10–12 September 2007; pp. 217–221. [Google Scholar] [CrossRef]
  72. Gunasekaran, S.; Pandarakone, S.E.; Asano, K.; Mizuno, Y.; Nakamura, H. Condition Monitoring and Diagnosis of Outer Raceway Bearing Fault using Support Vector Machine. In Proceedings of the 2018 Condition Monitoring and Diagnosis (CMD), Perth, WA, Australia, 23–26 September 2018; pp. 1–6. [Google Scholar] [CrossRef]
  73. Abid, F.B.; Zgarni, S.; Braham, A. Bearing fault detection of induction motor using SWPT and DAG support vector machines. In Proceedings of the IECON 2016—42nd Annual Conference of the IEEE Industrial Electronics Society, Florence, Italy, 23–26 October 2016; pp. 1476–1481. [Google Scholar] [CrossRef]
  74. Yagami, Y.; Araki, C.; Mizuno, Y.; Nakamura, H. Turn-to-turn insulation failure diagnosis of stator winding of low voltage induction motor with the aid of support vector machine. IEEE Trans. Dielectr. Electr. Insul. 2015, 22, 3099–3106. [Google Scholar] [CrossRef]
  75. Lazar, A.E.N.; Bendali, A.; Ferdjouni, A. ANN-approach for ITSC Fault Diagnosis of Induction Motor. In Proceedings of the 2021 IEEE Workshop on Electrical Machines Design, Control and Diagnosis (WEMDCD), Modena, Italy, 8–9 April 2021; pp. 231–236. [Google Scholar] [CrossRef]
  76. Mohamed, M.; Mohamed, E.; Mohamed, A.-A.; Abdel-Nasser, M.; Hassan, M.M. Detection of Inter Turn Short Circuit Faults in Induction Motor using Artificial Neural Network. In Proceedings of the 2020 26th Conference of Open Innovations Association (FRUCT), Yaroslavl, Russia, 20–24 April 2020; pp. 297–304. [Google Scholar] [CrossRef]
  77. Sameh, M.; Tarek, A.; Yassine, K. Bearing and Rotor Faults detection and diagnosis of Induction Motors using Statistical Neural Networks. In Proceedings of the 2020 20th International Conference on Sciences and Techniques of Automatic Control and Computer Engineering (STA), Monastir, Tunisia, 20–22 December 2020; pp. 77–81. [Google Scholar] [CrossRef]
  78. Pandarakone, S.E.; Masuko, M.; Mizuno, Y.; Nakamura, H. Deep Neural Network Based Bearing Fault Diagnosis of Induction Motor Using Fast Fourier Transform Analysis. In Proceedings of the 2018 IEEE Energy Conversion Congress and Exposition (ECCE), Portland, OR, USA, 23–27 September 2018; pp. 3214–3221. [Google Scholar] [CrossRef]
  79. Afrasiabi, S.; Afrasiabi, M.; Parang, B.; Mohammadi, M. Real-Time Bearing Fault Diagnosis of Induction Motors with Accelerated Deep Learning Approach. In Proceedings of the 2019 10th International Power Electronics, Drive Systems and Technologies Conference (PEDSTC), Shiraz, Iran, 12–14 February 2019; pp. 155–159. [Google Scholar] [CrossRef]
  80. Jiménez-Guarneros, M.; Morales-Perez, C.; de Rangel-Magdaleno, J.J. Diagnostic of Combined Mechanical and Electrical Faults in ASD-Powered Induction Motor Using MODWT and a Lightweight 1-D CNN. IEEE Trans. Ind. Inform. 2022, 18, 4688–4697. [Google Scholar] [CrossRef]
  81. Chen, X.; Yang, Z.; Lou, W. Fault Diagnosis of Rolling Bearing Based on the Permutation Entropy of VMD and Decision Tree. In Proceedings of the 2019 3rd International Conference on Electronic Information Technology and Computer Engineering (EITCE), Xiamen, China, 18–20 October 2019; pp. 1911–1915. [Google Scholar] [CrossRef]
  82. Mao, J.; Chen, F.; Jiang, B.; Wang, L. Composite Fault Diagnosis of Rotor Broken Bar and Air Gap Eccentricity Based on Park Vector Module and Decision Tree Algorithm. In Proceedings of the 2019 CAA Symposium on Fault Detection, Supervision and Safety for Technical Processes (SAFEPROCESS), Xiamen, China, 5–7 July 2019; pp. 701–706. [Google Scholar] [CrossRef]
  83. Tran, M.-Q.; Elsisi, M.; Mahmoud, K.; Liu, M.-K.; Lehtonen, M.; Darwish, M.M.F. Experimental Setup for Online Fault Diagnosis of Induction Machines via Promising IoT and Machine Learning: Towards Industry 4.0 Empowerment. IEEE Access 2021, 9, 115429–115441. [Google Scholar] [CrossRef]
  84. Roy, S.S.; Dey, S.; Chatterjee, S. Autocorrelation Aided Random Forest Classifier-Based Bearing Fault Detection Framework. IEEE Sens. J. 2020, 20, 10792–10800. [Google Scholar] [CrossRef]
  85. Tastimur, C.; Karakose, M.; Aydin, I.; Akin, E. A New Bearing Fault Diagnosis Method using Envelope based Feature Extraction. In Proceedings of the 2021 Innovations in Intelligent Systems and Applications Conference (ASYU), Elazig, Turkey, 6–8 October 2021; pp. 1–6. [Google Scholar] [CrossRef]
  86. Lo, N.G.; Soualhi, A.; Frinì, M.; Razik, H. Gear and bearings fault detection using motor current signature analysis. In Proceedings of the 2018 13th IEEE Conference on Industrial Electronics and Applications (ICIEA), Wuhan, China, 31 May–2 June 2018; pp. 900–905. [Google Scholar] [CrossRef]
  87. Ouachtouk, I.; El Hani, S.; Guedira, S.; Dahi, K. Detection and classification of broken rotor bars faults in induction machine using K-means classifier. In Proceedings of the 2016 International Conference on Electrical and Information Technologies (ICEIT), Tangiers, Morocco, 4–7 May 2016; pp. 180–185. [Google Scholar] [CrossRef]
  88. Soualhi, A.; Clerc, G.; Razik, H.; Ondel, O. Detection of induction motor faults by an improved artificial ant clustering. In Proceedings of the IECON 2011—37th Annual Conference of the IEEE Industrial Electronics Society, Melbourne, VIC, Australia, 7–10 November 2011; pp. 3446–3451. [Google Scholar] [CrossRef]
  89. Nagaraju, S.; Manish, K.; Bhattacharya, M. An Effective Density Based Approach to Detect Complex Data Clusters Using Notion of Neighborhood. Int. J. Autom. Comput. 2017, 14, 57–67. [Google Scholar] [CrossRef]
  90. Li, H.; Wang, W.; Huang, P.; Li, Q. Fault diagnosis of rolling bearing using symmetrized dot pattern and density-based clustering. Measurement 2020, 152, 107293. [Google Scholar] [CrossRef]
  91. Fernandes, M.; Corchado, J.M.; Marreiros, G. Machine learning techniques applied to mechanical fault diagnosis and fault prognosis in the context of real industrial manufacturing use-cases: A systematic literature review. Appl. Intell. 2022, 52, 14246–14280. [Google Scholar] [CrossRef]
  92. Campello, R.J.G.B.; Moulavi, D.; Sander, J. Density-Based Clustering Based on Hierarchical Density Estimates. In Advances in Knowledge Discovery and Data Mining; Pei, J., Tseng, V.S., Cao, L., Motoda, H., Xu, G., Eds.; Springer: Berlin/Heidelberg, Germany, 2013; pp. 160–172. [Google Scholar] [CrossRef]
  93. Malzer, C.; Baum, M. A Hybrid Approach to Hierarchical Density-based Cluster Selection. In Proceedings of the 2020 IEEE International Conference on Multisensor Fusion and Integration for Intelligent Systems (MFI), Karlsruhe, Germany, 14–16 September 2020; pp. 223–228. [Google Scholar] [CrossRef]
  94. Wang, C.; Yang, J.; Zhang, B. A fault diagnosis method using improved prototypical network and weighting similarity-Manhattan distance with insufficient noisy data. Measurement 2024, 226, 114171. [Google Scholar] [CrossRef]
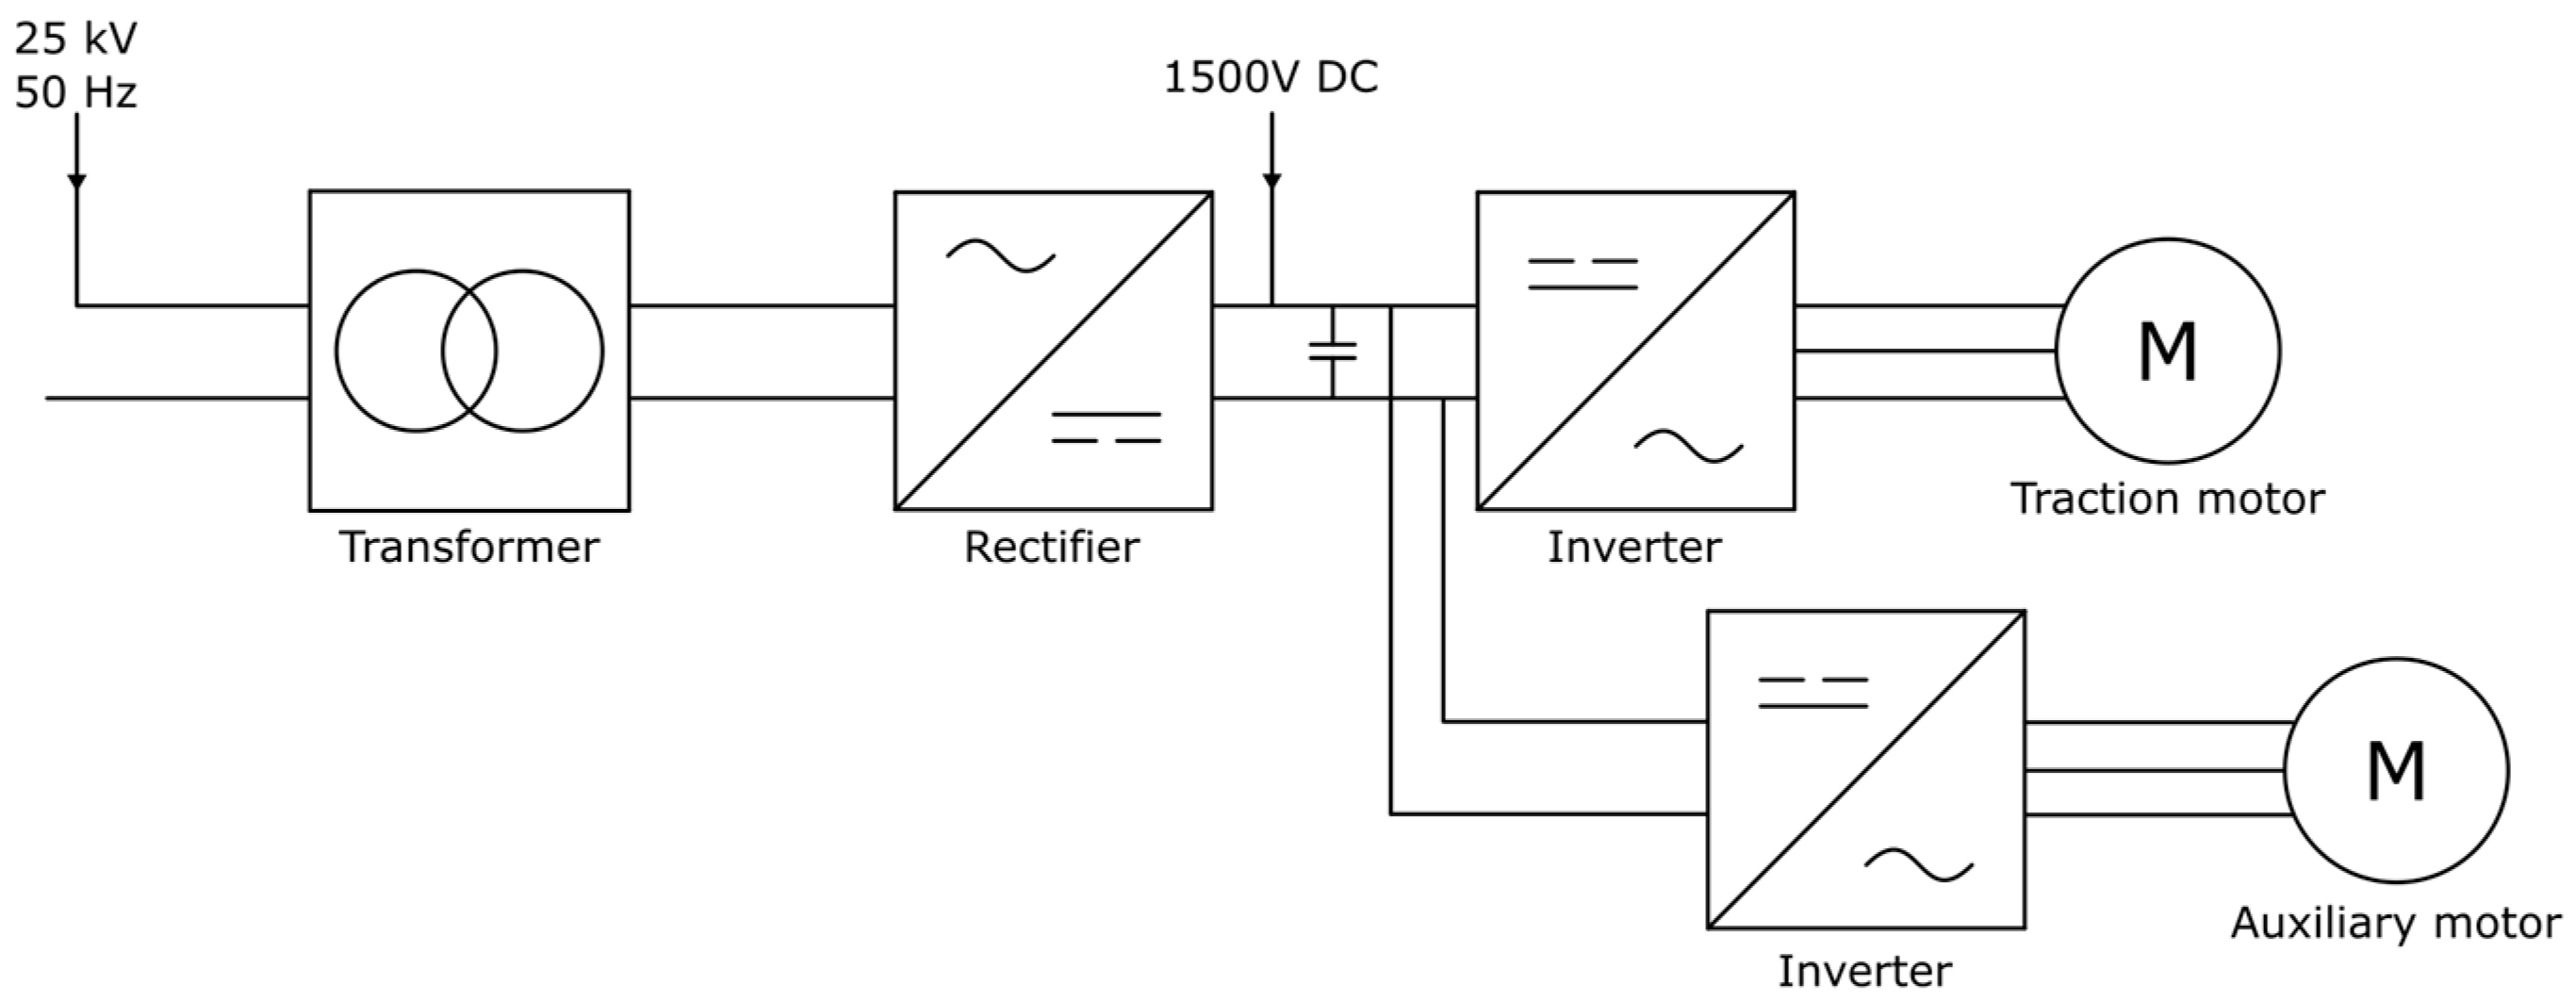
Figure 1. Examples a railway traction system with inverter technologies [4].
Energies 17 02728 g001
Figure 2. Representation of different short circuits found in the stator of an IM.
Energies 17 02728 g002
Figure 3. Examples of stator faults on electrical machines.
Energies 17 02728 g003
Figure 4. Lifted BRB on a traction IM.
Energies 17 02728 g004
Figure 5. Representation of static and dynamic eccentricity faults.
Energies 17 02728 g005
Figure 6. Representation of parallel and angular misalignment faults between the motor and load shafts.
Energies 17 02728 g006
Figure 7. (a) Picture of a bearing and (b) representation of the different bearing elements.
Energies 17 02728 g007
Figure 8. Pictures of different bearing faults: (a) in the rolling element, (b) in the outer raceway and (c) in the inner raceway.
Energies 17 02728 g008
Figure 9. Block diagram of an observer.
Energies 17 02728 g009
Figure 10. General structure of an ANN.
Energies 17 02728 g010
Figure 11. Structure of a decision tree.
Energies 17 02728 g011
Figure 12. Representation of the DBSCAN core, border, and noise points.
Energies 17 02728 g012
Table 1. Table summarizing the different faults an induction machine is subject to.
Induction motor faultsStator faultsInsulation defects
Open circuit faults
Short-circuit faults
Rotor faultsBroken rotor bar faults
Eccentricity faults
Misalignment faults
Bearing faultsIn the rolling element
In the inner raceway
In the outer raceway
In the cage
Other faultsFaults in the ventilation system
Faults in the power supply
Faults in the gears
Table 2. Time domain indicators and their corresponding equations.
Time Domain IndicatorEquations
Mean x ¯ = 1 N i = 1 N x ( i )
RMS x R M S = 1 N i = 1 N x i 2
Standard deviation σ = i = 1 N   x i x ¯ 2
Variance σ 2 = i = 1 N   x i x ¯ 2 N
Max m a x ( x )
Min min x
Kurtosis 1 N i = 1 N   x i x ¯ 4 1 N i = 1 N   x i x ¯ 2 2
Skewness 1 N i = 1 N   x i x ¯ 3 σ 3
Table 3. Table summarizing different time domain methods, the signals they are applied to and the detected fault.
SignalTime-Domain MethodDetected FaultReferences
Line currentsArithmetic differences using RMS valuesStator short circuits[11]
Mechanical vibrationsMean + σ + RMS + Peak to peak + Skewness + KurtosisBRBs[12]
Stray fluxIndicator based on the autocovariance functionBRBs[13]
Mechanical vibrationsKurtosis + negative log-likelihood valueRolling element in the bearings[14]
Start-up currentAkima interpolationInter-turn short circuit[15]
Three-phase currentsExtended Park’s vector approachBRBs[17]
Stator currentPark’s vector approachInter-turn short circuit[18]
Line currentSymmetrical components analysisInter-turn short circuit[19]
Line currentSymmetrical components analysisInter-turn short circuit, phase-to-phase, and single-phase-to-ground faults[21]
Table 4. Characteristic frequencies of different IM faults.
Detected FaultSignalCharacteristic Frequency
Stator faultsStator current and axial leakage flux f s t a t 1 = f s [ k 1 s p ± v ] f s : supply frequency
v : order of the stator time harmonics
p : number of pole pairs
s : slip
k : an integer
Motor vibrations f s t a t 2 = 2 f s
BRBStator current and axial leakage flux f B R B = 1 ± 2 s f s
Static eccentricityStator current and axial leakage flux f s e 1 = k R 1 s p ± v   f s
f s e 2 = f s ± f r
R : number of rotor bars
Dynamic eccentricityStator current and axial leakage flux f d e 1 = ( k R ± n d ) 1 s p ± v   f s n d : 1, 2, 3 …
Motor vibrations f d e 2 = f s ± f r
Bearing fault: rolling elementMotor vibrations f r e = f s 2 N B [ 1 D B c o s Θ D p 2 ] N B : number of rolling elements
D B : diameter of the rolling element
D p : average diameter of the bearing
Θ : contact angle
Bearing fault: cageMotor vibrations f c a g e = f s 2 [ 1 D B c o s Θ D p ]
Bearing fault: inner racewayMotor vibrations f i n n e r = f s 2 N B [ 1 + D B c o s Θ D p ]
Bearing fault: outer racewayMotor vibrations f o u t e r = f s 2 N B [ 1 D B c o s Θ D p ]
Table 5. Table summarizing different time-frequency domain methods, the signals they are applied to and the detected fault.
SignalTF MethodDetected FaultReferences
VibrationSTFTBRBs[12]
VibrationSTFTBearing faults[32]
Stator currentSTFTAxial misalignment[33]
Stator currentsSTFT + MLABRBs[34]
Stator currentWVDMechanical load faults[35]
Stator currentWVDEccentricity[36]
Stator currentsWVD + Concordia + HHTEccentricity[37]
Stator currentsHHTBearing faults in the rolling element[38]
Stator currentWVDMixed eccentricity[39]
Table 6. Table summarizing different wavelet-based methods, the signals they are applied to and the detected fault.
SignalWT MethodDetected FaultReferences
Stator currentWTBRB, broken end-rings, loss of a stator phase[40,41]
Stator currentsWTBearing faults[42]
Stator currentsPark vector approach + WTBearing faults[43]
Stator currentsWTStator inter-turn faults[44,45,46]
Stator currentWPTBearing faults[47]
Stator currentMWHWPTBRB[48]
Table 7. Summary of fault extraction methods and their advantages and disadvantages.
Signature Extraction MethodAdvantagesDisadvantages
Time domainEasy to implement, can be used in transient regimes.Can be hard to identify the type of fault.
Information in frequency domain is lost.
Frequency domainCharacteristic frequencies are mostly known in advance.Low resolution in transient regime, some frequency components are hard to detect with low slip.
Information in time domain is lost.
Time-frequency domainCapable of providing information in both time and frequency domains.
Can be used with non-steady state signals.
Some TF methods can show limited time and frequency resolutions or generate cross terms.
Wavelet transformCan be used with transient, non-periodic features.Shift sensitivity, lack of phase information and poor directionality.
Model-basedAllows a physical representation of the model. Model must be knowledge-based.
By approximating the behaviour of the system, some information may be lost.
Table 8. Summary of classification algorithms and their advantages and disadvantages.
Classification MethodAdvantagesDisadvantages
Logistic RegressionEasy to understand and train.Needs a big dataset.
Considers a linear relationship between variables.
K-Nearest NeighbourSimple to implement and understand.
Low calculation time.
Needs high memory as it stores all training data.
Sensitive to outliers.
Support Vector MachinesSuitable with high-dimensional data.
Works well with small datasets.
Robust to noise.
Not intuitive, difficult to interpret.
Sensitive to the choice of the kernel function.
Neural NetworksCan handle complex data.
Suitable with high-dimensional data.
Difficult to interpret due to its black box nature.
Sensitive to pre-processing.
Decision TreesIntuitive and easy to understand.
Nonparametric method.
Prone to overfitting.
The structure of the DT can change drastically if the training data are modified.
Random ForestReduces overfitting seen in decision trees.
Highly accurate.
High computational complexity.
Sensitive to noise.
K-meansSimple to implement and understand.
Low complexity.
Sensitive to outliers.
Number of clusters must be given in advance.
DBSCANRobust to noise and outliers.Sensitive to the choice of its parameters.
HDBSCANCan compute varying density clusters.
Visualization is possible through dendrograms.
Cubic time complexity.
Disclaimer/Publisher’s Note: The statements, opinions and data contained in all publications are solely those of the individual author(s) and contributor(s) and not of MDPI and/or the editor(s). MDPI and/or the editor(s) disclaim responsibility for any injury to people or property resulting from any ideas, methods, instructions or products referred to in the content.