Article

Research on Virtual Energy Storage Scheduling Strategy for Air Conditioning Based on Adaptive Thermal Comfort Model

1
Economic and Technological Research Institute, State Grid Shanghai Electric Power Company, Shanghai 200233, China
2
School of Electrical and Power Engineering, Hohai University, Nanjing 211100, China
*
Author to whom correspondence should be addressed.
Energies 2024, 17(11), 2670; https://doi.org/10.3390/en17112670
Submission received: 1 March 2024 / Revised: 25 May 2024 / Accepted: 28 May 2024 / Published: 30 May 2024
(This article belongs to the Section A1: Smart Grids and Microgrids)

Abstract

:
With the rapid development of a social economy, the yearly increase in air conditioning load in the winter and summer seasons may bring serious challenges to the safe and economic operation of the power grid during the peak period of electricity consumption. So, how we reasonably adjust the set temperature of air conditioning so as to cut down the load during peak periods is very important. In this paper, considering the thermal inertia of air-conditioned buildings and the adaptability of human thermal comfort to temperature changes, the air conditioning load is regarded as virtual energy storage, the air conditioning temperature adjustment range for different users is determined based on the adaptive thermal comfort model of different geographic locations and climatic conditions, and a compensation mechanism is set up based on air conditioning users’ level of participation. Then, an optimal scheduling strategy for a microgrid was constructed with the objectives of user satisfaction, carbon emissions, and microgrid operation benefits, as well as regulating the users’ electricity consumption behavior, and the strategy was solved by using a multi-objective JAYA algorithm. Finally, winter and summer are used as case studies to analyze the results, which demonstrate that regulating the virtual energy storage of air conditioning can effectively improve the economy and environmental friendliness of a microgrid operation and reduce the cost of electricity consumption for the users, taking into account the comfort of the users.

1. Introduction

In the new power system, a large amount of renewable energy is gradually replacing conventional units, leading to a continuous increase in the scarcity of system regulation resources. In addition, due to the frequent occurrence of extremely cold and hot weather, the load peak-valley difference is constantly expanding, showing a “double-peak” characteristic in winter and summer.
In 2021, the peak capacity of China’s power system was insufficient, and power system tight balancing and orderly power consumption occurred in many places. In 2022, combined with extreme weather conditions, a total of 21 provincial-level power grids in China had record high power consumption loads, and the scope of orderly power consumption has been further expanded. At present, the proportion of air conditioning and cooling loads in the electricity consumption load during the summer peak period in many provinces has exceeded 40%, and the proportion in some cities with power shortage has even exceeded 50% [1], and it is still continuing to increase. In the United States and Europe, heating, ventilation, and air conditioning systems account for more than half of building energy consumption, equivalent to over 20% of global energy consumption [2,3,4]. While this poses a serious challenge to the safe and economic operation of the power grid, it also shows that air conditioning loads have a huge potential for demand-side response [5].
On 15 September 2023, the National Development and Reform Commission and other departments in China issued the “Measures for Electricity Demand Side Management (2023 Edition)”, which proposed to encourage the promotion of renewable energy, electric vehicles, air conditioning loads and other entities to participate in demand response. In addition, the document requires that by 2025, the demand response capacity of each province should reach 3–5% of the maximum electricity load, of which provinces with annual peak-to-valley differentials of more than 40% of the maximum electricity load need to reach 5% or more. Therefore, the in-depth exploration of the regulation potential of temperature-controlled load resources contributes to the balance of power supply and demand and security of the new type of power system during the peak period of power consumption. At the same time, the flexible utilization of temperature-controlled loads can also help promote China’s low-carbon energy transition.
To fully exploit the air conditioning load scheduling margins and effectively implement demand-side response control strategies, modeling is fundamental [6]. Air conditioning load modeling was initially mainly used to predict or analyze the relationship with temperature, so various types of data decomposition and prediction algorithms were often used [7]. Later, in order to meet the needs of power system operation and regulation, physical models, probabilistic models, cluster division, control models, regulation strategies, and other research hotspots were developed.
The physical model of the air conditioning system mainly establishes the inherent relationship between indoor and outdoor temperature and cooling/heating power, which provides the basic basis for formulating demand response strategies for air conditioning loads. Establishing an air conditioning load model that meets the requirements of power system dispatch operation in terms of accuracy and speed plays an important role in its large-scale participation in demand response [8]. In addition, the differentiated needs of different users should also be considered in the regulation process, so as to maximize the air conditioning load regulation potential corresponding to various types of users.
Obviously, the key to combining user thermal comfort with air conditioning load regulation models lies in the determination of corresponding regulation temperature [9]. According to scholarly research, the temperature regulation characteristics within the human comfort level range in a building is equivalent to the virtual energy storage characteristics [10] and is more applicable to the capacity assessment and effective implementation of the power system demand response. In addition, regarding the consideration of virtual energy storage, there also exist studies considering virtual energy storage characteristics of electric water heaters [11] and heat network pipes [12] in temperature-controlled loads. In this paper, we focus on air-conditioned building virtual energy storage characteristics considering the thermal comfort of users.
The research on incorporating the characteristics of air conditioning building thermal storage into power grid optimization scheduling mainly focuses on the analysis of user demand response models [13,14,15], applications for different scenarios [16,17,18,19], and virtual energy storage modeling [3,15,16,17,18]. Among them, this paper focuses on virtual energy storage modeling and regulation strategies for air conditioning loads. Regarding this aspect of the research, ref. [6] starts from the characteristics of air conditioning equipment and focuses on considering the operating status of the air conditioning. Ref. [20] starts from the cold and heat storage characteristics of a building and proposes a virtual energy storage model based on the building material and structure. On the basis of the above studies, refs. [21,22,23] take the building, equipment, and users into consideration at the same time, taking into account environmental factors, thermal comfort boundaries, and air conditioning operation status, and analyzes different virtual energy storage control strategies. However, the above studies consider the human thermal comfort in a single way, and do not take into account the individual user, seasonal climate, or geographic differences in the determination of the optimal temperature for the human body. Although ref. [10] calculated the thermal comfort range of different types of users using the PMV model, the model inevitably has errors in prediction.
Due to the cold and heat storage properties of buildings and indoor air, there is a lag phenomenon in indoor temperature changes. In addition, due to the different degree of sensitivity of the human body to temperature changes, when the set temperature of the air conditioning changes, the differentiated needs of users will lead to differences in the actual adjustable capacity of the air conditioning load. In previous studies, the adjustment range of air conditioning temperature was often directly set by the researcher, and therefore differs greatly from the actual choice of the user, which will lead to the difficulty of implementing the regulation scheme or a significant difference between the experimental simulation effect and the actual results.
In summary, based on the above research, this paper proposes a comprehensive user satisfaction index including user electricity cost, the degree of change in the set temperature, and the degree of temperature appropriateness, and considers these together with the microgrid carbon emission and operation economy, so as to construct a scheduling strategy taking into account the virtual energy storage characteristics of air conditioning loads. The structure of the remaining parts of the paper is as follows:
First, this paper builds an air-conditioned building virtual energy storage model in Section 2. Among them, Section 2.1 classifies the response willingness and response ability of users based on different intervals of thermal sensory polling values and constructs a differentiated compensation price; Section 2.2 and Section 2.3 construct an air conditioning virtual energy storage model based on a typical air-conditioned building equivalent thermal parameter system and determines the virtual capacity, state of virtual charge, and other virtual energy storage indexes. Secondly, this paper establishes an optimal scheduling strategy for microgrid systems considering virtual energy storage characteristics in Section 3; Section 3.1 introduces the microgrid structure, and Section 3.2 constructs an optimization strategy for power consumption regulation within the acceptable temperature variation range of users with three factors of user satisfaction, carbon emission, and the optimization of the microgrid operation revenue economy as an objective function, and chooses the scheme in compromise under the joint consideration of multiple objectives. Then, the strategy is solved by the multi-objective JAYA algorithm (MOJAYA) introduced in Section 4 of this paper. In Section 5, the effectiveness and economy of the optimal scheduling strategy proposed in this paper are verified based on the solution results by taking the summer cooling scenario and the winter heating scenario of a community as an example. Finally, in Section 6, the research of this paper is summarized and outlooked.
The innovations in this manuscript are:
  • This paper proposes an air conditioning regulation scheme based on user adaptive thermal comfort, taking into account different seasons and different regions that can accurately assess the user’s regulation choices;
  • This paper sets up a demand response compensation mechanism that takes into account the adjustable capacity and response power of air conditioning users, which can fully incentivize users to actively participate in the capacity reserve and power response of the grid.

2. Air-Conditioned Building Virtual Energy Storage Model

2.1. Human Comfort Range

For the changes in indoor heating and cooling temperatures, the human acceptable temperature interval is represented by fitting a linear regression between the thermal sensation vote (TSV) and the indoor temperature, but the relationship between the average TSV and the thermal environment satisfaction is different under different conditions, and it is difficult for this method to predict the percentage of thermal environment satisfaction. Therefore, Ref. [24] proposes a logistic regression-based method for determining the comfort temperature interval, and experimentally verifies that the logistic regression model has a better prediction effect than the linear regression mode.
The evaluation of thermal environment satisfaction is based on the TSV index and the ASHRAE55-2023 standard [25]. In this paper, the ASHRAE seven-point thermal sensation scale is used, based on which it is assumed that TSV < −1.5 is cold discomfort, −1.5 ≤ TSV ≤ 1.5 is acceptable, and TSV > 1.5 is heat discomfort. After selecting the parameters such as climate zone, season, and building type, the following set of equations can be obtained based on the actual evaluation data and the corresponding temperature through the unordered multi-categorical logistic regression method:
P 1 + Y + P 2 = 100 % ln P 1 Y = a 1 + b 1 SET ln P 2 Y = a 2 + b 2 SET
where, P1, Y, and P2, respectively, represent the cold dissatisfaction rate, satisfaction rate, and hot dissatisfaction rate, SET is the standard effective temperature, A1, a2, b1, and b2 are parameters calculated through logistic regression. The equation for the function of satisfaction rate Y as a function of SET for specific conditions is obtained by association as follows:
Y = 1 1 + e a 1 + b 1 SET + e a 2 + b 2 SET
In order to fully utilize the virtual energy storage potential of the user side, this paper makes a classification of the response willingness and response ability of the air conditioning users based on the above model and sets the temperature with the highest satisfaction as the optimal body temperature.
(1)
Users who do not accept centralized temperature regulation, i.e., choose the temperature to be maintained at an optimal body temperature. This category of air conditioning users basically does not have the ability to respond to demand.
(2)
Users who can accept temperature regulation in a small range, i.e., the range of regulation temperature corresponds to the temperature range that achieves 90% satisfaction. This category of air conditioning users has a partial demand response capability.
(3)
Users who can accept temperature regulation in a wide range, i.e., the range of regulation temperature corresponds to the temperature range that achieves 80% satisfaction. This category of air conditioning users has the highest demand response capability.
After categorizing users’ willingness and ability to respond, this paper establishes a price compensation mechanism in terms of the regulation range chosen by users and the actual load reduction after regulation [26,27,28].
β 1 i ( t ) = P ac - max i ( t ) i = 1 M ac P ac - max i ( t ) β 2 i ( t ) = P ac - actual i ( t ) i = 1 M ac P ac - actual i ( t )
where, β 1 i ( t ) is the regulation potential coefficient for group i air conditioning users, P ac - max i ( t ) is the maximum adjustable capacity for group i air conditioning users, β 2 i ( t ) is the actual load regulation coefficient for group i air conditioning users, and P ac - actual i ( t ) is the actual load reduction for group i air conditioning users.
C e i ( t ) = α 1 β 1 i ( t ) + α 2 β 1 i ( t ) ) C b
where, C e i ( t ) is the compensation price for group i air conditioning users, C b is the basic compensation price given by the power grid, and α 1 ,   α 2 is the consideration weight of two factors and their values should satisfy the following conditions:
α 1 + α 2 = 1 0 α 1 1 0 α 2 1

2.2. Virtual Energy Storage Model for Air Conditioning Building Systems

The building thermal performance can be modeled using a first-order equivalent thermal parameter model to simulate the process. The first-order equivalent thermal parameters (ETP) model [13], which is commonly used for air-conditioning building systems, has differential equations expressed as follows [18]:
d T r t d t = Q ac t S C + T out t T r t R S C
The left side of the equation represents the indoor temperature change value during the differential period, and T r t is the current room temperature at that time, °C. On the right side of the equation is the heating/cooling capacity of the air conditioning in that time period under the influence of building heat dissipation, and the building heat dissipation, taking into account the influence of outdoor temperature, T out t is the current outdoor temperature, °C; Q ac t is the cooling (heating) capacity for air conditioning, kW; R is the equivalent thermal resistance of the building, °C/kW; S is the considered building area, m2; and C is the equivalent heat capacity of the building, kJ/(°C·m2).
The relationship between the electrical power and cooling capacity of air conditioning equipment is as follows:
P ac t = Q ac t η
where, η is the thermoelectric conversion coefficient, and P ac t is the corresponding air conditioning power, kW.
In this paper, air conditioning is considered to be divided into steady state and dynamic state. When the air conditioning is in a steady state, i.e., when the indoor temperature is equal to the set temperature, and the cooling/heating capacity is equal to the heat transfer Q s ( t ) between the building and the outdoors, its electrical power P ac - s ( t ) is calculated as follows:
P ac - s ( t ) = Q s ( t ) η = T out ( t ) T r ( t ) η R
where, Q s ( t ) is the building heat transfer power, kW.
Take summer as an example, when the air conditioning is dynamic, if the set temperature is higher than the indoor temperature, the air conditioning will stop cooling and the electric power will be 0. When the set temperature is lower than the indoor temperature, the air conditioning will start cooling with the rated electric power; its power P a c - a ( t ) is calculated by Equation (9):
P a c - a ( t ) = 0 , T s e t ( t ) > T r ( t 1 ) P n , T s e t ( t ) < T r ( t 1 )
The power of the air conditioning load in each time interval is the sum of the electric power of the steady state process and the dynamic process:
P a c ( t ) = P a c - s ( t ) + P a c - a ( t )
Using virtual energy storage to regulate air conditioning temperature is equivalent to reducing the air conditioning load, indirectly saving electricity. Taking summer as an example, this paper regards the temperature range acceptable to the human body as the adjustable capacity of virtual energy storage. When the temperature is raised to the highest temperature acceptable to the human body, the available capacity of virtual energy storage is 0. When the set temperature is lower than the highest acceptable temperature, it means that there is an adjustable potential at this time, i.e., the capacity of virtual energy storage is greater than 0. The temperature regulation process of air conditioning corresponds to the charging and discharging process of virtual energy storage: when the set temperature of the air conditioning increases, the available capacity of virtual energy storage decreases, which is equivalent to virtual energy storage discharge. When the set temperature of the air conditioning decreases, the available capacity of virtual energy storage increases, which is equivalent to virtual energy storage charging. The virtual energy storage charging and discharging power expressions are as follows:
P ac - v i r t u a l ( t ) = S C T s e t t T r t 1 τ η ,   s u m m e r P a c - v i r t u a l ( t ) = S C T r t 1 T s e t t τ η ,   w i n t e r
The above process is similar in winter, where P ac - v i r t u a l ( t ) is the virtual energy storage power during that period, kW; T s e t t is the set temperature of the air conditioning during the current period; and T r t is the indoor temperature during the current period, °C.

2.3. Virtual Energy Storage Indicator

Taking the summer scenes as an example, when the indoor temperature T r ( t ) rises to the upper acceptable temperature limit T m a x for the human body, the virtual energy storage has reached the maximum discharge depth, and the remaining electricity at this time is defined as 0. The expressions for virtual energy storage capacity S v i r t u a l ( t ) and rated capacity E N can be obtained as follows:
S virtual ( t ) = S C ( T m a x T r ( t ) ) η ,   summer S virtual ( t ) = S C ( T r T m i n ( t ) ) η ,   winter
E N = C ( T max T min ) η
In this paper, the upper and lower limits of the temperature at which 80% satisfaction is achieved are taken as the upper and lower limits of the acceptable temperature, taking into account the degree of adaptation of the human body to the temperature.
After the rated capacity is determined, the indoor temperature T r ( t ) corresponds with the state of virtual charge (SOVC), and S o v c ( t ) is represented as follows:
S o v c ( t ) = E ( t ) E N = T m a x T r ( t ) T m a x T m i n ,   summer S o v c ( t ) = E ( t ) E N = T r ( t ) T m i n T m a x T m i n ,   winter
The rated capacity of virtual energy storage is directly proportional to the equivalent heat capacity of the building and the acceptable temperature range of the air conditioning user. The virtual state of charge can measure the virtual energy storage capacity in real time.

3. Optimization Scheduling Strategy Considering Air Conditioning Building Virtual Energy Storage

3.1. Microgrid Structure

This paper considers a microgrid system model composed of multiple distributed energy sources, as shown in Figure 1. The main power generation equipment is micro gas turbines, wind power, and photovoltaic power generation; in addition, there are interactions with the main power grid. The load consists of the user’s basic power load and air conditioning load together.

3.2. Optimization Scheduling Model for Microgrids Considering Virtual Energy Storage

3.2.1. Objective Function

The objective function consists of the economic benefits, carbon emissions, and user satisfaction with the microgrid. The final result was obtained by normalizing the sum of the three sub-objective functions and taking the optimal solution. The specific expression is as follows:
  • Microgrid revenue:
The revenue of microgrid f 1 consists of the sum of its revenue from the sale of electricity and the load reduction compensation it receives from the grid minus the operation costs.
f 1 = t = 1 T C s e l l ( t ) + t = 1 T C b ( t ) P r e ( t ) j = 1 M i = 1 N t = 1 T C j i ( t ) P j i ( t )
C s e l l ( t ) = t = 1 T [ P WT ( t ) + P PV ( t ) + P MT ( t ) ] C t ( t )
where, C sell ( t ) is the electricity sales revenue of the microgrid; C b ( t ) is the compensation electricity price provided by the power grid, in yuan/kWh; P re ( t ) is the load reduction amount, kWh; M is the number of energy types in the microgrid; N is the number of units for this energy source; C j i ( t ) is the operation cost of the unit j of the energy source i, yuan/kWh; P j i ( t ) is the corresponding power generation, kWh; P WT ( t ) is the wind turbine power generation, kWh; P PV ( t ) is the photovoltaic power generation, kWh; P MT ( t ) id the gas turbine power generation, kWh; and C t ( t ) is the electricity price, yuan/kWh.
2.
Carbon emissions:
f 2 = t = 1 T ( λ g i r d P g i r d ( t ) + λ M T P M T ( t ) )
where, λ g i r d ,   λ M T are the carbon emission coefficients of interaction with the main power grid and gas turbine, kg/kWh; and P g r i d ( t ) is the amount of electricity interacting with the main grid, kWh.
3.
User satisfaction:
In this paper, three factors, namely, total user cost, gap between indoor temperature and optimal temperature, and indoor temperature fluctuation, are considered simultaneously, and user satisfaction f 3 is obtained by weighting and summing them.
f 3 = t = 1 T { k l [ C t ( t ) P l o a d ( t ) C e ( t ) P a c - a c t u a l ( t ) ] + k b Δ T b ( t ) + k c σ t }
Δ T b ( t ) = T r ( t ) T b e s t ( t )
σ t = 1 n t = 1 96 ( T s e t ( t ) T ¯ ) 2
where, P l o a d ( t ) is the total electricity consumption, kWh; Δ T b ( t ) is the difference between the current room temperature and the optimal temperature, °C; σ t is the variance of the temperature change value; T ¯ is the average value of the set temperature, °C; and k l ,   k b ,   k c is the weight coefficient for the three consideration factors. In the calculation, all three values are normalized before considering their respective weights.

3.2.2. Constraint Condition

  • Energy balance constraint:
P g i r d ( t ) + P W T ( t ) + P P V ( t ) + P M T ( t ) = P l o a d ( t )
P l o a d ( t ) = P b a s i c ( t ) + P ac ( t )
where, P b a s i c ( t ) is the basic electricity consumption, kWh.
2.
Power constraint:
P j i d o w n P j i ( t ) P j i up
P M T t P MT t 1 r MT
where P j i ( t ) is the power generation of the unit i of the energy source j, P j i d o w n ,   P j i u p are the upper and lower limits of the power of the unit, and r MT is the upper and lower limit of the climbing power of the micro gas turbine.
3.
Temperature regulation constraint:
The closer the indoor temperature is to the optimal temperature, the smaller the degree of temperature change and the higher the comfort level of the human body. The acceptable temperature range for the human body and the acceptable temperature change range are as follows:
T min T set ( t ) T max
Δ T min T r ( t + 1 ) T r ( t ) Δ T max
where, T max ,   T min are the upper and lower limits of temperature to ensure human comfort inside the building, °C; and Δ T max ,   Δ T min are the upper and lower limits of acceptable temperature changes that ensure human comfort inside the building, °C.

4. Multi Objective JAYA Algorithm

4.1. MO-JAYA Algorithm

The multi-objective JAYA algorithm was proposed by Fateh Berrouk et al. in 2018 [29]. It is based on the principle of continuous improvement, which brings individuals closer to excellent individuals, while constantly moving away from poor ones, thereby improving the quality of solutions. Compared to other metaheuristic algorithms, this algorithm has fewer control parameters and is easier to understand and implement. The formula for each iteration update is as follows:
X j , k , i = X j , k , i + r 1 , j , i ( X j , best , i X j , k , i ) r 2 , j , i ( X j , worst , i X j , k , i )
where, X j , k , i is the j variable of the k individual in the i iteration process; X j , best , i is the j variable of the individual with the best objective function value in the i iteration process; X j , worst , i is the j variable of the individual with the worst objective function value in the i iteration process; X j , k , i is the absolute value of X j , k , i ; r 1 , j , i and r 2 , j , i are random numbers between zero and one; and X j , k , i is the updated value of X j , k , i .
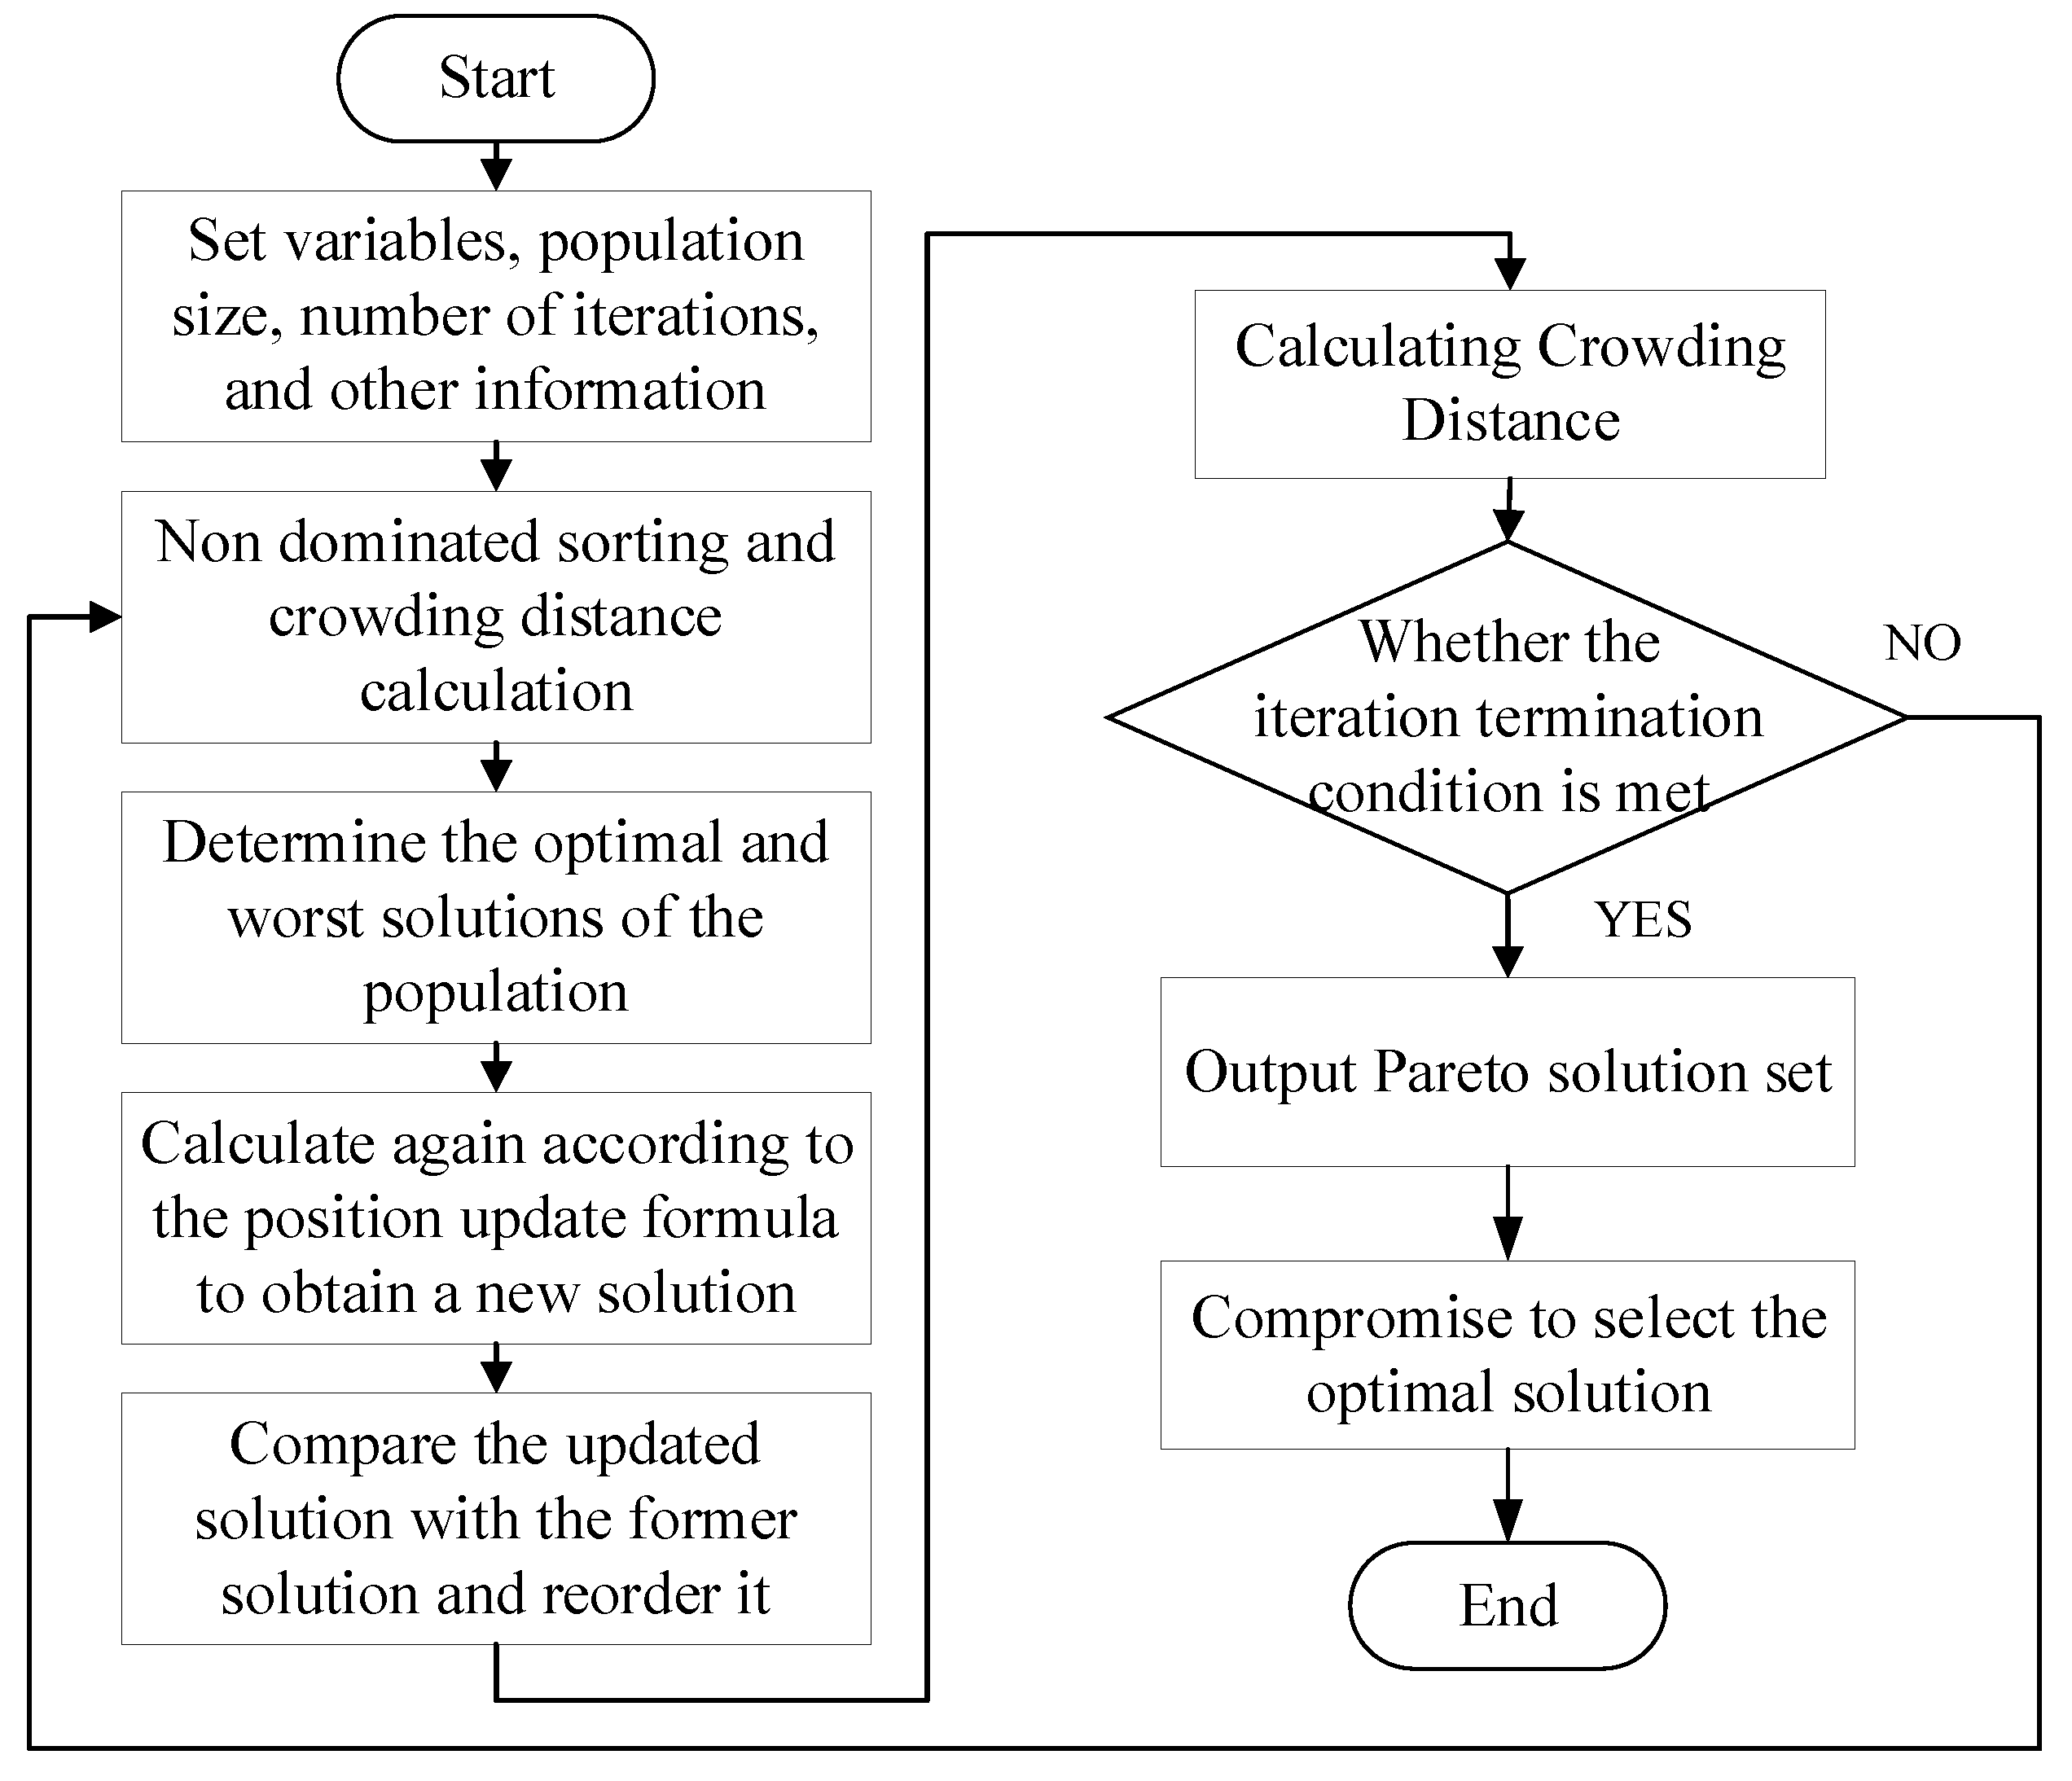
The MO-JAYA algorithm is a subsequent version of the JAYA algorithm, specifically designed to solve multi-objective optimization problems. In order to effectively and efficiently handle multi-objective problems, the algorithm incorporates non dominated sorting methods and crowding distance computing mechanisms.

4.2. MO-JAYA Algorithm Process

After obtaining the Pareto frontier of the objective function based on the above model, the optimal solution on the Pareto frontier can be normalized. The three objective functions set in this paper are, respectively, maximizing microgrid revenue, minimizing carbon emissions, and maximizing user satisfaction, so the coordinates of the optimal solution can be transformed into the following:
( f i , 1 n , f i , 2 n , f i , 3 n ) = f i , 1 min f i , 1 max f i , 1 min f i , 1 , f i , 2 min f i , 2 max f i , 2 min f i , 2 , f i , 3 min f i , 3 max f i , 3 min f i , 3
where, f i , j is the noninferior solution i of the objective function j. Then, taking ( f 1 max , f 2 min , f 3 min ) as the reference point and calculating the Euclidean distance between each non-inferior solution to the reference point, the one with the smallest Euclidean distance is the compromise solution.
The flowchart of MOJAYA algorithm is shown in Figure 2.

5. Analysis of Examples

In this paper, taking a typical winter and summer day in a city in southern China as an example, the building area used for calculating the virtual energy storage of air conditioning is set to be 15,000 m2, a total of 400 users are involved in the regulation, a total of 400 air conditioners with a rated power of 1.5 kW are used, the total air conditioning power is set to be 600 kW, and the electricity load is considered to be the user’s basic load plus the air conditioning load. The air conditioning load ETP parameters mainly refer to Refs. [30,31], where R = 0.002 kW/(°C·m2), C = 46 kJ/(°C·m2), and the rest of the parameters take the values shown in Table 1, Table 2 and Table 3. In this paper, the constructed model and strategy are simulated and verified in Matlab R2016b.
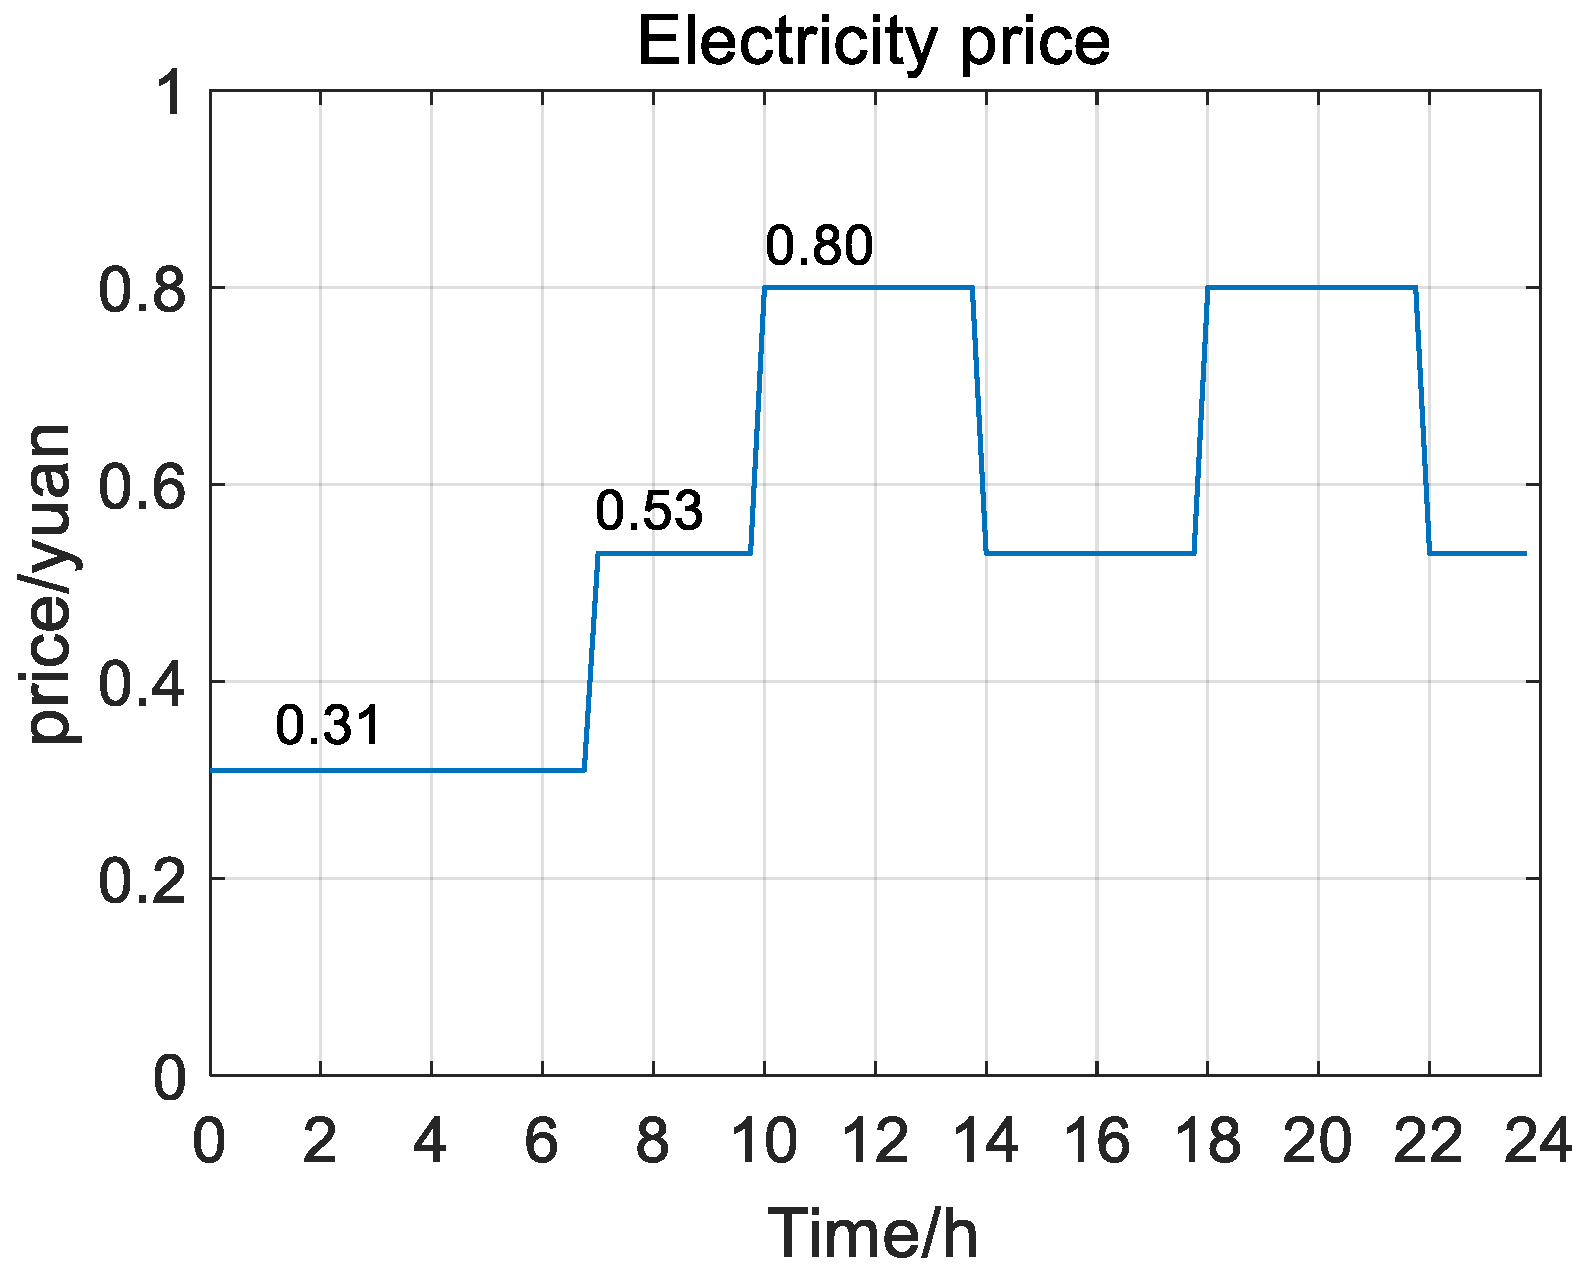
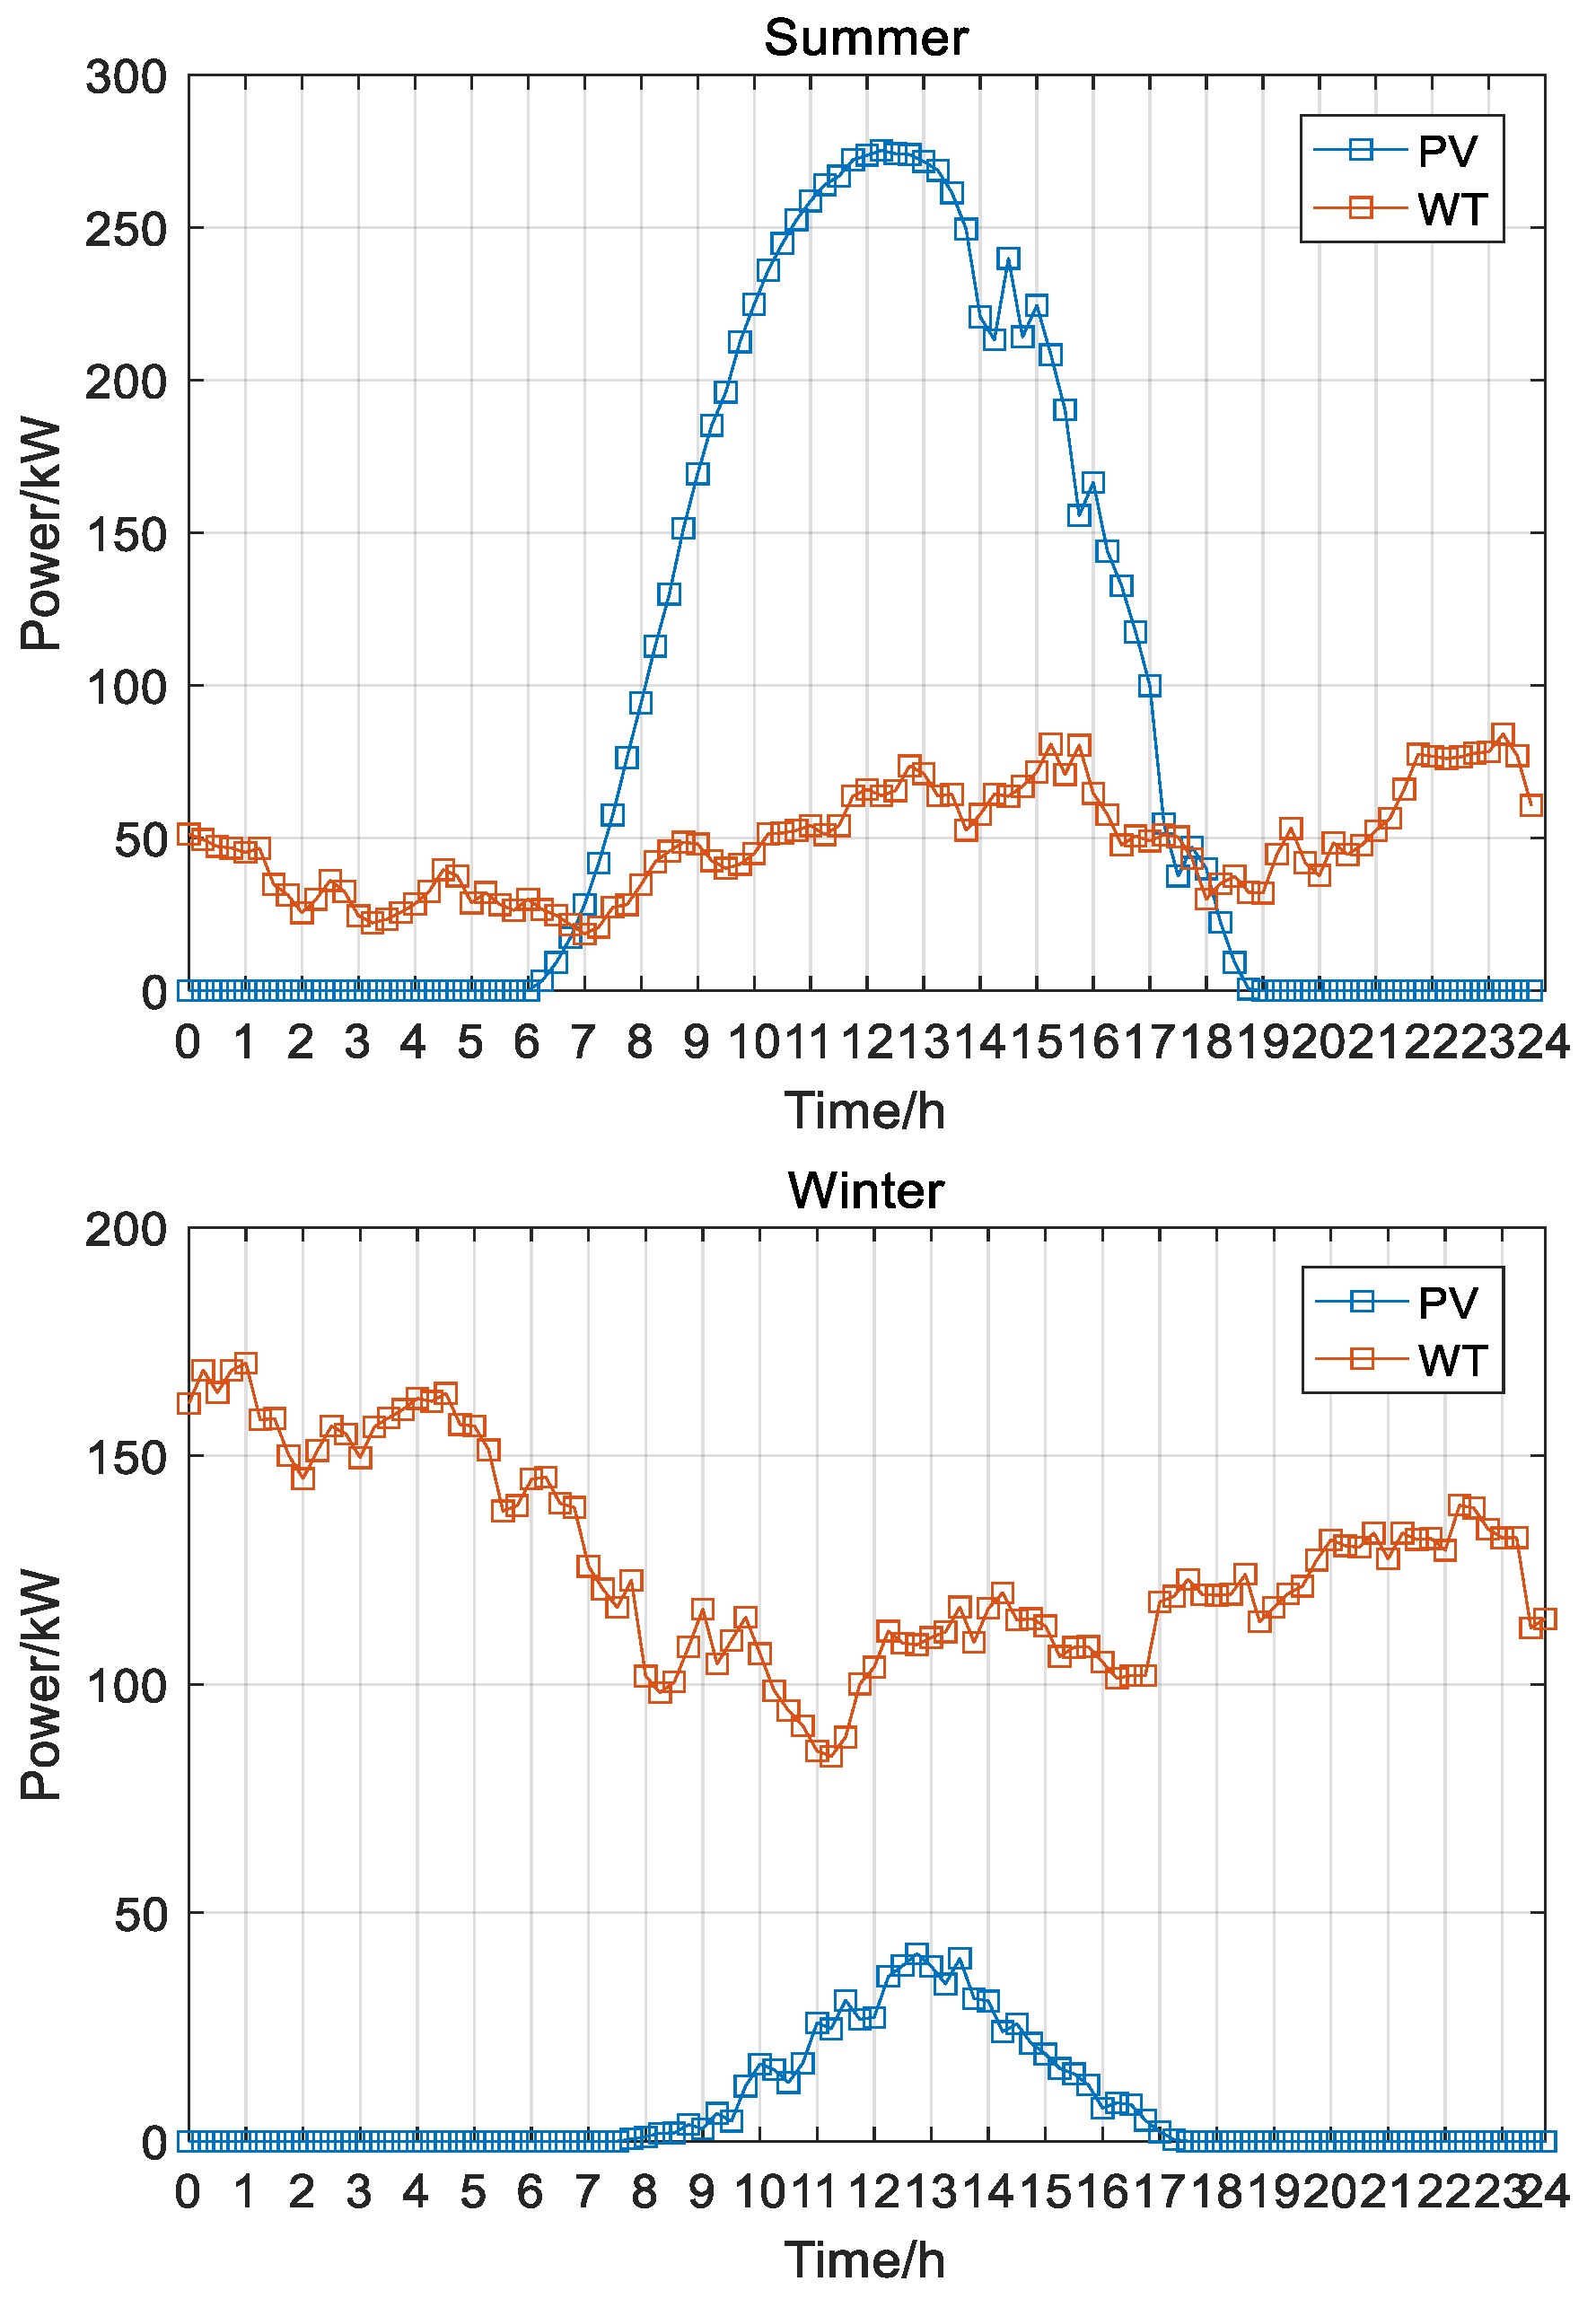
The microgrid operating parameters are shown in Table 1. The electricity price is shown in Figure 3. Based on data from wind and photovoltaic power plants in a southern Chinese city, the output data of wind and PV plants for typical scenarios in the summer and winter used in this paper are shown in Figure 4. In order to reflect the typicality of the winter scene, a rainy winter day is selected as a reference in this paper. The other value parameters are shown in Table 1, Table 2 and Table 3 [32,33,34,35,36].
The upper output limit of the micro gas turbine is 350 kW, the lower output limit is 35 kW, and the rate of climb constraint is 60 kW/15 min [37]. The values of various weight coefficients are α 1 = α 2 = 0.5, k l = 0.5, and k b = k c = 0.25. The compensation electricity price C b is 0.5 yuan/kWh.
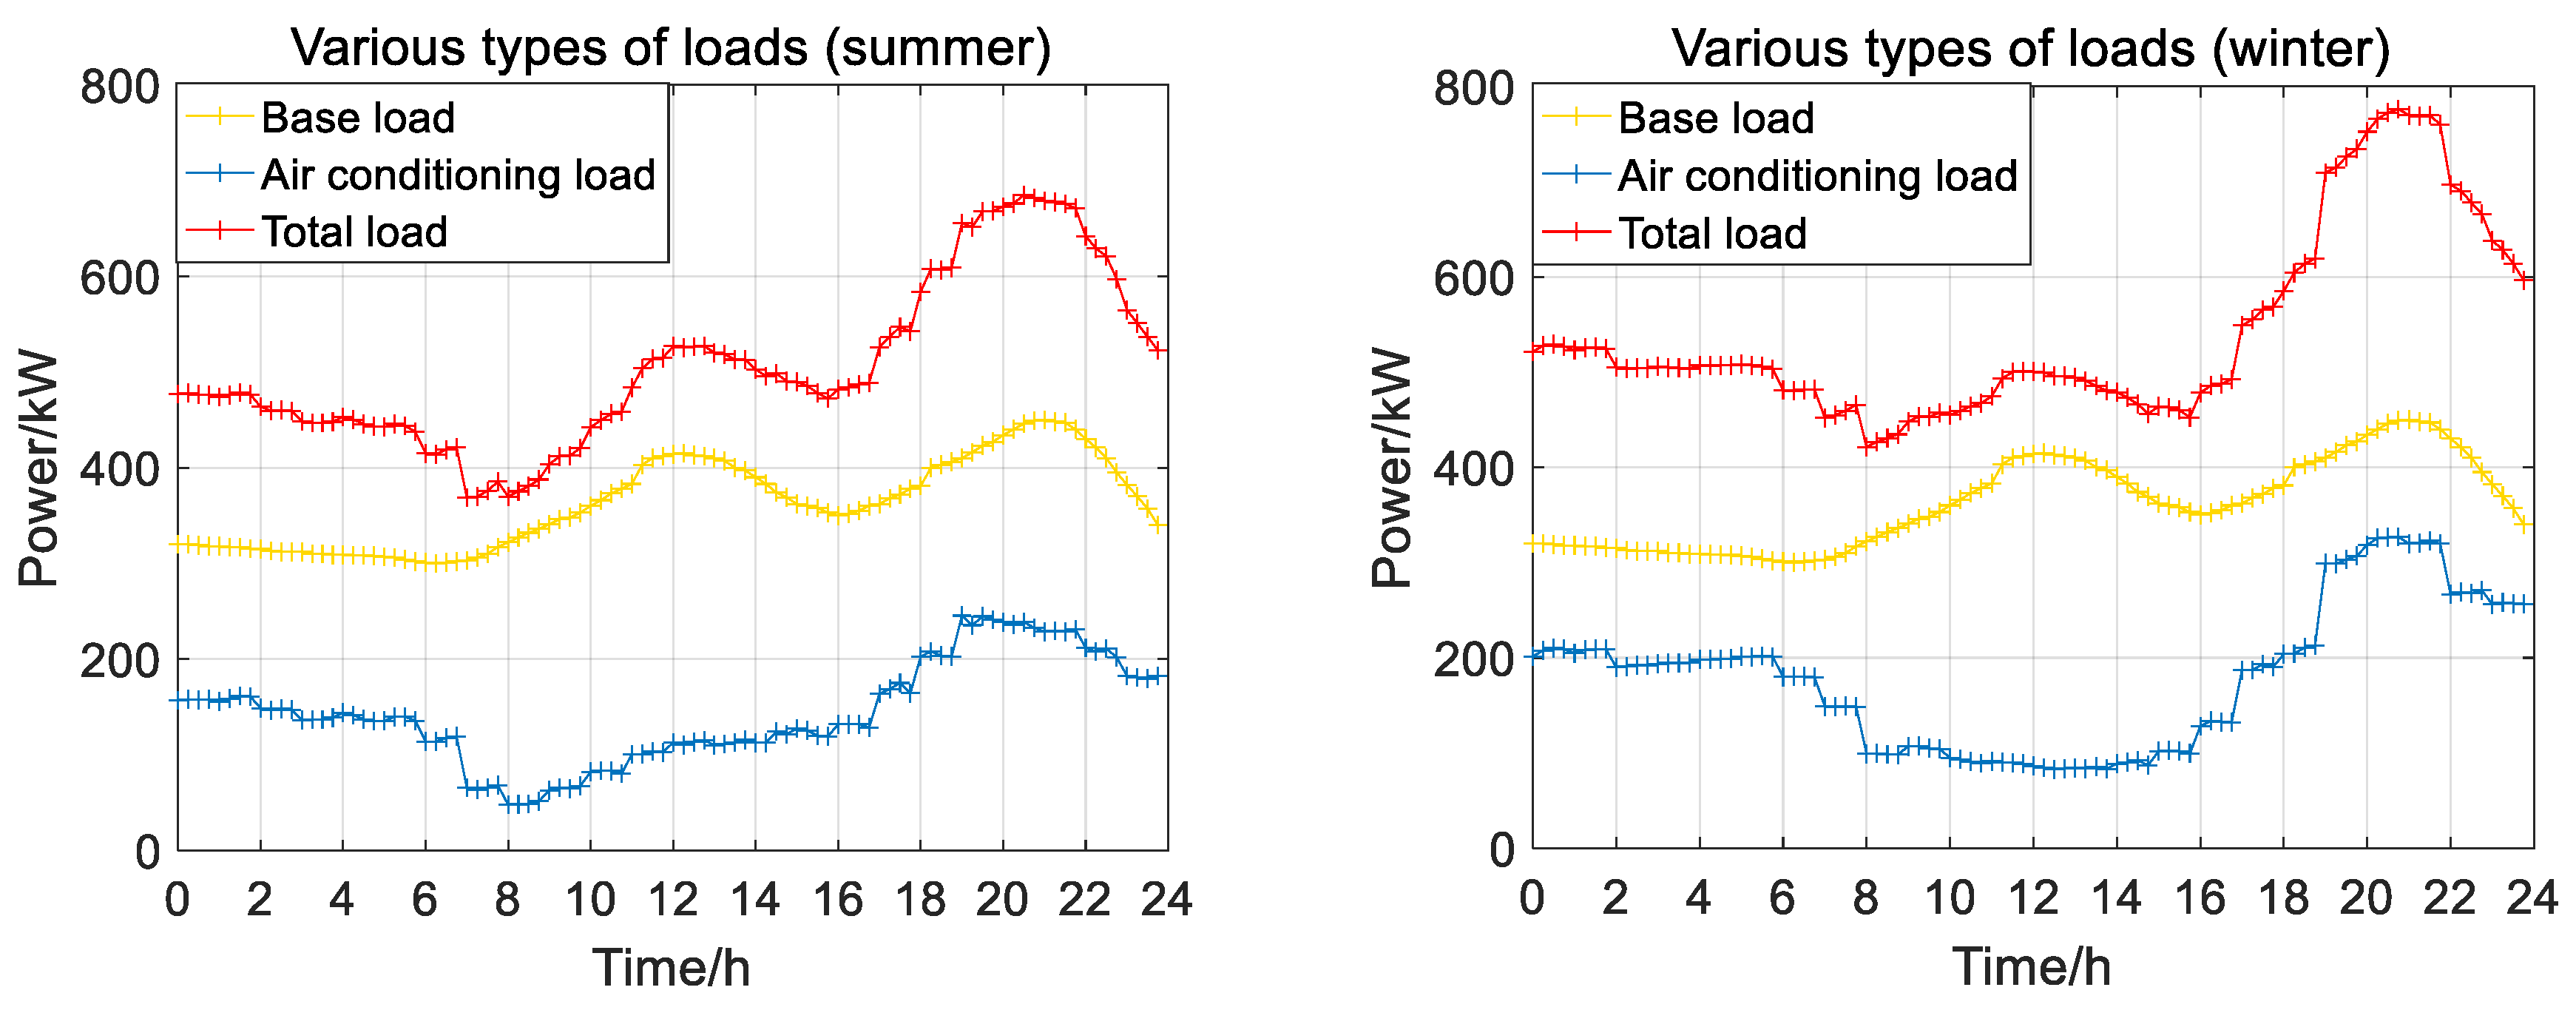
This paper also considers whether the air conditioner is in a state where it can be regulated, and sets the proportion of hot and cold loads to the total load and the trend of the proportion of air conditioning users participating in regulation by referring to refs. [38,39], and calculates the air conditioning load based on the proportion of air conditioning users participating in regulation in one day and the power generated by air conditioning equipment based on the temperature setting. In addition, taking into account the hardware and software conditions required for air conditioning to participate in uniform temperature control and the user’s awareness of participation, it is set so that only 50% of all air conditioning users have the conditions to participate in uniform control, so that the base load and air conditioning load in summer and winter seasons can be obtained, as shown in Figure 5.
For the thermal comfort model, ref. [40] constructed thermal comfort satisfaction models for various typical climates based on the China Thermal Comfort Database. The relevant models for hot summer and cold winter regions are shown in Table 4.
The comfort model of the residential area in which winter and summer are taken as an example, considering the limitation of the air conditioner setting temperature and substituting the temperature range of 18–30 °C into the model, the correspondence between satisfaction and temperature can be obtained, as shown in Table 5.
In order to facilitate the calculation, it is set so that the air conditioner is in a dynamic process in the first 5 min of a 15 min period, and the air conditioner is in a steady state process in the last 10 min. The incentives for users are given in Section 2.1.
Among the users involved in air conditioning regulation, this paper sets up three cases for comparison as follows:
(1)
Case 1: Users do not accept temperature control, meaning that the air conditioning temperature will always be maintained at the highest satisfactory temperature.
(2)
Case 2: Considering that 90% of the users are satisfied with a temperature adjustment range of 21.9 °C to 27.3 °C or 22 °C to 23.6 °C, it is assumed that 90% of the users are willing to participate in the demand response by accepting that the temperature can be regulated within that range when the air conditioning is working, while 10% of the users only accept the most comfortable temperature and do not participate in the demand response.
(3)
Case 3: Considering that 80% of the users are satisfied with a temperature regulation range of 20.4–28.9 or 18–28.9, it is assumed that 80% of the users are willing to participate in the demand response by accepting that the temperature can be regulated within that range when the air conditioning is operating. The remaining 10% of users are only satisfied with a temperature regulation range of 22–23.6, and 10% of users only accept the most comfortable temperature and do not participate in demand response.
The calculation results for various cases are shown in Figure 6, Figure 7, Figure 8, Figure 9, Figure 10 and Figure 11.
  • Summer Case 1
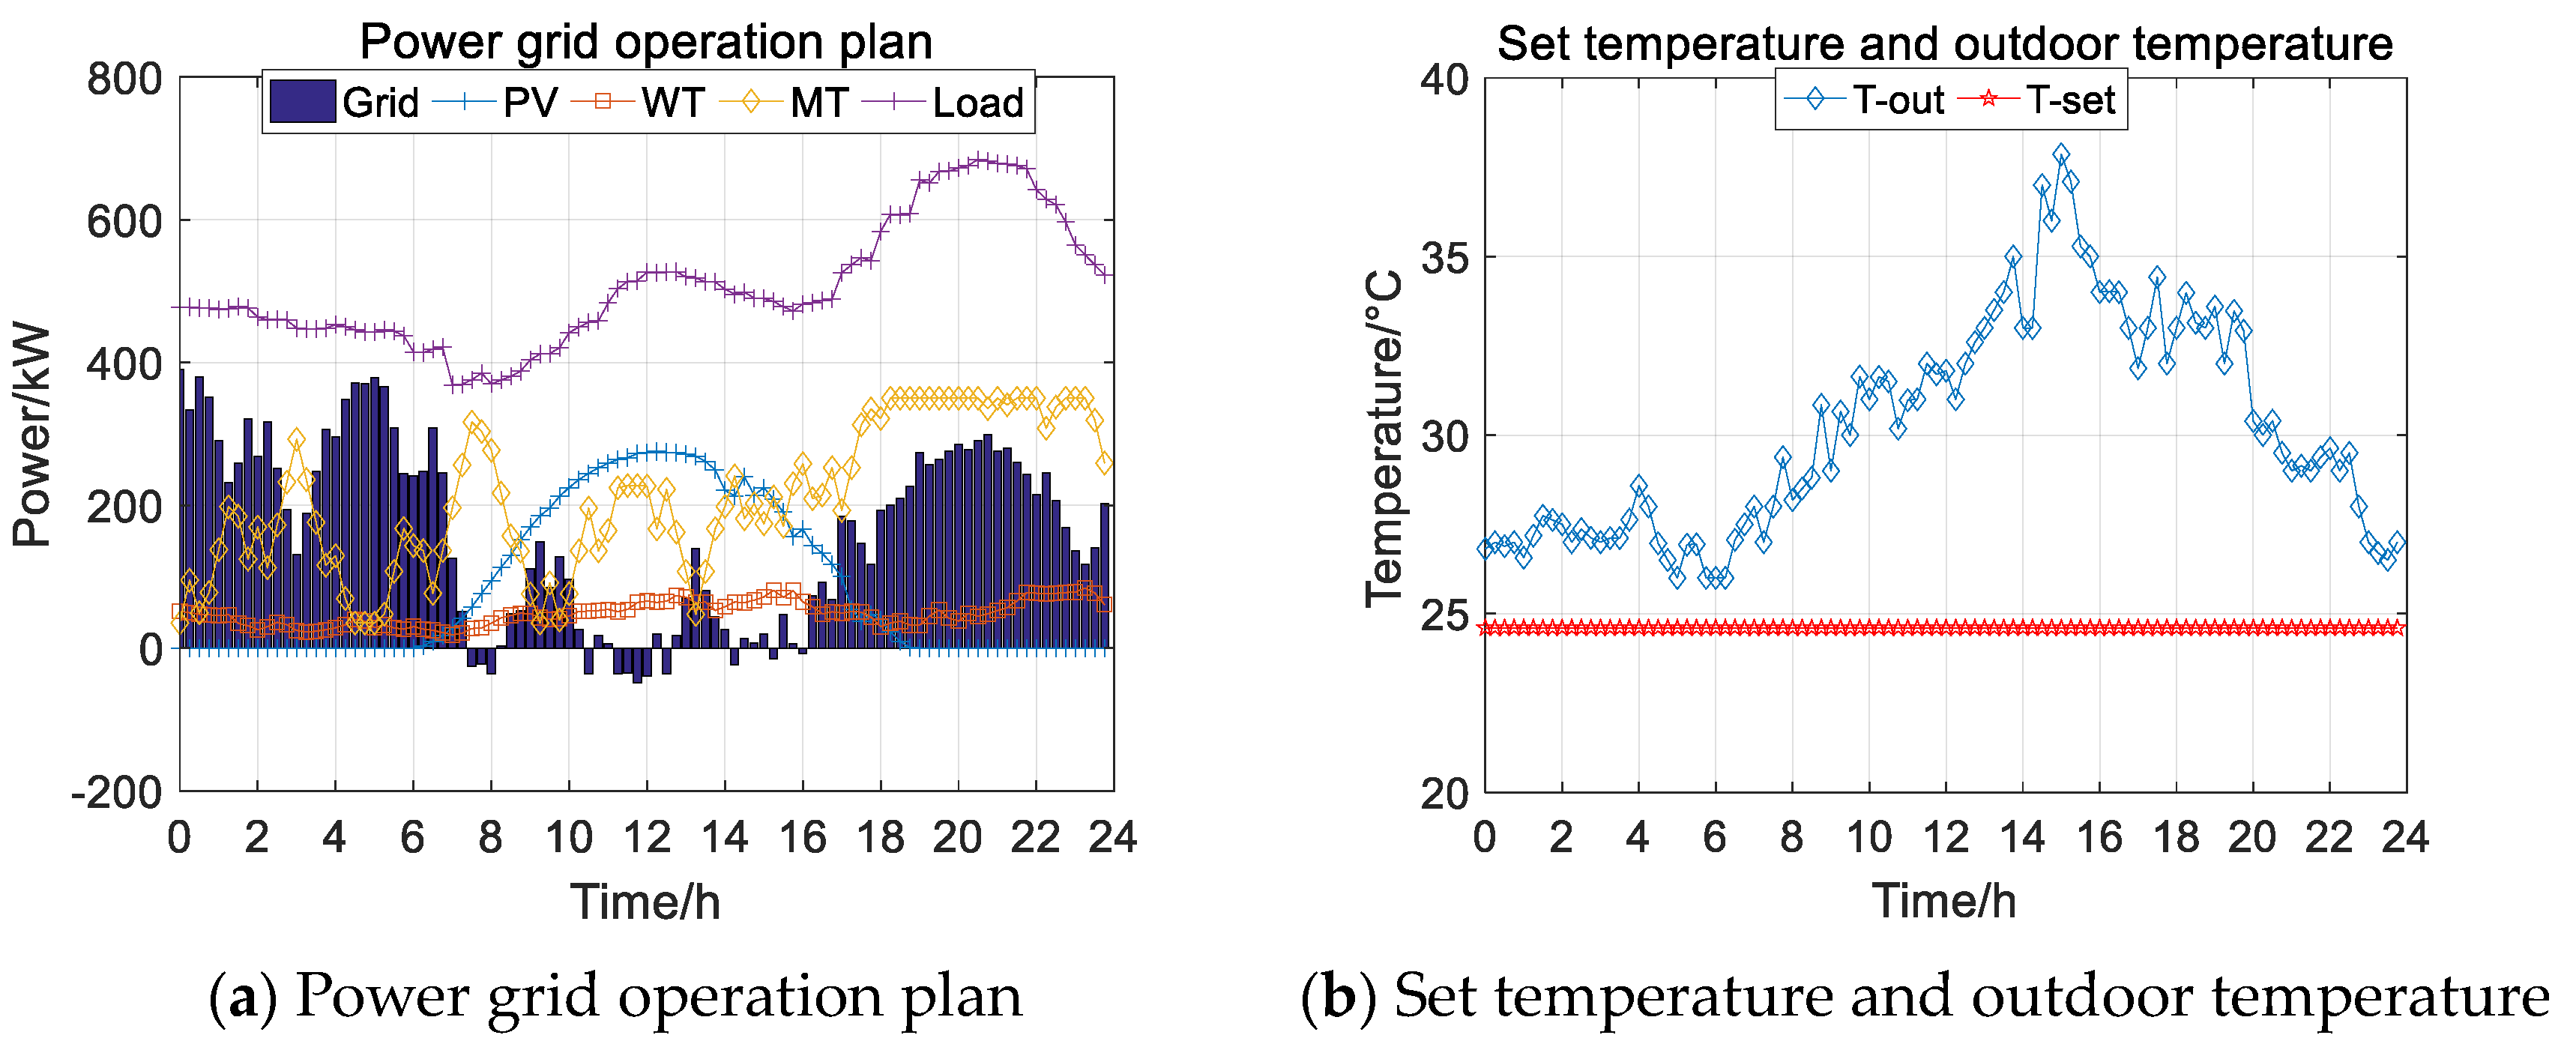
Figure 6. Summer Case 1 power grid operation.
Energies 17 02670 g006
2.
Summer Case 2
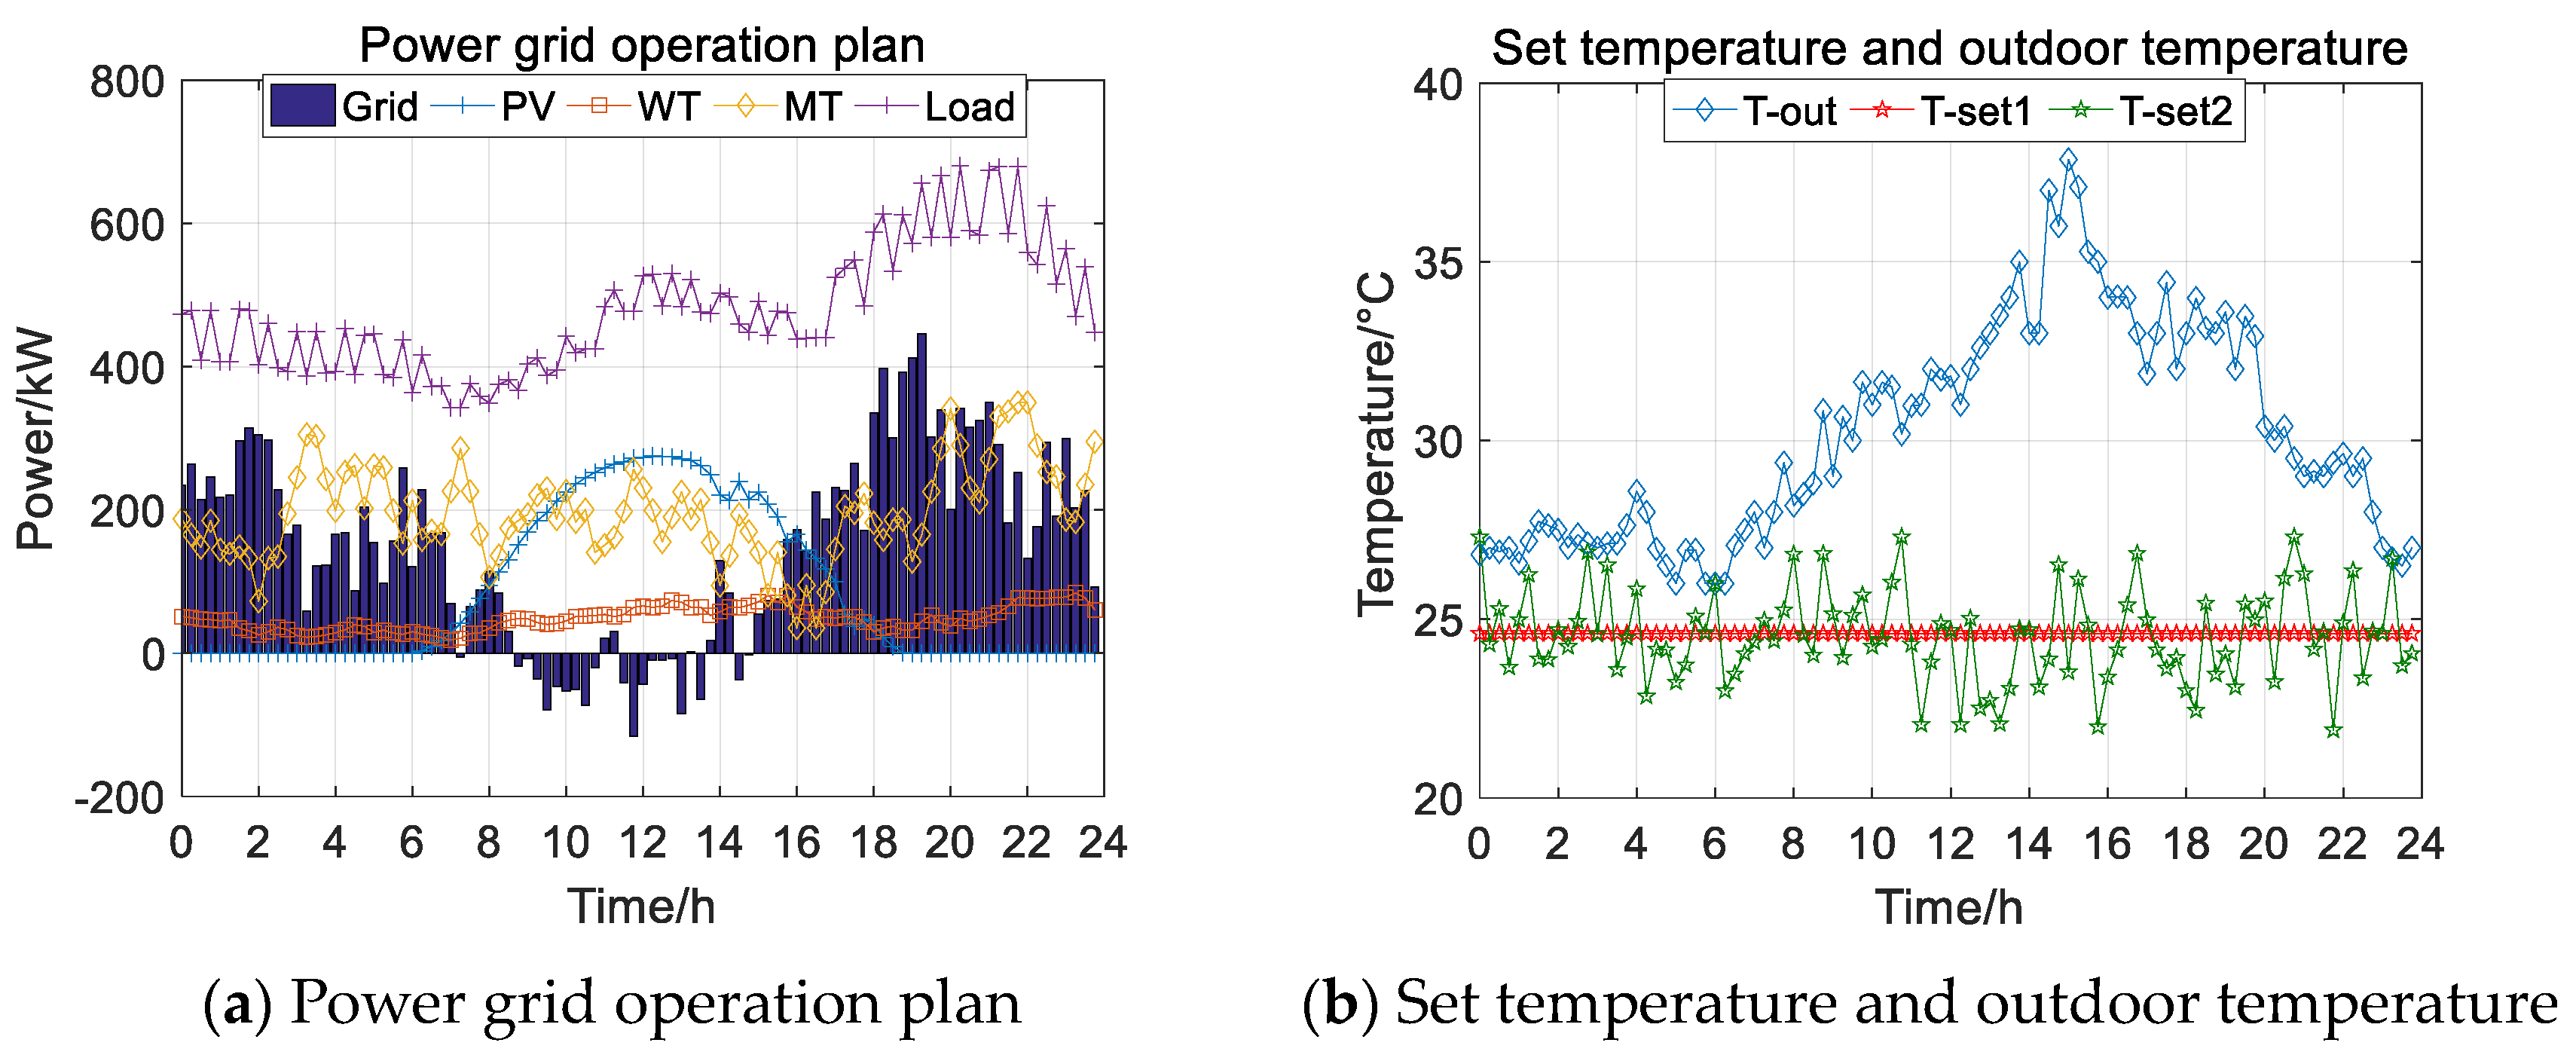
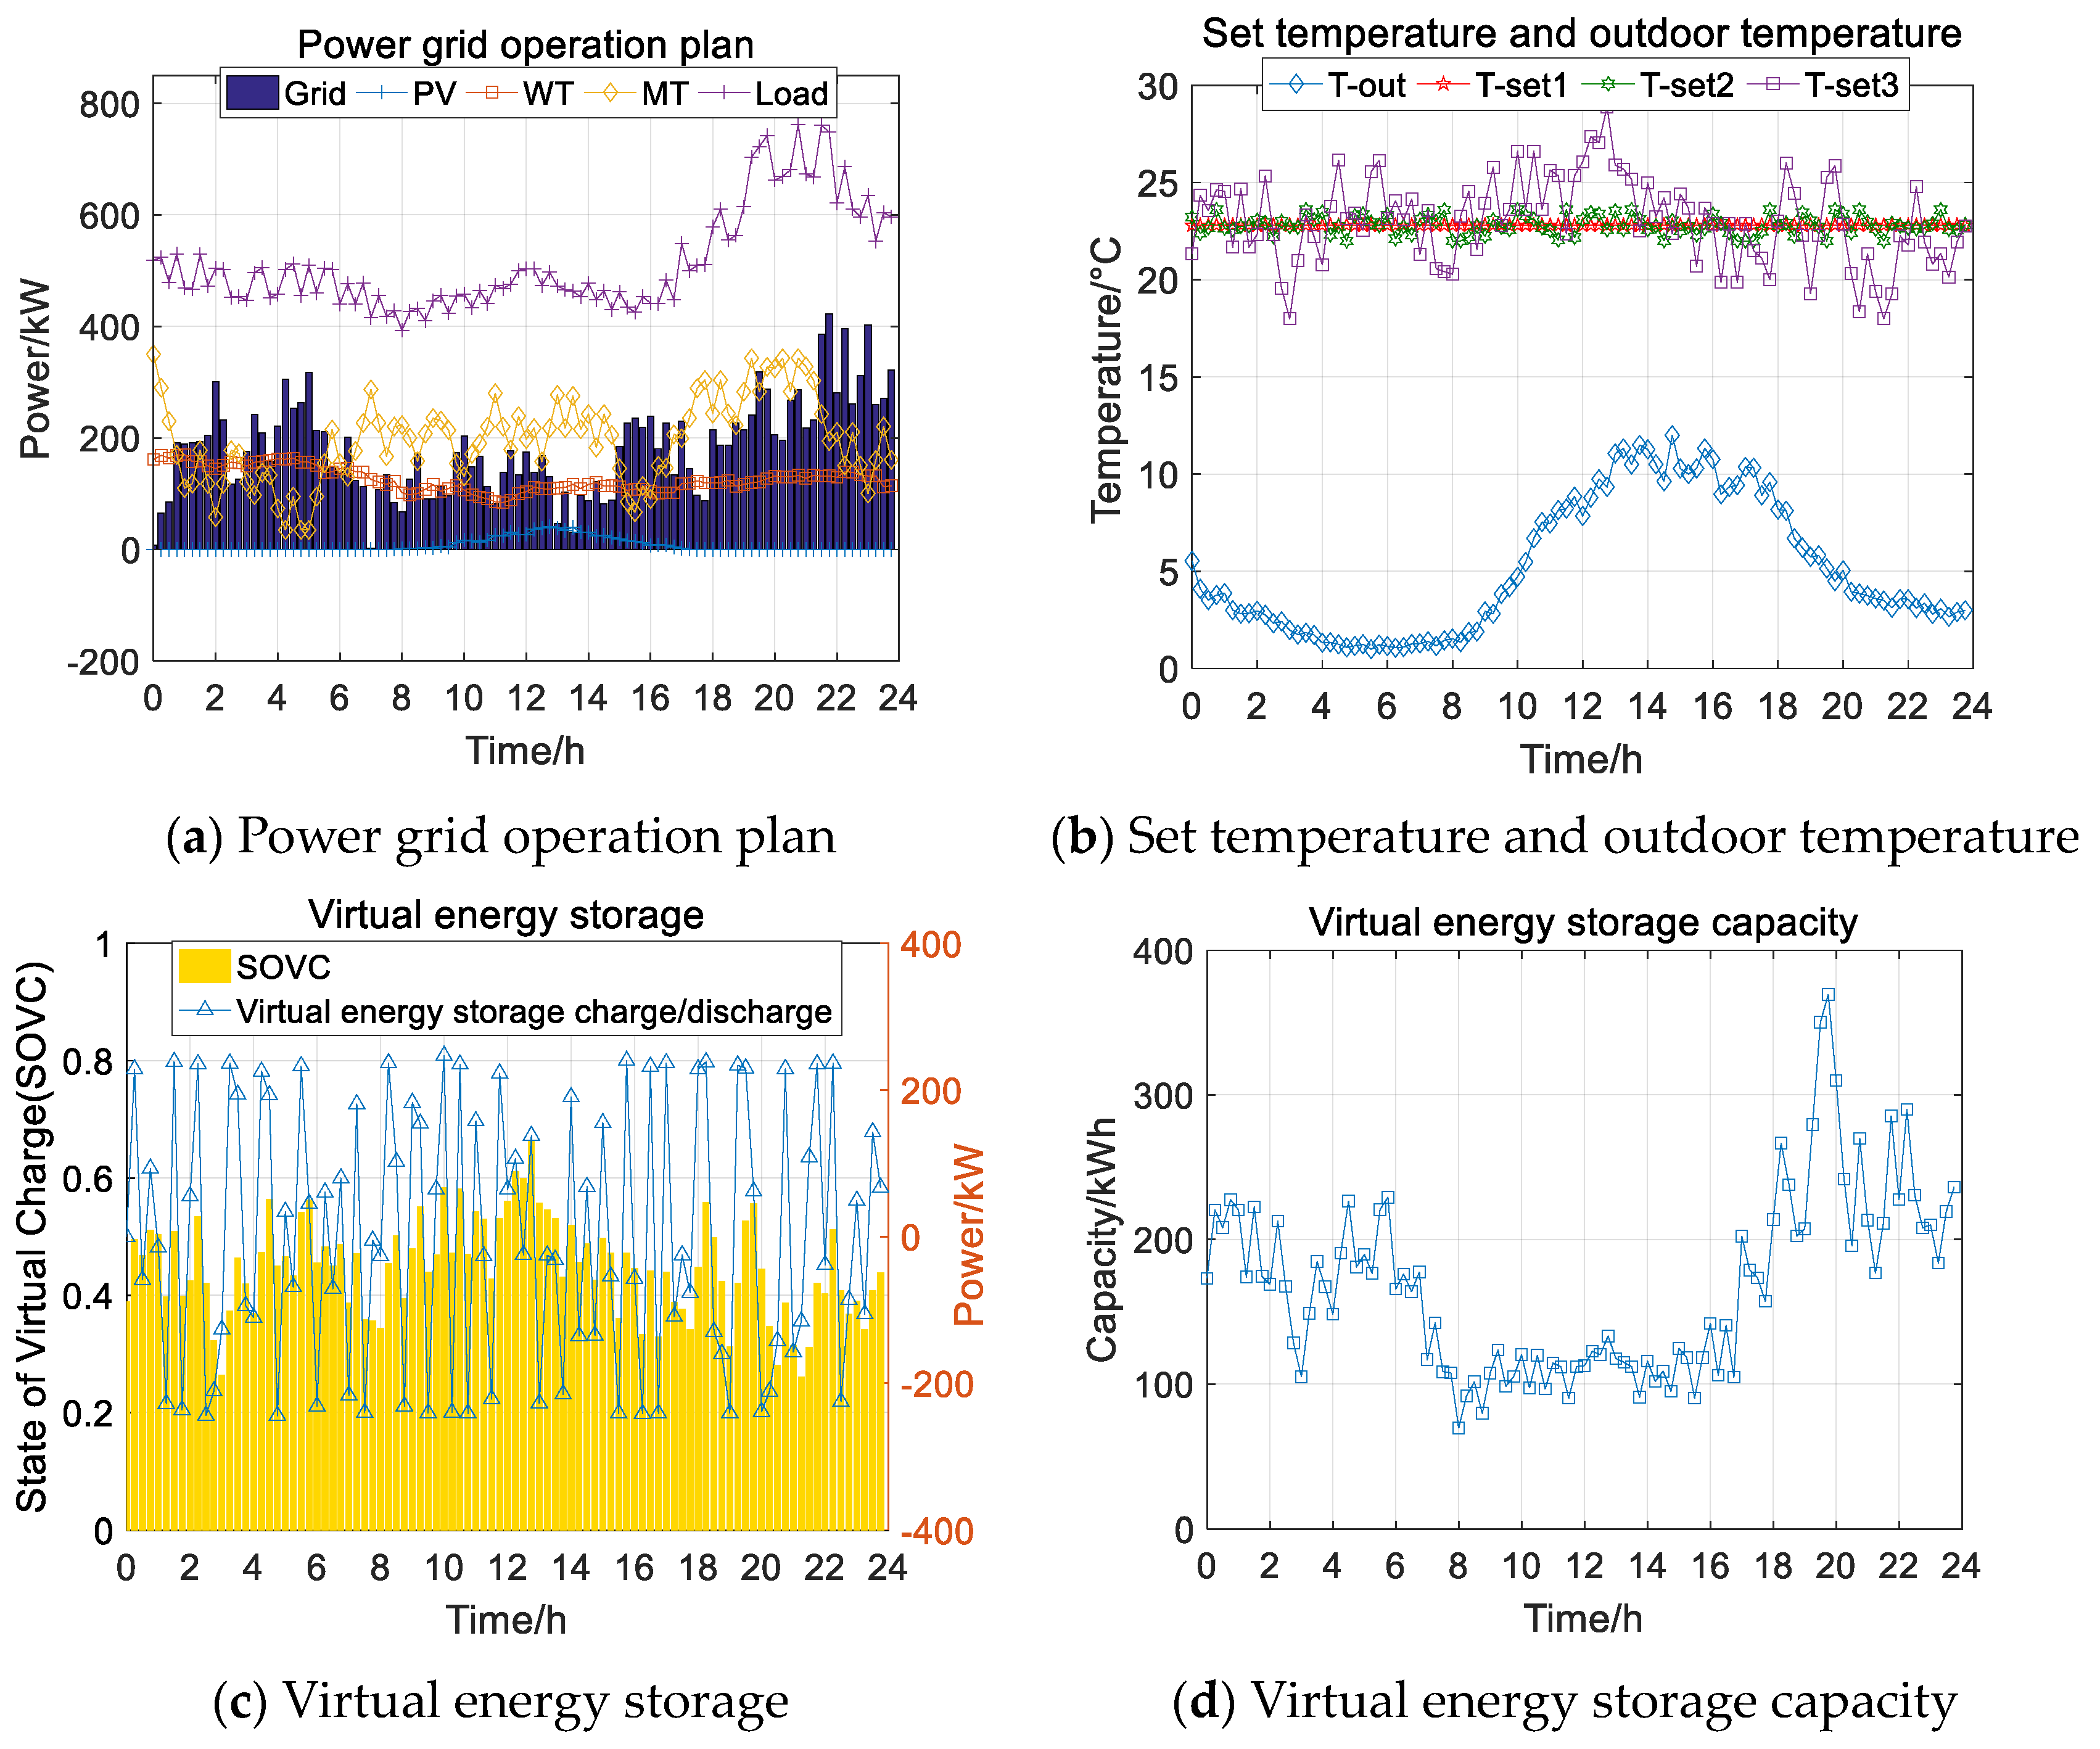
Figure 7. Summer Case 2 power grid operation and virtual energy storage situation.
Energies 17 02670 g007aEnergies 17 02670 g007b
3.
Summer Case 3
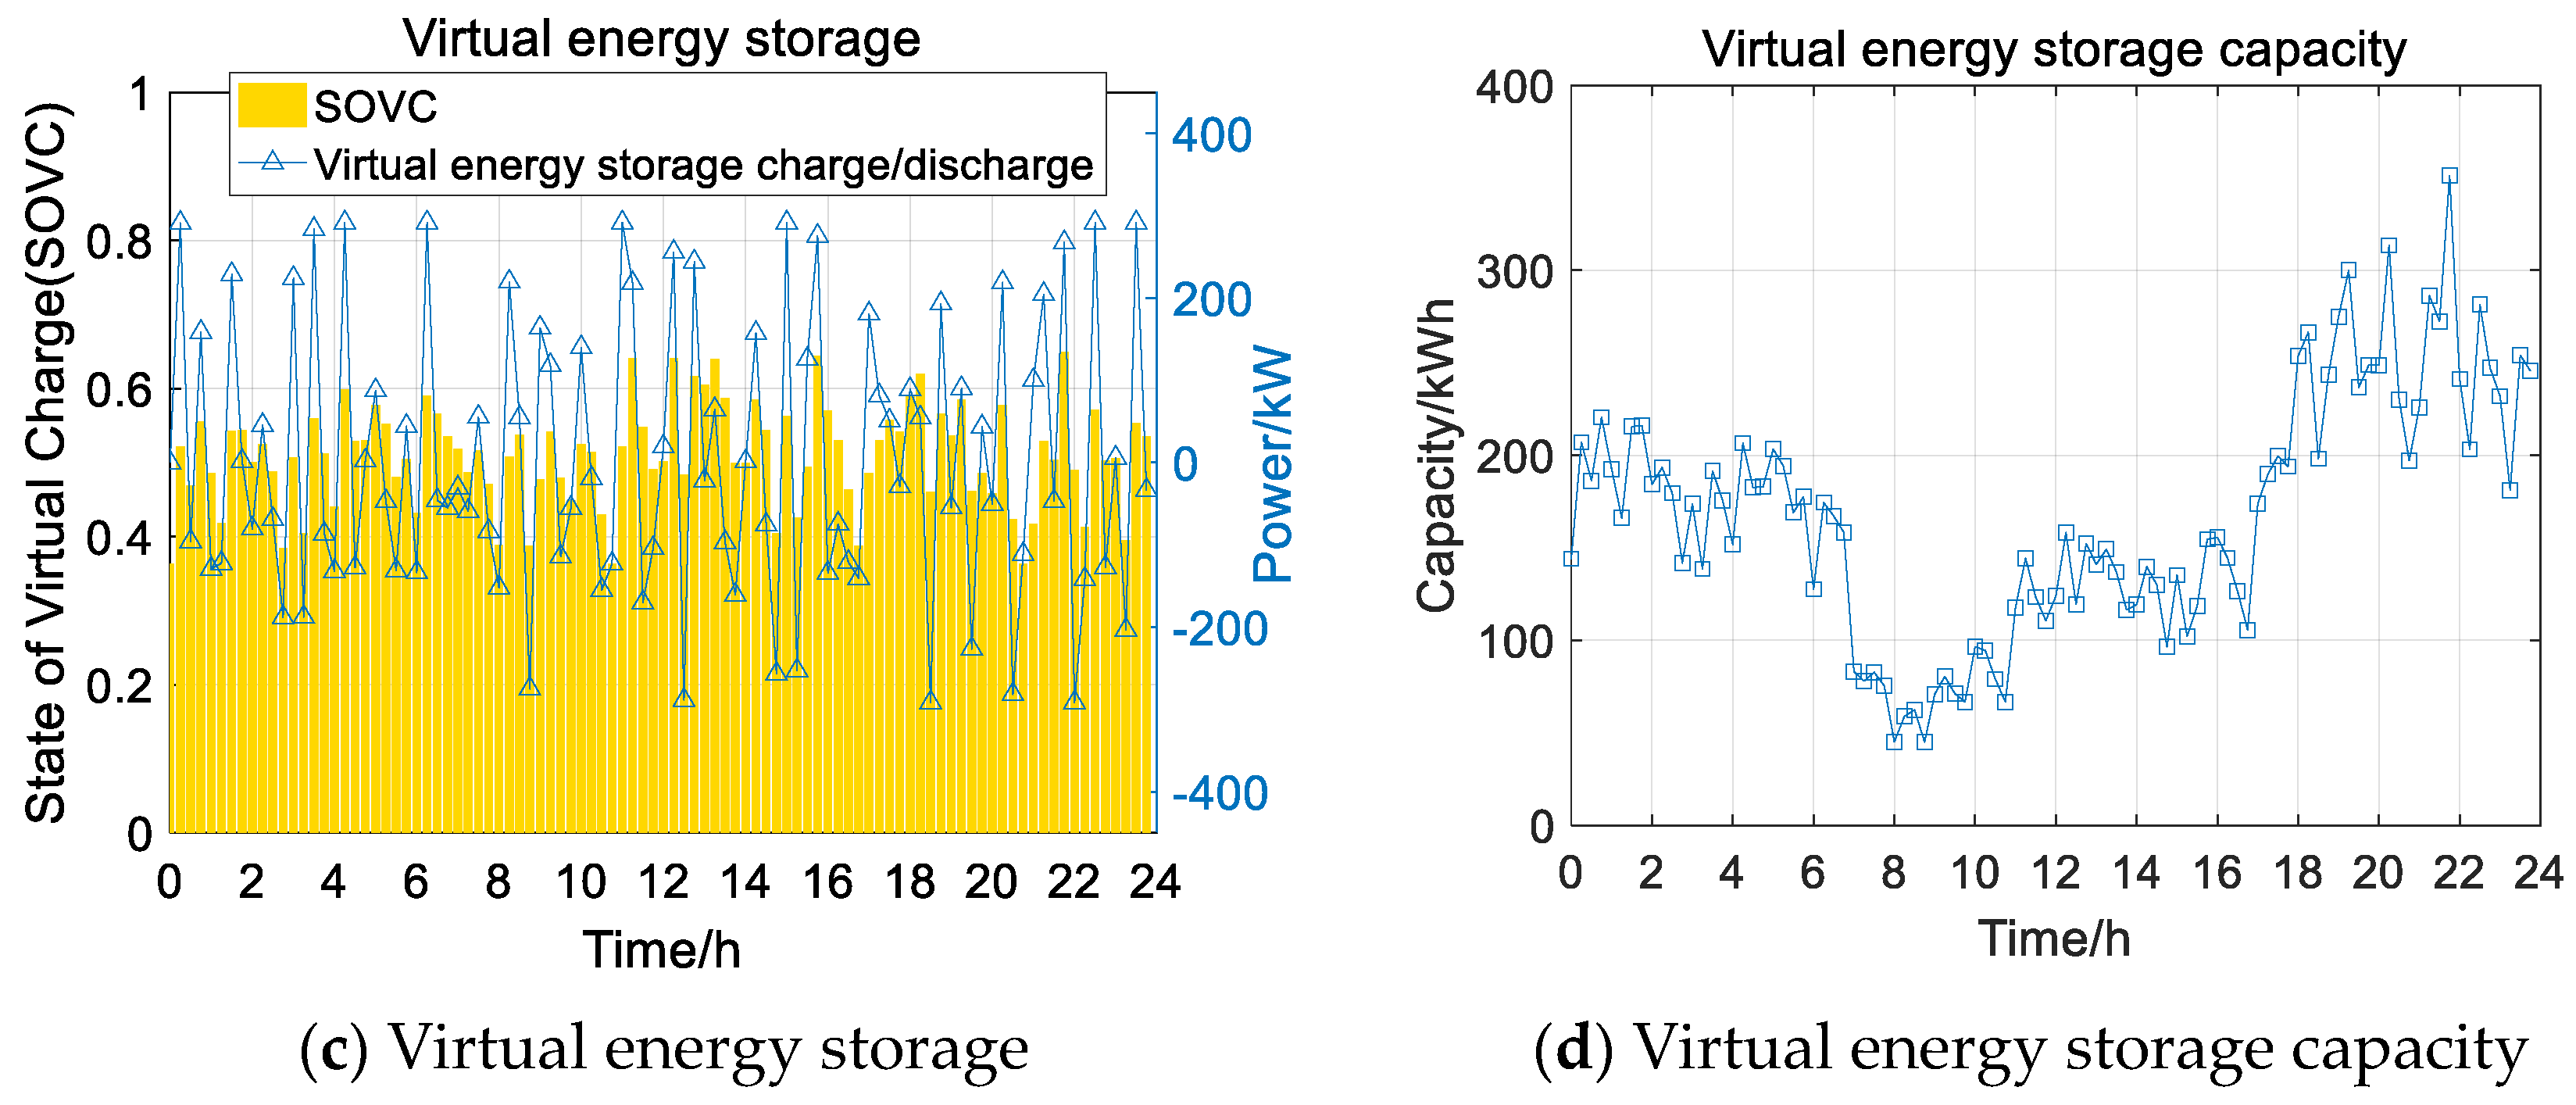
Figure 8. Summer Case 3 power grid operation and virtual energy storage situation.
Energies 17 02670 g008
The grid operation plan of this microgrid for a day in summer, without taking into account the air-conditioned buildings’ virtual energy storage, is shown in Figure 6. From this result, it can be seen that the microgrid tends to sell power versus self-generation when its own generation is high and tends to buy power when its generation is low and load is high, and the load has significant load peaks, which is needed to optimize the economics of the grid operation for the optimization of the load profile.
From Figure 7 and Figure 8, it can be seen that, due to the full consideration of user thermal comfort in this strategy, the set temperature of the air conditioner can be maintained at the optimal sensory temperature of around 24.6 °C for most of the time, which is within a relatively comfortable range for the human body.
In addition, it can also be concluded that the overall electricity load is reduced when virtual energy storage characteristics are considered. During the peak hours of 18:00–22:00 p.m., the virtual energy storage of the microgrid is at a lower level, which indicates that the virtual energy storage is fully utilized to indirectly regulate the loads, and it can also be seen from the figure that the load peaks have been significantly reduced, reflecting the effective peak shaving of the strategy proposed in this paper.
Due to the utilization of virtual energy storage, the air conditioning load is reduced, and the interaction between the microgrid and the power grid has also changed, that is, buying less electricity, which will increase the revenue of the microgrid.
The situations in winter are shown in the following figures.
4.
Winer Case 1
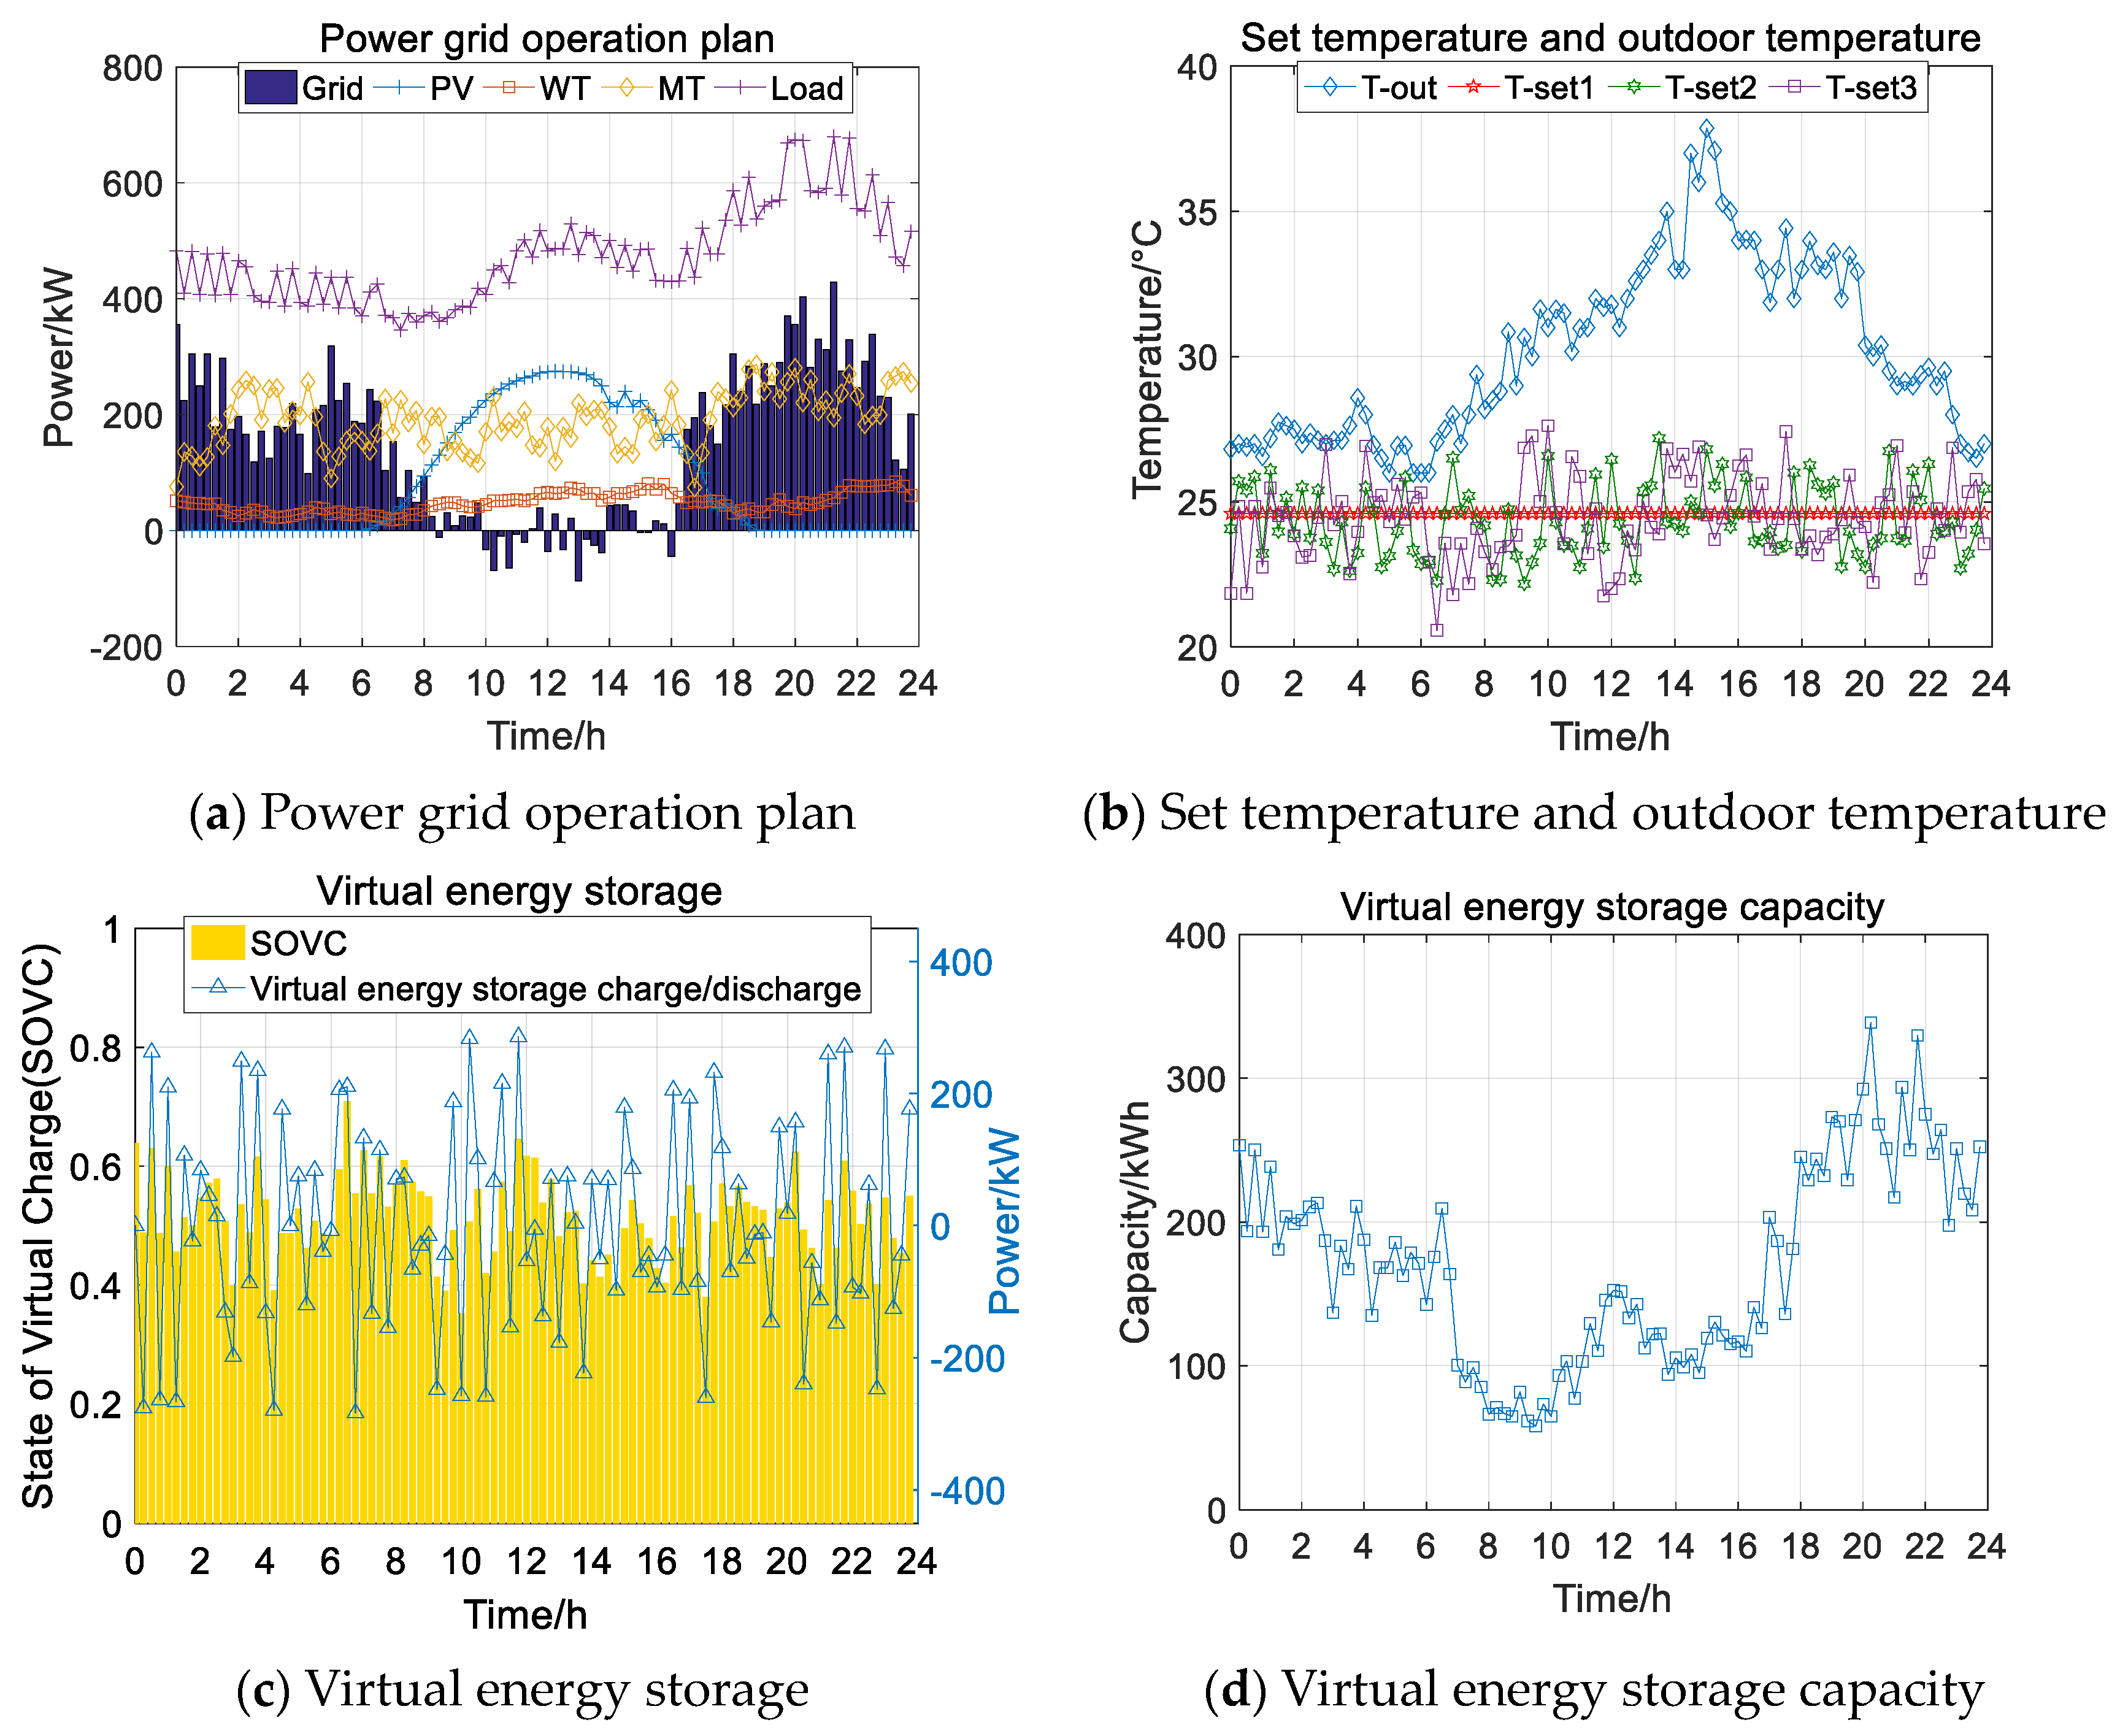
Figure 9. Winter Case 1 power grid operation and virtual energy storage situation.
Energies 17 02670 g009
5.
Winer Case 2
Figure 10. Winter Case 2 power grid operation and virtual energy storage situation.
Energies 17 02670 g010aEnergies 17 02670 g010b
6.
Winer Case 3
Figure 11. Winter Case 3 power grid operation and virtual energy storage situation.
Energies 17 02670 g011
In winter, the PV output is reduced and, therefore, the microgrid’s power purchase from the larger grid is increased. In addition, due to the significant difference between the optimal temperature and outdoor temperature compared to summer, the air conditioning load in winter is also greater than in the summer. In Winter Case 2, the utilization of virtual energy storage is lower because the adjustable range is smaller. When a larger temperature regulation range is considered, for example in Case 3, the virtual energy storage is utilized more, and the load is reduced compared to Case 2.
Comparison of all calculations of the results of the indicators are shown in Table 6.
From Table 6, it can be seen that when the optimal regulation of the air conditioning set temperature is carried out under the consideration of virtual energy storage, the microgrid’s purchased power from the higher-level grid is reduced due to the utilization of the regulation capacity of the virtual energy storage, so the revenue is increased, and the carbon emission of the microgrid and the cost of the user’s purchase power are both significantly reduced, which overall reflects the economy and environmental protection proposed in this strategy. Among the three different types in each season, whether or not to consider virtual energy storage as a regulation method has a particularly obvious effect on the improvement of users’ electricity costs and carbon emissions. When the temperature regulation range is increased, all three indicators are improved. But due to the larger temperature range available to the user, in order to make the temperature setting at the next moment better than the current setting, it is inevitable that the temperature setting will be lower than the maximum satisfactory temperature several times in the summer and higher than the maximum satisfactory temperature several times in the winter, which will lead to higher air conditioning loads in this time period. Therefore, the benefits of going from Case 2 to Case 3 are not very significant.
Comparing the winter and summer seasons, it can be seen that the gap between the outdoor temperature and the optimal temperature for the human body is larger in winter, so the power consumption of air conditioning loads is higher than that in summer, and the sum of the wind and solar power outputs in winter is smaller than that in summer, and the microgrid relies more on purchasing power from the main grid than that in summer, which makes the economic benefits of virtual energy storage more significant.
At the same time, the strategy also takes into account the wishes of the users; both the temperature regulation interval and the change in the situation are considered to maintain, as much as possible, the human body within an acceptable range. This also reflects the rationality of this strategy. Through prior questionnaire surveys or selecting different data in the database according to the type of application scenario, it is possible to calculate the thermal comfort temperature regulation range applicable to different scenarios, thus improving the flexibility and rationality of air conditioning load regulation.

6. Conclusions

This paper proposes a multi-objective optimal scheduling strategy for microgrids that takes into account the virtual energy storage characteristics of air conditioning and an adaptive thermal comfort model. The strategy can flexibly regulate the electricity consumption plan in terms of optimal user satisfaction, optimal economy, and optimal environmental protection according to the differences in users’ wishes at the same time, and the effectiveness of the proposed strategy is verified by specific examples. The following conclusions and outlooks can be drawn:
  • In this paper, by differentially considering thermal comfort models under different climatic geographies and personalized comfort grading based on user satisfaction, not only can we maximize the potential of air-conditioned buildings’ virtual energy storage, but also maximize the flexibility to satisfy different user wishes. The specific regulation grouping of users can also be further subdivided according to actual needs.
  • The regulation strategy constructed in this paper can be combined with a digital regulation platform of a power grid. For example, a virtual power plant has the ability of mass data information processing, which can be used as an interface for air conditioning loads to participate in demand-side response and provide data support and a control platform for differentiated consideration of thermal comfort, which can not only ensure the comfort of users through more data surveys, but also improve the economy and environmental protection of power grid operations.
  • The strategy constructed in this paper can effectively reduce part of the load peak and take into account the thermal comfort of users at the same time, but it only considers the virtual energy storage characteristics of air conditioning loads, and when combined with other types of virtual energy storage at the same time, it can further explore the potential of user-demand-side regulation.

Author Contributions

Conceptualization, R.L. and E.W.; methodology, M.W.; software, J.Z.; validation, L.L., C.F. and M.G.; formal analysis, R.L.; investigation, E.W.; resources, L.L.; data curation, F.C.; writing—original draft preparation, J.Z.; writing—review and editing, M.W.; visualization, M.G. and F.C.; supervision, R.L.; project administration, R.L.; funding acquisition, R.L. All authors have read and agreed to the published version of the manuscript.

Funding

This research was funded by the State Grid Corporation of China for science and technology projects (No. 52090R230002).

Data Availability Statement

The original contributions presented in the study are included in the article, further inquiries can be directed to the corresponding author.

Conflicts of Interest

Authors Ran Lv, Enqi Wu, Li Lan, Chen Fu, Mingxing Guo, Feier Chen were employed by the company Economic and Technological Research Institute, State Grid Shanghai Electric Power Company, Shanghai 200233, China. The remaining authors declare that the research was conducted in the absence of any commercial or financial relationships that could be construed as a potential conflict of interest.

References

  1. Zhu, R.; Liu, Z.; Jin, X.; Shi, Y. Inspiration of the UK ESO power supply sustainability measures under European energy crisis to China power system operator. Electr. Power 2023, 56, 177–184. [Google Scholar]
  2. Tushar, W.; Wang, T.; Lan, L.; Xu, Y.J.; Withanage, C.; Yuen, C.; Wood, K.L. Policy design for controlling set-point temperature of ACs in shared spaces of buildings. Energy Build. 2017, 134, 105–114. [Google Scholar] [CrossRef]
  3. Speake, A.; Wilson, E.J.H.; Zhou, Y.Y.; Horowitz, S. Component-level analysis of heating and cooling loads in the US residential building stock. Energy Build. 2023, 299, 113559. [Google Scholar] [CrossRef]
  4. Pachano, J.E.; Iglesias, M.F.V.; Saiz, J.C.; Bandera, C.F. Two-stage multi-step energy model calibration of the cooling systems of a large-space commercial building. Appl. Therm. Eng. 2023, 230, 120638. [Google Scholar] [CrossRef]
  5. Xie, K.; Hui, H.; Ding, Y. Review of modeling and control strategy of thermostatically controlled loads for virtual energy storage system. Prot. Contr. Mod. Power Syst. 2019, 423, 1–13. [Google Scholar] [CrossRef]
  6. Wang, Y.; Tong, Y.; Huang, M.; Yang, L.; Zhao, H. Research on virtual energy storage model of air conditioning loads based on demand response. Power Syst. Technol. 2017, 41, 394–401. [Google Scholar]
  7. Zhang, P.; Wang, M. Variation Characteristics Analysis and Short-Term Forecasting of Load Based on CEEMDAN. In Proceedings of the 2021 International Symposium on Electrical, Electronics and Information Engineering, Virtual Online, 19–21 February 2021. [Google Scholar]
  8. Song, M.; Gao, C.; Su, W.H. Modeling and controlling of air-conditioning load for demand response applications. Autom. Electr. Power Syst. 2016, 40, 158–167. [Google Scholar]
  9. Zhang, Y.; Li, N.; Ding, H.; Lu, M.; Yang, D.; Wang, Q. Air-conditioning load aggregation scheduling strategy based on user differentiated thermal comfort. Electr. Power Eng. Technol. 2023, 42, 133–140. [Google Scholar]
  10. Lv, G.; Ji, Y.; Zhang, Y.; Wang, W.; Zhang, J.; Chen, J.; Nie, Y. Optimization of building microgrid energy system based on virtual energy storage. Front. Energy. 2023, 10, 1053498. [Google Scholar] [CrossRef]
  11. Yuan, J.; Wang, N.; Zhao, H. Optimal strategy for domestic electric water heaters based on virtual energy storage characteristics. Desalin. Water Treat. 2019, 168, 357–365. [Google Scholar] [CrossRef]
  12. Pan, E.; Li, H.; Wang, Z.; Peng, D.; Zhao, L.; Fan, L.; Wang, Y.; Huang, F.; Ma, Y.; Liu, L. Operation optimization of integrated energy systems based on heat storage characteristics of heating network. Energy Sci. Eng. 2021, 9, 223–238. [Google Scholar] [CrossRef]
  13. Zhang, S.; Zhou, L.; Huang, H.; Shi, S.; Xiao, X. Optimization method of HVAC load group distribution network for integrated buildings taking into account occupancy effects. Power Syst. Technol. 2023; in press. [Google Scholar]
  14. Zhu, L.; Hong, J.; Yang, S.; Hu, Z.; Shao, Y.; Wu, C.; He, G. Online modeling of virtual energy storage for inverter air conditioning clusters in CDL-based demand response. Energy Rep. 2023, 9, 2024–2034. [Google Scholar] [CrossRef]
  15. Zhao, J.; Jin, Y.; Li, H.; Wang, J.; Li, W. Design and optimization of building intergated renewable energy system based on virtual energy storage. Acta Energiae Solaris Sinica. 2021, 42, 91–97. [Google Scholar]
  16. Cao, B. Research on the Impacts of Climate and Built Environment on Human Thermal. Ph.D. Thesis, Tsinghua University, Beijing, China, 2012. [Google Scholar]
  17. Zhu, C.; Chen, H.; Yin, J.; Zhang, X.; Zhou, L. Economic dispatching strategy for building CCHP coupling system based on virtual energy storage model. Power Demand Side Manag. 2021, 23, 52–57+100. [Google Scholar]
  18. Dai, R.; Zhao, B.; Zhang, X.; Yu, J.; Fan, B.; Liu, B. Joint virtual energy storage modeling with electric vehicle participation in energy local area smart grid. Complexity 2020, 2020, 3102729. [Google Scholar] [CrossRef]
  19. Dai, Q.; Yang, L.; Lin, Z.; Lan, Z.; Wang, Y.; Liu, Z. Multi-storage planning of integrated energy system considering functional area difference and virtual storage. Electr. Power Autom. Equip. 2021, 41, 182–190. [Google Scholar]
  20. Ge, S.; Liu, J.; Liu, H.; Wang, Y.; Zhao, C.; Sun, W. Economic Dispatch of Energy Station with Building Virtual Energy Storage in Demand Response Mechanism. Autom. Electr. Power Syst. 2020, 44, 35–43. [Google Scholar]
  21. Xue, S.; Che, Y.; He, W.; Zhao, Y.; Zhang, R. Control strategy of electric heating loads for reducing power shortage in power grid. Processes 2019, 7, 273. [Google Scholar] [CrossRef]
  22. Gabriele, F.; Marco, B.; Dimosthenis, T.; Vasiliki, K.; Georgios, G.; Antonis, P. Demand flexibility enabled by virtual energy storage to Improve renewable energy penetration. Energies 2020, 13, 5128. [Google Scholar] [CrossRef]
  23. Guo, X.; Gao, C.; Wang, C.; Li, L.; Liu, W. Peak adjustment strategy based on central air conditioning virtual energy storage model. Power Demand Side Manag. 2022, 24, 42–46. [Google Scholar]
  24. Lian, Z.; Cao, B.; Du, H.; Mou, D.; Lai, D.; Zhai, Y. Determination method of comfortable zone for indoor thermal environment. Build. Sci. 2022, 38, 9–15. [Google Scholar]
  25. ANSI/ASHRAE, ANSI/ASHRAE Standard 55-2023—Thermal Environmental Conditions for Human Occupancy, USA. 2023. Available online: https://www.ashrae.org/technical-resources/bookstore/standard-55-thermal-environmental-conditions-for-human-occupancy (accessed on 1 January 2024).
  26. Wang, J.J.; Wu, H.B.; Yang, S.H.; Bi, R.; Lu, J.H. Analysis of decision-making for air conditioning users based on the discrete choice model. Int. J. Electr. Power Energy Syst. 2021, 131, 106963. [Google Scholar] [CrossRef]
  27. Qi, N.; Cheng, L.; Xu, H.L.; Wang, Z.H.; Zhou, X.Y. Practical demand response potential evaluation of air-conditioning loads for aggregated customers. Energy Rep. 2020, 6, 71–78. [Google Scholar] [CrossRef]
  28. Yang, Y.; Song, L.T. Day ahead and real Time aggregate regulation of air conditioning load on demand response. J. Glob. Energy Interconnect. 2023, 6, 529–537. [Google Scholar]
  29. Berrouk, F.; Bouchekara, R.E.H.H.; Chaib, A.E.; Abido, M. A new multi-objective Jaya algorithm for solving the optimal power flow problem. J. Electr. Syst. 2018, 14, 165–181. [Google Scholar]
  30. Wang, J.; Bian, Y.; Xu, Q.; Kong, X. Distributionally robust optimal dispatching of microgrid considering risk and carbon trading mechanism. High Volt. Eng. 2023; in press. [Google Scholar]
  31. Wang, Y.; Hu, C.; Wu, B.; Zhang, J.; Zi, Z.; Kang, L. Matching Characteristic Research of Building Renewable Energy System Based on Virtual Energy Storage of Air Conditioning Load. Energies 2020, 13, 1269. [Google Scholar] [CrossRef]
  32. Lei, X.; Tang, W.Z.; Li, Z.Y.; He, J.Y.; Liu, Q.Y. Distribution Network Expansion Planning Considering Optimal Operation of Regional Integrated Energy System. Power Syst. Technol. 2018, 42, 3459–3468. [Google Scholar]
  33. Sun, K.; Chen, W.; Chen, J.; Yin, W. A resilience enhancement strategy for multi-microgrid in extreme scenarios based on electric vehicles. Power Syst. Prot. Control 2023, 51, 53–65. [Google Scholar]
  34. Zeng, B.; Zhang, J.H.; Yang, X.; Wang, J.H.; Dong, J.; Zhang, Y.Y. Integrated planning for transition to low-carbon distribution system with renewable energy generation and demand response. IEEE Trans. Power Syst. 2014, 29, 1153–1165. [Google Scholar] [CrossRef]
  35. Li, Z.K.; Li, Y.M.; Luo, X.; Wang, W.; Wei, Y.J. Optimal operation of microgrid in the park considering carbon trading and the proportion of green electricity. Electr. Meas. Instrum. 2022; in press. [Google Scholar]
  36. Fan, S.C.; Huang, X.M.; Zhang, Y.J.; Huang, G.Q.; Yang, J.X.; Li, Q.H. Modeling of expansion planning for distribution transformer considering orderly charging. Autom. Electr. Power Syst. 2021, 45, 62–70. [Google Scholar]
  37. Jin, G.; Pan, D.; Chen, Q.; Shi, C.; Li, G. Fuzzy Random Day-Ahead Optimal Dispatch of DC Distribution Network Considering the Uncertainty of Source-Load. Trans. China Electrotech. Soc. 2021, 36, 4517–4528. [Google Scholar]
  38. Chen, Y. Thermal Comfort Characteristics and Energy-Saving Operation Modes of Residential Buildings in Hangzhou Based on Personal Comfort Systems. Master’s Thesis, Chongqing University, Chongqing, China, 2021. [Google Scholar]
  39. Chen, Z. Study on Energy Consumption and Load Characteristics of Residential Buildings in Typical Cities in Hot Summer and Cold Winter Areas. Master’s Thesis, Zhejiang University, Hangzhou, China, 2022. [Google Scholar]
  40. Du, H.; Lian, Z.; Lai, D.Y.; Liu, W.; Lin, D.; Zhai, Y.; Cao, B.; Zhang, Y.; Zhou, X.; Wang, Z.; et al. Method of determining acceptable air temperature thresholds in Chinese HVAC buildings based on a data-driven model. Energy Build. 2021, 241, 110920. [Google Scholar] [CrossRef]
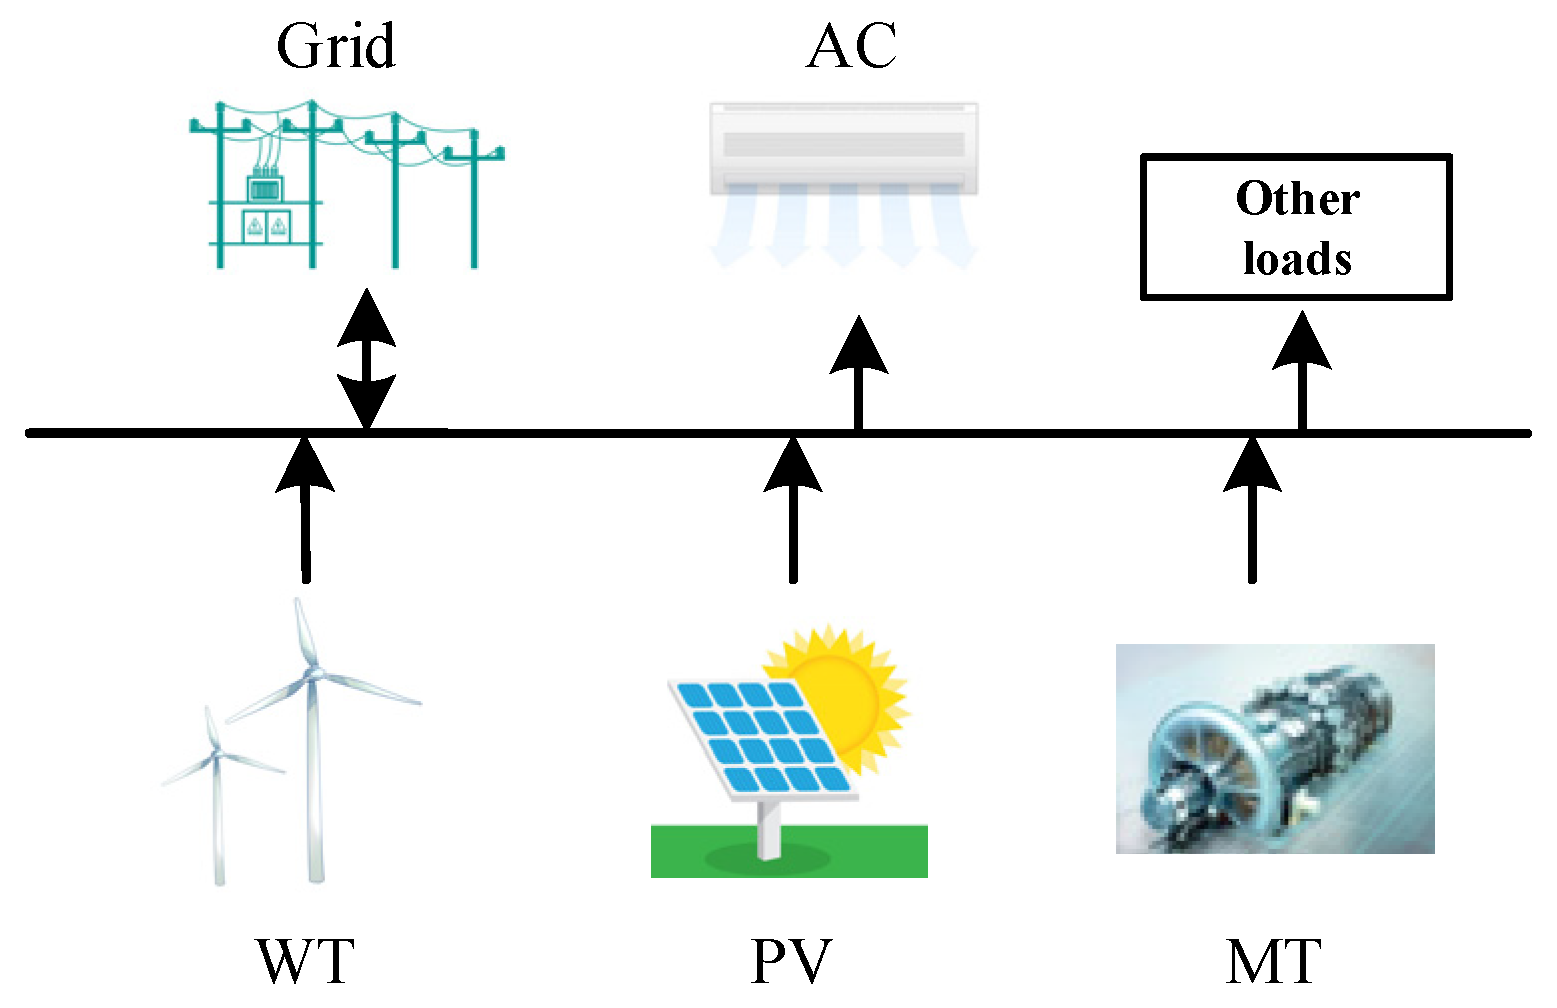
Figure 1. Microgrid structure.
Energies 17 02670 g001
Figure 2. MOJAYA algorithm flowchart.
Energies 17 02670 g002
Figure 3. Peak-flat-valley electricity price.
Energies 17 02670 g003
Figure 4. Wind power and photovoltaic power output.
Energies 17 02670 g004
Figure 5. Basic load and air conditioning load.
Energies 17 02670 g005
Table 1. Operation costs.
Type of Energy SourceOperation Costs (Yuan/kWh)
wind power 0.056
photovoltaic power 0.08
micro gas turbines0.7
Table 2. Carbon emission coefficient.
TypeCarbon Emission Coefficient (kg/kWh)
λ MT 0.458
λ grid 0.92
Table 3. Installed capacity.
Type of Energy SourceInstalled Capacity (kW)
micro gas turbines350
wind power192
photovoltaic power390
Table 4. Logistic regression model satisfaction prediction results.
SeasonBuilding TypeThermal Comfort Satisfaction
SummerOffice Y = 100 1 + e 9.697 0.58 SET + e 17.118 + 0.55 SET
SummerResidence Y = 100 1 + e 9.527 0.538 SET + e 16.953 + 0.538 SET
WinterOffice Y = 100 1 + e 8.466 0.499 SET + e 9.515 + 0.137 SET
WinterResidence Y = 100 1 + e 4.893 0.356 SET + e 7.446 + 0.209 SET
Table 5. Calculation results of thermal comfort in winter and summer seasons.
SeasonSatisfactionTemperature Range
SummerMaximum satisfaction24.6
Summer90%21.9–27.3
Summer80%20.4–28.9
WinterMaximum satisfaction22.8
Winter90%22–23.6
Winter80%18–28.9
Table 6. Comparison of various indicators in different situations.
SeasonMicrogrid Revenue
(Yuan)
Carbon Emissions
(kg)
User’s Electricity Purchase Cost (Yuan)
Summer Case 11321.35967.36970.3
Summer Case 21550.75593.76561.3
Summer Case 31621.75484.66479.8
Winter Case 11062.76395.37386.8
Winter Case 21306.86225.16983.4
Winter Case 31401.76224.96976.4
Disclaimer/Publisher’s Note: The statements, opinions and data contained in all publications are solely those of the individual author(s) and contributor(s) and not of MDPI and/or the editor(s). MDPI and/or the editor(s) disclaim responsibility for any injury to people or property resulting from any ideas, methods, instructions or products referred to in the content.