1. Introduction
The liquefied natural gas (LNG) supply chain contains oil and gas exploration, gas treatment, liquefaction, shipping, regasification, and marketing distribution. The natural gas (NG) liquefaction process plays a significant role in transporting natural gas over long distances from different regions.
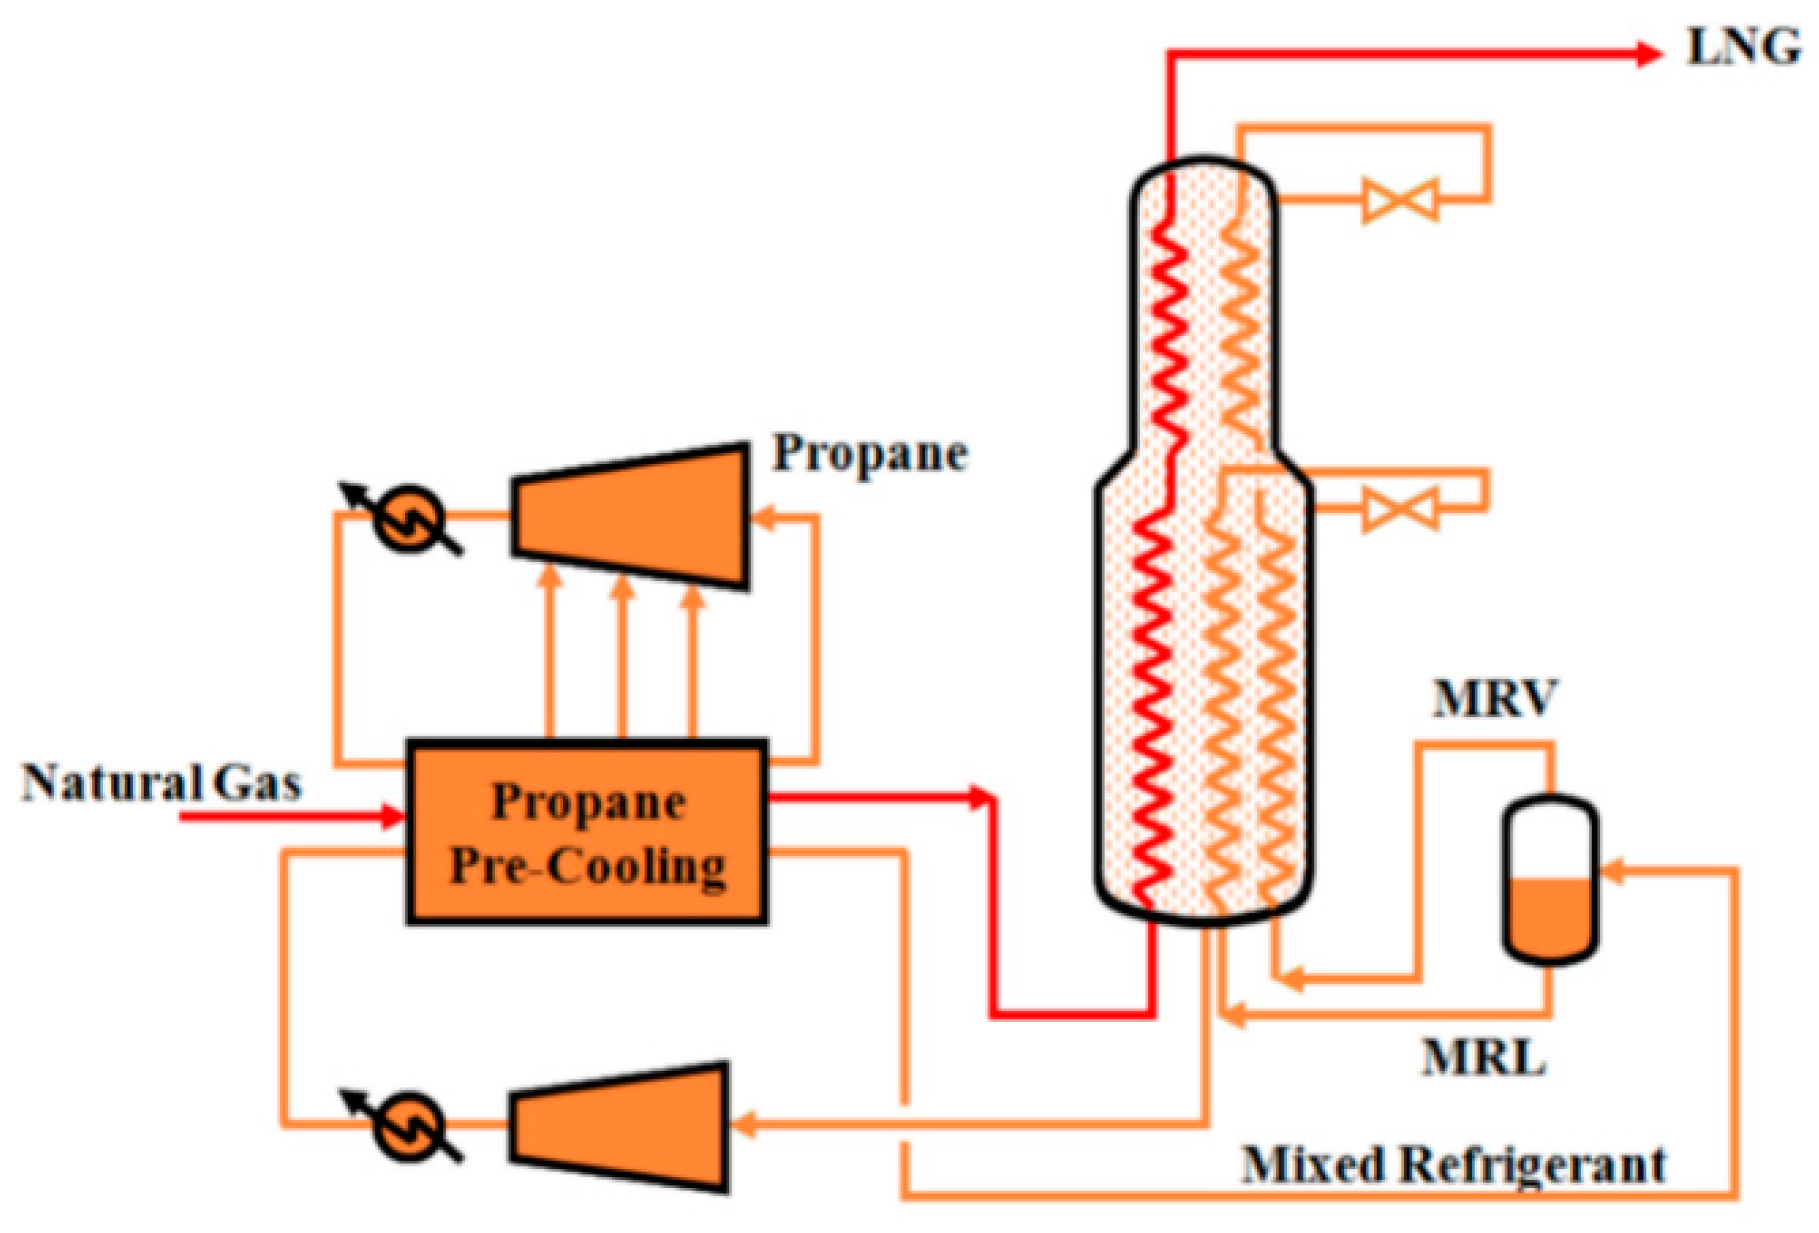
The LNG liquefaction system in this report is the propane precooled mixed refrigerant process (C3MR), which involves precooling of natural gas using a propane refrigeration loop followed by subcooling and liquefaction in the second loop using a mixed refrigerant composed of methane, ethane, and propane, as shown in
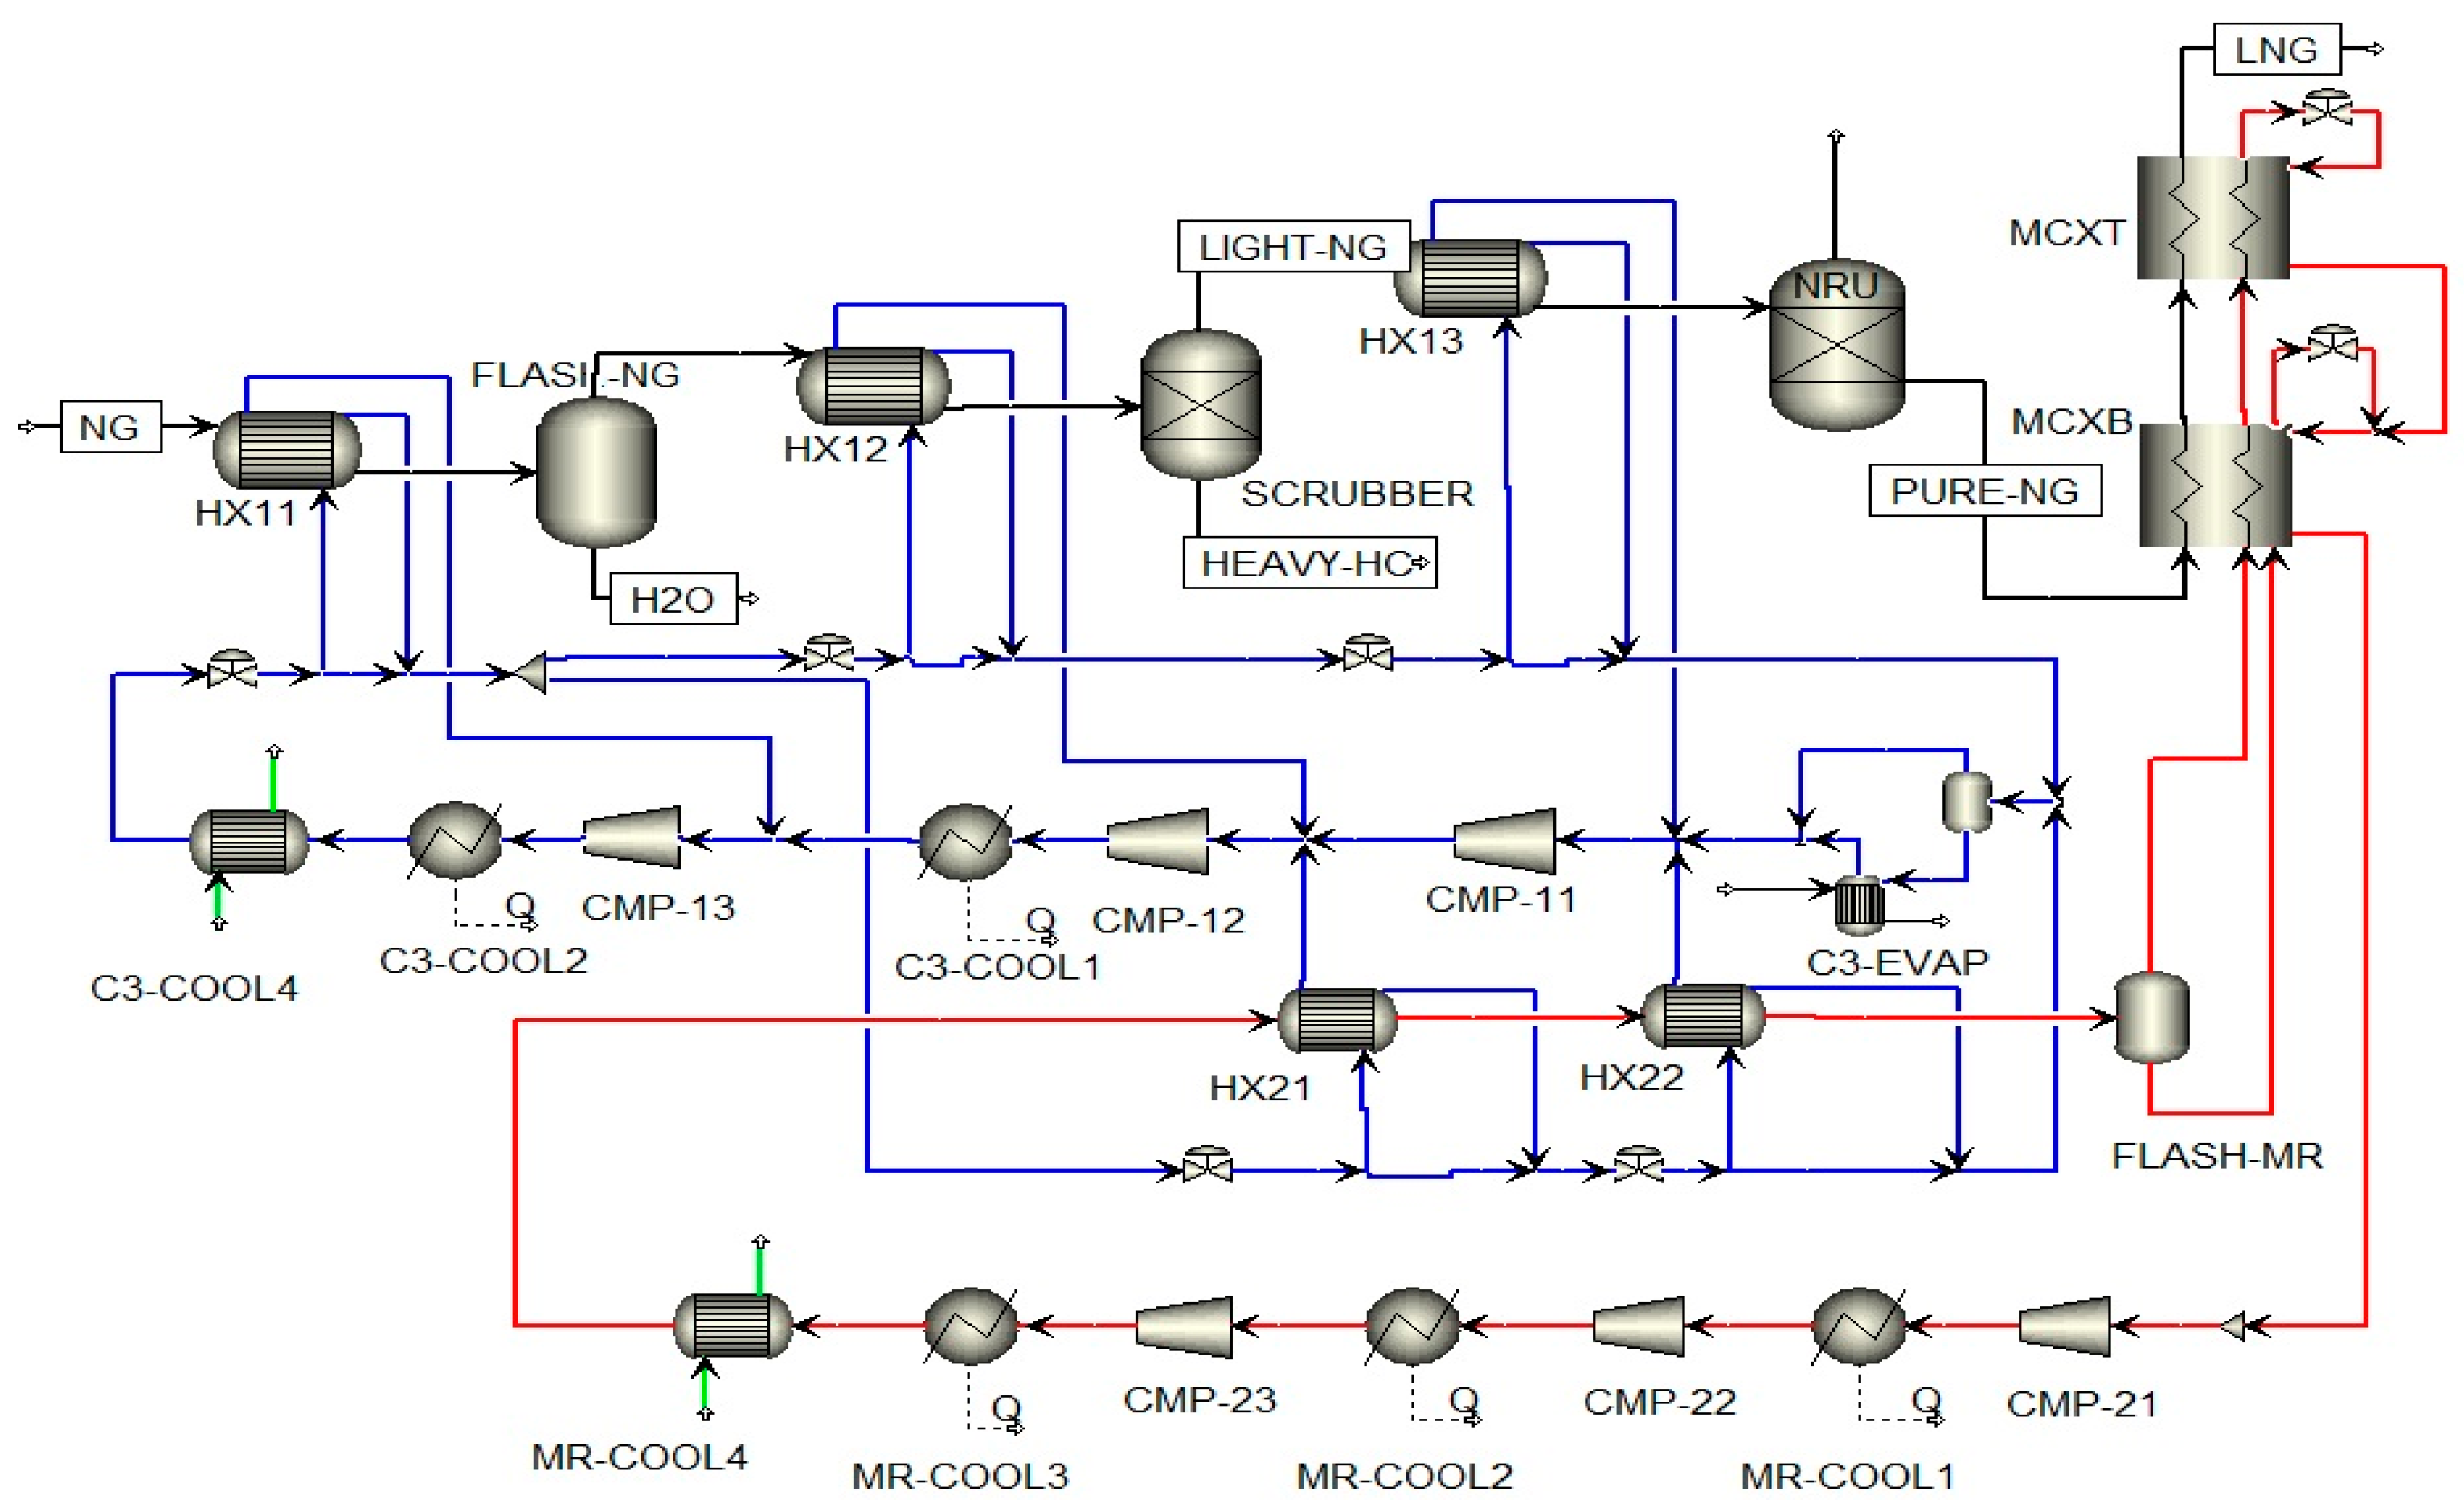
Figure 1. The modeling of a typical propane/mixed refrigerant (C3MR) LNG is shown in
Figure 2 [
1,
2,
3,
4,
5,
6,
7,
8,
9,
10,
11,
12,
13,
14,
15].
The Allam–Fetvedt cycle (AFC) is an oxy-combustion, carbon-neutral, high-efficiency (approximate 59%) super-critical CO
2 Brayton power cycle operated at elevated temperatures (up to 1050 °C) and pressures (between 30 and 300 bar). The exhaust CO
2 is captured during the process and recycled as system working fluid. The excess high-pressure CO
2 is sent to the pipelines for sequestration or utilization [
16,
17,
18,
19,
20,
21].
Liquified natural gas (LNG) plants use natural gas (NG)-powered compressors to run the refrigeration train, which emits methane, CO
2, nitrous oxide (N
2O), nitrogen oxides (NOx), and PM (soot). It is worth noting that SOx emissions are usually not an issue for the LNG plants since natural gas (sales gas) feed has been desulfurized (S content < 5 mg/m
3) [
22,
23,
24,
25,
26,
27,
28,
29,
30,
31,
32,
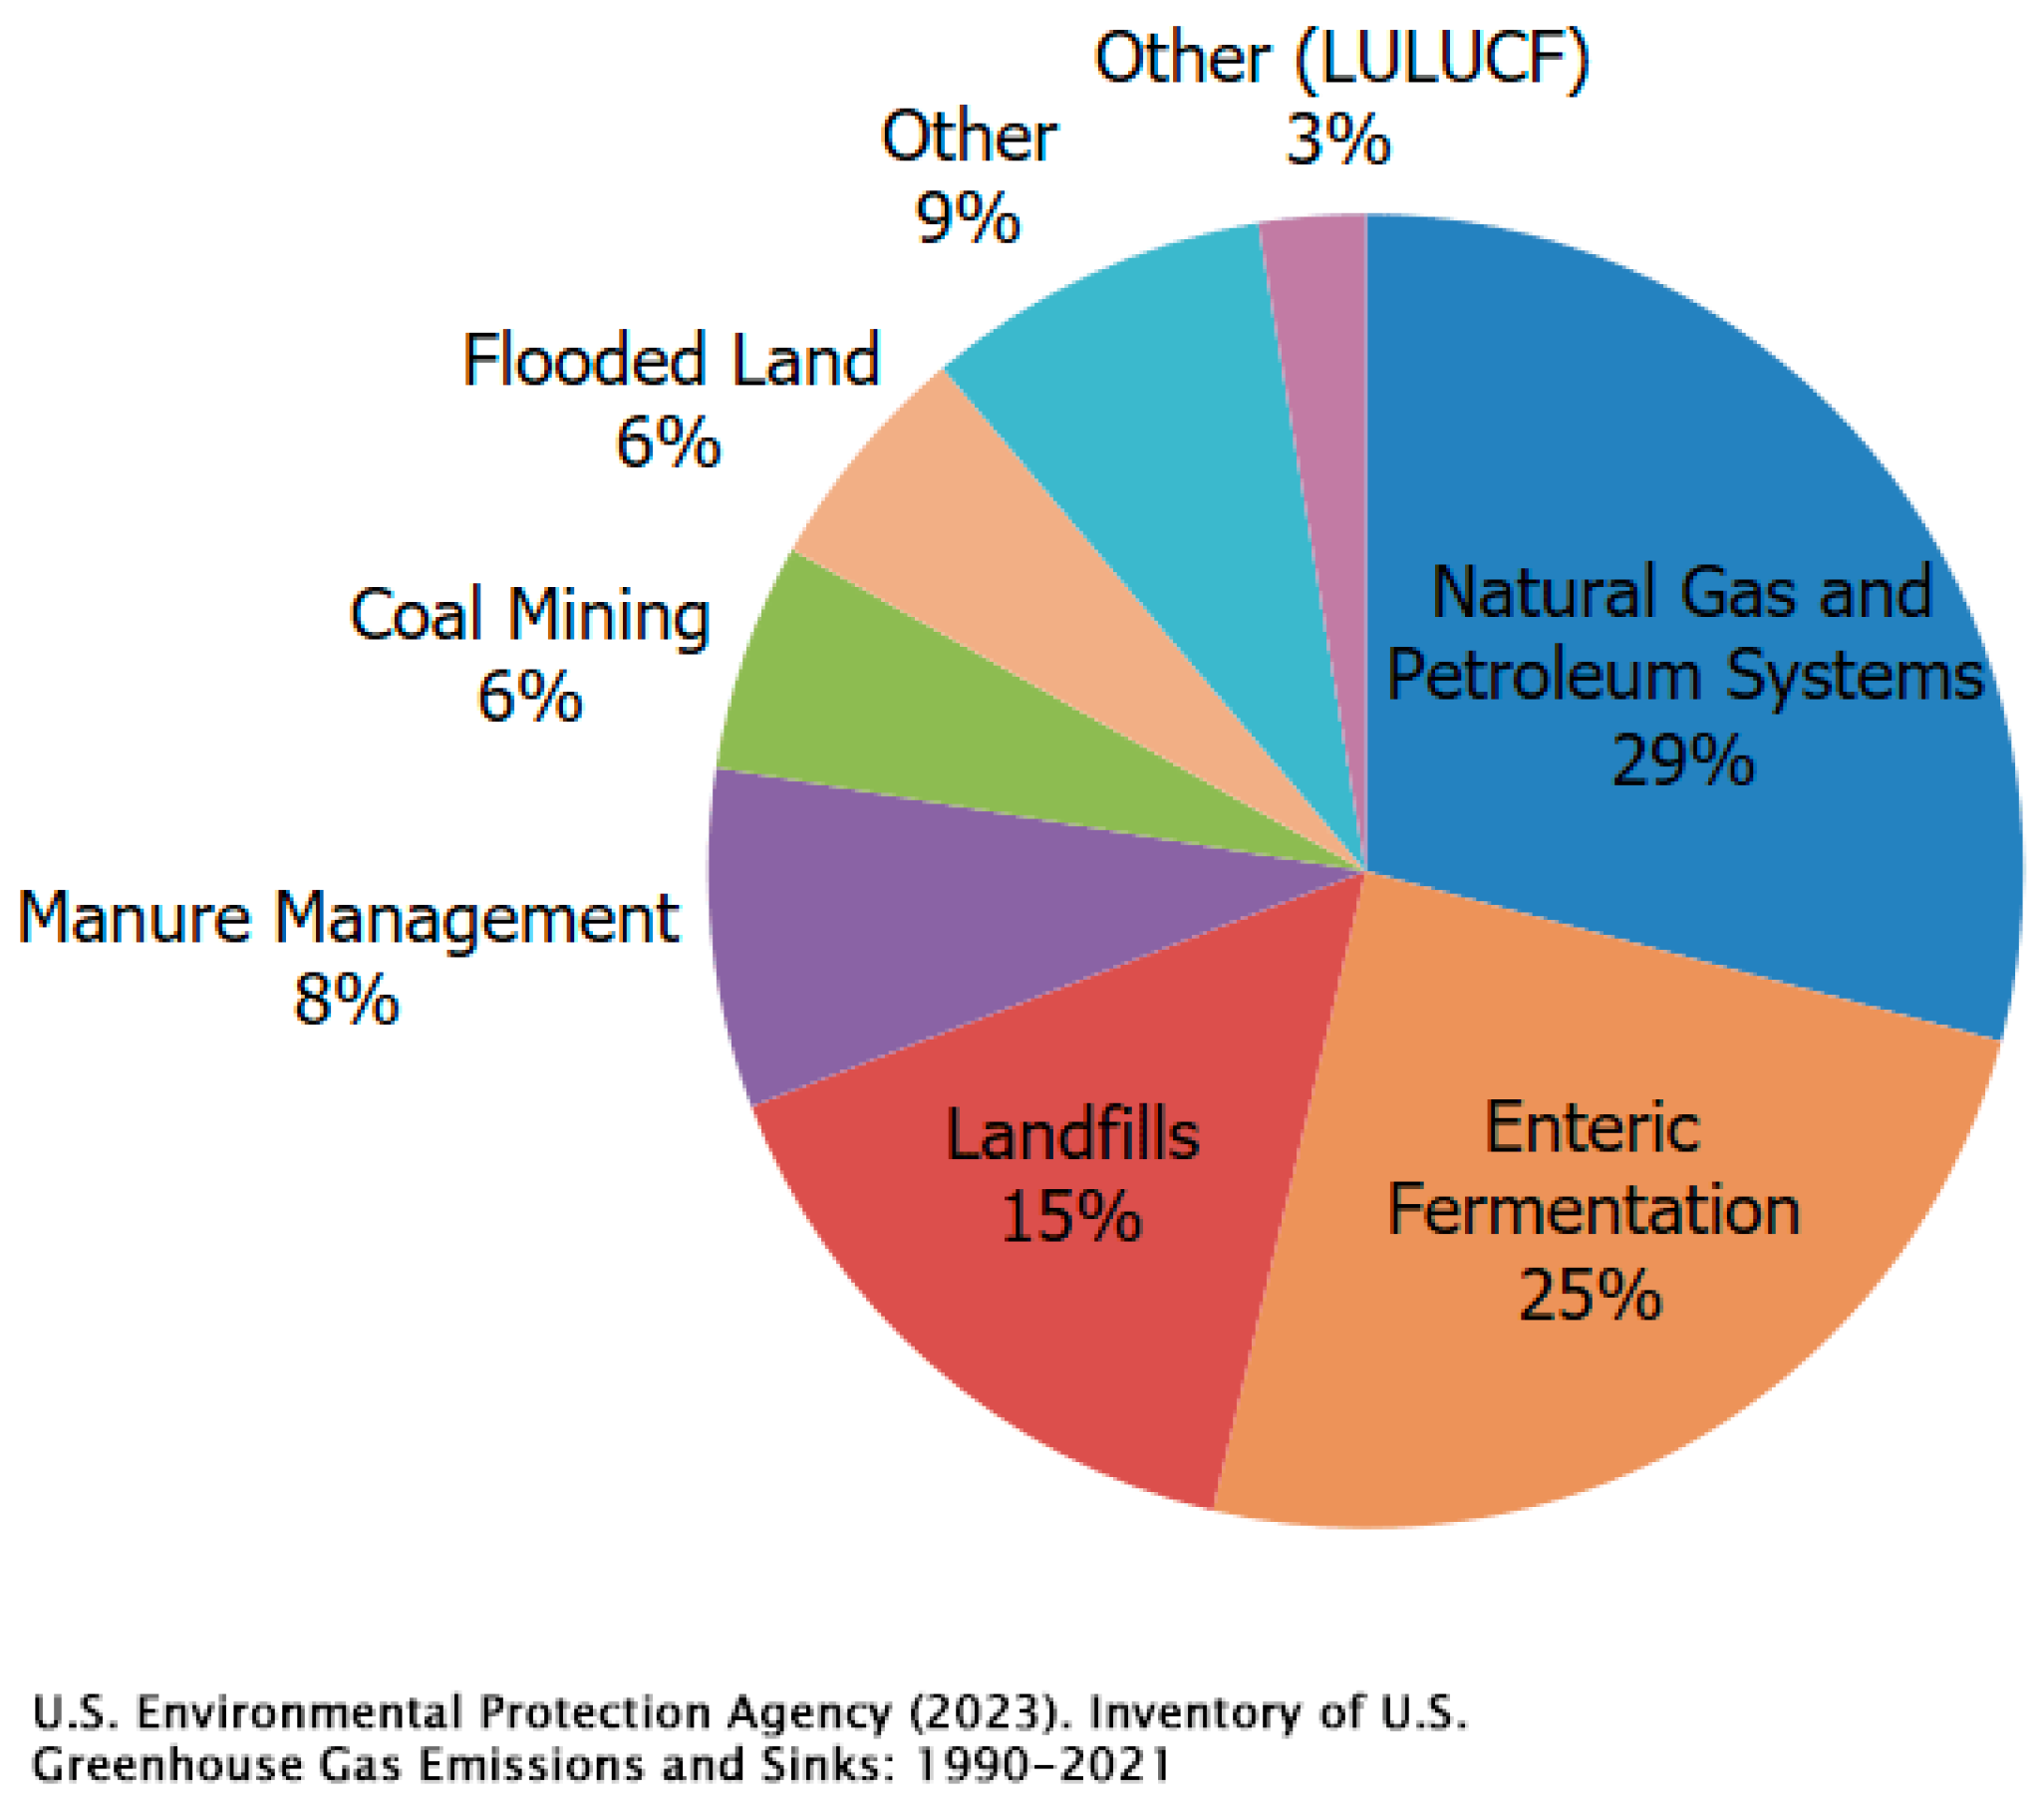
33]. Among the above-mentioned emissions from the LNG facilities, methane emissions have gained most attention recently. Methane emissions (from various sources) contributed to about one-third of the current anthropogenic temperature rise and undermine the claim that natural gas is a clean energy. As can be seen in
Figure 3, natural gas processing and petroleum production contribute significantly to US methane emissions, so the system and methods to reduce methane emissions from the LNG operations is a timely effort. Methane emissions include fugitive, vent, and flare emissions from natural gas-fired engines/turbines, storage tanks, and piping systems [
22,
29,
33]. LNG companies plan to cut greenhouse gas (GHG) emissions and electrification is the top priority for achieving decarbonization. Electric motors are much more efficient (>95%) than the internal combustion engine (ICE, <50%). They are also lightweight, smaller, can provide instant and consistent torque, and do not emit carbon into the atmosphere. For these reasons, electric motors are replacing internal combustion in transportation and industry. Electrification has become an important tool to decarbonize NG liquefaction operations as it may increase the reliability of the equipment in addition to reducing methane emissions [
4,
7,
15,
33]. Companies intend to electrify LNG operations to minimize methane emissions and potentially CO
2 emissions if the carbon intensity of electricity is below 600 metric tons of carbon dioxide equivalent per gigawatt hour (t CO
2e/GWh) [
25,
26]. The carbon intensity qualifier for electricity is important as the power generation can come from either renewable wind, solar, biogas, or carbon-free nuclear, low-carbon natural gas, or even carbon-intensive coal-fired power plants. In other words, the benefit of electrification actually depends on the carbon intensity of the mix of electrical power sources. However, without considering methane emissions, the availability of cheap natural gas dictates the choice of compressors, i.e., whether the use of electric compressors or natural gas-powered compressors is economically more favorable. One of the novel features of this work is to replace natural gas-powered compressors in the LNG operations with electric compressors powered by the carbon-neutral AFC.
Greenhouse gas emissions in natural gas liquefaction operations come from the combustion of natural gas in heaters, flares, and most importantly, engines/turbine-driven compressors. Environmental performance was compared in terms of GHG emission reduction. Economic performance was evaluated in terms of capital investment, operating cost, payback period, net present value, and internal rate of return with a 45Q tax credit.
No prior work on such an integration between an LNG facility and the Allam–Fetvedt cycle (AFC) was found in the literature. The reason is that high-efficiency, carbon-neutral AFC power generation is fairly new. The demonstration plant in La Porte, TX, achieved its first fire in 2018 and connected to the Texas grid in 2021. This paper is believed to be the first of its kind to show the benefits of such an integration. This paper analyzes not only the technical/economic side to show the improvement in energy efficiencies and profitability but also the benefits of reducing greenhouse gas emissions (especially methane).
3. Results and Discussion
3.1. LNG Plant Operating Data (Base Case)
The base case is a standalone LNG plant and a standalone AFC plant with its associated air separation unit (ASU).
Table 1 gives the component flow rates of the natural gas feed stream, a typical gas sold in the US that is free of contaminants such as H
2S and CO
2.
Table 2 provides the composition of the mixed refrigerant (MR) stream typical for the Air Products AP-C3MR process. The process conditions are based on the ones described by Ravavarapu et al. [
10]. The specifications used for propane/MR cycle heat exchangers and compressors are listed in
Table 3. The stream data including temperature, pressure, flow, and enthalpy are given in
Table 4.
3.2. Precooling of Natural Gas Feed with Cold Nitrogen Stream from ASU
The prior work from this group (Shetty, 2020) incorporated a cold nitrogen stream from the air separation unit (ASU) associated with the Allam power plant, making use of its available cold duty for the precooling of the natural gas feed in the propane precooling cycle of the LNG plant. Different types of scenarios were modeled using Aspen Plus and analyzed based on heaty duty, compressor work, and cost.
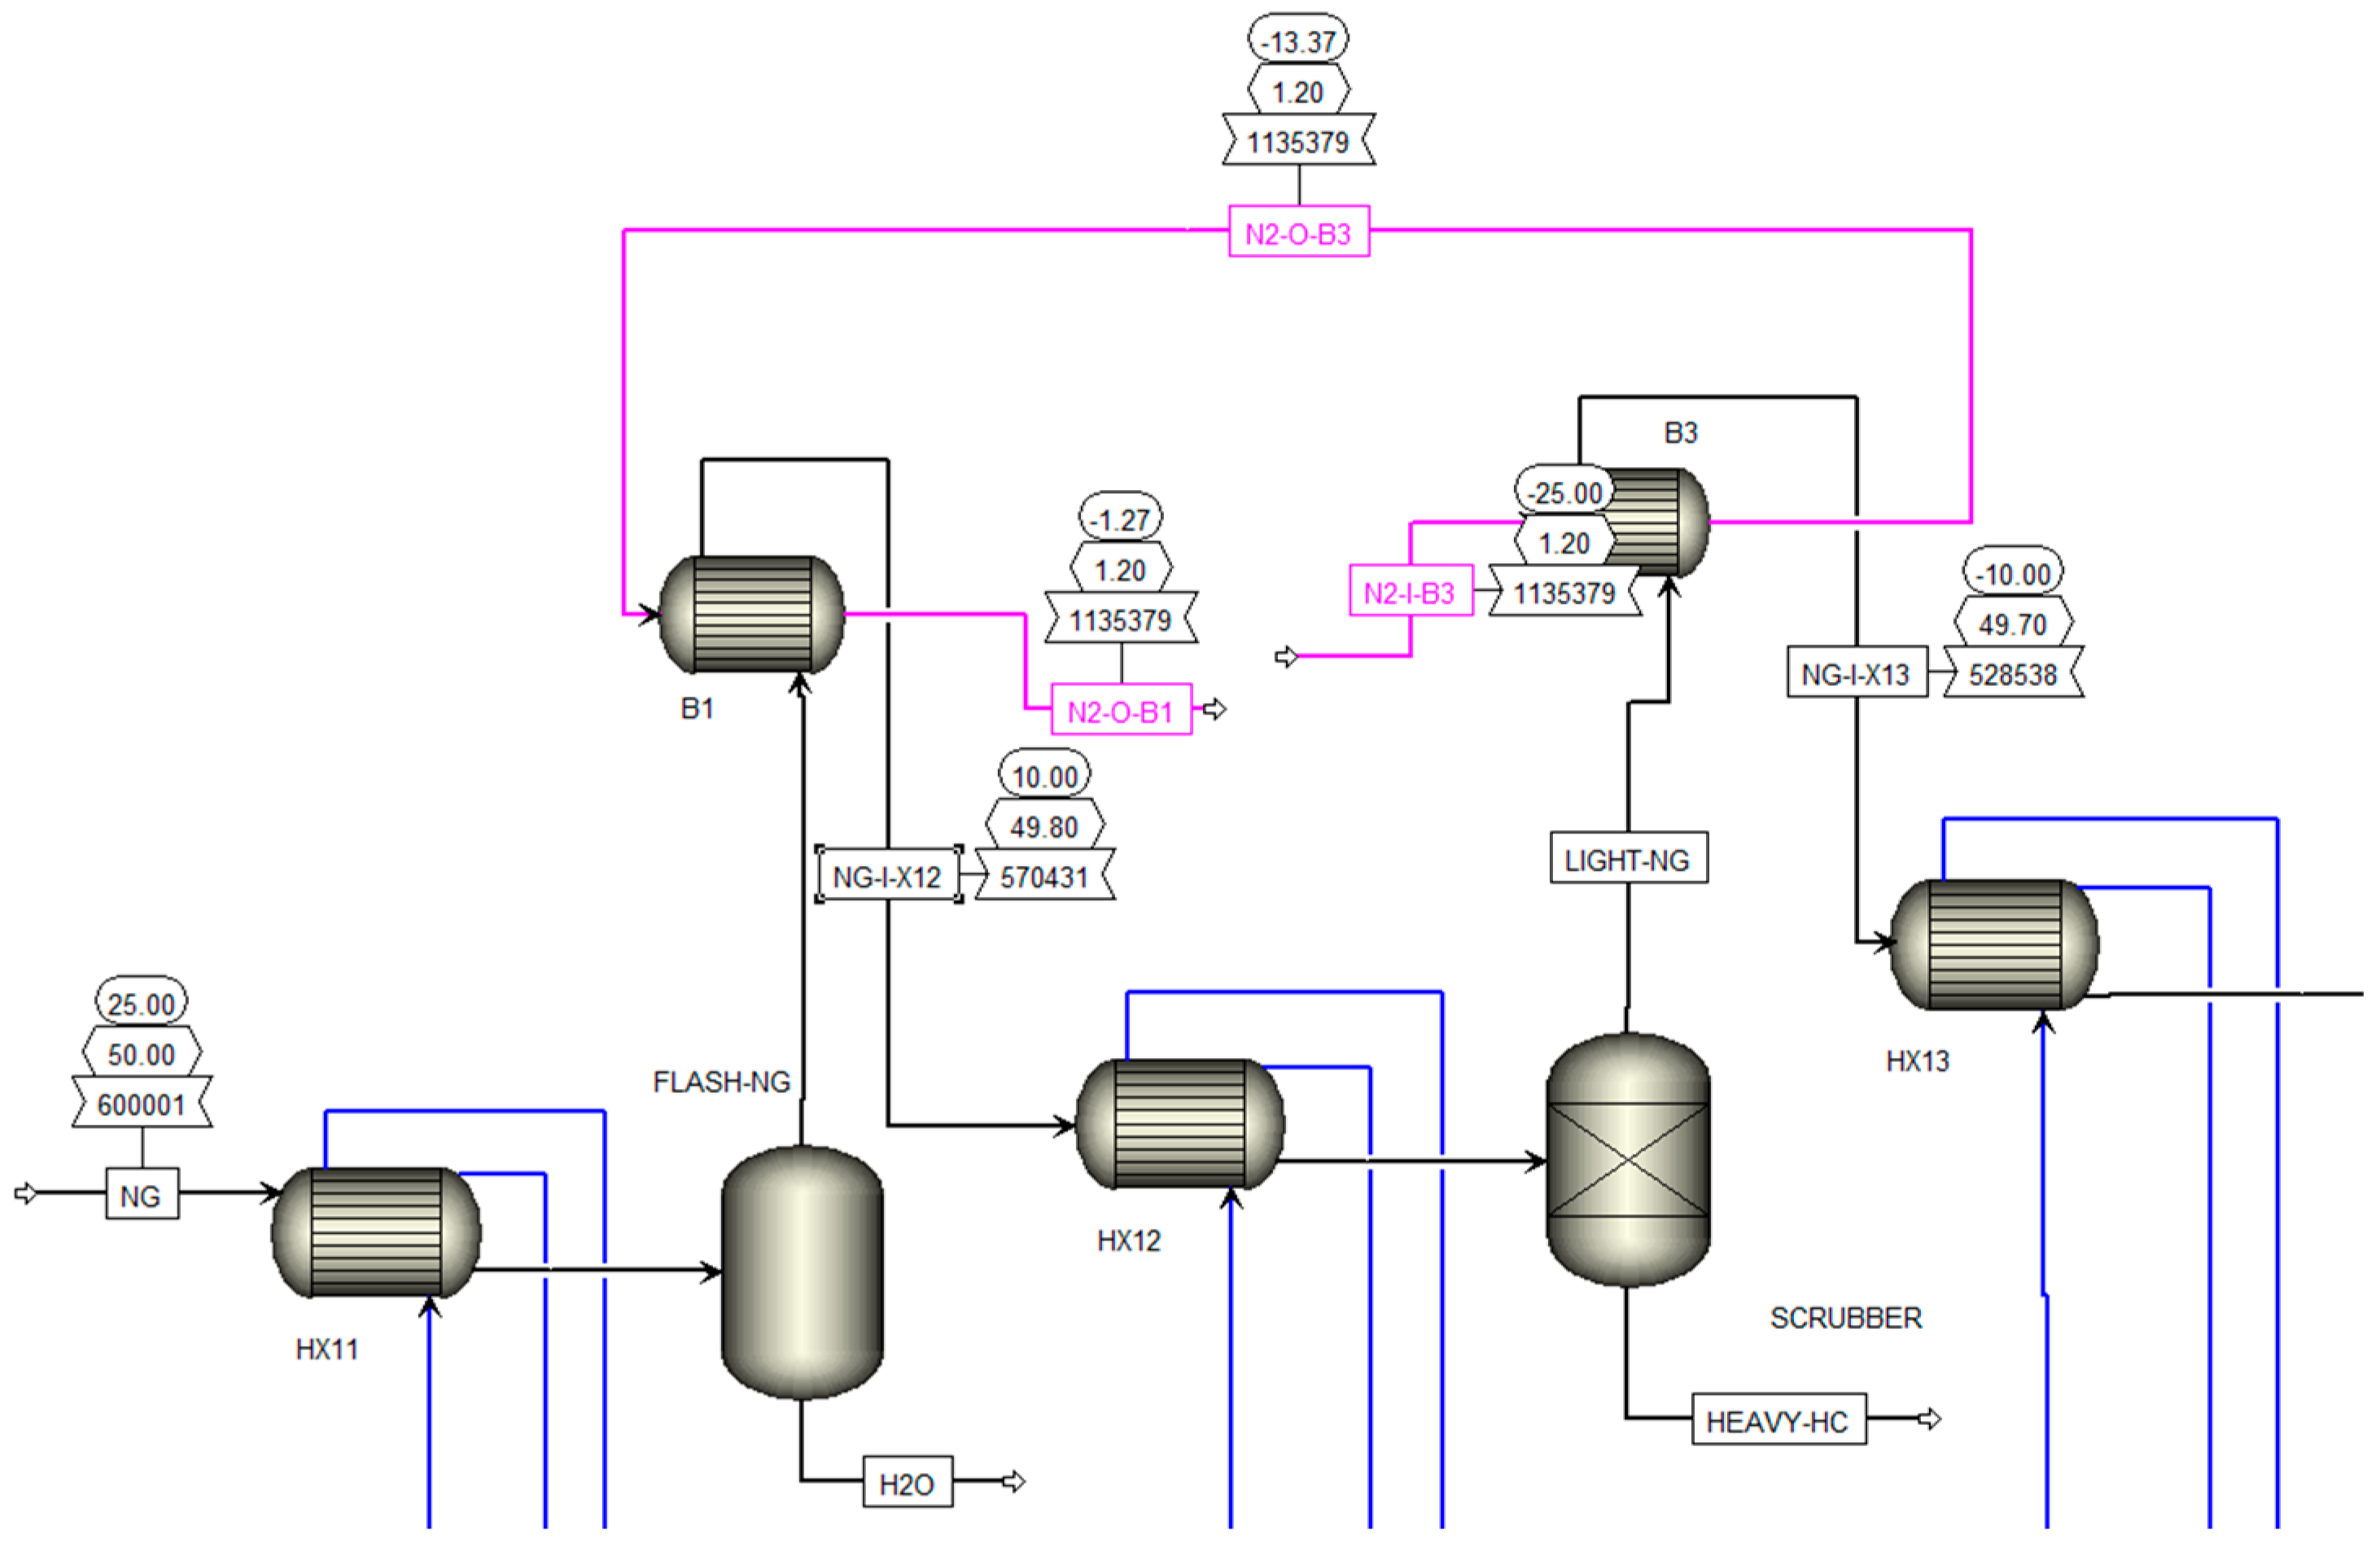
From the base case, a two-stage cooling chain including booster heat exchangers B1 and B3 is added for enhanced utilization of the cold N2 energy as shown in
Figure 5.
The scenario of integrating cold N
2 stream from the ASU with an LNG plant is compared to the base case with no N
2 precooling. The booster heat exchanger duties are given in
Table 5. The total compressor power inputs required to operate the C3 and MR cycles are presented in
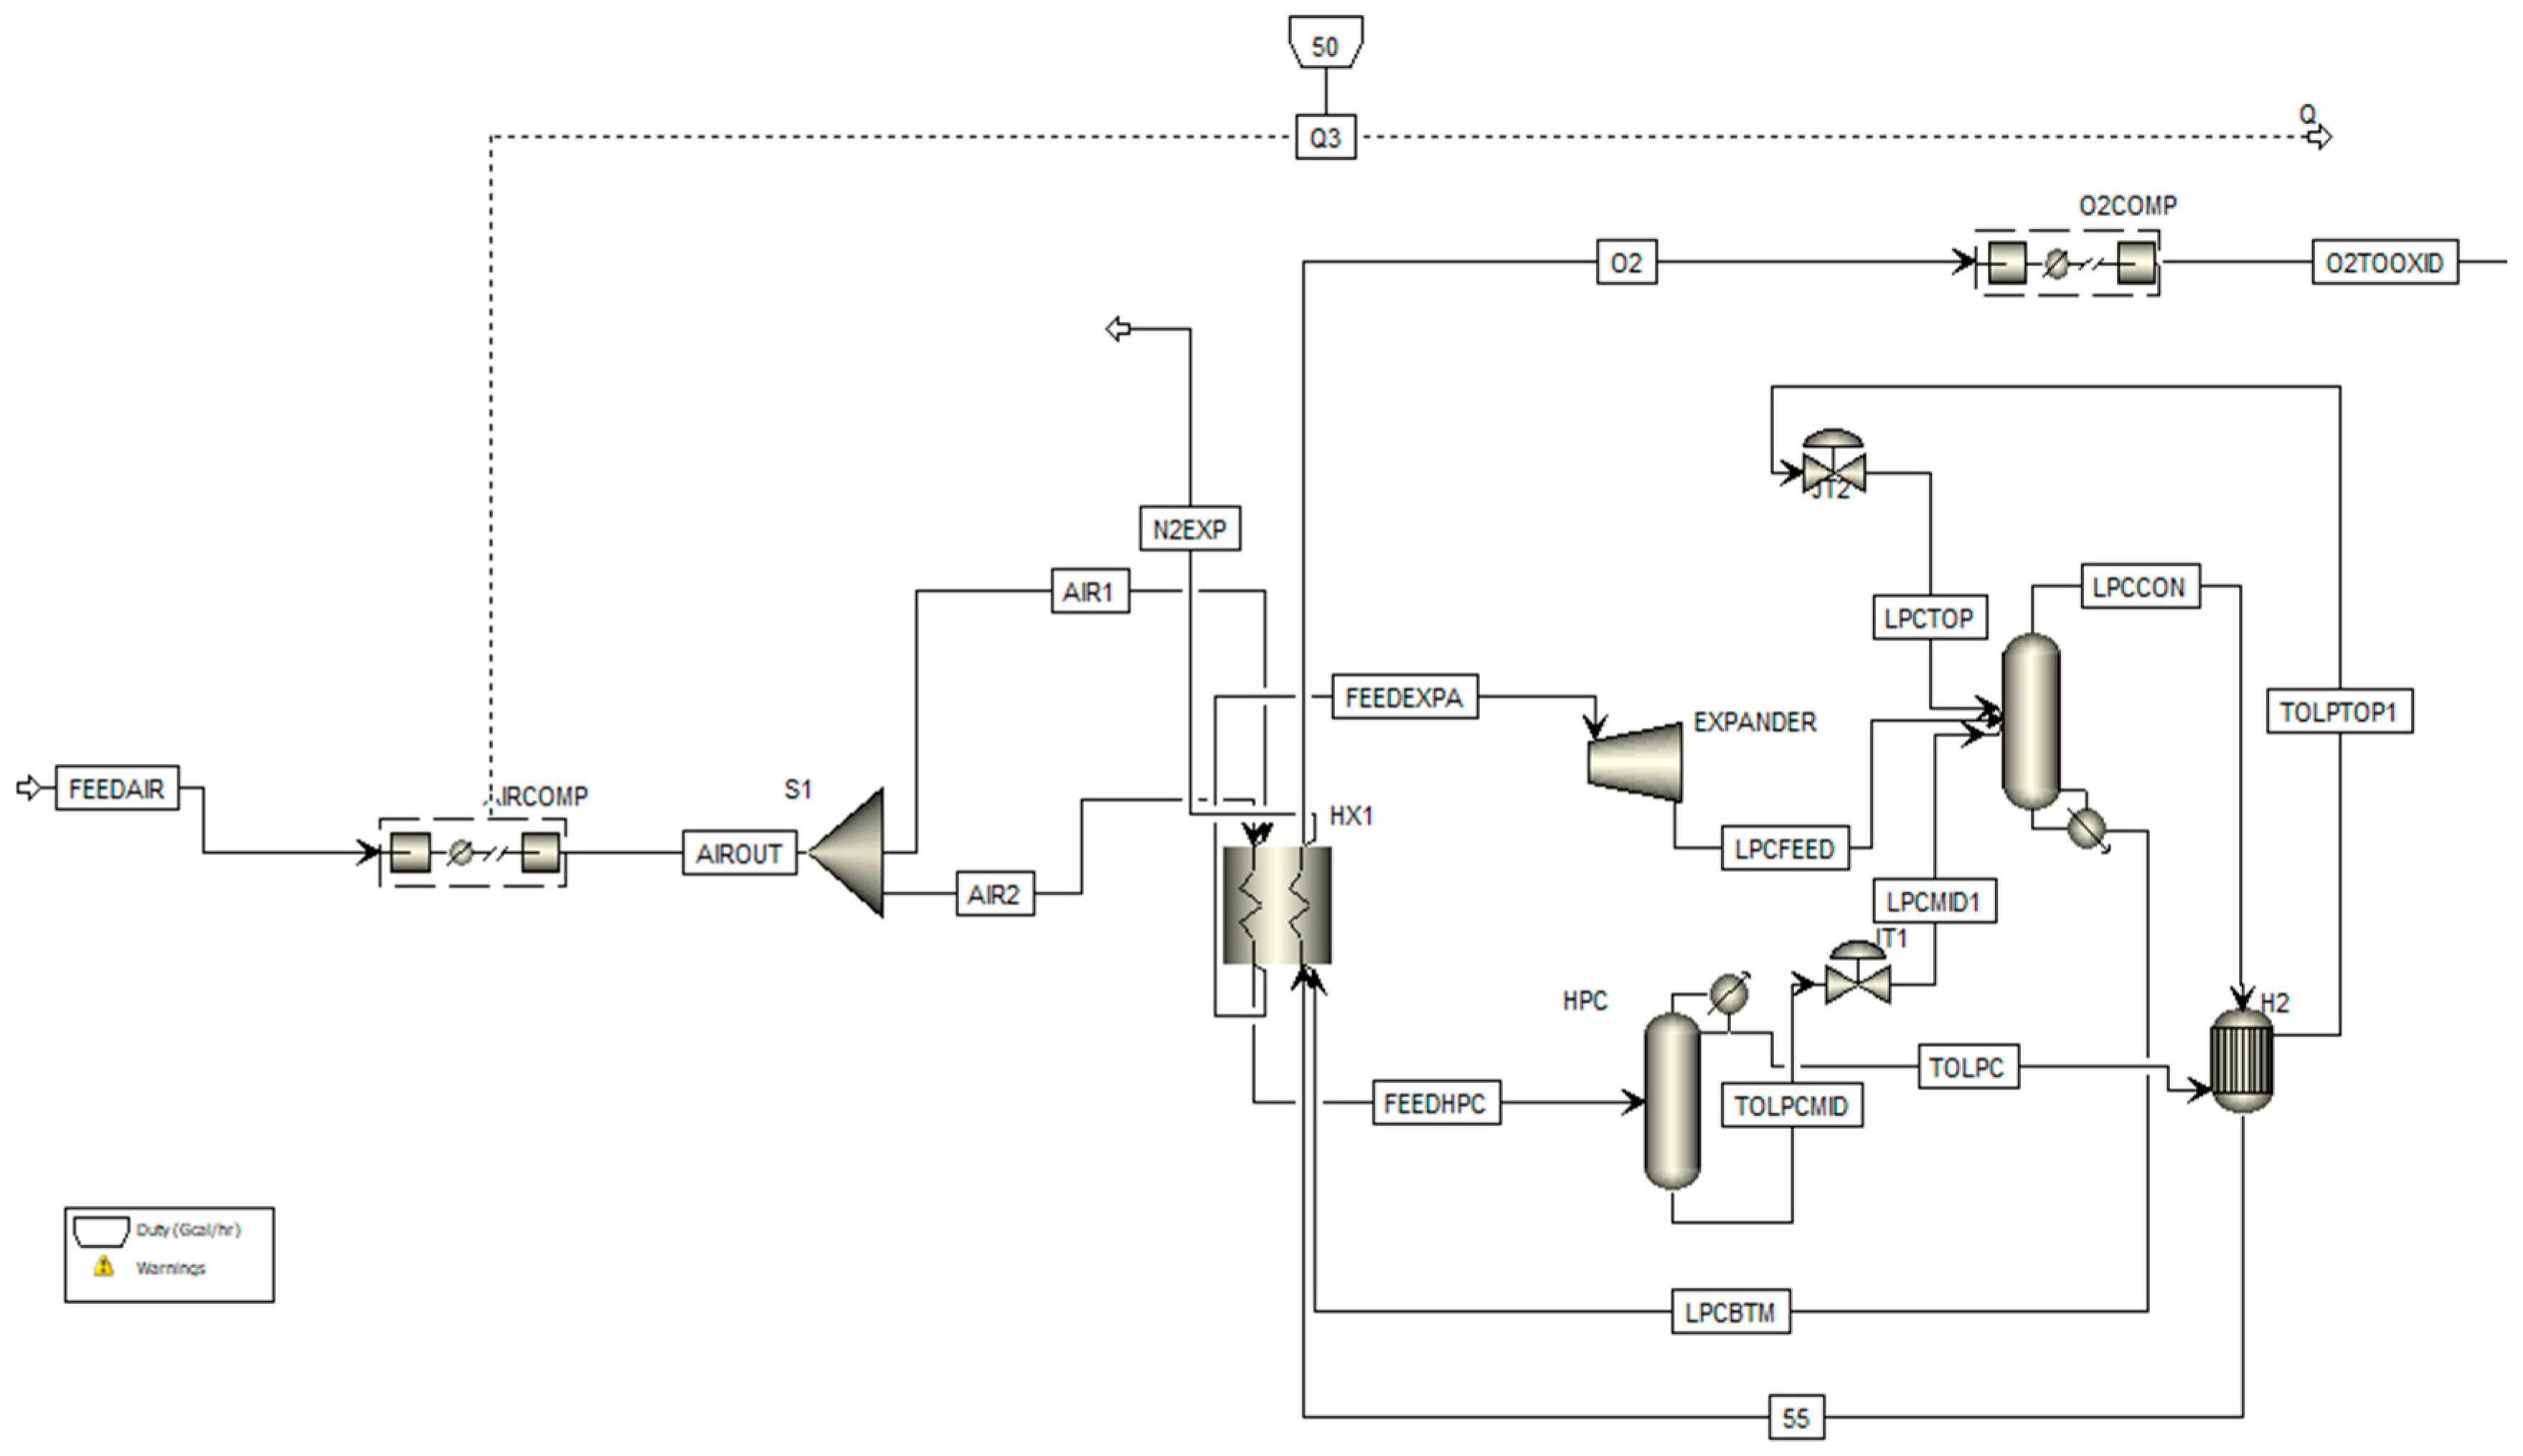
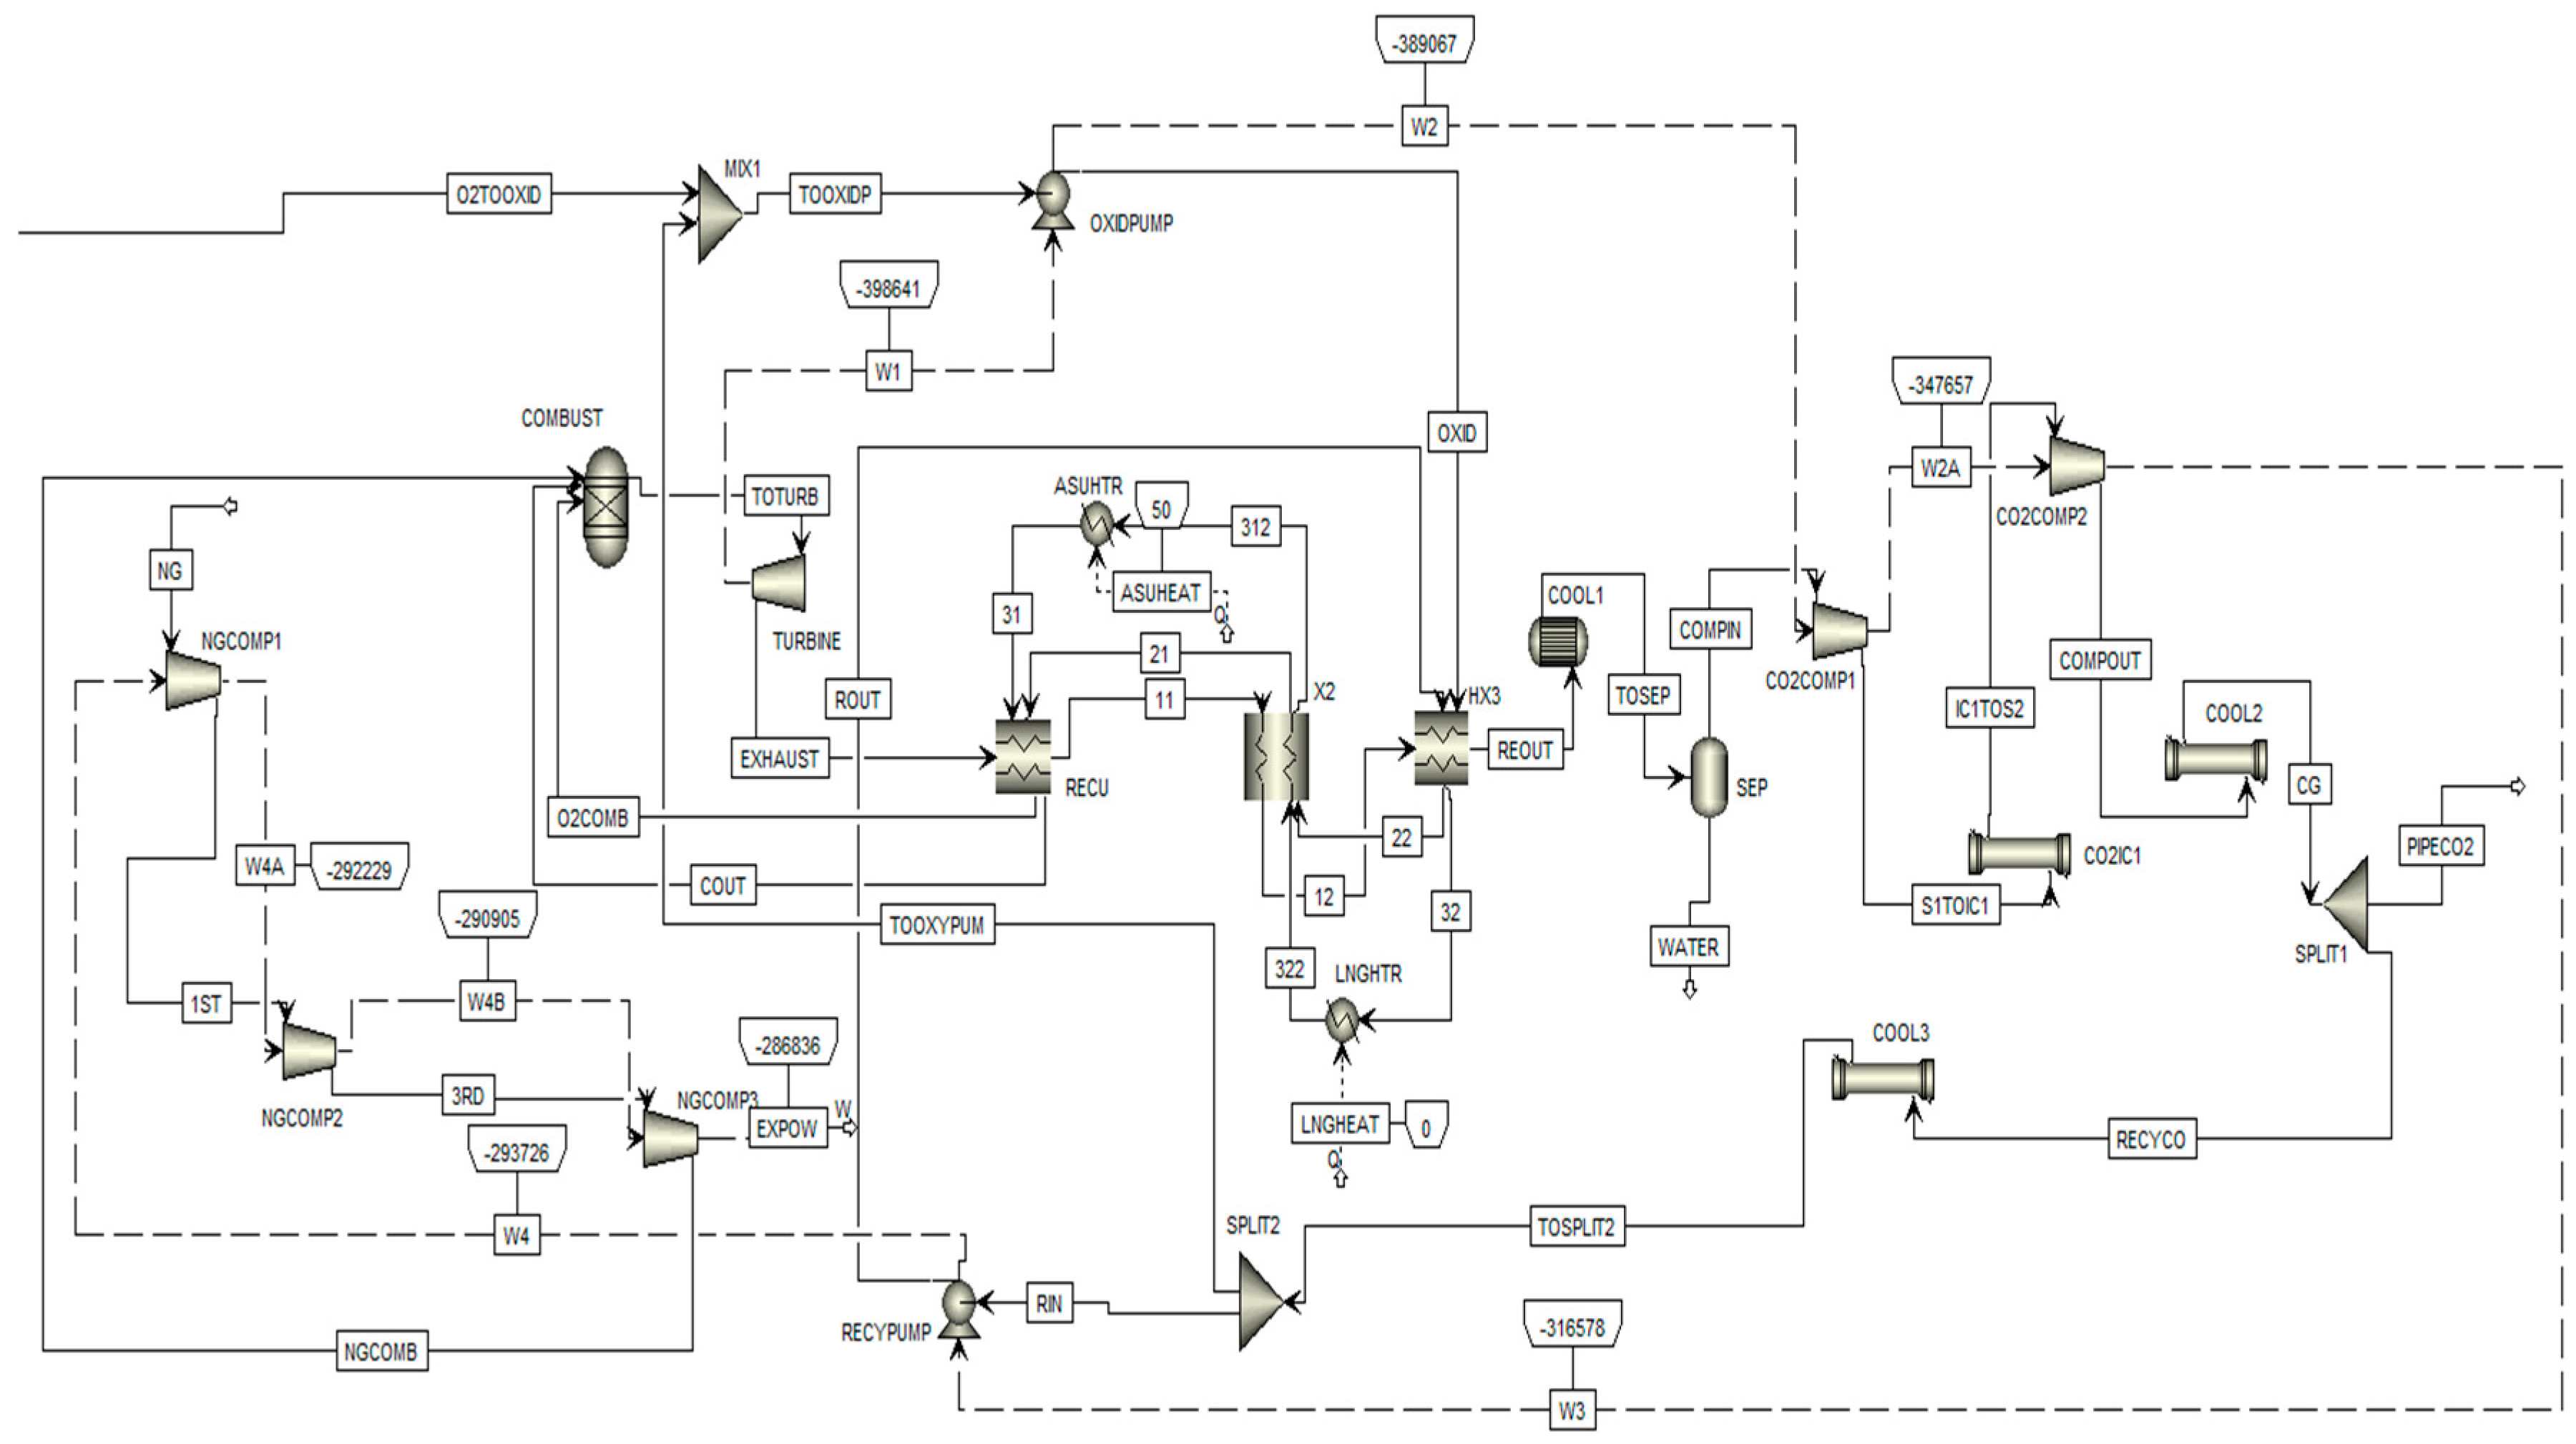
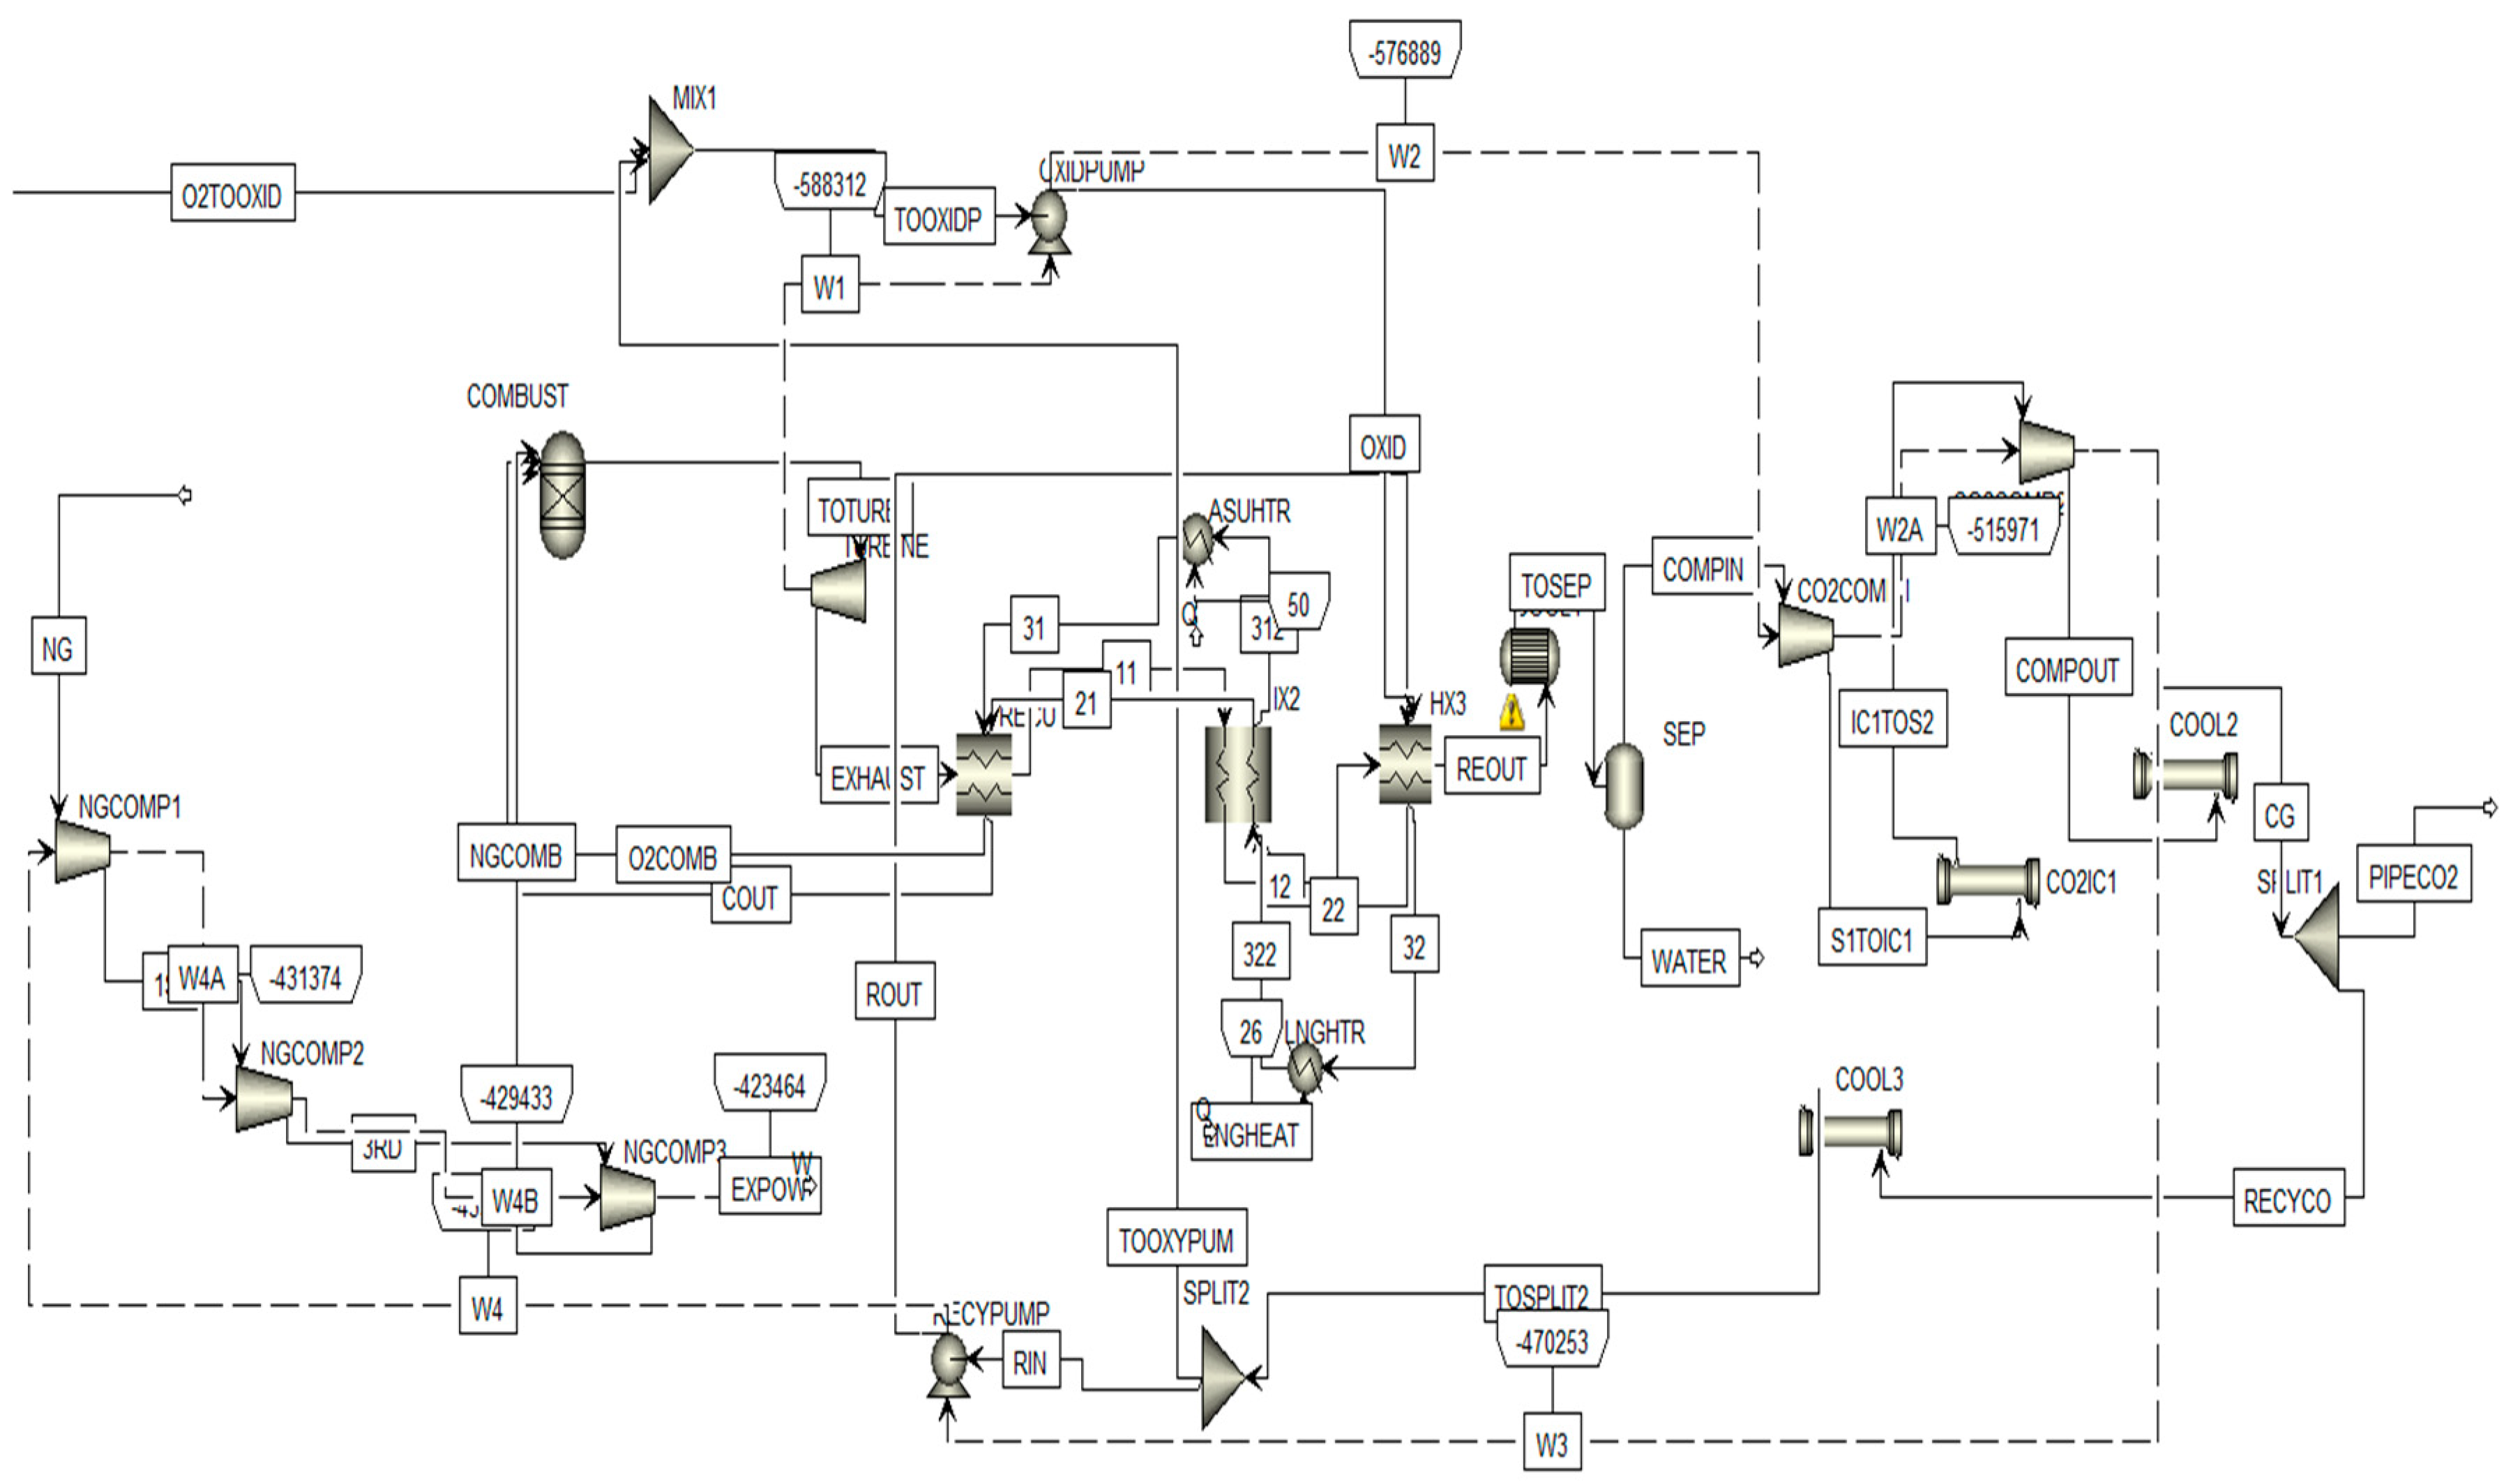
Table 6. The Aspen Plus process flow diagrams (PFDs) for the ASU and AFC (with and without N
2 precooling) are shown in
Figure 6,
Figure 7 and
Figure 8.
As can be seen, the integrated case has a higher booster heat exchanger heat duty and a lower compressor power requirement. It also indicates that roughly half of the precooling heat duty is converted to compressor power savings (2.97 Gcal/h/6.70 Gcal/h = 3.46 MW/7.79 MW = 44.5%).
Table 7 provides the compressor aftercooler duties of the C3/MR cycle. These duties can be utilized for the recuperator in the AFC, especially with the total amounts of heat duties coming from the MR cycle (MR-COOL1, MR-COOL2, and MR-COOL3). The heat integration of the MR cycle and recuperator will increase the efficiency of the AFC, which can be calculated based on the Allam subsystem’s current efficiency.
3.3. LNG Heat from MR Compressors for the Allam–Fetvedt Cycle Recuperator
The heat generated from mixed refrigerant compressors CMP-22, -23, (i.e., cooler duties of MRCooler-2 and -3) in
Figure 2 can be added to the AFC recuperator to raise the enthalpies of streams back to the combustor (Stream 9 recycled CO
2 and Stream 13 recycled oxidant CO
2+O
2). These heat sources as given in
Table 7 are used to increase the AFC’s thermal efficiency.
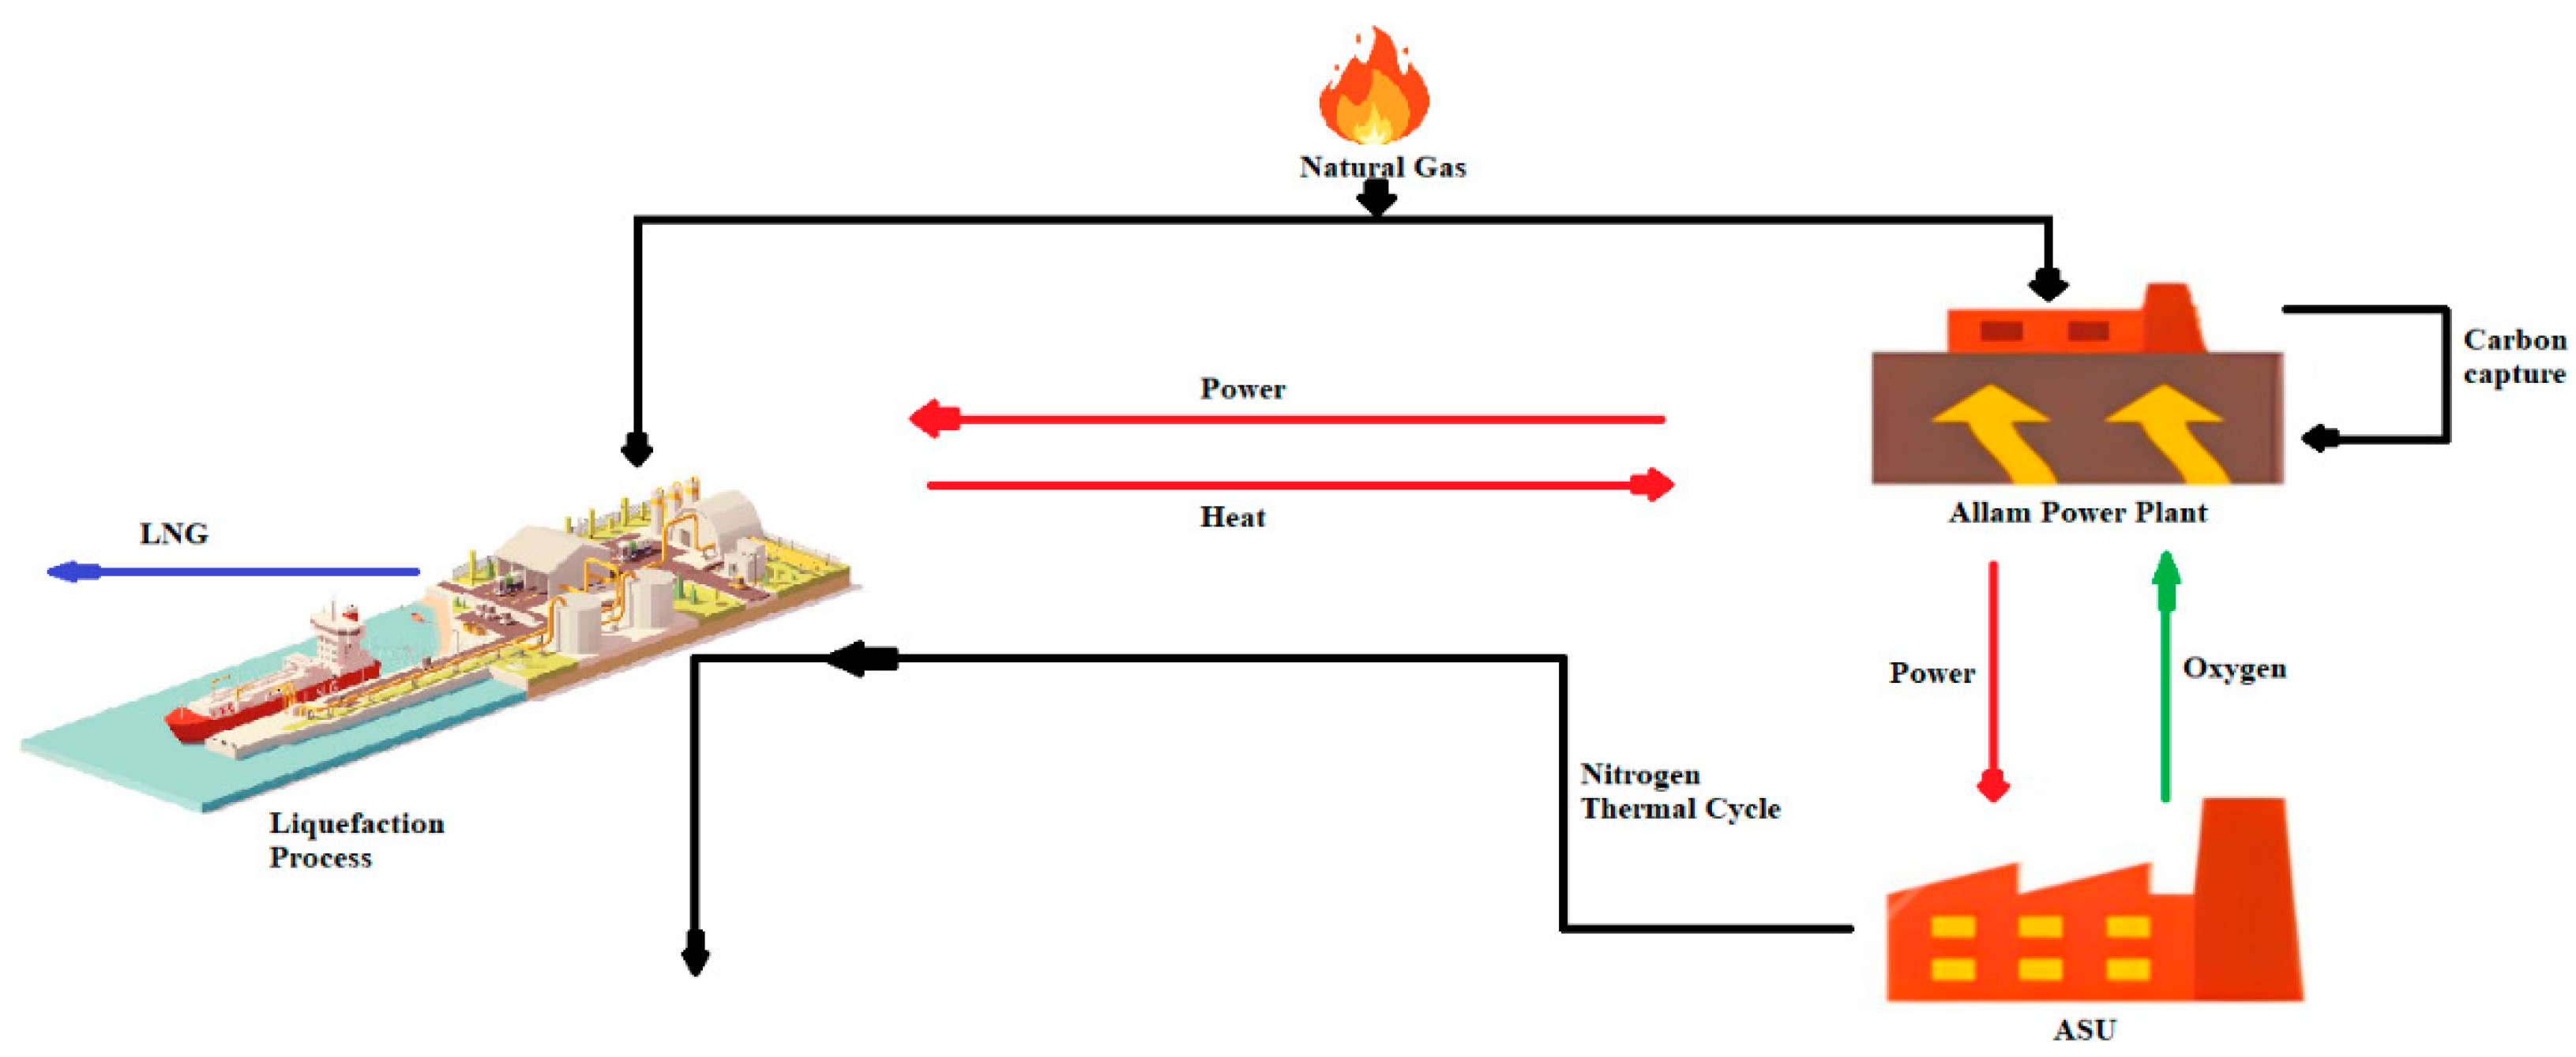
The AFC cycle recuperator is simulated as a series of three multi-stream heat exchangers: RECU, HX2, and HX3. In the base case, no LNG heat is supplied to the Allam–Fetvedt cycle HX3, so the ASU heat of 50 Gcal/h is added to HX2. In the improved case, HX3 utilizes the low-grade heat (26 Gcal/h, ~125 °C) from the aftercoolers’ (MR-COOL2 and MR-COOL3) heat duties of LNG mixed refrigerant compressors (CMP-22 and 23), as shown in
Figure 4. Only a fraction (~19%) of the low-grade heat from the LNG compressors can be utilized in the Allam recuperator to raise the recycled oxidant (a mix of O
2 and remainder CO
2) and recycled CO
2 from ~40 °C to ~125 °C. Then, the heat from the ASU air compressor is used in HX2 to further raise the temperature of the recycle streams to ~300 °C. The net power of the AFC is increased from 395 MW to 423 MW by increasing the NG flow to the combustor section from 36,000 kg/h to 52,800 kg/h. Simultaneously, the air flow for the ASU is increased from 917.5 T/h to 1347 T/h, which results in an increase in O
2 flow from 144,145 kg/h to 211,622 kg/h.
3.4. Energy Efficiency Improvement
The compressor work in the LNG operation is reduced from 255 MW to 251 MW, or by roughly 1.6%, due to the precooling of incoming NG with the nitrogen (N2) stream from the ASU. On the other hand, the net power from the AFC is increased from 395 MW to 423 MW, or an increase of 7.1%, due to the utilization of the waste heat from the LNG MR cycle compressors.
The overall energy efficiency improvement from the standalone LNG and AFC/ASU units to fully integrated LAA complex based on the same natural gas consumption is 8.8% (=1.071/(1 − 0.016) = 1.088). The AFC/ASU power output is increased by 7.1%, while the compressor power requirement is reduced by 1.6%.
3.5. Economic Analysis for Heat Integration between LNG and AFC/ASU Plants
Within this report, we present three distinct scenarios: the base case, an electrified LNG plant, and a heat and power integration among LNG/AFC/ASU.
Base case: This case portrays a standalone LNG plant and a standalone ASU/AFC operating independently, devoid of electrification or heat integration.
Electrified case: In this scenario, an LNG plant is energized by the ASU/AFC plant, i.e., the natural gas simple cycle (NGSC) power plant in the LNG is replaced by the AFC. In addition, all natural gas-powered compressors are replaced by electric compressors.
Integrated case: In this scenario, power is procured from the ASU/AFC system, and conversely, surplus heat (26 Gcal/h) from the LNG plant is channeled into the ASU/AFC system. This integration leads to an enhancement in the power generation capacity of the ASU/AFC, elevating it from 395 MW to 423 MW. Also, cold N2 from the ASU/AFC plant is used to precool the incoming NG before refrigeration, resulting in reciprocal benefits for both facilities.
Table 8,
Table 9 and
Table 10 provide economic analysis including total capital cost, total operating cost, total raw material cost, and total product sales for the base case, electrified case (LNG plant is electrified with electricity from the AFC+ASU complex), and an electrified case with fully heat-integrated LNG+AFC+ASU complex. It can be seen from
Table 11 that the heat integration increases the total capital cost by USD 14 million (one time) and the total operating cost by USD 3 million/yr, but the total product sales also go up by USD 33 million/yr. The product sales from AFC/ASU include only surplus electricity and N
2.
The total capital costs include the refrigeration train (natural gas-powered/electric compressors, aftercoolers, heat exchangers) in the LNG plant, the natural gas compressors, the combustor/turbine unit, and the recuperator in the Allam–Fetvedt power plant, and air compressors, O
2 compressors, and high-pressure column, and low-pressure column in the air separation unit. The operating cost includes natural gas feed, natural gas for running the AFC plant, and the natural gas simple cycle in the LNG plant, workforce to run the plants, and maintenance costs. The equipment cost bases and index to inflation are obtained from various sources [
1,
17,
46,
47,
48,
49,
50,
51]. The revenues include sales of LNG, nitrogen, and electricity.
The increase in capital cost for integrated LAA complex arises from the installation and operation of the duct connection (between the LNG compressor aftercoolers and the Allam–Fetvedt cycle recuperator, 1000 m) and 50 fans (30”, 100 BHP) for transporting hot air.
The operating cost is lower due to increased energy efficiency, i.e., the LAA complex consumes less natural gas to power the Allam–Fetvedt cycle in the integrated LNG/AFC/ASU complex.
Selection of the three LNG prices is based on the LNG contract/spot prices data from the past 10 years. The spot price spiked to USD 59/MMBtu in Asia on 4 March 2022 [
50,
51].
In
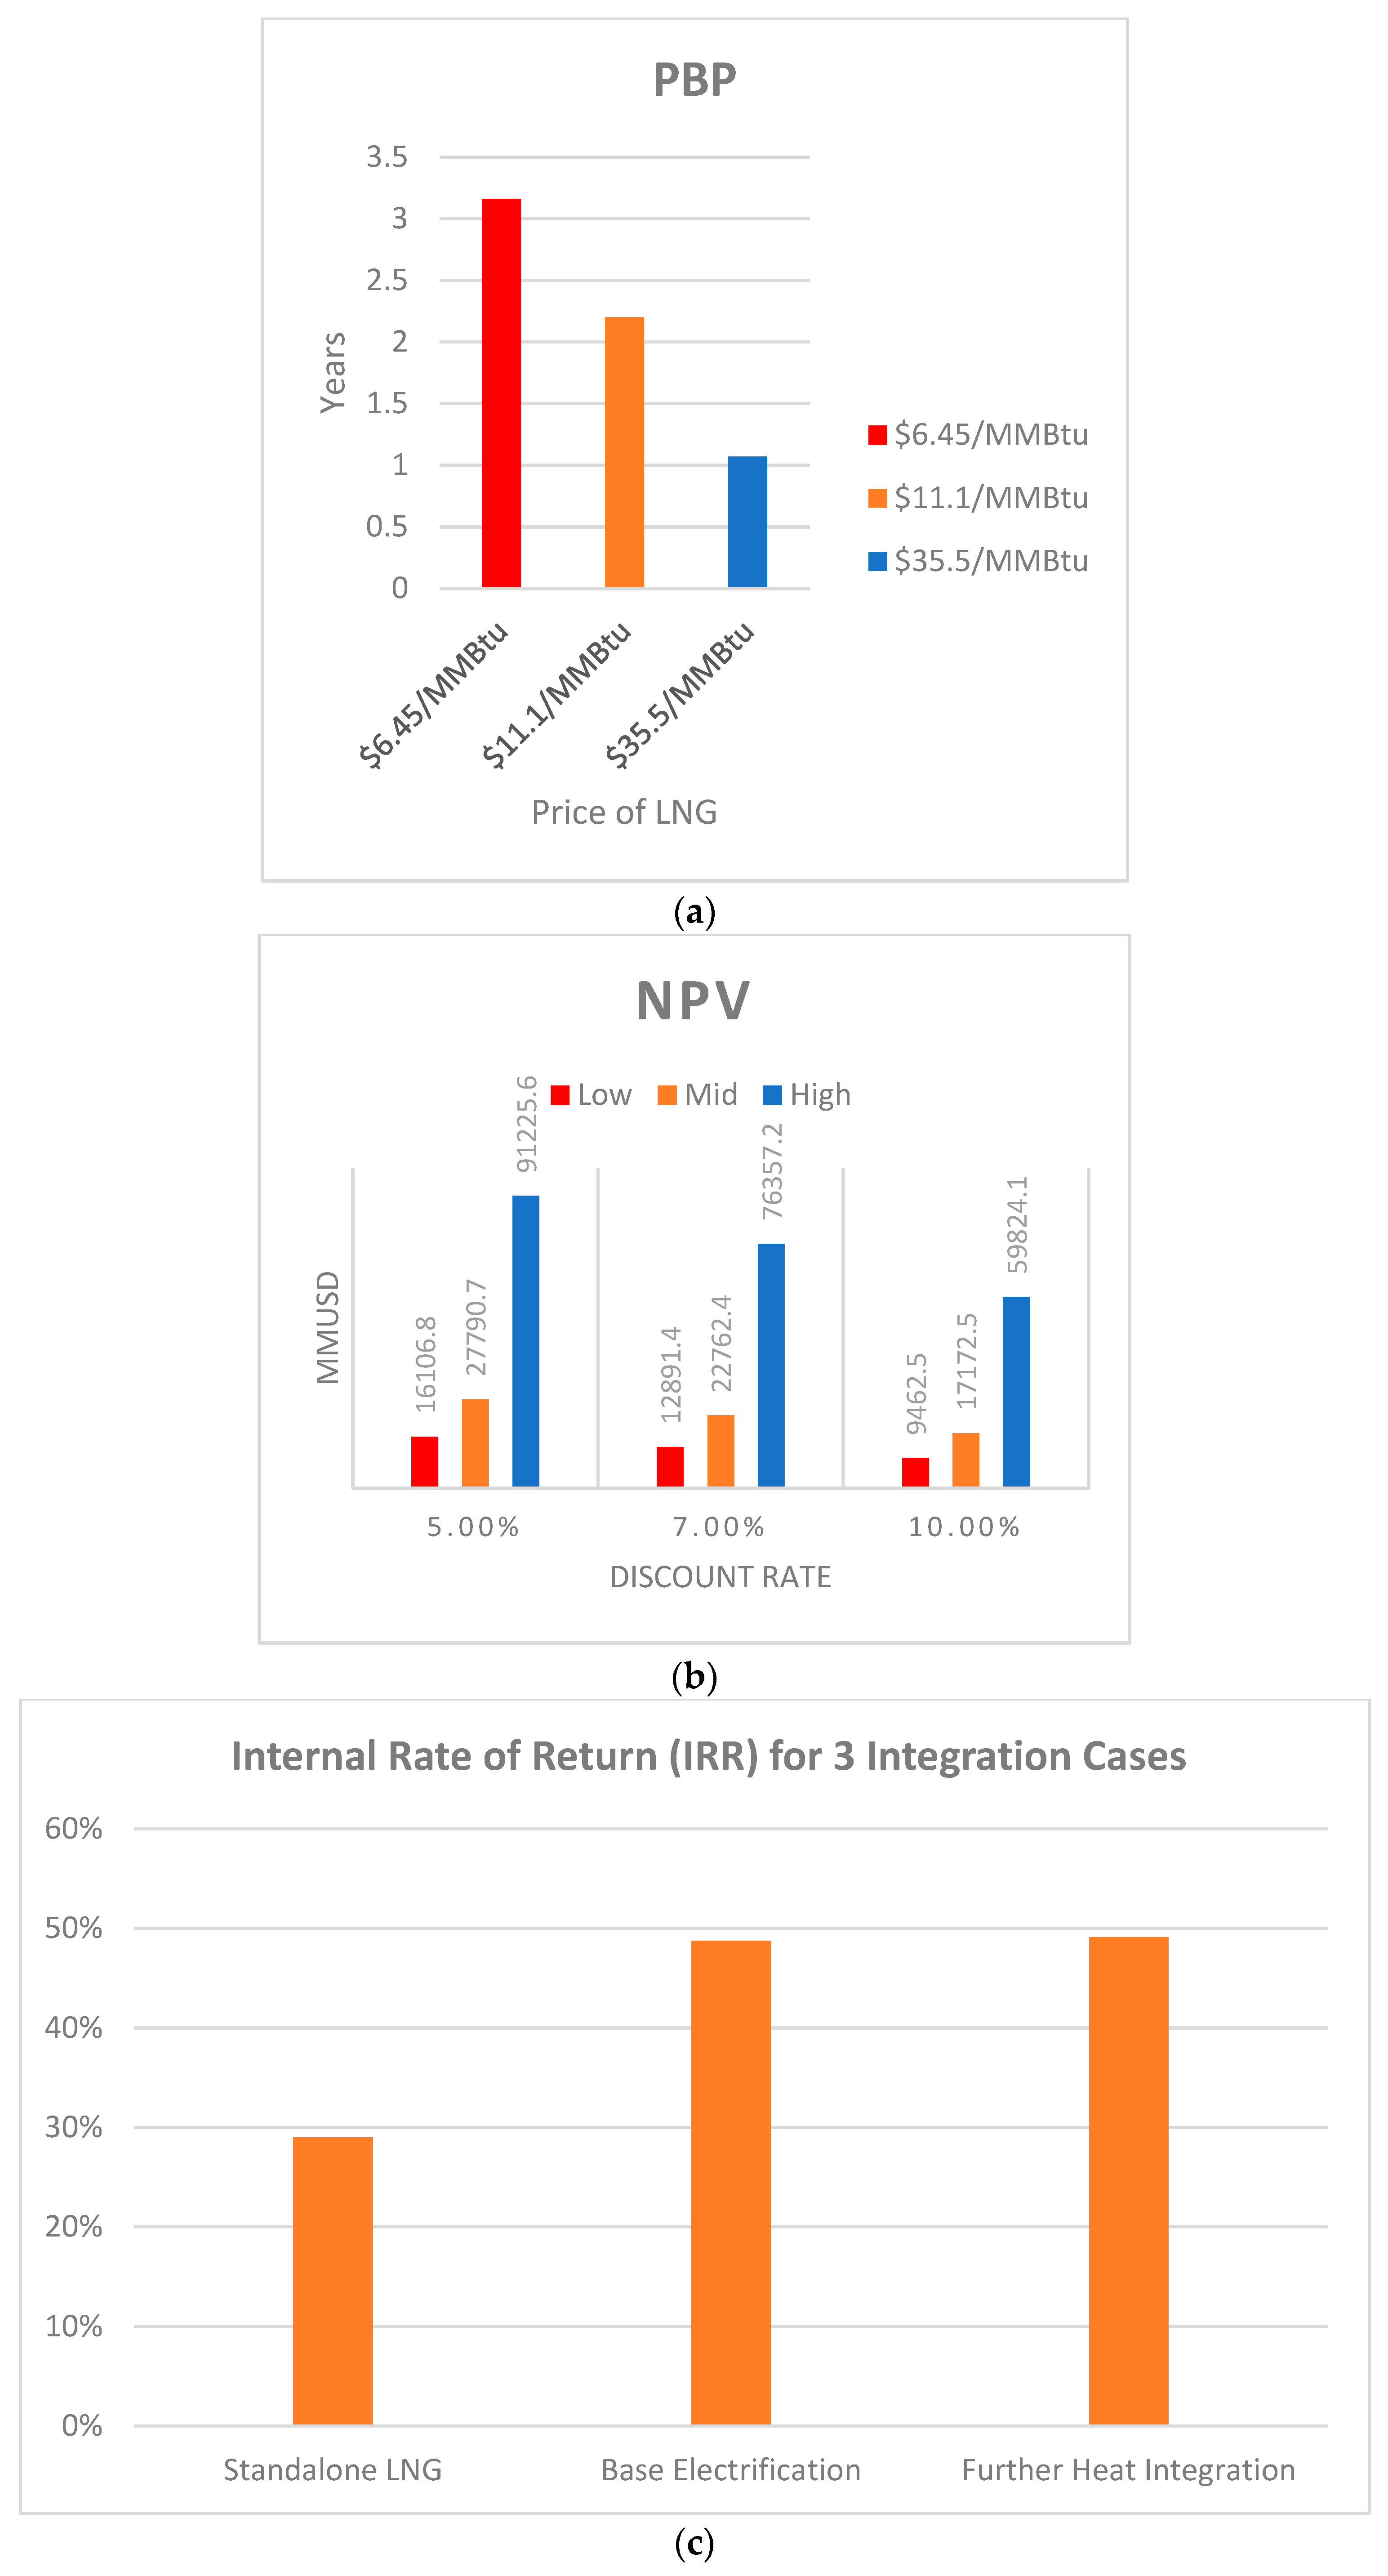
Table 12, the NPV and PBP values are compared for the above three cases for a 7% discount rate and three different LNG sale prices. Also, for integrated LNG/AFC/ASU plant the cash flow analysis over 5%, 7%, 10% discount rates is done with both high (USD 35.5/MMBtu), medium (USD 11.1/MMBtu), and low (USD 6.05/MMBtu) LNG prices, the comparison is shown in
Table 13 and a pictographic representation in
Figure 9a–c.
IRR for the Base case is 29%, whereas for electrification from the Allam–Fetvedt cycle is 48.76% and the fully integrated (power + heat integration) case is 49.10%,
Table 14.
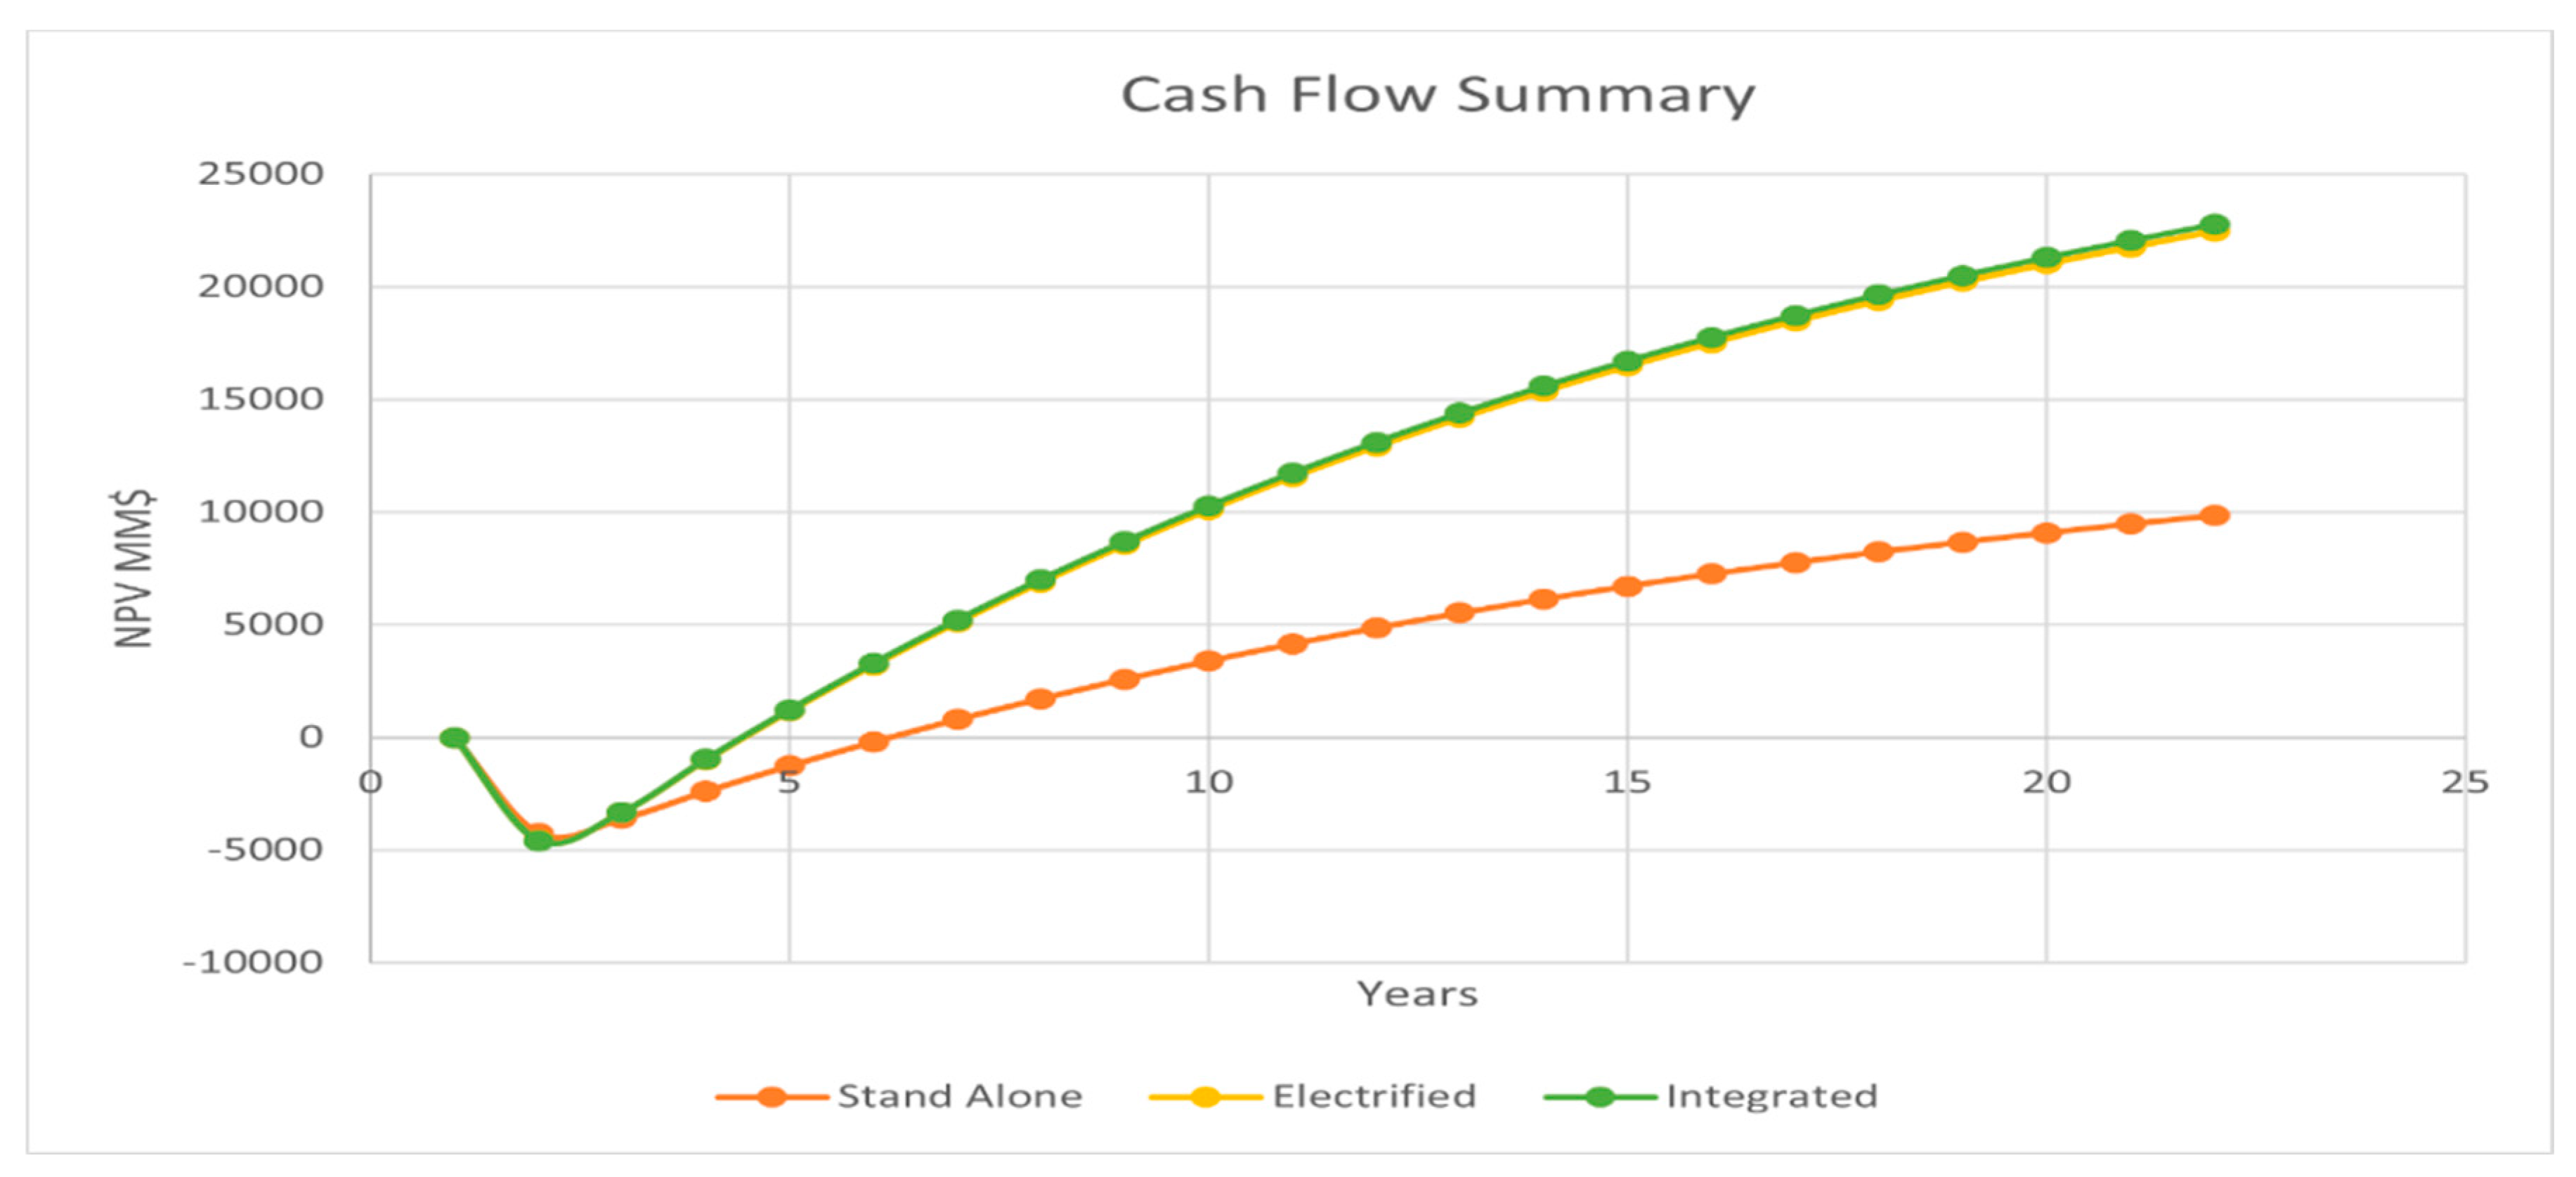
In
Figure 10, cash flow curves are displayed for all 3 plant configurations with a medium LNG sale price of USD 11.1/MMBtu and a 7% discount rate for a project period of over 20 years.
Table 15 provides the detailed cash flow analysis for the integrated LNG/AFC/ASU plant configuration. Detailed costs, revenues, taxes, 45Q carbon credit, cash flow, net earnings, and net present value (NPV) are presented for a 20-year period.
3.6. Estimated Greenhouse Gas Reduction
The total CO
2 emissions from the standalone LNG plant are 1.96 × 10
6 T/yr. The 100-year global warming potential of methane is set as 28. This is shown in
Table 16. These calculations are based on the CO
2 emission factor for the natural gas-powered turbine = 540 kg/MWh, CH
4 emission factor for the LNG plant compressors = 0.240 scf/(hp*h), 90% utilization rate, and natural gas simple cycle (NGSC) efficiency of 36%. The GHG emissions from the standalone LNG are estimated to be 1.96 × 10
6 T/yr.
Electrification of the LNG plant with an AFC/ASU helps avoid the CO
2 emissions of 1.96 × 10
6/yr and also captures 1.27 × 10
6 T/yr of the CO
2 by AFC/ASU power generation, as shown in
Table 17. Also, the estimated CO
2 emissions avoided for the AFC plant due to LNG compressors heat integration are 4.22 × 10
4 T/yr. The estimated CO
2 emissions avoided due to N
2 precooling heat integration for the LNG plant are 9.12 × 10
3 T/yr. Thus, the total CO
2 emissions avoided due to heat integration of the LNG plant and AFC/ASU are 5.13 × 10
4 T/yr or 2.6% of the standalone LNG emissions, as shown in
Table 18.
