1. Introduction
One of the most prominent applications that Energy Storage Systems (ESSs) are being developed and deployed for is providing frequency response services. By far the most popular ESSs to be deployed for this purpose are Battery Energy Storage Systems (BESSs) [
1]; however, with such services the BESS is limited by how much they can participate and thus generate revenue due to their high susceptibility to cycle based degradation [
2]. On the other hand, higher C-Rate ESSs cannot provide the service for long enough to be viable as standalone systems.
Flywheel Energy Storage Systems (FESSs) are a form of very short-duration energy storage that have been widely deployed in a range of applications such as renewable generation support [
3], peak load levelling [
4] and microgrid integration [
5]. Whilst they are a fairly mature technology, advancements in their construction is leading them to be reconsidered for new applications. Because of their ability to withstand very high numbers of cycles, they may represent ideal candidates to provide cycle-intensive services such as Dynamic Frequency Response (DFR) [
6]. The work contained here provides the most extensive techno-economic analysis on this possibility to date, to determine the conditions required to make their deployment viable.
This work concentrates specifically on the DFR service offered by National Grid ESO (NGESO) [
7], an existing frequency response service for the Great Britain (GB) grid with extensive publicly available data and which represents an excellent benchmark for assessing the effectiveness of ESSs delivering frequency response services. This paper begins with a literature review of ESS provision of frequency response services, specifically concentrating on the use of Flywheel Energy Storage Systems for this purpose although the application of BESSs is also discussed. DFR is operated as part of maintaining the obligation for NGESO to maintain the frequency of the national grid within statutory (49.5–50.5 Hz) and operational (49.8–50.2 Hz) limits at all times [
8].
MATLAB/Simulink has been used to model the energy storage technologies, as previously detailed in [
9,
10] for simulating the provision of the DFR service and analysis of performance metrics.
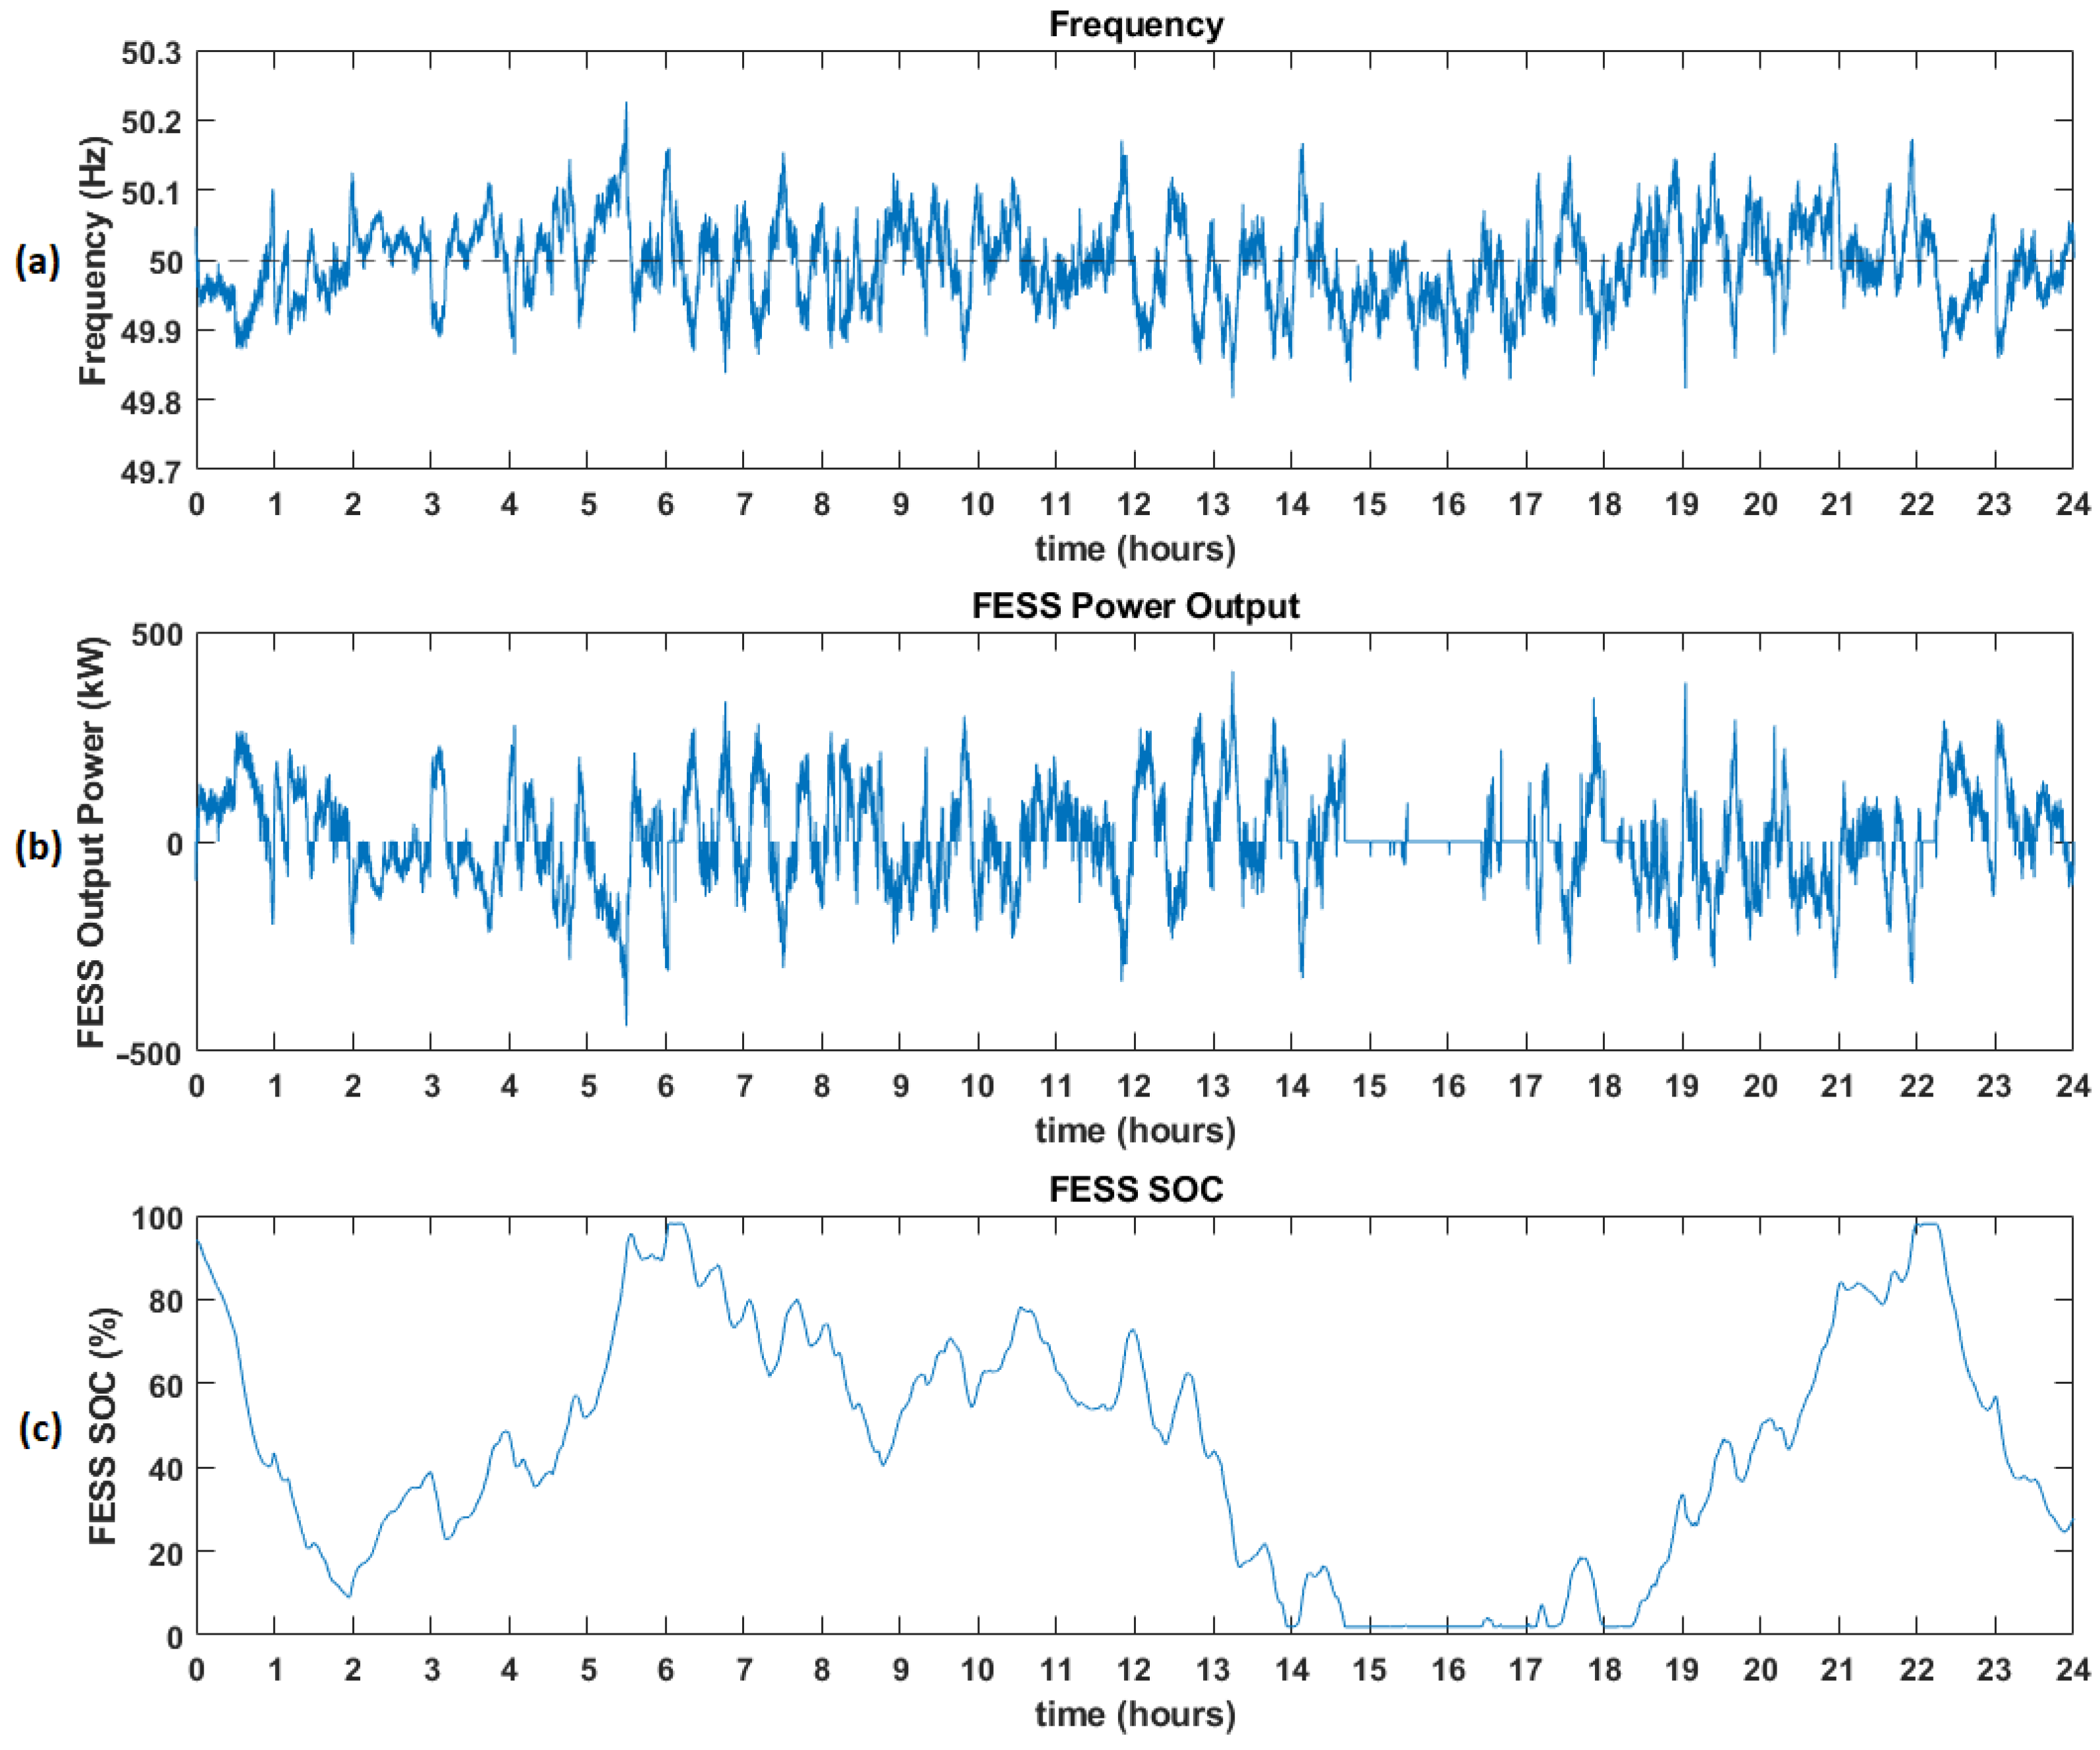
Figure 1 gives an example of the output of this simulation, showing the FESS responding to the variations in frequency through the provision of positive and negative power and the effect this has on the SOC of the system, which fluctuates throughout the day.
The model utilises frequency data taken from National Grid ESO [
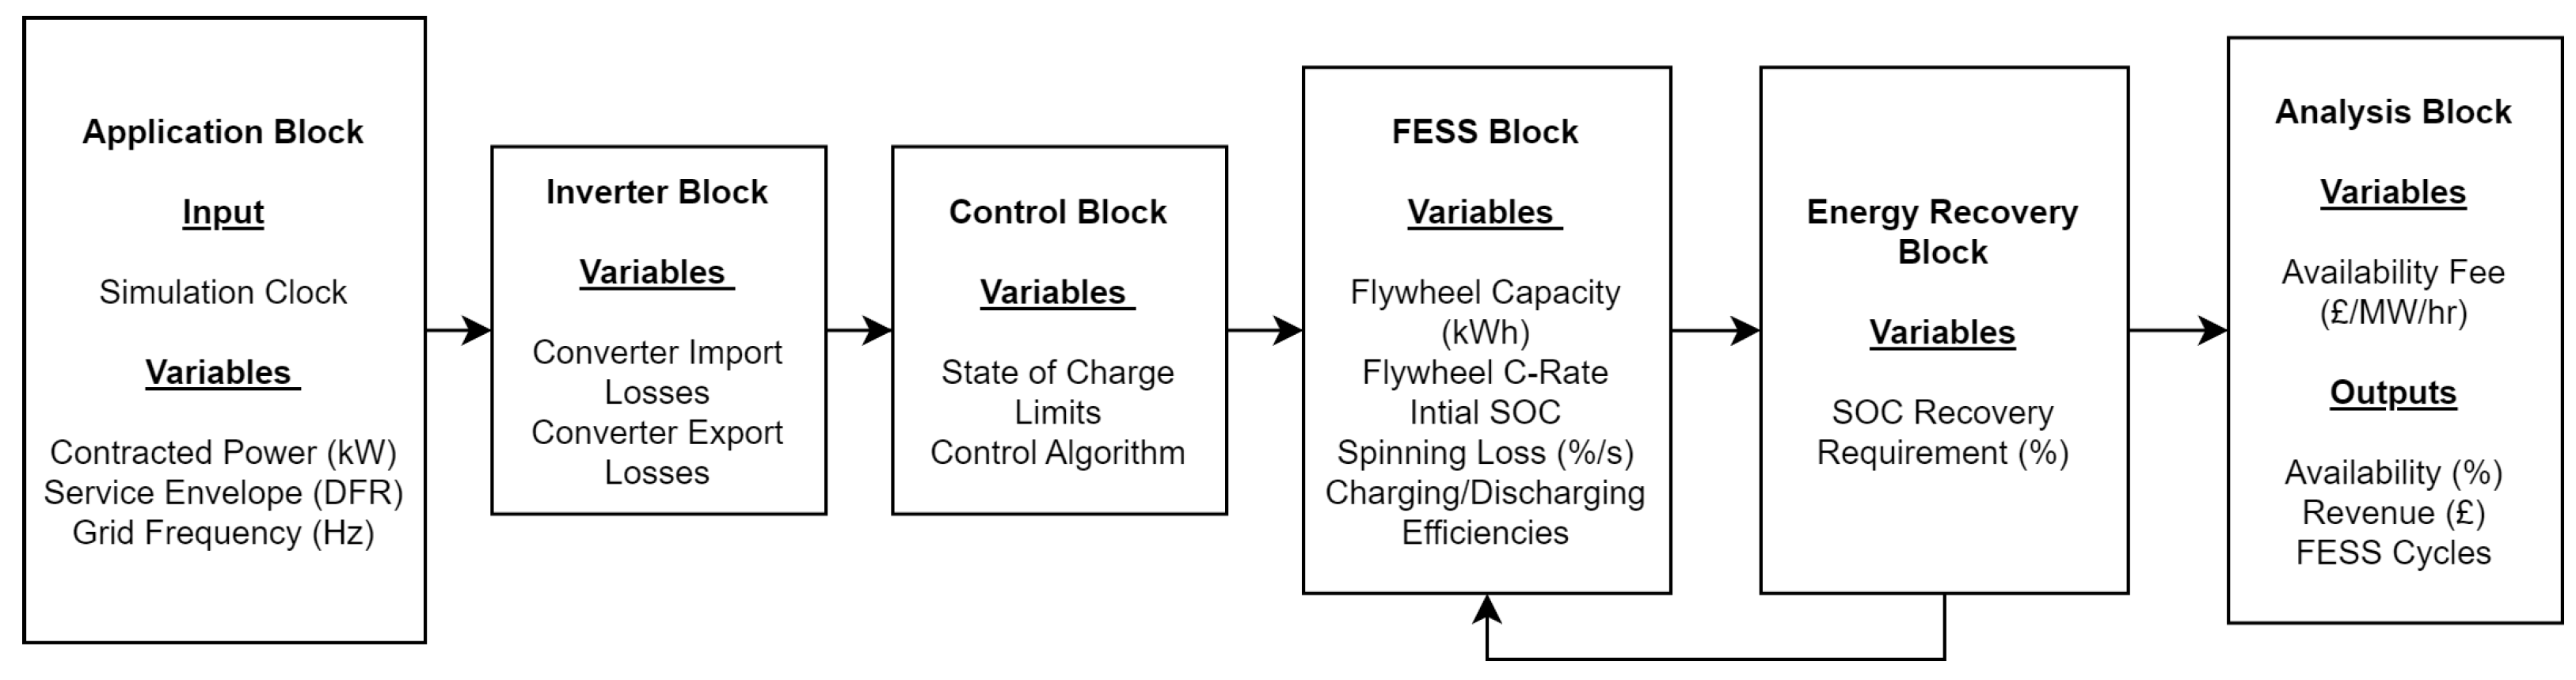
11] with the model simulated over a 1 year period between November 2020 and October 2021. These raw data are the actual grid frequency recorded, already having accounted for any actions taken by National Grid ESO in terms of services procured. A high-level overview of the model is presented in
Figure 2 showing the following components;
Application Block—This block determines which application is being studied within the model; in this case, it is frequency response. It takes input from the simulation clock and cycles through frequency values on a second-by-second basis using a look-up table, which is subsequently converted to a power request in kW.
Inverter Block—This block represents the efficiencies of the power electronics of the system
Control Block—This block contains a MATLAB function block that manages the SOC of the ESS and determines when it can charge or discharge
FESS Block—This block represents the FESS itself accounting for spinning losses, charging and discharging efficiencies, cycle counting and the FESS characteristics such as C-Rate and initial stored energy.
Analysis Block—This block calculates aspects such as availability, revenue and the degradation of the system.
Both storage systems were modelled using the bucket principle [
12] with the storage system considered as a simple energy store, or ‘bucket’, that is filled or drained as it is charged or discharged. This approach is common throughout the literature, and the model is made more complex by introducing further systems to include losses, efficiency and self-discharge. Losses in the electrical systems are accounted for and mechanical spinning losses in the flywheel are included and based on data provided by OXTO Energy [
13]. The BESS model specifications are based on the Willenhall Energy Storage System owned and operated by The University of Sheffield and previously verified in [
14]. The main model specifications utilised are shown in
Table 1. The system self-discharge rate represents the whole system value.
Parts of the work presented within this paper were previously published as part of conference proceedings [
9]. This paper builds extensively on the work previously presented, offering significant new results and assessments. The key advancements in the previous work discussed here are the extensive economic analysis works, further exploration of technical performance, and a significantly more in-depth assessment of hybrid scenarios.
This paper presents a wide-ranging analysis of FESS viability for the delivery of frequency response services. It explores both technical elements from a standalone and hybrid perspective, as well as an economic analysis to investigate whether these systems would be suitable for real-world deployment. The paper is organised as follows:
Literature Review—A review of the most relevant literature that investigates flywheels for the provision of frequency response services and their usage in hybrid systems with BESSs, before using this review to highlight the novel contributions contained within this article.
Economic Overview—This section covers the economic foundations of the study, outlining the current economic outlook for both FESSs and BESSs along with an overview of the economic metrics used in this study.
Standalone Technical Analysis—An initial technical study is conducted into the performance of varying configurations of FESS providing a DFR service, focusing on average availability, number of cycles and energy throughput.
Standalone Economic Analysis—The results of the standalone technical analysis are used to investigate the economic implications of deploying the different FESS configurations under varying economic conditions.
Hybrid Technical Analysis—The subsequent study introduces the hybrid aspect, combining small installations of BESS with the previously studied FESS configurations and again looking at the technical performance of the system, and how this changes with the hybridisation.
Hybrid Economic Analysis—Finally, a further economic analysis is performed to analyse the impact of hybridisation on the economic viability of deploying FESS/BESS hybrids for this application.
2. Literature Review
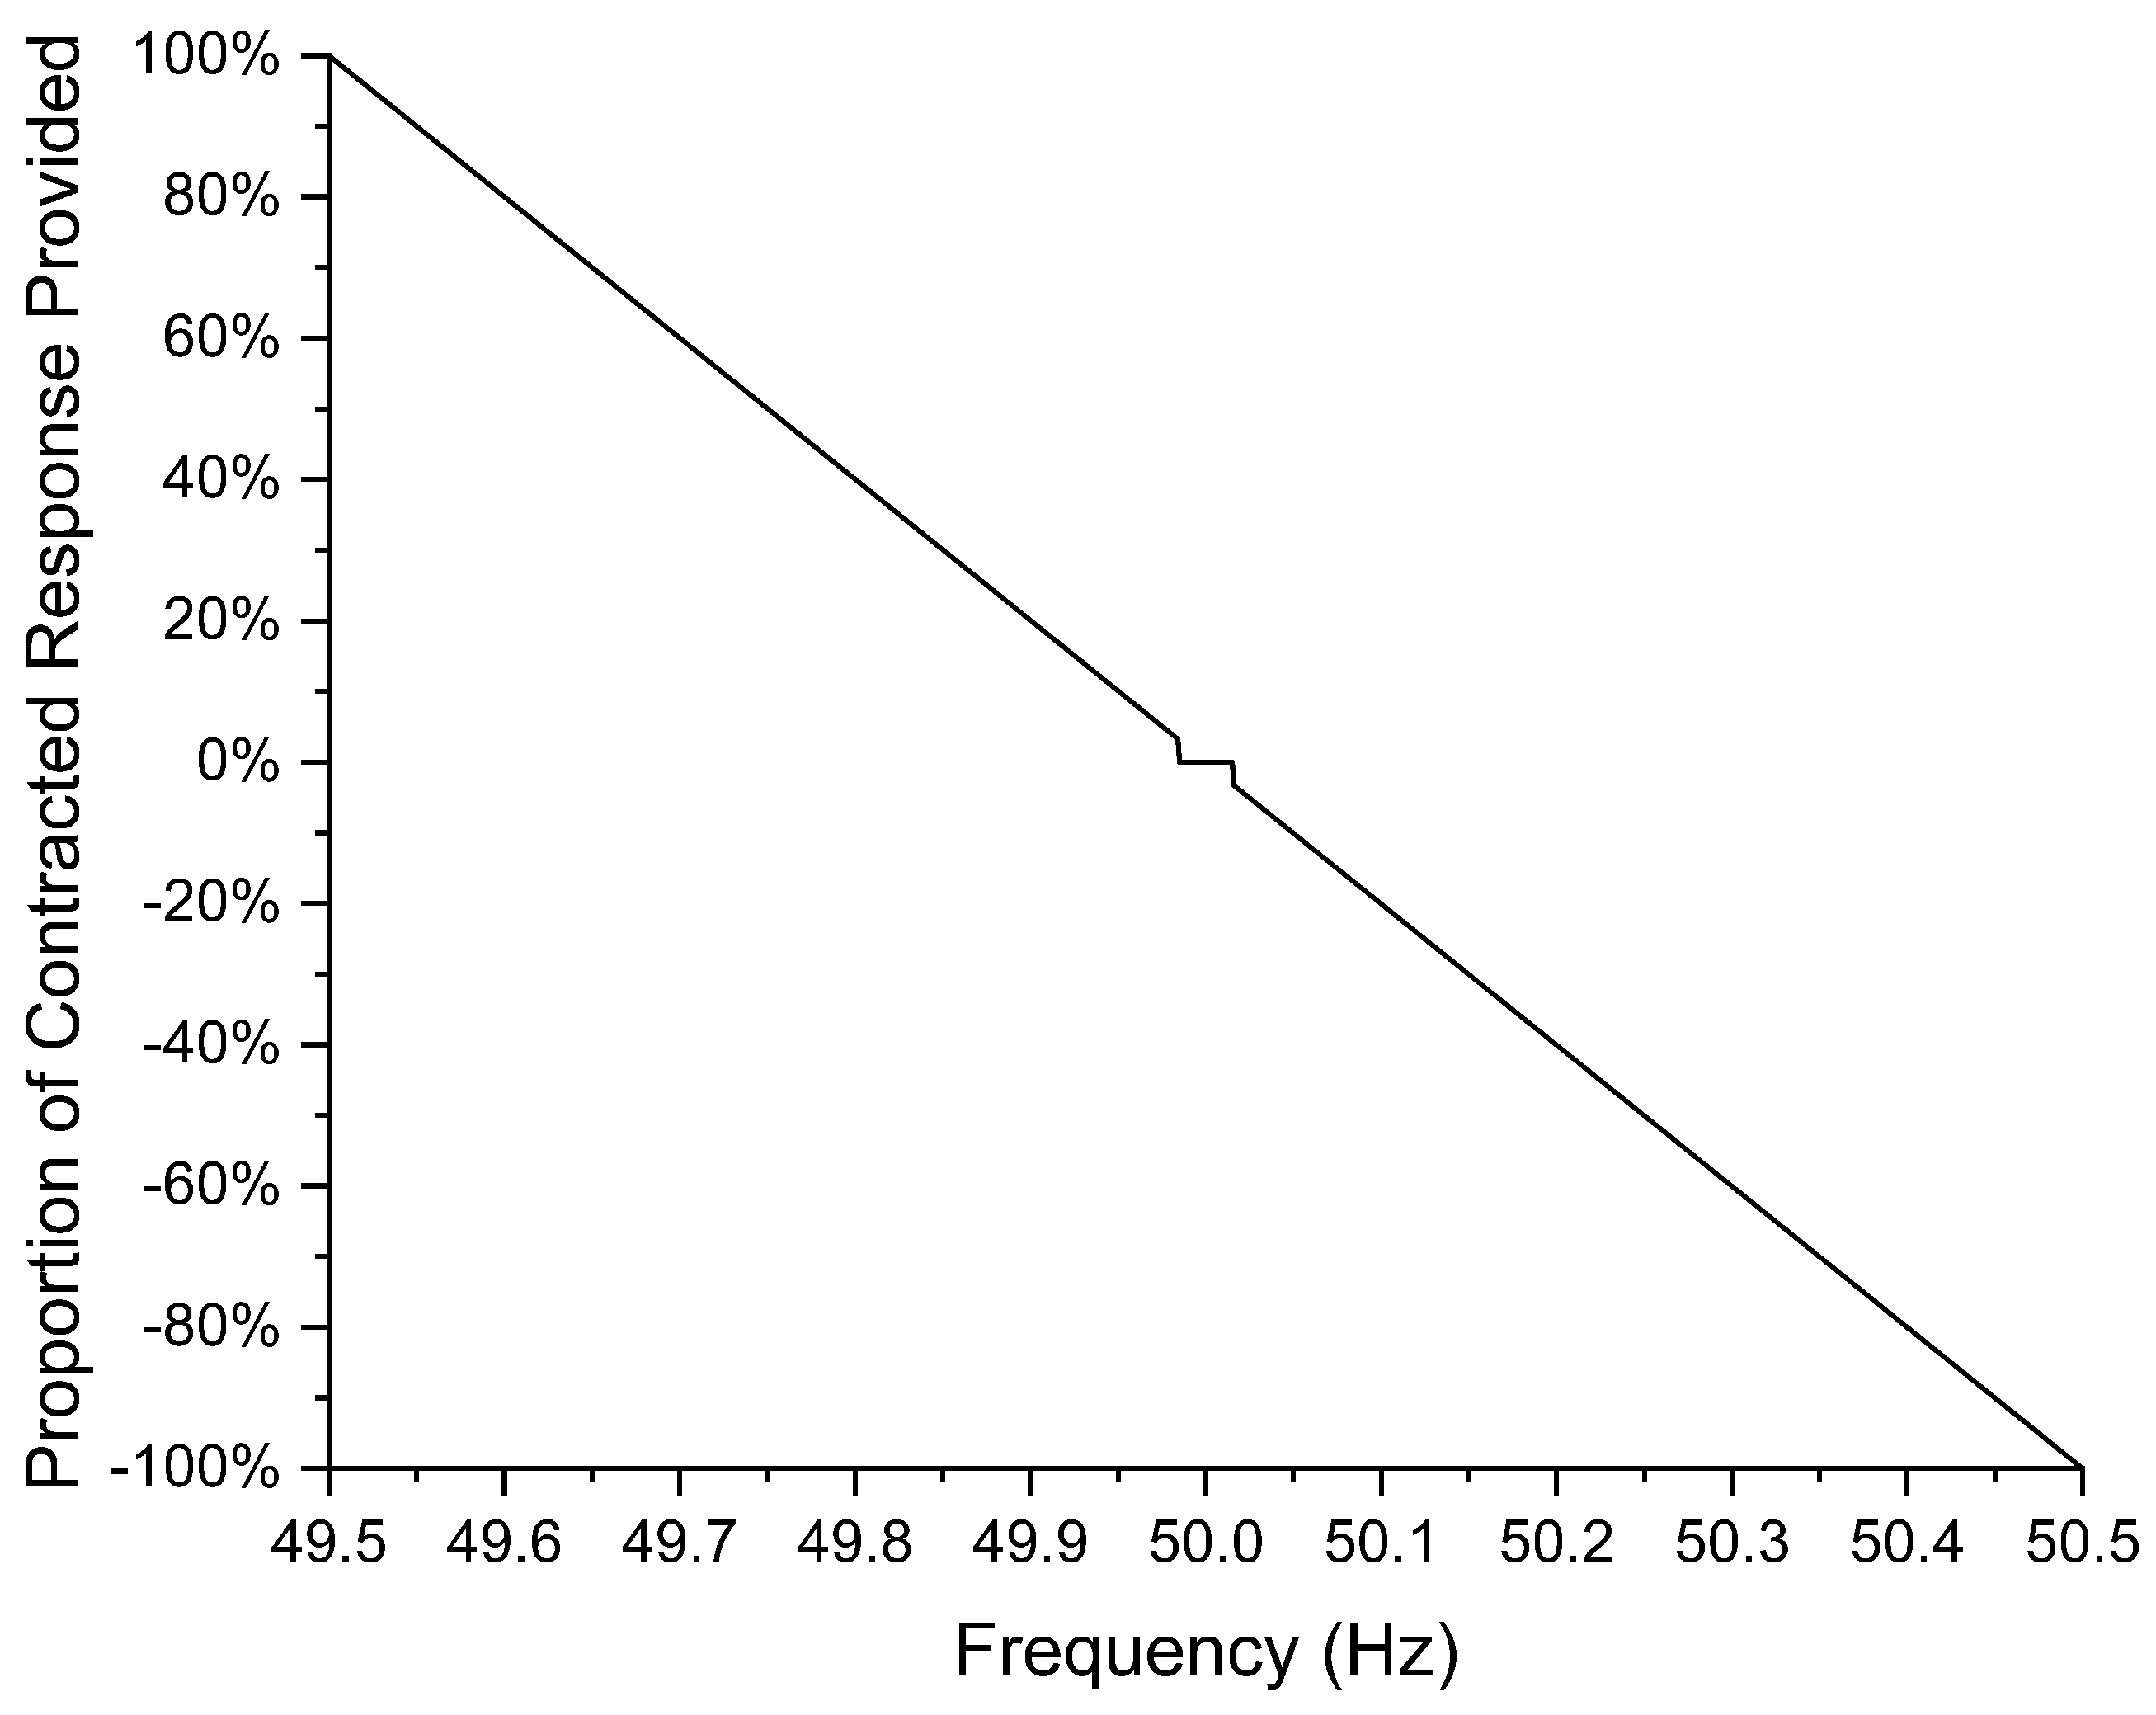
DFR is a service offered for the GB grid and can be best defined to the response envelope shown in
Figure 3. The basic premise of the service is that as the frequency deviates further from the rated frequency of 50 Hz, the contracted ESS will provide higher proportions of either the rated charging or discharging power [
7].
Crucially, the main metric for measuring an ESS’s ability to provide DFR is known as Availability and is expressed as a percentage of time that the output of the ESS matches the requested output from the service, as shown in Equation (
1), where
is the power requested by the service,
is the power provided by the ESS, and
is the overall operation time, or in the context of this research, the simulation time end. This metric is important, as it is used as a basis for determining whether payment is provided for that service period, with payments reducing as soon as the availability drops below 95% [
15].
Payment for this service is based upon a tendering process, and between October 2020 and November 2021, the overall average payment (termed the ‘Availability payment’) was calculated as 11.67 GBP/MW/h, which is the value that will be used for financial calculations within this study [
16]. This time period has been chosen to align with the frequency data used throughout this work, which covers the same period of time.
Another service commonly discussed within the literature is Enhanced Frequency Response (EFR), which is a different service that was offered by NGESO and that has since been discontinued. Whilst the service itself will not be offered out for auction again, there still exists a wide range of research on the topic which can be used to inform research into DFR and other frequency response services.
In terms of nomenclature, ‘Frequency Response’ can often be referred to as ‘Frequency Regulation’. However, these terms are also often used to refer to responding to very short-duration instantaneous frequency events, rather than the continuously operating services discussed in this paper. Instantaneous frequency regulation is not within the scope of the work contained in this paper.
2.1. Energy Storage Systems
ESSs can be deployed for a wide range of different applications. The most commonly deployed storage technology for frequency response services is BESSs [
17]. They have many advantages that make them well suited to this application such as a low self-discharge rate, good energy density and low cost [
1]. However, the main drawback when considering BESSs for a frequency response application is their high susceptibility to cycle-based degradation [
18].
As the popularity of BESSs for grid applications has grown, a significant amount of the literature has been published reviewing BESS operation, deployment and optimisation. The work in [
19] explores a range of issues related to BESS deployment in new electricity markets with a focus on the modelling and management of these systems. It highlights the growing requirement for faster charge rates and reduction of degradation rates as key issues for BESS deployment in the future.
Another key review in [
20] concludes that whilst the deployment of BESSs for grid applications is vital to facilitate the increasing integration of renewable energy, there remain significant challenges to be overcome, specifically discussing the diverse range of BESS chemistries available and the benefits and drawbacks of each. A similar conclusion is also reached in [
21] which highlights the role of cell balancing and converter technologies in future deployment of BESSs.
Flywheels have also been the subject of a growing portion of the literature in this field, with their main advantages being significantly longer lifetimes than BESSs, as well as a high power density [
6]. However, their traditionally low energy density presents a difficulty when considering certain applications.
The extensive review in [
22] discusses the wide range of potential applications for FESS deployment. It concludes that integrating FESSs into systems with high renewable penetration should be a target area of research in the future, specifically in areas such as power levelling and frequency regulation.
A similar conclusion is reached in [
23], which provides another overview of FESS technology and applications. It is highlighted that whilst challenges are apparent for the accelerated deployment of FESSs, a target area for research should be in the area of frequency regulation and other power system services.
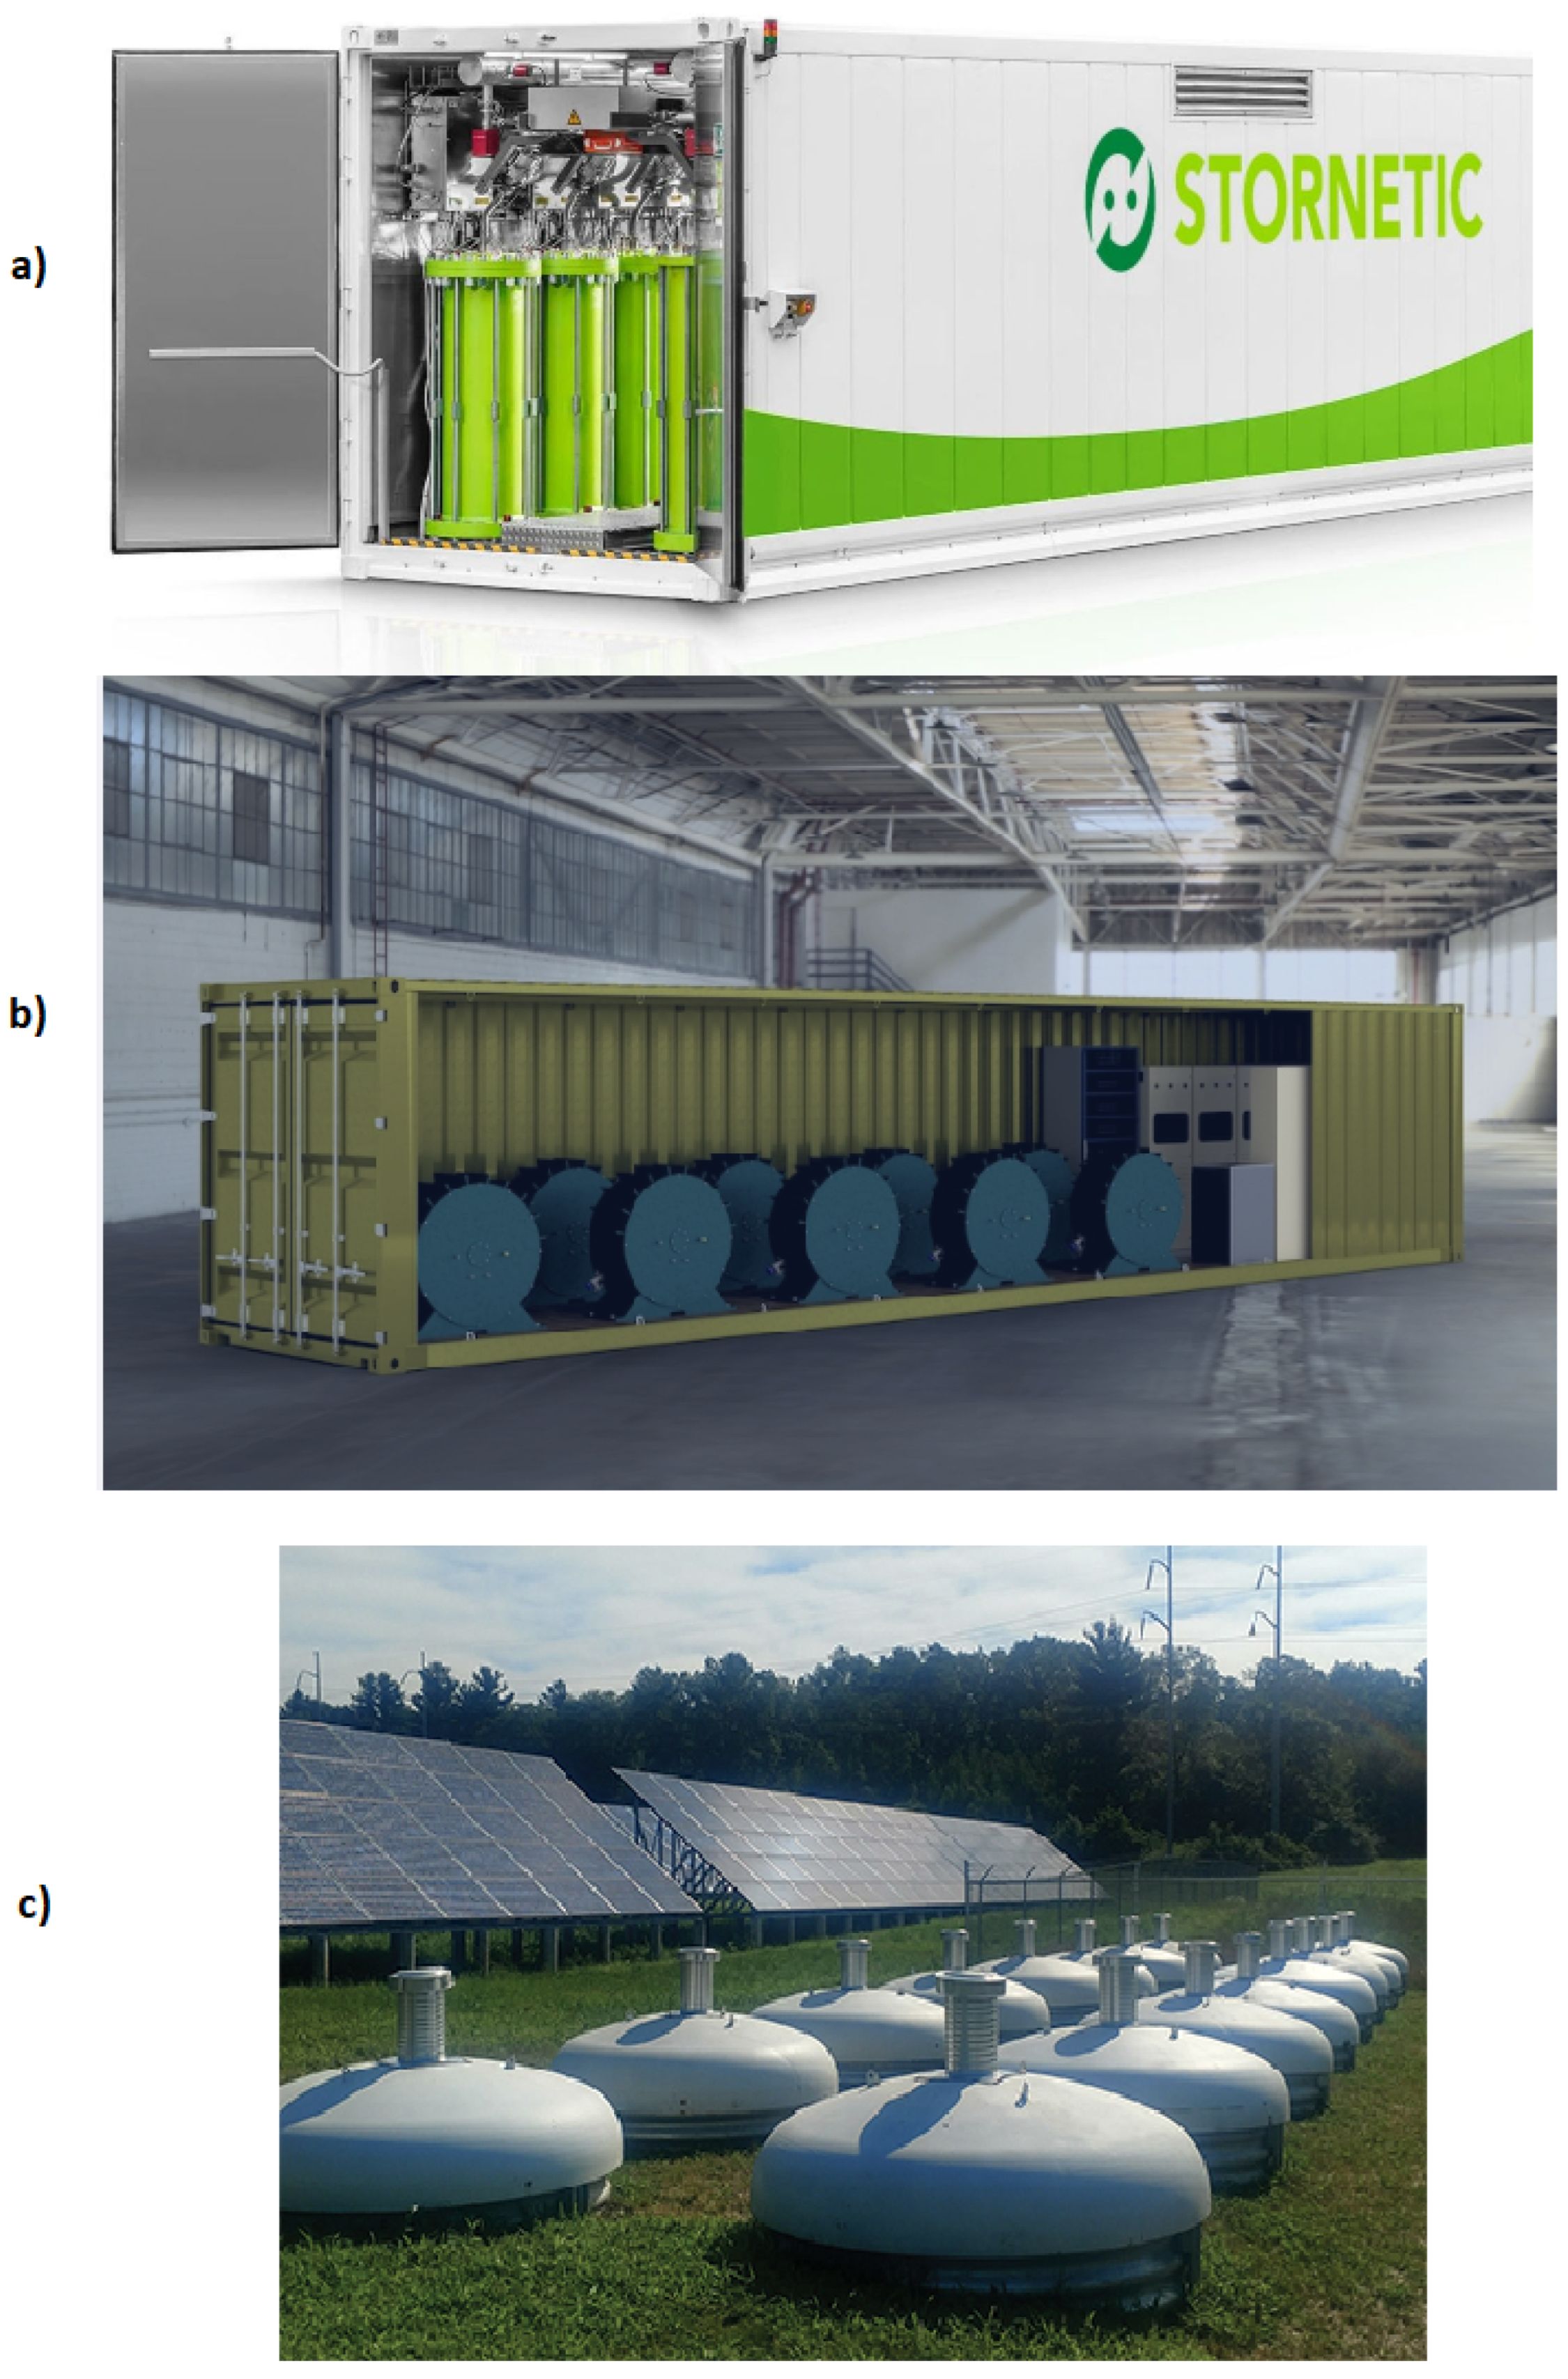
Figure 4 shows three examples of FESS installations. Flywheel systems can vary significantly in size and orientation, with the example in
Figure 4c showing an installation where the flywheel is submerged below ground as part of the containment.
Figure 4a,b show containerised systems consisting of multiple individual units. The FESS in
Figure 4b is the system being considered within this paper as part of the work done by industrial sponsor OXTO Energy [
13].
2.2. Flywheels for Frequency Response
The work in [
26] investigates FESS and FESS/BESS hybrids for a variety of different applications such as electric vehicle charging and microgrid support but does not investigate the provision of frequency response services. It does, however, provide a suggestion that an FESS can be a more economically attractive option in certain scenarios. In a similar field, ref. [
27] presents a study into FESS/BESS hybrids for autonomous projects, which uses a rudimentary modelling approach to suggest that FESSs could be commercially competitive with BESSs.
A comparative analysis of BESSs, FESSs and supercapacitors for a frequency regulation support role co-located with a wind generation site is presented in [
28]. Whilst not performing the same frequency response services discussed within this paper, it presents key insight into the trade-offs between the individual technologies and concludes that none of the three technologies emerges as a clear favourite for this application, suggesting that there is an opportunity for FESSs to displace BESSs in applications that they are widely deployed for [
29] highlights that when considering a BESS providing a frequency response service, additional control measures can result in a higher availability outweighing the increased number of cycles. This is an interesting conclusion that suggests the BESS degradation factor may not be as crucial as expected, and hence could provide a stronger basis for implementing a hybrid system between a BESS and FESS.
A key study in [
30] discusses the market within the New York Independent System Operator portion of the electrical grid in North America. Whilst there is no technical study undertaken and the paper is more focused on explaining the mechanisms available, there is a crucial aspect raised that reveals an energy storage system would be expected to see over 6000 cycles per year when operating as a frequency regulation service. This would be excessive for some forms of ESS susceptible to cycle-based degradation and suggests further exploration of cycle-resistant ESS technology is warranted.
A significant area of research, such as in [
31], focuses on extending the life of a BESS being used for frequency response services. In [
31], the approach taken is to use a specific control mechanism to maintain the BESS state of charge (SOC) within a defined range. Whilst the study concluded that a positive Net Present Value (NPV) was achievable, this came with the caveat that no BESS control method led to a lifetime longer than 5.9 years.
A similar study is undertaken in [
32], where different methods of control and participation are analysed to determine their effects on the degradation of a Li-ion BESS. In this paper, the maximum lifetime achieved was 13.5 years under favourable conditions, with the shortest lifetime achieved being just 4.8 years. Again, this suggests a significant interest in the area of extending the lifetime of BESSs providing frequency regulation, and that more work needs to be undertaken to begin to achieve longer lifetimes consistently.
Continuing in the area of battery energy management, the works in [
33,
34] discuss various methods of managing the SOC of a BESS whilst providing EFR. Both studies consist of in-depth technical assessments with [
33] then also considering revenue possibilities when combining with other services. Again, this work specifically concentrates on the control of the BESS to extract maximum performance. In contrast, consideration could also be given to the hybridisation of the system to provide a performance boost.
In terms of studies on FESSs providing frequency response services as a standalone unit, there is a minimal amount of the literature available due to their perceived unsuitability for this application. The main area of research that has parallels with that contained in this thesis is the work around frequency regulation, where FESSs have been regularly investigated for instantaneous frequency event management [
35,
36,
37]. One such study is the work in [
37], which discusses high-speed flywheels for voltage and frequency support, and concludes that the FESS is well suited to the application. In [
38], a hardware-in-the-loop approach is presented for utilising flywheels for frequency support, showing again that an FESS is suitable for deployment in this area. A key aspect is that the FESSs are shown to be fast-acting in response to frequency deviations, and if this ability can be extended to providing continuous rather than instantaneous support, then they could have a significant impact and suggest an area of work that is worthwhile further exploration.
In a grid services study, ref. [
39] introduces a hybrid BESS/Supercapacitor system for providing a frequency response service. It concentrates on optimisation of the capacity of the two units to extend battery lifetime and economic benefits. Whilst positive economic and degradation effects are claimed, there is minimal reference to the technical performance of the systems. It does, however, outline the potential for hybridisation in these applications.
A significant piece of work previously conducted in this field is that presented in [
40]. This work looks specifically at utilising FESSs to counter the ageing of a BESS providing frequency regulation. Whilst this study is promising, especially in its conclusion of a circa 20% extension of battery lifetime, there are significant gaps that can be exploited and improved upon. The main area that is not considered by the work is that the analysis is conducted on a generic level, with little analysis of the actual performance of the system in providing the service. Additionally, the ageing cycles are repeated short-duration events, rather than a longer simulation exposing the system to different types of charge profiles. Finally, no economic analysis is conducted to determine whether this battery lifetime extension would be offset by the cost of introducing the flywheel. There is significant scope for a far more in-depth study from both a technical and economic perspective.
2.3. Economic Literature Review
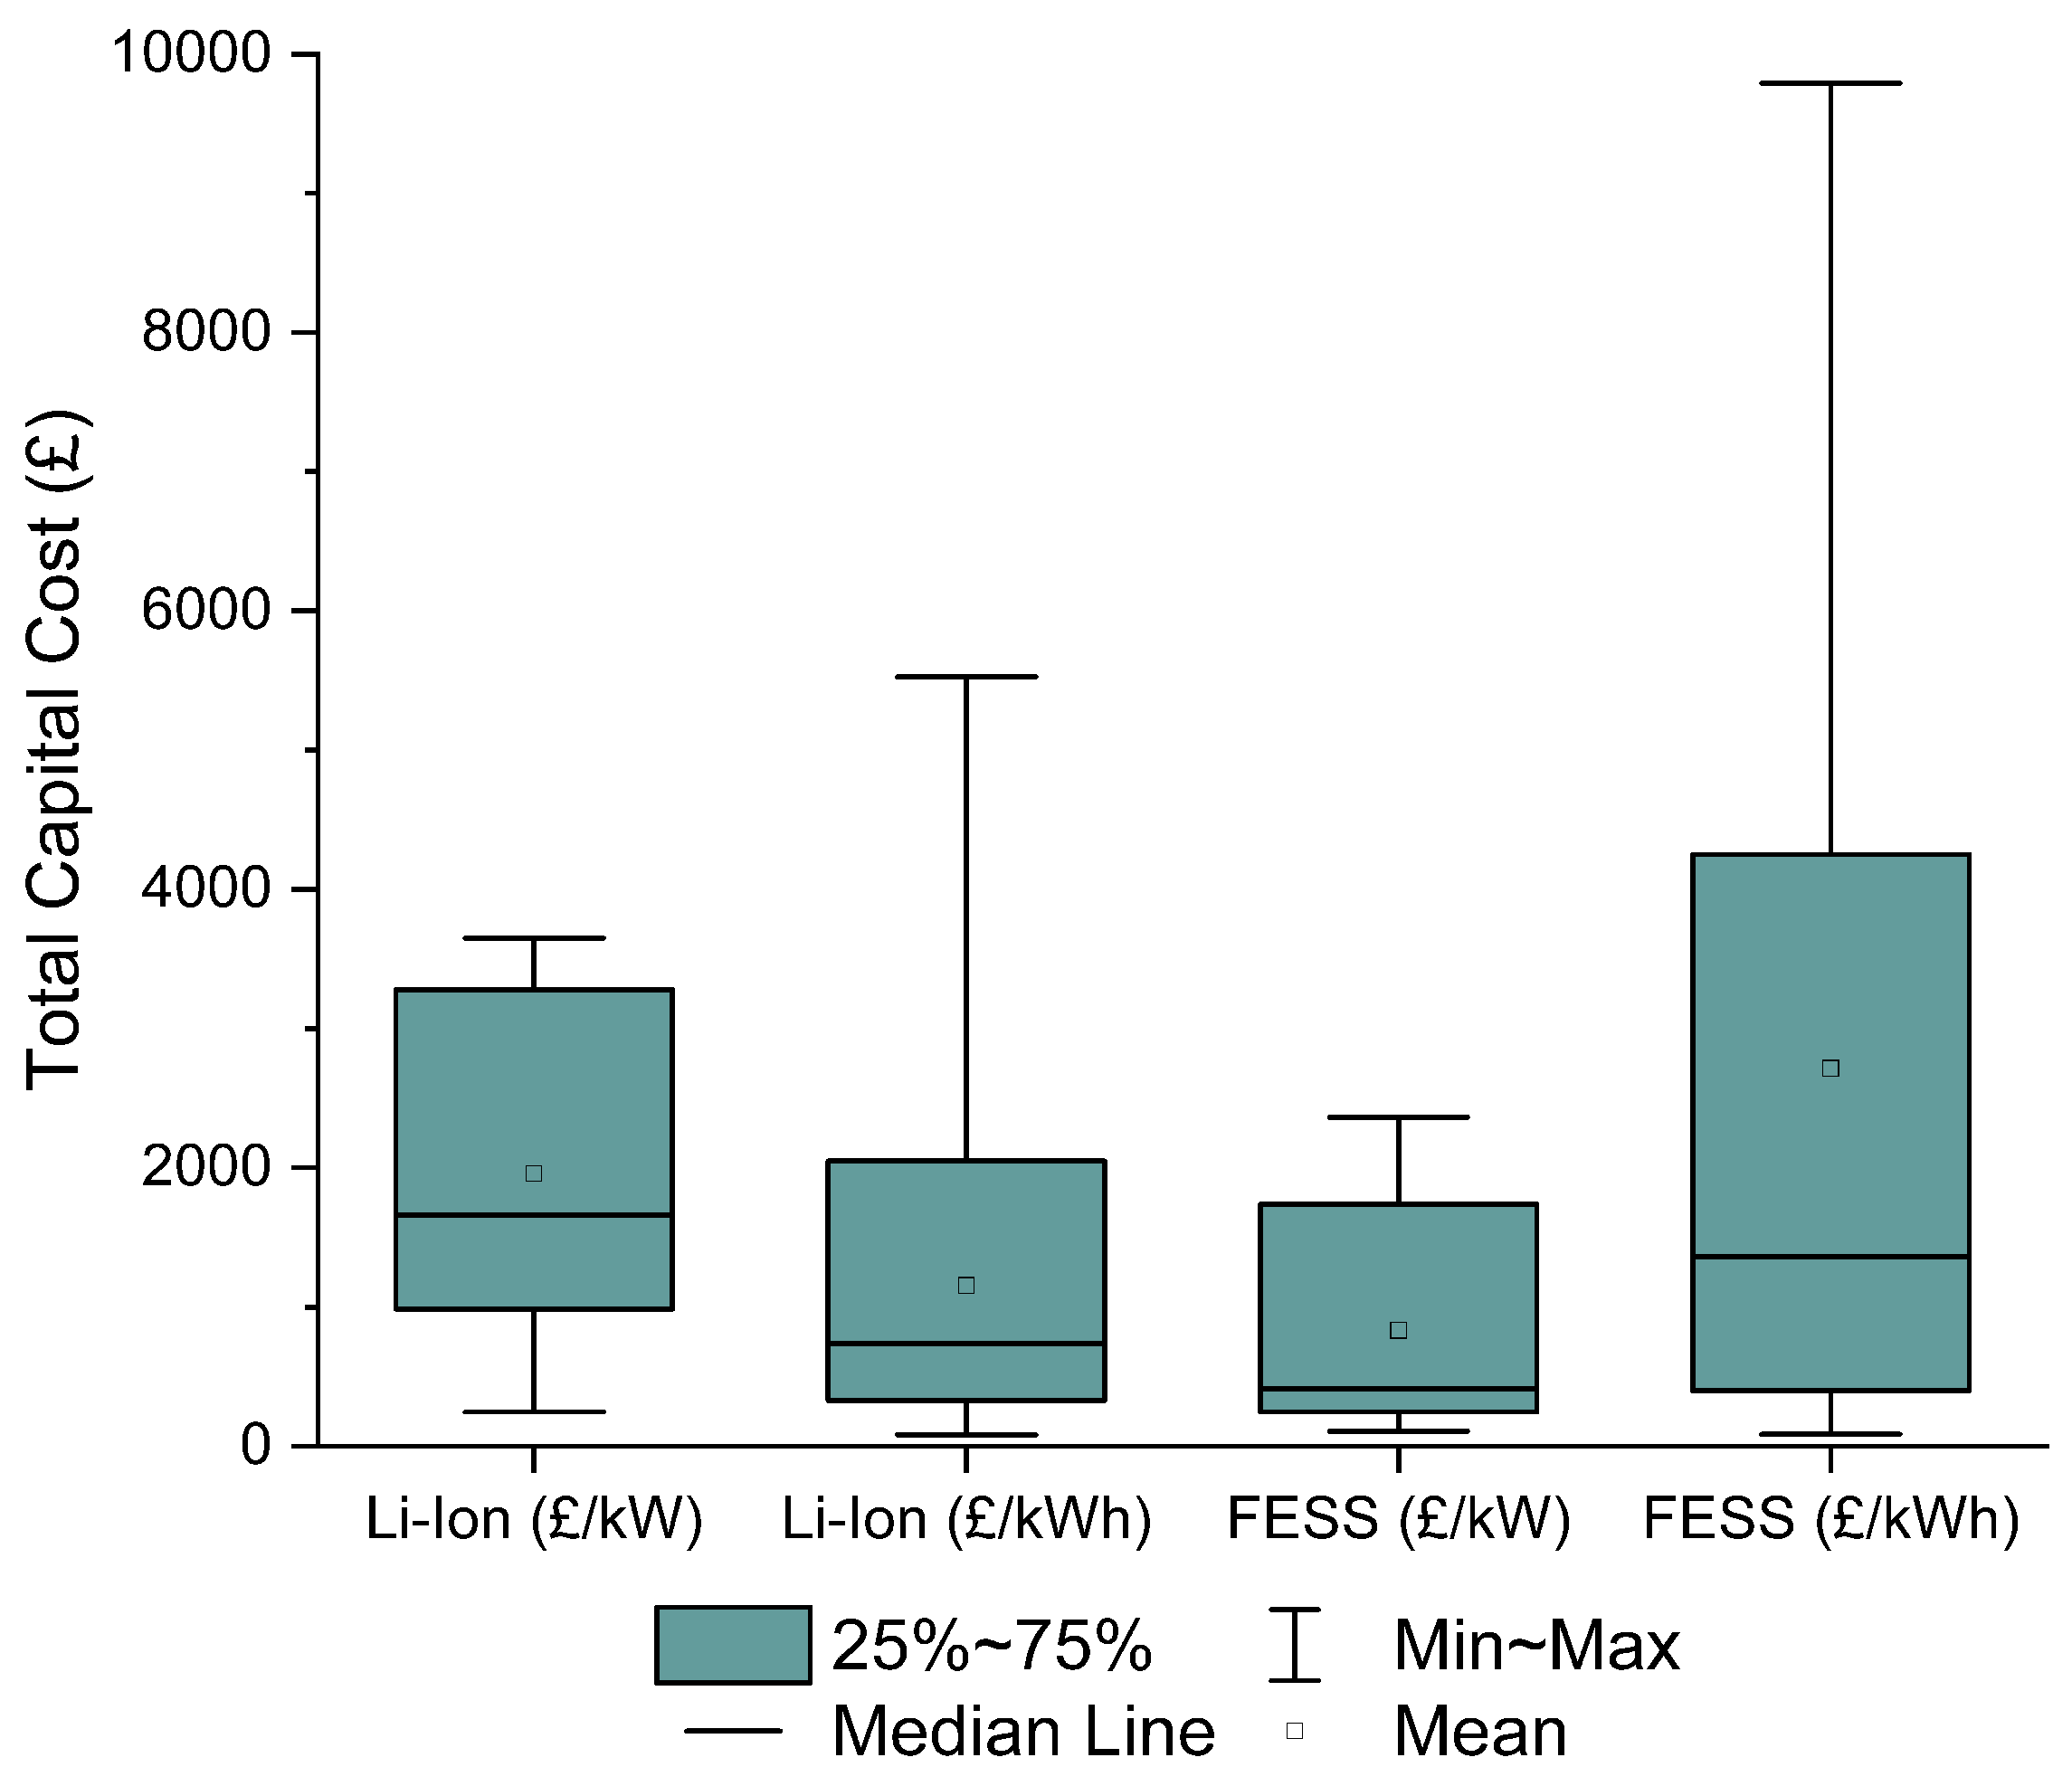
The most widespread method of stating the cost of an individual ESS is to use Total Capital Cost (TCC). This can be expressed either in terms of cost per kW (power-based) or cost per kWh (energy-based).
Table 2 shows the TCC values found across the literature for the two main ESS mediums being studied (Li-ion BESSs and FESSs) in terms of both cost per kW and cost per kWh. These data are then visualised in
Figure 5.
It can be seen from
Figure 5 that there is significant variation across the literature in terms of specifying an exact TCC for the two different ESSs. It is also evident, from the literature analysed, that there is more disagreement over assigning an energy-based cost compared to a power-based cost, as the power-based costs fall over much smaller ranges for both technologies.
Firstly, comparing energy-based costs, the FESS has a significant degree of uncertainty within the literature, which can likely be attributed to its status as a still-evolving industry for manufacturers to develop products. The mean value for FESSs is 2700 GBP/kWh and for BESSs is 1150 GBP/kWh.
In terms of power-based costs, there is more agreement with a smaller range of values presented in the literature for both ESS technologies. For these costs, FESSs have a mean of 780 GBP/kW and BESSs a mean of 1950 GBP/kW.
2.4. Economic Metrics
NPV is used across the literature as a means of measuring the present value of future cash inflow with the cash outflow [
54]. A positive NPV means that the installation is economically viable and can expect to provide a return in excess of the discount rate utilised. NPV is calculated using Equation (
2) [
55] where
is the initial investment in the system,
is the yearly income (GBP),
N is system lifetime in years, and
d is the discount rate. The NPV is primarily affected by the discount rate
d which is impacted by factors such as interest rates, inflation and debt levels. In this work,
d is set to 8% in line with previous studies and accounting for current economic conditions [
46,
56,
57,
58].
is calculated using Equation (
3) where
is the availability fee (set as GBP 11.67 as detailed previously),
is the rated power being delivered by the site in MW and
is the performance factor corresponding to the availability calculated for that period using Equation (
1) [
9]. The equation is multiplied by 0.5 to represent the calculation being calculated in half-hourly periods.
The metric Net Present Value Change (NPVC) is used in this analysis to illustrate the change from the baseline NPV, calculated using Equation (
4). where
is the NPV for the site with a given ESS installed, and
is the baseline NPV with no ESS installed.
NPV offers an easily comparable value for how economically viable an installation will be under set conditions [
31]. One of the main advantages of using NPV is that it can be applied across any application where there are associated costs and income, whether that be generation sites or service-based applications.
3. Novel Contribution
It can be seen from the literature that a significant gap exists for both the provision of frequency response services by very short-duration storage such as FESSs and for the hybridisation of these systems with BESS to extract maximum techno-economic benefit. Whilst some papers have partially explored this area, the main studies conducted so far either look at the application on a more generic level or do not concentrate on frequency response services but on a range of other applications.
The main novel contribution of this paper comes in the form of a techno-economic analysis of a standalone FESS providing DFR, showcasing both the benefits and challenges that are faced when attempting to use FESSs for this application. These analyses can have a significant impact on the future research direction for FESSs, giving crucial insight into the conditions required for an FESS to be able to compete with more established ESS technologies in this rapidly growing application.
The study is then evolved into a hybrid study, introducing an element of BESS to analyse the effect that hybridisation has on the techno-economic performance of the site. This novel set of analyses shows for the first time the techno-economic conditions under which an FESS could provide the DFR service, along with the potential for utilising them in a hybrid scenario. The work gives key conclusions that can inform further works on the potential of hybrid ESSs for grid-based applications.
This paper represents the most comprehensive analysis of FESS viability for the provision of frequency response services to date. Using a novel detailed model set informed by real-world manufacturer data, it highlights for the first time the various configurations of FESSs that could technically perform such services to the required level whilst also showing the economic characteristics required to make these systems commercially viable. The work on hybridisation presented here represents a significant advancement in the understanding of the fine balance between positive and negative repercussions of installing ESSs, showing the nuances of how small technical and economic changes can cause an installation to become unsuitable for deployment.
4. Technical Analysis
In this section, both a standalone FESS and an FESS hybridized with a BESS are analysed from a technical perspective, producing novel results that highlight the capability of such systems to provide frequency response services. The work contained in this section is important in both exploring the capabilities of standalone FESSs, and emphasising the advantages gained by considering hybridisation as an option when delivering these services.
In this study, the FESS power is kept constant whilst the C-Rate is varied. The C-Rate represents the charging/discharging speed of an ESS, where a 1C system would charge from 0% SOC to 100% SOC in 1 h, whilst a 2C would take 30 min. It is calculated using Equation (
5) [
59], where
is the energy capacity in kWh and
is the rated power of the system in kW. Typically, FESSs are considered to be high C-Rate assets, regularly being specified as 10C and above [
13,
60,
61]. However, some FESS installations are now being proposed with C-Rates as low as 0.25C [
25,
62].
For the first part of this study (standalone FESS), the DFR service to be delivered is set at 1 MW, and the FESS power rating is kept constant at 1 MW. The energy capacity is then varied by changing the C-Rate of the system. The system is simulated providing a 24/7 DFR service between November 2020 and October 2021. The chosen C-Rates are based on representations of FESS systems available in today’s market and are varied from 0.25C to 20C.
Table 3 summarises the different configurations used for this study.
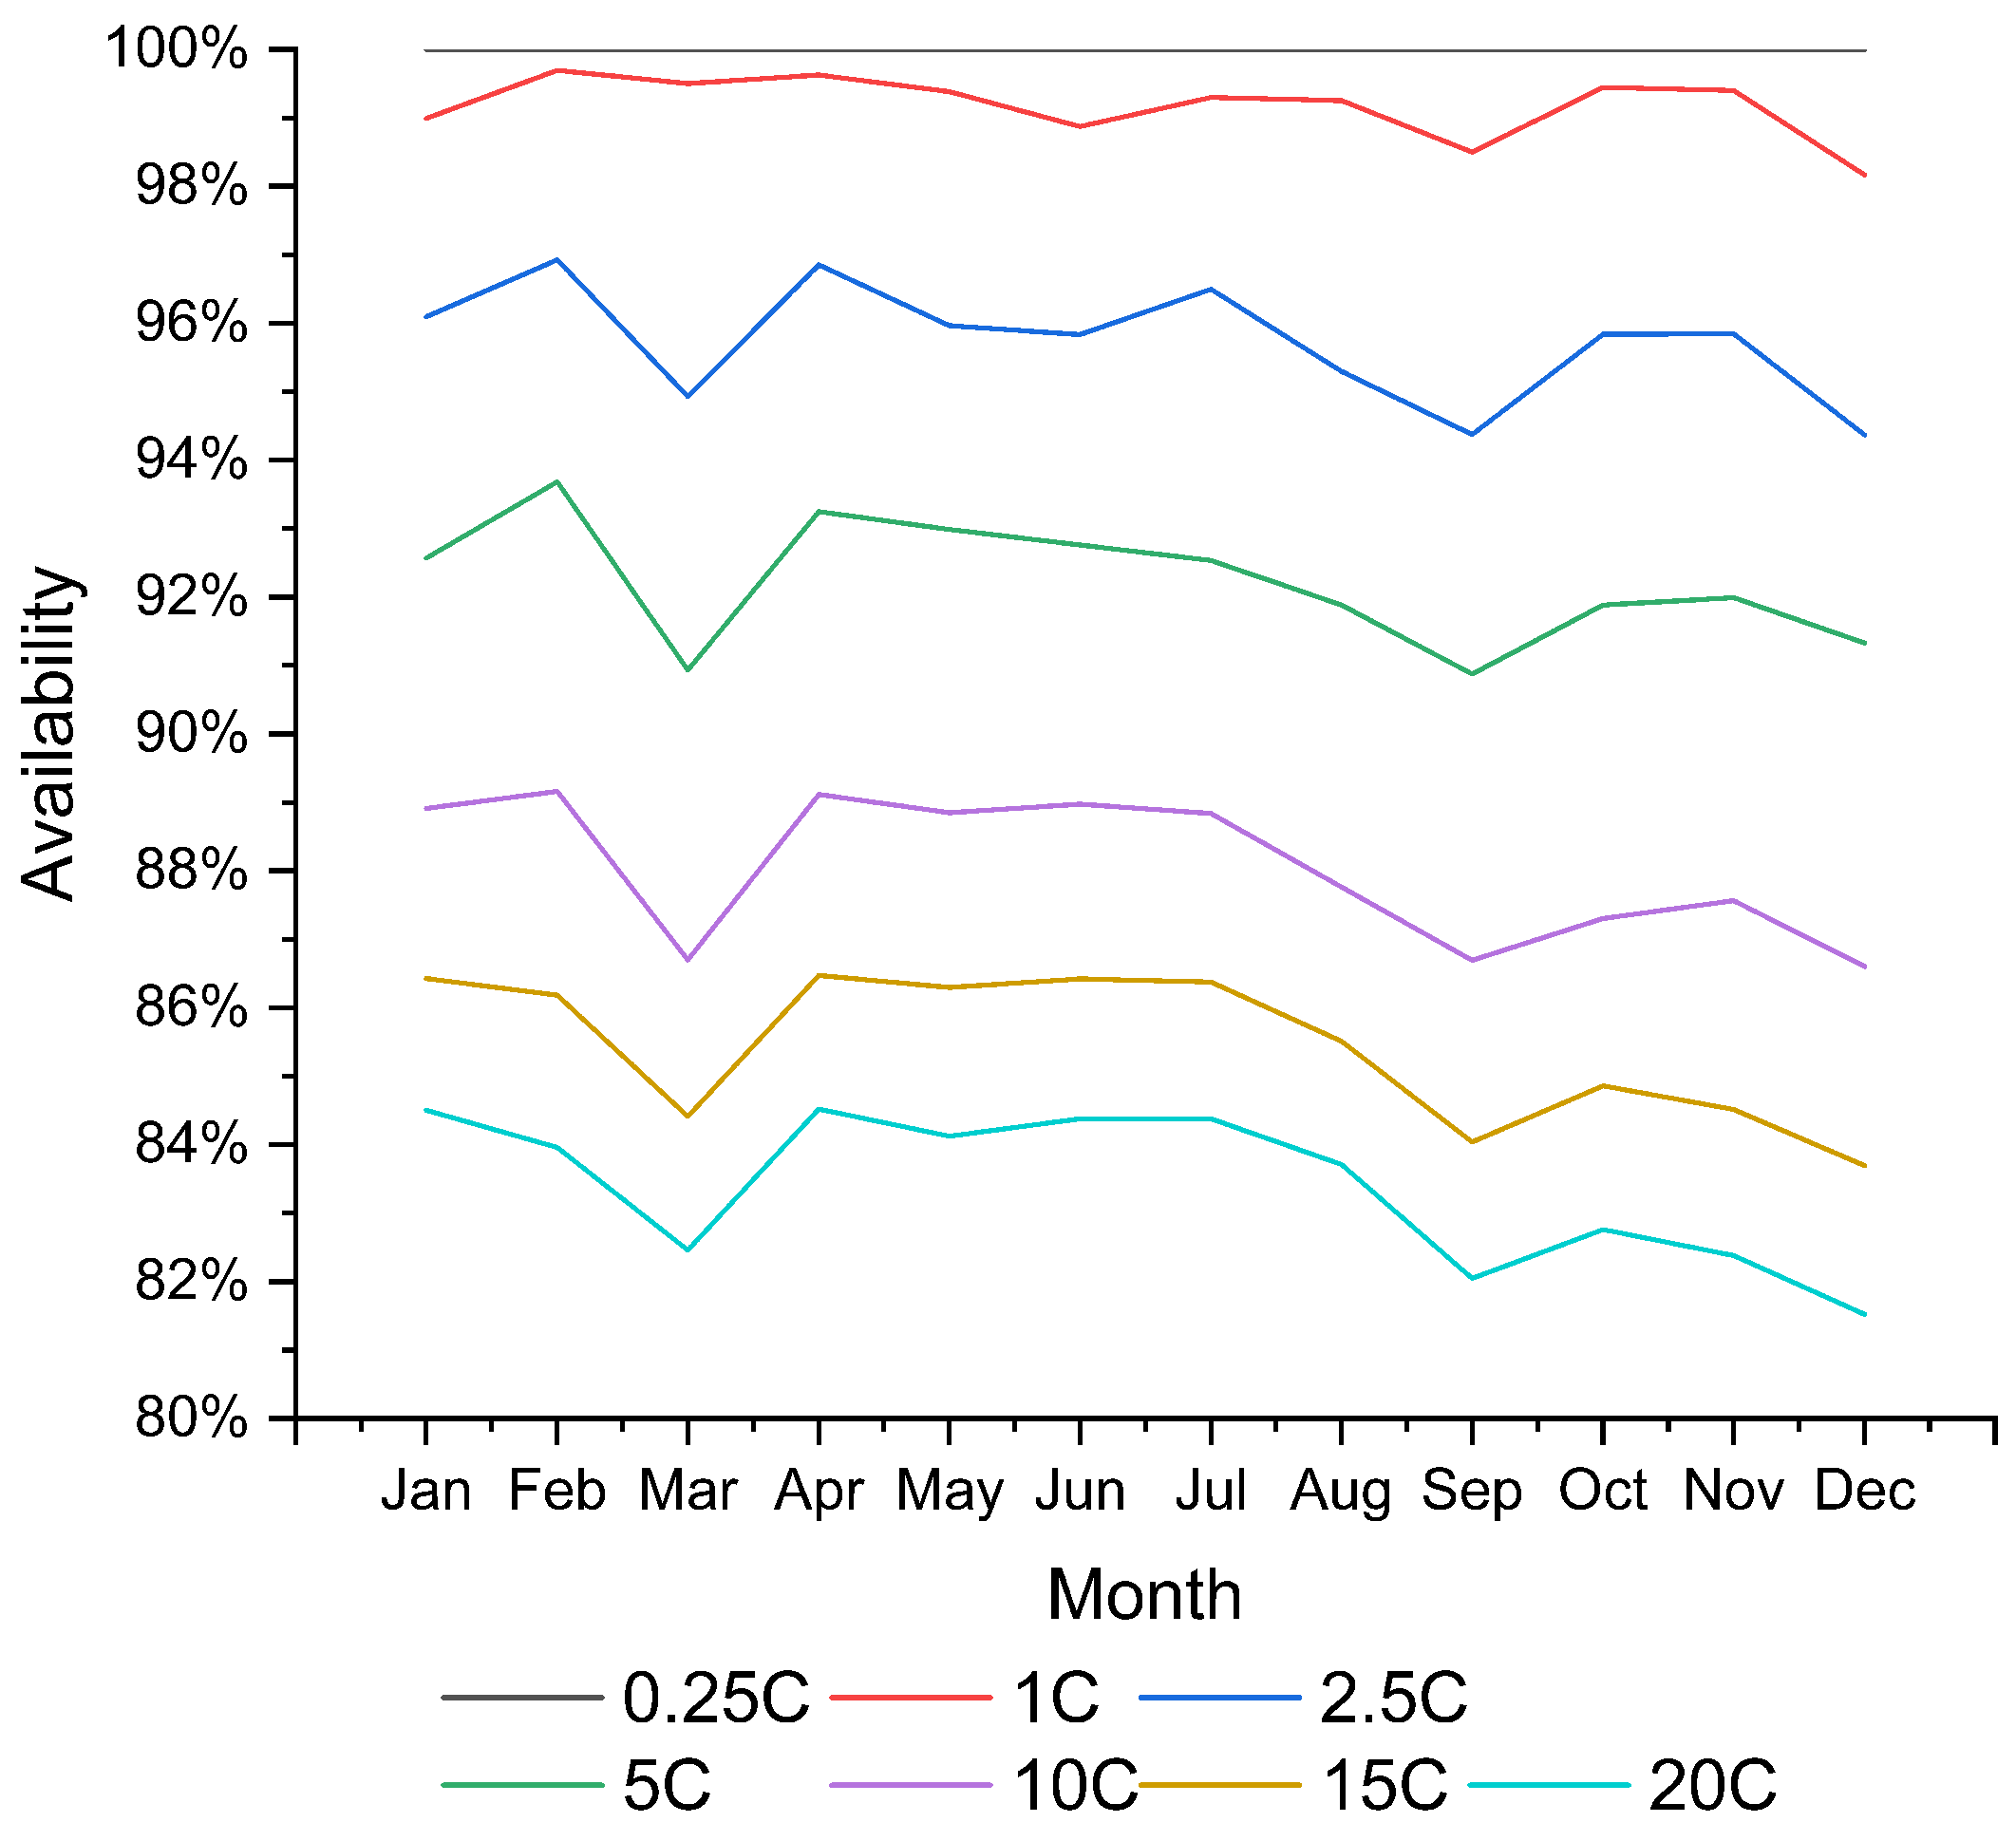
Availability is the key technical performance metric for systems delivering DFR, where they are required to be available a minimum of 95% of the service duration, if the availability falls below this value then the payment for that period is reduced. If the ESS reaches its high SOC limit then it is unable to provide any requested charge power, while if it reaches its low SOC limit, it is unable to provide any requested discharge power. In both of these scenarios, this would result in the availability for the duration of such an event to be zero. The equation for Availability has been defined previously in Equation (
1) and is the sum of each second where the system is classed as available over the entire service duration. Through simulation, the average availability was calculated across the 12 months studied (November 2020 to October 2021), with the results of this shown in
Figure 6.
Figure 6 shows the initial results of availability analysis for standalone systems, with 95% availability achieved for the entire duration when considering configurations A and B. Configuration C achieves this metric 9 out of 12 months of the year, with performance falling further as the C-Rate is increased (and the energy capacity is decreased). This shows how important energy capacity is for providing this service, and suggests that more power-centric FESSs may not be suitable as standalone ESSs.
This initial analysis suggests that FESSs in the range of 0.5–2.5C would be viable for providing this service. Whilst this does suggest the traditional configurations of FESS would work for providing this service, it does not rule out FESSs generally as there are similar configurations available on or coming to the market [
25,
62].
Table 4 highlights two further performance metrics for the range of FESS configurations studied. As the C-Rate is increased, the cycles experienced by the system also increase significantly from 742 cycles per year for a 0.5C system to 10,138 cycles per year for a 20C system. At the higher C-Rates, some FESSs may experience reduced lifetime as a 100,000 cycle limit is quoted across the literature and manufacturers’ information. However, many manufacturers also quote cycle lifetimes as <500,000, a scenario in which all configurations would not reach their cycle limit within a 20-year lifetime.
Additionally, it can be seen that the higher C-Rate systems trend towards a lower average SOC, which is likely a result of the rapid charging and discharging of power leading to the FESS reaching both high and low SOC limits on a regular basis.
5. Economic Analysis
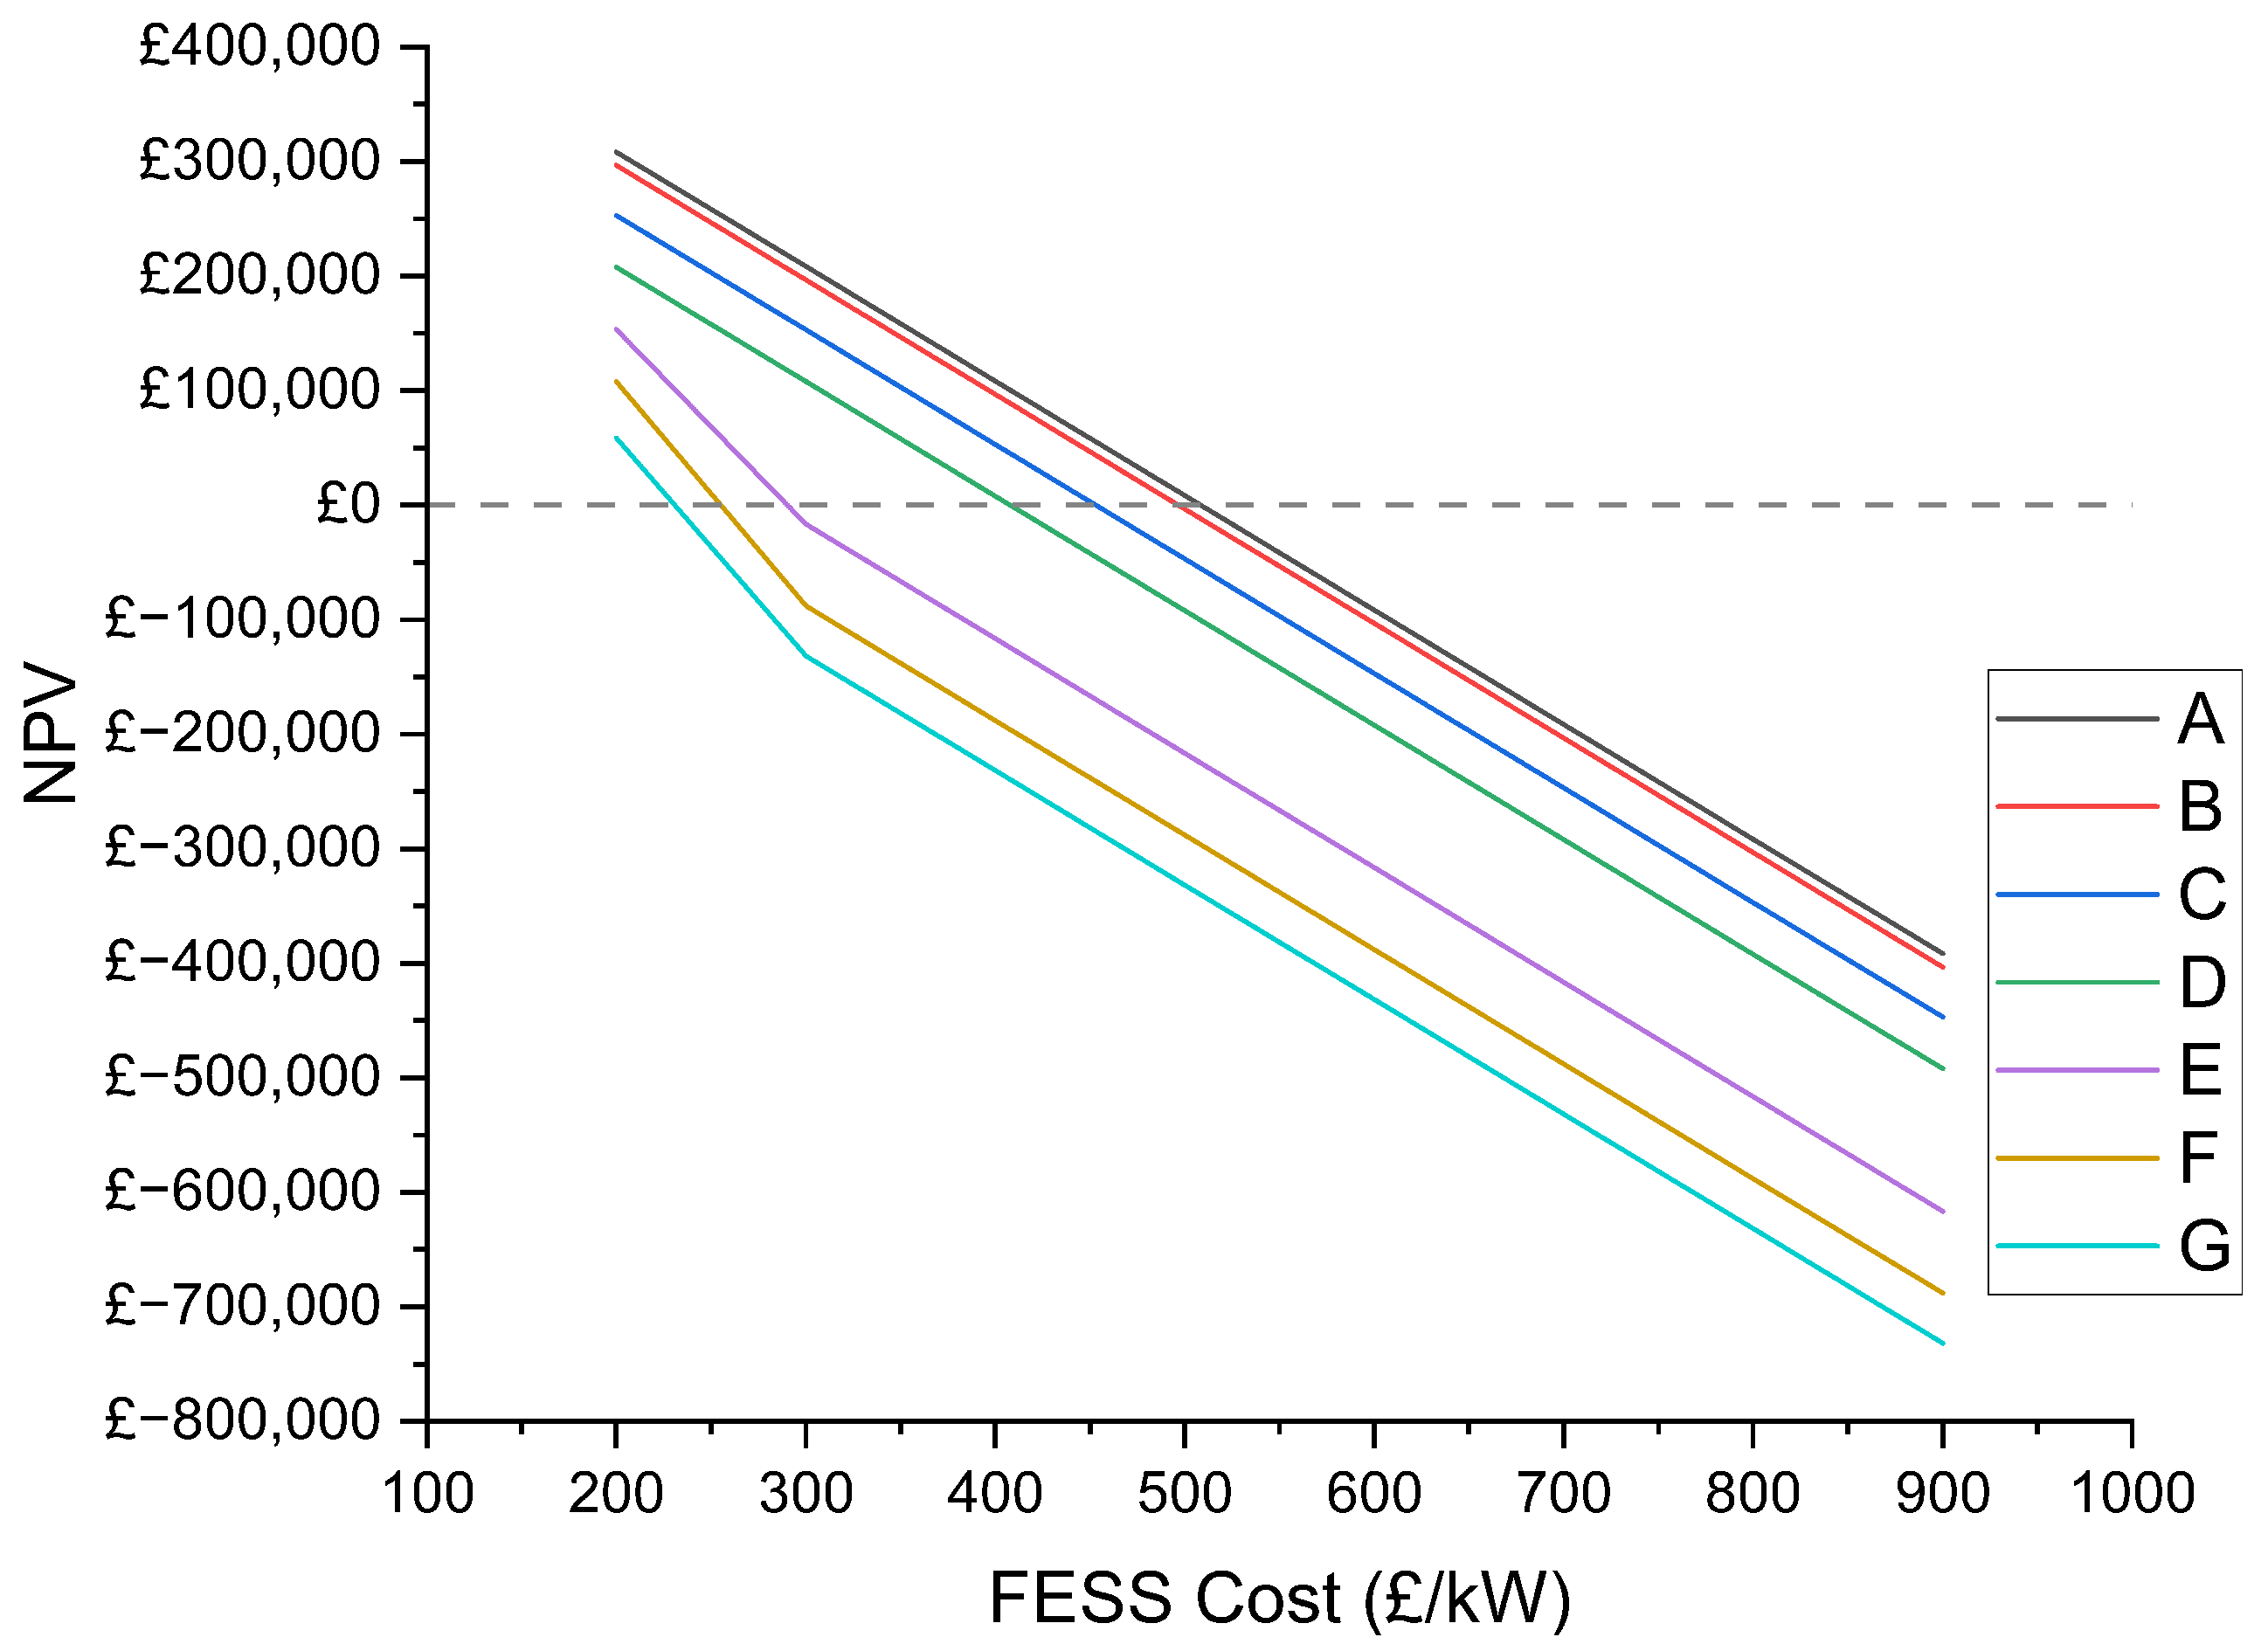
For the economic analysis, the FESS TCC was varied between 200 GBP/kW and 900 GBP/kW. This range of values was chosen after an iterative simulation process showed this range to sufficiently show the financial trends in both directions for analysis purposes. This range covers the lower end of the spectrum discussed above. The results of calculating the NPV of the system over an operational period of 20 years for different TCC values and FESS configurations are shown in
Figure 7.
Figure 7 shows that the lower energy FESSs achieve the best economic performance. For configurations A and B, a TCC of 496 GBP/kW and below would produce a positive NPV. However, configurations E, F and G only provide a positive NPV at the lowest FESS cost studied. For these configurations, there is a sharp drop in NPV between 200 GBP/kW and 300 GBP/kW. This is due to the systems reaching their cycle capacity before the end of the 20-year lifetime studied, and hence they only begin to counter this additional cost of replacement at very low TCC values.
5.1. Cycle Limit Sensitivity Analysis
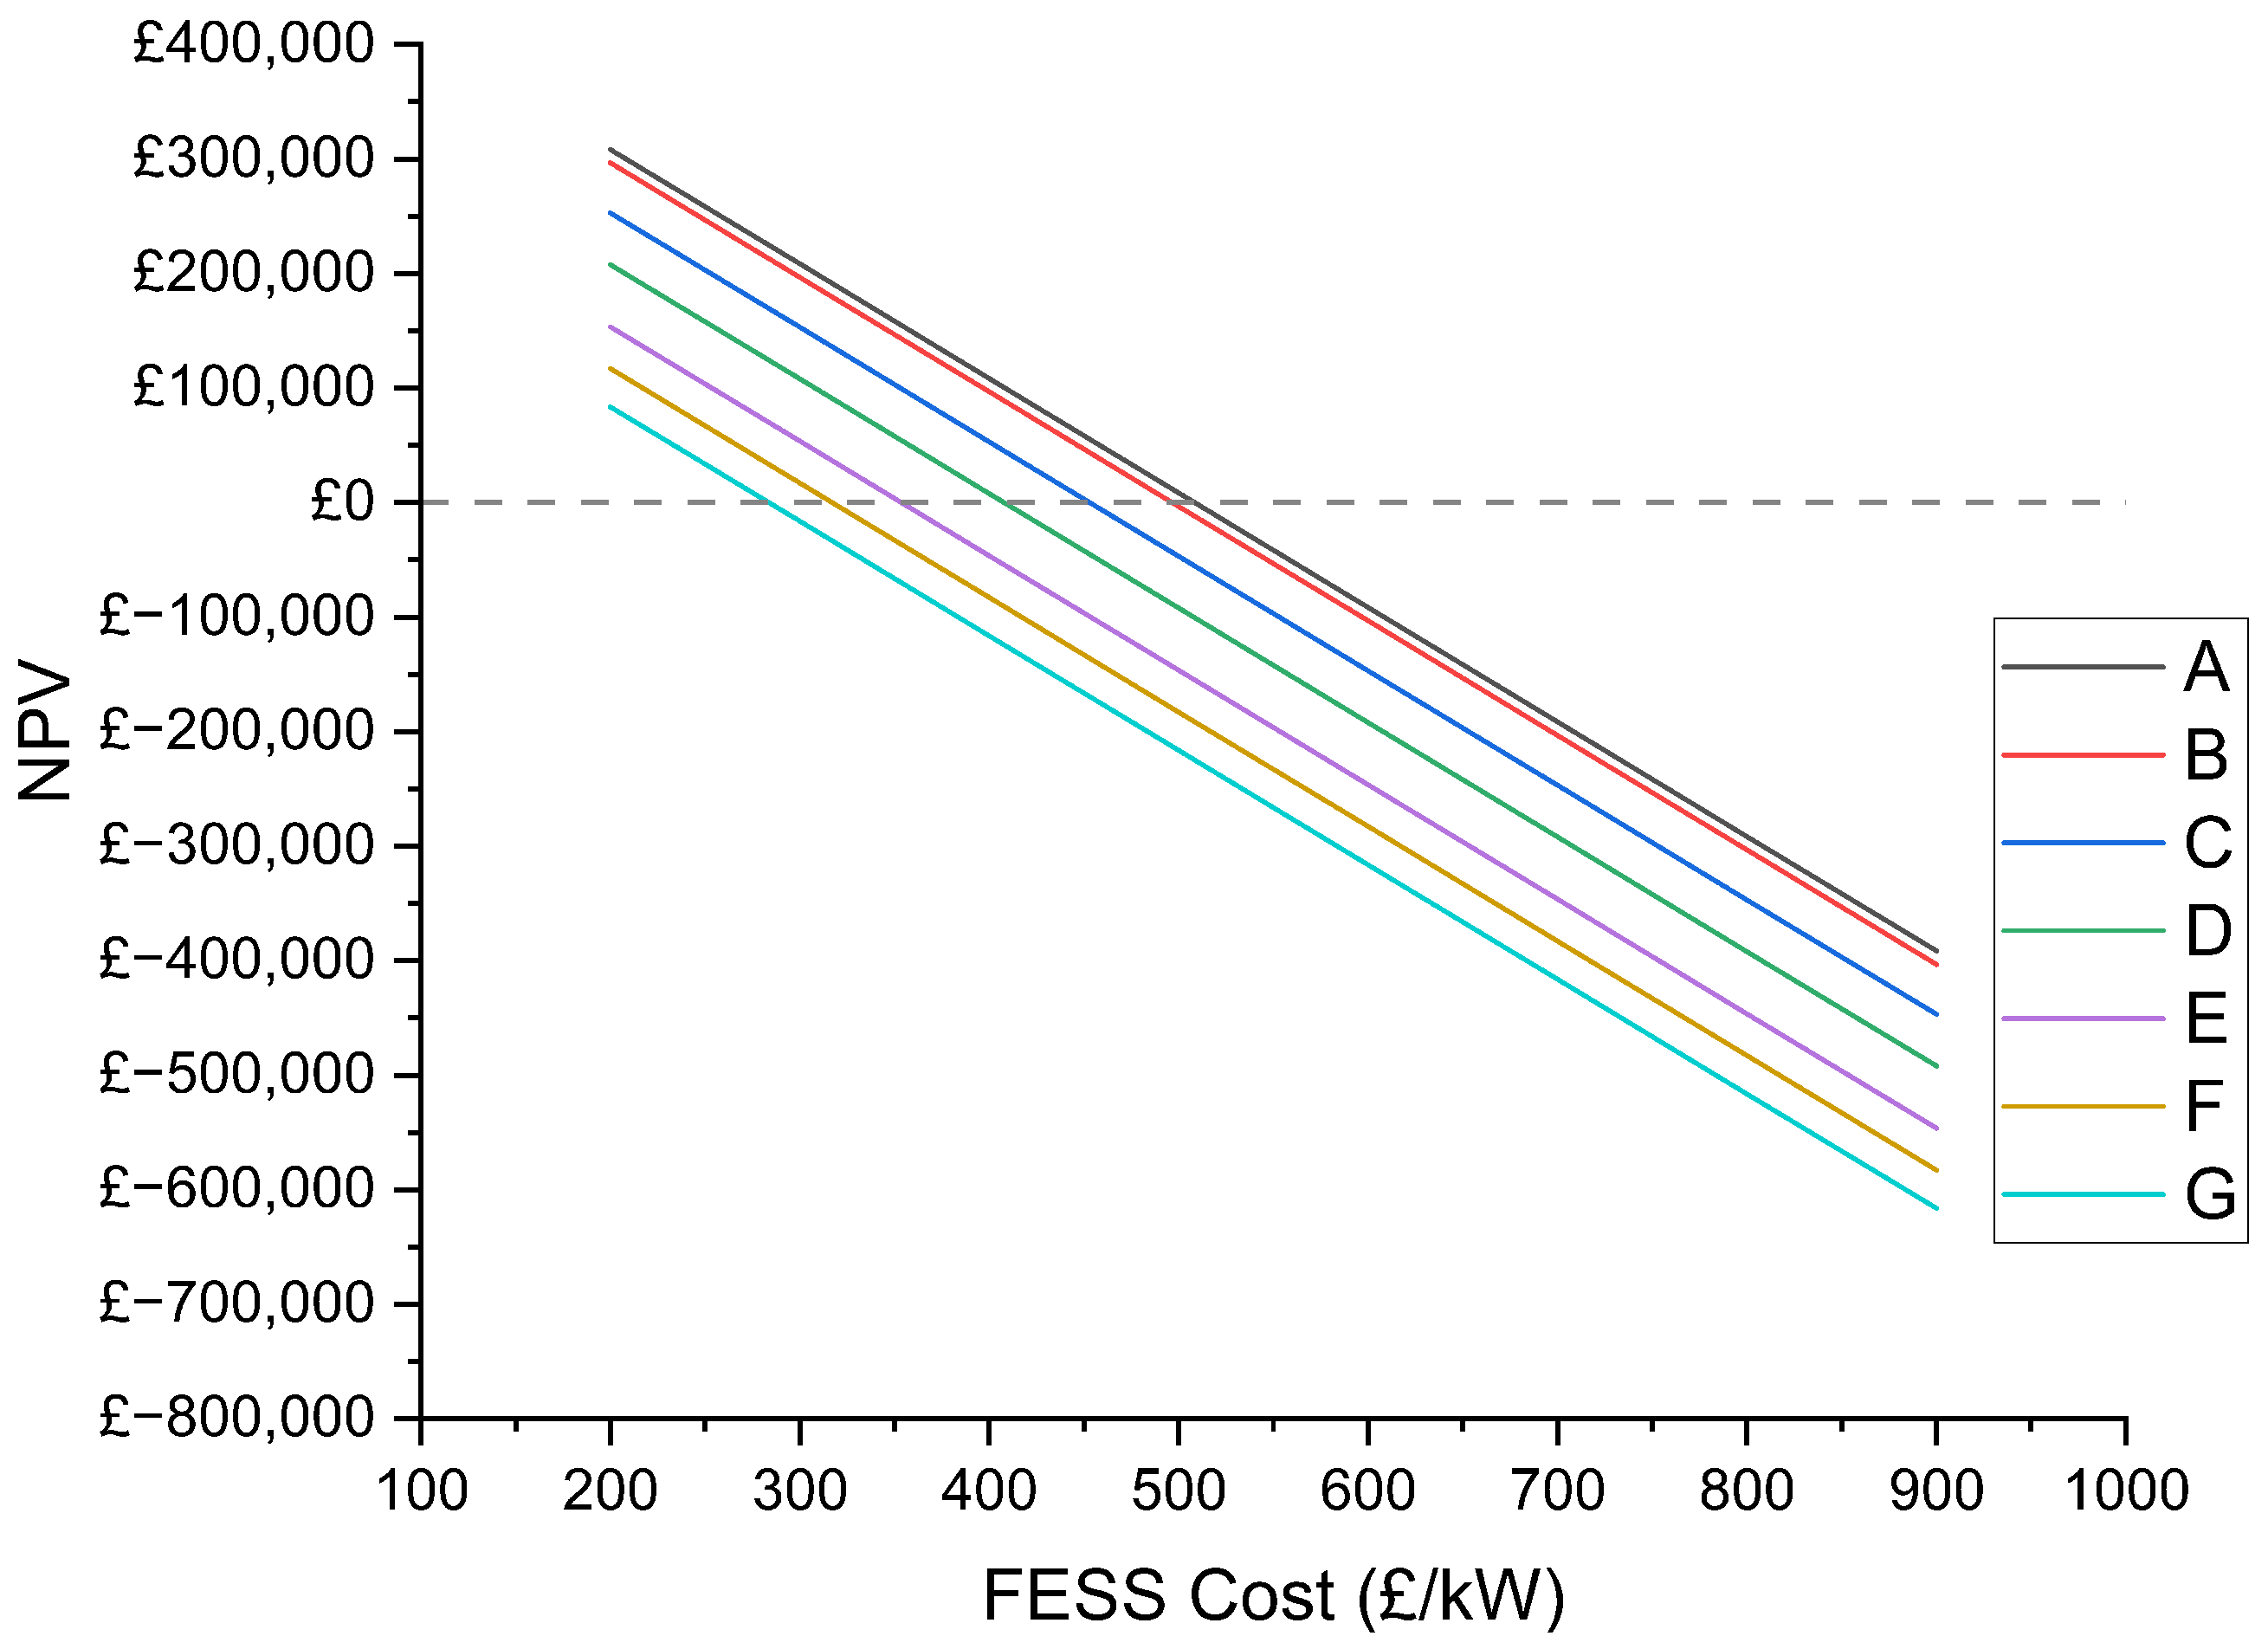
Initially, this study was undertaken with an FESS replacement threshold of 100,000 cycles, at which point the economic calculations include the cost of replacing the system. However, as previously discussed, many manufacturers quote their systems as having unlimited lifetimes [
63,
64,
65]. Considering this, the study was repeated with the FESS replacement threshold set to 250,000 cycles, and the results are shown in
Figure 8. The TCC values at which the NPV of the system becomes negative for all configurations and both cycle thresholds are also shown in
Table 5.
The results of increasing the cycle limit are seen in
Figure 8 where Configurations E, F and G now perform better economically than at the lower cycle limit as they do not require replacement during the 20-year operational lifetime. In
Table 5, it can be seen that configuration E now produces a negative NPV above 353 GBP/kW rather than the 290 GBP/kW produced for the lower cycle limit. For any standalone FESS to deliver this service it is clear that significant reductions in the cost of such systems will need to be achieved when compared to the costs currently quoted within the literature as all values fall below the previously discussed TCC of 780 GBP/kW.
This analysis provides a good indication of the TCC values that will need to be met by different FESS configurations in order to be viable for delivering this service as a standalone unit. This study has been conducted with a discount rate of 8%; however, increases in economic performance would be expected if this was lowered, which could be achieved depending on outside economic scenarios, such as lower inflation or interest rates.
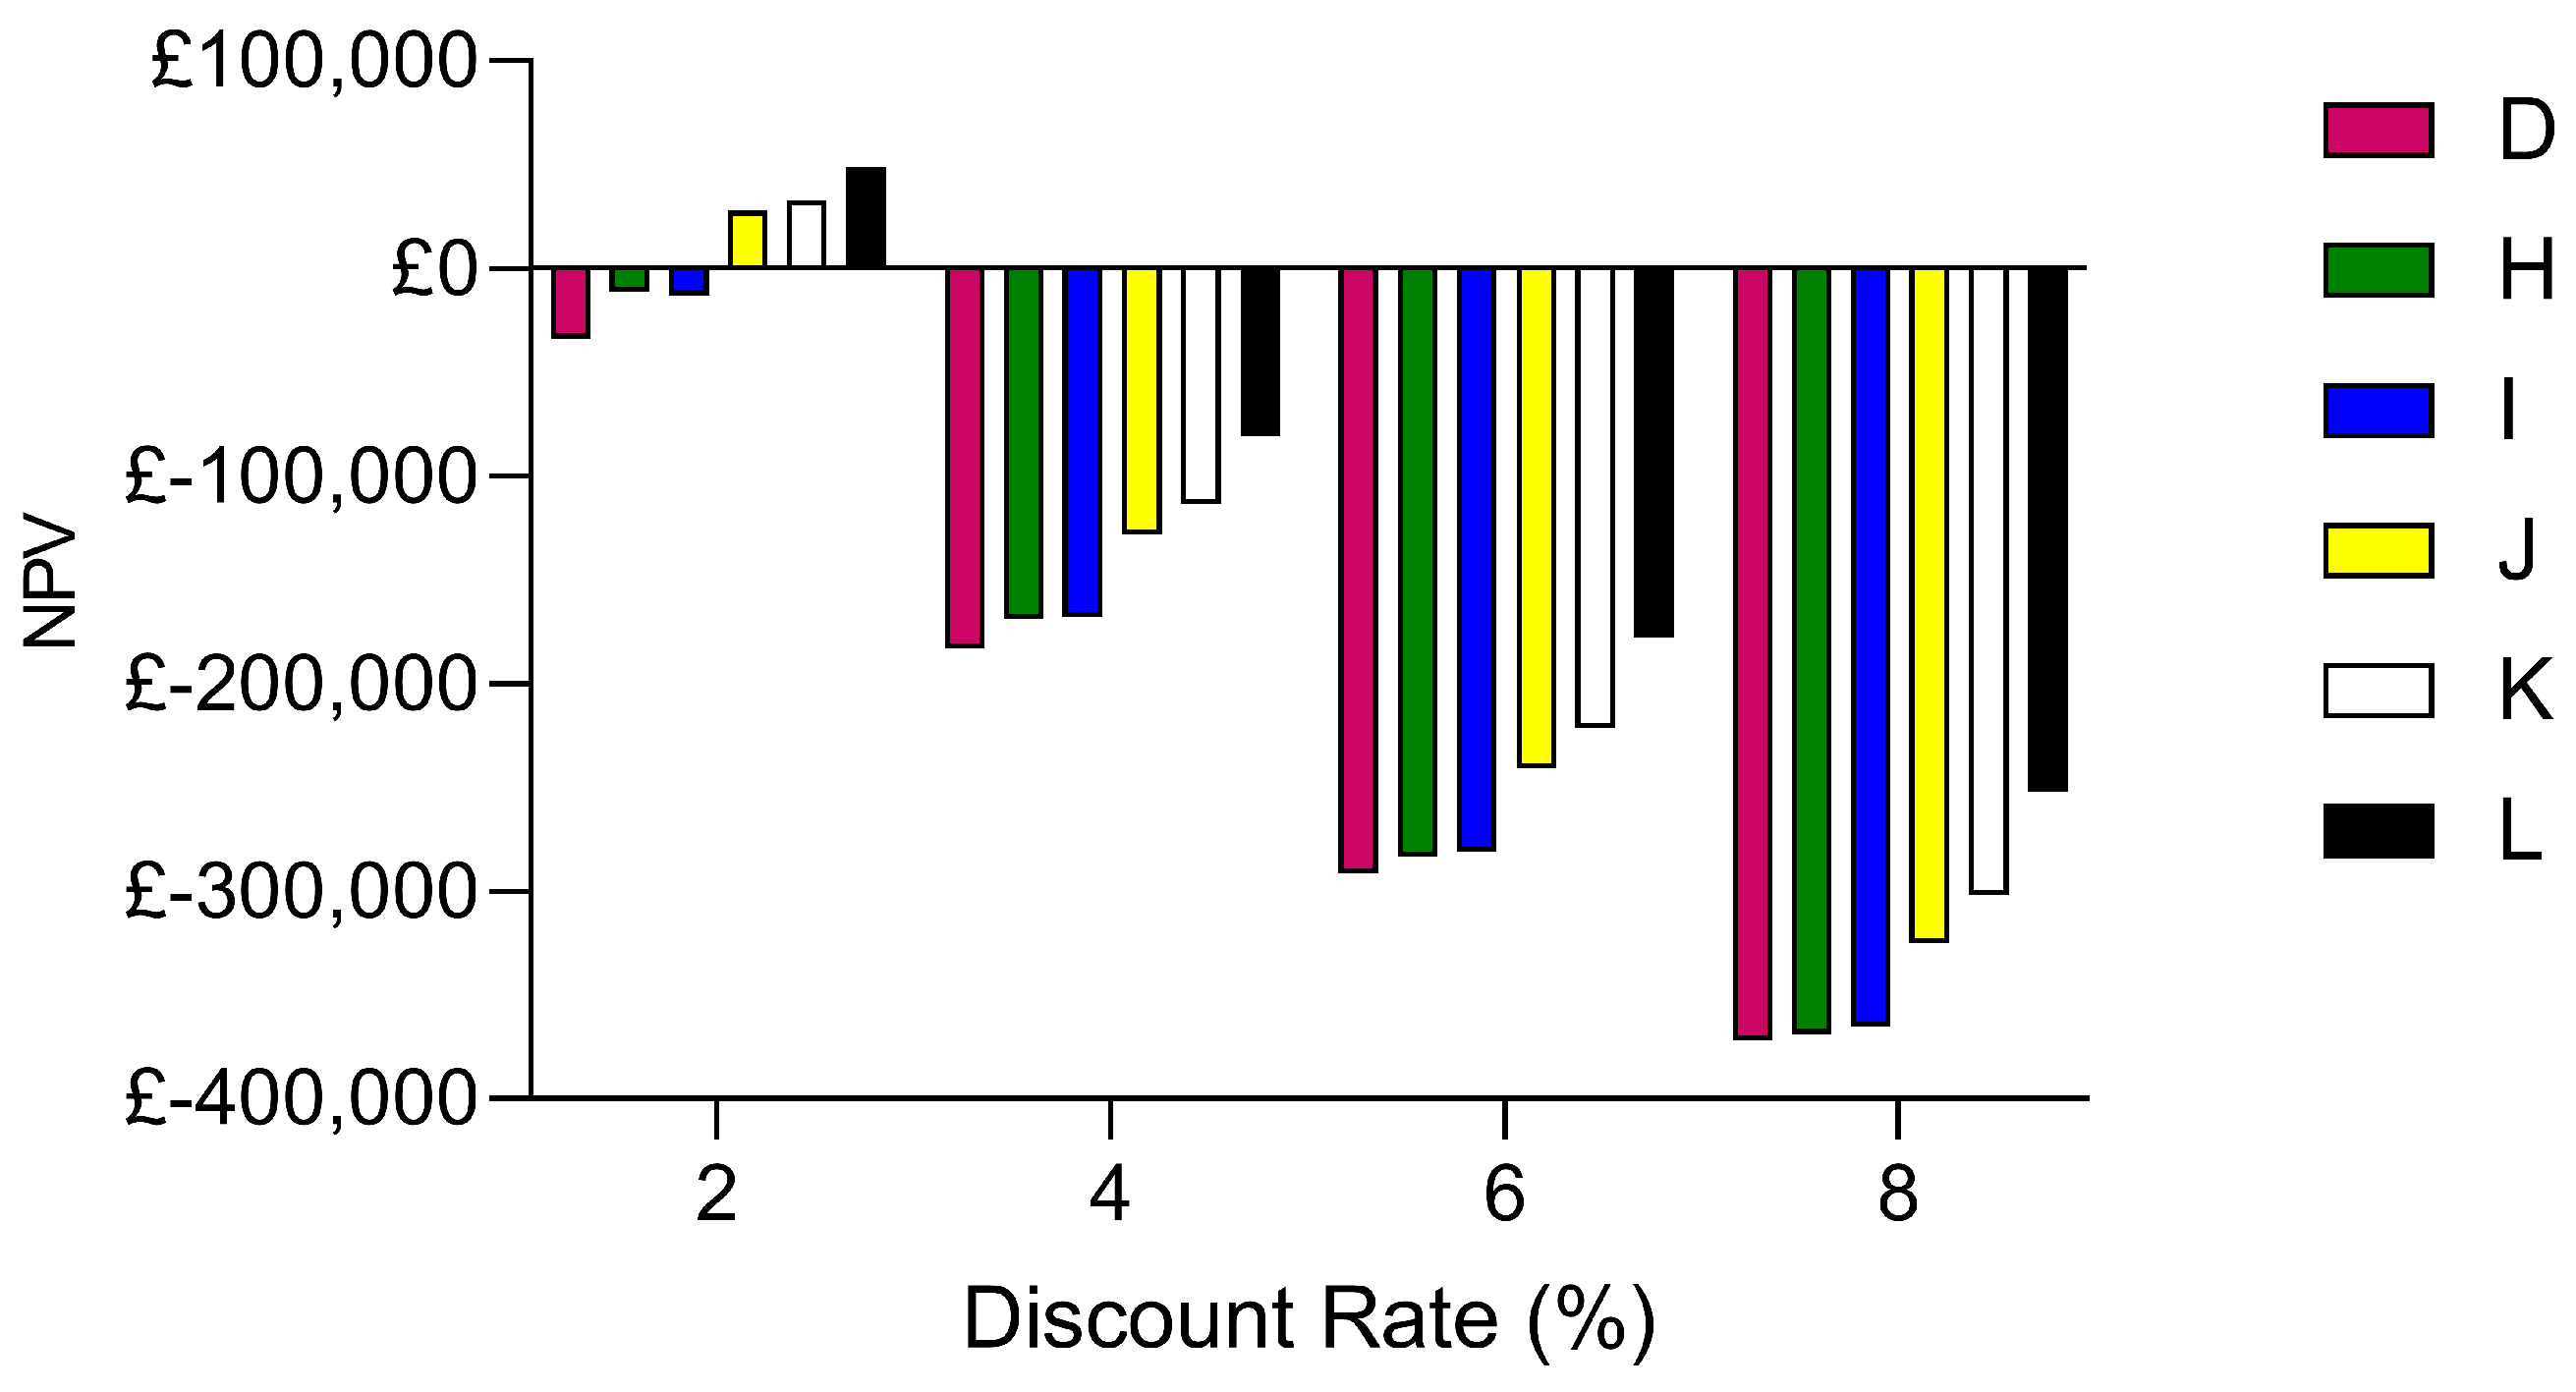
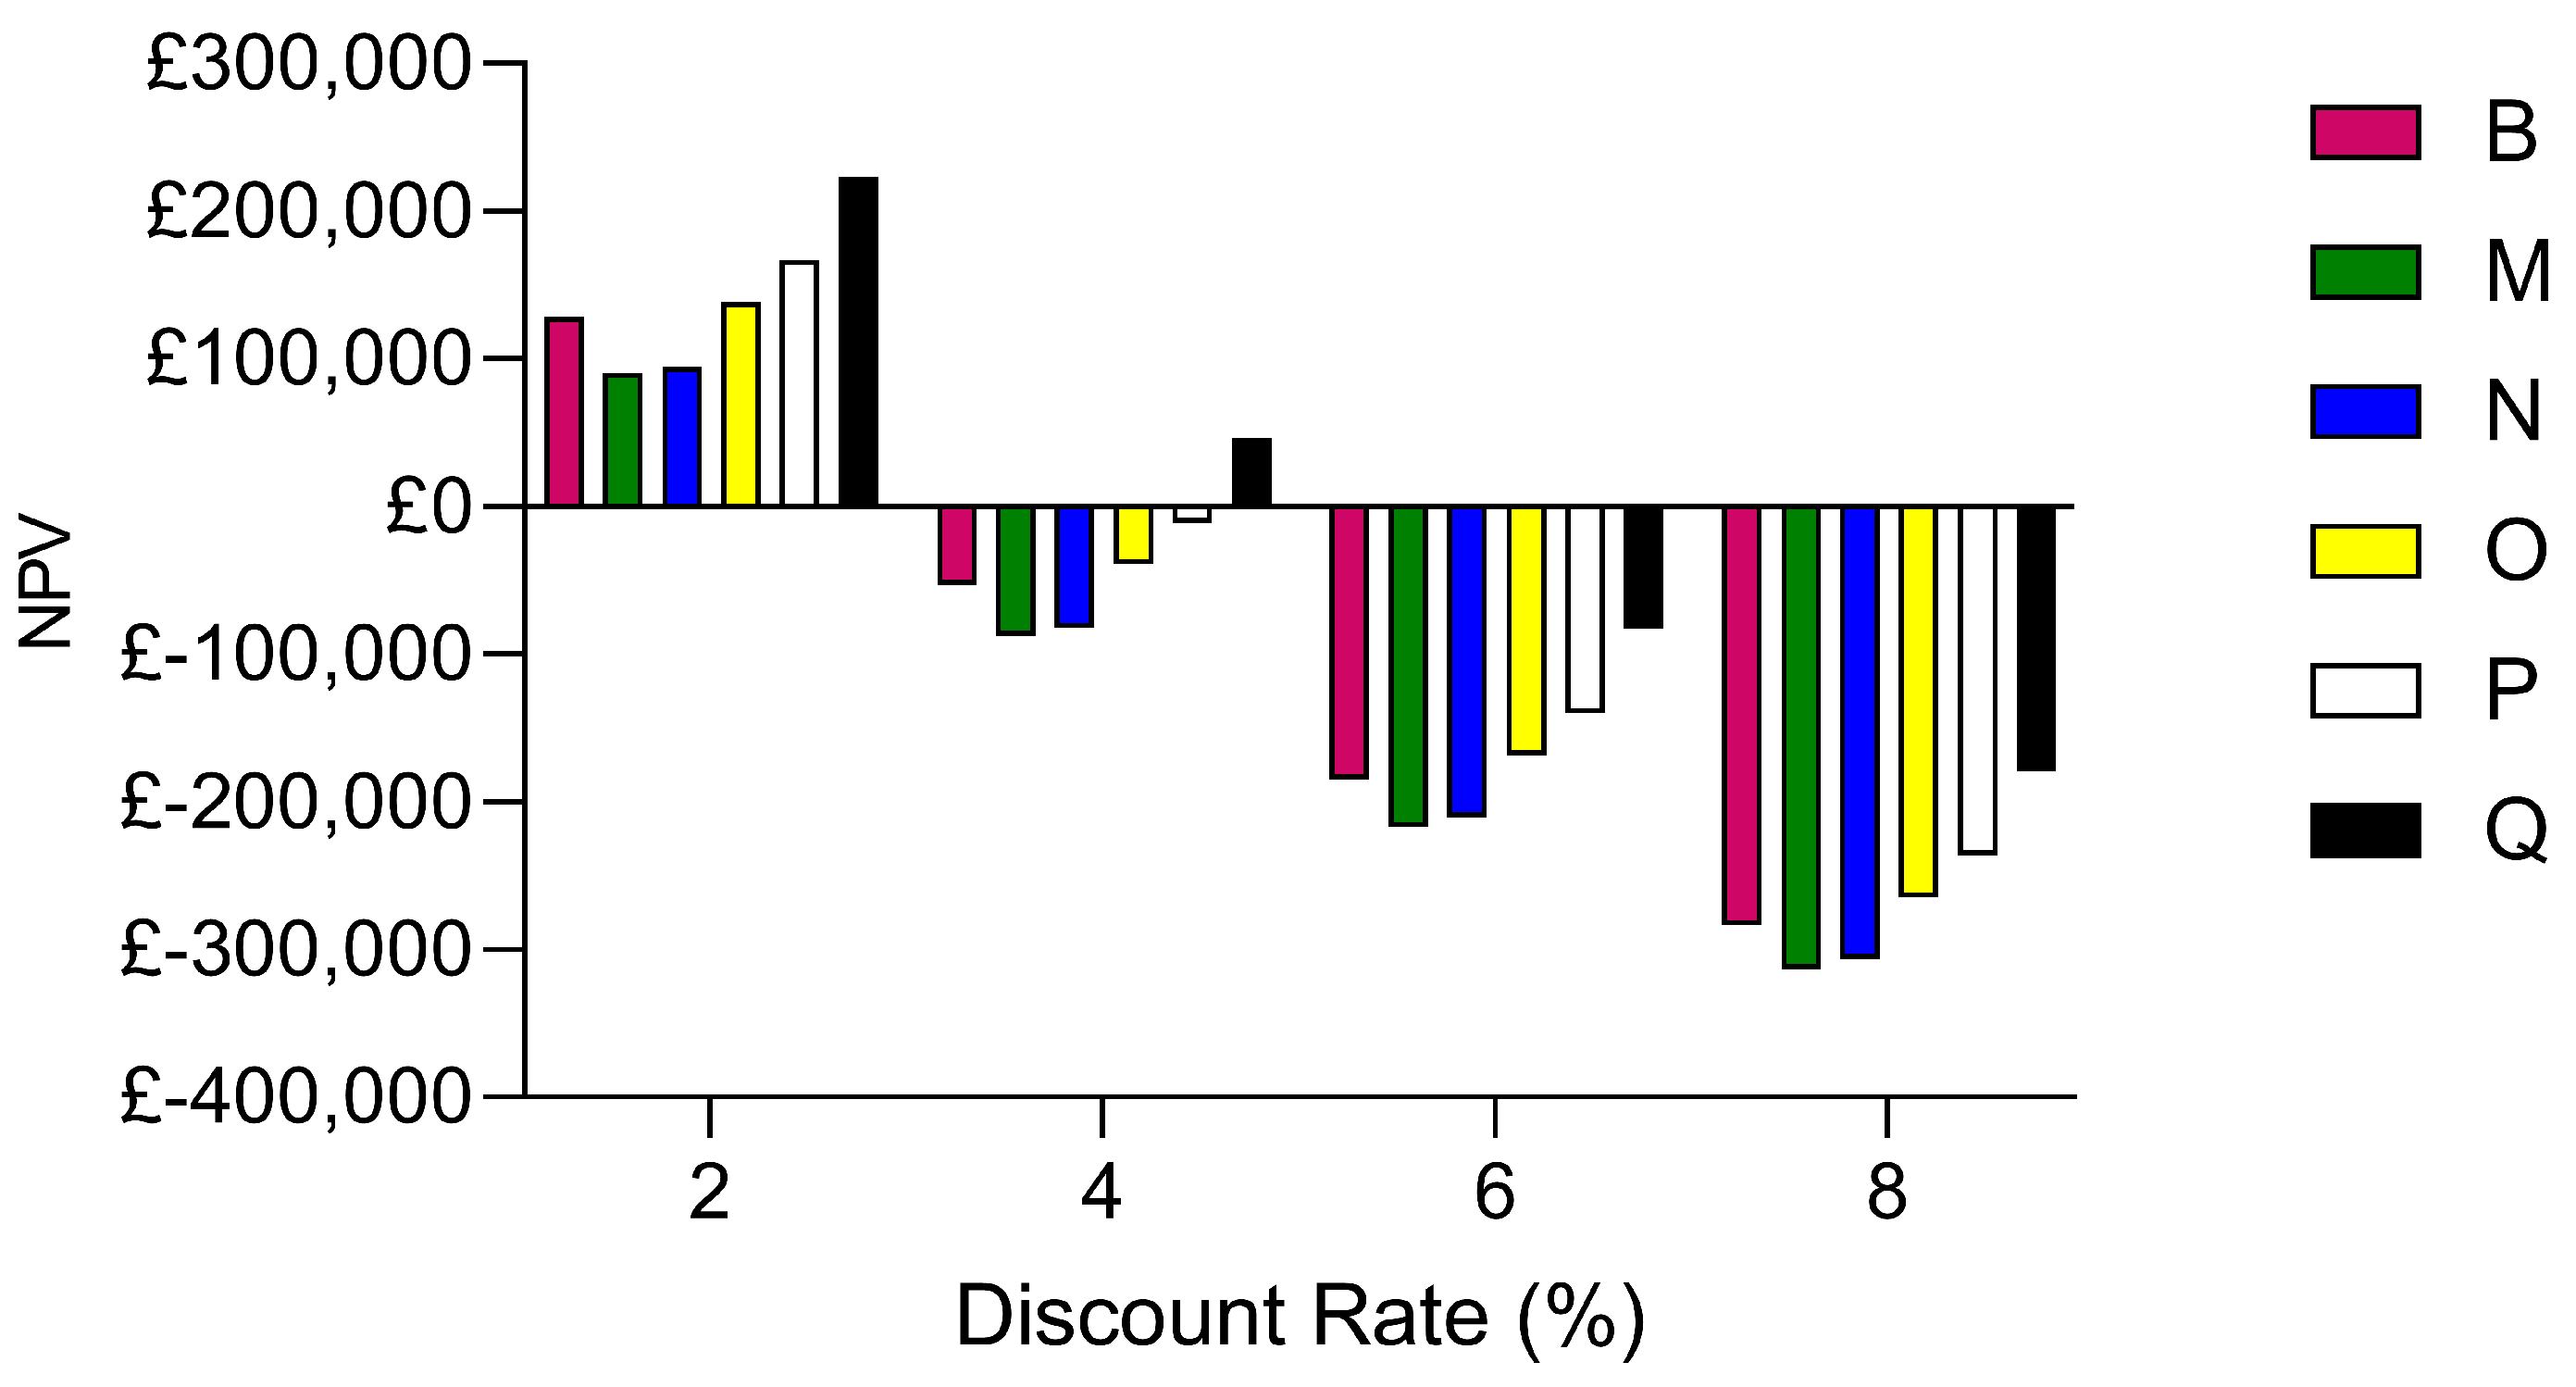
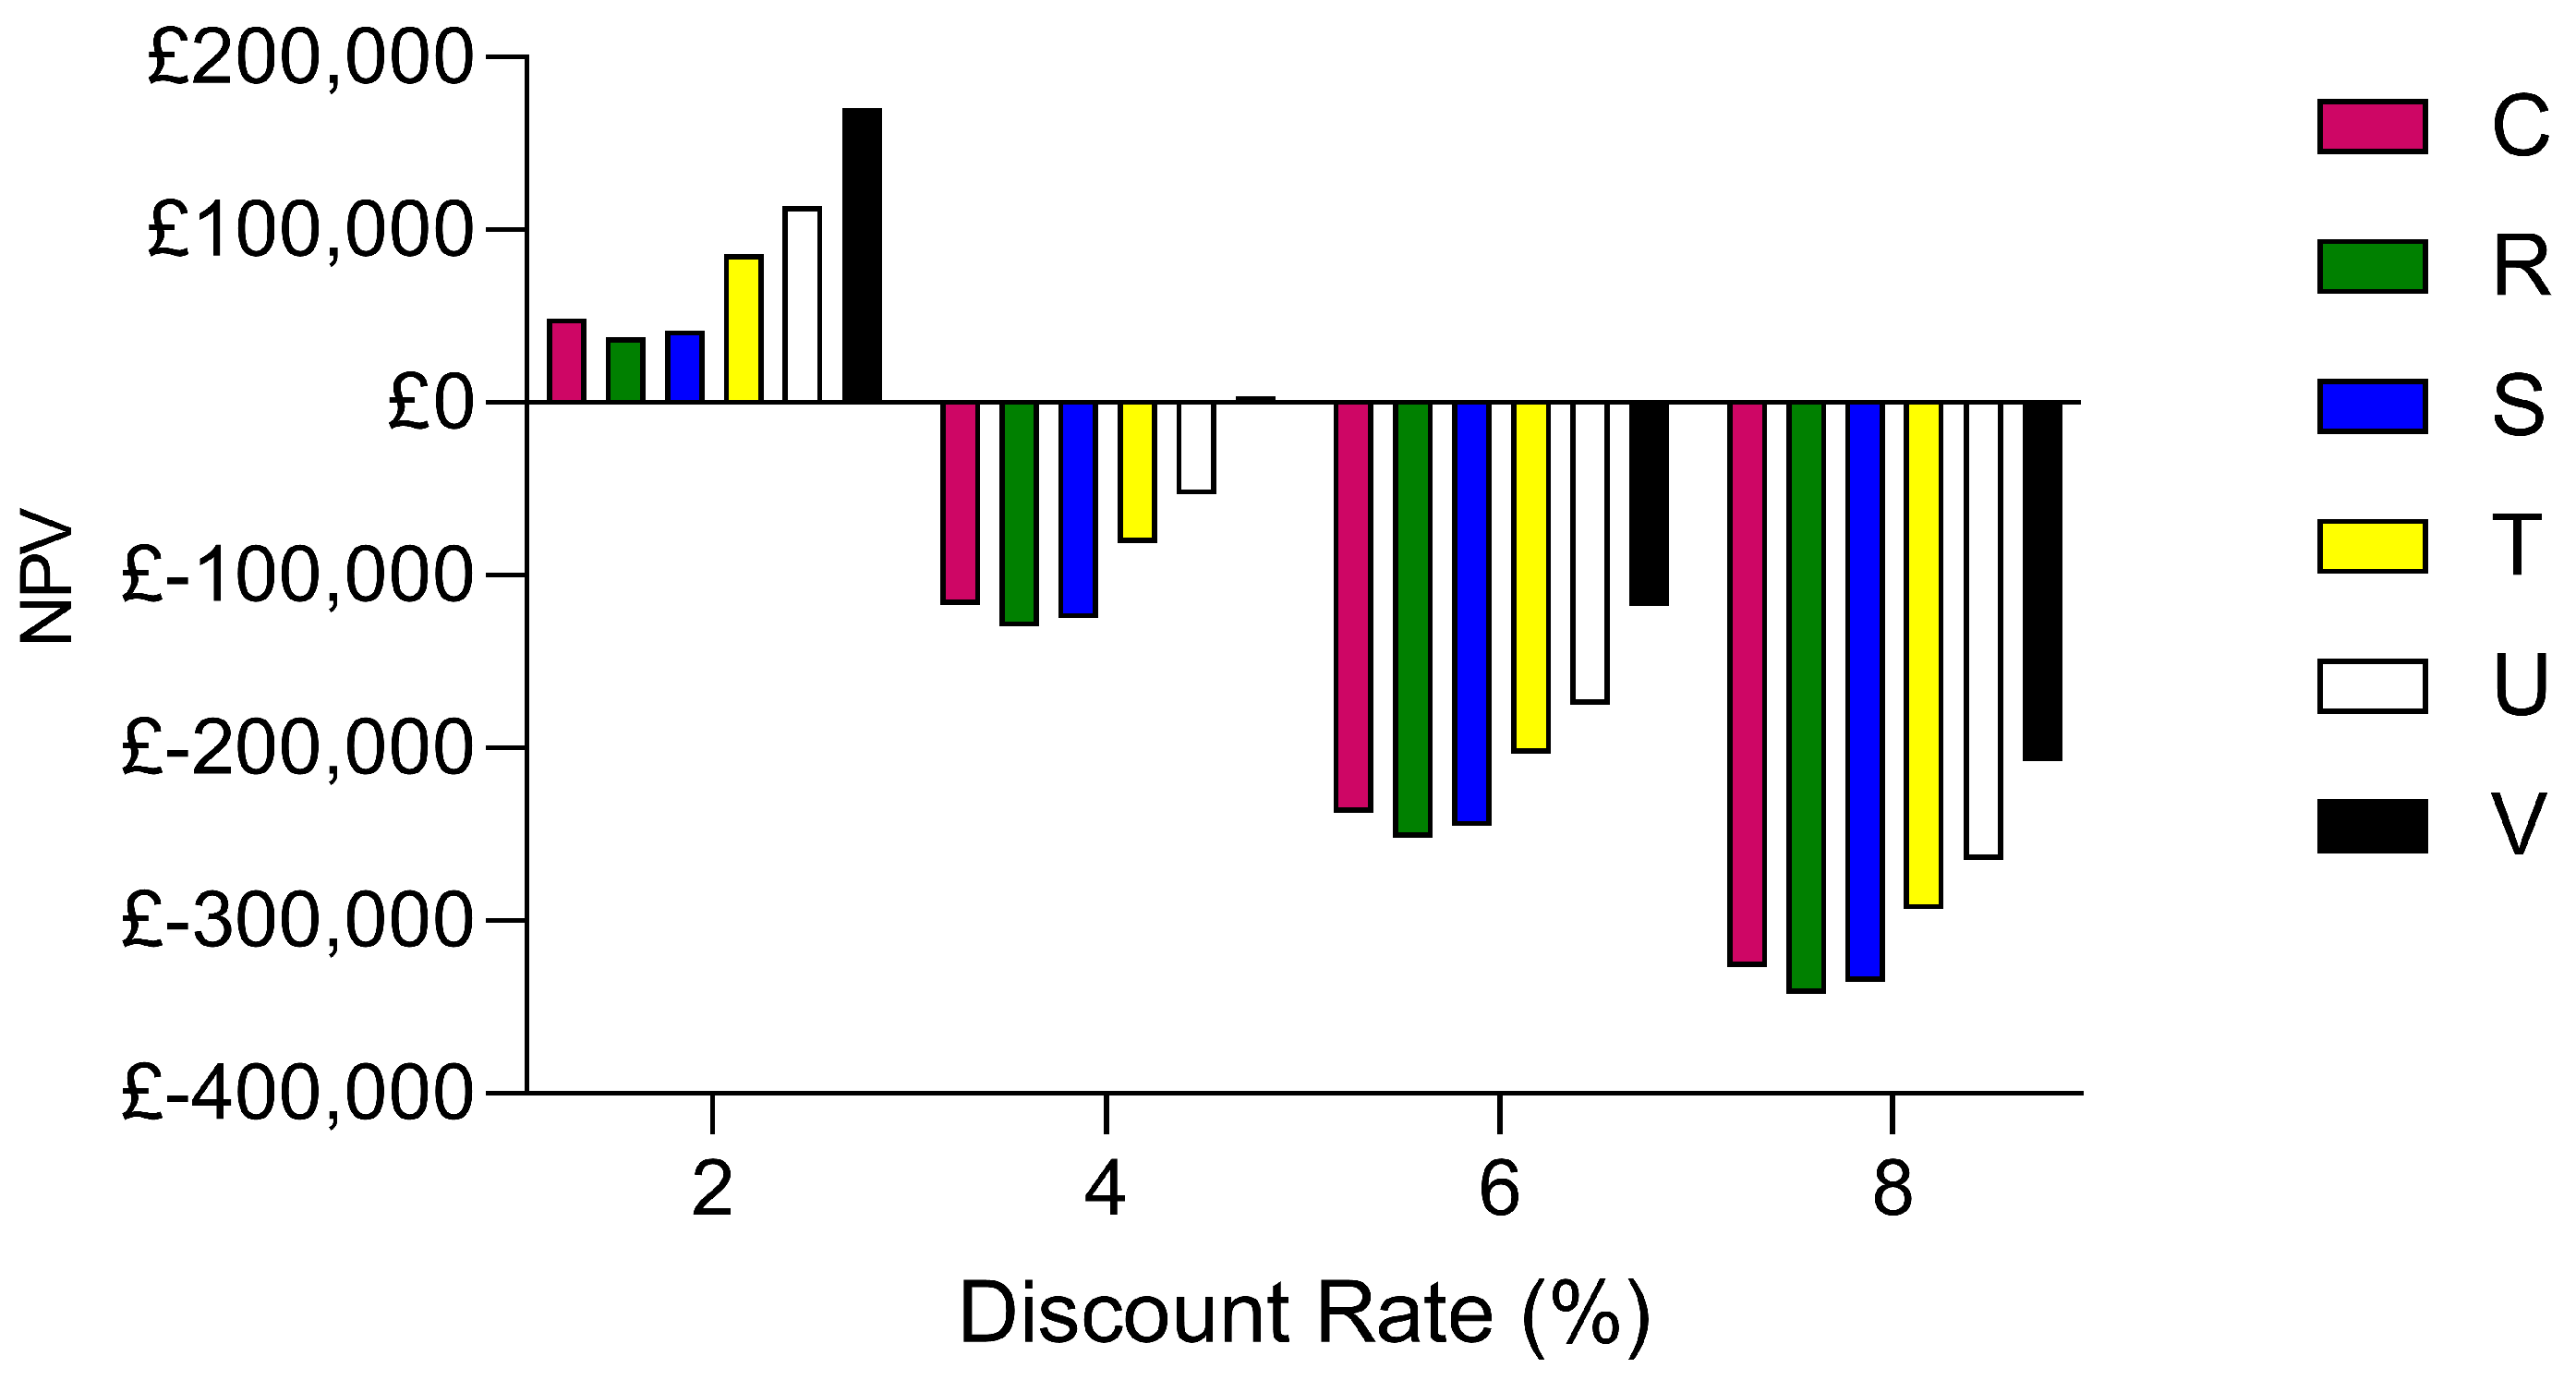
5.2. Discount Rate Sensitivity Analysis
To illustrate this, a discount rate sensitivity study was conducted for configurations B, C and D which were identified as the most realistic options for FESSs under current market conditions. The discount rate was varied between 2% and 10% with the results shown in
Figure 9,
Figure 10 and
Figure 11.
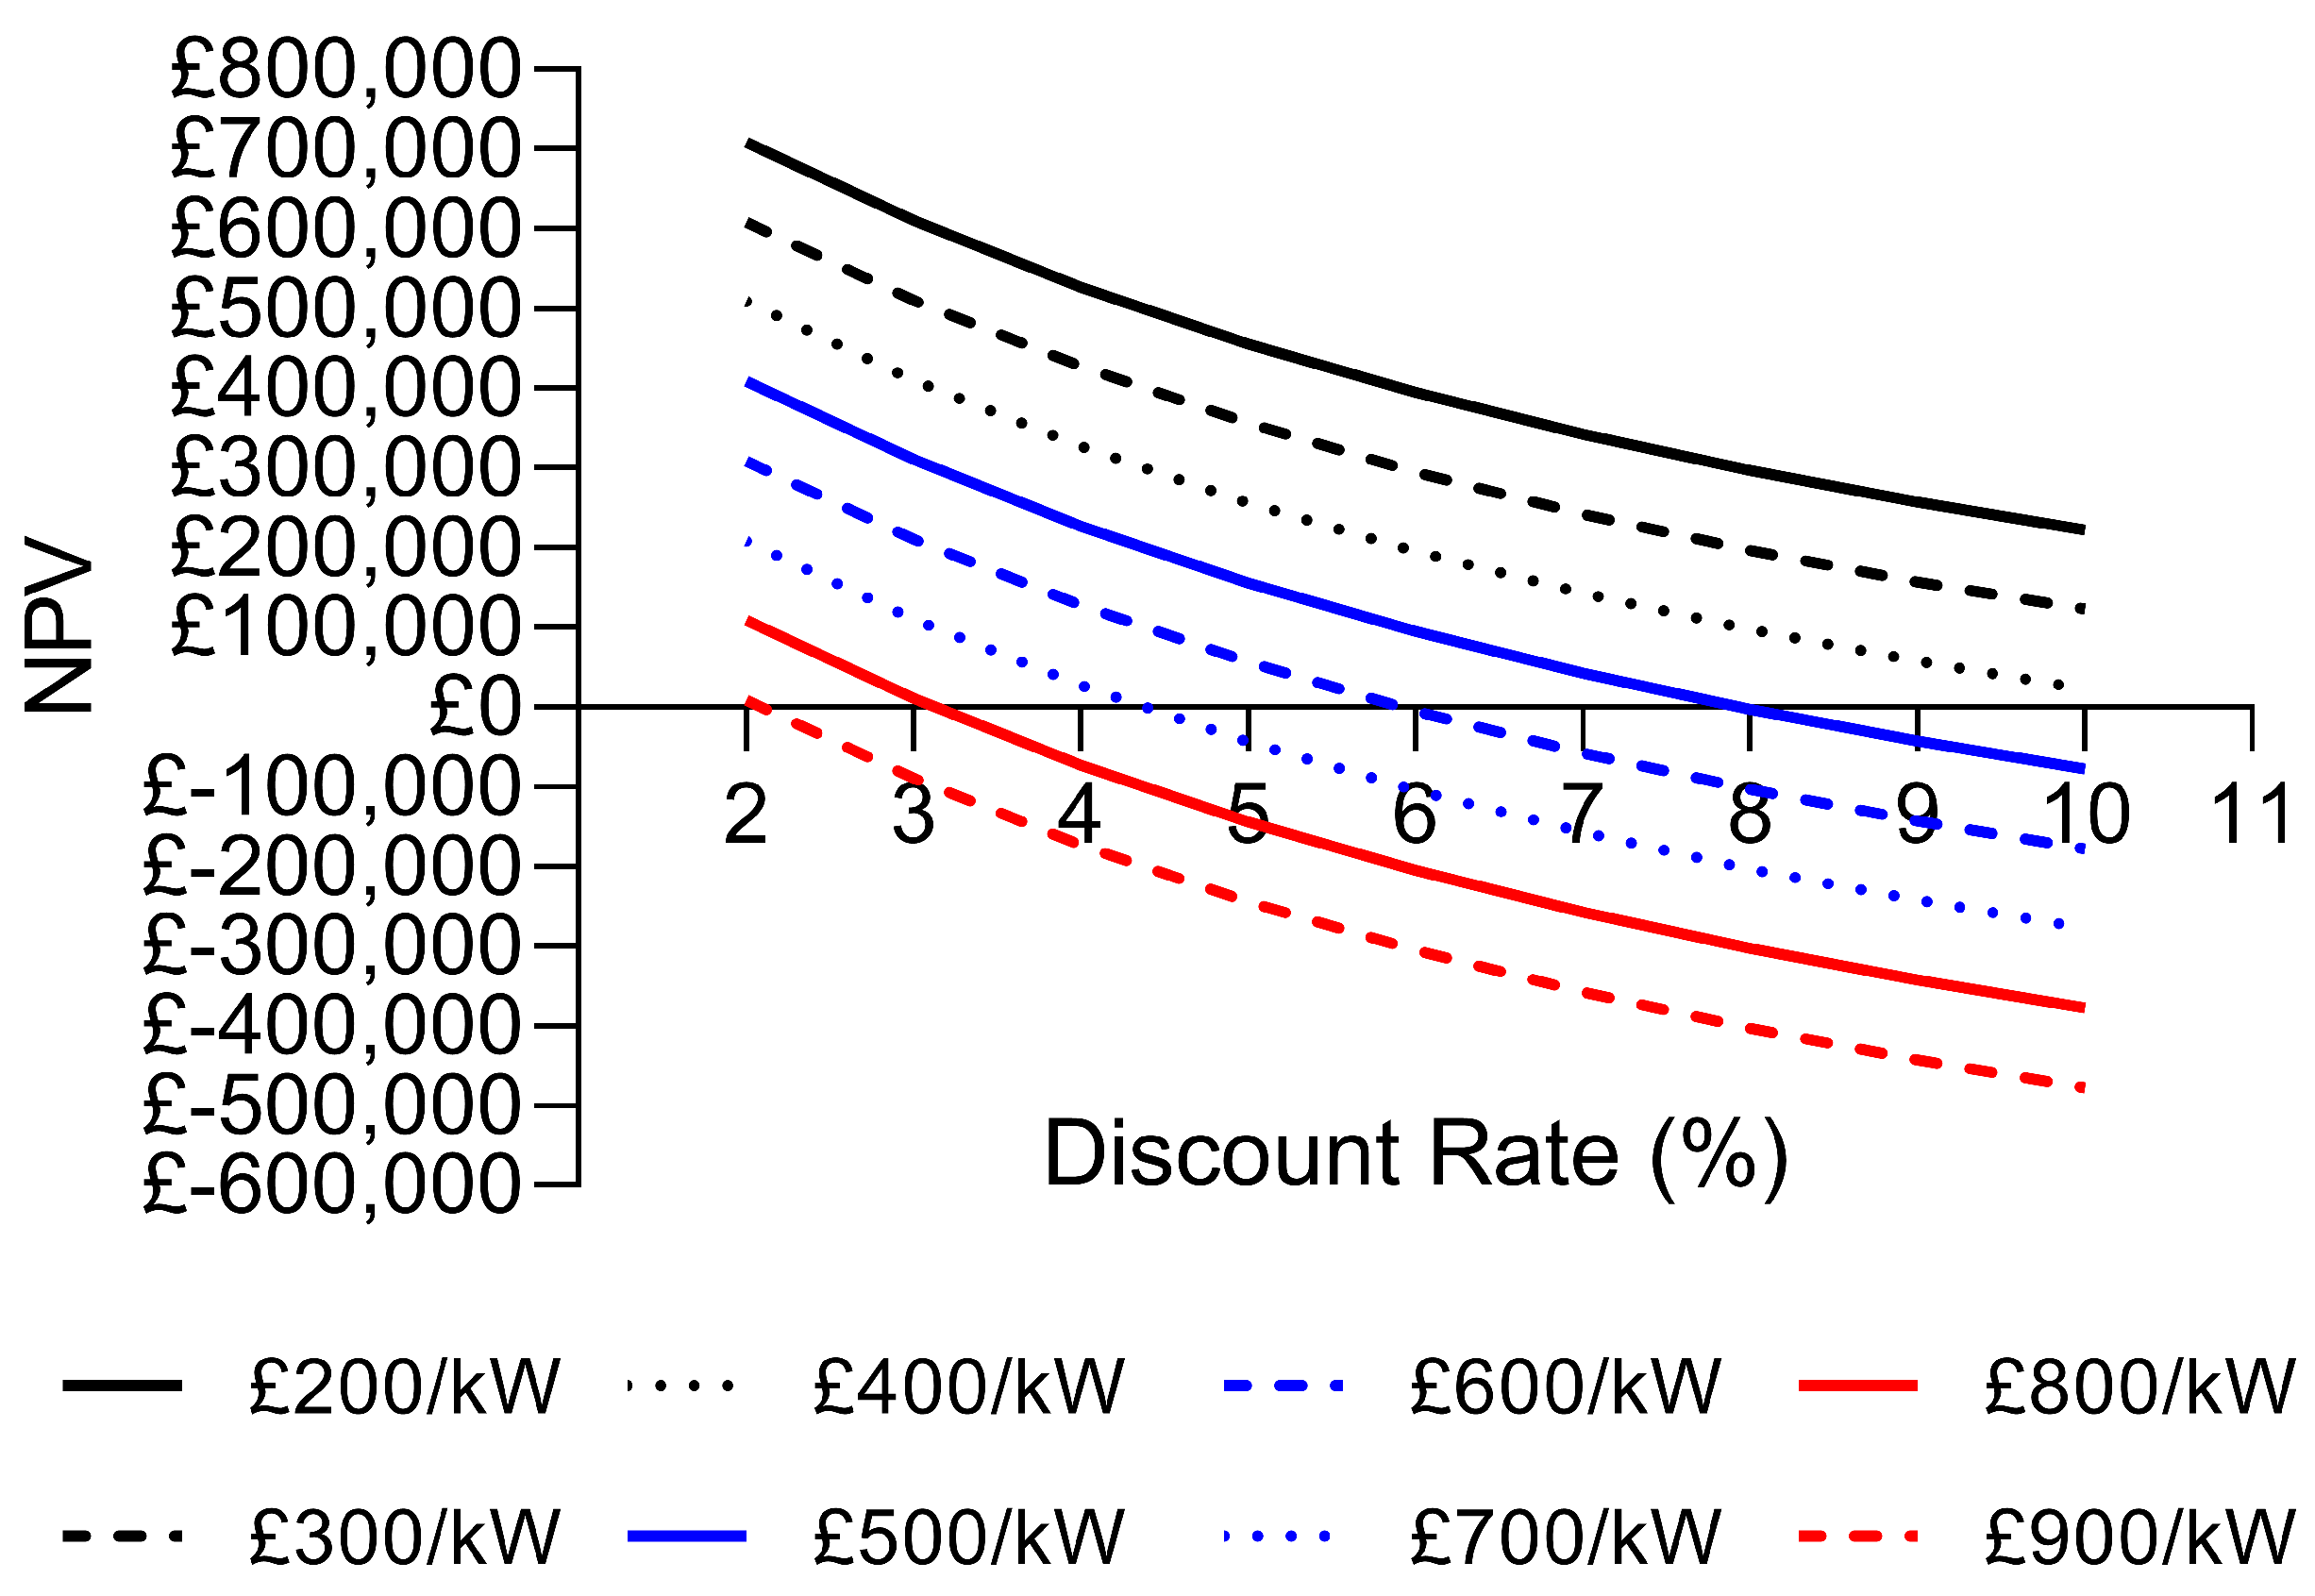
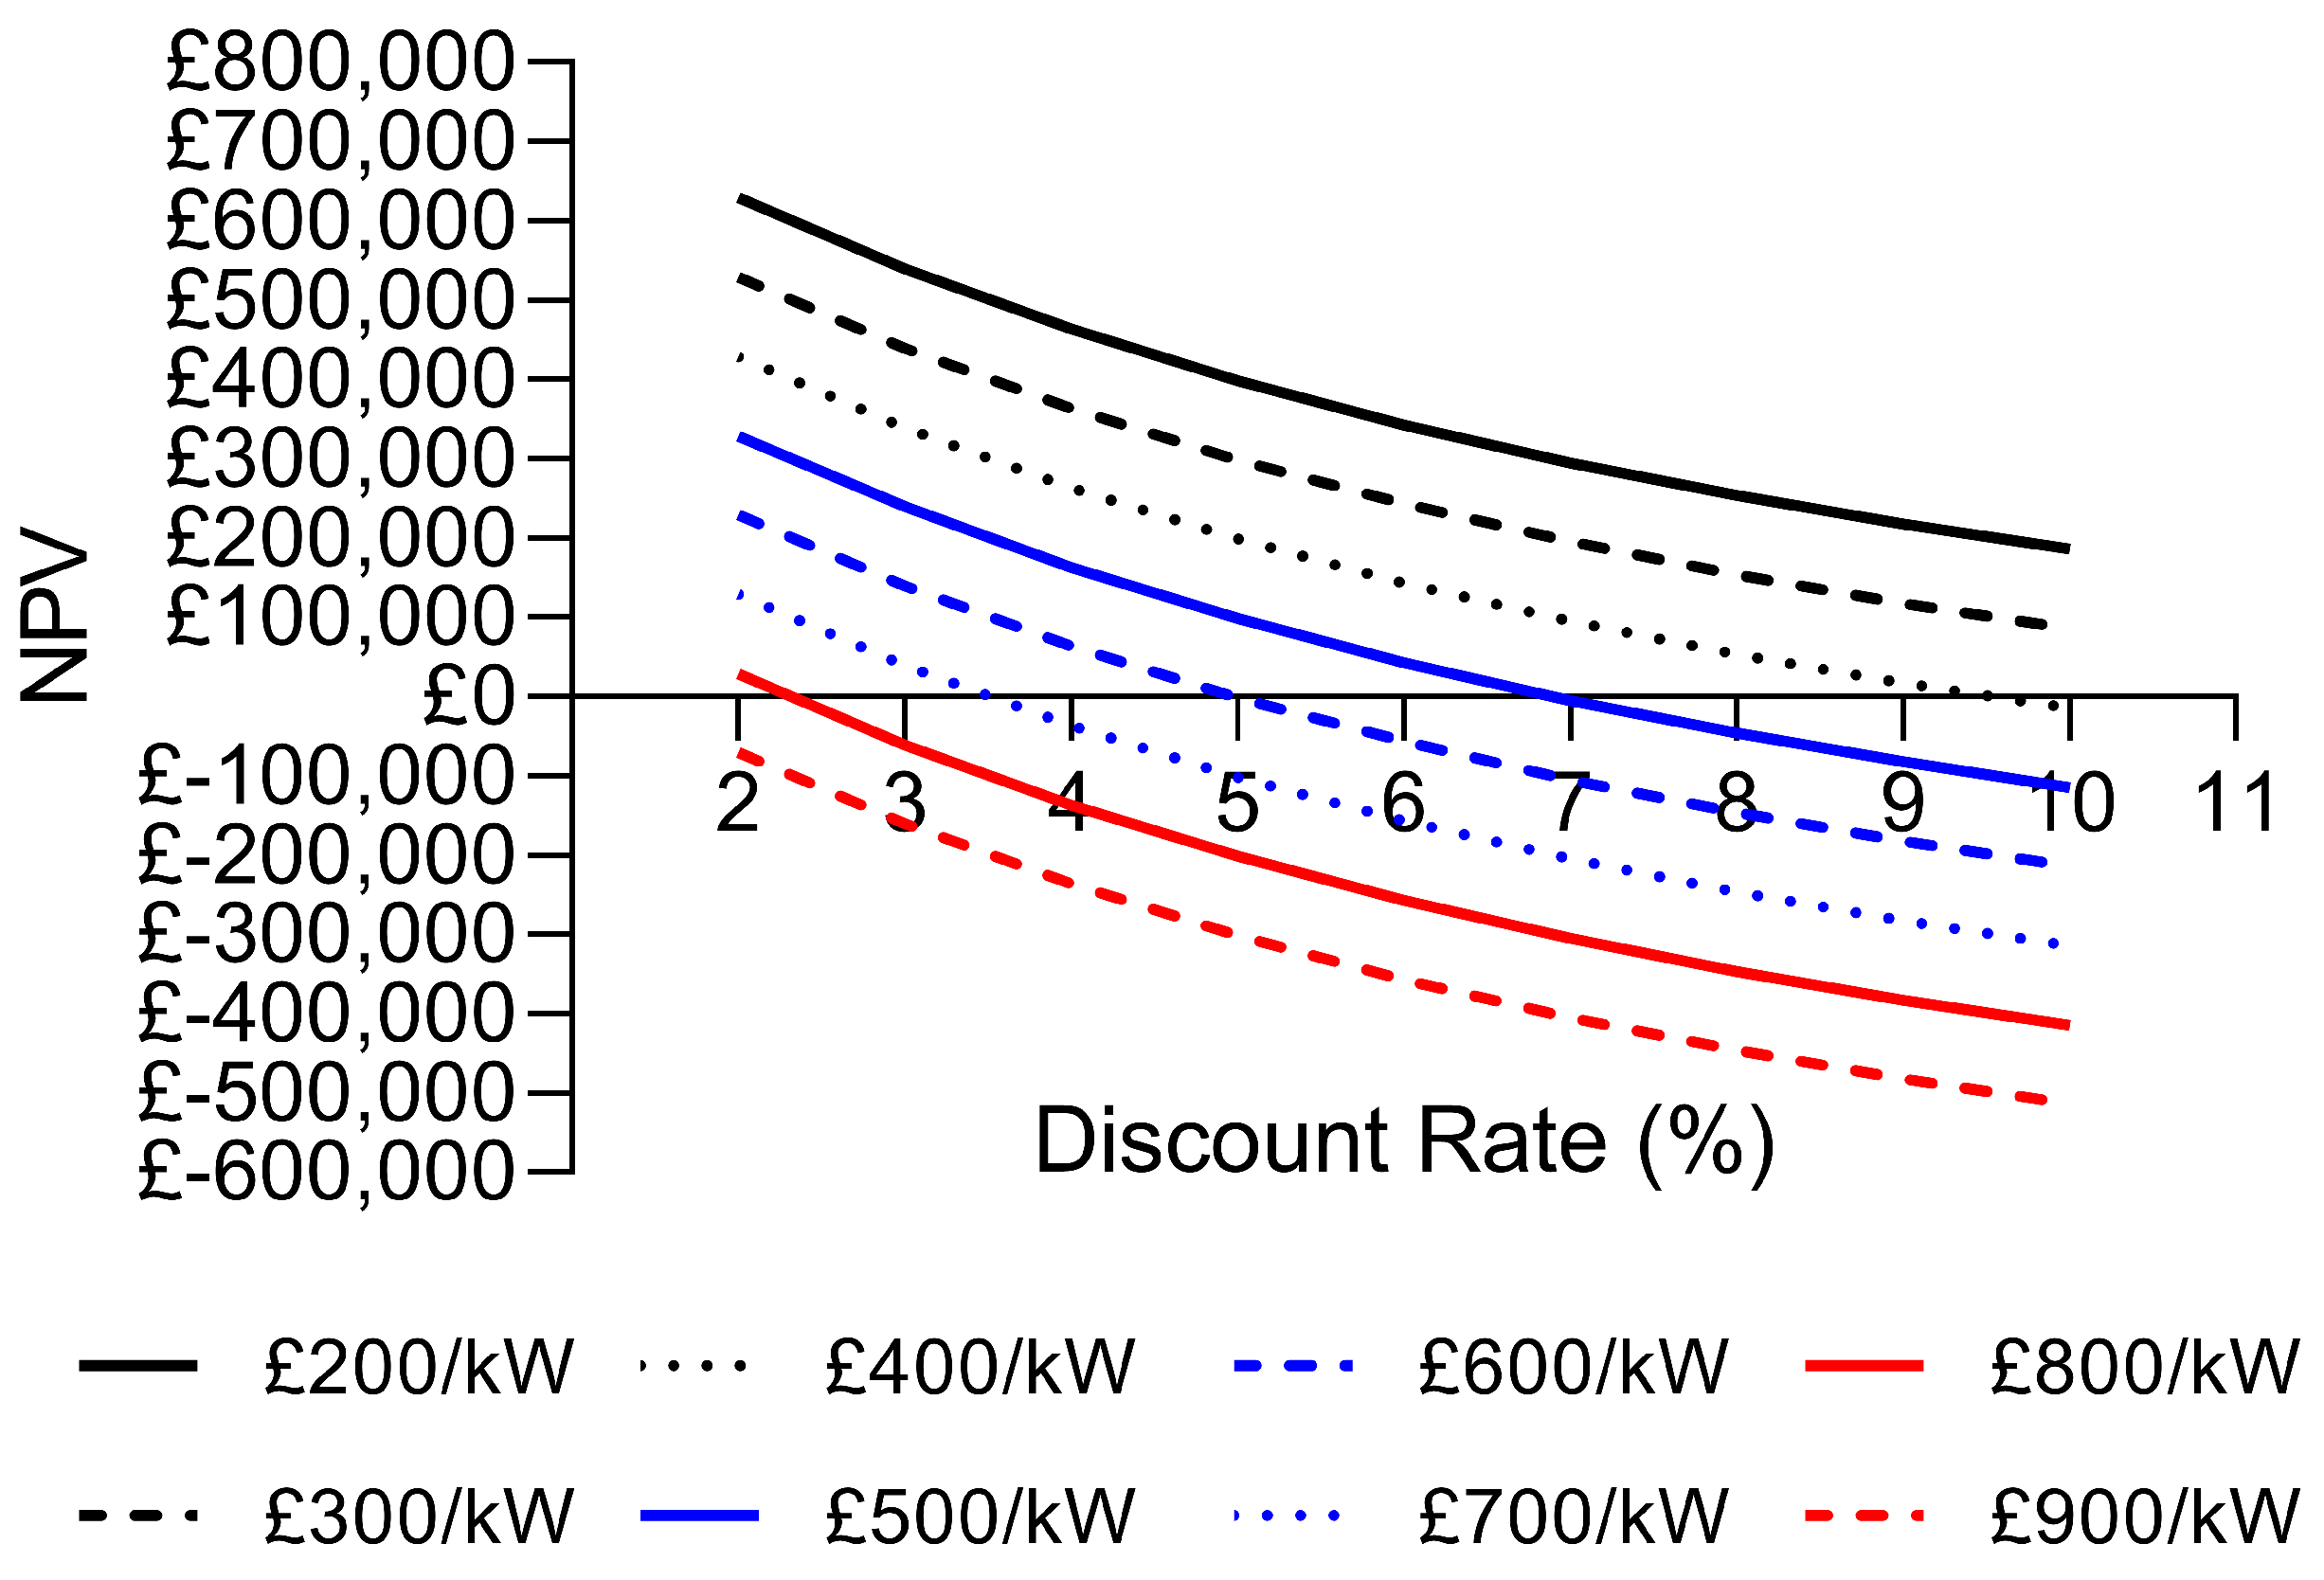
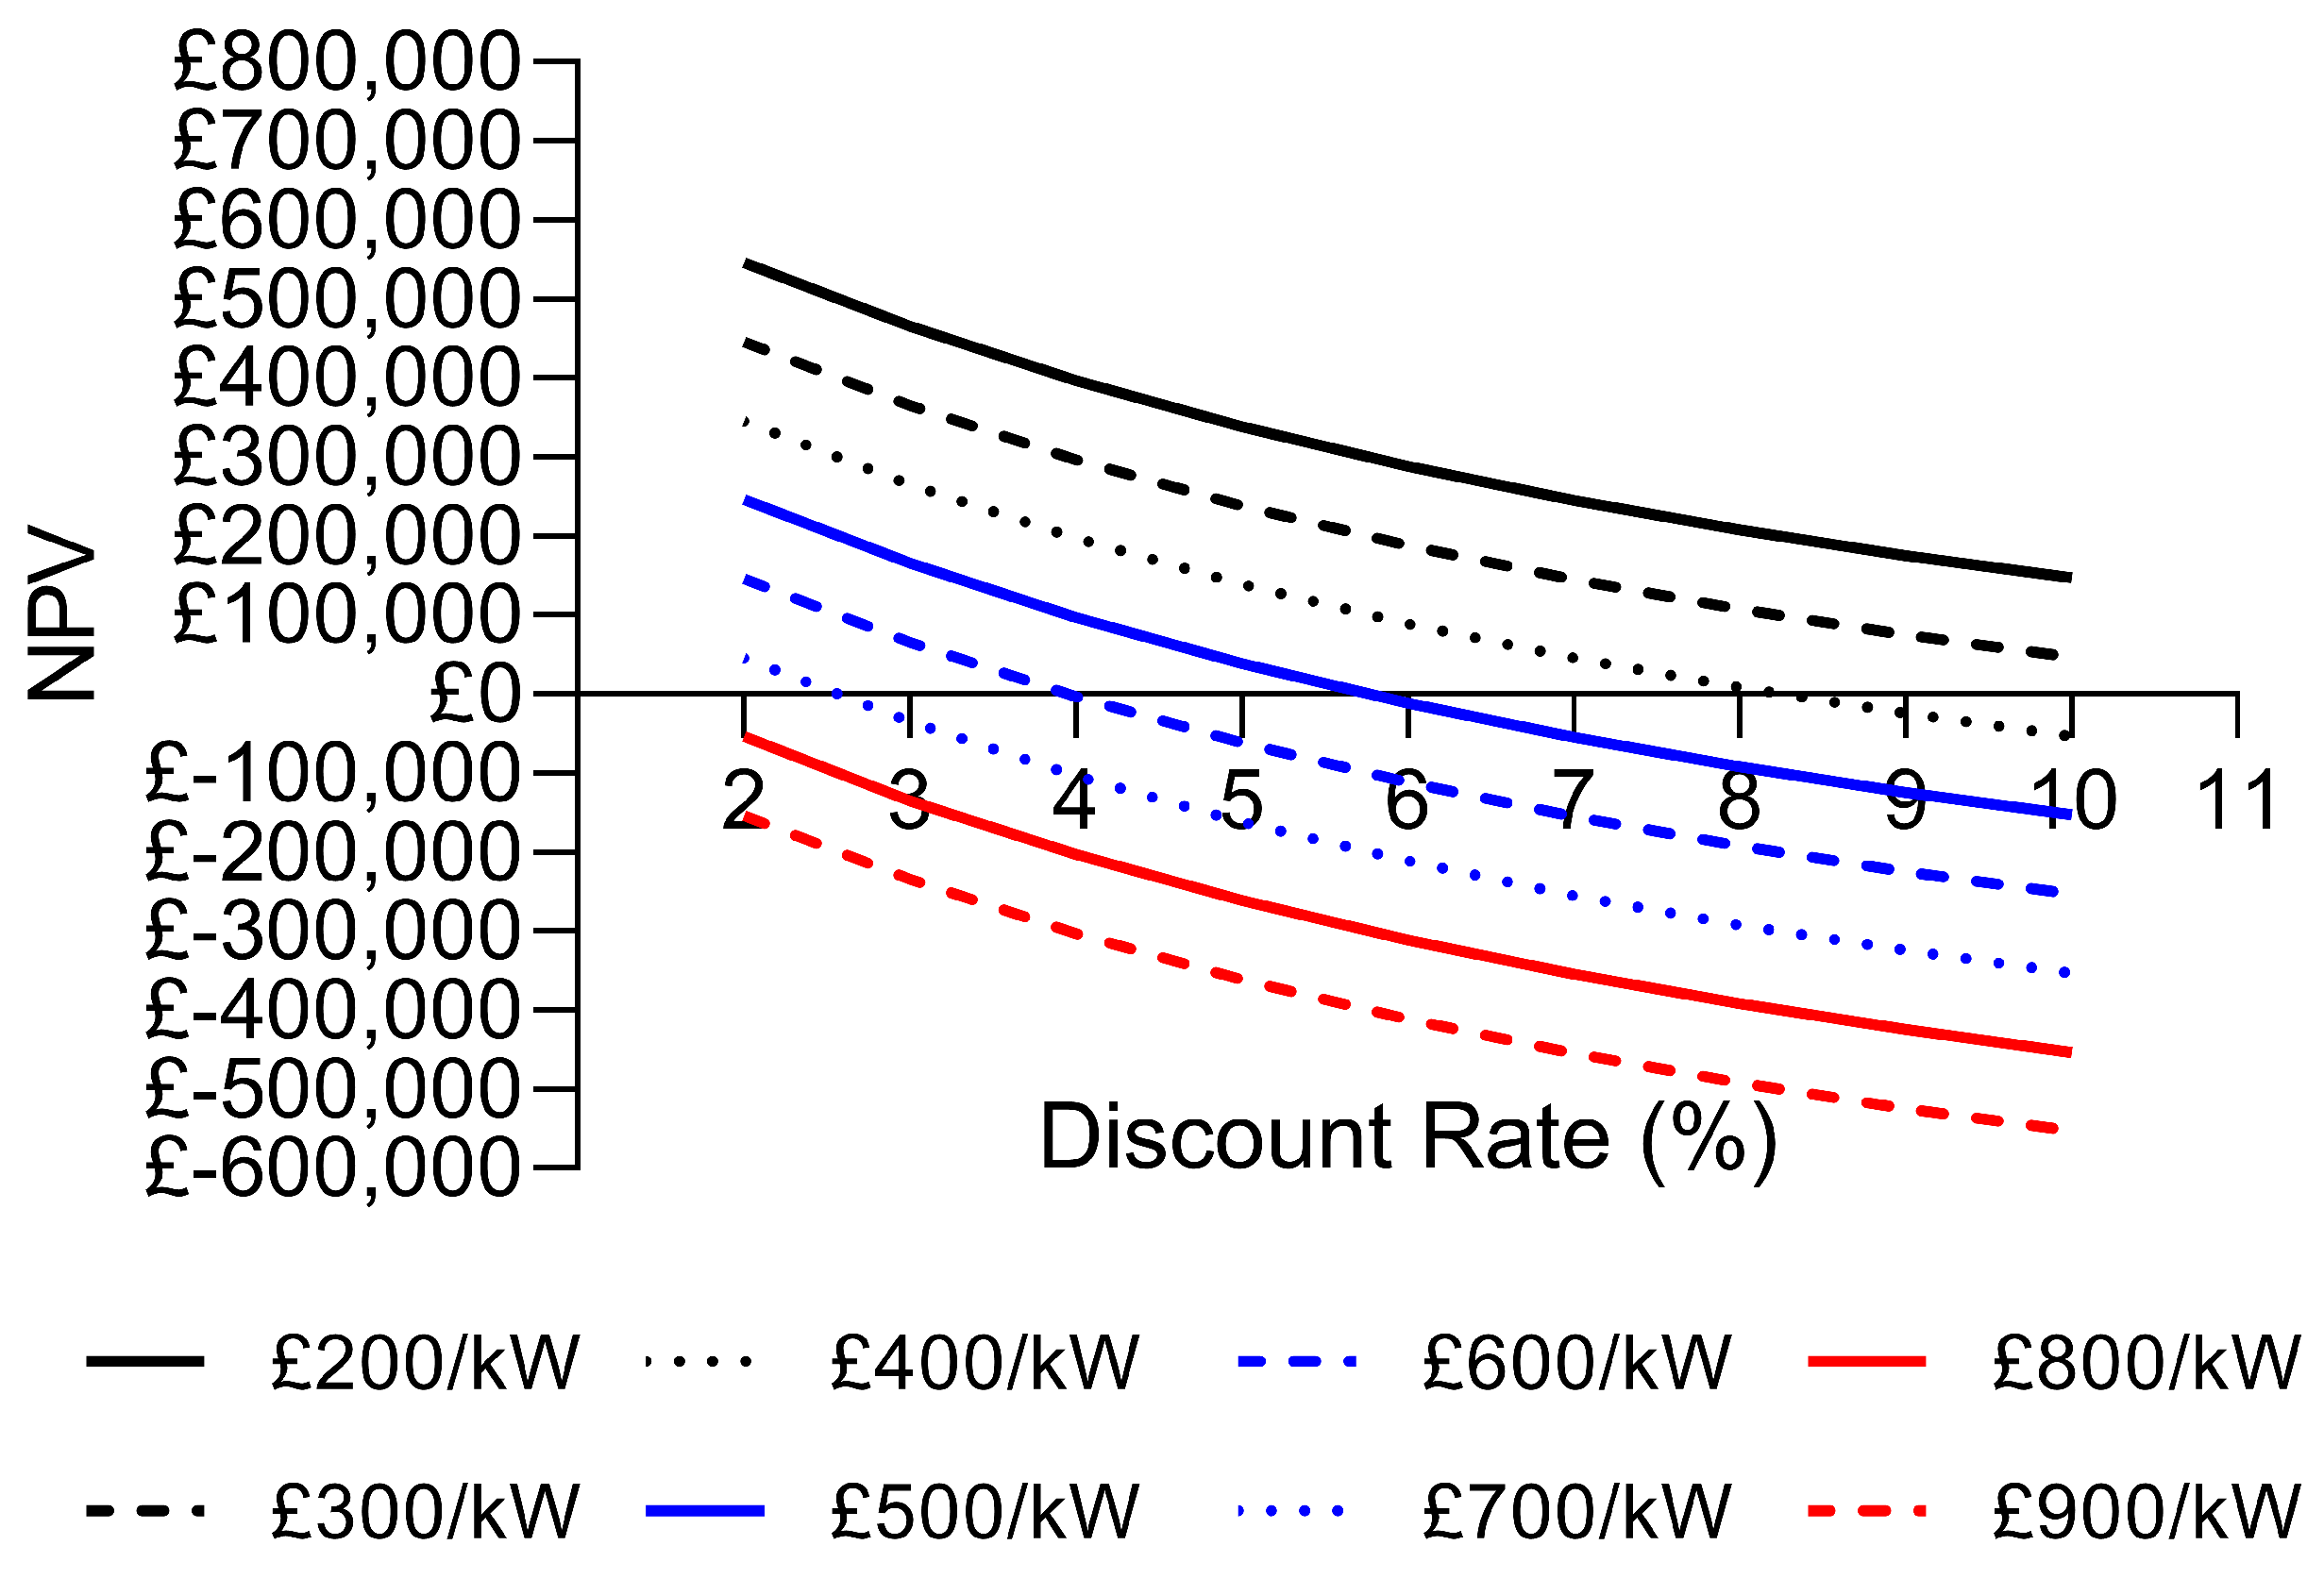
Immediately, it becomes apparent that by reducing the discount rate, the viability of an FESS providing these services is increased. Crucially, even configurations C and D can provide significant positive NPV scenarios across a much wider range of TCC with lower discount rates.
The best-performing system is still configuration B, which can provide a positive NPV for all discount rates when the TCC is 400 GBP/kW or below. When looking at the more realistic region of 700 GBP/kW, the configuration can still provide a positive NPV across discount rates ranging from 2 to 4%. The results worsen at 700 GBP/kW for Configuration C and D, with C providing positive NPV at discount rates of 2–3% and D only providing positive NPV at 2%.
5.3. Discussion
This sensitivity analysis does highlight that there is a narrow window for providing a positive NPV and that a significant number of configurations result in a negative NPV. For Configuration B (the 1C system), 59.7% of the studied combinations resulted in a positive NPV, whilst for Configuration C (2.5C system), this value is 51.4% and Configuration D (5C system) it is 44.4%.
The information presented so far details different FESS configuration’s capability of providing standalone DFR services. However, the energy capacity of the FESS is a significant disadvantage when considering the higher C-Rate systems. The next section will investigate whether it is possible to increase the viability of the FESS configurations that are close to providing the required techno-economic level of performance by considering the benefits of hybridisation of FESSs and BESSs to attempt to extract further value from the respective systems.
6. Hybrid Analysis
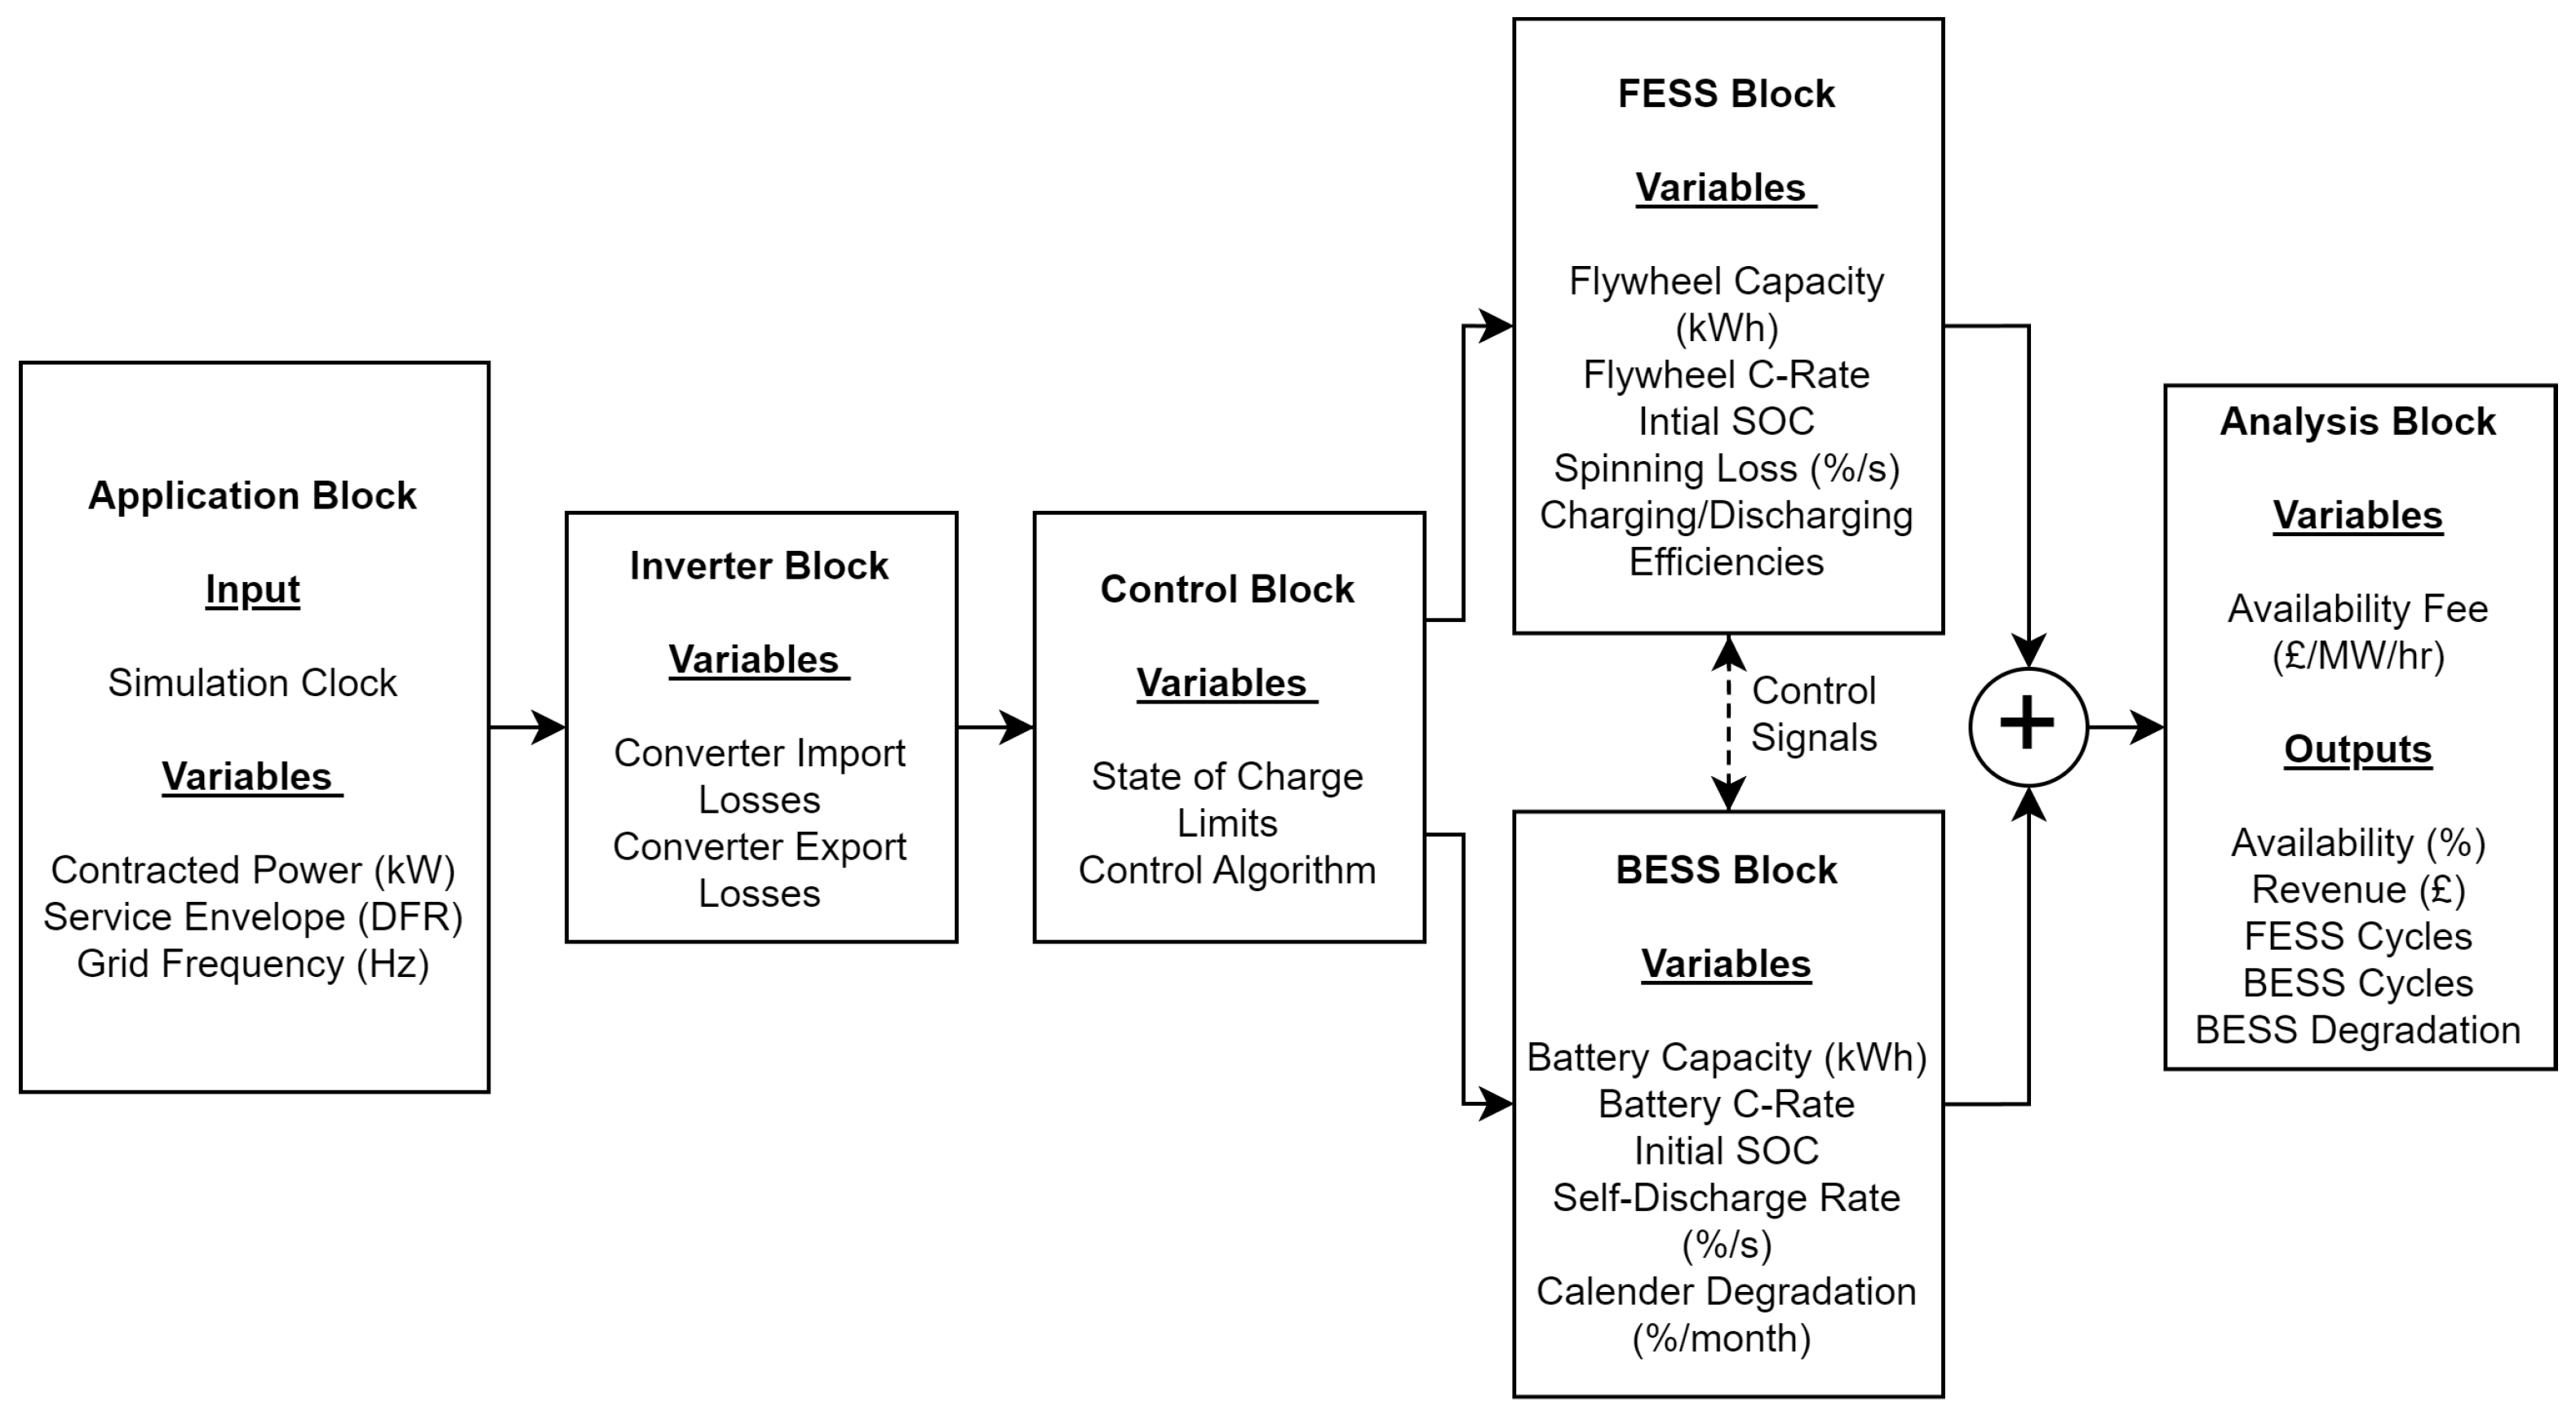
For this section, Configuration D has been chosen to be studied further in a hybrid scenario because this configuration represents a fairly common FESS C-Rate specification, as well as showing promising results without achieving the ideal level of 95% average availability. For this reason, it is an ideal candidate to take forward to understand the effects of hybridisation in this way. A high-level representation of the hybrid MATLAB/Simulink model is shown in
Figure 12, which builds upon the previously discussed model, with the main differences being the addition of a BESS block which contains aspects such as degradation and self-discharge, and modifications to the control block to allow it to decide which storage system to use.
The control approach assumed for this hybrid system is taken from previous work presented in [
66], and consists of all requests for power from the service being provided by the FESS if the FESS is within its high and low SOC limits. If the FESS is unable to provide the required power, the BESS will instead attempt to provide the required power.
A key criterion of the hybridisation scheme is to ensure that the required power rating of the system (1 MW) is maintained across all configurations. For this reason, two different approaches have been taken, with the configurations to be studied shown in
Table 6. The first approach, with Configuration H and I, represents an additional quantity of BESS being introduced on top of the existing FESS that was analysed as Configuration D. The second approach consists of decreasing the size of the FESS and replacing this with different amounts of BESS capacity.
6.1. HESS Technical Analysis
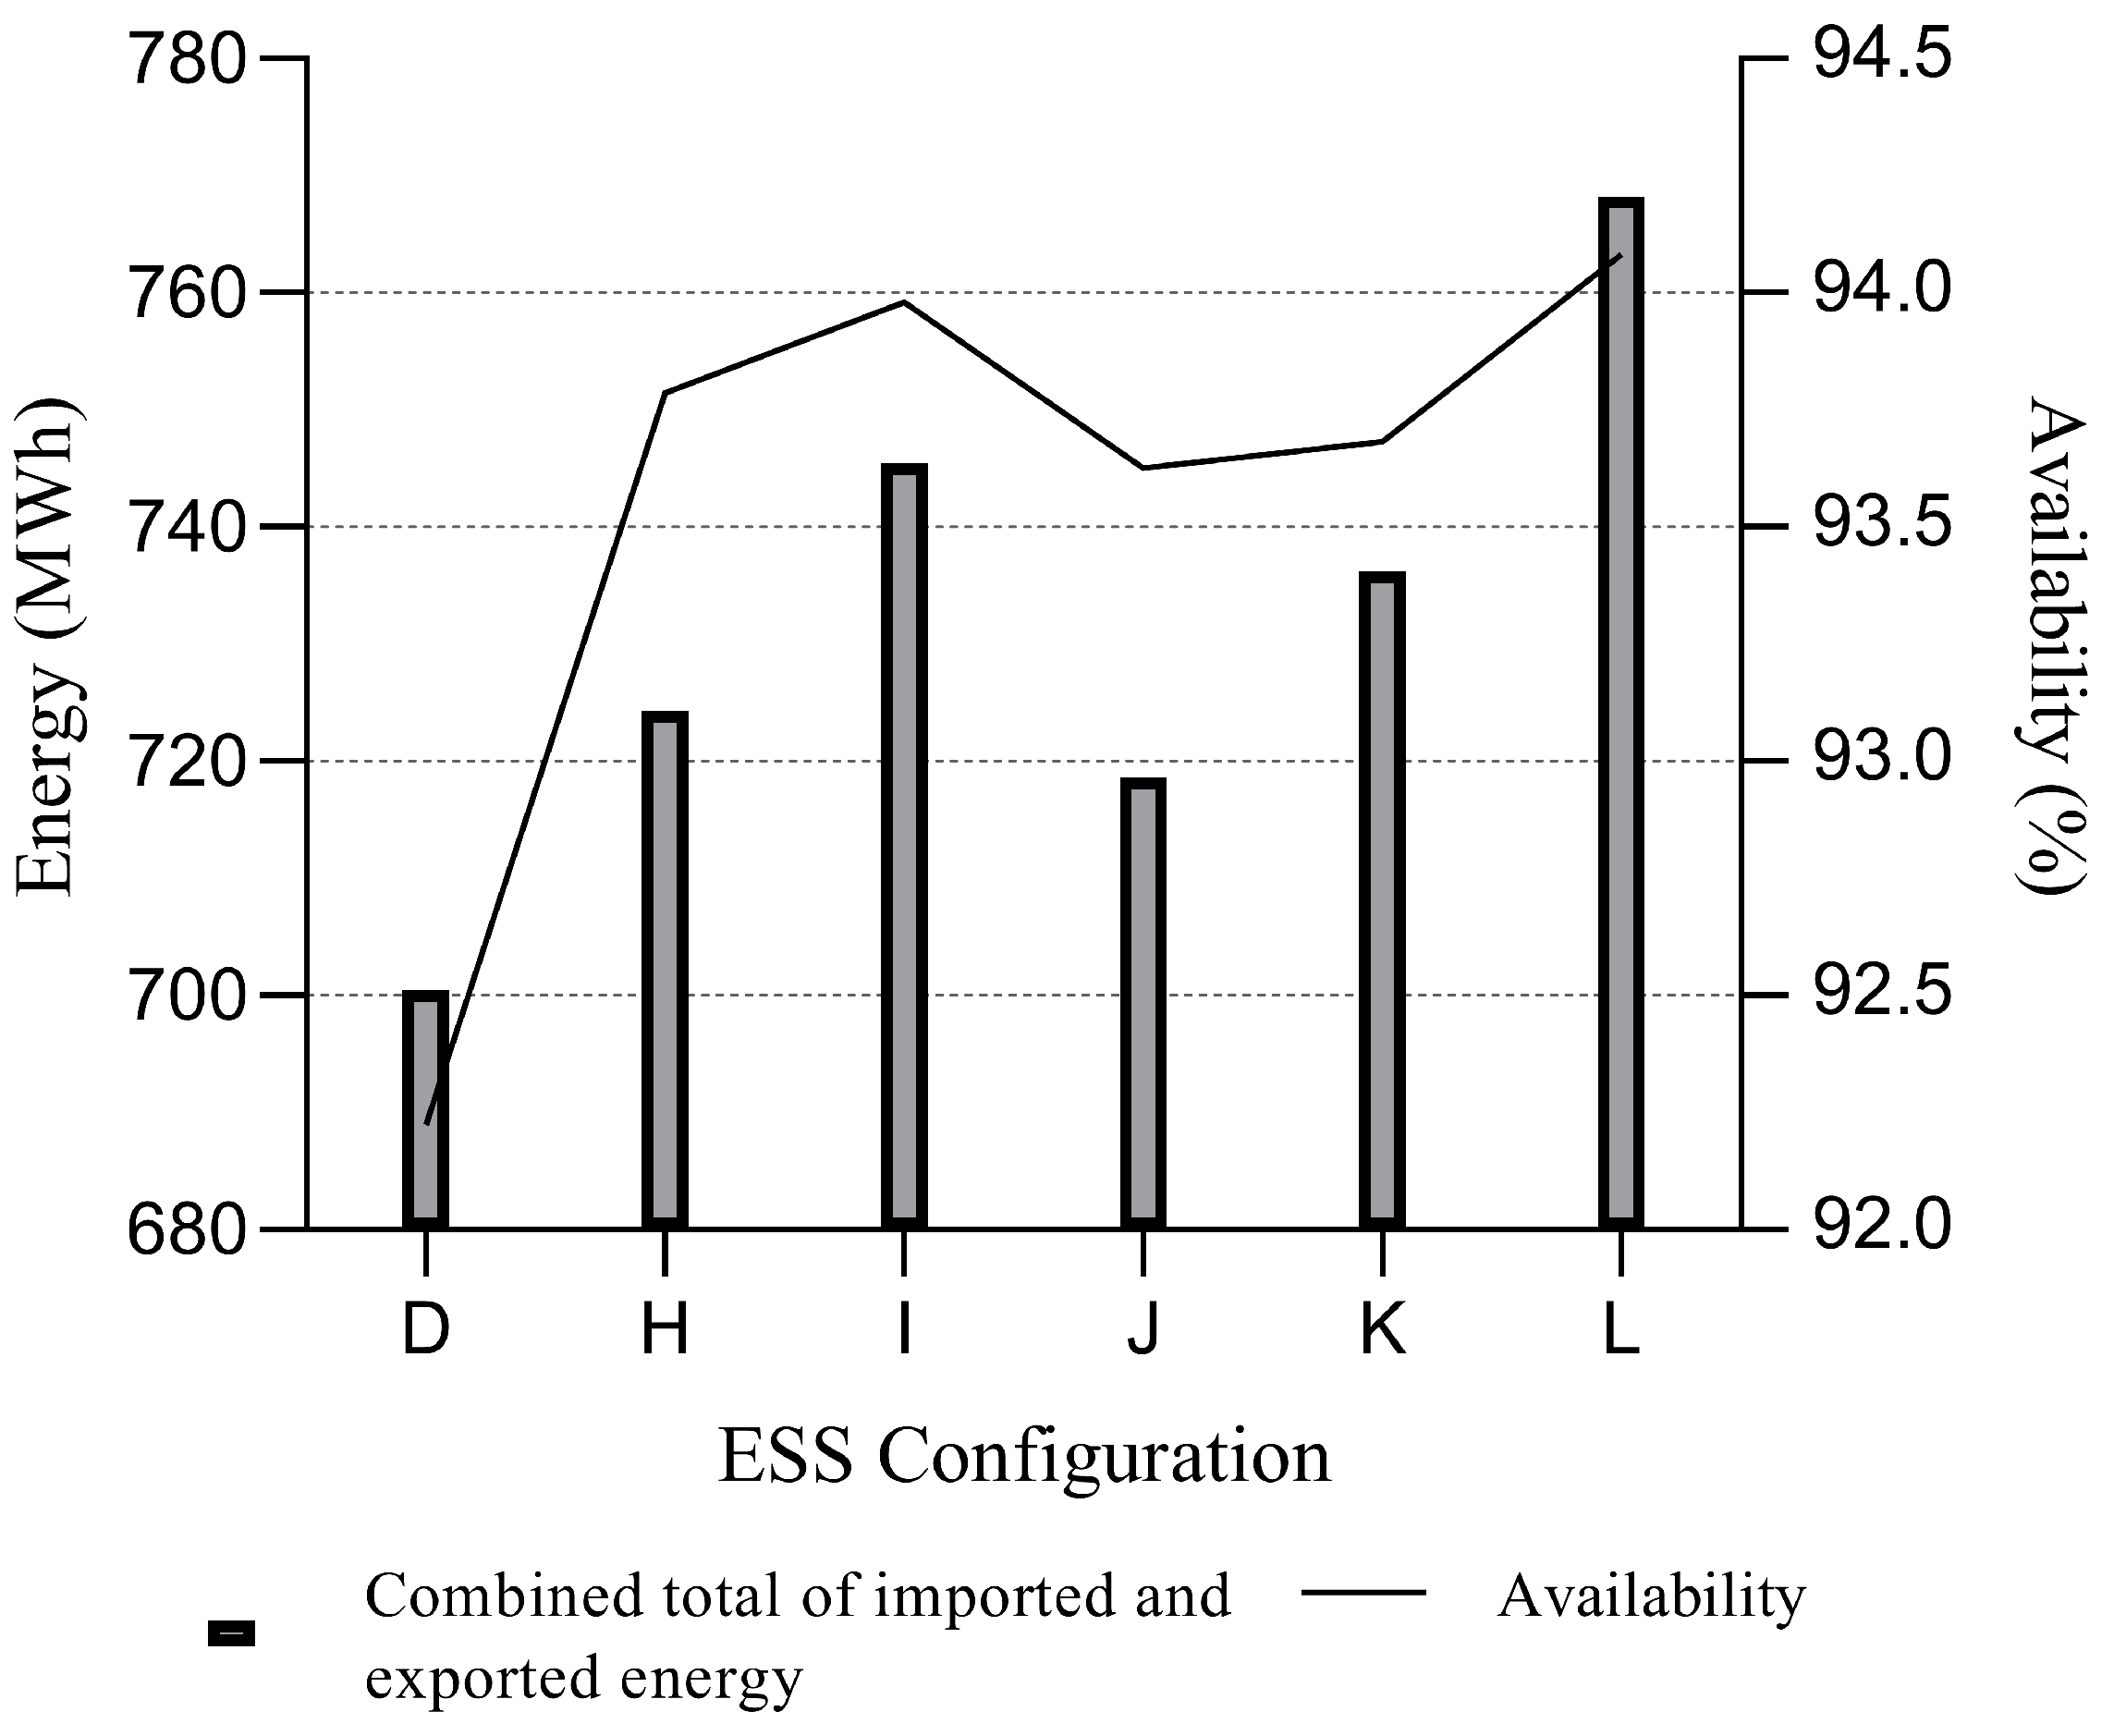
Figure 13 shows the technical performance of the different hybrid configurations. The average availability over the course of a year increases by at least 1.5% across all configurations, with the peak increase occurring under Configuration L which achieves an average availability of 94.1%. The data suggest that were the energy capacities of the BESS portions to be increased further then this would have a knock-on effect of increasing the average availability.
Table 7 shows the number of cycles experienced by each ESS under the various configurations. The number of BESS cycles increases slightly with decreasing FESS size. This represents the BESS becoming more active as the FESS’s ability to respond to power requests reduces due to the lower energy capacities. The FESS cycles experienced would all result in no replacement being required across the operational lifetime.
The highest number of BESS cycles experienced (for Configuration L) would result in 9560 cycles being performed over the 20-year operational lifetime. This study assumes a BESS replacement threshold of 10,000 cycles. However, some of the literature suggests cycle limits lower than this, and that should be taken into account when considering the data produced here. The expected number of cycles and the estimated number of cycles that the ESS can perform before reaching the end of life is critical when considering hybrid systems, due to the balance between providing increased performance and the economic cost of cycle-related replacement.
6.2. HESS Economic Analysis
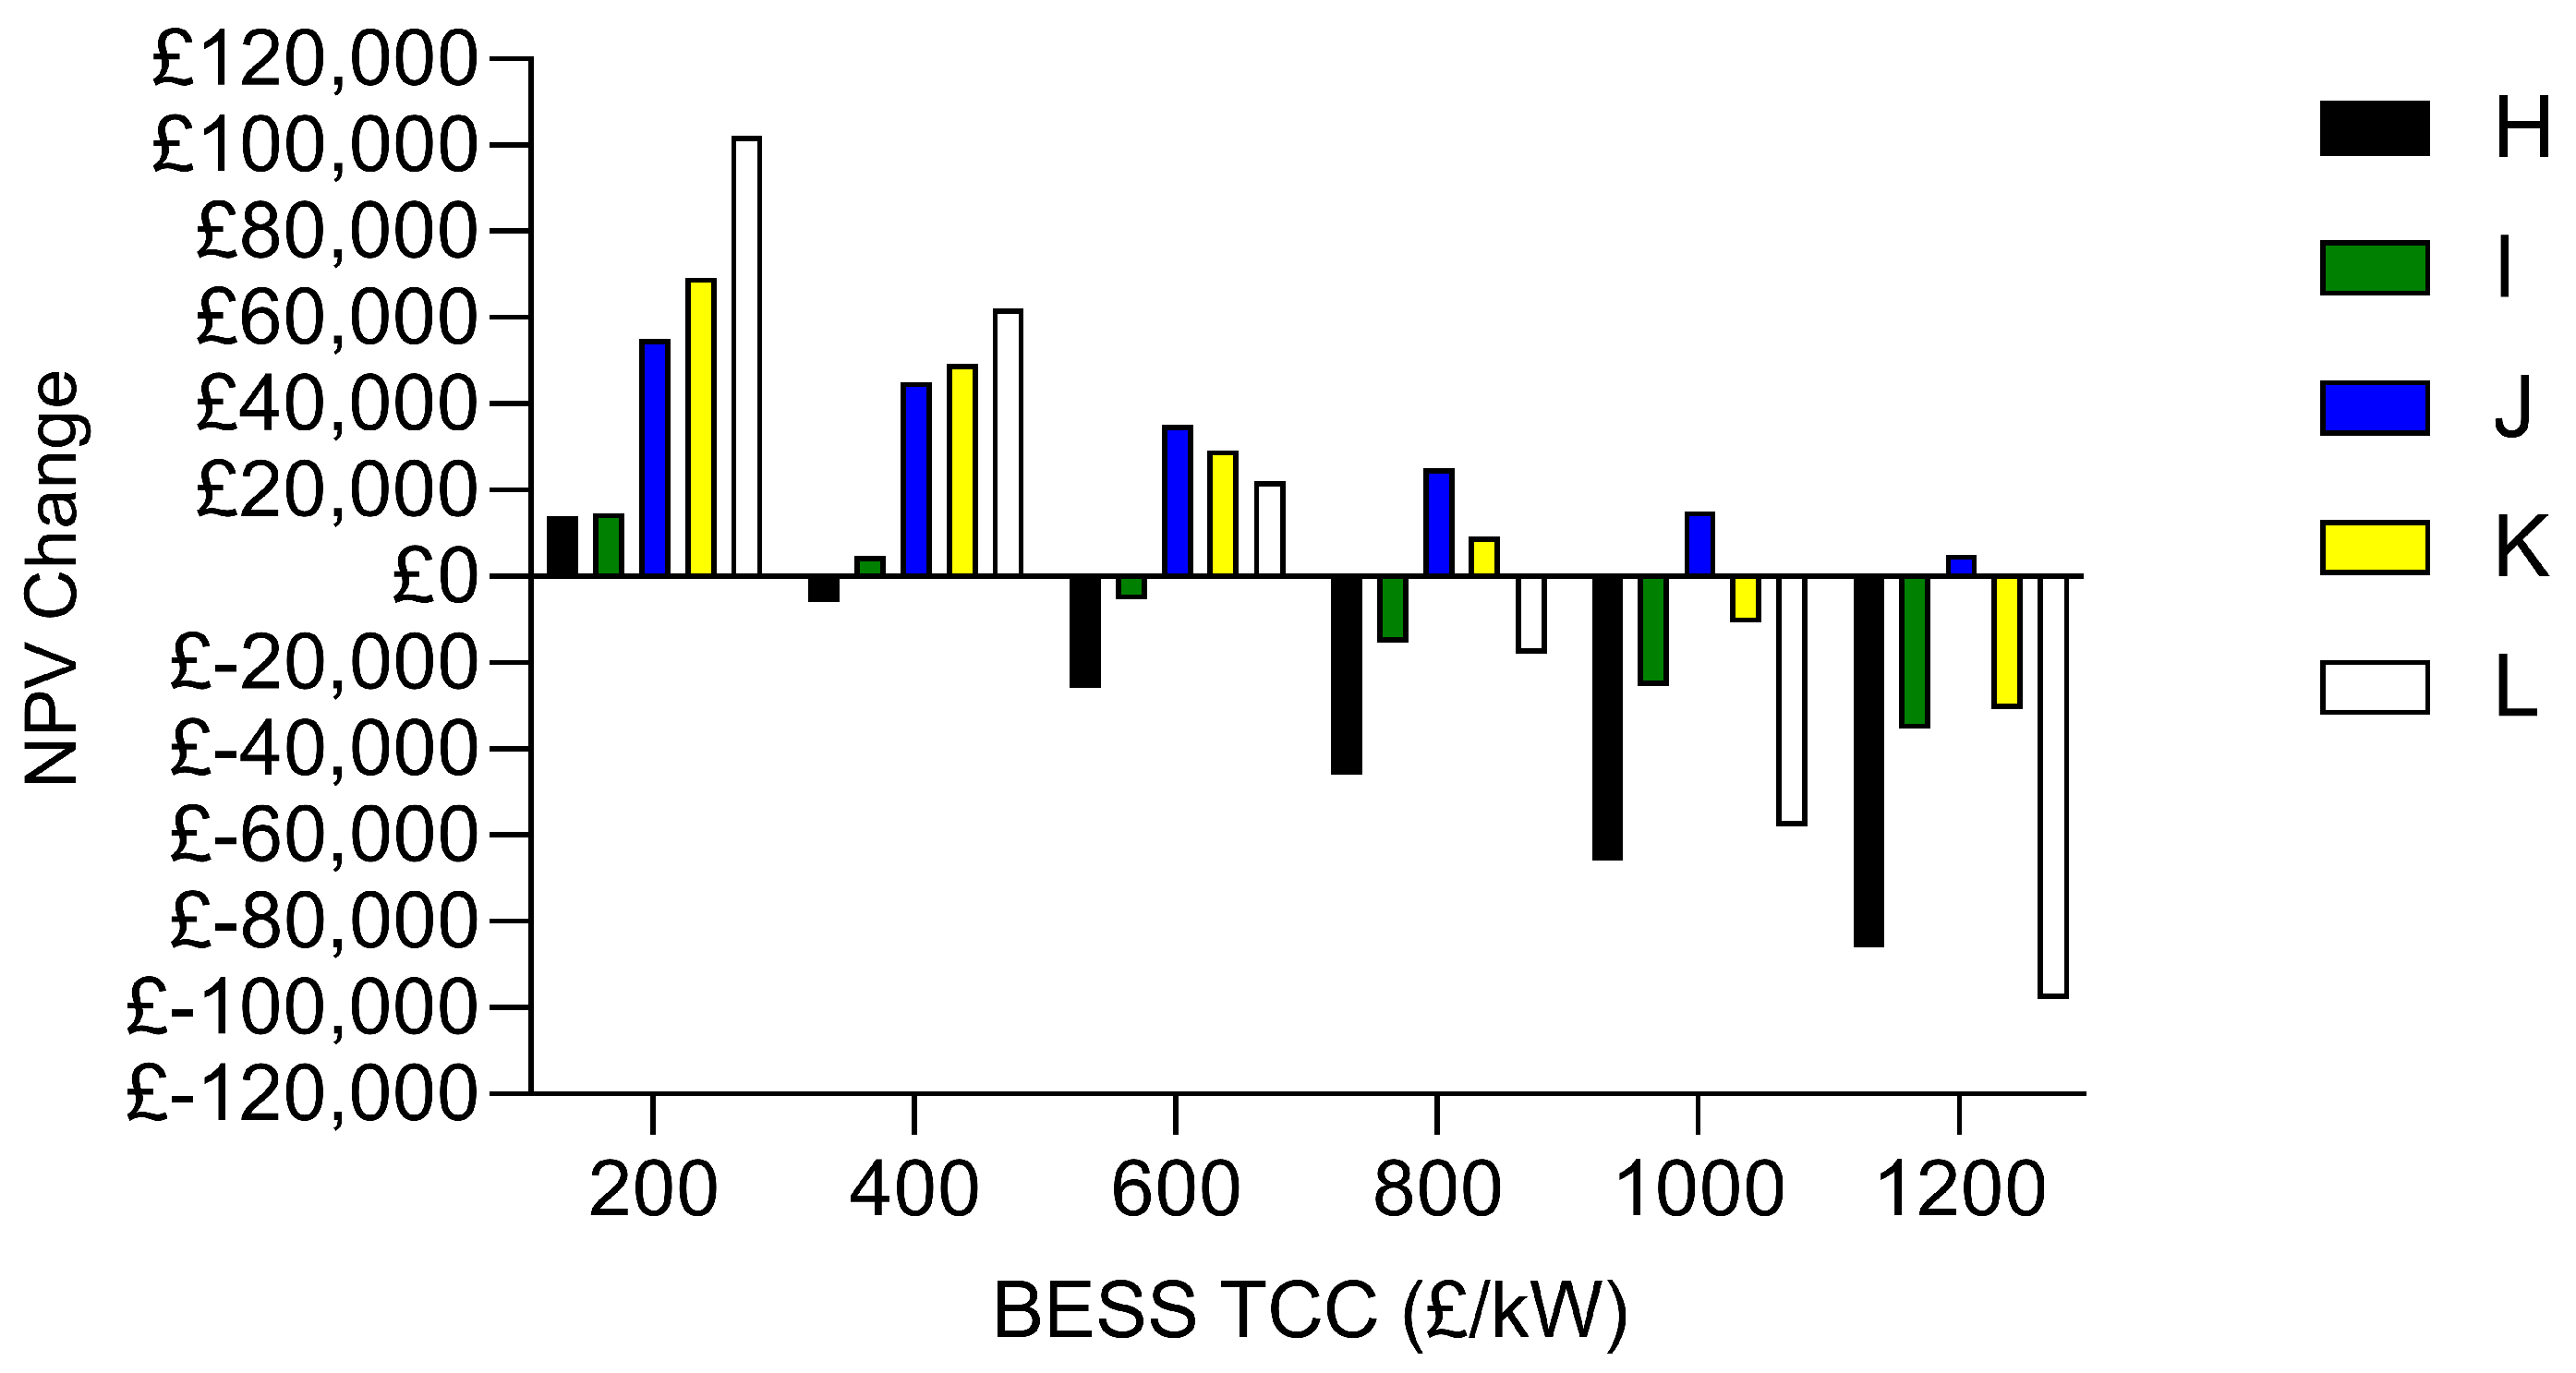
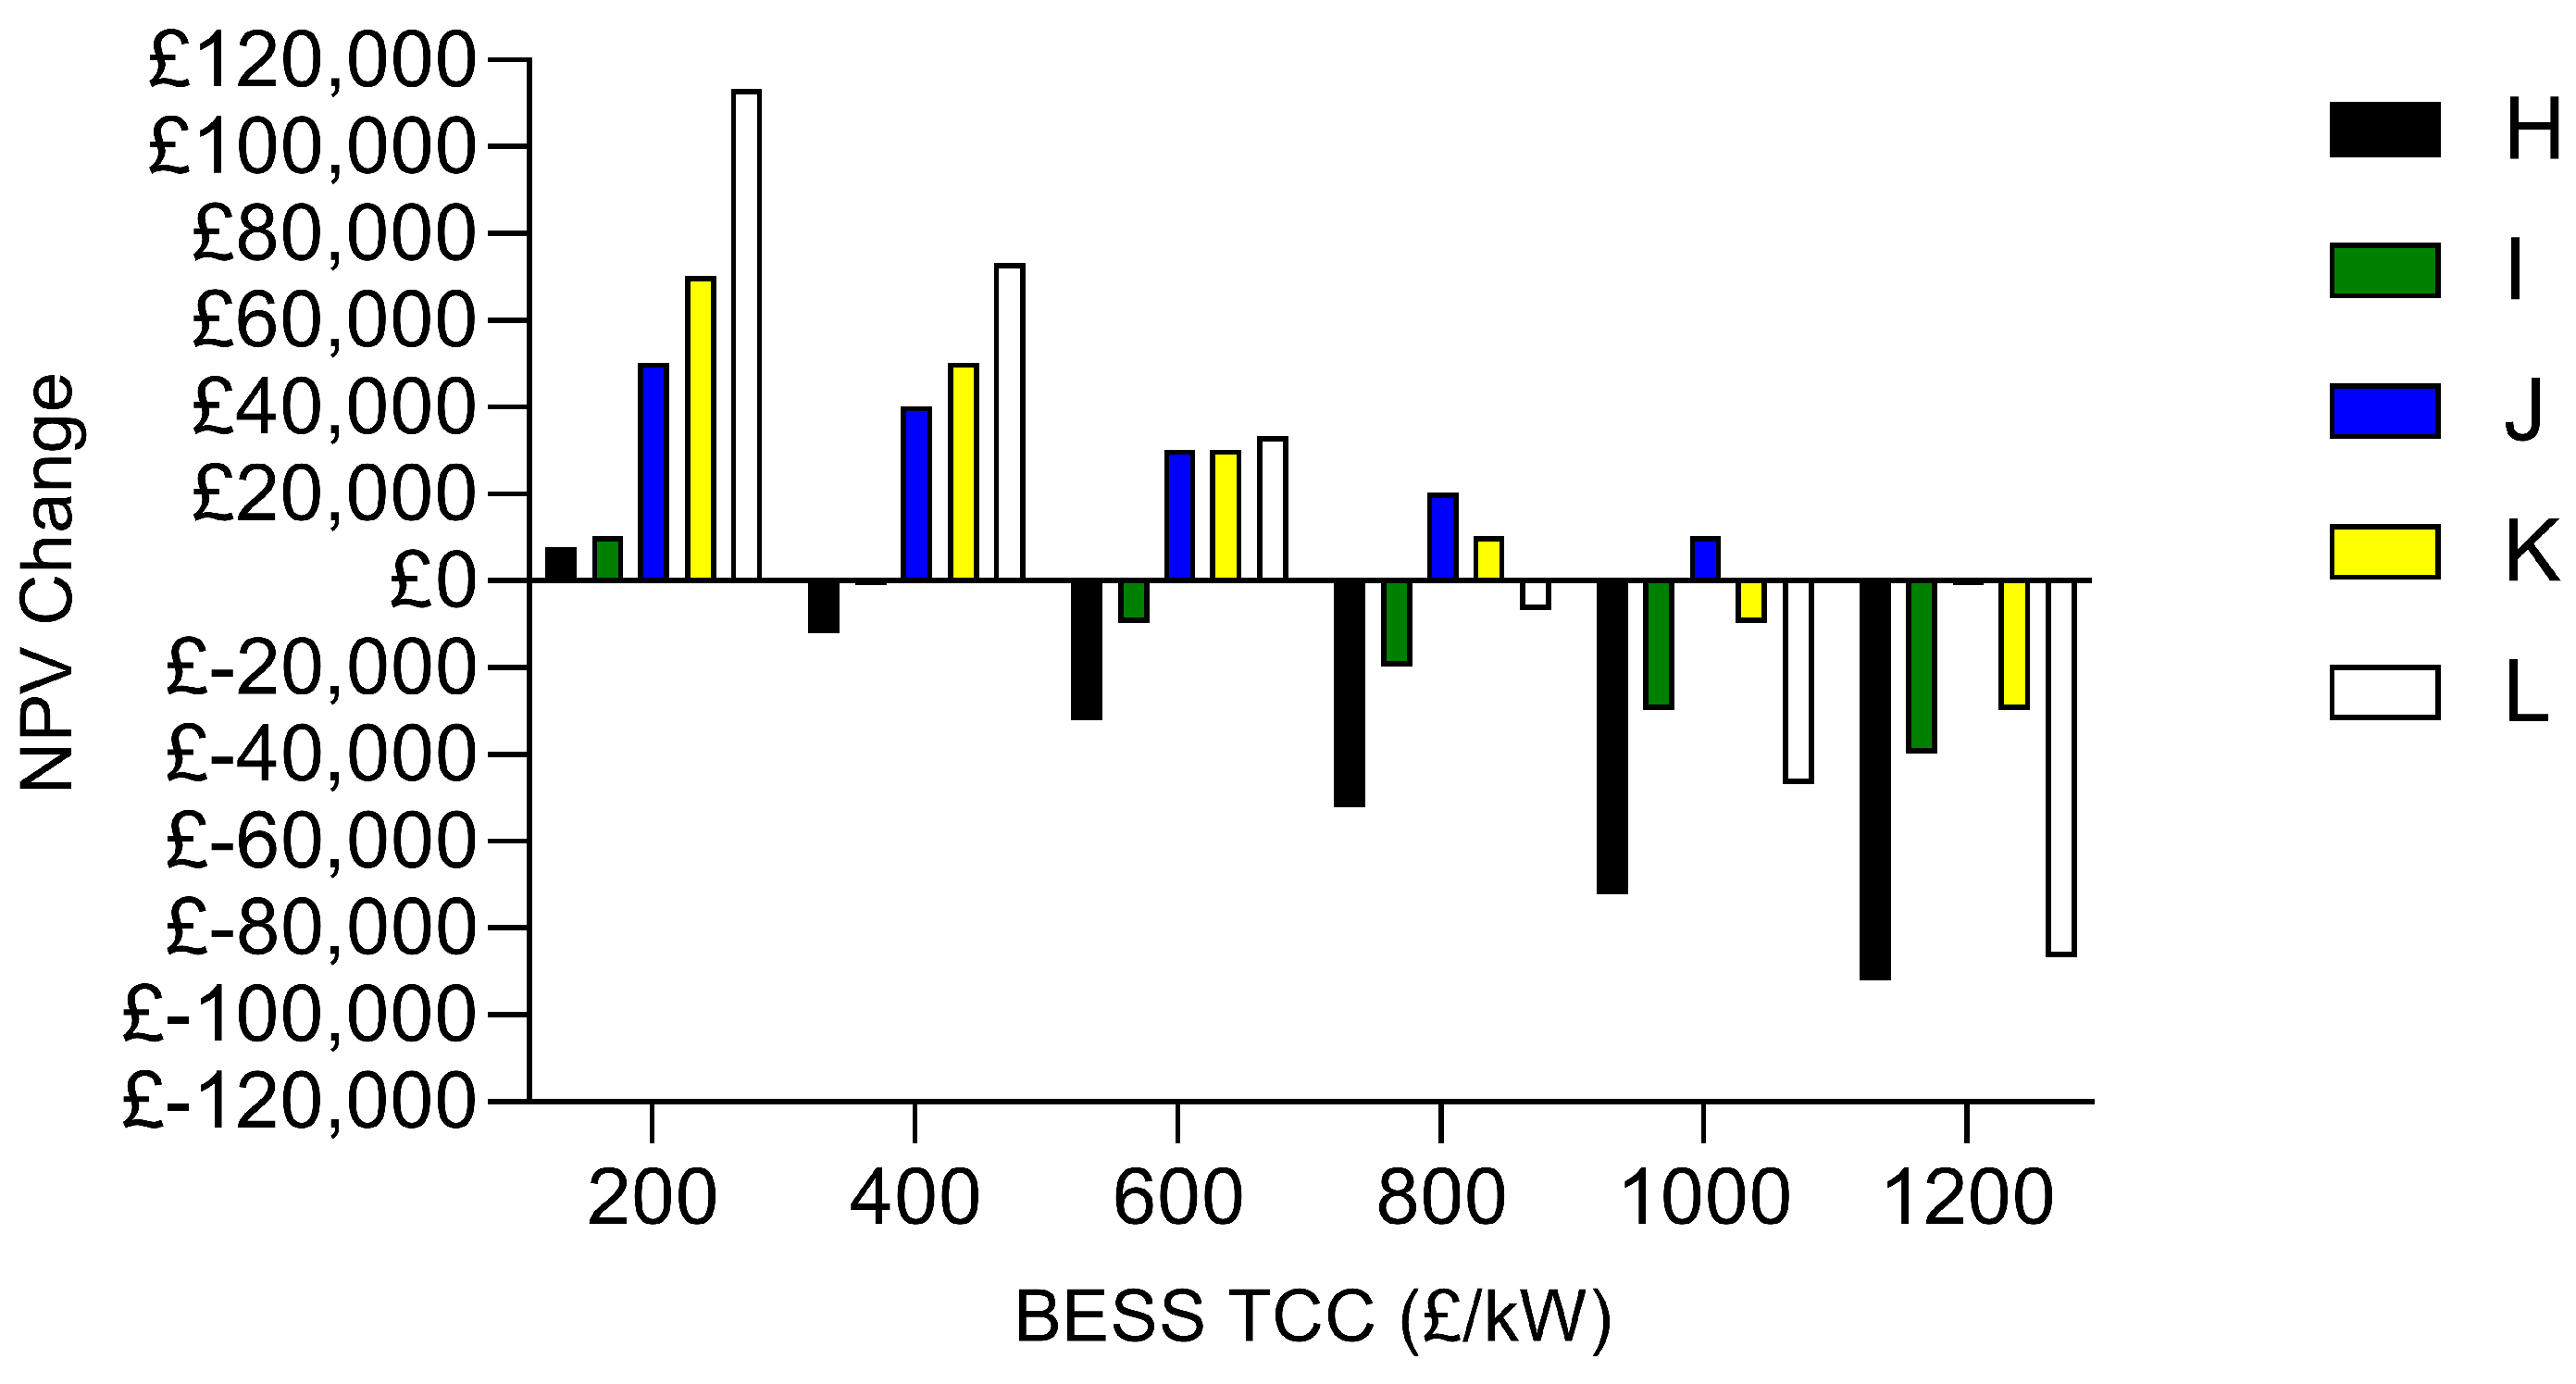
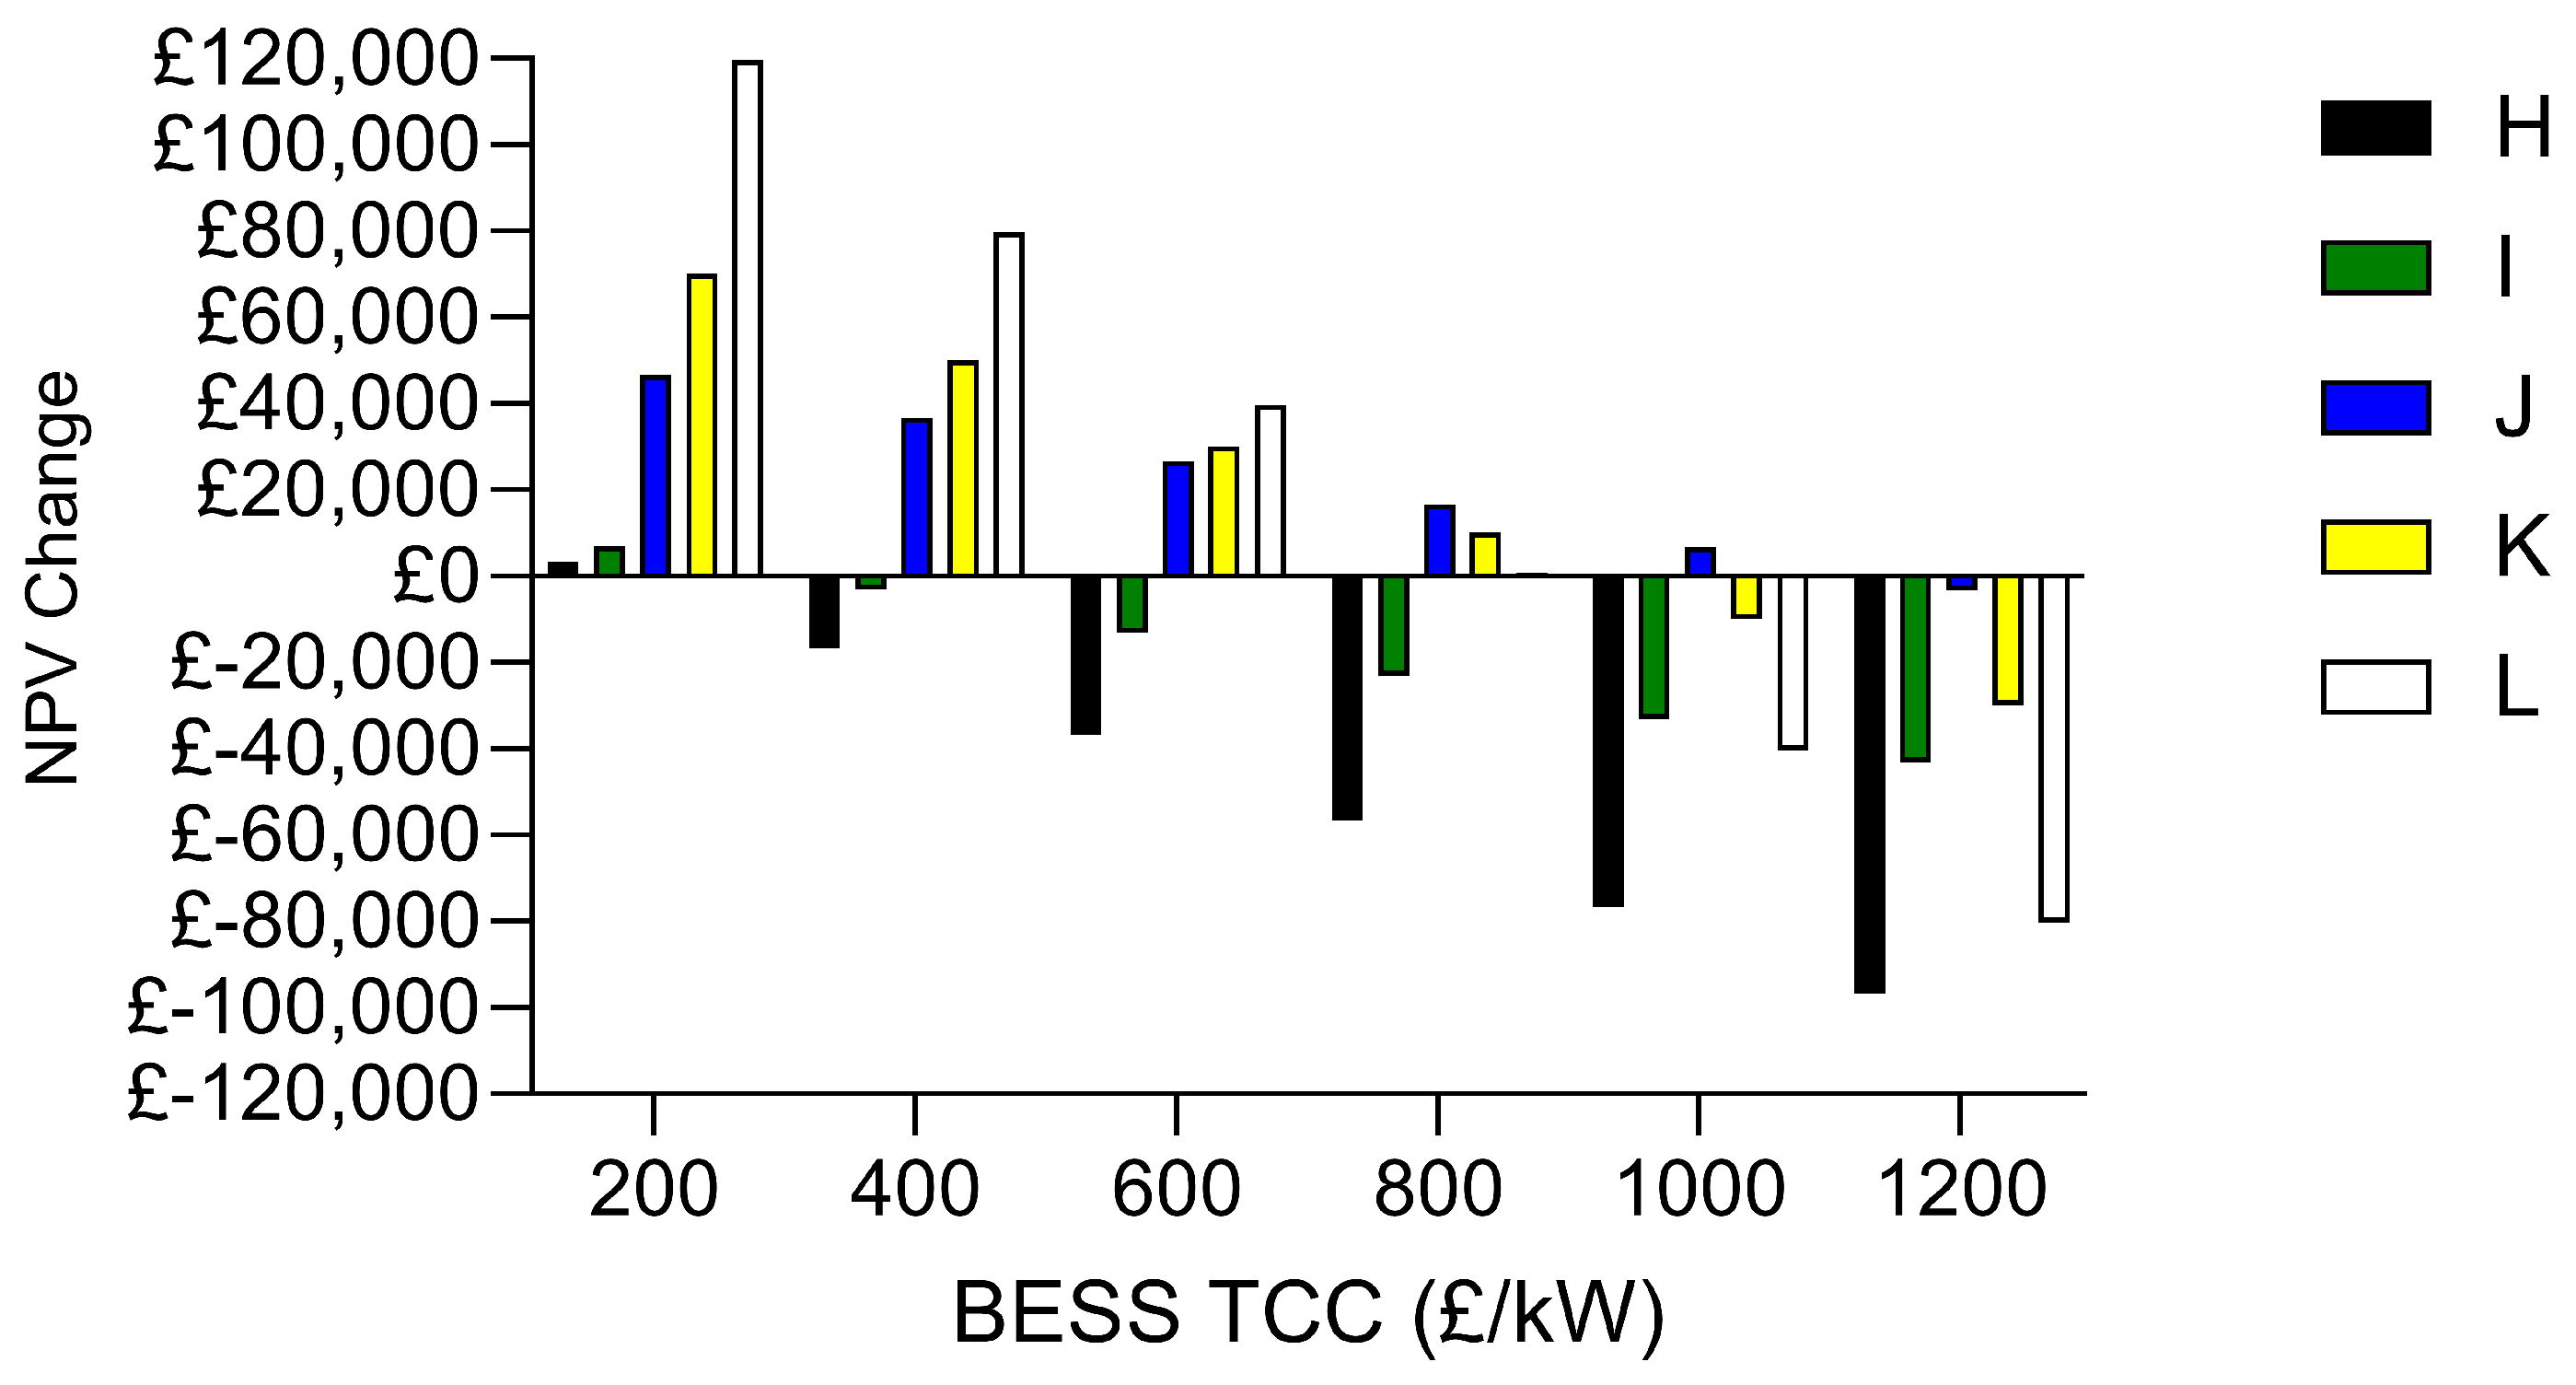
For the economic portion of this analysis, the FESS TCC has been set to 780 GBP/kW in line with the average found previously in the literature review. From the baseline NPV for Configuration D at this TCC, further analysis has been undertaken to assess the impact of the BESS TCC and discount rate on the economic feasibility of hybridisation. The results of this analysis are shown in
Figure 14,
Figure 15 and
Figure 16.
This analysis reveals several interesting trends. For analysed TCC values of 800 /kW and above, Configuration J is the option that consistently performs best. This is due to the small capacity of BESS required for this configuration, so the benefits provided are affected less by the higher TCC.
In the other direction, at lower TCC values, Configuration L provides the highest NPVC again due to the complex balance between an increase in performance and cost. As the BESS cost drops below the FESS cost, it becomes more beneficial to replace more of the FESS with quantities of BESS. Thus, there is a balancing act to be achieved depending on the relevant costs of each component.
Additionally, it is interesting to note that at the lower end of the BESS TCC values, increasing the discount has a positive effect on the NPVC. This runs counter-intuitively to the common understanding of NPV; however, it is easily explained by acknowledging that as the discount rate is changed, the baseline NPV of Configuration D also changes. Consequently, the effect of hybridisation is having more of a positive effect as a ratio of the original NPV.
This conclusion now leads us to consider the actual NPV achieved by these systems, and whether the increases seen under these varying scenarios are sufficient to make the selected configuration (D) economically viable. To illustrate this, the base NPV values when using a TCC of 780 GBP/kW for the FESS and the best-performing value of 200 GBP/kW for the BESS are shown across varying discount rates in
Figure 17.
Despite the hybridisation improving the NPV in all of these scenarios, the NPV remains negative unless the discount rate is reduced to 2%. The main conclusion to draw from this is that hybridisation can indeed make a positive contribution to the economic viability of an FESS-providing DFR, it cannot radically improve the NPV and hence it is important to note that in some scenarios it may not be suitable.
To illustrate this, the effect that hybridisation has on Configuration B and C is now considered. The analysis previously conducted was repeated for both configurations to replicate the results shown previously in
Figure 17 but for the two new configurations. Once again, the FESS TCC was set as 780 GBP/kW with the BESS TCC set as 200 GBP/kW to illustrate the best-case scenario for BESS impact when installing with an FESS of average cost. The results of this analysis are shown in
Figure 18 and
Figure 19. The updated configurations considered in this analysis are shown in
Table 8.
The hybridisation with Configuration B produces the highest overall NPV. However, the effect of hybridisation still remains minimal, with a negative NPV only turning positive in one scenario, when considering a 4% discount rate Configuration B can provide a positive NPV when it is modified to form Configuration Q.
Configuration B and C already perform to a higher economic level than Configuration D; therefore, there are scenarios where introducing a BESS at a low TCC of 200 GBP/kW will negatively impact the overall NPV even at the lowest discount rate. This is because, in these configurations, the addition of the BESS components does not provide a sufficient technical performance boost to offset the additional economic cost.
7. Conclusions and Future Work
Under current economic conditions, it is unlikely that an FESS could be deployed as a standalone system providing DFR. The results from this study suggested that as a standalone entity, a FESS with a low C-Rate will be most effective at providing the service, as the 0.5C system showed the best overall performance. Realistically, however, FESSs are rarely specified as high energy assets, and as such further analysis was performed on 1C, 2.5C and 5C systems to determine the conditions under which they can be profitable in providing DFR.
The conclusion of this further analysis was that under current economic conditions, it is unlikely that higher C-Rate FESSs would be economically viable for deployment for this application. Despite this, FESSs up to 2.5C have been shown to be technically capable of delivering the service in a standalone format, with a 5C system likely to be able to perform adequately with supplementation from a more energy-dense technology. Across an in-depth analysis of different FESS configurations and discount rates, only 1C and 2.5C systems could achieve a positive NPV at the lowest discount rate studied. This does, however, present the research field with a benchmark for future research into FESSs, where decreasing costs of installation could lead to this technology being economically viable.
To further explore this potential, a hybridisation study was undertaken. Introducing differing levels of battery energy storage, the study looked at whether this could make higher C-Rate systems economically viable. The conclusions of this study showed that whilst there was an improvement in the technical performance of the system, only under a narrow set of economic conditions would the system achieve a positive NPV. Thus, the conclusion to take away from this study is that the limiting factor for FESSs being deployed in the field of frequency response services is their currently high capital costs. Reducing this to a competitive level should be a target area of research in the field of Flywheel Energy Storage.
Future work should look to investigate the possibility of designing services with shorter-duration technologies in mind, as well as developing further studies on the optimisation of hybrid systems for frequency response.
Author Contributions
Conceptualization, A.J.H. and D.T.G.; methodology, A.J.H.; software, A.J.H.; validation, D.T.G.; formal analysis, A.J.H.; investigation, A.J.H.; writing—original draft preparation, A.J.H.; writing—review and editing, D.T.G.; supervision, D.T.G.; funding acquisition, D.T.G. All authors have read and agreed to the published version of the manuscript.
Funding
The authors gratefully acknowledge the financial support of the Engineering and Physical Sciences Research Council (EPSRC) in the form of the ‘Energy Storage Integration for a Net Zero grid’ project under grant code EP/W02764X/1.
Data Availability Statement
The datasets presented in this article are not readily available because of ongoing studies. Requests to access the datasets should be directed to the authors.
Conflicts of Interest
The authors declare no conflicts of interest. The funders had no role in the design of the study; in the collection, analyses, or interpretation of data; in the writing of the manuscript; or in the decision to publish the results.
Abbreviations
The following abbreviations are used in this manuscript:
| BESS | Battery Energy Storage System |
| DFR | Dynamic Frequency Response |
| ESS | Energy Storage System |
| FESS | Flywheel Energy Storage System |
| GB | Great Britain |
| NPV | Net Present Value |
| NPVC | Net Present Value Change |
| NGESO | National Grid Electricity System Operator |
| ROI | Return on Investment |
| SOC | State of Charge |
| TCC | Total Capital Cost |
References
- Mexis, I.; Todeschini, G. Battery energy storage systems in the united kingdom: A review of current state-of-the-art and future applications. Energies 2020, 13, 3616. [Google Scholar] [CrossRef]
- Li, J.; Yao, F.; Yang, Q.; Wei, Z.; He, H. Variable Voltage Control of a Hybrid Energy Storage System for Firm Frequency Response in the UK. IEEE Trans. Ind. Electron. 2022, 69, 13394–13404. [Google Scholar] [CrossRef]
- Sebastián, R.; Peña Alzola, R. Flywheel energy storage systems: Review and simulation for an isolated wind power system. Renew. Sustain. Energy Rev. 2012, 16, 6803–6813. [Google Scholar] [CrossRef]
- Dai, X.; Wei, K.; Zhang, X. Analysis of the peak load leveling mode of a hybrid power system with flywheel energy storage in oil drilling rig. Energies 2019, 12, 606. [Google Scholar] [CrossRef]
- Shen, L.; Cheng, Q.; Cheng, Y.; Wei, L.; Wang, Y. Hierarchical control of DC micro-grid for photovoltaic EV charging station based on flywheel and battery energy storage system. Electr. Power Syst. Res. 2020, 179, 106079. [Google Scholar] [CrossRef]
- Amiryar, M.E.; Pullen, K.R. A review of flywheel energy storage system technologies and their applications. Appl. Sci. 2017, 7, 286. [Google Scholar] [CrossRef]
- National Grid ESO. Firm Frequency Response (FFR). Available online: https://www.nationalgrideso.com/industry-information/balancing-services/frequency-response-services/firm-frequency-response-ffr?overview (accessed on 8 March 2022).
- National Grid ESO. The Grid Code—UK. Available online: https://www.nationalgrid.com/sites/default/files/documents/8589935310-Complete%20Grid%20Code.pdf (accessed on 8 March 2023).
- Hutchinson, A.J.; Gladwin, D.T. Techno-Economic Analysis of a Flywheel Energy Storage System performing a Dynamic Frequency Response Service. In Proceedings of the IEEE International Symposium on Industrial Electronics, Kyoto, Japan, 20–23 June 2021. [Google Scholar] [CrossRef]
- Hutchinson, A.J.; Gladwin, D.T. Genetic Algorithm Optimisation of Hybrid Energy Storage System providing Dynamic Frequency Response. In Proceedings of the 2022 IEEE International Symposium on Industrial Electronics, Anchorage, AK, USA, 1–3 June 2022. [Google Scholar]
- National Grid ESO. Historic Frequency Data. Available online: https://www.nationalgrideso.com/balancing-services/frequency-response-services/historic-frequency-data (accessed on 14 February 2021).
- Simpkins, T.; Donnell, C.O. Optimizing Battery Sizing and Dispatching To Maximize Economic Return. In Proceedings of the Battcon Stationary Battery Conference, Orlando, FL, USA, 7–10 May 2017; pp. 1–14. [Google Scholar]
- OXTO Energy. Available online: https://www.oxtoenergy.com/ (accessed on 15 June 2020).
- Hutchinson, A.J.; Gladwin, D.T. Verification and analysis of a Battery Energy Storage System model. Energy Rep. 2022, 8, 41–47. [Google Scholar] [CrossRef]
- Greenwood, D.M.; Lim, K.Y.; Patsios, C.; Lyons, P.F.; Lim, Y.S.; Taylor, P.C. Frequency response services designed for energy storage. Appl. Energy 2017, 203, 115–127. [Google Scholar] [CrossRef]
- National Grid ESO. Firm Frequency Response (FFR) Post Tender Reports. Available online: https://data.nationalgrideso.com/ancillary-services/firm-frequency-response-post-tender-reports (accessed on 9 March 2021).
- International Energy Agency. Energy Technology Perspectives 2017; OECD Library: Tokyo, Japan, 2017. [Google Scholar] [CrossRef]
- Wang, J.; Purewal, J.; Liu, P.; Hicks-Garner, J.; Soukazian, S.; Sherman, E.; Sorenson, A.; Vu, L.; Tataria, H.; Verbrugge, M.W. Degradation of lithium ion batteries employing graphite negatives and nickel-cobalt-manganese oxide + spinel manganese oxide positives: Part 1, aging mechanisms and life estimation. J. Power Sources 2014, 269, 937–948. [Google Scholar] [CrossRef]
- Carrasco Ortega, P.; Durán Gómez, P.; Mérida Sánchez, J.C.; Echevarría Camarero, F.; Pardiñas, Á. Battery Energy Storage Systems for the New Electricity Market Landscape: Modeling, State Diagnostics, Management, and Viability—A Review. Energies 2023, 16, 6334. [Google Scholar] [CrossRef]
- Rey, S.O.; Romero, J.A.; Romero, L.T.; Martínez, À.F.; Roger, X.S.; Qamar, M.A.; Domínguez-García, J.L.; Gevorkov, L. Powering the Future: A Comprehensive Review of Battery Energy Storage Systems. Energies 2023, 16, 6344. [Google Scholar] [CrossRef]
- Krichen, M.; Basheer, Y.; Qaisar, S.M.; Waqar, A. A Survey on Energy Storage: Techniques and Challenges. Energies 2023, 16, 2271. [Google Scholar] [CrossRef]
- Olabi, A.G.; Wilberforce, T.; Abdelkareem, M.A.; Ramadan, M. Critical review of flywheel energy storage system. Energies 2021, 14, 2159. [Google Scholar] [CrossRef]
- Xu, K.; Guo, Y.; Lei, G.; Zhu, J. A Review of Flywheel Energy Storage System Technologies. Energies 2023, 16, 6462. [Google Scholar] [CrossRef]
- Stornetic. Enwheel. Available online: https://www.stornetic.com/our-technology/enwheel (accessed on 13 July 2022).
- Amber Kinetics. Amber Kinetics M32. Available online: https://www.amberkinetics.com/wp-content/uploads/2020/05/Amber-Kinetics-DataSheet.pdf (accessed on 13 July 2022).
- Arshad, M.S. Techno-economic Feasibility of Flywheel Energy Storage System in Standalone and Hybrid Applications. Ph.D. Thesis, University of Alberta, Edmonton, AB, Canada, 2021. [Google Scholar] [CrossRef]
- Prodromidis, G.N.; Coutelieris, F.A. Simulations of economical and technical feasibility of battery and flywheel hybrid energy storage systems in autonomous projects. Renew. Energy 2012, 39, 149–153. [Google Scholar] [CrossRef]
- Beltran, H.; Harrison, S.; Egea-Àlvarez, A.; Xu, L. Techno-economic assessment of energy storage technologies for inertia response and frequency support from wind farms. Energies 2020, 13, 3421. [Google Scholar] [CrossRef]
- Ahmouda, A.; Gladwin, D.T. Enhanced Dynamic Control Strategy for Stacked Dynamic Regulation Frequency Response Services in Battery Energy Storage Systems. Energies 2023, 16, 7686. [Google Scholar] [CrossRef]
- Lazarewicz, M.L.; Ryan, T.M. Integration of flywheel-based energy storage for frequency regulation in deregulated markets. In Proceedings of the IEEE PES General Meeting, PES 2010, Minneapolis, MN, USA, 25–29 July 2010; pp. 4–9. [Google Scholar] [CrossRef]
- Lian, B.; Sims, A.; Yu, D.; Wang, C.; Dunn, R.W. Optimizing LiFePO4 Battery Energy Storage Systems for Frequency Response in the UK System. IEEE Trans. Sustain. Energy 2017, 8, 385–394. [Google Scholar] [CrossRef]
- Stroe, D.I.; Knap, V.; Swierczynski, M.; Stroe, A.I.; Teodorescu, R. Operation of a grid-connected lithium-ion battery energy storage system for primary frequency regulation: A battery lifetime perspective. IEEE Trans. Ind. Appl. 2017, 53, 430–438. [Google Scholar] [CrossRef]
- Gundogdu, B.; Gladwin, D.; Stone, D. Battery energy management strategies for UK firm frequency response services and energy arbitrage. J. Eng. 2019, 2019, 4152–4157. [Google Scholar] [CrossRef]
- Mantar Gundogdu, B.; Nejad, S.; Gladwin, D.T.; Foster, M.P.; Stone, D.A. A battery energy management strategy for U.K. enhanced frequency response and triad avoidance. IEEE Trans. Ind. Electron. 2018, 65, 9509–9517. [Google Scholar] [CrossRef]
- Saberi Oskouee, S.; Kamali, S.; Amraee, T. Primary Frequency Support in Unit Commitment Using a Multi-Area Frequency Model with Flywheel Energy Storage. IEEE Trans. Power Syst. 2021, 36, 5105–5119. [Google Scholar] [CrossRef]
- Moghaddam, H.A.; Saeedinia, M.H.; Mohamadian, S.; Mahdavi, M.S.; Gharehpetian, G.B. Integrated Modeling of Power Network and Connected Flywheel Energy Storage System for Optimal Power and Energy Ratings of Flywheel. IEEE Trans. Energy Convers. 2021, 36, 1589–1599. [Google Scholar] [CrossRef]
- Karrari, S.; Noe, M.; Geisbuesch, J. High-speed Flywheel Energy Storage System (FESS) for Voltage and Frequency Support in Low Voltage Distribution Networks. In Proceedings of the 2018 IEEE 3rd International Conference on Intelligent Energy and Power Systems, IEPS 2018, Kharkiv, Ukraine, 10–14 September 2018; pp. 176–182. [Google Scholar] [CrossRef]
- Karrari, S.; De Carne, G.; Noe, M. Model validation of a high-speed flywheel energy storage system using power hardware-in-the-loop testing. J. Energy Storage 2021, 43, 103177. [Google Scholar] [CrossRef]
- Bahloul, M.; Khadem, S.K. An analytical approach for techno-economic evaluation of hybrid energy storage system for grid services. J. Energy Storage 2020, 31, 101662. [Google Scholar] [CrossRef]
- Sessa, S.D.; Tortella, A.; Andriollo, M.; Benato, R. Li-ion battery-flywheel hybrid storage system: Countering battery aging during a grid frequency regulation service. Appl. Sci. 2018, 8, 2330. [Google Scholar] [CrossRef]
- Zakeri, B.; Syri, S. Electrical energy storage systems: A comparative life cycle cost analysis. Renew. Sustain. Energy Rev. 2015, 42, 569–596. [Google Scholar] [CrossRef]
- Liu, J.; Hu, C.; Kimber, A.; Wang, Z. Uses, Cost-Benefit Analysis, and Markets of Energy Storage Systems for Electric Grid Applications. J. Energy Storage 2020, 32, 101731. [Google Scholar] [CrossRef]
- Aneke, M.; Wang, M. Energy storage technologies and real life applications—A state of the art review. Appl. Energy 2016, 179, 350–377. [Google Scholar] [CrossRef]
- Mongird, K.; Viswanathan, V.; Balducci, P.; Alam, J.; Fotedar, V.; Koritarov, V.; Hadjerioua, B. Energy Storage Technology and Cost Characterization Report; US Department of Energy: Washington, DC, USA, 2019; pp. 1–120. [Google Scholar]
- Kousksou, T.; Bruel, P.; Jamil, A.; El Rhafiki, T.; Zeraouli, Y. Energy storage: Applications and challenges. Sol. Energy Mater. Sol. Cells 2014, 120, 59–80. [Google Scholar] [CrossRef]
- Alharbi, H.; Bhattacharya, K. Stochastic optimal planning of battery energy storage systems for isolated microgrids. IEEE Trans. Sustain. Energy 2018, 9, 211–227. [Google Scholar] [CrossRef]
- International Energy Agency. Technology Roadmap. In Encyclopedia of Production and Manufacturing Management; Springer: Boston, MA, USA, 2014. [Google Scholar] [CrossRef]
- Meishner, F.; Sauer, D.U. Wayside energy recovery systems in DC urban railway grids. eTransportation 2019, 1, 100001. [Google Scholar] [CrossRef]
- Khalid, M.; Savkin, A.V. Minimization and control of battery energy storage for wind power smoothing: Aggregated, distributed and semi-distributed storage. Renew. Energy 2014, 64, 105–112. [Google Scholar] [CrossRef]
- Martins, J.; Miles, J. A techno-economic assessment of battery business models in the UK electricity market. Energy Policy 2021, 148, 111938. [Google Scholar] [CrossRef]
- Renewable Energy Association. Energy Storage in the UK. Technical Report, REA. 2016. Available online: https://www.r-e-a.net/wp-content/uploads/2019/10/Energy-Storage-FINAL6.pdf (accessed on 2 October 2023).
- Olateju, B.; Kumar, A.; Secanell, M. A techno-economic assessment of large scale wind-hydrogen production with energy storage in Western Canada. Int. J. Hydrogen Energy 2016, 41, 8755–8776. [Google Scholar] [CrossRef]
- Atherton, J.; Sharma, R.; Salgado, J. Techno-economic analysis of energy storage systems for application in wind farms. Energy 2017, 135, 540–552. [Google Scholar] [CrossRef]
- Shaw-Williams, D.; Susilawati, C.; Walker, G. Value of residential investment in photovoltaics and batteries in networks: A techno-economic analysis. Energies 2018, 11, 1022. [Google Scholar] [CrossRef]
- Anvari-Azar, F.; Strickland, D.; Filkin, N.; Townshend, H. Net Present Value Analysis of a Hybrid Gas Engine Energy Storage System in the Balancing Mechanism. Energies 2020, 13, 3816. [Google Scholar] [CrossRef]
- Diyoke, C.; Aneke, M.; Wang, M.; Wu, C. Techno-economic analysis of wind power integrated with both compressed air energy storage (CAES) and biomass gasification energy storage (BGES) for power generation. RSC Adv. 2018, 8, 22004–22022. [Google Scholar] [CrossRef]
- Schoenung, S.; Hassenzahl, W. Long- vs. Short-Term Energy Storage Technologies Analysis A Life-Cycle Cost Study A Study for the DOE Energy Storage Systems Program. Power Quality 2003, SAND2011-2, 84. [Google Scholar]
- Www.rateinflation.com. United Kingdom Inflation Rates: 1989 to 2021. Available online: https://www.rateinflation.com/inflation-rate/uk-historical-inflation-rate/ (accessed on 21 May 2021).
- Battery University. BU-402: What Is C-Rate? Available online: https://batteryuniversity.com/article/bu-402-what-is-c-rate (accessed on 2 October 2023).
- Active Power. Cleansource Plus Sms. Available online: https://www.activepower.com/en-US/documents/6791/cleansource-r-plus-sms-ul-60hz-300-kw-480v.pdf (accessed on 10 February 2023).
- Vycon Energy. VYCON Direct Connect (VDC) Kinetic Energy Storage Systems. Available online: https://vyconenergy.com/wp-content/uploads/2020/11/VYCON_VDC_Brochure_2020.pdf (accessed on 6 October 2022).
- Spinlectrix. The Revolution. Available online: https://www.spinlectrix.com/the-revolution (accessed on 13 July 2022).
- Energiestro. Technology. Available online: https://energiestro.net/technology/ (accessed on 13 July 2022).
- Revterra. Cost Effective & Long Duration Storage. Available online: https://www.revterra.io/ (accessed on 13 July 2022).
- Teraloop. Our Products. Available online: https://www.teraloop.org/products (accessed on 14 July 2022).
- Hutchinson, A.J.; Gladwin, D.T. Techno-economic assessment of novel hybrid energy storage control strategies for Dynamic Frequency Response. J. Energy Storage 2022, 55, 105694. [Google Scholar] [CrossRef]
Figure 1.
Example simulation output of a 1 MW 5C FESS providing DFR (a) frequency (b) FESS power (kW) (c) FESS SOC.
Figure 1.
Example simulation output of a 1 MW 5C FESS providing DFR (a) frequency (b) FESS power (kW) (c) FESS SOC.
Figure 2.
High-level diagram of MATLAB/Simulink model of an FESS used in this study.
Figure 2.
High-level diagram of MATLAB/Simulink model of an FESS used in this study.
Figure 3.
DFR response envelope.
Figure 3.
DFR response envelope.
Figure 4.
Examples of flywheel installations—(
a) Stornetic (
b) OXTO (
c) Amber Kinetics [
13,
24,
25].
Figure 4.
Examples of flywheel installations—(
a) Stornetic (
b) OXTO (
c) Amber Kinetics [
13,
24,
25].
Figure 5.
Ranges of Total Capital Costs for BESSs and FESSs in the literature.
Figure 5.
Ranges of Total Capital Costs for BESSs and FESSs in the literature.
Figure 6.
Availability per month for varying configurations of FESS.
Figure 6.
Availability per month for varying configurations of FESS.
Figure 7.
NPV for a 20-year lifespan for varying configurations of FESS.
Figure 7.
NPV for a 20-year lifespan for varying configurations of FESS.
Figure 8.
NPV for a 20-year lifespan for varying configurations of FESS with increased cycle lifetime.
Figure 8.
NPV for a 20-year lifespan for varying configurations of FESS with increased cycle lifetime.
Figure 9.
Discount and TCC sensitivity analysis for Configuration B.
Figure 9.
Discount and TCC sensitivity analysis for Configuration B.
Figure 10.
Discount and TCC sensitivity analysis for Configuration C.
Figure 10.
Discount and TCC sensitivity analysis for Configuration C.
Figure 11.
Discount and TCC sensitivity analysis for Configuration D.
Figure 11.
Discount and TCC sensitivity analysis for Configuration D.
Figure 12.
High-level diagram of MATLAB/Simulink model of the hybrid FESS/BESS system used in this study.
Figure 12.
High-level diagram of MATLAB/Simulink model of the hybrid FESS/BESS system used in this study.
Figure 13.
Average availability and energy throughput across the year for varying configurations of HESS [
9].
Figure 13.
Average availability and energy throughput across the year for varying configurations of HESS [
9].
Figure 14.
NPV change under different HESS configurations for a discount rate of 4%.
Figure 14.
NPV change under different HESS configurations for a discount rate of 4%.
Figure 15.
NPV change under different HESS configurations for a discount rate of 6%.
Figure 15.
NPV change under different HESS configurations for a discount rate of 6%.
Figure 16.
NPV change under different HESS configurations for a discount rate of 8%.
Figure 16.
NPV change under different HESS configurations for a discount rate of 8%.
Figure 17.
Total NPV under different HESS configurations for varying discount rates from a baseline of Configuration D.
Figure 17.
Total NPV under different HESS configurations for varying discount rates from a baseline of Configuration D.
Figure 18.
Total NPV under different HESS configurations for varying discount rates from a baseline of Configuration B.
Figure 18.
Total NPV under different HESS configurations for varying discount rates from a baseline of Configuration B.
Figure 19.
Total NPV under different HESS configurations for varying discount rates from a baseline of Configuration C.
Figure 19.
Total NPV under different HESS configurations for varying discount rates from a baseline of Configuration C.
Table 1.
Model parameters used in simulations.
Table 1.
Model parameters used in simulations.
| Parameter | FESS | BESS |
|---|
| System Self-Discharge Rate (per hour) | 3% | 0.125% |
| Round-trip Efficiency | 90% | 90% |
| SOC High Limit | 98% | 95% |
| SOC Low Limit | 2% | 5% |
Table 2.
Total Capital Costs for Li-ion BESSs and FESSs in the literature.
Table 2.
Total Capital Costs for Li-ion BESSs and FESSs in the literature.
| Ref. | Currency | BESS (GBP/kW) | BESS (GBP/kWh) | FESS (GBP/kW) | FESS (GBP/kWh) | Year |
|---|
| [41] | € | 1160 | - | 867 | - | 2015 |
| [42] | $ | - | 200–1260 | - | 1500–6000 | 2020 |
| [43] | $ | 1200–4000 | 600–2500 | 250–350 | 1000–5000 | 2016 |
| [44] | $ | 2194 | 469 | 2880 | 11,520 | 2018 |
| [45] | $ | 4000 | 2500 | 350 | 5000 | 2014 |
| [46] | $ | 1859 | 901 | - | - | 2018 |
| [47] | $ | 300–3500 | - | 130–500 | - | 2014 |
| [48] | $ | - | 100–2500 | 300–1000 | 100–2500 | 2019 |
| [49] | $ | - | 1272 | - | - | 2014 |
| [50] | GBP | - | 216 | - | - | 2021 |
| [51] | $ | 1180–4450 | 975–6740 | 2120–2390 | 420–470 | 2016 |
| [52] | $ | - | 440 | - | - | 2016 |
| [53] | $ | - | 400 | - | 1600 | 2017 |
Table 3.
FESS configurations analyzed in FESS-Only DFR study.
Table 3.
FESS configurations analyzed in FESS-Only DFR study.
| Configuration | kWh Rating | kW Rating | C-Rate |
|---|
| A | 4000 | 1000 | 0.25 |
| B | 1000 | 1000 | 1 |
| C | 400 | 1000 | 2.5 |
| D | 200 | 1000 | 5 |
| E | 100 | 1000 | 10 |
| F | 66 | 1000 | 15 |
| G | 50 | 1000 | 20 |
Table 4.
Performance statistics for varying FESS configurations performing DFR.
Table 4.
Performance statistics for varying FESS configurations performing DFR.
| Configuration | Average SOC (%) | Cycles per Year |
|---|
| A | 77 | 742 |
| B | 61 | 1322 |
| C | 54 | 2341 |
| D | 52 | 3828 |
| E | 51 | 6292 |
| F | 50 | 8373 |
| G | 50 | 10,138 |
Table 5.
TCC at which NPV becomes negative for each configuration and varying cycle limits.
Table 5.
TCC at which NPV becomes negative for each configuration and varying cycle limits.
| | 100,000 Cycle Limit (GBP/kW) | 250,000 Cycle Limit (GBP/kW) |
|---|
| A | 508 | 508 |
| B | 496 | 496 |
| C | 452 | 452 |
| D | 407 | 407 |
| E | 290 | 353 |
| F | 255 | 317 |
| G | 230 | 283 |
Table 6.
Hybrid configurations analyzed in HESS DFR study.
Table 6.
Hybrid configurations analyzed in HESS DFR study.
| | FESS kWh Rating | FESS kW Rating | C-Rate | BESS kWh Rating | BESS kW Rating | C-Rate |
|---|
| D | 200 | 1000 | 5 | - | - | - |
| H | 200 | 1000 | 5 | 50 | 50 | 1 |
| I | 200 | 1000 | 5 | 100 | 100 | 1 |
| J | 190 | 950 | 5 | 50 | 50 | 1 |
| K | 180 | 900 | 5 | 100 | 100 | 1 |
| L | 160 | 800 | 5 | 200 | 200 | 1 |
Table 7.
Number of FESS and BESS cycles from hybrid configuration study.
Table 7.
Number of FESS and BESS cycles from hybrid configuration study.
| Configuration | FESS Cycles | BESS Cycles |
|---|
| D | 3828 | - |
| H | 3829 | 434 |
| I | 3829 | 429 |
| J | 3973 | 458 |
| K | 4130 | 477 |
| L | 4495 | 478 |
Table 8.
Further hybrid configurations analyzed in HESS DFR study.
Table 8.
Further hybrid configurations analyzed in HESS DFR study.
| | FESS kWh Rating | FESS kW Rating | FESS C-Rate | BESS kWh Rating | BESS kW Rating | BESS C-Rate |
|---|
| B | 1000 | 1000 | 1 | - | - | - |
| M | 1000 | 1000 | 1 | 50 | 50 | 1 |
| N | 1000 | 1000 | 1 | 100 | 100 | 1 |
| O | 950 | 950 | 1 | 50 | 50 | 1 |
| P | 900 | 900 | 1 | 100 | 100 | 1 |
| Q | 800 | 800 | 1 | 200 | 200 | 1 |
| C | 400 | 1000 | 2.5 | - | - | - |
| R | 400 | 1000 | 2.5 | 50 | 50 | 1 |
| S | 400 | 1000 | 2.5 | 100 | 100 | 1 |
| T | 380 | 950 | 2.5 | 50 | 50 | 1 |
| U | 360 | 900 | 2.5 | 100 | 100 | 1 |
| V | 320 | 800 | 2.5 | 200 | 200 | 1 |
| Disclaimer/Publisher’s Note: The statements, opinions and data contained in all publications are solely those of the individual author(s) and contributor(s) and not of MDPI and/or the editor(s). MDPI and/or the editor(s) disclaim responsibility for any injury to people or property resulting from any ideas, methods, instructions or products referred to in the content. |
© 2024 by the authors. Licensee MDPI, Basel, Switzerland. This article is an open access article distributed under the terms and conditions of the Creative Commons Attribution (CC BY) license (https://creativecommons.org/licenses/by/4.0/).


