Article

Parameter Identification of Power Grid Subsynchronous Oscillations Based on Eigensystem Realization Algorithm

1
State Grid Sichuan Electrical Power Research Institute, Chengdu 610041, China
2
Power Internet of Things Key Laboratory of Sichuan Province, Chengdu 610041, China
3
School of Electrical Engineering, Beijing Jiaotong University, Beijing 100044, China
*
Author to whom correspondence should be addressed.
These authors contributed equally to this work.
Energies 2024, 17(11), 2575; https://doi.org/10.3390/en17112575
Submission received: 17 April 2024 / Revised: 22 May 2024 / Accepted: 24 May 2024 / Published: 26 May 2024
(This article belongs to the Special Issue Stability Problems and Countermeasures in New Power Systems)

Abstract

:
The subsynchronous oscillation caused by the resonance between power electronic devices and series compensation devices or weak power grids introduced by large-scale renewable energy generation greatly reduces the transmission capacity of the system and may endanger the safe operation of the power system. It even leads to system oscillation instability. In this paper, based on the advantages of a simple solution, a small amount of calculation and anti-noise of ERA, a method of subsynchronous oscillation parameter identification based on the eigensystem realization algorithm (ERA) is proposed. The Hankel matrix in the improved ERA is obtained by splicing the real part matrix and the imaginary part matrix of the synchrophasor, thus solving the problem of angular frequency conjugate constraints of two fundamental components and two oscillatory components which are not considered in the existing ERA. The solution to this problem is helpful to improve the accurate parameter identification results of ERA under the data window of 200 ms and weaken the limitation caused by the assumption that the synchrophasor model is fixed. The practicability of the improved method based on PMU is verified by the synthesis of ERA and the actual measurement data. Compared with the existing ERA, the improved ERA can accurately identify the parameters of each component under the ultra-short data window and realize the dynamic monitoring of power system subsynchronous oscillation.

1. Introduction

Resonance between power electronic devices and series compensators or weak grids frequently causes subsynchronous oscillations (SSOs) in modern power systems with renewable generations. SSO occurs when voltage and current in a power system have a frequency lower than synchronization frequency. In some cases, there may also be a supersynchronous component with a frequency higher than the synchronization frequency. SSOs can reduce transmission capacity, threaten power system safety, and cause instability. Therefore, it is essential to closely monitor the dynamic process of SSOs in the power system and implement control measures in time to restrain SSOs effectively [1,2,3,4,5].
There are several methods for detecting subsynchronous oscillatory dynamic processes. In the literature [6], digital fault recorders are utilized for online monitoring of subsynchronous oscillations. Electrical and mechanical signals are both effective for SSO monitoring. This expands our monitoring capabilities and helps us identify potential issues proactively, saving costs and time. In references [7,8,9], Prony analysis, a model-based parameter identification method, is introduced. This method has high accuracy when the signal–noise ratio is high. However, the algorithm contains a large amount of computation and takes a long time. Moreover, all the methods mentioned above require the use of instantaneous data from the fault recorders (FRs). Collecting FR data on time is challenging due to the installation of FRs on various buses. Additionally, observing SSO globally is challenging due to the lack of a unified timing standard for FRs.
At present, the Wide Area Measurement System (WAMS) and Phasor Measurement Unit (PMU) are widely used in power systems. The most significant advantage of subsynchronous oscillation analysis based on synchrophasor data is that the data measured by different power stations have a unified time scale and comparability. SSO parameter identification methods based on synchrophasors can be classified as discrete Fourier transform (DFT) algorithm-based or not.
In DFT-based algorithms, literature [10] utilizes WAMS/PMU to analyze the impact of the DFT algorithm and a synchrophasor sampling rate on the amplitude spectrum. It provides a correction ratio for the accurate identification of SSO parameters. However, to accurately extract sub-synchronous oscillation component parameters, this method requires a large data window of 10 s. This is less reliable and real-time in identifying rapidly changing SSOs. Therefore, some scholars have proposed an interpolation DFT method combined with a Hann window [11,12]. This approach not only reduces the data window to 2 s, but also effectively eliminates spectrum aliasing influence. Reference [13] is built upon by literature [11] through an interpolation method utilizing the damped Rife–Vincent window function to enhance SSO identification accuracy. This method shortens the data window to 2 s.
Among non-DFT algorithms, there are mainly two modal parameter extraction algorithms based on synchrophasors [14], namely the matrix beam method [15,16,17] and the feature system implementation algorithm [18]. The non-DFT algorithms are less limited by the resolution of the spectrum. Therefore, a time window of 2 s can be used instead. Although the method above can ensure the accuracy of identifying sub-synchronous oscillation parameters to a certain extent, 2 s is still a relatively long time window. In addition, the above method does not consider the constraint of angular frequency conjugation, which reduces the accuracy of identifying the SSO parameters.
The eigensystem realization algorithm (ERA) is a classical modal parameter extraction algorithm. To extract the modal parameters, we can construct the Hankel matrix and system matrix. This transformation will convert the problem into a matrix decomposition problem. By doing so, we can obtain the angular frequency and coefficient of each mode directly. This is a simple and low-computation approach to solving the problem. In theory, there is an angular frequency conjugate constraint between the two modes of fundamental components. There is also an angular frequency conjugate constraint between the two modes of the oscillatory component. However, the ERA method cannot consider the angular frequency conjugate constraints as synchrophasors are in the complex number field. Therefore, the identification error of subsynchronous oscillation parameters is significant in the actual situation.
During the research process, we conducted an analysis based on fixed models, but in actual situations, these models are often affected by various factors and changes. A longer data window will be more limited to the assumption of fixed models, because as the data window becomes longer, the data within it may exhibit more complexity as time changes. The non-conjugation of angular frequency reduces the accuracy of subsequent parameter identification. Therefore, based on practical applications, it is necessary to shorten the data window. However, it was found in research that the identification accuracy of ERA is greatly reduced after shortening the data window. Therefore, we improved the algorithm to maintain high accuracy even in a shorter data window, which is our fundamental starting point.
This paper improves ERA’s Hankel matrix construction, solving the issue of obtaining angular frequencies without conjugations in the existing ERA. The Hankel matrix is constructed by combining the real and imaginary parts of the synchrophasor, and it can retain all the information of synchrophasors. The accuracy of identifying fundamental wave parameters and subsynchronous and supersynchronous oscillation parameters is significantly improved. At the same time, the improved ERA shortens the data window to 200 ms, which can better mitigate the limitations of assuming the model to be constant and is more conducive to real-time monitoring of the dynamic process of SSO in power systems. Finally, the improved ERA methodology is presented and validated using synthetic, simulated, and measured PMU data. It is then compared with the existing ERA. The ERA can accurately identify the frequency, amplitude, and phase of the fundamental, subsynchronous, and supersynchronous components of a single synchronization signal using a 200 ms data window.
The structure of this article is as follows. In the second part, the synchrophasors model and the extraction of modal parameters are studied. The third section introduces SSO parameter identification based on improved ERA. In section four, the performance of the proposed method is evaluated using synthetic, simulated, and measured PMU data.

2. Synchrophasors Model and Modal Parameter Extraction

2.1. SSO Model with Supersynchronous Component

The power system’s instantaneous signal model, denoted as x ( t ) , is established. This model consists of a fundamental component with a possible frequency deviation, a pair of frequency-coupled subsynchronous components, and supersynchronous components. Formula (1) demonstrates these components.
x ( t ) = x 0 cos ( 2 π f 0 t + ϕ 0 ) + x sub cos ( 2 π f sub + ϕ sub ) + x sup cos ( 2 π f sup + ϕ sub )
The synchrophasor sequence X ˙ ( k ) corresponding to the instantaneous signal x ( t ) can be obtained by DFT of Formula (1), as shown in (2).
X ˙ ( k ) = ( e j k π ) 2 N x ( t ) e j 2 π N n = X ˙ 0 ( k ) + X ˙ sub ( k ) + X ˙ sup ( k ) ,
where X ˙ 0 ( k ) , X ˙ sub ( k ) , and X ˙ sup ( k ) are the fundamental components, subsynchronous components, and supersynchronous components of the synchrophasor, respectively. The subsynchronous component and the supersynchronous component are a pair of coupling components. Their frequencies satisfy the relationship of f sub + f sup = 2 f N , where f N is the nominal frequency.
According to the theory of DFT, each component contains a positive frequency component and a negative frequency component [12,19]. The subsynchronous component and the super-synchronous component are a pair of coupling components, so the oscillatory component ( X ˙ s + ( k ) , X ˙ s ( k ) ) can be used to replace the sum of the subsynchronous component and the supersynchronous component, as shown in (3) and (4).
X ˙ ( k ) = X ˙ 0 + ( k ) + X ˙ 0 ( k ) + X ˙ sub + ( k ) + X ˙ sub ( k ) + X ˙ sup + ( k ) + X ˙ sup ( k ) = X ˙ 0 + ( k ) + X ˙ 0 ( k ) + X ˙ s + ( k ) + X ˙ s ( k ) = X ˙ 0 ( k ) + X ˙ s ( k )
X ˙ 0 + ( k ) = Q * ( f 0 , + 1 ) x 0 e j ϕ 0 e j α k X ˙ 0 ( k ) = Q ( f 0 , 1 ) x 0 e j ϕ 0 e j α k ; X ˙ s + ( k ) = Q * ( f sub , + 1 ) x sub e j ϕ sub e j β k + Q ( f sup , 1 ) x sup e j ϕ sup e j β k X ˙ s ( k ) = Q ( f sub , 1 ) x sub e j ϕ sub e j β k + Q * ( f sup , + 1 ) x sup e j ϕ sup e j β k
where “+, −” denotes positive and negative frequencies and “*” indicates conjugation; besides, “ α ” and “ β ” are the angular frequencies of fundamental and oscillatory components, respectively, and are expressed in the following formula together with Q ( f , l ) :
α = 2 π f N f 0 f s β = 2 π f N f sub f s ; Q ( f , l ) = 1 N n = 0 N 1 e ( j 2 π f f N N + j 2 π N l ) n
where “ N ” is the number of instantaneous data in DFT synchrophasors calculation, and “ f s ” is the synchrophasor data reporting frequency, and f s = 2 f N .
The modal model of the synchrophasor under subsynchronous oscillation is expressed as (6)–(8)
X ˙ ( k ) = m = 1 4 R m e ω m k
R 1 = Q * ( f 0 , + 1 ) x 0 e j ϕ 0 R 2 = Q ( f 0 , 1 ) x 0 e j ϕ 0 R 3 = Q * ( f sub , + 1 ) x sub e j ϕ sub + Q ( f sup , 1 ) x sup e j ϕ sup R 4 = Q ( f sub , 1 ) x sub e j ϕ sub + Q * ( f sup , + 1 ) x sup e j ϕ sup
ω 1 = j α , ω 2 = j α , ω 3 = j β , ω 4 = j β
where “ R 1 , R 2 , R 3 , R 4 ” are four constant parameters, “ ω 1 , ω 2 ” are the positive and negative angular frequencies of the fundamental components, and “ ω 3 , ω 4 ” are the positive and negative angular frequencies of the oscillating components. Note that in (6), only “k” is a variable that represents the characteristics of the angular frequency over time.

2.2. Modal Parameter Extraction Problem

The extraction of frequency, amplitude, and phase for each component of subsynchronous oscillation from a vast amount of synchrophasor data is a typical problem in modal parameter extraction. ERA is a classical method used for this purpose. The ERA uses the Hankel matrix and the system matrix to transform the problem of extracting modal parameters into a matrix decomposition problem. This allows for the direct determination of the angular frequencies ( ω 1 , ω 2 , ω 3 , ω 4 ) and coefficients ( R 1 , R 2 , R 3 , R 4 ) for each component. This approach offers simplicity and computational efficiency.
The central idea of ERA is to use the time continuity of synchrophasor sequence X ˙ ( k ) to construct two Hankel matrices, and the two elements of two Hankel matrices in the same position have the same time difference. Through the relationship between the two Hankel matrices, a system characteristic matrix can be obtained, that is, diag[ e ω 1 , e ω 2 , e ω 3 , e ω 4 ]. Then, (8) is used to obtain coefficients ( α , β ), and (6) is used to obtain coefficients ( R 1 , R 2 , R 3 , R 4 ). Finally, phases ( ϕ 0 , ϕ sub , ϕ sup ) of the fundamental component, the subsynchronous component, and the supersynchronous component can be further obtained based on R m , (5), and (7).

3. Parameter Identification of SSO Based on Improved ERA

3.1. The Process of ERA

Using the synchrophasor sequence X ˙ ( k ) , the Hankel matrices Y and Y are constructed as follows:
Y = X ˙ ( 0 ) X ˙ ( 1 ) X ˙ ( L ) X ˙ ( 1 ) X ˙ ( 2 ) X ˙ ( L + 1 ) X ˙ ( K L 1 ) X ˙ ( K L ) X ˙ ( K 1 ) ; Y = X ˙ ( 1 ) X ˙ ( 2 ) X ˙ ( L + 1 ) X ˙ ( 2 ) X ˙ ( 3 ) X ˙ ( L + 2 ) X ˙ ( K L ) X ˙ ( K L + 1 ) X ˙ ( K )
where K is the number of synchrophasors and the Hankel matrixes are matrices of ( K L ) rows and ( L + 1 ) columns.
The Y matrix can be decomposed in the following form:
Y = Z 1 R Z 2
Z 1 = 1 1 1 1 e ω 1 e ω 2 e ω 3 e ω 4 e ω 1 ( K L 1 ) e ω 2 ( K L 1 ) e ω 3 ( K L 1 ) e ω 4 ( K L 1 ) ; Z 2 = 1 e ω 1 e ω 1 L 1 e ω 2 e ω 2 L 1 e ω 3 e ω 3 L 1 e ω 4 e ω 4 L
R = d i a g ( [ R 1 , R 2 , R 3 , R 4 ] )
Each synchronphasor piece of data in the Y matrix is replaced with the synchronphasor data of the next measurement, and the new matrix is marked Y . Then, the relationship between Y and Y is shown in (13).
Y = Z 1 R Z 2 = Z 1 R Z 0 Z 2
where Z 0 = d i a g [ e w 1 , e w 2 , e w 3 , e w 4 ] . Each row and column in Y is characterized by temporal continuity; the same goes for Y .
Therefore, the values of four angular frequencies can be obtained only by solving the Z 0 matrix. According to Formula (13), the system matrix Z 0 can be solved by the following formula:
Z 0 = R 1 2 Z 1 1 Y Z 2 1 R 1 2
From matrix Z 0 , “ ω 1 , ω 2 , ω 3 , ω 4 ” can be obtained, and R m can be further calculated based on ω m and (6).

3.2. Defects of Existing ERA

The existing ERA directly constructs the Hankel matrix based on the synchrophasor in the complex number field and then constructs the complex number field system matrix. By solving the eigenvalues of the system matrix, we can obtain ω 1 , ω 2 , ω 3 , ω 4 , and R 1 , R 2 , R 3 , R 4 are solved by the least square method. This method can be solved accurately under ideal conditions.
However, in practical applications, when directly solving the eigenvalues of the system matrix Z 0 , the obtained ω 1 and ω 2 do not satisfy the conjugate relations of j α and j α . ω 3 and ω 4 also do not satisfy the conjugate relation of j β and j β . Thus, it is impossible to solve α and β accurately. As a result, the parameter identification error of each component is significant.
The complex number field matrix constructed by ERA makes it challenging to guarantee pairwise conjugates of the four eigenvalues obtained by directly solving the system matrix. If the Hankel matrix can be constructed in the real number domain, the angular frequency conjugate constraint problem can be solved in theory.

3.3. The Idea of Improved ERA

The basic idea of the improved ERA is to construct the real number domain Hankel matrix, construct the system matrix based on the real number domain Hankel matrix, and solve the eigenvalues of the system matrix. The eigenvalues obtained in this way can satisfy the angular frequency conjugate constraints of the positive and negative spectrums of the fundamental component and the positive and negative spectrums of the oscillatory component. That is, e ω 1 and e ω 2 satisfy the conjugate relations of e j α and e j α ; e ω 3 and e ω 4 also satisfy the conjugate relation of e j β and e j β . This solves the problem of the existing ERA directly calculating the eigenvalues of the complex number field system matrix, which leads to a large error. With the solution of this problem, the improved ERA can still maintain high identification accuracy under the ultra-short data window of 200 ms, which overcomes the limitation of the fixed hypothetical model to some extent.
Next, this section introduces the construction of the Hankel matrix in the real number field and the solution of modal parameters.

3.3.1. Construction of Real Number Field Hankel Matrix

Part 1: We use the complex number field Hankel matrices Y and Y in Section 3.1 to construct two real number field Hankel matrices H and H by extracting the real and imaginary parts of each element in the matrix. The detailed process of constructing the real-valued Hankel matrix is as follows. First, we express the real part matrix and the imaginary part matrix of the synchronized phasor sequence, as shown in Formulas (15) and (16), respectively. By observing these two matrices, we can see that each element in the matrices is a real number, and the real part matrix and the imaginary part matrix are the basis for constructing the real-valued Hankel matrix.
Re ( 2 Y ) = 2 Re [ X ˙ ( 0 ) ] 2 Re [ X ˙ ( 1 ) ] 2 Re [ X ˙ ( L ) ] 2 Re [ X ˙ ( 1 ) ] 2 Re [ X ˙ ( 2 ) ] 2 Re [ X ˙ ( L + 1 ) ] 2 Re [ X ˙ ( K L 1 ) ] 2 Re [ X ˙ ( K L ) ] 2 Re [ X ˙ ( K 1 ) ]
Im ( 2 Y ) = 2 Im [ X ˙ ( 0 ) ] 2 Im [ X ˙ ( 1 ) ] 2 Im [ X ˙ ( L ) ] 2 Im [ X ˙ ( 1 ) ] 2 Im [ X ˙ ( 2 ) ] 2 Im [ X ˙ ( L + 1 ) ] 2 Im [ X ˙ ( K L 1 ) ] 2 Im [ X ˙ ( K L ) ] 2 Im [ X ˙ ( L 1 ) ]
where Re represents the real part and Im represents the imaginary part.
Second, the Hankel matrix constructed in the improved ERA method is a real-valued matrix, which is obtained by directly concatenating the real part matrix and the imaginary part matrix. This process is quite simple. Therefore, the real-valued Hankel matrix in the improved ERA can be expressed in the following formula:
H = 2 Re [ X ˙ ( 0 ) ] 2 Re [ X ˙ ( 1 ) ] 2 Re [ X ˙ ( L ) ] 2 Re [ X ˙ ( 1 ) ] 2 Re [ X ˙ ( 2 ) ] 2 Re [ X ˙ ( L + 1 ) ] 2 Re [ X ˙ ( K L 1 ) ] 2 Re [ X ˙ ( K L ) ] 2 Re [ X ˙ ( K 1 ) ] 2 Im [ X ˙ ( 0 ) ] 2 Im [ X ˙ ( 1 ) ] 2 Im [ X ˙ ( L ) ] 2 Im [ X ˙ ( 1 ) ] 2 Im [ X ˙ ( 2 ) ] 2 Im [ X ˙ ( L + 1 ) ] 2 Im [ X ˙ ( K L 1 ) ] 2 Im [ X ˙ ( K L ) ] 2 Im [ X ˙ ( K 1 ) ] = Re ( 2 Y ) Im ( 2 Y )
Similarly, the expression for another real-valued shifted Hankel matrix can be represented by Formula (18).
H = Re ( 2 Y ) Im ( 2 Y )
where H and H are matrices with 2 ( K L ) rows and ( L + 1 ) columns.
On the whole, the real number field matrix is composed of the real part matrix and the imaginary part matrix of the complex number field Hankel matrix. Compared to using only the real part matrix or the imaginary part matrix, its advantage is that all the information of the synchrophasor sequence can be fully retained, and matrices H and H are very easy to obtain. Why the real part matrix and the imaginary part matrix can be spliced to construct a new real number field Hankel matrix is the focus of the following sections.
Part 2: We prove why the real part matrix and the imaginary part matrix can be spliced to obtain the real number field Hankel matrix, which is the core of this article. The real part matrix and the imaginary part matrix are composed of the real part and the imaginary part of the synchronous phasor sequence, respectively. Therefore, it is necessary to analyze the composition of the real and imaginary parts of the synchronous phasor. The analysis process is as follows.
The real and imaginary parts of fundamental and oscillatory components can be expressed using (3), (4), and (7), and their expressions are as follows:
2 Re [ X ˙ 0 ( k ) ] = [ X ˙ 0 ( k ) + X ˙ 0 * ( k ) ] = [ ( R 1 + R 2 * ) e j α k + ( R 2 + R 1 * ) e j α k ]
2 Im [ X ˙ 0 ( k ) ] = [ X ˙ 0 ( k ) X ˙ 0 * ( k ) ] = [ ( R 1 R 2 * ) e j α k + ( R 2 R 1 * ) e j α k ]
2 Re [ X ˙ s ( k ) ] = [ X ˙ s ( k ) + X ˙ s * ( k ) ] = [ ( R 3 + R 4 * ) e j β k + ( R 4 + R 3 * ) e j β k ]
2 Im [ X ˙ s ( k ) ] = [ X ˙ s ( k ) X ˙ s * ( k ) ] = [ ( R 3 R 4 * ) e j β k + ( R 4 R 3 * ) e j β k ]
The above formula is simplified as follows: we let
R 0 + ( r ) = R 1 + R 2 * , R 0 ( r ) = R 2 + R 1 * R 0 + ( i ) = R 1 R 2 * , R 0 ( i ) = R 2 R 1 * R s + ( r ) = R 3 + R 4 * , R s ( r ) = R 4 + R 3 * R s + ( i ) = R 3 R 4 * , R s ( i ) = R 4 R 3 *
Then, according to (23), we can find
R 0 + ( r ) = R 0 ( r ) * , R 0 + ( i ) = R 0 ( i ) * R s + ( r ) = R s ( r ) * , R s + ( i ) = R s ( i ) *
Therefore, combining Formulas (3) and (19)–(24), the real part and the imaginary part of the synchrophasor can be expressed as follows:
2 Re [ X ˙ ( k ) ] = 2 Re [ X ˙ 0 ( k ) ] + 2 Re [ X ˙ s ( k ) ] = ( R 0 + ( r ) e j α k + R 0 + ( r ) * e j α k + R s + ( r ) e j β k + R s + ( r ) * e j β k )
2 Im [ X ˙ ( k ) ] = 2 Im [ X ˙ 0 ( k ) ] + 2 Im [ X ˙ s ( k ) ] = ( R 0 + ( i ) e j α k + R 0 + ( i ) * e j α k + R s + ( i ) e j β k + R s + ( i ) * e j β k )
Through (6), (25), and (26), we can determine that both the real part and the imaginary part of the synchrophasor sequence contain four modes. That is four modes with angular frequencies ± j α and ± j β , which are consistent with the complex synchrophasor sequence modes.
The difference between the real and imaginary parts of a synchronized phasor after being split and the complete synchronized phasor lies only in the different constant parameters preceding the complex exponential, while the modal patterns remain the same. Therefore, the real part matrix and the imaginary part matrix can be spliced to construct a new real number field Hankel matrix.
Part 3: the real number field Hankel matrix H is decomposed by singular value decomposition, imitating “ Y = Z 1 R Z 2 ” and written in the form of “ H = U R V ”. The specific process is as follows.
The coefficients of the positive and negative components of fundamental components of Re [ X ˙ ( k ) ] and Im [ X ˙ ( k ) ] are not equal, but the coefficients of X ˙ ( k ) can be expressed in a particular proportion. Therefore, we let
γ 1 ( r ) R 1 = R 0 + ( r ) , γ 2 ( r ) R 2 = R 0 + ( r ) * γ 1 ( i ) R 1 = R 0 + ( i ) , γ 2 ( i ) R 2 = R 0 + ( i ) *
where γ n ( r ) , γ n ( i ) ( n = 1 , 2 ) are four constants. Using Formulas (7), (23) and (27), the numerical details can be obtained by calculation as follows:
γ 1 ( r ) = R 0 + ( r ) R 1 = R 1 + R 2 * R 1 = Q * ( f 0 , + 1 ) + Q * ( f 0 , 1 ) Q * ( f 0 , + 1 )
Similarly, the expressions of γ 2 ( r ) , γ 1 ( i ) and γ 2 ( i ) are shown in (29).
γ 2 ( r ) = Q ( f 0 , + 1 ) + Q ( f 0 , 1 ) Q ( f 0 , 1 ) γ 1 ( i ) = Q * ( f 0 , + 1 ) Q * ( f 0 , 1 ) Q * ( f 0 , + 1 ) γ 2 ( i ) = Q ( f 0 , 1 ) Q ( f 0 , + 1 ) Q ( f 0 , 1 )
The coefficients of the positive and negative components of the oscillation components of Re [ X ˙ ( k ) ] and Im [ X ˙ ( k ) ] are also not equal. They are also proportional to the coefficient of X ˙ ( k ) , as shown in (30).
γ 3 ( r ) R 3 = R s + ( r ) , γ 4 ( r ) R 4 = R s + ( r ) * γ 3 ( i ) R 3 = R s + ( i ) , γ 4 ( i ) R 4 = R s + ( i ) *
where γ n ( r ) , γ n ( i ) ( n = 3 , 4 ) are four constants. Using Formulas (7), (23), and (30), the numerical details can be obtained by calculation as follows and the detailed derivation process is in Appendix A.
γ 3 ( r ) = R s + ( r ) R 3 = R 3 + R 4 * R 3 = [ Q * ( f sub , + 1 ) + Q * ( f sub , 1 ) ] x sub e j ϕ sub + [ Q ( f sup , 1 ) + Q ( f sup , + 1 ) ] x sup e j ϕ sup Q * ( f sub , + 1 ) x sub e j ϕ sub + Q ( f sup , 1 ) x sup e j ϕ sup
Similarly, the expressions of γ 4 ( r ) , γ 3 ( i ) and γ 4 ( i ) are shown in (32). Besides, the detailed derivation process is in Appendix A.
γ 4 ( r ) = [ Q ( f sub , + 1 ) + Q ( f sub , 1 ) ] x sub e j ϕ sub + [ Q * ( f sup , 1 ) + Q * ( f sup , + 1 ) ] x sup e j ϕ sup Q ( f sub , 1 ) x sub e j ϕ sub + Q * ( f sup , + 1 ) x sup e j ϕ sup γ 3 ( i ) = [ Q * ( f sub , + 1 ) Q * ( f sub , 1 ) ] x sub e j ϕ sub + [ Q ( f sup , 1 ) Q ( f sup , + 1 ) ] x sup e j ϕ sup Q * ( f sub , + 1 ) x sub e j ϕ sub + Q ( f sup , 1 ) x sup e j ϕ sup γ 4 ( i ) = [ Q ( f sub , + 1 ) Q ( f sub , 1 ) ] x sub e j ϕ sub + [ Q * ( f sup , 1 ) Q * ( f sup , + 1 ) ] x sup e j ϕ sup Q ( f sub , 1 ) x sub e j ϕ sub + Q * ( f sup , + 1 ) x sup e j ϕ sup
and then we can obtain the expression of the real number field Hankel matrix H .
Y = γ 1 ( r ) 1 e ω 1 e ω 1 ( K L 1 ) γ 2 ( r ) 1 e ω 2 e ω 2 ( K L 1 ) γ 3 ( r ) 1 e ω 3 e ω 3 ( K L 1 ) γ 4 ( r ) 1 e ω 4 e ω 4 ( K L 1 ) γ 1 ( i ) 1 e ω 1 e ω 1 ( K L 1 ) γ 2 ( i ) 1 e ω 2 e ω 2 ( K L 1 ) γ 3 ( i ) 1 e ω 3 e ω 3 ( K L 1 ) γ 4 ( i ) 1 e ω 4 e ω 4 ( K L 1 ) U R 1 e ω 1 e ω 1 L 1 e ω 2 e ω 2 L 1 e ω 3 e ω 3 L 1 e ω 4 e ω 4 L V
where R = d i a g [ R 1 , R 2 , R 3 , R 4 ] , matrix U is a matrix with 2 ( K L ) rows and four columns, and matrix V is a matrix with four rows and ( L + 1 ) columns.
According to the four Formulas, (10), (13), (15) and (33), we can determine that the expression of the Hankel matrix H is as follows:
H = U R V = U R A V
where A = d i a g [ e ω 1 , e ω 2 , e ω 3 , e ω 4 ] is the system matrix.
So far, we have constructed the Hankel matrix of the real number field. In fact, although it is proved that it is a difficult process to concatenate the real part matrix and the imaginary part matrix, the constructed real field matrix is easy to obtain. This further illustrates the feasibility of this method.

3.3.2. Solution of Modal Parameters

In the beginning, we need to solve the system matrix A to obtain the angular frequencies of various components. Using (34), the equation for solving A is shown in (35).
A = R 1 2 U 1 H V 1 R 1 2
After we obtain the matrix of system A = d i a g [ e ω 1 , e ω 2 , e ω 3 , e ω 4 ] , we can obtain ω 1 , ω 2 , ω 3 , ω 4 . The obtained ω 1 and ω 2 satisfy the conjugate relation of j α and j α ; ω 3 and ω 4 also satisfy the conjugate relation of j β and j β , so angular frequency α of the fundamental component and angular frequency β of the oscillating component can be accurately solved.
Now that ω 1 , ω 2 , ω 3 , and ω 4 are known, α and β can be obtained through Formula (8). The detailed process of solving the frequency, amplitude, and phase of each component is as follows:
First, four constants R 1 , R 2 , R 3 , and R 4 are solved according to (36).
1 1 1 1 e j α e j α e j β e j β e j α ( K 1 ) e j α ( K 1 ) e j β ( K 1 ) e j β ( K 1 ) R 1 R 2 R 3 R 4 = X ˙ ( 0 ) X ˙ ( 1 ) X ˙ ( K 1 )
Second, according to Formulas (4) and (7), the angular frequency of the fundamental component, the angular frequency of the oscillating component, and the four constant parameters in the modal model, the calculated values of fundamental positive frequency component X ˙ 0 + ( k ) , fundamental negative frequency component X ˙ 0 ( k ) , oscillatory positive frequency component X ˙ s + ( k ) , and oscillatory negative frequency component X ˙ s ( k ) are determined as in (37).
X ˙ 0 + ( k ) = R 1 e j α , X ˙ 0 ( k ) = R 2 e j α X ˙ s + ( k ) = R 3 e j β , X ˙ s ( k ) = R 4 e j β
Then, combined with Formulas (4) and (5), the frequency, amplitude, and phase of the fundamental component are determined as shown in (38).
f 0 = f N α 2 π f s , | | X ˙ 0 + ( k ) | | 2 < | | X ˙ 0 ( k ) | | 2 f N + α 2 π f s , | | X ˙ 0 + ( k ) | | 2 > | | X ˙ 0 ( k ) | | 2 ; Q ( f 0 , 1 ) x 0 e j ϕ 0 = X ˙ 0 ( k ) , | | X ˙ 0 + ( k ) | | 2 < | | X ˙ 0 ( k ) | | 2 Q * ( f 0 , + 1 ) x 0 e j ϕ 0 = X ˙ 0 + ( k ) , | | X ˙ 0 + ( k ) | | 2 | | X ˙ 0 ( k ) | | 2
Finally, combined with Formulas (4) and (5) and f sub + f sup = 2 f N , the frequency, amplitude, and phase of the subsynchronous component and the frequency, amplitude, and phase of the supersynchronous component are determined according to the method of (39).
f sub = f N β f s 2 π f sup = 2 f N f sub Q * ( f sub , + 1 ) Q ( f sup , 1 ) Q * ( f sub , 1 ) Q ( f sup , + 1 ) x sub e j ϕ sub x sup e j ϕ sup = X ˙ s + ( k ) X ˙ s * ( k )
So far, the frequency, amplitude, and phase of the fundamental component, subsynchronous component, and supersynchronous component of the synchrophasor have been obtained. The modal parameters of the synchrophasor are finished.
The conclusion is that this algorithm has two outstanding advantages. On the one hand, by constructing the real-domain Hankel matrix, the problem of the angular frequency obtained by the existing ERA directly calculating the eigenvalues of the complex number field system matrix not satisfying the ± j α and ± j β conjugate constraints is solved. On the other hand, the Hankel matrix is constructed by combining the real part and the imaginary part of the synchrophasor, which can completely retain the information of the synchrophasor and effectively improve the identification accuracy of fundamental parameters, subsynchronous oscillation parameters, and supersynchronous oscillation parameters.

4. Verification

To verify the correctness, feasibility, and practicality of the proposed power grid subsynchronous oscillation parameter identification method based on the eigensystem realization algorithm, the algorithm was validated using both synthetic and actual measured PMU data in MATLAB R2021a software.
The decision to use synthetic PMU data as the testing foundation was primarily based on practical considerations. While simulation scenarios and actual measured PMU data are of great value for power system dynamic analysis, they often cannot comprehensively cover all possible frequency ranges and oscillation characteristics. The operating states and fault conditions of actual power grids are complex and variable, making it difficult to guarantee that all types of subsynchronous oscillation data can be captured in real-world environments. To thoroughly test the performance and reliability of the algorithm, we need a dataset that allows for us to control the characteristics of the input data. Therefore, we chose synthetic oscillation data which can precisely set oscillation parameters according to needs, simulating various complex subsynchronous oscillation scenarios. By using these synthetic data, we can more systematically evaluate the performance of the algorithm under different conditions, ensuring its correctness and effectiveness in practical applications.
The choice to use actual measured PMU data is because they directly reflect the dynamic characteristics and oscillation features of the power system in actual operation. By applying these data to the algorithm presented in this paper, we can more accurately assess the feasibility of the algorithm in real-world scenarios. Additionally, using actual measured PMU data also helps us gain a deeper understanding of the power system’s dynamic characteristics. Through the analysis of real data, we can discover phenomena that are difficult to observe in simulations or models, thus gaining a better understanding of the operation patterns and potential risks of the power system.

4.1. Verification I: Synthetic PMU Data

The synthetic PMU data is modelled as (1), and the fundamental frequency f 0 is set as [49 49.5 49.7 50 50.5 51 51.5] Hz. Other parameters of fundamental, subsynchronous, and supersynchronous components are set as ( x 0 , ϕ 0 ) = (100, π / 3 ), ( f sub , x sub , ϕ sub ) = ( 20 , 20 , π / 2 ), and ( f sup , x sup , ϕ sup ) = ( 80 , 30 , π / 4 ), respectively.
In the process of verification, the sampling frequency of instantaneous data is 2.0 kHz. First, the sampled instantaneous data are operated by DFT, and the synthetic PMU data are obtained. The frequency of reporting PMU data is 100 Hz. In the SSO parameter identification of ERA, a data window of 200 ms, that is, the Hankel matrix composed of 21 synchrophasor data, is selected.
Previous research [12] indicated that identification accuracy is most affected by f 0 and f sub . Therefore, by using the method of controlling variables, the SSO parameters of the synthesized PMU data are identified by changing f sub in the range of [5, 45] Hz and x sub in the range of [5, 100]. At the same time, to evaluate the accuracy of the improved algorithm in identifying parameters under the influence of noise, zero-mean white noise is added to the instantaneous signal (1). According to literature [11], the measured signal-to-noise ratio (SNR) of the PMU is usually around 45 dB, so 40 dB is selected as the noise condition for the simulation experiment.
The performance of the improved ERA (referred to as “IERA”) is compared with that of the existing ERA. The test results are listed in Table 1, and the results are analyzed as follows below.

4.1.1. Relative Errors under Ideal Conditions

It can be seen from Table 1 that, under ideal conditions, the relative error of SSO parameters obtained by improved ERA is between 10 13 % and 10 11 % , close to the identification result of the existing ERA with a data window of 1 s. The relative error of SSO parameters obtained by ERA is between 10 12 % and 10 8 % . The relative error of parameter f sub obtained by the two methods is not large. Compared with the ERA, the accuracy of the improved ERA method is higher for the relative error of other parameters.

4.1.2. Relative Errors under Noise Conditions

Under the noise condition of 40 dB SNR, the existing ERA method with 200 ms and 1 s data windows has an identification error of x 0 around 5%, which is mainly because the conjugate relationship between angular frequency ω 1 and ω 2 satisfying α and α is not considered, resulting in a large identification error for the fundamental wave parameters. The improved ERA can control the identification error below 3.5%. However, the identification error of the existing ERA with 200 ms data windows is basically 5% to 10%, and even the identification error of x sub is more than 12%. Therefore, it can be proven that compared with ERA, the IERA is more accurate in identifying the component parameters of SSO.
Consequently, under noise, frequency-varying and amplitude-varying conditions, the accuracy of IERA in identifying the parameters of SSO is higher than that of ERA.
Due to the improved ERA method splitting the real and imaginary parts of the synchronized phasors, the constructed real-domain Hankel matrix has a higher number of rows than the existing ERA Hankel matrix. Therefore, to eliminate the limitation of identification speed on the practical application value of this algorithm, the average single identification time of three algorithms with data windows of 1 s, 200 ms, and 200 ms, namely “ERA 1 s”, “ERA 200 ms”, and “IERA 200 ms”, is estimated by repeated identification of 20,000 times under ideal and noise conditions. The computer processor used is a 13th Gen Intel(R) Core(TM)i7-13620H. The identification times of the three algorithms are shown in Table 2. The identification times of the three algorithms are analyzed and compared as follows below.
From Table 2, it can be seen that the calculation time of the improved ERA is close to or even slightly smaller than that of the existing ERA 200 ms, and it is shorter than that of the existing ERA of 1 s. Therefore, the algorithm in this paper does not increase the parameter identification time due to the separation of the real and imaginary parts of the synchrophasors, which further demonstrates the feasibility and practicality of the algorithm in this paper.

4.2. Verification II: Simulated PMU Data and Actual Measured PMU Data

To further verify the effectiveness of the improved ERA, the simulated PMU data and the actual measured PMU data are analyzed. The simulation PMU data are generated based on Formula (1). The actual measured PMU data are from [12], which are recorded in an SSO event in the North China Power Grid. The current instantaneous data and amplitudes of synchrophasors of actual measured PMU data are shown in Figure 1. As shown in Figure 1, a 10 s data window is selected as the simulation object for the actual measured PMU data, and the SSO is changing rapidly.
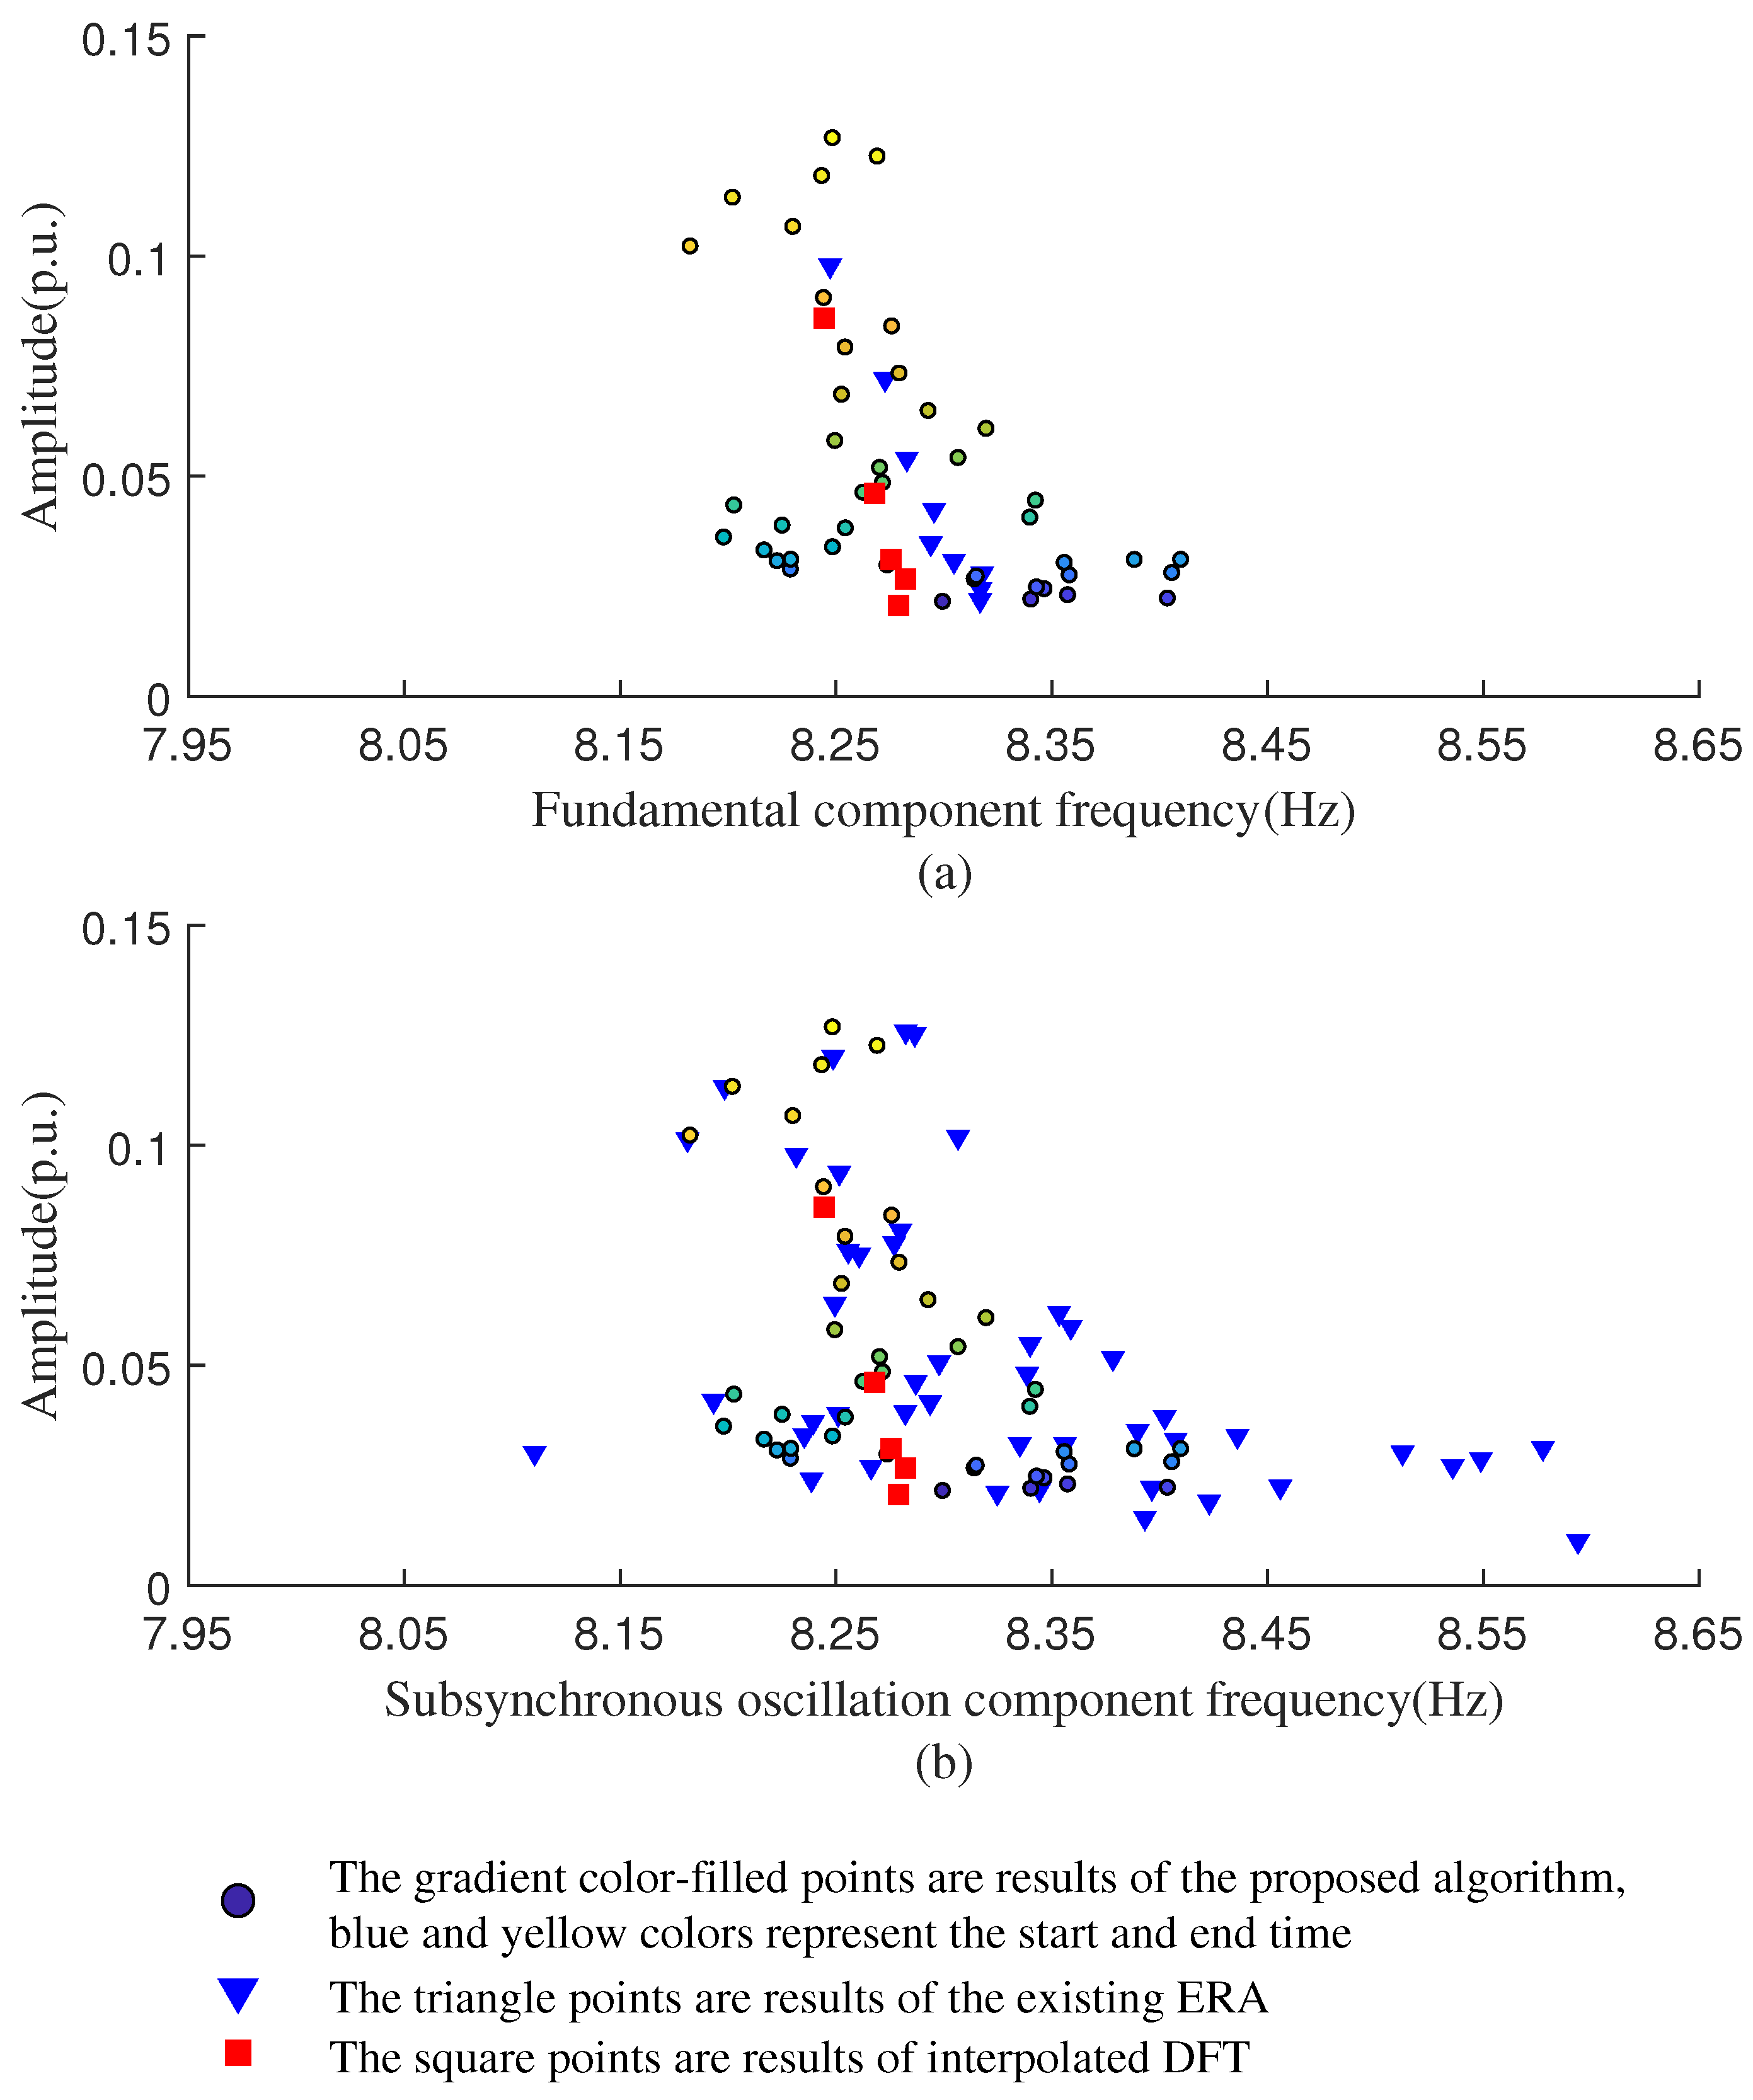
In this paper, the data window of the improved ERA is 200 ms. In addition, the existing ERA is used for comparison, and the lengths of the data window are 1 s and 200 ms, respectively, and there is the interpolation DFT algorithm with a data window length of 2 s for reference and comparison. Since there is little difference in the identification results of the fundamental components obtained by the three methods, only the identification results of the oscillatory components are introduced in detail. In addition, the subsynchronous component and the supersynchronous component are a pair of coupling components, and the identification result of the supersynchronous component is similar to that of the subsynchronous component, so the identification result of the subsynchronous component is analyzed as shown in Figure 2.

4.2.1. Data Window of Existing ERA: 1 s

Figure (a) of Figure 2 shows the identification results of subsynchronous oscillation components of the three methods when the length of the data window selected by the existing ERA is 1 s. It can be seen from the figure that there is little difference in the identification results of the three methods. However, the data window lengths of existing ERA and interpolation DFT are 1 s and 2 s, respectively. Theoretically, the longer the data window, the more information can be extracted, and the more accurate the identification result, the worse the real-time performance. The improved ERA only needs the data window of 200 ms to obtain the identification results with little difference in accuracy, but at the same time, the improved 200 ms ultrashort data window of ERA realizes the dynamic monitoring of power system SSO.

4.2.2. Data Window of Existing ERA: 200 ms

Figure (b) of Figure 2 shows the identification results of subsynchronous oscillation components of the three methods when the length of the data window selected by the existing ERA is 200 ms. It can be seen from the figure that the f sub identification results of the subsynchronous oscillation components of the existing ERA are quite different from those of the interpolated DFT and the improved ERA in the 200 ms data window. The f sub identification results of the improved ERA are concentrated between 8.18 Hz and 8.40 Hz, while among the existing ERA f sub identification results, the smallest is 8.11 Hz, and the largest is even close to 8.60 Hz. It can be seen from the figure that the f sub identification result of the existing ERA exceeds that of the 8.50 Hz by five times, which seriously deviates from the identification result of the interpolated DFT. There is little difference in x sub identification results of the three methods. Moreover, the data window of 200 ms is 10 times shorter than that of 2 s, so the improved ERA can also reflect the real-time characteristics of SSO.

5. Conclusions

Based on the advantages of a simple solution, a small amount of calculation and anti-noise of ERA, an improved SSO parameter identification method based on ERA is proposed, and the dynamic real-time monitoring of SSO is realized. The existing ERA does not consider the angular frequency conjugate constraints of two fundamental components and two oscillatory components, but the improved ERA solves this problem and makes the results of parameter identification more accurate. At the same time, the Hankel matrix needed by the improved ERA can be easily obtained, and only the real part matrix and the imaginary part matrix of the synchrophasor need to be spliced. The improved method based on PMU is verified by the synthesis of ERA and the actual measurement data. Compared with the existing ERA, the improved ERA can identify parameters more accurately under the data window of 200 ms, and the ultra-short data window of 200 ms also realizes the dynamic monitoring of power system SSO.
In addition, there is also a certain limitation in improving ERA. This limitation is a common challenge faced by all identification methods, which is the limited ability to process signals that are too divergent. This will be a key area for improvement in future research work. However, the algorithm proposed in this article minimizes the impact of signal divergence on parameter identification results by shortening the data window. The improved ERA selects a 200 ms data window, which can effectively solve the most rapidly changing oscillation problems in practical applications.

Author Contributions

Conceptualization, X.Z., G.C., Y.L., F.Z. and H.S.; methodology, X.Z., G.C., Y.L., F.Z. and H.S.; software, X.Z. and G.C.; validation, Y.L. and F.Z.; data curation, X.Z. and G.C.; formal analysis, Y.L. and F.Z.; investigation, H.S.; writing—original draft preparation, X.Z. and Y.L.; writing—review and editing, X.Z., G.C. and Y.L.; visualization, X.Z.; supervision, F.Z.; project administration, X.Z.; funding acquisition, X.Z. All authors have read and agreed to the published version of the manuscript.

Funding

This research was funded by the Science and Technology Project of the State Grid Corporation of China, grant number [521997230001], and The APC was funded by [521997230001].

Data Availability Statement

The original contributions presented in the study are included in the article, further inquiries can be directed to the corresponding authors.

Conflicts of Interest

The authors declare no conflicts of interest.

Appendix A

Detailed derivation of Formula (31):
γ 3 ( r ) = R s + ( r ) R 3 = R 3 + R 4 * R 3 = Q * ( f sub , + 1 ) x sub e j ϕ sub + Q ( f sup , 1 ) x sup e j ϕ sup + Q * ( f sub , 1 ) x sub e j ϕ sub + Q ( f sup , + 1 ) x sup e j ϕ sup Q * ( f sub , + 1 ) x sub e j ϕ sub + Q ( f sup , 1 ) x sup e j ϕ sup = [ Q * ( f sub , + 1 ) + Q * ( f sub , 1 ) ] x sub e j ϕ sub + [ Q ( f sup , 1 ) + Q ( f sup , + 1 ) ] x sup e j ϕ sup Q * ( f sub , + 1 ) x sub e j ϕ sub + Q ( f sup , 1 ) x sup e j ϕ sup
Detailed derivation of Formula (32):
γ 4 ( r ) = R s + ( r ) * R 4 = R 3 * + R 4 R 4 = Q ( f sub , + 1 ) x sub e j ϕ sub + Q * ( f sup , 1 ) x sup e j ϕ sup + Q ( f sub , 1 ) x sub e j ϕ sub + Q * ( f sup , + 1 ) x sup e j ϕ sup Q ( f sub , 1 ) x sub e j ϕ sub + Q * ( f sup , + 1 ) x sup e j ϕ sup = [ Q ( f sub , + 1 ) + Q ( f sub , 1 ) ] x sub e j ϕ sub + [ Q * ( f sup , 1 ) + Q * ( f sup , + 1 ) ] x sup e j ϕ sup Q ( f sub , 1 ) x sub e j ϕ sub + Q * ( f sup , + 1 ) x sup e j ϕ sup
γ 3 ( i ) = R s + ( i ) R 3 = R 3 R 4 * R 3 = Q * ( f sub , + 1 ) x sub e j ϕ sub + Q ( f sup , 1 ) x sup e j ϕ sup Q * ( f sub , 1 ) x sub e j ϕ sub Q ( f sup , + 1 ) x sup e j ϕ sup Q * ( f sub , + 1 ) x sub e j ϕ sub + Q ( f sup , 1 ) x sup e j ϕ sup = [ Q * ( f sub , + 1 ) Q * ( f sub , 1 ) ] x sub e j ϕ sub + [ Q ( f sup , 1 ) Q ( f sup , + 1 ) ] x sup e j ϕ sup Q * ( f sub , + 1 ) x sub e j ϕ sub + Q ( f sup , 1 ) x sup e j ϕ sup
γ 4 ( i ) = R s + ( i ) * R 4 = R 3 * R 4 R 4 = Q ( f sub , + 1 ) x sub e j ϕ sub + Q * ( f sup , 1 ) x sup e j ϕ sup Q ( f sub , 1 ) x sub e j ϕ sub Q * ( f sup , + 1 ) x sup e j ϕ sup Q ( f sub , 1 ) x sub e j ϕ sub + Q * ( f sup , + 1 ) x sup e j ϕ sup = [ Q ( f sub , + 1 ) Q ( f sub , 1 ) ] x sub e j ϕ sub + [ Q * ( f sup , 1 ) Q * ( f sup , + 1 ) ] x sup e j ϕ sup Q ( f sub , 1 ) x sub e j ϕ sub + Q * ( f sup , + 1 ) x sup e j ϕ sup

References

  1. Bi, T.; Kong, Y.; Xiao, S.; Zhang, P.; Zhang, T.; Liu, Q. Review of sub-sychronous oscillation with large-scale wind power transmission. J. Electr. Power Sci. Technol. 2012, 27, 10–15. [Google Scholar]
  2. Wang, B.; Lu, J.; Gong, J.; Hu, M. A method to suppress sub-synchronous oscillation of wind farm composed of doubly fed induction generators with additional rotor side control. Power Syst. Technol. 2013, 37, 2580–2584. [Google Scholar] [CrossRef]
  3. Li, R.; Lu, Y.; Liu, H.; Han, B. Mechanism analysis on subsynchronous oscillation caused by grid-integration of doubly fed wind power generation system via series compensation. Power Syst. Technol. 2013, 37, 3073–3079. [Google Scholar] [CrossRef]
  4. Wang, L.; Xie, X.; Jiang, Q.; Liu, H.; Li, Y.; Liu, H. Investigation of SSR in Practical DFIG-Based Wind Farms Connected to a Series-Compensated Power System. IEEE Trans. Power Syst. 2015, 30, 2772–2779. [Google Scholar] [CrossRef]
  5. Chen, L.; Wu, S.; Yu, W.; Liu, Z.; Han, Z. A sub/supersynchronous oscillation suppression method for a DFIG-connected grid based on additional damping control on the rotor side converter. Power Syst. Prot. Control 2021, 49, 558–569. [Google Scholar] [CrossRef]
  6. Khalilinia, H.; Venkatasubramanian, V. Subsynchronous Resonance Monitoring Using Ambient High Speed Sensor Data. IEEE Trans. Power Syst. 2016, 31, 1073–1083. [Google Scholar] [CrossRef]
  7. Netto, M.; Mili, L. A Robust Prony Method for Power System Electromechanical Modes Identification. In Proceedings of the 2017 IEEE Power & Energy Society General Meeting, Chicago, IL, USA, 16–20 July 2017. [Google Scholar]
  8. Khazaei, J.; Fan, L.; Jiang, W.; Manjure, D. Distributed Prony analysis for real-world PMU data. Electr. Power Syst. Res. 2016, 133, 113–120. [Google Scholar] [CrossRef]
  9. Trudnowski, D.; Johnson, J.; Hauer, J. Making Prony analysis more accurate using multiple signals. IEEE Trans. Power Syst. 1999, 14, 226–231. [Google Scholar] [CrossRef]
  10. Zhang, F.; Cheng, L.; Gao, W.; Huang, R. Synchrophasors-Based Identification for Subsynchronous Oscillations in Power Systems. IEEE Trans. Smart Grid 2019, 10, 2224–2233. [Google Scholar] [CrossRef]
  11. Yang, X.; Zhang, J.; Xie, X.; Xiao, X.; Gao, B.; Wang, Y. Interpolated DFT-Based Identification of Sub-Synchronous Oscillation Parameters Using Synchrophasor Data. IEEE Trans. Smart Grid 2020, 11, 2662–2675. [Google Scholar] [CrossRef]
  12. Zhang, F.; Li, J.; Liu, J.; Gao, W.; He, J. An Improved Interpolated DFT-Based Parameter Identification for Sub-/Super-Synchronous Oscillations With Synchrophasors. IEEE Trans. Power Syst. 2023, 38, 1714–1727. [Google Scholar] [CrossRef]
  13. Ma, Y.; Cai, D.; Huang, Q. Parameter identification of wind power sub-synchronous oscillation based on Rife-Vincent window and synchrophasor data. Proc. CSEE 2021, 41, 790–802. [Google Scholar] [CrossRef]
  14. Almunif, A.; Fan, L.; Miao, Z. A tutorial on data-driven eigenvalue identification: Prony analysis, matrix pencil, and eigensystem realization algorithm. Int. Trans. Electr. Energy Syst. 2020, 30, e12283. [Google Scholar] [CrossRef]
  15. Crow, M.; Singh, A. The matrix pencil for power system modal extraction. IEEE Trans. Power Syst. 2005, 20, 501–502. [Google Scholar] [CrossRef]
  16. Hua, Y.; Sarkar, T. Matrix pencil method for estimating parameters of exponentially damped/undamped sinusoids in noise. IEEE Trans. Acoust. Speech Signal Process. 1990, 38, 814–824. [Google Scholar] [CrossRef]
  17. Sarkar, T.; Pereira, O. Using the matrix pencil method to estimate the parameters of a sum of complex exponentials. IEEE Antennas Propag. Mag. 1995, 37, 48–55. [Google Scholar] [CrossRef]
  18. Juang, J.N.; Pappa, R.S. An eigensystem realization algorithm for modal parameter identification and model reduction. J. Guid. Control Dyn. 1985, 8, 620–627. [Google Scholar] [CrossRef]
  19. Wang, Y.; Jiang, X.; Xie, X.; Yang, X.; Xiao, X. Identifying Sources of Subsynchronous Resonance Using Wide-Area Phasor Measurements. IEEE Trans. Power Deliv. 2021, 36, 3242–3254. [Google Scholar] [CrossRef]
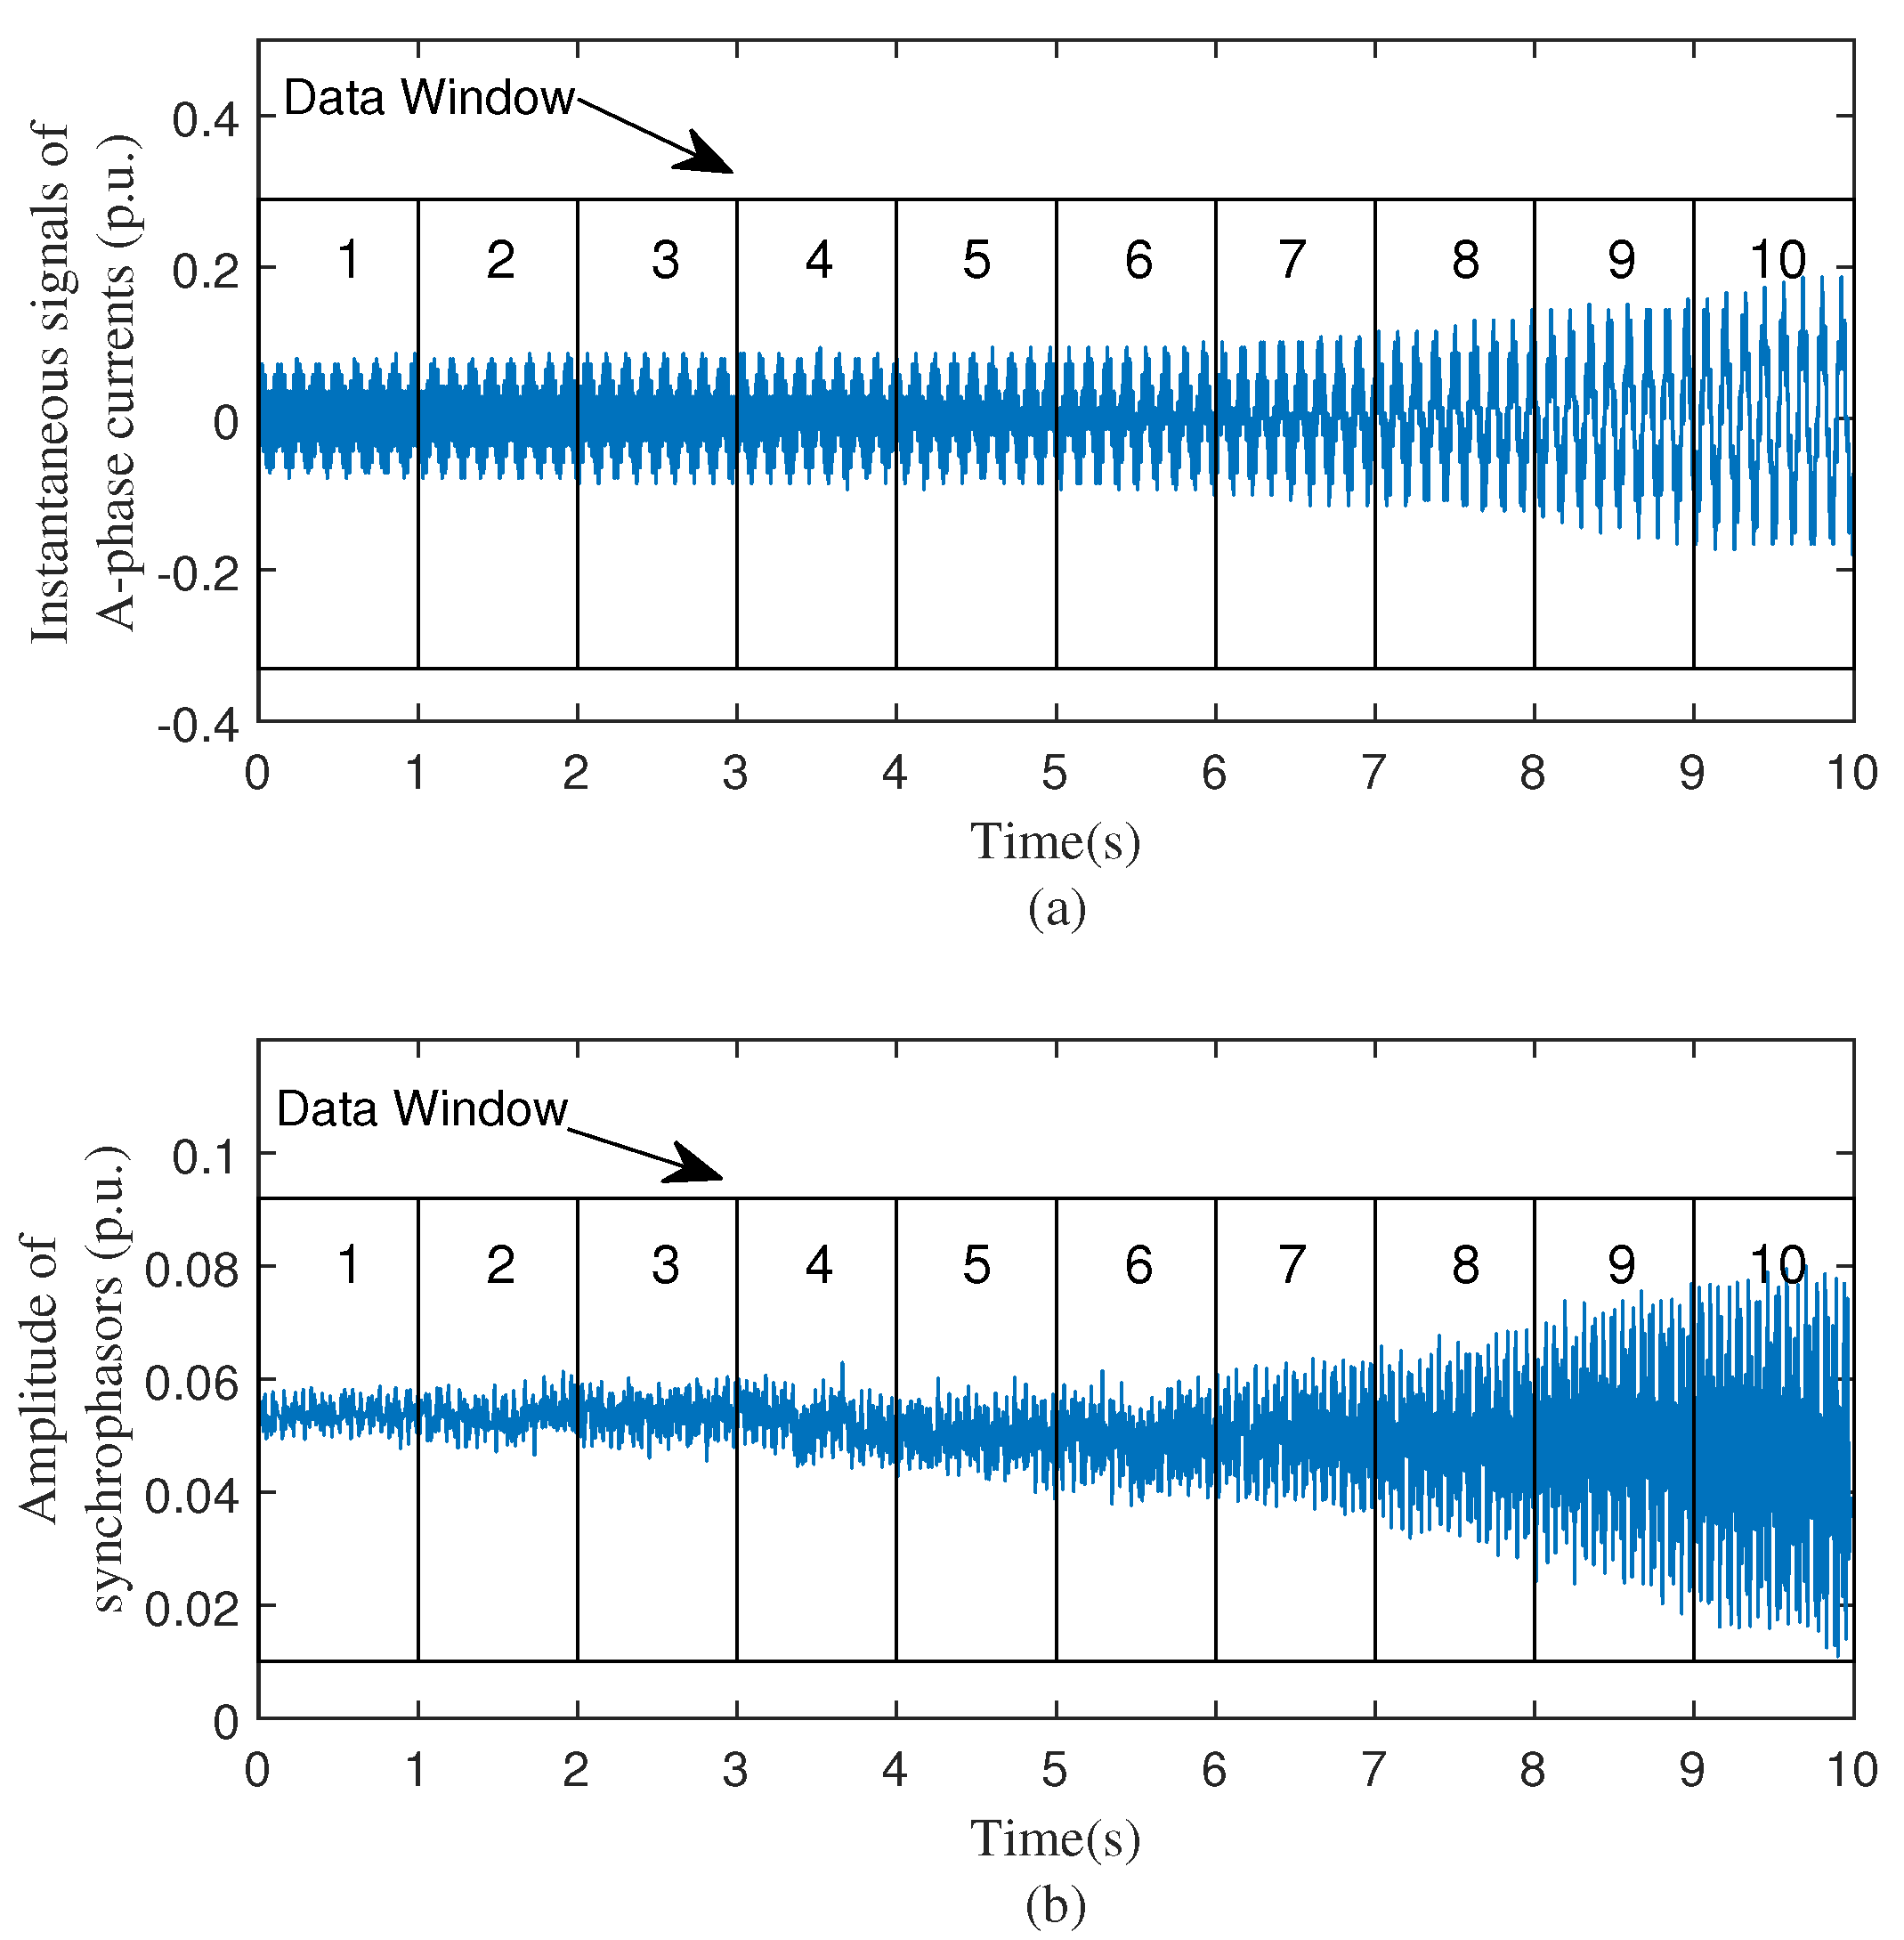
Figure 1. The instantaneous signal of current and the amplitudes of the corresponding synchrophasor sequence for the actual measured PMU data case. (a) Instantaneous data. (b) Amplitude of synchrophasor.
Energies 17 02575 g001
Figure 2. Identified results of frequency and amplitude of subsynchronous oscillation components for actual measured PMU data case. (a) ERA data winder 1 s. (b) ERA data window 200 ms.
Energies 17 02575 g002
Table 1. Comparison of parameter identification errors between IERA and ERA (%).
Test SetSNRMethod | f ^ 0 f 0 | f 0 | x ^ 0 x 0 | x 0 | f ^ sub f sub | f sub | x ^ sub x sub | x sub | ϕ ^ sub ϕ sub | ϕ sub | x ^ sup x sup | x sup | ϕ ^ sup ϕ sup | ϕ sup
f sub [5, 45] HzIERA
(200 ms)
10 13 10 12 10 12 10 11 10 11 10 11 10 11
ERA
(200 ms)
10 9 10 8 10 12 10 8 10 9 10 8 10 9
ERA (1 s) 10 11 10 10 10 12 10 11 10 11 10 10 10 11
40IERA
(200 ms)
0.18890.76190.06162.91542.04772.12753.4843
ERA
(200 ms)
0.64795.58240.09618.01553.3277.7245.736
ERA (1 s)0.13225.85750.00561.35581.57172.99571.8074
x sub [ 5 , 100 ] IERA
(200 ms)
10 13 10 12 10 12 10 12 10 11 10 12 10 11
ERA
(200 ms)
10 10 10 10 10 12 10 10 10 10 10 10 10 10
ERA (1 s) 10 12 10 10 10 13 10 11 10 11 10 11 10 11
40IERA
(200 ms)
0.01140.05610.02290.3180.82750.2630.4533
ERA
(200 ms)
0.74845.36210.032312.32648.88756.90986.2734
ERA (1 s) 0.1729 4.5502 0.0034 1.6465 0.4527 0.8911 0.6088
Table 2. The average single identification time of the three algorithms (ms).
Test MethodSNRIERA 200 msERA 200 msERA 1 s
f sub [5, 45]  Hz 4.68 5.07 6.13
40 4.69 4.94 6.11
x sub [ 5 , 100 ] 5.04 4.99 5.95
40 4.71 5.00 6.04
Disclaimer/Publisher’s Note: The statements, opinions and data contained in all publications are solely those of the individual author(s) and contributor(s) and not of MDPI and/or the editor(s). MDPI and/or the editor(s) disclaim responsibility for any injury to people or property resulting from any ideas, methods, instructions or products referred to in the content.