Article

Renewable Energy Share in European Industry: Analysis and Extrapolation of Trends in EU Countries

by
Bożena Gajdzik
1,*,
Rafał Nagaj
2,
Radosław Wolniak
3,*,
Dominik Bałaga
4,
Brigita Žuromskaitė
5 and
Wiesław Wes Grebski
6
1
Department of Industrial Informatics, Silesian University of Technology, 44-100 Gliwice, Poland
2
Institute of Economics and Finance, University of Szczecin, 71-101 Szczecin, Poland
3
Faculty of Organization and Management, Silesian University of Technology, 44-100 Gliwice, Poland
4
KOMAG Institute of Mining Technology, Pszczynska 37, 44-101 Gliwice, Poland
5
Faculty of Public Governance and Business, Mykolas Romeris University, LT-08303 Vilnius, Lithuania
6
Penn State Hazleton, Pennsylvania State University, 76 University Drive, Hazleton, PA 18202, USA
*
Authors to whom correspondence should be addressed.
Energies 2024, 17(11), 2476; https://doi.org/10.3390/en17112476
Submission received: 27 March 2024 / Revised: 15 May 2024 / Accepted: 17 May 2024 / Published: 22 May 2024
(This article belongs to the Special Issue Energy Efficiency and Economic Uncertainty in Energy Market)

Abstract

:
The strategic objective of world climate policy is the decarbonization of industries, aiming to achieve “net-zero” emissions by 2050, as outlined in the European Green Deal and the Paris Agreement. This transition entails increasing the utilization of renewable energy sources (RES) in industrial energy consumption, thereby transforming economies from reliance on fossil fuels to sustainable alternatives. However, this shift poses a significant challenge for many EU countries, with varying degrees of success in adaptation. This paper investigates the process of decarbonizing industries by analyzing trends in the adoption of RES in EU countries and evaluating their progress toward climate targets. Utilizing time series analysis of production, total energy usage, and the proportion of renewables in industrial energy consumption, the study compares two groups of countries: longstanding EU members and newer additions. The aim is to forecast the trajectory of RES integration in industry and assess the feasibility of meeting the targets outlined in the European Green Deal. The findings reveal a considerable gap between the set targets and projected outcomes, with only a few countries expected to meet the EU’s 2030 goals. This is highlighted by disparities in RES shares across member states, ranging from 0.0% to 53.8% in 2022. Despite notable increases in the absolute use of renewable energy, particularly in central and eastern European nations, substantial challenges persist in aligning industrial sectors with EU decarbonization objectives.

1. Introduction

Decarbonization, within the framework of environmental policy, denotes the systematic reduction in greenhouse gas emissions, ultimately aiming to cease the release of CO2 into the atmosphere. The European Union (EU) has set ambitious targets to mitigate emissions of detrimental greenhouse gases, aiming for a 55% reduction by 2030 and a more substantial reduction ranging between 80–95% by 2050 compared to 1990 levels [1,2]. In December 2019, the EU delineated a strategic roadmap for the green transition, charting a course toward achieving climate neutrality by 2050 [3]. Over the preceding four years, specific policy directives have been aligned with this strategic vision, leading to the development of new tools for the EU industrial strategy, such as the Carbon Border Adjustment Mechanism (CBAM) [4,5].
The pursuit of climate neutrality among member states, particularly those heavily reliant on coal for energy production, necessitates the adoption of a fundamentally new paradigm in the energy market—transitioning from fossil fuels to renewable energy sources. New EU member states, including Poland, Slovakia, and the Czech Republic, are urged to intensify their focus on renewable energy sources (RES), coupled with accelerated investments in this domain. The imperative of deep decarbonization mandates a shift away from the consumption of solid fuels, oil, and natural gas, toward the utilization of renewable energy sources.
The global energy landscape must undergo a profound transformation, transitioning from its current heavy reliance on fossil fuel exploitation to a more sustainable utilization of renewable energy sources (RES) across economies. The evolution of economies is intricately intertwined with shifts in industries and their structures, particularly within sectors such as energy, metallurgy, mining, chemical production, and cement manufacturing, all of which are significantly influenced by climate and energy policies. According to the Communication from the Commission of the European Communities (2007, p. 3), prevailing energy and transport policies suggest a projected 5% increase in EU emissions by around 2030, with a global increase of 55% [5].
The implementation of a novel climate policy featuring a net-zero strategy poses a formidable challenge for European industries. Decarbonization initiatives cannot be uniformly distributed among member states due to variations in the proportion of renewable energy sources (RES) within their total energy portfolios [6]. Some Union countries exhibit considerable RES shares, particularly within industrial sectors, such as Latvia (49.1%), Sweden (42.3%), or Finland (38.2%), while others display notably lower shares, exemplified by Malta (0.0%), the Netherlands (1.4%), or Italy (2.0%) [7,8].
This article aims to scrutinize trends in the integration of renewable energy within the overall energy consumption of industrial sectors across EU nations. It endeavors to evaluate the feasibility of attaining climate-related objectives pertaining to RES utilization within the industrial context, within the framework of the EU Renewable Energy Road Map. The methodology employed for scientific analysis and interpretation relied on secondary data obtained from Eurostat and the U.S. Energy Information Administration, encompassing metrics on industrial production, total energy utilization, and the incorporation of renewables in industrial energy consumption [8]. These data were utilized to estimate the expected share of RES in the final consumption of total energy in industry in 2030. For this purpose, multiple regression analysis was employed, considering the influence of economic, political, and technological factors that, according to the literature, can stimulate the use of renewable energy sources in industry. Based on the dataset, analyses were conducted for the period 1995–2022 and subsequently, based on the projected level of independent variables in 2030, the share of RES in the final consumption of total energy in industry in 2030 was extrapolated. Findings were delineated into two segments: (1) “old EU” members and (2) “new” EU members. On this basis, an assessment was made regarding the major factors influencing RES consumption in industry and whether the 2030 climate targets for a target minimum level of RES in final energy consumption are also achievable for industry.
The authors propose the following research hypothesis (RHs):
RH: At the current rate of industrial development and changes in the level of energy intensity of production, none of the goals connected with EU climate targets will be achieved.
The following research questions (RQs) were added to the hypothesis:
RQ1: What factors influence the share of renewable energy sources in total final industrial energy consumption in the EU member states?
RQ2: How many EU countries will be able to achieve the indicative targets for RES in the industry?
RQ3: Will “old EU” and “new” EU members be able to meet minimum climate targets for RES consumption in their industries?
RQ4: Should the green industrial transformation be evaluated by “new” and “old” EU members or regionally?
Our study addresses a conspicuous gap in the existing literature and offers a valuable contribution to the field. Notably, the literature lacks analyses focusing on the implementation of climate targets specifically tailored to the industrial sector. While the existing literature explores the trajectory of industrial decarbonization, there is a scarcity of analyses concerning projections of the renewable energy sources (RES) share and their alignment with actual climate targets for the industrial domain. Within the context of Research Question 3 (RQ3), it is notable that projections from the U.S. Energy Information Administration [8] suggest a uniform average annual percentage change of 0.4% in industrial RES consumption and total energy consumption by sector in western Europe from 2022 to 2050. Conversely, in eastern Europe, the projected annual change in RES consumption is estimated to be 0.8%, while for total energy consumption, it is projected to be 3.0%. Consequently, it can be inferred that “established” EU member states are more likely to achieve climate targets concerning RES utilization within the industrial sector compared to “new” member states.
The structure of the paper comprises six sections. Following the introduction (Section 1) is the background analysis (Section 2), where the authors elucidate the backdrop of changes in the European Union, including the industry, while also delineating the factors identified in the literature as influencing the transformation of the industrial sector toward decarbonization and the utilization of cleaner energy. Subsequently, a methodological section is presented wherein the authors elucidate a logical model of the research process. Based on the knowledge presented in Section 2, the authors extract the factors to be analyzed and describe the model employed in the study. Section 3 is about materials and methods. Section 4 is a research section where an analysis of predictors and trends in the share of RES in total energy is conducted based on historical data, along with predictive models for selected key trends of change. The ensuing section (Section 5) is a discussion, wherein reference is made to the obtained results of the analysis and the literature review. The final section is a summary (Section 6), wherein the authors account for the research objectives, highlight the utility of the analysis, and describe the limitations of the research.

2. Theoretical Background of Analysis

The modernization of European industry, pivotal to the Green Transformation, emerges as a vital component in the pursuit of climate neutrality within the European Union’s (EU) strategic framework aiming for climate neutrality by 2050. European industry, contributing approximately 20% to the total value added and driving 80% of goods export, simultaneously accounts for about 20% of EU greenhouse gas emissions [6]. Hence, the successful realization of the European Green Deal [9] mandates a transition from fossil fuels to clean energy sources, notably renewables, aligning industrial energy consumption with indicative targets set for the broader economy.
The endeavor to decarbonize industrial policy presents a formidable challenge for European economies. The European Green Deal signifies a paradigmatic shift in EU policies, compelling industries to decarbonize operations by 2050. This commitment is underscored by newly established targets, including a renewable energy sources (RES) target of 42.5%, with aspirations for 45%, and an 11.7% improvement in energy efficiency by 2030 [9]. The European Commission stipulates that meeting RES targets necessitates an annual increase in renewable energy utilization in industry by 1.1 percentage points [10]. EU member states are mandated to devise national strategies to meet decarbonization goals and elevate the proportion of RES in energy consumption [11].
Forecasts from the Global Energy Transformation project suggests that renewables will account for 63% of final energy consumption in industry by 2050, with the EU aiming for a minimum of 70% [12], p. 9. The pursuit of a net-zero greenhouse gas emissions economy lies at the heart of the European Green Deal, aligning with the EU’s commitments under the Paris Agreement [8]. Active climate policies are gaining traction globally, with continents such as Asia and America also embracing such initiatives [13,14], recognizing their influence not only on environmental quality but also on living standards, including addressing energy poverty. Despite global support for climate action, challenges persist, particularly in eastern European economies heavily reliant on carbon-intensive production processes, exhibiting resistance to technological change [15].
The transition of European industry toward sustainability is facilitated by EU policies, including climate and energy initiatives such as the Emissions Trading Scheme (EU ETS) and the newly introduced Carbon Border Adjustment Mechanism (CBAM). Moreover, there is a growing imperative for industries to embrace the principles of a circular economy, aiming to optimize natural resource utilization [16]. Presently, only 12% of materials utilized in industry are sourced from recycling, a figure the European Commission aims to double by 2030 [17].
The EU’s formal commitment to decarbonization traces its roots back to the early 1990s when the Union commenced integrating environmental considerations into its policy framework. However, it was not until the 21st century that the decarbonization of industries emerged as a focal point, marked by the adoption of the European Climate Change Program in 2000. This program laid the groundwork for subsequent initiatives addressing climate change [18]. A pivotal moment in the EU’s decarbonization trajectory was the adoption of the 2020 Climate and Energy Package in 2008, enshrining binding targets for reducing greenhouse gas emissions, increasing renewable energy share, and enhancing energy efficiency. Further reinforcement came with the ratification of the Paris Agreement in 2015, where member states committed to limiting global warming to well below 2 degrees Celsius [19].
Building upon these commitments, the EU unveiled the European Green Deal in 2019, presenting a comprehensive roadmap outlining the Union’s strategy to achieve carbon neutrality by 2050. This ambitious initiative encompasses a diverse array of measures, from accelerating renewable energy deployment and enhancing energy efficiency to promoting sustainable agriculture and biodiversity conservation [20]. To drive decarbonization efforts, the EU has implemented various legislative instruments, including the EU Emissions Trading System (EU ETS), aimed at mitigating carbon emissions from industries. Additionally, the EU introduced the Just Transition Fund to provide support to regions heavily reliant on fossil fuels in transitioning to a low-carbon economy [21].
The COVID-19 pandemic has acted as a catalyst prompting the European Union (EU) to reassert its commitment to decarbonization through the Next Generation EU recovery plan. This plan allocates a significant portion of funds to green initiatives, emphasizing the pivotal role of decarbonization policy in shaping a resilient and sustainable future [22]. As the EU advances, ongoing discussions center around the Fit for 55 package, a comprehensive set of legislative proposals designed to align the Union with its 2030 climate targets. This package aims to reinforce the EU’s determination to decarbonize by proposing measures to reduce emissions across various sectors, including transportation, industry, and buildings [18,19].
The pursuit of deep decarbonization within European policy encompasses a range of efforts across both the private and public sectors aimed at reducing the carbon footprint of organizations and products. The term “carbon footprint” refers to a calculation that encompasses total greenhouse gas emissions, including carbon dioxide (CO2) and methane (CH4) [19]. The net-zero strategy mandates the replacement of carbon-intensive technologies with innovative alternatives; for example, the steel sector must transition from BF-BOF technology to DRI-EAF technology and incorporate the use of green hydrogen [23,24,25,26]. Moreover, critical industries, essential for meeting energy demands, must increase the proportion of renewable energy sources (RES) [27,28]. Substantial transformations are anticipated in sectors such as mining, where thermal coal, a source of carbon-intensive energy, will be phased out, while measures to capture and utilize Coal Mine Methane (CMM) will be implemented [29]. Deep decarbonization initiatives extend to sectors like the chemical industry [30] and others characterized by significant reliance on carbon-intensive energy sources. The transition costs in these sectors are expected to be considerable, with projections from the Wuppertal Institute suggesting that by 2030, half of the EU’s steel and chemical industry installations will require replacement, along with 30% in the cement industry [31].
There is an unequivocal commitment to significantly reduce carbon dioxide and other greenhouse gas emissions, underscored by the escalating global average temperature. The Paris Agreement under the United Nations Framework Convention on Climate Change (UNFCCC) adopts a scenario limiting global warming to 2 °C [32]. Climate policy, anchored in a net-zero strategy, presents an opportunity for economic advancement. The transition from coal, gas, or oil to renewable energy sources is poised to yield environmental benefits, reaffirming the imperative of safeguarding our shared environment (Our Common Future) [33].
As the momentum behind energy transition and the “green deal” intensifies, new industrial ecosystems are emerging, accompanied by the advent of advanced technologies previously unseen. Technological advancements are driving innovation in industries and products, fostering the implementation of responsible innovation approaches within industrial ecosystems [34]. Additionally, the proliferation of new energy carriers is reshaping consumption patterns for both individuals and businesses [34,35,36]. Examples such as energy cooperatives and comprehensive grids highlight the evolution of novel forms within the energy market [37,38,39].
The stability of energy supply serves as the cornerstone of prosperity in highly developed nations. Attention to social and economic development must be accompanied by profound decarbonization efforts across energy, industry, transport, and other sectors. However, organizational and technical barriers, alongside escalating energy costs, impede the transition away from fossil fuels in certain industrial processes, contributing to the emergence of energy poverty in countries characterized by low energy diversification and reliance on both black and green energy [39,40,41]. Public institutions bear the responsibility of safeguarding the most vulnerable social groups and supporting entities engaged in diversifying energy and heat sources for residential areas. Notably, the European Social Climate Fund, operational between 2025 and 2032, is poised to allocate EUR 72.2 billion to directly assist vulnerable households affected by climate change and facilitate investments in clean heating and mobility [42].
Decarbonization strategies are complemented by efforts to enhance energy efficiency. Governments have long advocated for policies aimed at boosting energy efficiency, with industries investing in measures to curtail energy consumption. Within the industrial sector, optimizing energy usage is deemed crucial not only for decarbonization but also for overall business strategy. The ongoing effects of technological advancements in pivotal sectors, such as metallurgy, are evident [43]. A plethora of existing technologies offer rapid and substantial improvements in energy efficiency for both buildings and industrial processes. While energy efficiency initiatives alone may not entirely address emissions challenges in sectors resistant to reduction, widespread adoption of efficiency measures can collectively yield significant outcomes. Furthermore, such initiatives often result in direct cost savings for businesses, making them an attractive starting point for endeavors aimed at achieving a net-zero trajectory.
Industries striving for net-zero emissions stand to benefit from emerging markets for alternative energy sources such as hydrogen, biofuels, and biogas, as well as from the utilization of by-products, as demonstrated by Carbon Capture, Utilization, and Storage (CCUS) technologies. CCUS, available for numerous years, involves capturing, utilizing, and storing carbon emissions from power generation or industrial processes [42]. However, despite the urgent need for carbon capture capacity highlighted by the International Energy Agency (IEA)—estimating a requirement of 1.7 billion tonnes by 2030 to meet net-zero objectives—the existing pipeline of CCUS projects falls significantly short of this target. Effectively harnessing CCUS in industrial decarbonization endeavors requires substantial efforts to expedite its adoption, including the development of new infrastructure such as pipelines for transporting captured carbon from production sites to storage facilities.
In addition to establishing reduction targets, several governments are implementing carbon pricing mechanisms to accelerate progress toward their environmental objectives. Numerous nations have introduced either direct or indirect levies aimed at curbing carbon dioxide emissions. According to the Deloitte report, approximately 40 countries impose direct carbon levies on emitters [42]. Notably, the European Commission has implemented a carbon pricing framework known as the EU Emissions Trading System (ETS). Concurrently, the European Commission (EC) has unveiled a suite of policy measures, subsidies, and financial allocations to foster a transition to a carbon-neutral economy, thereby bolstering sustained investments in eco-friendly ventures and clean technologies.
Despite multifaceted efforts to mitigate emissions through diverse policy interventions, technological innovations, and a shift toward renewable energy sources, global CO2 output has yet to register a substantial decline. In the United States, CO2 emissions have exhibited fluctuations over time, influenced by factors such as changes in energy consumption patterns, economic dynamics, and policy determinations. Although certain sectors have witnessed reductions in CO2 emissions, notably in electricity generation where there has been a transition toward natural gas and renewables, overall emissions have not demonstrated a sustained downward trend [21,22,23,24,25,26,27,28,29,30,43,44].
The imperative for profound decarbonization within the industrial sector is increasingly evident among numerous companies. Entities whose core business models are reliant on the production and processing of fossil fuels are compelled to transition toward investments in low-carbon or innovative zero-carbon technologies. Rather than perceiving decarbonization policies as threats, companies should regard them as opportunities. The integration of established green energy generation and consumption management solutions can confer a competitive advantage, appealing to conscientious customers and business partners. Collaborative efforts within businesses are particularly critical across various levels of Life Cycle Assessment (LCA) [45].
Decarbonization endeavors at the industrial level encompass diverse domains, including reducing energy consumption, adopting renewable energy sources (RES) for energy utilities, expanding RES capacity, utilizing green gases such as biomethane, conserving local carbon sinks like forests, transitioning from high-emission to low-emission or zero-emission technologies, implementing CO2 recovery and utilization (CCUS), and advancing hydrogen production, among others [46,47]. However, the challenge lies in determining which avenues to prioritize and how to assess their effectiveness.
For years, companies have pursued sustainable development, integrating environmental protection requirements, restrictions, and standards into their policies and strategies. Even within the framework of Industry 4.0 (I4.0), which has been widely promoted for over a decade, there is ample scope for green manufacturing [48,49]. The amalgamation of green manufacturing and smart manufacturing is further emphasized in the concept of Industry 5.0 (I5.0) [50], where attention is squarely focused on decarbonization and environmental impact throughout the value chain. Regardless of the industrial development concept, be it Industry 4.0 or Industry 5.0, decarbonization policy represents a proactive strategic approach. Companies must allocate sufficient investment resources to advance toward decarbonization targets. The pathways to decarbonization in manufacturing are diverse, with early adopters often serving as exemplars. Large capital groups frequently benefit from European programs [51], leading the innovation and testing of new low-carbon technologies within their respective industries.
At the sectoral level (energy, metallurgy, cement, mining, and chemicals), defined lines of action outlined in industrial policies are being implemented. The European Industrial Strategy aims to ensure access to clean and affordable energy and raw materials. Industries like cement, steel, aluminum, and fertilizer production, characterized by emissions that are challenging to abate, necessitate comprehensive approaches due to the complex equipment, processes, and heat involved. Information, technical expertise, and economic tools are indispensable throughout the transformation process. Governments, with varying experiences in formulating decarbonization strategies, should examine RES trends in two segments: members of the “old EU” and “new” EU members.
Two primary strategies for reducing atmospheric carbon dioxide levels include reducing CO2 emissions from existing technologies (predominantly fossil fuel-based) and transitioning to new energy facilities utilizing carbon-free technologies. The choice between these strategies hinges on various factors and the broader context of each situation. Feasible and economically viable retrofitting or upgrading of existing technologies to significantly reduce CO2 emissions without compromising efficiency or productivity may be favored where applicable. In cases where industries heavily rely on existing infrastructure and a rapid transition to new technologies poses logistical or economic challenges, focusing on emissions reduction within the existing framework may be pragmatic. Implementation of carbon capture and storage (CCS) technologies can be integrated into strategies to mitigate emissions from existing fossil fuel-based technologies.
In scenarios where technological advancements have rendered carbon-free alternatives not only available but also economically competitive, transitioning to these technologies becomes increasingly compelling. When existing technologies are inherently inefficient or approaching the end of their operational lifespan, investing in new carbon-free facilities during replacements or upgrades becomes a strategic choice.
Both decarbonization strategies and investments in renewable energy are closely intertwined, highlighting a shift away from traditional fossil fuels toward cleaner alternatives [52]. This transition necessitates concerted efforts to move from carbon-intensive energy sources to renewable technologies such as solar, wind, hydropower, and geothermal energy, with a shared commitment to achieving a substantial reduction in carbon emissions, thereby contributing to the global endeavor to mitigate climate change [53].
Technologically, both the decarbonization of industries and the expansion of renewable energy infrastructure require the deployment and enhancement of cleaner technologies [54]. This involves not only refining existing renewable technologies but also integrating them into mainstream energy systems [55]. On the policy front, there is a simultaneous emphasis on crafting regulatory frameworks conducive to the adoption of clean energy practices. Decarbonization initiatives advocate for policies incentivizing carbon emissions reduction, while investments in renewable energy often hinge on incentives, mandates, and targets to propel the assimilation of sustainable energy alternatives [56,57].
Whether through decarbonization endeavors or investments in renewable energy, the objective is to cultivate a global milieu less reliant on carbon-intensive practices and more aligned with principles of environmental stewardship [58]. Economically, both avenues present opportunities for growth and innovation. Decarbonization initiatives, by diminishing dependence on traditional fossil fuels, foster the emergence of green employment opportunities and drive the advancement of innovative technologies [59]. Similarly, investments in renewable energy sectors bolster economic expansion while concurrently advocating for a cleaner and more sustainable energy paradigm [60].
The integration of renewable technologies into energy systems constitutes a palpable strategy for decarbonization [46,47,48,49,50,51,52,53,54,55,56,57,58,59,60,61]. This transition involves a deliberate departure from fossil fuel reliance toward cleaner and environmentally friendlier alternatives. The deployment of solar panels, wind turbines, and other renewable infrastructures embodies a technological focal point directly supporting the reduction in carbon emissions in energy generation [61,62,63].
The ramifications extend beyond technological progressions, influencing policy frameworks tailored to bolster cleaner energy adoption [64]. Governments and institutions worldwide are increasingly acknowledging the pivotal role of renewable resources in attaining decarbonization objectives [65]. Policies incentivizing and mandating the integration of renewable energy sources into the energy matrix contribute to a regulatory milieu harmonious with the ethos of carbon emissions reduction [66,67].
On a global scale, the adoption of renewable resources addresses a major driver of global warming. The widespread implementation of clean energy technologies not only mitigates climate change but also fosters a sustainable and resilient energy landscape [68,69]. The global impact is underscored by a collective commitment to transitioning toward a low-carbon future, transcending geographical boundaries, and fostering international collaboration [70]. The global literature analyzes this topic using many advanced forecasting models, albeit focusing on countries from continents other than Europe as examples [71,72,73].
In Table 1, we summarize the realization of decarbonization policy in selected industries. In the energy and power generation sector, there is a concerted effort to transition from conventional fossil fuel-based sources to renewable energy alternatives. This necessitates substantial investments in wind, solar, and hydropower, coupled with the deployment of carbon capture and storage (CCS) technologies to mitigate emissions from existing power plants. Well-defined targets for renewable energy capacity and carbon intensity reduction play a pivotal role in shaping the trajectory of industry decarbonization [74].
The transportation sector is undergoing a transition toward low-emission vehicles and alternative fuels [75]. Policies are facilitating the adoption of electric vehicles (EVs) and hydrogen-powered transport, complemented by the development of requisite infrastructure [76]. Stringent emission standards for vehicles and incentives for cleaner transportation technologies further underscore the commitment to decarbonizing transportation [77].
In the manufacturing sphere, decarbonization endeavors revolve around enhancing energy efficiency and embracing cleaner production methodologies [78]. Industries are integrating renewable energy sources into their operational frameworks to meet ambitious emissions reduction objectives. Embracing sustainable supply chain practices is also pivotal in curtailing the overall carbon footprint [79,80]. The construction and building sector is actively implementing policies that promote energy-efficient design and construction practices [78]. Retrofitting existing structures for enhanced energy efficiency, advocating for the use of sustainable materials, and adhering to green building standards constitute fundamental pillars of the industry’s decarbonization strategy [82,83].
Agriculture and agrifood industries are embracing sustainable farming practices, such as precision agriculture and agroforestry [84]. Measures aimed at capturing methane emissions from livestock are pivotal in mitigating the sector’s environmental impact. Furthermore, policies are being devised to facilitate the integration of renewable energy sources into agricultural operations [85]. The chemical and petrochemical industries are investing in cleaner production technologies and processes, progressively reducing their dependence on fossil fuels as feedstock [86,87]. The adoption of carbon capture and utilization (CCU) technologies represents a significant advancement in mitigating emissions from these sectors [88].
Within the information and communication technology (ICT) sector, there is a pronounced focus on enhancing energy efficiency in data centers, promoting green computing, and utilizing renewable energy in ICT infrastructure. The industry is actively engaged in efforts to reduce the carbon footprint associated with digital technologies through various initiatives [89]. Finance and banking institutions are integrating environmental, social, and governance (ESG) criteria into their investment decisions [90,91]. Support for green financing and investments in sustainable projects reflects a shift toward aligning financial practices with decarbonization objectives [92,93].
The tourism and hospitality industries are championing sustainable tourism practices, including the development of eco-friendly accommodations and transportation options [92]. Carbon offset programs targeting travel-related emissions contribute to a more sustainable tourism sector [94]. Similar initiatives were observed during the COVID-19 pandemic [95]. In healthcare, endeavors are directed toward implementing energy-efficient practices in healthcare facilities and reducing the carbon footprint of pharmaceutical production and distribution. Research and innovation in green healthcare technologies further bolster the industry’s commitment to decarbonization [96,97,98].
The commentary accompanying the table transcends mere numerical data, offering a narrative that encompasses diverse aspects such as the observed decline in carbon emissions, the uptake of sustainable practices, and discrepancies among member states. This narrative serves as a crucial resource for policymakers, researchers, and stakeholders seeking to grasp the efficacy of decarbonization policies in molding the EU industry. Through nuanced qualitative analysis, it deepens our comprehension of the intricate dynamics at play in guiding the industrial sector toward decarbonization objectives. These insights are instrumental in informing future policy enhancements and strategic industrial planning initiatives.

3. Materials and Methods

The research aimed to scrutinize trends concerning the proportion of energy sourced from renewable outlets within the overall energy consumption of industries across EU countries. Additionally, it sought to evaluate the feasibility of attaining climate objectives linked to renewable energy sources (RES) within the industrial sector. Through this analysis, the authors sought to elucidate the evolution of renewable energy consumption trends to date and identify the factors influencing the utilization of RES in industrial activities across EU member states.
By examining current trends in industrial production, aggregate energy consumption, and renewable energy uptake, the authors aimed to project the trajectory of RES utilization in the industrial sector by the year 2030. Subsequently, based on these findings, they intended to appraise whether the climate targets delineated by the European Commission for EU economies would be met. Furthermore, the study aimed to ascertain the achievability of these targets and whether the progression of RES utilization in the industrial sphere aligns with the broader economic objectives.
As part of the research process, some key steps were taken (Figure 1).
The first stage of the research process involved analyzing the literature, which allowed for the identification of the research problem and research questions. Elaborating on a theoretical framework, the authors aimed to answer the following research questions (RQs).
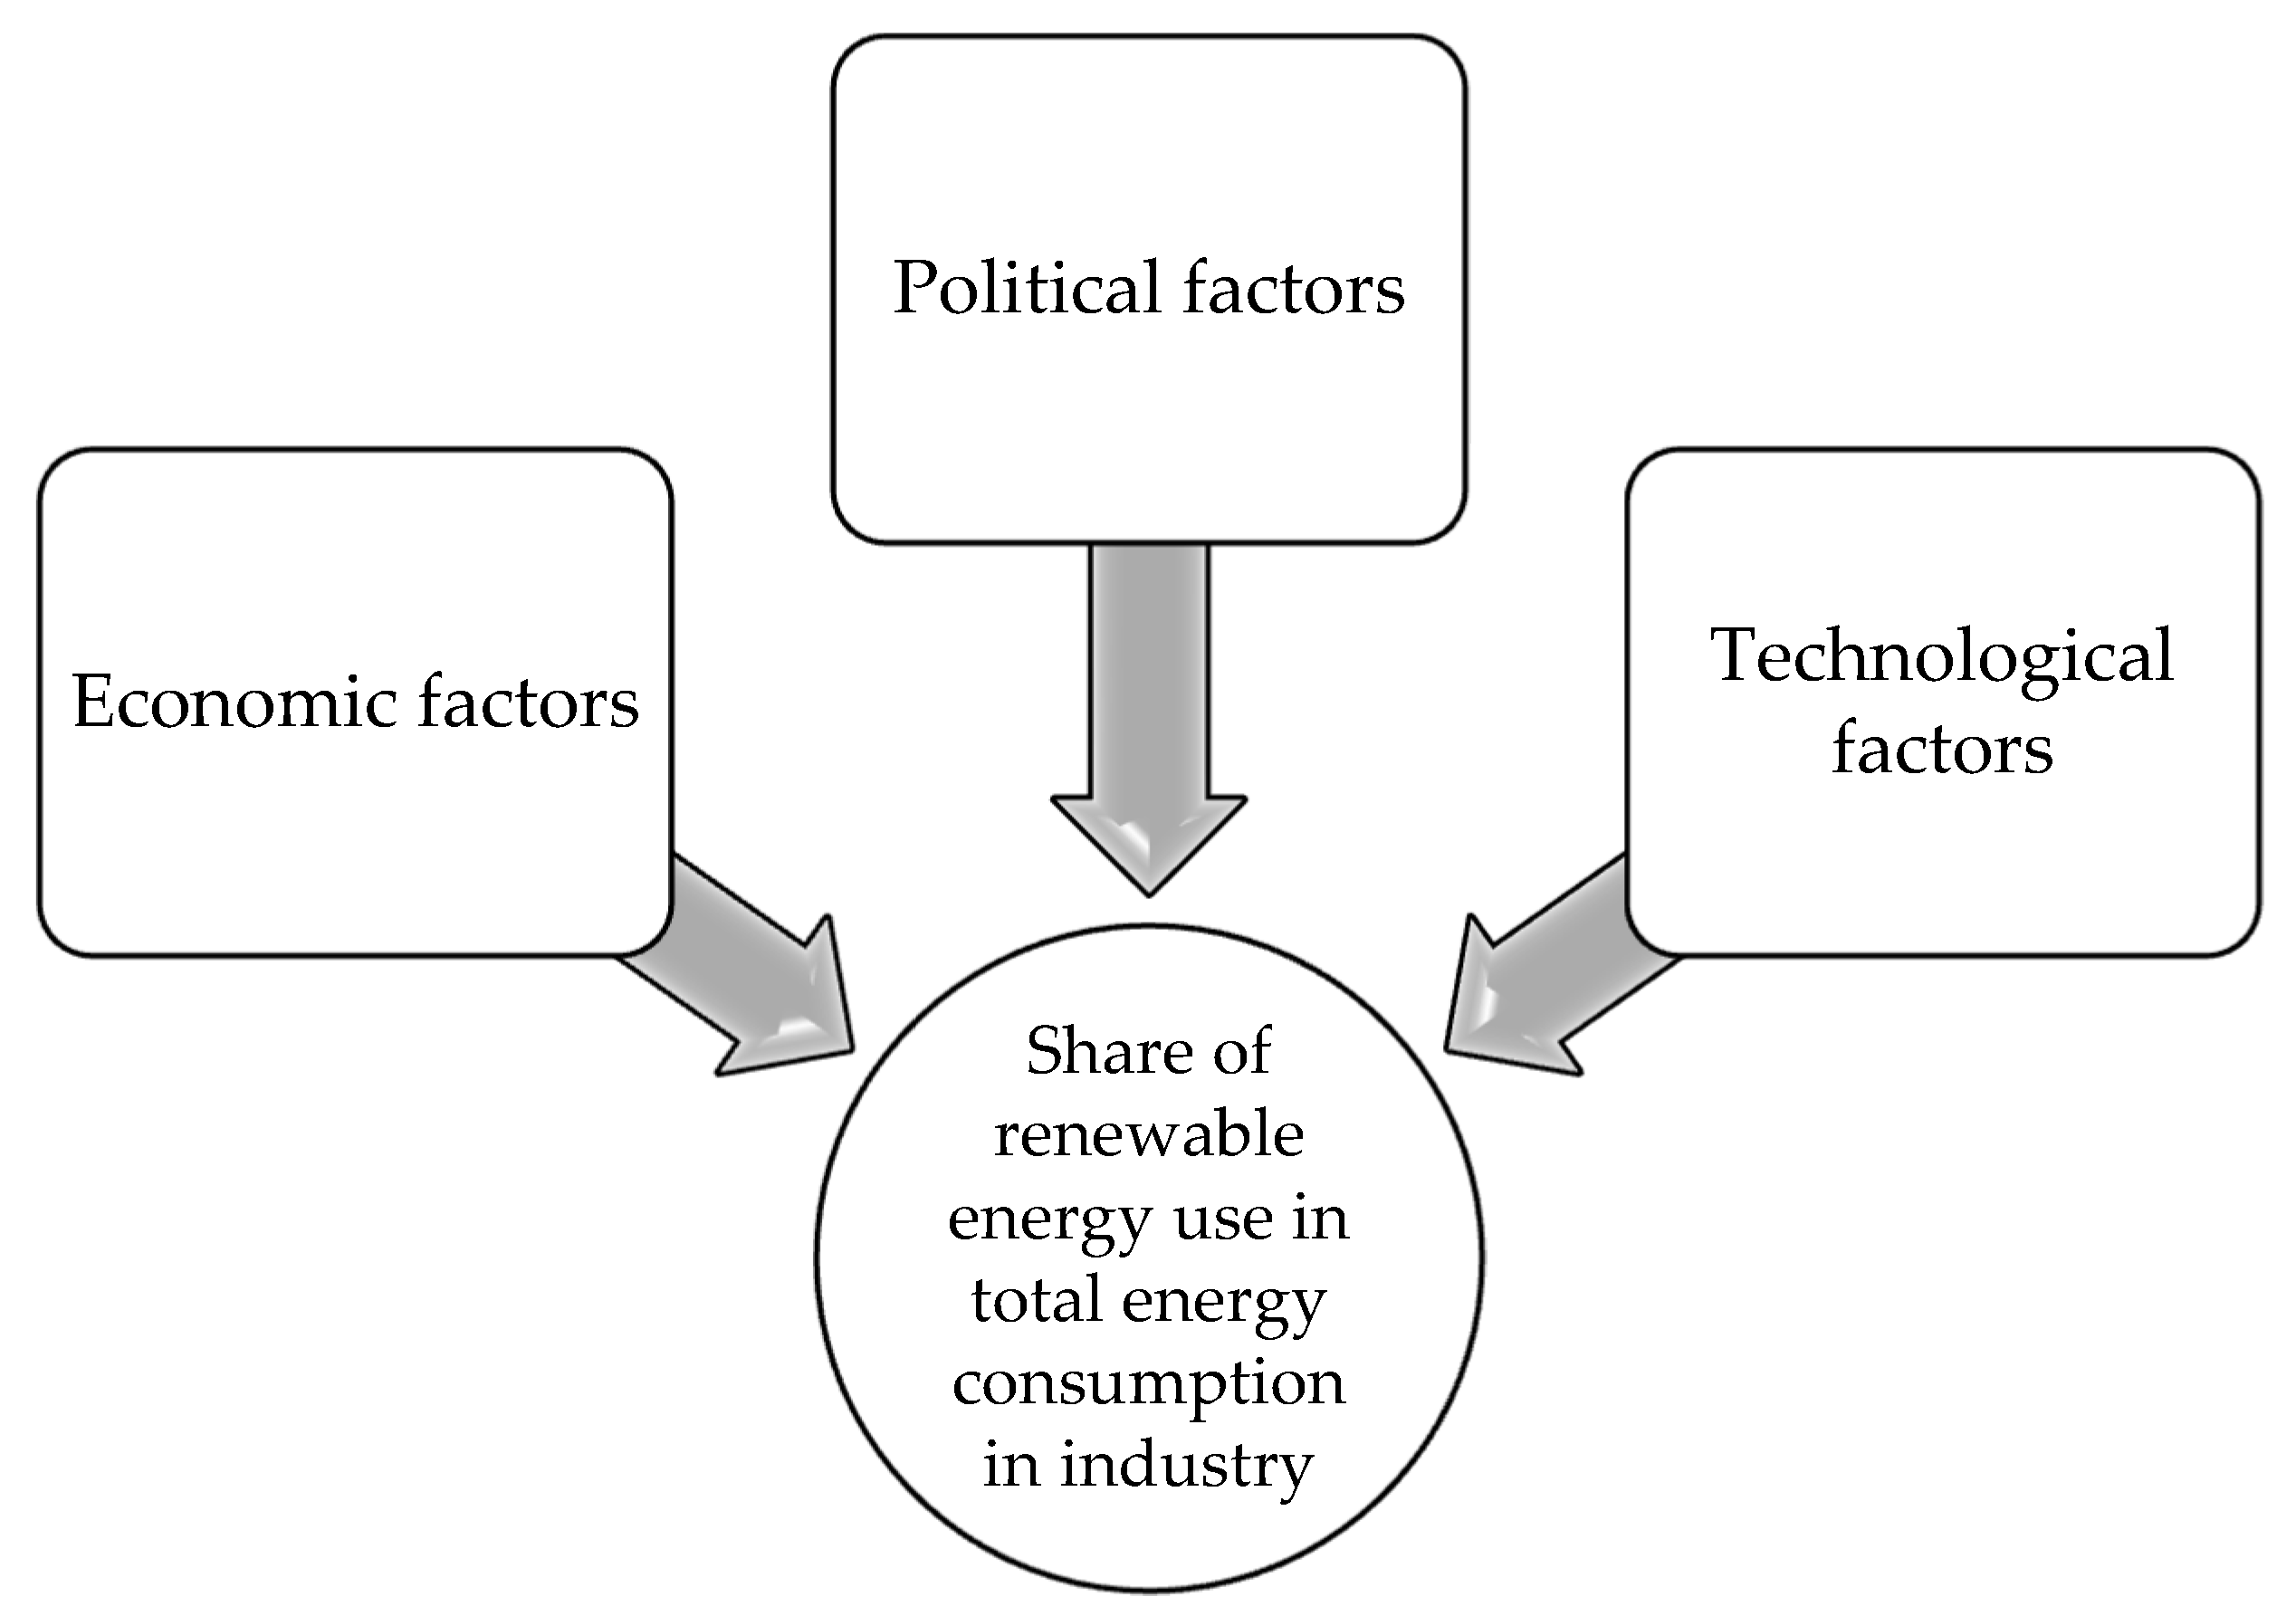
The literature review highlighted various drivers influencing the utilization of renewable energy sources within industrial contexts, encompassing factors of diverse origins. Predominantly, these factors pertain either to shaping energy consumption levels within industry or fostering a proclivity toward renewable energy adoption. Consequently, the authors categorized potential stimulants for augmenting the proportion of renewable energy utilization in total energy consumption into three primary groups: economic, political, and technological (refer to Figure 2).
Economic factors encompass considerations linked to societal income and welfare levels [99], energy price dynamics [100], and the extent of governmental support for renewable or environmentally sustainable energy initiatives [101]. Within the realm of political factors, emphasis is placed on elements associated with climate and energy policies, such as greenhouse gas emission targets, energy efficiency standards, and the proportion of renewables in overall energy consumption [52,74].
Regarding the influence of technological factors, which notably impact the industrial sector’s decarbonization endeavors and transition toward renewable energy sources, modern renewable technologies like wind, solar, and hydropower assume pivotal roles [74]. These technological advancements not only facilitate the integration of renewable energy sources but also drive innovation within industrial processes, thereby contributing to the broader sustainability objectives.
A multiple regression method was used to assess the impact of these factors on the share of renewable energy use in total final energy consumption in industry. An econometric function to assess the impact of these factors in each country will be used as follows:
Y j = β 0 j + β 1 j · X 1 j + β 2 j · X 2 j + + β i j · X i j +
where
Yj—share of renewable energy use in total final energy consumption in industry in j-th EU member state (dependent variable);
β0j, βij—parameters and coefficients of the regression function (i = 1, …, 8);
X1, X2, , Xi—independent variables affecting the dependent variable during the period under consideration (i = 1, …, 8);
j—EU member state.
The dependent variable, namely the share of renewable energy use in total final energy consumption in the industrial sector for each EU member state, will be calculated from the following formula:
Y j = R E S j C O N S j ,
where
RESj—final consumption (energy use) of renewables in the industrial sector in the j-th country;
CONSj—final consumption (energy use) of the total energy in the industrial sector.
For the regression analysis, eight independent variables were selected, as follows:
X1—GDP per capita (current prices, USD)—source: IMF [102];
X2—Electricity price for industrial consumers (Band ID for second semester of year, in EUR)—source: Eurostat [103,104];
X3—General government expenditure on environmental protection as % of GDP)—source: Eurostat [105];
X4—Total net greenhouse gas emissions (excluding memo items, including international aviation)—source: Eurostat [106];
X5—Energy efficiency of primary energy—measured in kilowatt-hours per international [Million tonnes of oil equivalent]—source: Eurostat [107];
X6—Energy efficiency of final energy in the industrial sector, calculated as energy use in the industrial sector divided by the output of production in industry—source: Eurostat [108,109];
X7—Share of RES in total energy consumption in the economy—source: Energy Institute and Our World In Data [110,111];
X8—Modern renewable electricity (from wind, hydro, solar, and other renewables including bioenergy in TWh)—source: Our World in Data [112].
According to the literature [99], the higher the country’s GDP per capita, the higher the level of energy consumption; however, the more renewable energy sources should be used. The variable X1 should therefore be expected to have a positive impact on the share of renewable energy in final energy consumption in the industrial sector. Meanwhile, in the context of variable X2, i.e., electricity price for industrial consumers, the impact should be negative on the share of RES in energy consumption. According to theory [100], prices are one of the main cost factors in industry. This should be especially true in countries where electricity is generated from conventional media and where the price is rising rapidly, making renewable energy an economical alternative to conventional sources. However, it should be anticipated that in countries where the share of RES in the energy mix is high, the impact of this factor may be low. The last economic factor is the level of government expenditure on environmental protection, which in this paper is measured as general government expenditure on environmental protection as a % of GDP. A higher level of subsidy should compound to increase investment expenditure on RES. Therefore, the independent variable X3 should have a positive effect on Y. Variables X4X7 represent political factors. In this case, these are factors from the impact of climate policy overseen by the European Commission. Variable X4 relates to total net greenhouse gas (GHG) emissions. Since reducing GHG emissions requires, among other things, replacing fossil fuels with renewable energy [52,92], the impact of this independent variable should therefore be negative. For variables X5 and X6, energy efficiency is an alternative method to RES development to reduce the negative environmental impact of production. According to the literature, if the energy intensity of total economy or of the industrial sector is lower, the pressure to increase RES decreases. Therefore, the impact of X5 and X6 on the share of RES in industrial energy consumption is expected to be positive (these are the stimulants). The final policy factor in our model is the share of RES in total energy consumption in the economy (X7). The value of this indicator is imposed by the European Commission and approved in the form of indicative national indicators by governments. According to theory, it has a positive effect on the share of RES in the energy mix and is therefore a stimulant in our model. Variable X8 represents the technology factor and measures what proportion of modern renewable electricity is generated. This takes into account the increasing share of RES from wind, hydro, solar, and other renewables including bioenergy. According to the literature [74], the more electricity is generated by power plants using modern technology, the higher the share of RES in energy consumption. For this reason, it will be a stimulant in our model.
Based on this developed econometric function, a trend function will be determined for each of the countries studied. Of course, depending on the country, the number and type of factors influencing the dependent variable may differ, depending on which ones are statistically significant.
Y ^ j = β 0 j + β 1 j · X 1 j + β 2 j · X 2 j + + β i j · X i j
The research period is delineated by available data, facilitating the capture of long-term trends and patterns. The derived trend functions will enable an evaluation of the statistically significant impact of various factors on the dependent variable throughout the research duration. This extended timeframe affords a nuanced comprehension of the evolution of renewable energy sources (RES) utilization within the industrial sector. Employing trend analysis, the study endeavors to discern patterns and fluctuations in industrial production and energy consumption over the specified period, with particular attention to the exponential growth observed in central and eastern European countries.
Subsequently, the estimated functions will undergo validation to ascertain the absence of autocorrelation in the residuals, utilizing the Durbin–Watson statistical test. Conversely, White’s test will be employed to assess the absence of heteroscedasticity in regression models. These methodological steps collectively serve to address the primary research question.
To address the remaining three research inquiries, an extrapolation will be conducted to forecast outcomes for the year 2030. It is noteworthy that the analysis timeframe aligns with the European Green Deal’s intermediate climate goal for the EU. The assessment of the feasibility of climate objectives pertaining to RES within the industrial sphere will encompass all EU member countries, grounded in an analysis of trends in the proportion of renewable energy within total energy consumption across these nations.
The next stage of the research process is the estimation of the projected level of RES use in industry for 2030 in the EU countries.
Y ^ j ( 2030 ) = β 0 j + β 1 j · X 1 j ( 2030 ) + β 2 j · X 2 j ( 2030 ) + + β 8 j · X 8 j ( 2030 )
where
X1j(2030), X2j(2030), … X8j(2030)—the projected level of independent variables in 2030 for the j-th country (j = 1, …, 27).
The theoretical equation of the dependent variable indicates the theoretical values in line with the trend; however, in addition to indicating what the influence of the independent variables is by calculating the estimators during the regression analysis, it will also allow us to extrapolate, i.e., calculate the theoretical predicted value of the dependent variable in 2030. In order to extrapolate the share of renewable energy sources in total energy consumption in industry in 2030, it is necessary to know the projected value of the predictors for 2030 that were adopted in the regression models. For this purpose, the levels forecasted by international institutions were adopted as the levels of predicted independent variables in 2030. Table 2 shows the adopted levels and sources of data for 2030.
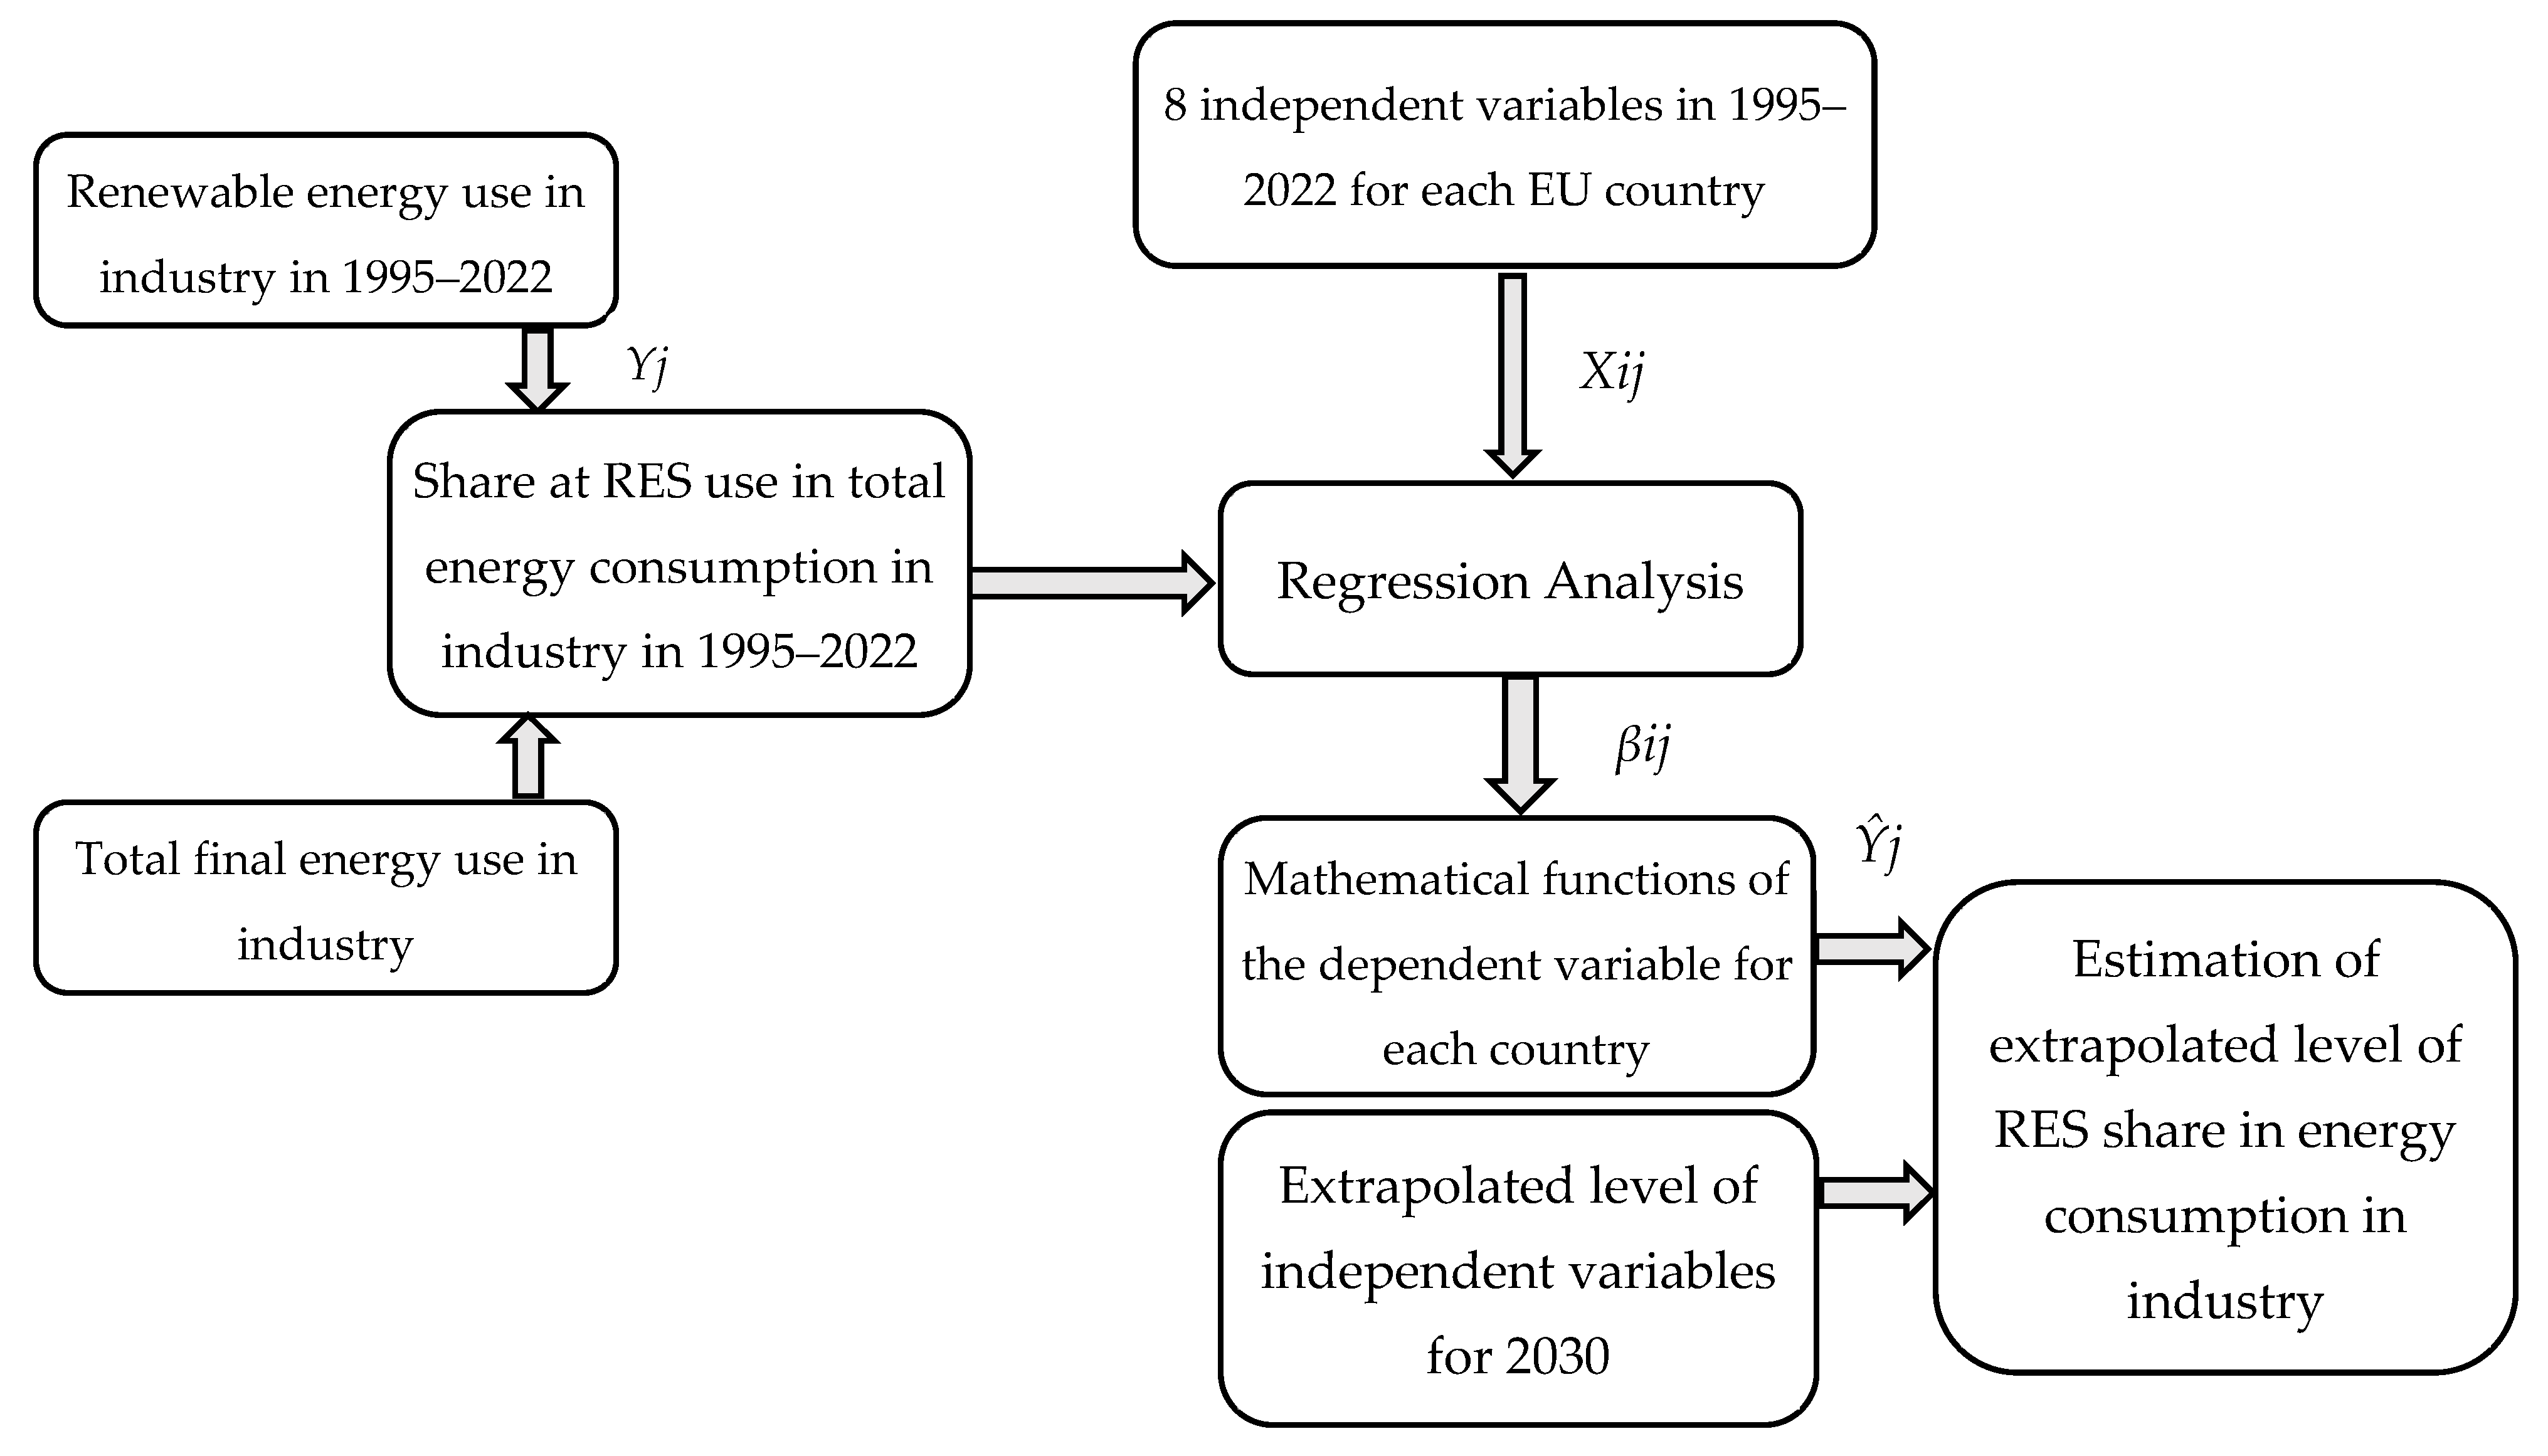
Subsequently, leveraging the established regression models for each country and the known levels of independent variables in 2030, the proportion of renewable energy consumption in total final energy consumption within the industrial sector for the same year will be extrapolated. The schematic depiction of the model devised for formulating and estimating the proportion of renewable energy consumption in total final energy consumption within the industrial sector in 2030 is illustrated in Figure 3.
The basis for gathering data necessary for scientific analysis and interpretation were Eurostat, Our World in Data, and International Monetary Fund data for the years 1995–2022. The Statistica 13.3 software (TIBCO Software, Dublin, Ireland) will be used for statistical calculations.
When extrapolating trends in the context of renewable energy adoption and decarbonization endeavors, several complexities arise that may hinder the accuracy of such extrapolations. One such complexity is Jevon’s paradox, a phenomenon whereby improvements in resource efficiency lead to increased overall consumption rather than conservation. This paradox implies that as technologies become more energy-efficient, industries may tend to consume more energy, thus offsetting the intended environmental benefits. Furthermore, extrapolations may be influenced by the energy cost associated with depleting materials. As industries transition to renewable energy sources, the production and deployment of necessary technologies may entail the utilization of materials that are finite or environmentally impactful. The extraction, processing, and disposal of these materials contribute to the overall energy cost and environmental footprint of renewable energy systems.
The increasing challenge of implementation following the initial pursuit of “low-hanging fruit” poses a significant obstacle. Initial efforts to integrate renewable energy may prioritize the most accessible and economically viable solutions, representing the low-hanging fruit. However, as these straightforward options are exhausted, subsequent implementations may encounter greater complexities, costs, and technical hurdles. This escalating challenge could potentially decelerate the pace of adoption and undermine the feasibility of achieving ambitious renewable energy targets.
These concepts collectively emphasize the necessity for caution when extrapolating trends and making long-term projections in the realm of renewable energy adoption. Recognizing the potential influence of Jevon’s paradox, the energy cost of depleting materials, and the diminishing ease of implementation can facilitate the refinement of extrapolations, considering not only the technological dimensions but also the broader socio-economic and environmental dynamics inherent in the transition toward sustainable energy systems.
The forecasted values for 2030 for the industrial sector will be compared with the national targets of EU member countries as indicated in Table 3. This comparative analysis aims to assess the trends in the industry regarding the increasing use of RES and whether the industrial sector will align with the targets set for the entire economy. By juxtaposing these data with national targets regarding the share of RES in the economy, verification will be obtained, providing insights into Research Questions RQ2 and RQ3. During the final stage of the research process, the authors will address Research Question RQ4 by comparing data for individual countries to discern any differences between the ‘old’ and ‘new’ EU countries.

4. Results

The analysis commenced with the computation of the proportions of renewable energy within the energy consumption of the industrial sector spanning the period from 1995 to 2022. The outcomes of this calculation are presented in Table 3.
An examination of the utilization levels of renewable energy sources within the industrial sector has revealed a prevailing underutilization of ‘green’ energies across most countries. Specifically, among the 27 EU countries assessed, only 10 had achieved an RES share of 10% in energy consumption within the sector by the conclusion of 2022, whereas 7 countries registered figures below the 5% threshold. Scrutinizing the transitions that transpired between 1995 and 2022, it emerged that merely four nations succeeded in augmenting their share of renewable energy by more than 10 percentage points over the 27-year interval. Conversely, Latvia, Cyprus, and Sweden exhibited the most notable rates of change.
Subsequently, the authors conducted a regression analysis to address RQ1, which pertains to the factors influencing the share of RES in industrial energy consumption among EU member states. The findings of this analysis are elucidated in Table 4.
The findings underscored that, across most countries, political factors emerged as the predominant determinants. Specifically, the EU’s climate policy indicative targets for the share of RES in energy consumption held relevance for 16 nations, while greenhouse gas reduction targets were significant for 8 countries and energy efficiency measures for primary energy were influential for 10 countries. Subsequently, economic factors assumed prominence, with GDP per capita identified as a driving force for six countries, while electricity prices were influential for one nation. In contrast, technological factors exhibited comparatively minimal significance, demonstrating statistical significance solely for Germany and Bulgaria. Notably, in the cases of Croatia, Malta, and Slovenia, the fluctuations in RES utilization within industrial energy consumption were pronounced to the extent that none of the analyzed factors proved to be statistically significant predictors.
Subsequent to the derivation of regression models (refer to Table 4), the anticipated share of RES in energy consumption within the industrial sector by 2030 was computed. Predictions were informed by the values of predictors (independent variables) for individual countries in 2030, as projected by international institutions (refer to Table 2). Table 5 delineates the extrapolated values for 2030 and juxtaposes them with the actual values for 2022, thereby illustrating the anticipated changes during the extrapolated period.
Regarding the utilization of renewable energy sources (RES), the analysis revealed a predominant trend of increasing consumption across the majority of the scrutinized countries within their industrial sectors. Notably, Italy, Latvia, and Slovakia constituted exceptions to this trend, wherein although the quantity of RES utilized experienced an upward trajectory, the average annual rate of change during the period 2030/2022 was lower compared to the period 2022/1995. It is imperative to acknowledge that the patterns of change in RES utilization within the industrial landscape varied across individual countries, yielding diverse trends. Also, upon scrutinizing the extrapolated levels of renewable energy consumption in industry from 2022 to 2030 (with RES consumption levels derived from the trend models elucidated in the regression analysis presented in Table 4), a notable surge in the number of consumed renewables is anticipated across the majority of EU countries.
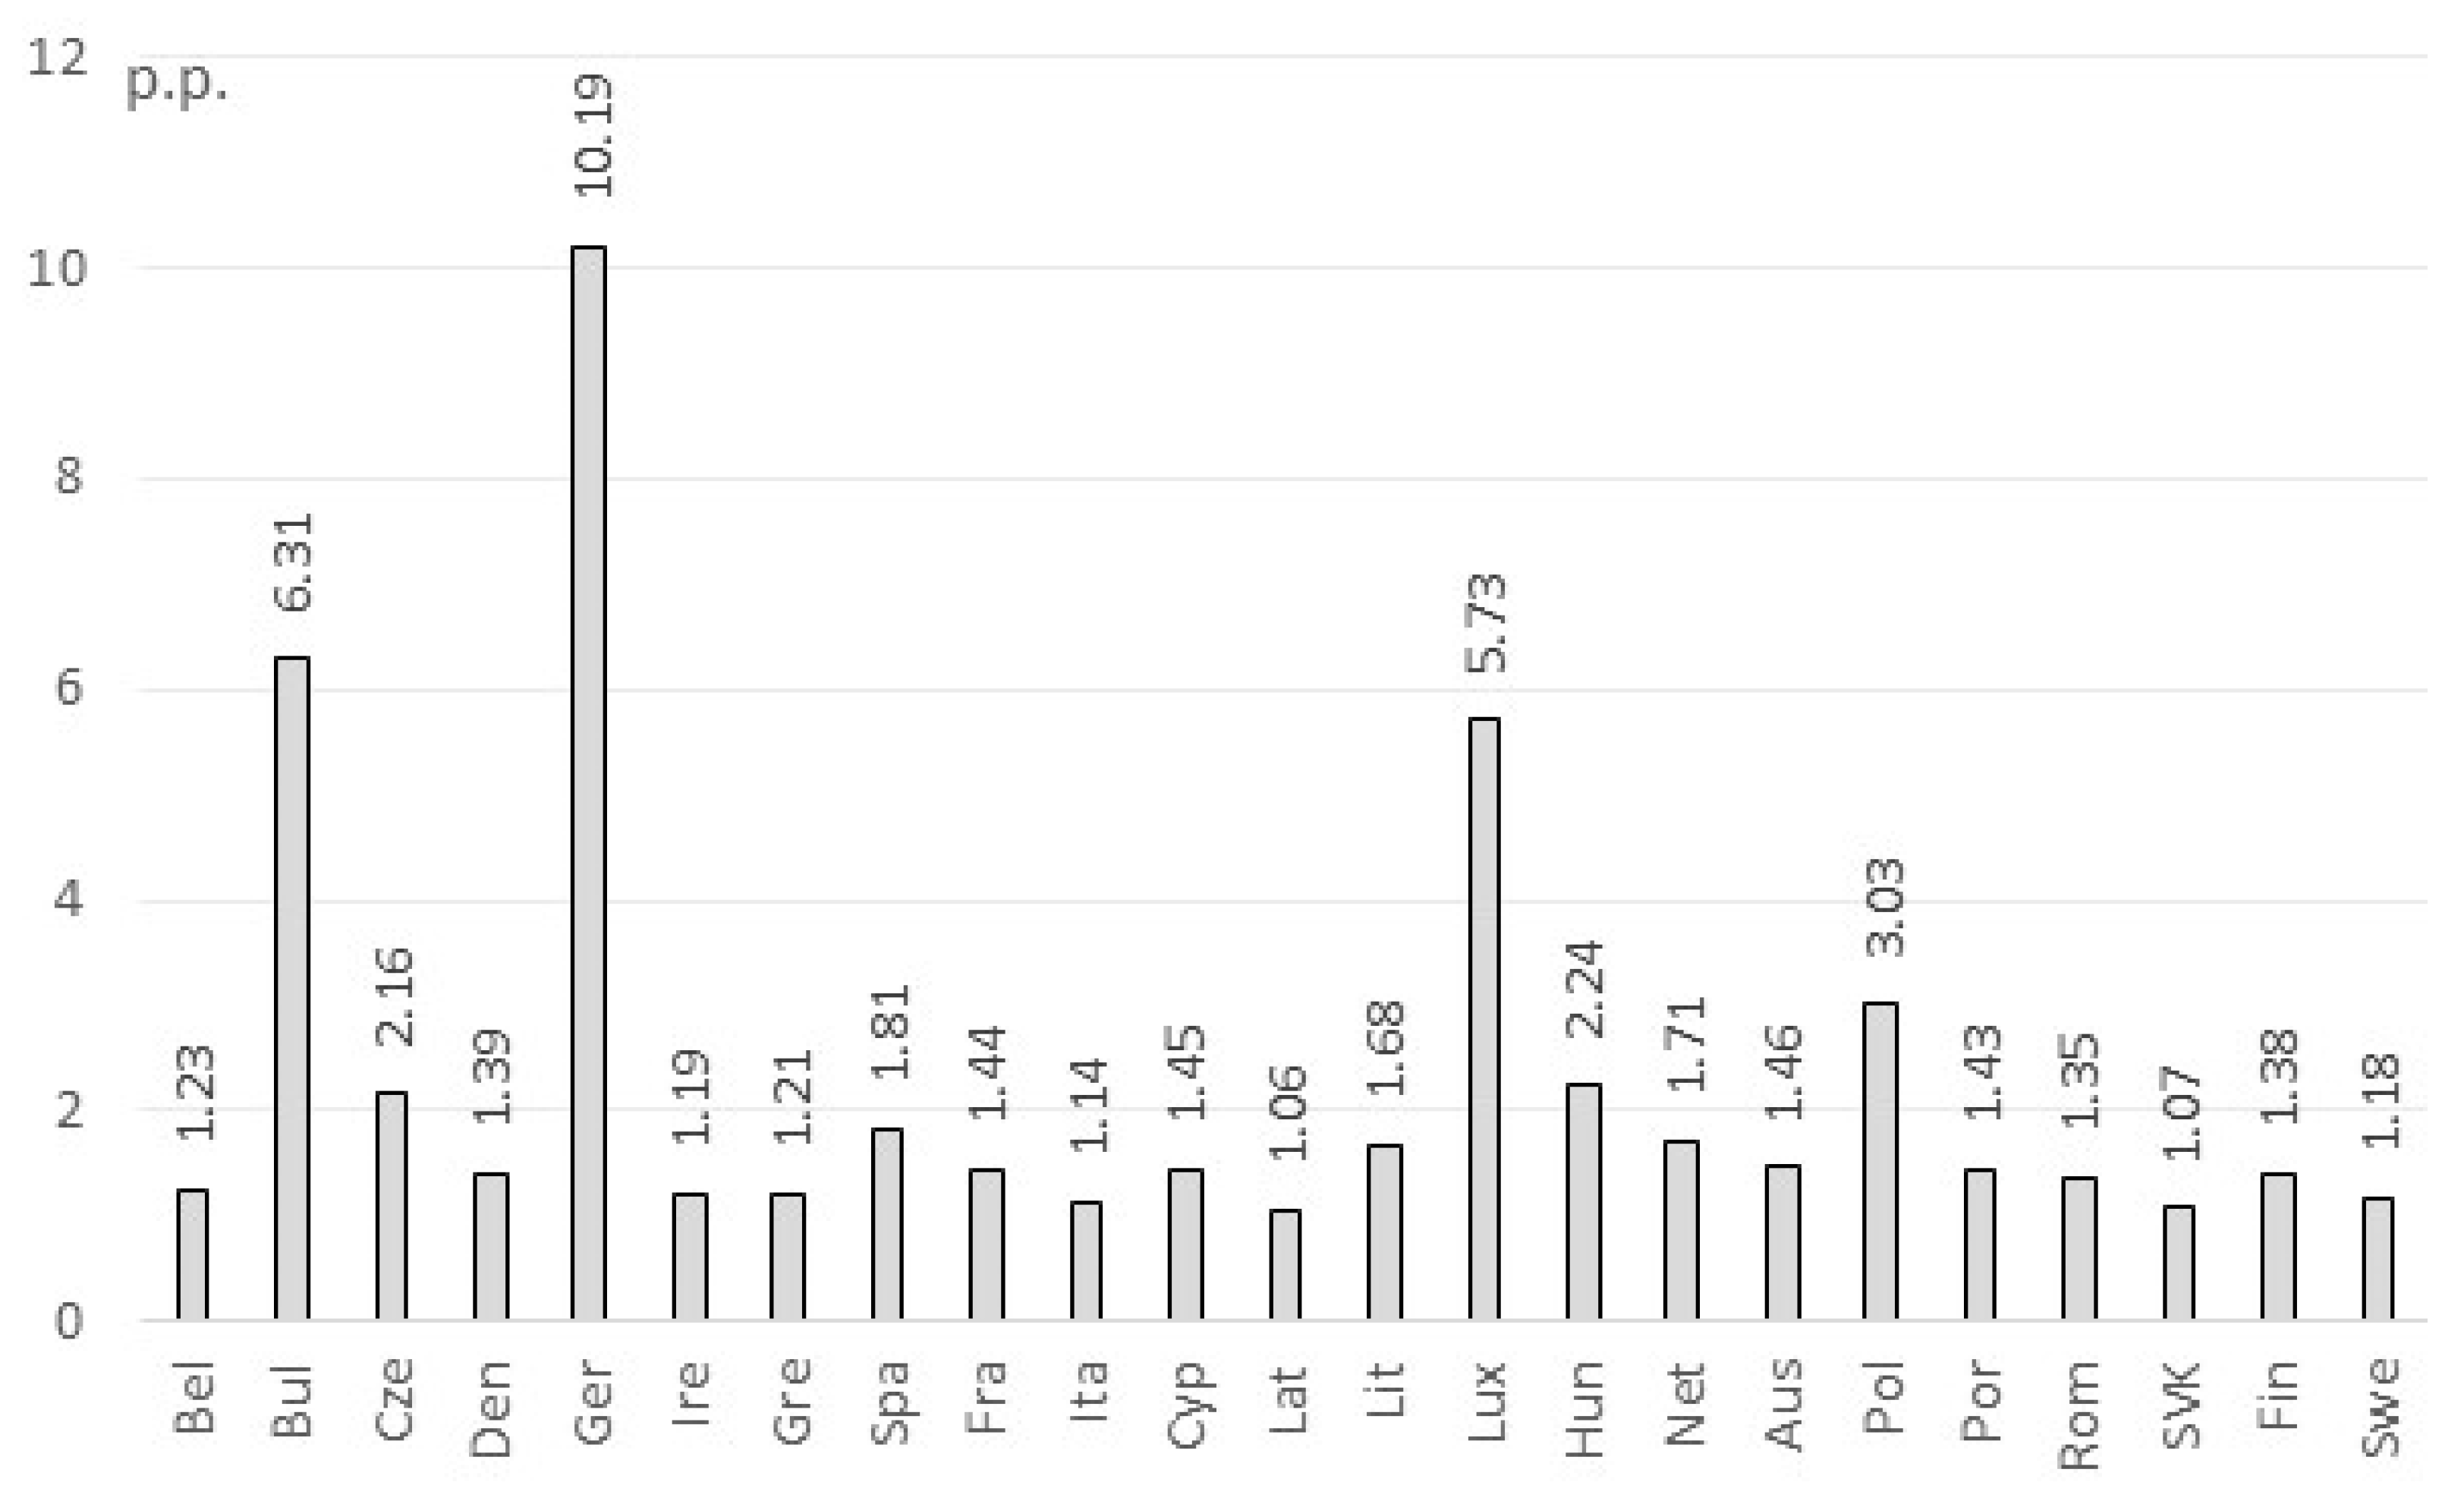
The analysis of projected changes spanning the period from 2022 to 2030 (depicted in Figure 4) suggests a universal augmentation in the utilization of renewable energy as a proportion of total energy consumption across all EU countries. Notably, Germany is poised to exhibit the most substantial increase, surpassing 10%, while Bulgaria and Luxembourg are projected to witness increments exceeding five percentage points. Conversely, in the remaining countries, the anticipated rise is expected to fall within the range of one to three percentage points.
As the forecast is always subject to the possibility of deviation, it is therefore worthwhile to also carry out a sensitivity analysis. To this end, the authors calculated the projected value of the share of RES in energy consumption in the industrial sector, assuming fluctuations in the values of the independent variables of 5% in 2030, i.e., 5% lower and 5% higher (refer to Table 6).
It is worth noting that the sensitivity analysis, i.e., assuming fluctuations in the level of independent variables by 5%, will not cause significant changes in the extrapolated level of the share of RES in energy consumption in the industrial sector in 2030. The difference in the level of the dependent variable depending on the country may range from 0.1 (in the case of Ireland and Slovakia) to 6.6 percentage points (for Germany).
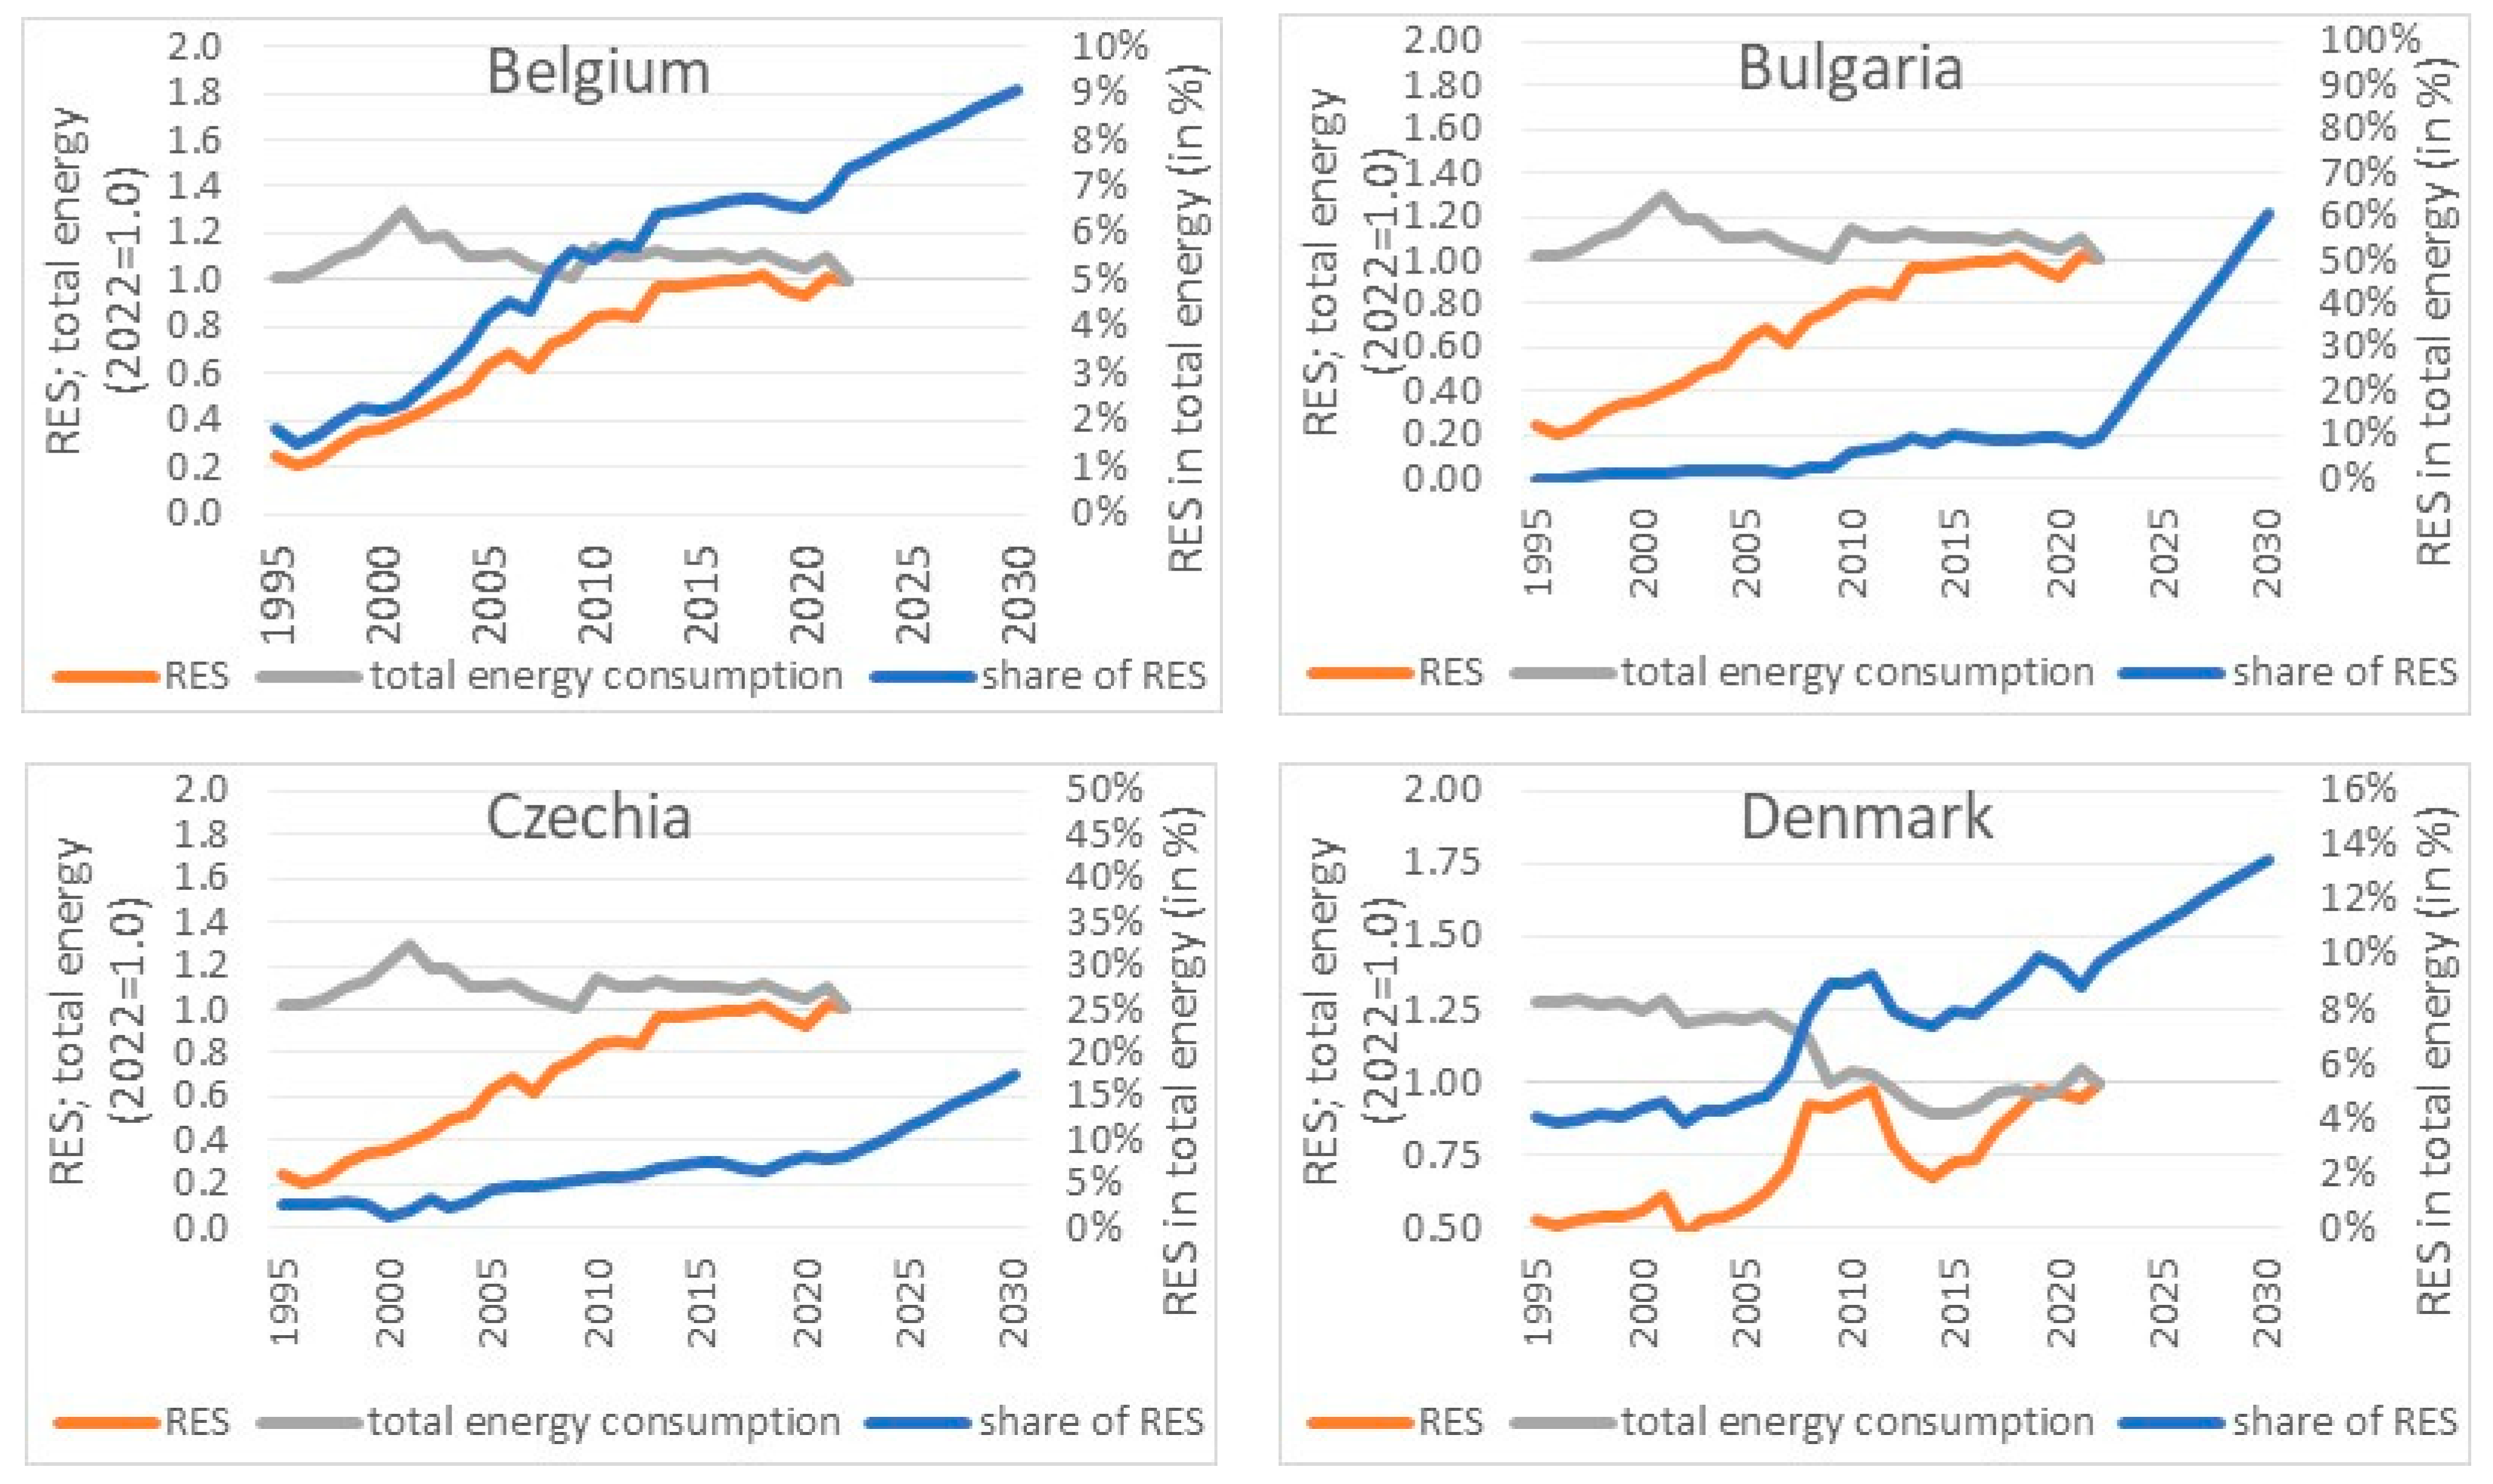
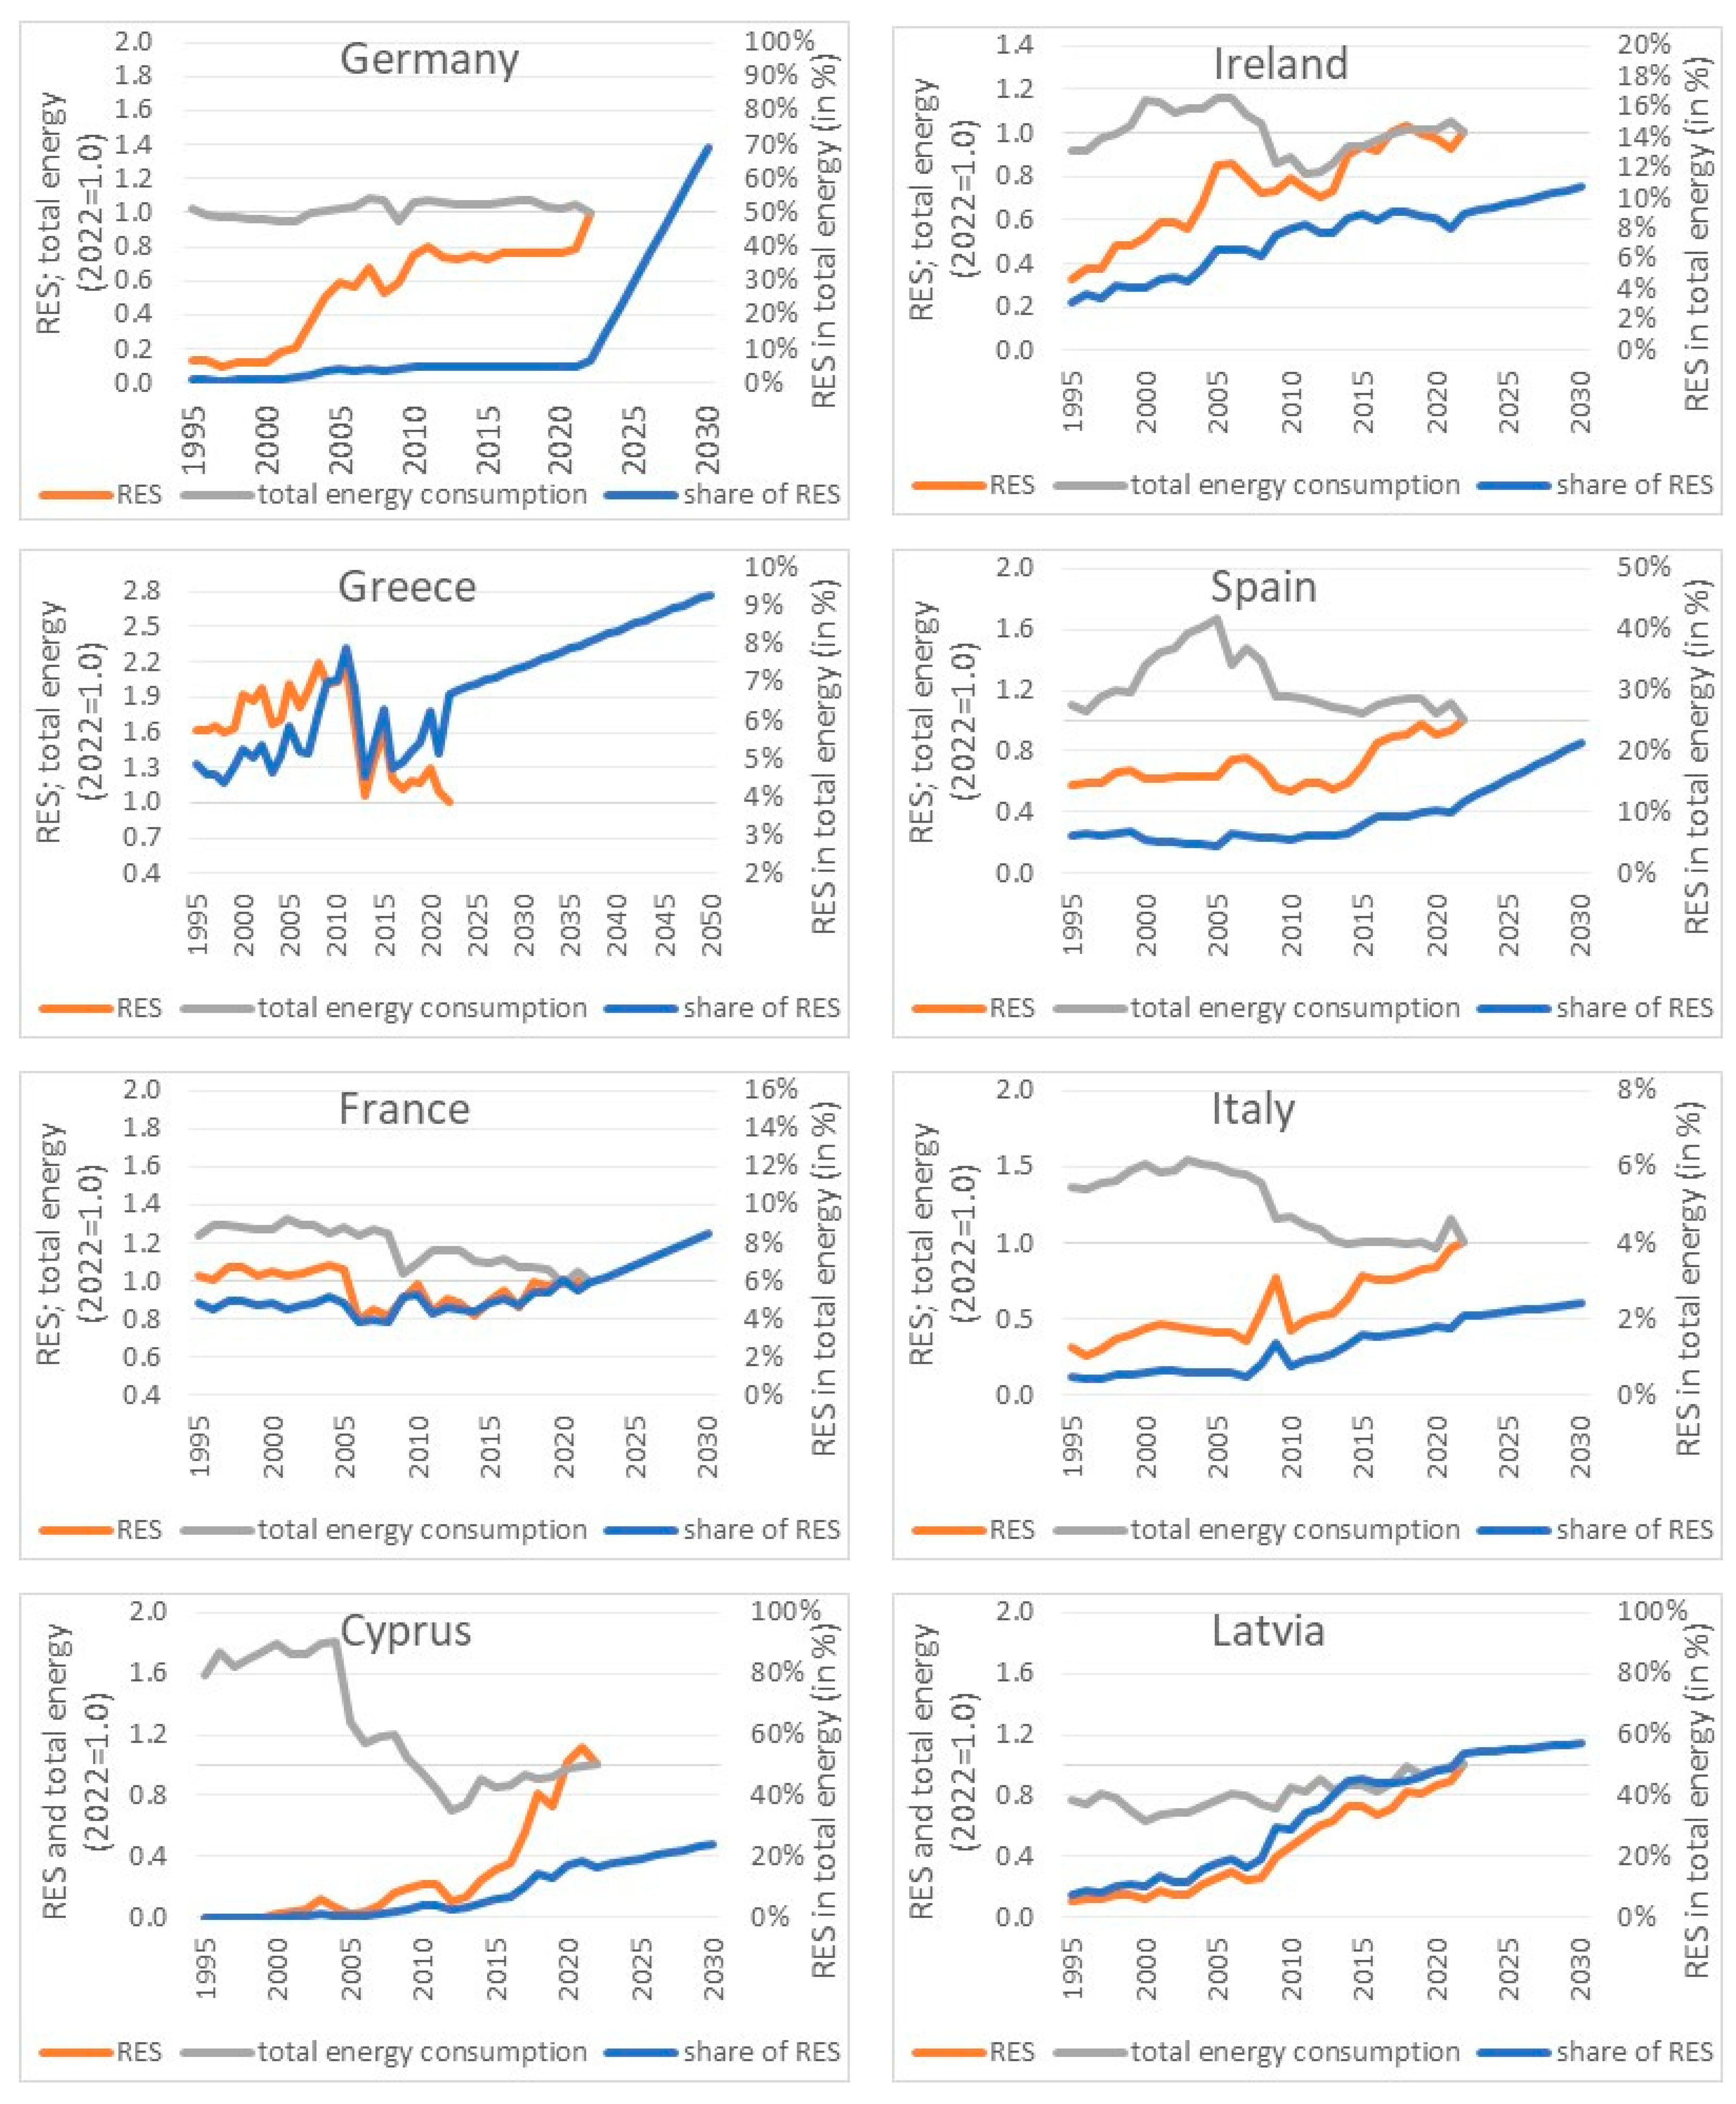
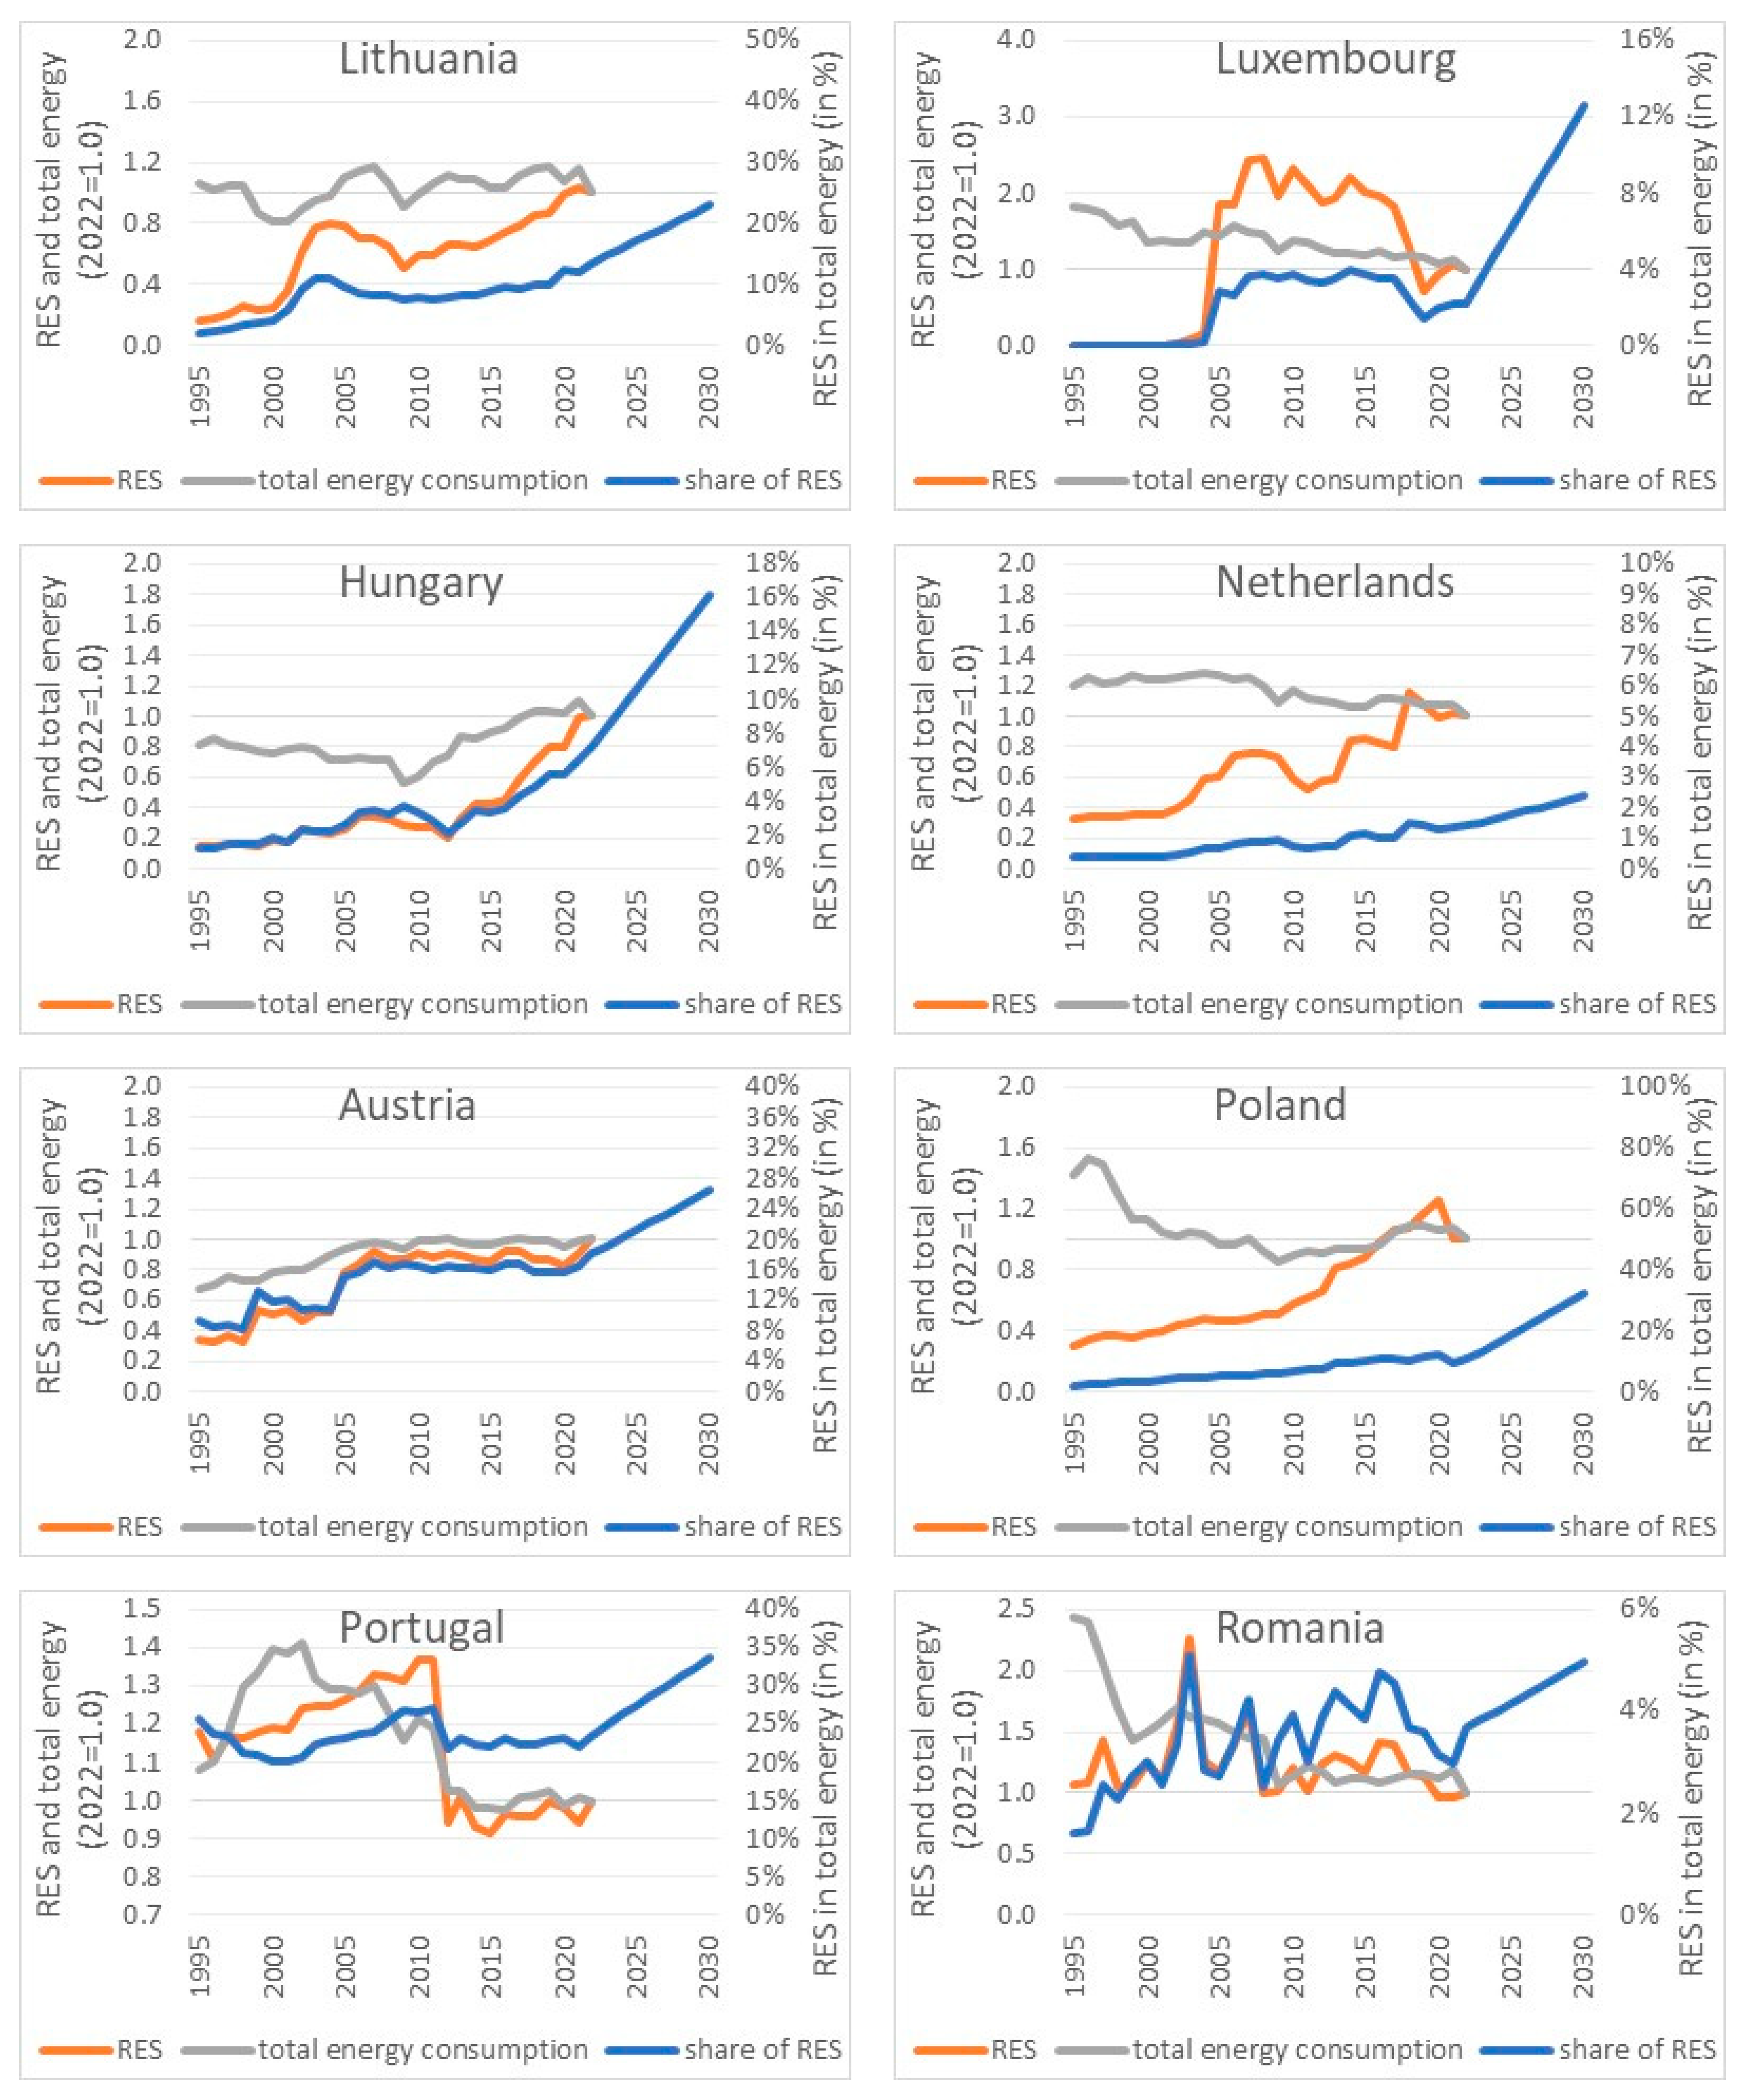
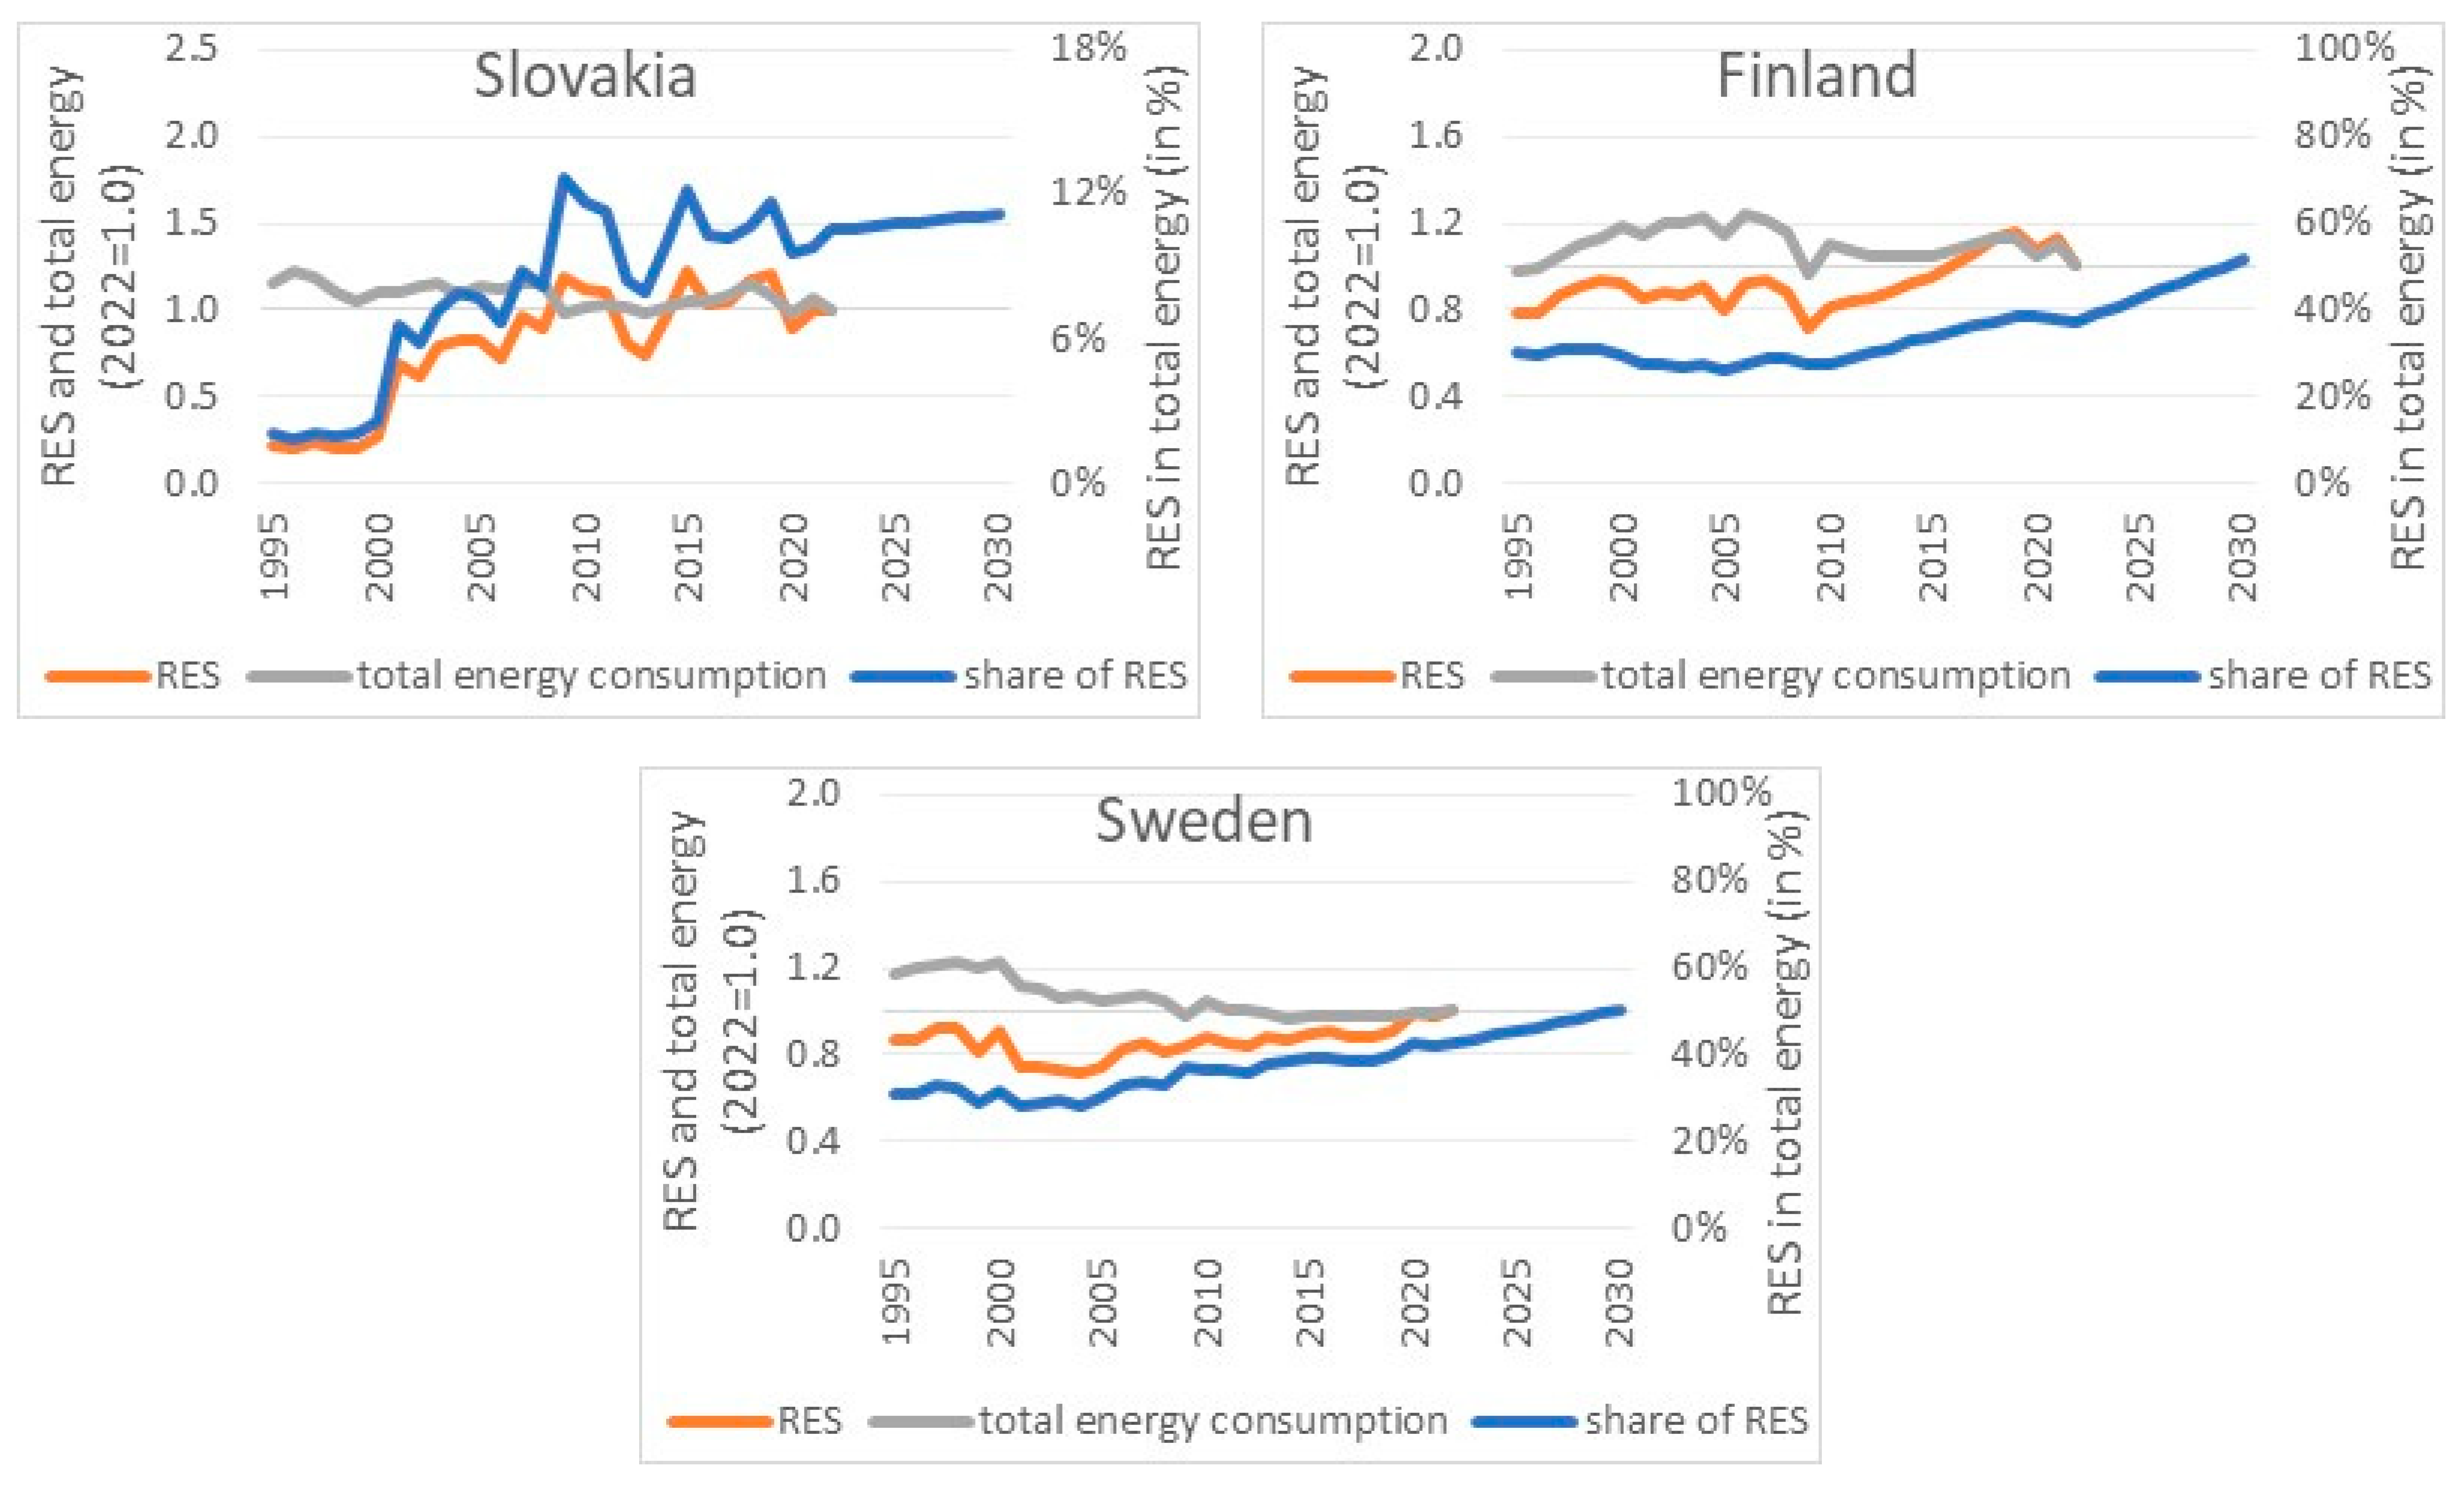
Figure 5 functions as a graphical depiction of pivotal dynamics in the proportion of renewable energy sources (RES) within the industrial sector across EU member states. Upon scrutinizing the data encapsulated within the figure, a mosaic of trends and disparities unfolds, exerting significant influence on the renewable energy landscape. Notably, nations such as Germany, Sweden, Finland, Latvia, and Bulgaria have emerged as vanguards in the integration of renewable energy into industrial operations. The substantial shares of renewable energy observed in these countries underscore a resolute commitment to sustainability and a successful transition toward cleaner energy sources within their industrial frameworks. The conspicuous presence of Germany within this cohort accentuates its stature as a formidable economic juggernaut, wielding influence in both industrial output and environmental stewardhip. Indeed, one may contemplate whether the observed increments in the proportion of RES in energy consumption within EU countries’ industrial sectors stem from an escalation in the volume of renewable sources utilized or simply a reduction in total energy consumption by the industrial sector. Figure 5 furnishes the elucidation of this inquiry.
Conversely, nations such as Malta, Croatia, Greece, Italy, and Romania grapple with lower proportions of renewable energy sources (RES) in their industrial energy consumption. The challenges confronting these southern European countries may stem from diverse factors, including economic structures, historical energy dependencies, or policy landscapes, warranting closer examination.
The temporal dimension delineated in Figure 3, spanning from 1995 to 2021, facilitates the discernment of trends over time. Analyzing the trajectories of individual countries yields insights into the adaptability and responsiveness of industrial sectors to evolving energy paradigms. For instance, the ascending trajectory in renewable energy utilization evident in central and eastern European countries, exemplified by nations like Poland and Lithuania, denotes a favorable transition in the regional energy portfolio.
The nuanced oscillations observed in select countries, such as Greece, Romania, Croatia, and Portugal, signify potential challenges or barriers hindering a consistent increase in the share of renewables. Such hurdles may be rooted in economic factors, policy deficiencies, or structural constraints impeding a smoother integration of renewable energy sources. Nevertheless, the pertinent question arises: will the indicative goals for entire economies be realized within the industrial sector? To address RQ2 and RQ3, it becomes imperative to juxtapose the estimated forecasted shares of RES in energy consumption within the industry against the target values established for European Union countries. It is noteworthy that the European Commission (EC) has delineated an overarching target for the European Union as a whole, set at 42.5% by the year 2030, while member states have submitted their respective national indicative values for approval by the EC. Table 7 delineates these national indicative targets.
It is noteworthy that the national indicative targets of the EU countries for the proportion of renewable energy sources (RES) in final consumption surpass the corresponding shares within the industrial sector. With the exceptions of Slovakia and Belgium, the planned RES shares in the broader economy are projected to exceed 20% across all countries, with nine nations aiming for proportions even surpassing 50%. This prompts the pertinent query: will the industrial sectors in EU countries align with the climate goals pertaining to RES? The resolution to this inquiry is furnished in Table 8.
The research findings indicate that, within the industrial sector, the majority of EU member countries are unlikely to meet both EU and national targets pertaining to the utilization of renewable energy sources. Specifically, for the year 2030, only five countries (six when considering the sensitivities of the independent variables) are projected to attain the EU’s target of 42.5%, with merely three (or four, considering the sensitivities of the independent variables) anticipated to fulfill the national targets sanctioned by the EC. Consequently, it can be inferred that the industrial sector lags behind other segments of the economy (the non-industrial sector) in terms of renewable energy utilization.
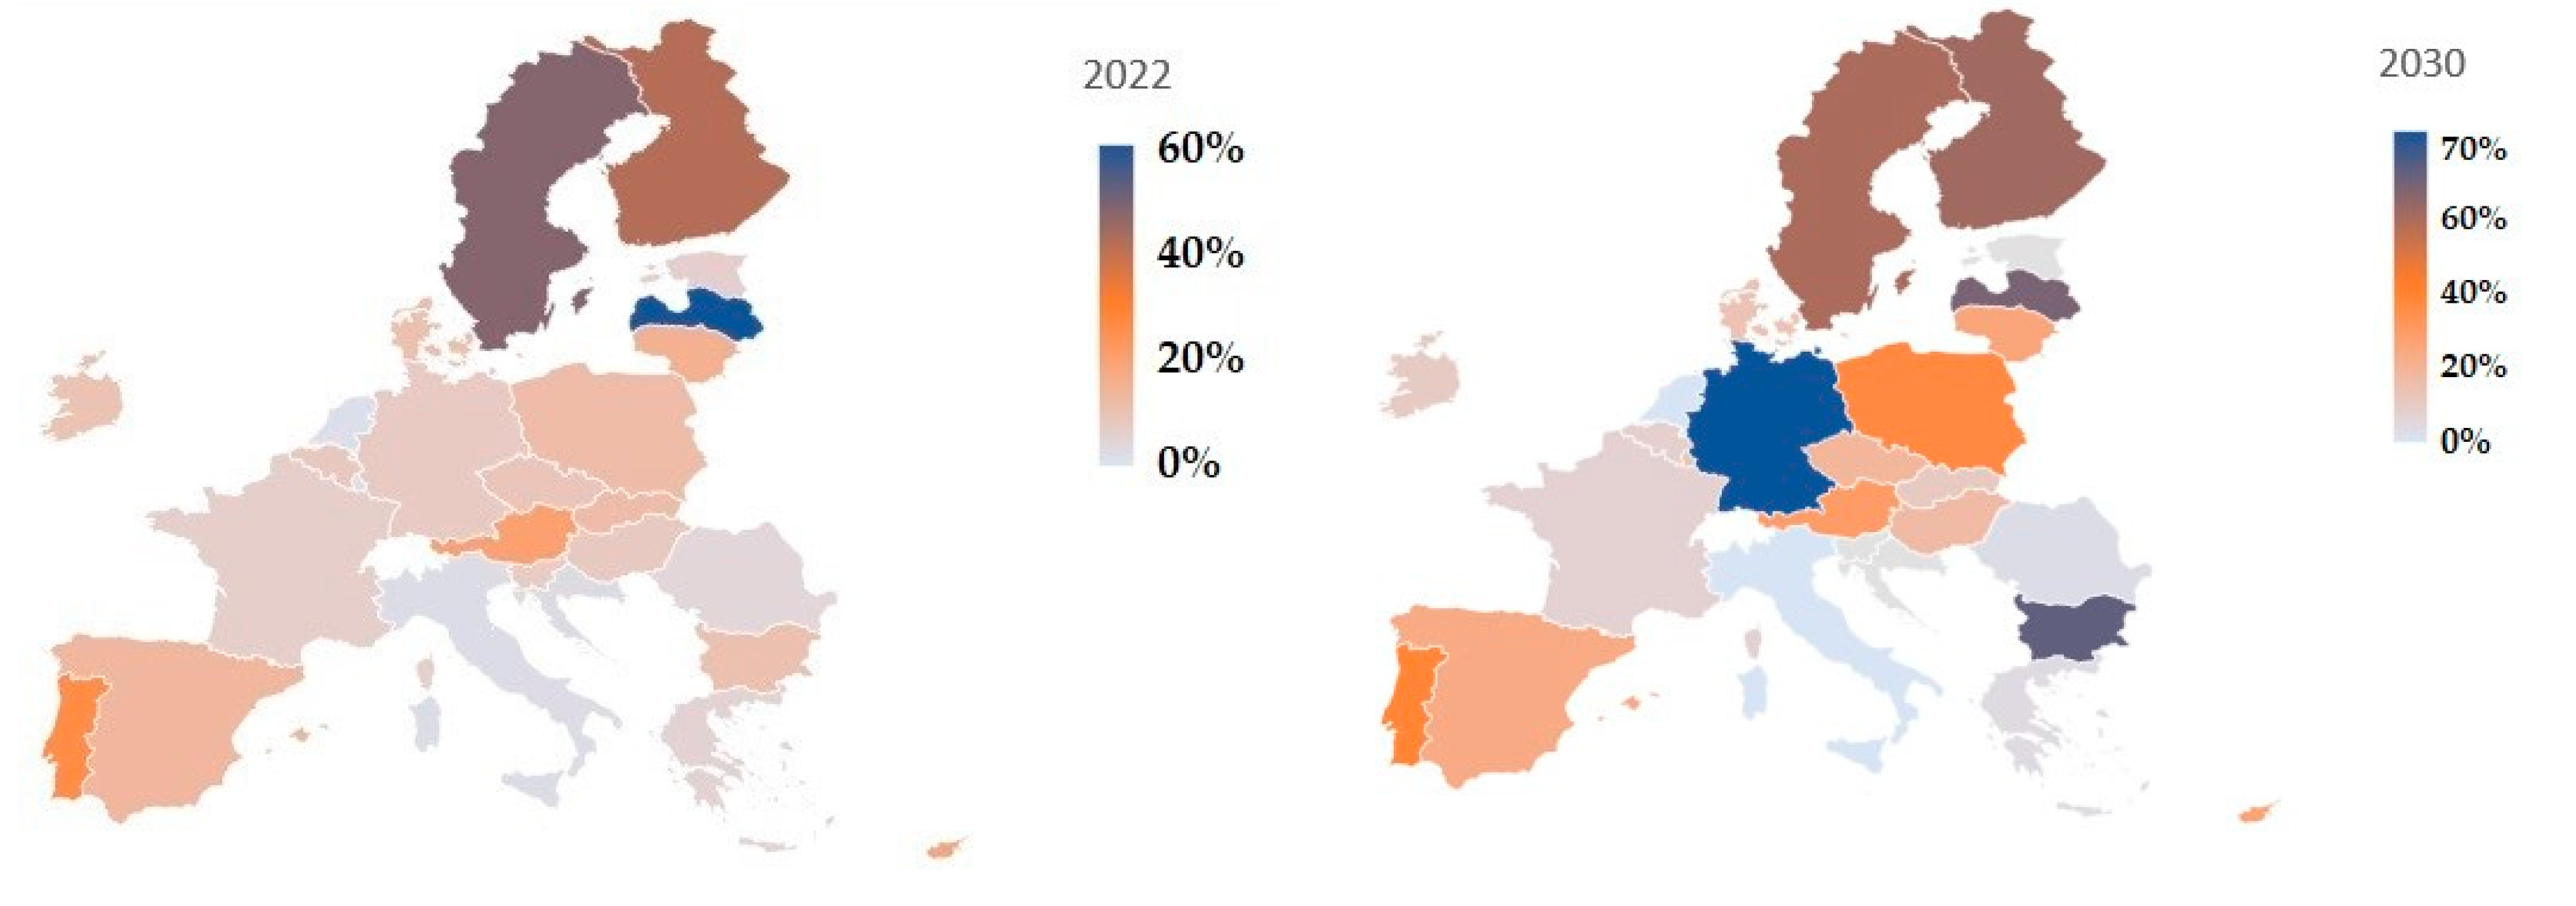
Figure 6 provides a geographical overview of EU countries with respect to the proportion of RES in energy consumption within industrial sectors. Notably, the Scandinavian countries, characterized by mountainous terrain and sparse populations, exhibit a favorable positioning in the pursuit of renewable energy goals. The topographical features of these regions may facilitate the exploitation of specific renewable energy sources, such as hydropower, which is abundant in mountainous areas. Moreover, the lower population density prevalent in these regions may contribute to a smoother transition and implementation of renewable technologies.
It can be observed that densely populated countries with relatively flat terrain face a more arduous trajectory in achieving renewable energy objectives, as evidenced by the data. The absence of natural advantages, such as mountainous terrain conducive to hydropower or ample sunlight conducive to solar energy, coupled with higher population densities, poses challenges to the expeditious attainment of renewable targets. Italy, exemplifying one of these countries, is notable for its distinctive characteristics and the associated challenges in transitioning to renewable energy.
While not explicitly stated, it is evident that sun-rich southern countries may possess inherent advantages in embracing solar energy owing to their climatic conditions. The data, by delineating the proportion of renewable energy sources (RES), implicitly acknowledges the potential contribution of regions abundant in solar resources to the renewable energy spectrum. However, it is imperative to recognize that the data may not offer a granular breakdown of each renewable source and factors such as the solar energy potential might not be explicitly underscored.
Summing up, the biophysical and economic factors delineated in the data underscore the intricate nexus of geographical, demographic, and environmental elements that influence the uptake of renewable energy across EU countries. Disparities between mountainous sparsely populated regions and densely populated less geographically favored areas contribute to variations in the observed share of RES within the industrial landscape. Thus, the data serve as a valuable instrument for apprehending the nuanced panorama of renewable energy adoption in the EU, elucidating regional dynamics that may impinge upon policy formulation and strategic deliberations.
In scrutinizing the geographical positioning of countries predicated on the extent of renewable energy sources (RES) utilization within the industry (Figure 6) to address RQ4, it is discernible that a clear demarcation between “old” and “new” member states within the EU is lacking. Although, in 2022, western European Union countries exhibited higher RES utilization indicators within the industry vis-à-vis central and eastern European Union countries; the latter are characterized by a swifter pace of growth in renewable energy sources and a concomitant decline in the energy intensity of industrial production. The latter aspect assumes critical significance in this context. Additionally, it is pertinent to note that countries in southern Europe, such as Malta, Croatia, Greece, and Romania, grapple particularly with the share of RES in total energy consumption within the industry. Bleak developmental prospects in this regard are also anticipated for countries like France, Italy, or Luxembourg by 2030. Conversely, countries situated in the northern realm of the EU, such as Sweden, Finland, and Latvia, are anticipated to exhibit commendable performance in this domain. Germany and Cyprus also fall within this cohort, with Cyprus standing as an exception within its region.

5. Discussion

The authors investigated trends in the share of renewable energy sources (RES) within the EU industry (contributing over 30% of total energy output) in the context of climate goals for RES and industrial decarbonization. They analyzed time series data (1995–2022) on production, energy consumption, and RES penetration in industrial energy use. Based on these trends, they forecasted the RES share in 2030. Their findings suggest that energy efficiency and reduced energy intensity are crucial for increasing the RES share in final industrial energy consumption, particularly critical for the energy-intensive industrial sector. This is especially pronounced in “new” EU countries with declining trends, aligning with Pianta and Lucchese’s [15] observation of eastern European economies’ resistance to technological change. However, broader RES adoption requires further development, as emphasized by the European Green Deal and the existing literature [27,28].
The study leverages data from reputable sources like Eurostat, the European Commission, and the International Energy Agency, providing information on production, energy consumption, and RES penetration in industry. However, critical evaluation of data quality is crucial. While Eurostat offers comprehensive and standardized data collection, potential biases or discrepancies might arise due to variations in reporting practices among EU member states. These variations, coupled with time lags in data availability, could limit the analysis’ accuracy and real-time assessment of trends.
While focusing on industrial production and energy consumption is fundamental, incorporating additional variables can offer a richer understanding of RES adoption. Policy incentives, a key driver of the renewable energy transition, should be analyzed. Examining the presence and effectiveness of supporting policies could illuminate the regulatory landscape influencing industrial practices. Additionally, evaluating the impact of specific policies or their absence would strengthen the study’s robustness.
The dynamic nature of advancements in renewable energy technologies significantly influences adoption rates. Integrating data on the evolution of these technologies, efficiency improvements, and breakthroughs would enable a more nuanced analysis. This would reveal how technological progress aligns with observed trends in RES adoption.
Economic factors, particularly the cost-effectiveness of RES compared to traditional sources, are critical for industries. Integrating economic variables like the costs of renewable technologies, subsidies, and fossil fuel prices would provide valuable insights into the economic drivers shaping industrial decisions regarding energy sources.
The study aligns with the existing literature [52] highlighting the link between renewable energy (RES) investments and reduced carbon emissions. The observed increase in RES share within industrial energy use aligns with the decarbonization initiatives of the European Commission and individual EU countries. However, the research suggests that current trends in RES development and industrial energy intensity reduction might not guarantee the achievement of the European Green Deal (EGD) goals for EU industry. Forecasts indicate that only five countries and three national targets will reach the EGD’s 42.5% RES target by 2030. The European Commission’s recommendation [10] for a 1.1 percentage point annual increase in industrial RES use appears overly ambitious compared to current trends. Only nine countries had forecasts suggesting this growth rate, highlighting the need for intensified efforts across the EU. The lack of national long-term strategies (up to 2050) in several member states further underscores the need for action.
The paper aligns with energy transition theory [119,120] by emphasizing industrial modernization and green transformation as crucial for achieving EGD’s decarbonization goals. The observed positive trends in industrial production, particularly the exponential growth in central and eastern European (CEE) countries, resonate with the theory’s acknowledgment of dynamic energy transitions across regions [121]. Additionally, the identification of challenges faced by different EU regions, particularly the nuanced difficulties encountered by CEE countries due to historical fossil fuel dependence, aligns with the theory’s recognition of socio-political and economic barriers. The theory emphasizes the non-uniform nature of energy transitions across regions and the paper reflects this by highlighting the varying complexities faced by EU member states. This study, therefore, bridges theory and empirical analysis, offering a nuanced perspective on the multifaceted nature of industrial decarbonization within the EU.
The paper’s findings contribute to understanding RES adoption within the EU’s industrial sector through the lens of Innovation Diffusion Theories [122]. Notably, Everett Rogers’ Diffusion of Innovations theory explores how new ideas and technologies spread within a social system [123].
The observed trends align with the theory’s stages. The positive production growth, particularly in central and eastern Europe (CEE), suggests a transition from early adopters to a broader segment integrating RES. Similarly, the decrease in energy intensity across all countries reflects the diffusion of energy-efficient practices and technologies. This aligns with the theory’s emphasis on early adopters influencing others [99,124,125,126,127,128,129]. For instance, highly energy-intensive sectors may adopt best practices to introduce environmental strategies [129].
However, the paper also highlights challenges faced by eastern European regions. These resonate with the concept of diffusion gaps, where adoption rates differ due to factors like economic conditions, infrastructure, and policy support [122]. The paper’s identification of stronger barriers in eastern Europe aligns with the theory’s recognition of varying adoption patterns across contexts.
The paper’s findings on industrial decarbonization and “green” technology development offer crucial insights for reducing carbon emissions. The analysis of RES trends across the EU underscores the importance of such strategies for achieving climate goals, particularly those outlined in the European Green Deal.
The observed positive trends in industrial production, particularly the strong growth in central and eastern European (CEE) countries, suggest a shift toward a more sustainable and energy-efficient industrial landscape. The concurrent increase in RES use and reduction in energy intensity across all EU countries aligns with the broader goal of industrial decarbonization. This emphasizes the importance of energy efficiency as a cornerstone of transitioning to cleaner energy sources.
The paper underscores the challenges faced by different EU regions, particularly those in eastern Europe with a historical dependence on fossil fuels. These regional disparities highlight the need for targeted policies and support mechanisms. Tailored approaches can facilitate industrial decarbonization and green technology adoption in areas with unique socio-political and economic challenges.
The identified challenges and opportunities resonate with the broader discourse on the green transition. Both the development of renewable energy sources and reductions in energy intensity are widely recognized as crucial elements for achieving decarbonization goals. This paper bridges the gap between theory and empirical analysis, providing a nuanced perspective on the multifaceted nature of industrial decarbonization within the EU. The paper’s emphasis on industrial modernization and green transformation aligns with the European Green Deal’s objectives. Additionally, the identified challenges, such as disparities in regional adoption rates and the potential influence of factors like Jevon’s paradox and the energy cost of depleting materials, enrich our understanding of the complexities involved in achieving sustainable industrial practices.
The analysis of regional disparities within EU countries regarding decarbonization efforts reveals intricate dynamics influenced by various factors. One key aspect is industrial composition, where different regions often have distinct economic structures and industrial specializations. The concentration of energy-intensive industries in certain regions, such as manufacturing hubs, may present challenges due to their inherent production processes and energy demands. Conversely, regions with a more diversified industrial landscape or a higher prevalence of cleaner industries may find decarbonization easier.
Resource availability is another critical factor contributing to regional variations. Regions with abundant renewable energy resources, such as wind or solar potential, have a natural advantage in adopting these sources for industrial processes. Conversely, regions lacking such resources may face difficulties in achieving a significant share of renewables in their energy mix. Resource availability also extends to raw materials necessary for renewable technologies, potentially influencing the feasibility of widespread adoption. Finally, infrastructure development plays a pivotal role in shaping regional decarbonization efforts. Well-established infrastructure, including energy grids, transportation networks, and research institutions, can facilitate the integration of renewable energy sources. Regions with advanced infrastructure are likely to experience smoother transitions to cleaner energy practices, while those facing infrastructure bottlenecks may encounter hurdles in implementing and scaling up renewable energy solutions.
Historical dependence on fossil fuels and legacy industrial infrastructure further exacerbate regional disparities. Regions with entrenched reliance on traditional energy sources may find transitioning away from established practices particularly challenging, necessitating more comprehensive decarbonization efforts. These findings hold significant implications for future EU policy development and industrial strategies. Policymakers and industry stakeholders should leverage these insights to formulate effective and targeted approaches for achieving decarbonization goals.
Acknowledging regional variations in decarbonization efforts is crucial. A “one-size-fits-all” approach is unlikely to be successful given the diverse industrial landscapes and resource availability across EU regions. Tailoring policies to address the specific challenges and opportunities of each region can significantly enhance the likelihood of successful decarbonization. Policy development should extend beyond traditional measures focused solely on production and energy usage. Encompassing targeted policies that consider factors like industrial composition, resource availability, and infrastructure development is vital. Examples include providing incentives for cleaner technologies, supporting research and development in resource-constrained regions, and investing in infrastructure upgrades. These measures can act as catalysts for the transition to renewable energy sources.
Policymakers should also pay close attention to the economic aspects of decarbonization. Recognizing the potential economic impact on regions heavily reliant on traditional industries is essential. Implementing “just transition” strategies that offer support for reskilling, job creation in clean energy sectors, and community development can mitigate the socio-economic challenges associated with decarbonization. Collaboration between policymakers, industry stakeholders, and research institutions is imperative. Fostering a conducive environment for innovation and technology transfer can accelerate the adoption of renewable energy sources. Industry stakeholders should actively participate in shaping policies, providing valuable insights into the practicalities of implementing sustainable practices within their sectors.
The findings also highlight the need for ongoing monitoring and evaluation of regional progress. Regular assessments can inform adaptive policymaking, allowing for timely adjustments based on the evolving dynamics of decarbonization efforts. Establishing clear benchmarks and accountability mechanisms will be instrumental in tracking the effectiveness of policies over time.

6. Conclusions

The European Green Deal [9] sets forth the paramount objective of mitigating greenhouse gas emissions and attaining climate neutrality by 2050 through decarbonization. This endeavor poses formidable challenges for European Union (EU) member states and their industrial sectors, thereby necessitating strategic responses from policymakers and business leaders. This article endeavors to scrutinize the trajectories of renewable energy incorporation within the overall energy consumption of industries across EU nations and to evaluate these trajectories within the ambit of the 2030 climate objectives pertaining to renewable energy sources (RES). To this end, secondary data sourced from Eurostat, the International Monetary Fund (IMF), and the International Energy Agency (IEA), were marshaled. This facilitated the projection of the anticipated proportion of RES within the final energy consumption of industries by the year 2030. Preceding the empirical analysis was an exhaustive literature review, which engendered several discernments.
The literature review underscored the imperative of modernizing the EU industrial landscape and prioritizing green transformation as pivotal prerequisites for achieving climate neutrality. To concretize the aspirations of the European Green Deal, nations must transition from fossil fuels to sustainable energy sources, thereby augmenting the share of renewables in industrial energy consumption. Moreover, it elucidated the formidable challenges attendant upon decarbonizing industries and integrating RES technologies within European economies [129,130,131,132,133]. Notably, these challenges exhibit nuanced variations across EU nations, with eastern European countries, owing to their historical reliance on fossil fuels, contending with more intricate and formidable barriers—political, social, and financial—than their western counterparts [29]. The literature further illuminated the potential economic and social toll associated with implementing net-zero strategies, particularly in facility modernization and transformation, which may precipitate an upsurge in energy poverty [28]. Nevertheless, amid these challenges, positive transformations are discernible as novel industrial ecosystems and advanced technologies foster enhanced energy efficiency across sectors, including industry [129,130,131,132,133]. Additionally, it posited that decarbonization is indeed attainable through the augmentation of RES utilization in energy consumption. Despite these seminal insights, the literature delineated a dearth of research on the extent of renewable energy integration within industries, prospective developmental trajectories, extending up to 2030, and analyses of the leading EU economies making strides in RES within the scrutinized sector. In a bid to redress these lacunae, the authors embarked on empirical analysis, incorporating trend analysis.
The trend analysis revealed a positive production trajectory within the industrial landscape across all EU countries, with central and eastern European nations demonstrating exponential growth particularly. Furthermore, a negative trend in energy intensity of output within the industrial sector was pervasive across all countries, indicative of heightened energy efficiency. Notably, central and eastern European countries exhibited a more pronounced reduction in energy intensity of output compared to their western counterparts. However, in response to research question RQ1, it became evident that political factors, namely the EU climate policy and its obligatory indicative targets concerning the share of RES in energy consumption, greenhouse gas mitigation, and energy efficiency, emerged as the predominant influencers on RES utilization levels within the industrial sector. Economic factors, chiefly GDP per capita levels, also exerted a discernible impact on the ‘green’ evolution of industries. Conversely, technological factors, though pertinent, assumed a subordinate role, evidencing statistical significance solely for two countries, namely Germany and Bulgaria. Secondary data scrutiny additionally divulged an upward trajectory in renewable energy consumption within industries, albeit exceptions were noted in Greece, Estonia, and Portugal. This upward trend augurs well for the transition toward sustainability.
Also, forecasting alterations in RES levels from 2022 to 2030 predicated on historical trends spanning from 1995 to 2022, revealed a projected surge in RES adoption across most EU countries. However, the research unveiled that the majority of EU nations are poised to fall short of both EU and national targets pertaining to renewable energy utilization within the industrial sector by 2030. Thus, in response to research question RQ2, it emerged that only five countries are projected to meet the EU target, with a mere three countries on track to achieve national targets by 2030. Consequently, it is inferred that while most EU countries are poised to witness an augmentation in both renewable energy consumption and the proportion of RES within final energy consumption, the extrapolated growth trajectories, based on historical trends up to 2022, are likely inadequate to realize the benchmarks set forth by the European Commission for 2030.
In investigating the inquiry posed by RQ3, “Can members of the ‘old EU’ and ‘new’ EU members achieve minimum climate goals related to RES consumption in the industry?”, it was discerned that by the year 2030, the most substantial percentage increments are anticipated in Finland, Germany, Latvia, Poland, and Bulgaria. Nevertheless, the preponderance of RES utilization will persistently be observed in Germany, Sweden, Finland, Bulgaria, Latvia, and Poland. Hence, the response to RQ3 is negative. The study addressed the query posed by RQ4: “Should the EU be assessed in terms of ‘old’ and ‘new’ EU members or regionally in achieving climate goals in the industry?”. In response to this inquiry, it was determined that no dichotomy exists within the EU between ‘old’ and ‘new’ member states concerning the escalating proportion of renewables in energy consumption within the industrial sphere. Despite the higher rates of RES consumption in western European Union countries vis-à-vis central and eastern European Union countries in 2022, the latter is characterized by a swifter pace of RES expansion and a concomitant reduction in the energy intensity of industrial production. Instead, a regional demarcation is discernible, wherein, in accordance with prevailing trends, the authors prognosticate a diminished share of RES in total energy consumption within the industry in Southern European countries juxtaposed with elevated levels in northern EU countries, Germany, and Cyprus.
Also, the paper acknowledges certain research limitations. Firstly, it is noteworthy that this paper refrains from analyzing climate policy, although such an investigation would undoubtedly furnish valuable insights. Additionally, it must be underscored that trends are inherently mutable and susceptible to alteration. Consequently, the conclusions drawn herein are predicated on the presumption of trend constancy. As for future research avenues, it would be judicious to delve into how individual state policy instruments underpin the development of RES in the industrial sector moving forward.
The study’s limitation is intertwined with the reliance on historical trends from 1995 to 2022 to forecast future evolutions up to 2030. While historical data proffer invaluable insights, they may not comprehensively encapsulate emergent trends or abrupt shifts in the renewable energy landscape that could impinge upon the accuracy of long-term prognostications. Another constraint arises from the study’s exclusive focus on trends in the share of renewable energy sources in the industrial sector, thereby neglecting other facets of renewable energy integration, such as technological advancements, economic viability, or societal acceptance, which could furnish a more holistic perspective of the challenges and opportunities therein.
Acknowledgment of potential limitations and biases is imperative. Primarily, it is essential to reckon with the potential variability and inconsistency in data reporting by member states to Eurostat. Discrepancies in methodologies, data collection procedures, and reporting standards among EU nations could introduce variability and undermine the overall reliability of the aggregated data. Additionally, while Eurostat provides extensive data, the granularity of certain variables may be limited, potentially obscuring nuances within industrial sub-sectors or the types of renewable energy sources employed. The inherent time lag in data availability constitutes a notable limitation. The study scrutinizes data up to 2022 and, given the dynamism of changes in the renewable energy landscape, more recent developments or policy interventions may not be fully captured. The projection for 2030 rests on the premise of sustained trends, which may not adequately account for potential abrupt shifts in policies or technologies.
The principal scientific merit of this paper resides in its exhaustive analysis of the trends in the share of renewable energy sources (RES) in the industrial sector across European Union (EU) nations and the attendant factors influencing them. By elucidating the challenges and opportunities germane to attaining climate goals delineated in the European Green Deal, the study augments the collective understanding of sustainable energy transitions. Its scholarly value is further underscored by its holistic examination of the extant status, impediments, and prospective trajectories of integrating renewable energy sources into the industrial milieu of EU countries, thereby furnishing insights that can apprise policymakers, researchers, and industry stakeholders alike.

Author Contributions

Conceptualization, B.G., R.W., R.N. and B.Ž.; methodology, R.N.; validation, B.G., R.W., R.N. and B.Ž.; formal analysis, R.N., B.G., R.W. and B.Ž.; investigation, B.G., R.W., R.N. and B.Ž.; resources, R.N., B.G. and R.W.; data curation, B.G., R.W., R.N. and B.Ž.; writing—original draft preparation, B.G., R.W., R.N. and B.Ž.; writing—review and editing, R.W., B.G., R.N., D.B. and W.W.G.; visualization, B.G., R.W., R.N., B.Ž. and D.B.; supervision, B.G., R.W., R.N. and B.Ž.; project administration, R.N., B.G. and R.W.; and funding acquisition, R.W. All authors have read and agreed to the published version of the manuscript.

Funding

This research received no external funding.

Data Availability Statement

Data are contained within the article.

Conflicts of Interest

The authors declare no conflicts of interest.

References

  1. Document 52011DC0885. Communication from the Commission to the European Parliament, the Council, the European Economic and Social Committee and the Committee of the Regions Energy Roadmap 2050/COM/2011/0885 Final. Available online: https://eur-lex.europa.eu/legal-content/EN/ALL/?uri=CELEX%3A52011DC0885 (accessed on 5 December 2023).
  2. European Council. Fit for 55. 2021. Available online: https://www.consilium.europa.eu/en/policies/green-deal/fit-for-55/ (accessed on 10 February 2024).
  3. European Commission. Communication from the Commission to the European Parliament, the European Council, the Council, the European Economic and Social Committee and the Committee of the Regions: The European Green Deal (COM/2019/640 Final). 2019. Available online: https://eur-lex.europa.eu/legal-content/EN/TXT/?uri=COM%3A2019%3A640%3AFIN (accessed on 10 February 2024).
  4. CBAM Regulation (EU) 2023/956 of the European Parliament and of the Council of 10 May 2023 Establishing a Carbon Border Adjustment Mechanism, L 130/52 [EN], Official Journal of the European Union 16.5.2023. Available online: https://eur-lex.europa.eu/legal-content/EN/TXT/PDF/?uri=CELEX:32023R0956 (accessed on 10 February 2024).
  5. Commission Communication of 10 January 2007: “Renewable Energy Road Map. Renewable Energies in the 21st Century: Building a More Sustainable Future” [COM(2006) 848 Final—Not Published in the Official Journal]. Available online: https://eur-lex.europa.eu/legal-content/EN/ALL/?uri=celex:52006DC0848 (accessed on 10 February 2024).
  6. The Net-Zero Industry Act: Accelerating the Transition to Climate Neutrality, 16 March 2023. Available online: https://single-market-economy.ec.europa.eu/industry/sustainability/net-zero-industry-act_en (accessed on 10 February 2024).
  7. Eurostat. Available online: https://ec.europa.eu/eurostat/databrowser/view/nrg_bal_s__custom_8856531/default/table?lang=en (accessed on 5 December 2023).
  8. IEA. International Energy Outlook 2023 with Projections to 2050. U.S. Energy Information Administration. 2023. Available online: https://www.eia.gov/outlooks/ieo/data.php (accessed on 5 December 2023).
  9. European Commission. Climate Action: 2050 Long-Term Strategy. Available online: https://ec.europa.eu/clima/policies/strategies/2050_en (accessed on 22 June 2020).
  10. European Commission. Leading the Clean Industrial Revolution. 2021. Available online: https://ec.europa.eu/commission/presscorner/detail/%5Beuropa_tokens:europa_interface_language%5D/fs_21_3675 (accessed on 13 December 2023).
  11. European Commission. National Long-Term Strategies. 2023. Available online: https://commission.europa.eu/energy-climate-change-environment/implementation-eu-countries/energy-and-climate-governance-and-reporting/national-long-term-strategies_en#national-long-term-strategies (accessed on 13 December 2023).
  12. IRENA. Global Energy Transformation: A Roadmap to 2050, International Renewable Energy Agency, Abu Dhabi. 2018. Available online: https://www.irena.org/-/media/Files/IRENA/Agency/Publication/2018/Apr/IRENA_Report_GET_2018.pdf (accessed on 13 December 2023).
  13. Murtaugh, D. “China Is the Emissions Behemoth. Can it Change Fast Enough?” Bloomberg Green, 21 January 2020. Available online: https://www.bloomberg.com/news/articles/2020-01-21/where-china-stands-on-climatetarget-goals-from-5-year-plan (accessed on 25 August 2020).
  14. Accelerating America’s Green Transition, 12 September 2019. Available online: https://www.greeninvestmentgroup.com/en/projects-and-perspectives/accelerating-americas-green-transition.html (accessed on 10 February 2024).
  15. Pianta, M.; Lucchese, M. Rethinking the European green Deal: An industrial policy for a just transition in Europe. Rev. Radic. Political Econ. 2020, 52, 633–641. [Google Scholar] [CrossRef]
  16. European Commission. Circular Economy Action Plan. 2023. Available online: https://environment.ec.europa.eu/strategy/circular-economyaction-plan_en (accessed on 10 February 2024).
  17. van Diemen, R.; Matthews, J.B.R.; Möller, V.; Fuglestvedt, J.S.; Masson-Delmotte, V.; Méndez, C.; Reisinger, A.; Semenov, S. (Eds.) IPCC, 2022: Annex I: Glossary Archived 13 March 2023 at the Wayback Machine. In IPCC, 2022: Climate Change 2022: Mitigation of Climate Change. Contribution of Working Group III to the Sixth Assessment Report of the Intergovernmental Panel on Climate Change Archived 2 August 2022 at the Wayback Machine; Shukla, P.R., Skea, J., Slade, R., Al Khourdajie, A., van Diemen, R., McCollum, D., Pathak, M., Some, S., Vyas, P., Fradera, R., et al., Eds.; Cambridge University Press: Cambridge, UK; New York, NY, USA, 2022. [Google Scholar] [CrossRef]
  18. Victoria, M.; Zhu, K.; Brown, T.; Andresen, G.B.; Greiner, M. Early decarbonization of the European energy system pays off. Nat. Commun. 2020, 11, 6223. [Google Scholar] [CrossRef] [PubMed]
  19. Jarosławska-Sobór, S. Decarbonization—Origins and Evolution of The Process on the European Level. J. Sustain. Min. 2021, 20, 250–259. [Google Scholar] [CrossRef]
  20. Drummond, P.; Ekins, P. Cost-effective decarbonization in the EU: An overview of policy suitability. Clim. Policy 2017, 17, S51–S71. [Google Scholar] [CrossRef]
  21. Adler, D.; Wargan, P. Decarbonization without democracy: Tennis-ball politics and the EU Green Deal. In Routledge Handbook on the Green New Deal; Routledge: London, UK, 2022; pp. 299–314. [Google Scholar]
  22. Coghlan, C.; Bricout, A.; Velasco, L.R.; Trottier-Chi, C.; Makuch, Z. A Justice-Driven Approach to EU Power Sector Decarbonization. Eur. Energy Environ. Law Rev. 2022, 31, 70–104. [Google Scholar]
  23. Gajdzik, B.; Wolniak, R.; Grebski, W.W. Electricity and Heat Demand in Steel Industry Technological Processes in Industry 4.0 Conditions. Energies 2023, 16, 787. [Google Scholar] [CrossRef]
  24. Bhaskar, A.; Abhishek, R.; Assadi, M.; Somehesaraei, H.N. Decarbonizing primary steel production: Techno-economic assessment of a hydrogen based green steel production plant in Norway. J. Clean. Prod. 2022, 350, 131339. [Google Scholar] [CrossRef]
  25. Birat, J.P. Innovation paradigms for the steel industry of the 21st Century—Future directions for steel industry and continuous casting. La Rev. Metall.–CIT 2002, 99, 957. [Google Scholar] [CrossRef]
  26. Quadera, M.; Ahmed, S.; Ghazillaa, R.; Ahmed, S.; Dahari, M. A comprehensive review on energy efficient CO2 breakthrough technologies for sustainable green iron and steel manufacturing. Renew. Sustain. Energy Rev. 2015, 50, 594–614. [Google Scholar] [CrossRef]
  27. Clean Energy for All Europeans—Unlocking Europe’s Growth Potential. IP_16_4009. European Commission, Brussel. 2016. Available online: https://europa.eu/rapid/press-release_IP-16-4009_en.htm (accessed on 15 October 2023).
  28. Energy Roadmap 2050; Publications Office of the European Union, European Commission: Luxembourg; Brussels, Belgium, 2012.
  29. Schiffer, Z.J.; Manthiram, K. Electrification and Decarbonization of the Chemical Industry. Joule 2017, 1, 10–14. [Google Scholar] [CrossRef]
  30. Agora Energiewende; Wuppertal Institute. Breakthrough Strategies for Climate-Neutral Industry in Europe: Policy and Technology Pathways for Raising EU Climate Ambition, Berlin 2021, p. 30. Available online: https://static.agora-energiewende.de/fileadmin/Projekte/2020/2020_10_Clean_Industry_Package/A-EW_197_Strategies-Climate-Neutral-Industry-EU_Summary_WEB.pdf (accessed on 10 February 2024).
  31. UNFCCC. Adoption of the Paris Agreement. Report No. FCCC/CP/2015/L.9/Rev.1. 2015. Available online: http://unfccc.int/resource/docs/2015/cop21/eng/l09r01.pdf (accessed on 15 May 2023).
  32. Brundtland, G.H. Our Common Future, Report of the World Commission on Environment and Development, Our Common Future (Brundtland Report); Oxford University Press: New York, NY, USA, 1987. [Google Scholar]
  33. Valackienė, A.; Nagaj, R. Shared Taxonomy for the Implementation of Responsible Innovation Approach in Industrial Ecosystems. Sustainability 2021, 13, 9901. [Google Scholar] [CrossRef]
  34. Gajdzik, B.; Jaciow, M.; Wolniak, R.; Wolny, R.; Grebski, W.W. Energy Behaviors of Prosumers in Example of Polish Households. Energies 2023, 16, 3186. [Google Scholar] [CrossRef]
  35. Pacana, A.; Siwiec, D. Model to Predict Quality of Photovoltaic Panels Considering Customers’ Expectations. Energies 2022, 15, 1101. [Google Scholar] [CrossRef]
  36. Siwiec, D.; Pacana, A. Model of Choice Photovoltaic Panels Considering Customers’ Expectation. Energies 2021, 14, 5977. [Google Scholar] [CrossRef]
  37. Rosenbloom, D. Pathways: An emerging concept for the theory and governance of low-carbon transitions. Glob. Environ. Chang. 2017, 43, 37–50. [Google Scholar] [CrossRef]
  38. Bogdanov, D.; Ram, M.; Aghahosseini, A.; Traber, T.; Breyer, C. Low-cost renewable electricity as the key driver of the global energy transition towards sustainability. Energy 2021, 227, 120467. [Google Scholar] [CrossRef]
  39. Gajdzik, B.; Wolniak, R.; Nagaj, R.; Grebski, W.W.; Romanyshyn, T. Barriers to Renewable Energy Source (RES) Installations as Determinants of Energy Consumption in EU Countries. Energies 2023, 16, 7364. [Google Scholar] [CrossRef]
  40. Monyeia, C.G.; Sovacoold, B.K.; Browne, M.A.; Jenkinsf, K.E.H.; Viririb, S.; Li, Y. Justice, poverty, and electricity decarbonization. Electr. J. 2019, 32, 47–51. [Google Scholar] [CrossRef]
  41. Regulation (EU) 2023/955 Establishing a Social Climate Fund, Regulation (EU) 2023/955 of the European Parliament and of the Council of 10 May 2023 Establishing a Social Climate Fund and Amending Regulation (EU) 2021/1060. Available online: https://climate-laws.org/document/regulation-eu-2023955-establishing-a-social-climate-fund-ce42 (accessed on 10 February 2024).
  42. Industrial Decarbonization Network 06/14/2022. Available online: https://www.industrialdecarbonizationnetwork.com/leadership-strategy/articles/the-4-pathways-to-industrial-decarbonization (accessed on 10 February 2024).
  43. Deloitte Report: The 2030 Decarbonization Challenge the Path to the Future of Energy. Available online: https://www2.deloitte.com/pl/pl/pages/energy-and-resources/articles/dekarbonizacja-i-rozwoj-odnawialnych-zrodel-energii.html (accessed on 10 February 2024).
  44. European Commission. Finance and the Green Deal. 2023. Available online: https://commission.europa.eu/strategy-and-policy/priorities-2019-2024/european-green-deal/finance-and-green-deal_en (accessed on 10 February 2024).
  45. Pacana, A.; Siwiec, D.; Sprinc, L.; Krasnici, D. Simplified model supporting decisionmaking considering the criteria of sustainable development and life cycle assessment (LCA). Acta Montan. Slovaca 2023, 28, 408–423. [Google Scholar]
  46. European Commission. EU Taxonomy for Sustainable Activities. 2023. Available online: https://finance.ec.europa.eu/sustainable-finance/tools-and-standards/eu-taxonomysustainable-activities_en (accessed on 10 February 2024).
  47. Industrial Transformation 2050—Towards an Industrial Strategy for a Climate Neutral Europe. Institute for European Studies, Vrije Universiteit Brussel. Available online: https://www.ies.be/files/Industrial_Transformation_2050_0.pdf (accessed on 20 November 2023).
  48. Sartal, A.; Bellas, R.; Mejías, A.M.; García-Collado, A. The sustainable manufacturing concept, evolution and opportunities within Industry 4.0: A literature review. Adv. Mech. Eng. 2020, 12, 1687814020925232. [Google Scholar] [CrossRef]
  49. Bag, S.; Pretorius, J.H.C. Relationships between industry 4.0, sustainable manufacturing and circular economy: Proposal of a research framework. Int. J. Organ. Anal. 2020, 30, 864–898. [Google Scholar] [CrossRef]
  50. EC: European Commission. Industry 5.0 Towards a Sustainable, Human Centric and Resilient European Industry; Manuscript completed in January 2021; European Commission: Brussels, Belgium, 2021; p. 14. [Google Scholar]
  51. Branca, T.A.; Fornai, B.; Murri, M.M.; Streppa, E.; Schröder, A.J. The Challenge of Digitalization in the Steel Sector. Metals 2020, 10, 288. [Google Scholar] [CrossRef]
  52. Kermeli, K.; Crijns-Graus, W.; Johannsen, R.M.; Mathiesen, B.V. Energy efficiency potentials in the EU industry: Impacts of deep decarbonization technologies. Energy Effic. 2022, 15, 68. [Google Scholar] [CrossRef]
  53. Khatiwada, D.; Vasudevan, R.A.; Santos, B.H. Decarbonization of natural gas systems in the EU—Costs, barriers, and constraints of hydrogen production with a case study in Portugal. Renew. Sustain. Energy Rev. 2022, 168, 112775. [Google Scholar] [CrossRef]
  54. Wang, Z.; Li, J.; Wang, B.; Hui, N.S.; Lu, B.; Wang, C.; Xu, S.; Zhou, Z.; Zhang, B.; Zheng, Y. The decarbonization pathway of power system by high-resolution model under different policy scenarios in China. Appl. Energy 2024, 355, 122235. [Google Scholar] [CrossRef]
  55. Roginko, S.A. EU green steel deal: Maneuvers on the decarbonization track. Chernye Met. 2022, 11, 66–72. [Google Scholar] [CrossRef]
  56. Sovacool, B.K.; Del Rio, D.F.; Zhang, W. The political economy of net-zero transitions: Policy drivers, barriers, and justice benefits to decarbonization in eight carbon-neutral countries. J. Environ. Manag. 2023, 347, 119154. [Google Scholar] [CrossRef] [PubMed]
  57. Plazas-Niño, F.A.; Yeganyan, R.; Cannone, C.; Howells, M.; Quirós-Tortós, J. Informing sustainable energy policy in developing countries: An assessment of decarbonization pathways in Colombia using open energy system optimization modelling. Energy Strategy Rev. 2023, 50, 101226. [Google Scholar] [CrossRef]
  58. Yeung, G.; Liu, Y. Local government policies and public transport decarbonization through the production and adoption of fuel cell electric vehicles (FCEVs) in China. J. Clean. Prod. 2023, 422, 138552. [Google Scholar] [CrossRef]
  59. Huang, L.; Long, Y.; Chen, J.; Yoshida, Y. Sustainable lifestyle: Urban household carbon footprint accounting and policy implications for lifestyle-based decarbonization. Energy Policy 2023, 181, 113696. [Google Scholar] [CrossRef]
  60. Kafetzis, A.; Bampaou, M.; Kardaras, G.; Panopoulos, K. Decarbonization of Former Lignite Regions with Renewable Hydrogen: The Western Macedonia Case. Energies 2023, 16, 7029. [Google Scholar] [CrossRef]
  61. Issa, M.; Ilinca, A.; Rousse, D.R.; Boulon, L.; Groleau, P. Renewable Energy and Decarbonization in the Canadian Mining Industry: Opportunities and Challenges. Energies 2023, 16, 6967. [Google Scholar] [CrossRef]
  62. Hoseinzadeh, S.; Astiaso Garcia, D.; Huang, L. Grid-connected renewable energy systems flexibility in Norway islands’ Decarbonization. Renew. Sustain. Energy Rev. 2023, 185, 113658. [Google Scholar] [CrossRef]
  63. Carmona-Martínez, A.A.; Bartolomé, C.; Jarauta-Córdoba, C.A. The Role of Biogas and Biomethane as Renewable Gases in the Decarbonization Pathway to Zero Emissions. Energies 2023, 16, 6164. [Google Scholar] [CrossRef]
  64. Paraschiv, L.S.; Paraschiv, S. Contribution of renewable energy (hydro, wind, solar and biomass) to decarbonization and transformation of the electricity generation sector for sustainable development. Energy Rep. 2023, 9, 535–544. [Google Scholar] [CrossRef]
  65. Meraj, S.T.; Yu, S.S.; Rahman, M.S.; Hossain Lipu, M.S.; Trinh, H. Energy management schemes, challenges and impacts of emerging inverter technology for renewable energy integration towards grid decarbonization. J. Clean. Prod. 2023, 405, 137002. [Google Scholar] [CrossRef]
  66. Yan, C.; Murshed, M.; Ozturk, I.; Ghardallou, W.; Khudoykulov, K. Decarbonization blueprints for developing countries: The role of energy productivity, renewable energy, and financial development in environmental improvement. Resour. Policy 2023, 83, 103674. [Google Scholar] [CrossRef]
  67. Zhao, C.; Wang, J.; Dong, K.; Wang, K. How does renewable energy encourage carbon unlocking? A global case for decarbonization. Resour. Policy 2023, 83, 103622. [Google Scholar] [CrossRef]
  68. Romasheva, N.; Cherepovitsyna, A. Renewable Energy Sources in Decarbonization: The Case of Foreign and Russian Oil and Gas Companies. Sustainability 2023, 15, 7416. [Google Scholar] [CrossRef]
  69. Yu, B.; Fang, D.; Xiao, K.; Pan, Y. Drivers of renewable energy penetration and its role in power sector’s deep decarbonization towards carbon peak. Renew. Sustain. Energy Rev. 2023, 178, 113247. [Google Scholar] [CrossRef]
  70. Hossain, M.R.; Singh, S.; Sharma, G.D.; Apostu, S.-A.; Bansal, P. Overcoming the shock of energy depletion for energy policy? Tracing the missing link between energy depletion, renewable energy development and decarbonization in the USA. Energy Policy 2023, 174, 113469. [Google Scholar] [CrossRef]
  71. Rao, C.; Wei, X.; Xiao, X.; Shi, Y.; Goh, M. Oversampling method via adaptive double weights and Gaussian kernel function for the transformation of unbalanced data in risk assessment of cardiovascular disease. Inf. Sci. 2024, 665, 120410. [Google Scholar] [CrossRef]
  72. Rao, C.; Xu, Y.; Xiao, X.; Hu, F.; Goh, M. Imbalanced customer churn classification using a new multi-strategy collaborative processing method. Expert Syst. Appl. 2024, 247, 123251. [Google Scholar] [CrossRef]
  73. Xiao, Q.; Gao, M.; Chen, L.; Jiang, J. Dynamic multi-attribute evaluation of digital economy development in China: A perspective from interaction effect. Technol. Econ. Dev. Econ. 2023, 29, 1728–1752. [Google Scholar] [CrossRef]
  74. Adun, H.; Ishaku, H.P.; Jazayeri, M.; Dagbasi, M.; Olusola, B.; Okoye, T.; Dike, G.C. Decarbonization of EU energy sector: Techno-feasibility analysis of 100% renewables by 2050 in Cyprus. Clean Technol. Environ. Policy 2022, 24, 2801–2824. [Google Scholar] [CrossRef]
  75. Zeng, B.; Wang, W.; Zhang, W.; Wang, Y.; Tang, C.; Wang, J. Optimal configuration planning of vehicle sharing station-based electro-hydrogen micro-energy systems for transportation decarbonization. J. Clean. Prod. 2023, 387, 135906. [Google Scholar] [CrossRef]
  76. Aktas, T.U.; Shi, J.; Lim, G.J.; D’Agostino, F.; Liang, C. Decarbonization of the Maritime Transportation Systems: Recent Progress, Challenges, and Prospects. In Proceedings of the 2023 IEEE Electric Ship Technologies Symposium, ESTS 2023, Old Town Alexandria, VA, USA, 1–4 August 2023; pp. 224–230. [Google Scholar]
  77. Ali, Q.; Di Silvestre, M.L.; Lombardi, P.; Sanseverino, E.R.; Zizzo, G. The Role of Renewable Energy Generation in Electric Vehicles Transition and Decarbonization of Transportation Sector. In Proceedings of the 2023 IEEE International Conference on Environment and Electrical Engineering and 2023 IEEE Industrial and Commercial Power Systems Europe, EEEIC/I and CPS Europe 2023, Madrid, Spain, 6–9 June 2023. [Google Scholar]
  78. Price, C.R.; Nimbalkar, S.U.; Thirumaran, K.; Cresko, J. Smart Manufacturing Pathways for Industrial Decarbonization and Thermal Process Intensification. Smart Sustain. Manuf. Syst. 2023, 7, 41–53. [Google Scholar] [CrossRef]
  79. Schneider, C.; Büttner, S.; Sauer, A. Optimal Selection of Decarbonization Measures in Manufacturing Using Mixed-Integer Programming. In Congress of the German Academic Association for Production Technology; Springer International Publishing: Cham, Switzerland, 2022; pp. 749–760. [Google Scholar]
  80. Powell, B.; Milton, N. Decarbonization of a Large Brownfield (Electrical Products) Manufacturing Plant. In Proceedings of the AEE World Energy Conference and Expo 2022, Atlanta, GA, USA, 21–23 September 2022. [Google Scholar]
  81. Arogundade, S.; Dulaimi, M.; Ajayi, S.; Saka, A.; Ilori, O. Decarbonization of construction projects: A review and interpretive structural modelling of carbon reduction drivers. J. Eng. Des. Technol. 2023, ahead-of-print. [CrossRef]
  82. Hooper, B. All-Electric New Construction and Building Decarbonization. In Proceedings of the Air and Waste Management Association’s Annual Conference and Exhibition, AWMA, San Francisco, CA, USA, 27–30 June 2022. [Google Scholar]
  83. González Ríos, I. Towards a progressive decarbonization of construction through energy rehabilitation. Cuad. De Derecho Local 2021, 57, 82–121. [Google Scholar]
  84. Anyanwu, C.N.; Ojike, O.; Emodi, N.V.; Elochukwu, A.E.; Nnamani, U.A. Deep decarbonization options for the agriculture, forestry, and other land use (AFOLU) sector in Africa: A systematic literature review. Environ. Monit. Assess. 2023, 195, 565. [Google Scholar] [CrossRef]
  85. Pombo-Romero, J.; Rúas-Barrosa, O. A Blockchain-Based Financial Instrument for the Decarbonization of Irrigated Agriculture. Sustainability 2022, 14, 8848. [Google Scholar] [CrossRef]
  86. Feng, R.; Xu, X.; Yu, Z.-T.; Lin, Q. A machine-learning assisted multi-cluster assessment for decarbonization in the chemical fiber industry toward net-zero: A case study in a Chinese province. J. Clean. Prod. 2023, 425, 138965. [Google Scholar] [CrossRef]
  87. Barecka, M.H.; Ager, J.W. Towards an accelerated decarbonization of the chemical industry by electrolysis. Energy Adv. 2023, 2, 268–279. [Google Scholar] [CrossRef]
  88. Mallapragada, D.S.; Dvorkin, Y.; Modestino, M.A.; Aydil, E.S.; Taylor, A.D. Decarbonization of the chemical industry through electrification: Barriers and opportunities. Joule 2023, 7, 23–41. [Google Scholar] [CrossRef]
  89. Bogodukhova, E.S.; Britvina, V.V.; Gavrilyuk, A.V.; Sorokin, A.Y.; Bobrov, K.R. Trends in the development of decarbonization in energy systems using information technology. IOP Conf. Ser. Earth Environ. Sci. 2022, 990, 012007. [Google Scholar] [CrossRef]
  90. Yan, X.; Yang, C.; Zhang, R. How does green finance derive the resource efficiency and decarbonization of the economy? Resour. Policy 2023, 85, 103934. [Google Scholar] [CrossRef]
  91. Han, J.; Zhang, W.; Işık, C.; Muhammad, A.; Yan, J. General equilibrium model-based green finance, decarbonization and high-quality economic development: A new perspective from knowledge networks. Environ. Dev. Sustain. 2023. [CrossRef]
  92. Nagaj, R.; Žuromskaitė, B. Young Travellers and Green Travel in the Post-COVID Era. Sustainability 2023, 15, 13822. [Google Scholar] [CrossRef]
  93. Al Mamun, M.; Boubaker, S.; Nguyen, D.K. Green finance and decarbonization: Evidence from around the world. Financ. Res. Lett. 2022, 46, 102807. [Google Scholar] [CrossRef]
  94. Rej, S.; Bandyopadhyay, A.; Murshed, M.; Mahmood, H.; Razzaq, A. Pathways to decarbonization in India: The role of environmentally friendly tourism development. Environ. Sci. Pollut. Res. 2022, 29, 50281–50302. [Google Scholar] [CrossRef]
  95. Scott, D.; Hall, C.M.; Gössling, S. A review of the IPCC Fifth Assessment and implications for tourism sector climate resilience and decarbonization. J. Sustain. Tour. 2016, 24, 8–30. [Google Scholar] [CrossRef]
  96. Armocida, B.; Formenti, B.; Ussai, S.; Martuzzi, M.; Barone-Adesi, F. Decarbonization of the Italian healthcare system and European funds. A lost opportunity? Front. Public Health 2022, 10, 1037122. [Google Scholar] [CrossRef] [PubMed]
  97. Eurostat. Available online: https://ec.europa.eu/eurostat/databrowser/view/nama_10_a64__custom_8859016/default/table?lang=en (accessed on 5 December 2023).
  98. Anglani, N.; Di Salvo, S.R.; Oriti, G.; Julian, A.L. Steps towards Decarbonization of an Offshore Microgrid: Including Renewable, Enhancing Storage and Eliminating Need of Dump Load. Energies 2023, 16, 1411. [Google Scholar] [CrossRef]
  99. Destek, M.A.; Sinha, S. Renewable, non-renewable energy consumption, economic growth, trade openness and ecological footprint: Evidence from organisation for economic Co-operation and development countries. J. Clean. Prod. 2020, 242, 118537. [Google Scholar] [CrossRef]
  100. Koeva, D.; Kutkarska, R.; Zinoviev, V. High Penetration of Renewable Energy Sources and Power Market Formation for Countries in Energy Transition: Assessment via Price Analysis and Energy Forecasting. Energies 2023, 16, 7788. [Google Scholar] [CrossRef]
  101. Mirza, Z.T.; Anderson, T.; Seadon, J.; Brent, A. A thematic analysis of the factors that influence the development of a renewable energy policy. Renew. Energy Focus 2024, 49, 100562. [Google Scholar] [CrossRef]
  102. IMF. World Economic Outlook Database April 2024. Available online: https://www.imf.org/en/Publications/WEO/weo-database/2024/April (accessed on 27 April 2024).
  103. Eurostat. Electricity Prices for Industrial Consumers—Bi-Annual Data (until 2007). Available online: https://ec.europa.eu/eurostat/databrowser/view/nrg_pc_205_h/default/table?lang=en&category=nrg.nrg_price.nrg_pc_h (accessed on 28 April 2024).
  104. Eurostat. Electricity Prices for Non-Household Consumers—Bi-Annual Data (from 2007 Onwards). Available online: https://ec.europa.eu/eurostat/databrowser/view/nrg_pc_205__custom_11105182/default/table?lang=en (accessed on 28 April 2024).
  105. Eurostat. General Government Expenditure by Function. Available online: https://ec.europa.eu/eurostat/databrowser/view/gov_10a_exp__custom_11105433/default/table?lang=en (accessed on 28 April 2024).
  106. Eurostat. Net Greenhouse Gas Emissions. Available online: https://ec.europa.eu/eurostat/databrowser/view/sdg_13_10__custom_11104852/default/table?lang=en (accessed on 28 April 2024).
  107. Eurostat. Available online: https://ec.europa.eu/eurostat/databrowser/view/nrg_ind_eff__custom_9531378/default/table?lang=en (accessed on 26 January 2024).
  108. Eurostat. Simplified Energy Balances. Available online: https://ec.europa.eu/eurostat/databrowser/view/nrg_bal_s__custom_11097683/default/table?lang=en (accessed on 26 April 2024).
  109. Eurostat. National Accounts Aggregates by Industry. Available online: https://ec.europa.eu/eurostat/databrowser/view/nama_10_a64__custom_11097466/default/table?lang=en (accessed on 26 April 2024).
  110. Energy Institute. Statistical Review of World Energy. 2023. Available online: https://www.energyinst.org/statistical-review/ (accessed on 26 January 2024).
  111. Our World In Data, Share of Primary Energy Consumption That Comes from Renewables. Available online: https://ourworldindata.org/grapher/renewable-share-energy (accessed on 26 January 2024).
  112. Our World in Data, Modern Renewable Energy Generation by Source. Available online: https://ourworldindata.org/grapher/modern-renewable-prod (accessed on 29 April 2024).
  113. Statista. Forecast Electricity Price for Industries in Selected European Countries in 2030. Available online: https://www.statista.com/statistics/1420469/industrial-electricity-price-europe-forecast-by-country/ (accessed on 7 May 2024).
  114. European Environmental Agency. Environmental Protection Expenditure. 2023. Available online: https://www.eea.europa.eu/en/analysis/indicators/environmental-protection-expenditure-8th-eap (accessed on 3 May 2024).
  115. European Commission. The European Green Deal Striving to Be the First Climate-Neutral Continent. 2024. Available online: https://commission.europa.eu/strategy-and-policy/priorities-2019-2024/european-green-deal_en (accessed on 26 April 2024).
  116. Directive (EU) 2023/1791 of the European Parliament and of the Council of 13 September 2023 on Energy Efficiency and Amending Regulation (EU) 2023/955. OJ L 231, 20.09.2023, pp. 1–111. Available online: https://eur-lex.europa.eu/legal-content/EN/TXT/?uri=OJ:JOL_2023_231_R_0001 (accessed on 8 February 2024).
  117. Directive (EU) 2023/2413 of the European Parliament and of the Council of 18 October 2023 Amending Directive (EU) 2018/2001, Regulation (EU) 2018/1999 and Directive 98/70/EC as Regards the Promotion of Energy from Renewable Sources, and Repealing Council Directive (EU) 2015/652. OJ L, 31.10.2023, pp. 1–77. Available online: http://data.europa.eu/eli/dir/2023/2413/oj (accessed on 11 February 2024).
  118. IEA. World Energy Outlook 2023. Available online: https://iea.blob.core.windows.net/assets/86ede39e-4436-42d7-ba2a-edf61467e070/WorldEnergyOutlook2023.pdf (accessed on 27 April 2024).
  119. Lazaroiu, A.C.; Panait, C.; Popescu, C.L.; Popescu, M.O. Renewable Energy Sources for Decarbonization of Smart Cities. In Proceedings of the 2023 IEEE International Smart Cities Conference, ISC2 2023, Bucharest, Romania, 24–27 September 2023. [Google Scholar]
  120. Kamalu, K.; Wan Ibrahim, W.H.B. Towards full decarbonization: Does environmental tax and renewable energy matters in developing countries? J. Environ. Econ. Policy 2023, 1–16. [Google Scholar] [CrossRef]
  121. Anser, M.K.; Khan, K.A.; Umar, M.; Awosusi, A.A.; Shamansurova, Z. Formulating sustainable development policy for a developed nation: Exploring the role of renewable energy, natural gas efficiency and oil efficiency towards decarbonization. Int. J. Sustain. Dev. World Ecol. 2023, 31, 247–263. [Google Scholar] [CrossRef]
  122. Dumitrescu, D.G.; Horobeț, A.; Tudor, C.D.; Belașcu, L. Renewables and Decarbonization: Implications for Energy Policy in the European Union. Amfiteatru Econ. 2023, 25, 254–271. [Google Scholar] [CrossRef] [PubMed]
  123. Cormos, C.-C.; Petrescu, L.; Cormos, A.-M.; Dinca, C.; Sandru, M. Integration of renewable energy and CO2 capture and utilization technologies for decarbonization of energy intensive process industries. Comput. Aided Chem. Eng. 2023, 52, 2777–2784. [Google Scholar]
  124. Cracknell, R.; Ciatti, S.; Dorofeev, S.; McManus, K.; Nakata, K. Decarbonization of mobility, including transportation and renewable fuels. Proc. Combust. Inst. 2023, 39, 1–9. [Google Scholar] [CrossRef]
  125. Sameti, M.; Syron, E. 100% renewable industrial decarbonization: Optimal integration of solar heat and photovoltaics. Smart Energy 2022, 8, 100087. [Google Scholar] [CrossRef]
  126. Hirao, K.; Nakajima, T.; Chan, B.; Lee, H.-J. The verification of delta SCF and Slater’s transition state theory for the calculation of core ionization energy. J. Comput. Chem. 2024, 45, 183–192. [Google Scholar] [CrossRef] [PubMed]
  127. Caetano, R.V.; Marques, A.C. Could energy transition be a game changer for the transfer of polluting industries from developed to developing countries? An application of game theory. Struct. Chang. Econ. Dyn. 2023, 65, 351–363. [Google Scholar] [CrossRef]
  128. Alhammadi, K.; Marashdeh, H.; Hussain, M. Assessing the effect of innovation diffusion and technology readiness theories on attitude, behavioral intention and implementation of smart learning. Cross Cult. Strateg. Manag. 2023, 30, 657–675. [Google Scholar] [CrossRef]
  129. Gajdzik, B.; Wolniak, R.; Grebski, W. Process of Transformation to Net Zero Steelmaking: Decarbonisation Scenarios Based on the Analysis of the Polish Steel Industry. Energies 2023, 16, 3384. [Google Scholar] [CrossRef]
  130. Santos Ayllón, L.M.; Jenkins, K.E.H. Energy justice, Just Transitions and Scottish energy policy: A re-grounding of theory in policy practice. Energy Res. Soc. Sci. 2023, 96, 102922. [Google Scholar] [CrossRef]
  131. Simpson, G.; Clifton, J. Testing Diffusion of Innovations Theory with data: Financial incentives, early adopters, and distributed solar energy in Australia. Energy Res. Soc. Sci. 2017, 29, 12–22. [Google Scholar] [CrossRef]
  132. Rezgui, K.; Sellami, H.M. Using Innovation Diffusion Theory to Understand the Factors Impacting the Adoption of Competency-Based Applications. In Proceedings of the 9th 2023 International Conference on Control, Decision and Information Technologies, CoDIT 2023, Rome, Italy, 3–6 July 2023; pp. 1332–1337. [Google Scholar]
  133. Guidolin, M. Innovation Diffusion Models: Theory and Practice. In Innovation Diffusion Models: Theory and Practic; Wiley: Hoboken, NJ, USA, 2023; pp. 1–186. [Google Scholar]
Figure 1. Stages of the research process.
Energies 17 02476 g001
Figure 2. Categories of drivers of renewable energy consumption in industry.
Energies 17 02476 g002
Figure 3. Model for the extrapolation of the share of RES consumption in total final energy consumption in industry in 2030.
Energies 17 02476 g003
Figure 4. Change in the share of RES in energy consumption in the industrial sector in 2022–2030 (in percentage points).
Energies 17 02476 g004
Figure 5. Development of RES and final energy consumption in the industrial sector in 1995–2022 and the share of RES in industry consumption in the EU in 1995–2030.
Energies 17 02476 g005aEnergies 17 02476 g005bEnergies 17 02476 g005cEnergies 17 02476 g005d
Figure 6. The share of RES in final energy consumption in industry in the EU.
Energies 17 02476 g006
Table 1. Realization of decarbonization policy in selected industries.
IndustryRealization of Decarbonization Policy
Energy and Power Generation [74]Transitioning from fossil fuel-based power generation to renewable energy sources, such as wind, solar, and hydropower. Implementation of carbon capture and storage (CCS) technologies to reduce emissions from existing power plants. Establishment of targets for renewable energy capacity and carbon intensity reduction.
Transportation [75,76,77]Promoting the use of electric vehicles (EVs), hydrogen-powered vehicles, and other low-emission transport modes. Investing in charging infrastructure and renewable fuels. Setting emission standards for vehicles and incentivizing the adoption of cleaner transportation technologies.
Manufacturing [78,79,80]Implementing energy efficiency measures and adopting cleaner production processes. Incorporating renewable energy sources in manufacturing operations. Setting emission reduction targets and adopting sustainable supply chain practices.
Construction and Buildings [81,82,83]Promoting energy-efficient building design and construction. Implementing energy retrofits and upgrades for existing structures. Encouraging the use of sustainable materials and green building standards.
Agriculture and Agri-food [84,85]Encouraging sustainable farming practices, precision agriculture, and agroforestry. Implementing methane capture from livestock. Supporting the use of renewable energy in agricultural operations.
Chemical and Petrochemical [86,87,88]Investing in cleaner production technologies and processes. Reducing reliance on fossil fuels as feedstock. Implementing carbon capture and utilization (CCU) technologies.
Information and Communication Technology (ICT) [89]Promoting energy-efficient data centers, green computing, and the use of renewable energy in ICT infrastructure. Implementing measures to reduce the carbon footprint of digital technologies.
Finance and Banking [90,91,92]Incorporating environmental, social, and governance (ESG) criteria into investment decisions. Supporting green financing and investments in sustainable projects. Discouraging investments in carbon-intensive industries.
Tourism and Hospitality [93,94,95]Encouraging sustainable tourism practices, including eco-friendly accommodations and transportation. Promoting carbon offset programs for travel-related emissions.
Healthcare [96]Implementing energy-efficient practices in healthcare facilities. Reducing the carbon footprint of pharmaceutical production and distribution. Supporting research and innovation in green healthcare technologies.
Source: Authors’ own analysis on the basis of [74,75,76,77,78,79,80,81,82,83,84,85,86,87,88,89,90,91,92,93,94,95,96].
Table 2. Data sources for projected levels of independent variables in 2030.
Independent VariableSource
X1International Monetary Fund [102]. For each country, the IMF provides the forecast level of GDP per capita
X2Statista [113]. Forecast prices are given for each EU country
X3European Environmental Agency [114]
X4European Commission [115]. The EU set a target in the EU Green Deel. It is 55% lower than in 1990.
X5The target was set in Directive 2023/1791 [116]. It amounts to 992.5 Mtoe for the entire EU in the case of primary energy consumption. Compared to 2022, energy consumption levels in 2030 will be 21.0% lower.
X6The target was set in Directive 2023/1791 [116]. It amounts to 763 Mtoe in the case of final energy consumption. Compared to 2022, energy consumption levels in 2030 will be 23.3% lower.
X7Directive (EU) 2023/2413 [117] set the target at 42.5% but each country set its individual national long-term strategy [11]. The levels will be presented in the section ‘Results’.
X8International Energy Agency [118], p. 264
Table 3. Share of renewable energy use in total energy consumption in industry in the EU member states in % [102].
Country19952022Change in p.p.
Belgium1.87.45.6
Bulgaria0.19.69.5
Czechia2.68.15.5
Denmark4.09.75.7
Germany0.96.85.9
Estonia10.05.7−4.3
Ireland3.29.05.8
Greece4.84.7−0.1
Spain6.311.85.6
France4.95.91.0
Croatia0.02.52.5
Italy0.52.11.6
Cyprus0.016.616.6
Latvia7.353.846.6
Lithuania2.013.611.5
Luxembourg0.02.22.2
Hungary1.37.25.9
Malta0.00.00.0
Netherlands0.41.41.0
Austria9.318.18.8
Poland2.310.68.3
Portugal25.823.6−2.2
Romania1.63.72.1
Slovenia5.26.51.3
Slovakia2.010.58.5
Finland30.237.47.1
Sweden31.342.811.5
Table 4. Results of regression analysis for the EU member states.
Coefficients (α)Standard Errort-Statisticp-Value
AustriaRegression statistics: R = 0.9242; R2 = 0.8542; Adjusted R2 = 0.8425; F(2;25) = 73.22; p < 0.0122
Constant
Variable X5
Variable X7
−0.3297
0.7095
0.4897
0.0392
0.0774
0.0774
−8.4152
9.1713
6.3302
0.0000
0.0000
0.0000
Durbin–Watson test statisticsDW = 1.6126
White test statisticsF = 0.9245; p(F) = 0.4839; p(chi-sq.) = 0.433
BelgiumRegression statistics: R = 0.9729; R2 = 0.9466; Adjusted R2 = 0.9423; F(2;25) = 221.61; p < 0.0047
Constant
Variable X4
Variable X7
0.2379
−0.0143
−0.0028
0.0237
0.1656
0.1656
10.0230
−8.8223
−3.1366
0.0000
0.0000
0.0043
Durbin–Watson test statisticsDW = 1.6439
White test statisticsF = 1.5487; p(F) = 0.2159; p(chi-sq.) = 0.20
BulgariaRegression statistics: R = 0.9795; R2 = 0.9593; Adjusted R2 = 0.9477; F(4;14) = 82.56; p < 0.0074
Constant
Variable X2
Variable X4
Variable X7
Variable X8
−0.1660
−0.2528
0.4485
3.5047
−2.4514
0.0246
0.0853
0.0639
0.4165
0.4215
−6.7350
−2.9647
7.0217
8.4143
−5.8161
0.0000
0.0102
0.0000
0.0000
0.0000
Durbin–Watson test statisticsDW = 1.1884
White test statisticsF = 0.5983; p(F) = 0.7878; p(chi-sq.) = 0.5376
CyprusRegression statistics: R = 0.9726; R2 = 0.9460; Adjusted R2 = 0.9426; F(1;16) = 280.21; p < 0.0000
Constant
Variable X7
−0.0437
0.0124
0.0072
0.0007
−6.0867
16.7395
0.0000
0.0000
Durbin–Watson test statisticsDW = 1.5945
White test statisticsF = 2.7429; p(F) = 0.0966; p(chi-sq.) = 0.0898
Czech RepublicRegression statistics: R = 0.9717; R2 = 0.9442; Adjusted R2 = 0.9397; F(2;25) = 211.45; p < 0.0052
Constant
Variable X1
Variable X7
0.0108
0.00001
0.0053
0.0025
0.0000
0.0007
4.3084
4.8198
7.2468
0.0002
0.0001
0.0000
Durbin–Watson test statisticsDW = 1.3922
White test statisticsF = 0.3108; p(F) = 0.9012; p(chi-sq.) = 0.8699
DenmarkRegression statistics: R = 0.9161; R2 = 0.9393; Adjusted R2 = 0.8264; F(2;25) = 65.28; p < 0.0000
Constant
Variable X1
Variable X5
0.0946
0.000001
−0.0046
0.0333
0.0000
0.0014
2.8361
6.1088
−3.2836
0.0089
0.0000
0.0030
Durbin–Watson test statistics1.8735
White test statisticsF = 1.7962; p(F) = 0.1553; p(chi-sq.) = 0.1499
EstoniaRegression statistics: R = 0.6737; R2 = 0.4539; Adjusted R2 = 0.4102; F(2;25) = 10.39; p < 0.0005
Constant
Variable X6
Variable X7
0.1880
−0.2353
−0.0094
0.0203
0.1120
0.0021
9.2654
−2.1004
−4.4470
0.0000
0.0459
0.0001
Durbin–Watson test statisticsDW = 1.4511
White test statisticsF = 2.5274; p(F) = 0.0594; p(chi-sq.) = 0.0693
FinlandRegression statistics: R = 0.9256; R2 = 0.8568; Adjusted R2 = 0.8453; F(2;25) = 74.78; p < 0.0000
Constant
Variable X6
Variable X7
0.0598
0.8328
0.0077
0.0370
0.2311
0.0008
1.6194
3.6042
10.2003
0.1179
0.0014
0.0000
Durbin–Watson test statisticsDW = 1.2314
White test statisticsF = 1.9276; p(F) = 0.1304; p(chi-sq.) = 0.1294
FranceRegression statistics: R = 0.7362; R2 = 0.5420; Adjusted R2 = 0.5054; F(2;25) = 14.79; p < 0.0038
Constant
Variable X1
Variable X7
0.0440
−0.0000003
0.0017
0.0035
0.0000
0.0003
12.4913
−2.6599
5.4357
0.0000
0.0134
0.0000
Durbin–Watson test statisticsDW = 1.2967
White test statisticsF = 2.6273; p(F) = 0.0522; p(chi-sq.) = 0.0630
GermanyRegression statistics: R = 0.9565; R2 = 0.9148; Adjusted R2 = 0.90000; F(4;23) = 61.77; p < 0.0056
Constant
Variable X1
Variable X5
Variable X7
Variable X8
−0.2112
0.000001
0.0006
0.0117
−0.0007
0.0603
0.0000
0.0001
0.0032
0.0002
−3.5002
2.6607
3.1713
3.6424
−3.1880
0.0019
0.0139
0.0042
0.0013
0.0040
Durbin–Watson test statisticsDW = 1.3704
White test statisticsF = 1.6960; p(F) = 0.1744; p(chi-sq.) = 0.2026
GreeceRegression statistics: R = 0.5954; R2 = 0.3544; Adjusted R2 = 0.3028; F(2;25) = 6.8640; p < 0.0042
Constant
Variable X4
Variable X5
0.0257
−0.0075
0.0041
0.0119
0.0021
0.0011
2.1564
−3.4500
3.7037
0.0408
0.0020
0.0010
Durbin–Watson test statisticsDW = 1.0570
White test statisticsF = 1.5604; p(F) = 0.2126; p(chi-sq.) = 0.1972
HungaryRegression statistics: R = 0.9713; R2 = 0.9435; Adjusted R2 = 0.9390; F(2;25) = 208.73; p < 0.0000
Constant
Variable X4
Variable X7
−0.1028
0.0160
0.0095
0.0177
0.0024
0.0006
−5.7958
−6.6271
14.4149
0.0000
0.0000
0.0000
Durbin–Watson test statisticsDW = 1.5360
White test statisticsF = 0.7785; p(F) = 0.5758; p(chi-sq.) = 0.5197
IrelandRegression statistics: R = 0.9662; R2 = 0.9335; Adjusted R2 = 0.9282; F(2;25) = 175.39; p < 0.0000
Constant
Variable X4
Variable X5
0.0965
−0.0065
0.0057
0.0136
0.0003
0.0008
7.0597
−16.5660
7.0026
0.0000
0.0000
0.0000
Durbin–Watson test statisticsDW = 1.2708
White test statisticsF = 1.6063; p(F) = 0.2000; p(chi-sq.) = 0.1868
ItalyRegression statistics: R = 0.9399; R2 = 0.8834; Adjusted R2 = 0.8741; F(2;25) = 94.74; p < 0.0000
Constant
Variable X4
Variable X6
0.0368
−0.0026
−0.1496
0.0024
0.0004
0.0594
14.9151
−5.8190
−2.5167
0.0000
0.0000
0.0186
Durbin–Watson test statisticsDW = 1.0394
White test statisticsF = 2.4290; p(F) = 0.0674; p(chi-sq.) = 0.0764
LatviaRegression statistics: R = 0.9529; R2 = 0.9080; Adjusted R2 = 0.9045; F(1;26) = 256.73; p < 0.0000
Constant
Variable X4
0.1069
0.0560
0.0140
0.0034
7.5959
16.0228
0.0000
0.0000
Durbin–Watson test statisticsDW = 1.0297
White test statisticsF = 2.9050; p(F) = 0.0734; p(chi-sq.) = 0.0714
LithuaniaRegression statistics: R = 0.9618; R2 = 0.9250; Adjusted R2 = 0.9156; F(3;24) = 98.68; p < 0.0000
Constant
Variable X5
Variable X6
Variable X7
−1539.0
1421.6
−46531.9
1321.5
806.779
612.784
8818.805
151.773
−0.3201
2.3199
−5.2764
8.7069
0.4516
0.0291
0.0000
0.0000
Durbin–Watson test statisticsDW = 1.6158
White test statisticsF = 3.4012; p(F) = 0.0530; p(chi-sq.) = 0.0697
LuxembourgRegression statistics: R = 0.9232; R2 = 0.8523; Adjusted R2 = 0.8405; F(2;25) = 72.13; p < 0.0064
Constant
Variable X1
Variable X7
−0.0274
0.000001
0.0024
0.0041
0.0000
0.0005
−6.6441
11.0601
4.4867
0.0000
0.0000
0.0001
Durbin–Watson test statisticsDW = 1.4503
White test statisticsF = 3.3604; p(F) = 0.0566; p(chi-sq.) = 0.0660
NetherlandsRegression statistics: R = 0.9390; R2 = 0.8817; Adjusted R2 = 0.8722; F(2;25) = 93.17; p < 0.0000
Constant
Variable X1
Variable X5
0.0263
0.0000002
−0.0004
0.0046
0.0000
0.0000
5.6820
8.3211
−6.5611
0.0000
0.0000
0.0000
Durbin–Watson test statisticsDW = 1.1109
White test statisticsF = 1.3848; p(F) = 0.2683; p(chi-sq.) = 0.2437
PolandRegression statistics: R = 0.9690; R2 = 0.9391; Adjusted R2 = 0.9342; F(2;25) = 192.70; p < 0.0081
Constant
Variable X6
Variable X7
0.0486
−0.1135
0.0086
0.0054
0.0321
0.0007
8.9042
−3.5278
10.9686
0.0000
0.0016
0.0000
Durbin–Watson test statisticsDW = 1.9021
White test statisticsF = 0.2598; p(F) = 0.7733; p(chi-sq.) = 0.7520
PortugalRegression statistics: R = 0.8119; R2 = 0.6592; Adjusted R2 = 0.6307; F(2;24) = 23.20; p < 0.0000
Constant
Variable X5
Variable X7
−0.1669
0.0147
0.0032
0.0594
0.0023
0.0003
−2.8076
6.2623
5.9542
0.0097
0.0000
0.0000
Durbin–Watson test statisticsDW = 1.7676
White test statisticsF = 0.6119; p(F) = 0.6919; p(chi-sq.) = 0.6335
RomaniaRegression statistics: R = 0.8410; R2 = 0.7074; Adjusted R2 = 0.6961; F(1;26) = 62.847; p < 0.0044
Constant
Variable X5
0.0861
−0.0015
0.0068
0.0001
12.5932
−7.9276
0.0000
0.0000
Durbin–Watson test statisticsDW = 1.9385
White test statisticsF = 1.1821; p(F) = 0.3232; p(chi-sq.) = 0.2983
SlovakiaRegression statistics: R = 0.9250; R2 = 0.8557; Adjusted R2 = 0.8501; F(1;26) = 154.18; p < 0.0000
Constant
Variable X6
0.1208
−0.4569
0.0042
0.0368
28.1094
−12.4169
0.0000
0.0000
Durbin–Watson test statisticsDW = 1.5646
White test statisticsF = 0.2898; p(F) = 0.7733; p(chi-sq.) = 0.7520
SpainRegression statistics: R = 0.8507; R2 = 0.7236; Adjusted R2 = 0.6891; F(3;24) = 20.948; p < 0.0000
Constant
Variable X4
Variable X5
Variable X7
0.2309
−0.0290
0.0008
−0.0033
0.0457
0.0074
0.0003
−0.0033
5.0495
−3.9023
2.3584
−2.1520
0.0000
0.0007
0.0268
0.0417
Durbin–Watson test statisticsDW = 1.5520
White test statisticsF = 1.0028; p(F) = 0.4723; p(chi-sq.) = 0.4056
SwedenRegression statistics: R = 0.8937; R2 = 0.7986; Adjusted R2 = 0.7909; F(1;26) = 103.11; p < 0.0209
Constant
Variable X7
0.1293
0.0057
0.0220
0.0006
5.8636
10.1542
0.0000
0.0000
Durbin–Watson test statisticsDW = 1.6599
White test statisticsF = 1.1858; p(F) = 0.3221; p(chi-sq.) = 0.2973
Table 5. The share of RES in final energy consumption in industry in 2022 and projected values for 2030 in the EU member states (in %).
Country20222030Average Annual Percentage Change in 2022/1995Average Annual Percentage Change in 2030/2022
Belgium7.49.10.200.21
Bulgaria9.660.60.345.28
Czechia8.117.50.201.13
Denmark9.713.50.210.46
Germany6.869.30.216.26
Ireland9.010.70.210.22
Greece4.75.70.000.13
Spain11.821.40.201.15
France5.98.50.040.32
Italy2.12.40.060.04
Cyprus16.624.10.570.91
Latvia53.857.21.430.41
Lithuania13.622.90.411.13
Luxembourg2.212.60.081.24
Hungary7.216.10.211.08
Netherlands1.42.40.040.12
Austria18.126.40.311.00
Poland10.632.10.302.46
Portugal23.633.7−0.081.21
Romania3.75.00.080.16
Slovakia10.511.20.300.08
Finland37.451.70.261.69
Sweden42.850.30.400.90
[Source: based on Table 2, Table 3 and Table 4].
Table 6. The share of RES in final energy consumption in industry in 2030 with the independent variable changed by ±5% (in %).
CountryProjected Level in 2030 with Independent Variables Lower by 5%Projected Level in 2030 with Independent Variables Higher by 5%
Belgium8.99.3
Bulgaria57.863.3
Czechia16.618.3
Denmark12.714.3
Germany66.072.6
Ireland10.810.7
Greece5.95.6
Spain21.321.5
France8.38.7
Italy2.32.5
Cyprus22.725.5
Latvia59.554.9
Lithuania22.423.5
Luxembourg11.813.3
Hungary15.516.8
Netherlands2.22.5
Austria25.926.9
Poland30.733.4
Portugal33.533.9
Romania4.85.2
Slovakia11.111.2
Finland49.853.6
Sweden48.452.1
[Source: based on Table 2, Table 3 and Table 4].
Table 7. National indicative targets for the share of RES in final energy consumption in the economy in EU member states in % [10,11].
Country2030
Belgium18.3
Bulgaria61.0
Czechia22.0
Denmark55.0
Germany80.0
Estonia42.0
Ireland31.0
Greece61.0
Spain35.0
France33.0
Croatia53.2
Italy72.0
Cyprus23.0
Latvia36.7
Lithuania45.0
Luxembourg25.0
Hungary21.0
Malta40.5
Netherlands21.0–33.0
Austria76.0
Poland32.0
Portugal85.0
Romania30.7–34.0
Slovenia27.0
Slovakia19.2
Finland55.0
Sweden65.0
Table 8. Meeting the climate targets for 2030 for the share of RES in the EU member states by the industrial sector.
CountryEC TargetNational TargetEC Target Assuming a 5% Fluctuation in the Independent VariablesNational Target Assuming a 5% Fluctuation in the Independent Variables
Belgiumnononono
Bulgariayesnoyesyes
Czechianononono
Denmarknononono
Germanyyesnoyesno
Estonianononono
Irelandnononono
Greecenononono
Spainnononono
Francenononono
Croatianononono
Italynonoyesno
Cyprusnoyesnoyes
Latviayesyesyesyes
Lithuanianononono
Luxembourgnononono
Hungarynononono
Maltanononono
Netherlandsnononono
Austrianononono
Polandnoyesnoyes
Portugalnononono
Romanianononono
Slovenianononono
Slovakianononono
Finlandyesnoyesno
Swedenyesnoyesno
Disclaimer/Publisher’s Note: The statements, opinions and data contained in all publications are solely those of the individual author(s) and contributor(s) and not of MDPI and/or the editor(s). MDPI and/or the editor(s) disclaim responsibility for any injury to people or property resulting from any ideas, methods, instructions or products referred to in the content.