Article

Realistic μPMU Data Generation for Different Real-Time Events in an Unbalanced Distribution Network

by
Abdul Haleem Medattil Ibrahim
1,2,*,
Madhu Sharma
1 and
Vetrivel Subramaniam Rajkumar
2
1
Department of Electrical and Electronics Engineering, University of Petroleum and Energy Studies, Dehradun 248007, India
2
Department of Electrical Sustainable Energy, Delft University of Technology, 2628 CD Delft, The Netherlands
*
Author to whom correspondence should be addressed.
Energies 2023, 16(9), 3842; https://doi.org/10.3390/en16093842
Submission received: 22 March 2023 / Revised: 25 April 2023 / Accepted: 26 April 2023 / Published: 29 April 2023
(This article belongs to the Special Issue Modeling and Analysis of Active Distribution Networks and Smart Grids)

Abstract

:
Monitoring, protection, and control processes are becoming more complex as distributed energy resources (DERs) penetrate distribution networks (DNs). This is due to the inherent nature of power DNs and the bi-directional flow of current from various sources to the loads. To improve the system’s situational awareness, the grid dynamics of the entire DER integration processes must be carefully monitored using synchronized high-resolution real-time measurement data from physical devices installed in the DN. μPMUs have been introduced into the DN to help with this. In comparison to traditional measurement devices, μPMUs can measure voltage, current, and their phasors, in addition to frequency and rate of frequency change (ROCOF). In this study, an approach to generating realistic event data for a real utility DN utilizing strategically installed μPMUs is proposed. The method employs an IEEE 34 test feeder with 12 μPMUs installed in strategic locations to generate real-time events-based realistic μPMU data for various situational awareness applications in an unbalanced DN. The node voltages and line currents were used to analyze the various no-fault and fault events. The author generated the data as part of his PhD research project, utilizing his real-time utility grid operation experience to be used for various situational awareness and fault location studies in a real unbalanced DN. The DN was modeled in DIgSILENT PowerFactory (DP) software. The generated realistic μPMU data can be utilized for developing data-driven algorithms for different event-detection, classification and section-identification research works.

1. Introduction

In the past, when radial power distribution and one-way power flow were prevalent, it was sufficient to evaluate the design conditions’ envelope, such as peak loads or fault currents, rather than continuously monitoring the operational status. However, as DERs are integrated on a large scale, fluctuation, unpredictability, and the potential to enlist a variety of resources for grid services present themselves, sparking demand for tools such as sophisticated sensors and much more extensive monitoring in order to accurately observe, comprehend, and manage the DN [1]. The SCADA (supervisory control and data acquisition) system is used by the majority of electric utilities around the world to monitor and control electric power DN. RTUs, which are traditional measurement devices installed throughout the power system, transmit data to the SCADA system. With a low resolution, it records unsynchronized voltage, current magnitude, and real and reactive power flow (a few seconds). As a result, the SCADA system is unable to capture the dynamic behavior of the current DN [2]. Because of the large number of nodes, short distances, small amplitude and angle differences between nodes, unbalanced loads, and faster dynamics, DN is extremely complex. Because of the inherent complexities, there is a greater need for the development of new high-accuracy and precision monitoring systems that support situational awareness in the DN. This enables distribution operators to respond to such disturbances by making operational decisions [3]. To improve situational awareness and alleviate these complexities, the micro-phasor measurement unit (μPMU) was developed for DN [4]. μPMU generates time-synchronized voltage and current phasors in real time with high accuracy, precision, and sampling rate. Synchronization is accomplished by simultaneously sampling voltage and current phasors with GPS receiver timing signals [5]. It has a precision angle of 0.01, a total vector error allowance of 0.05%, an angle resolution of 0.002, and a magnitude resolution of 0.0002% [6]. Its sampling rate can be adjusted from 10 to 120 samples per second for a 60 Hz system [7]. Operators can monitor distribution applications in real time due to the high performance of μPMU technology in DN.
With the expansion of sensor data comes new challenges, such as how to handle data anomalies, enable real-time processing, and control cyber security [8]. The limited control center uses of μPMU measurements show that, overall, translating high-resolution μPMU data into real-time actionable information remains an important challenge [9]. A single-line-to-neutral fault at a real DN in Riverside, CA, is investigated using data from five μPMUs to conduct a detailed analysis of how faults affect different voltage levels [10]. Due to the infrequent, unscheduled, and unknown nature of the events, a large volume of PMU data contains a large number of events that are difficult to analyze [11]. Some techniques improve awareness by combining data from various monitoring devices installed in the network. Using data from smart meters and μPMUs, ref. [12] examines real-time topology detection and state estimation in DN. An impedance-based method is demonstrated in [13] that computes fault currents using observed voltages measured by μPMUs and known bus impedance before employing distributed parameters to calculate the fault distance from the measured site. The addition of μPMU devices in specific distribution system sites was investigated in [14] to enrich smart meter data with high-resolution data and improve time-series estimations. The work in [15] performs a thorough investigation of how various voltage levels are affected by capacitor-bank-switching events in DN using data-driven experimental analysis on a capacitor-bank-switching event in a real DN using μPMU data. In circuit theory, the compensation theorem serves as the foundation for a technique that generates an equivalent circuit to describe the event using voltage and current synchrophasors recorded by μPMUs [16]. The fault source location is determined by performing an improved distribution system state estimation in a hierarchical structure based on the feeder graph model in the decreased searching zone [17]. In [18], for the event categorization approach, the wavelet transforms and shifts in the magnitudes and phase angles of the voltage and current phasors are used. A method for determining whether a frequency event is propagated from the transmission system formed within a DN or erroneously generated by instantaneous frequency estimation algorithms is tested utilizing real μPMU data [19]. Most of the investigations are carried out using μPMU data. When combining high-quality and high-resolution μPMU data with conventional measurements, it is difficult to obtain the best state-estimation scheme, and the software will require more processing power. The system’s computational load rises as additional devices that require measurement are added, which increases the data volume [20].
The use of these data has been described in numerous works; however, all the relevant real-time events have not fully been investigated with specified abnormalities and events. Field data are challenging to collect and are not marked for abnormalities or incidents [9]. Besides the real data-handling challenges of μPMUs, due to privacy and security concerns, accessing field data is exceedingly difficult. These challenges are the roadblocks for researchers who explore the benefits of the μPMU data in the context of highly dynamic, unbalanced DN. This study describes a technique for producing accurate μPMU data for the specified IEEE benchmark network. We must put our tools to the test on accurate μPMU data to determine how well they will operate in the actual world [9].
There are a few open-source data sets that have been documented in the literature; however, they either have a short access duration, a difficult process, or are only available to collaborators. As a result, there is still a problem and a gap in the research, but the authors were driven to produce accurate data from a benchmark dataset that was readily available. The author utilizes his real-time distribution grid operation experience to generate these data and carry out applied research in the field of DN situational awareness improvement techniques for distribution control center (DCC) operators. The goal of this work is to generate realistic real-time events-based μPMU data that can be utilized to develop different real-time monitoring applications for the DN. The applications developed using these data can be utilized to enhance the visibility of the network. The main contributions of this paper are as follows:
  • Modeling an unbalanced real distribution network in DP. This model is subsequently used for data generation.
  • Synthetic μPMU data generation for real-time applications, such as event detection, classification and localization.
  • Validation of the generated data with real data published in the literature and with the load flow variations in the network.
The paper is organized with real-time events described in Section 2, followed by the real-time event-based data-generation methodology in Section 3. The results of the generated events are discussed in Section 4. Section 5 presents the validation of the generated data. An experimental use case is tested in Section 6 utilizing the generated realistic data. Section 7 summarizes the conclusions.

2. Real-Time Events in DN

All the DN are designed as meshed networks but with radial operating structures and unbalanced load connections, hence the name unbalanced network. The complexity of the issue is further increased by the non-linear power flow, the scale of the networks, and switching choices [21]. The real DN is prone to various events. Fault events and no-fault events are the main categories of real-time events. The events in a DN network can be defined as the act of connecting or disconnecting the components from the network due to the normal and abnormal conditions of the components or the networks themselves. A detailed list of the no-fault and fault events that normally happen in the real utility DN is listed below.

2.1. No-Fault Events

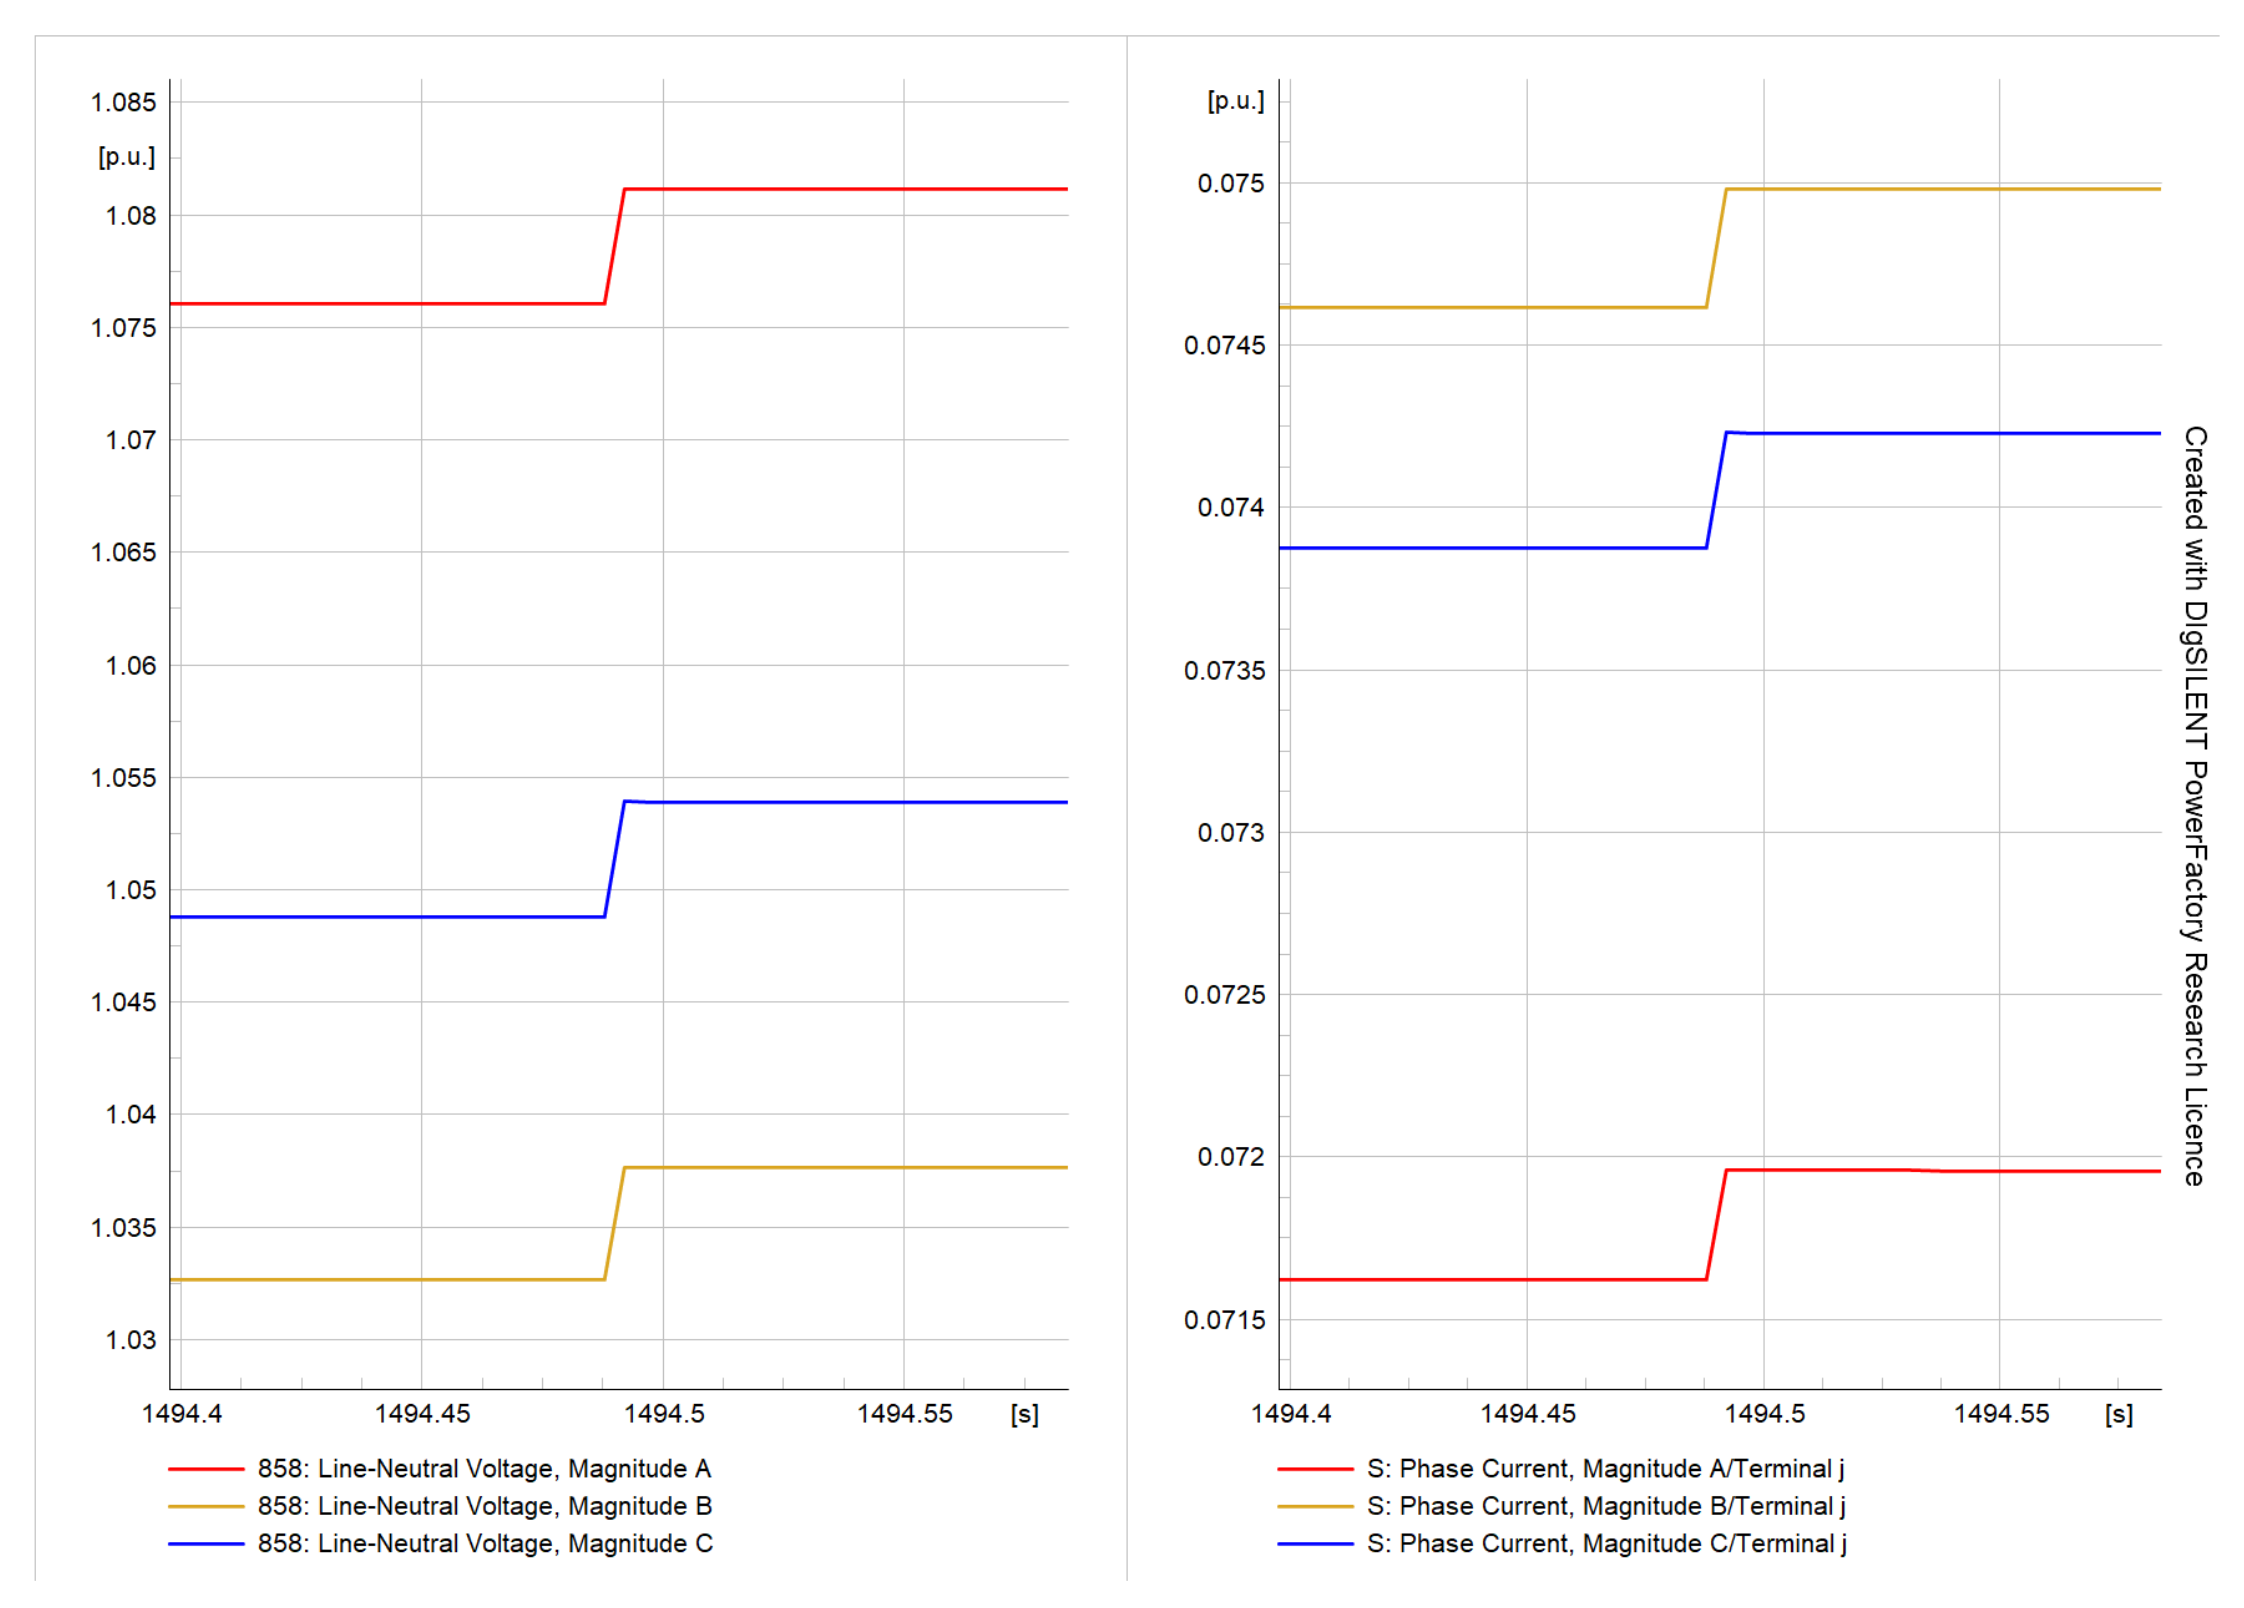
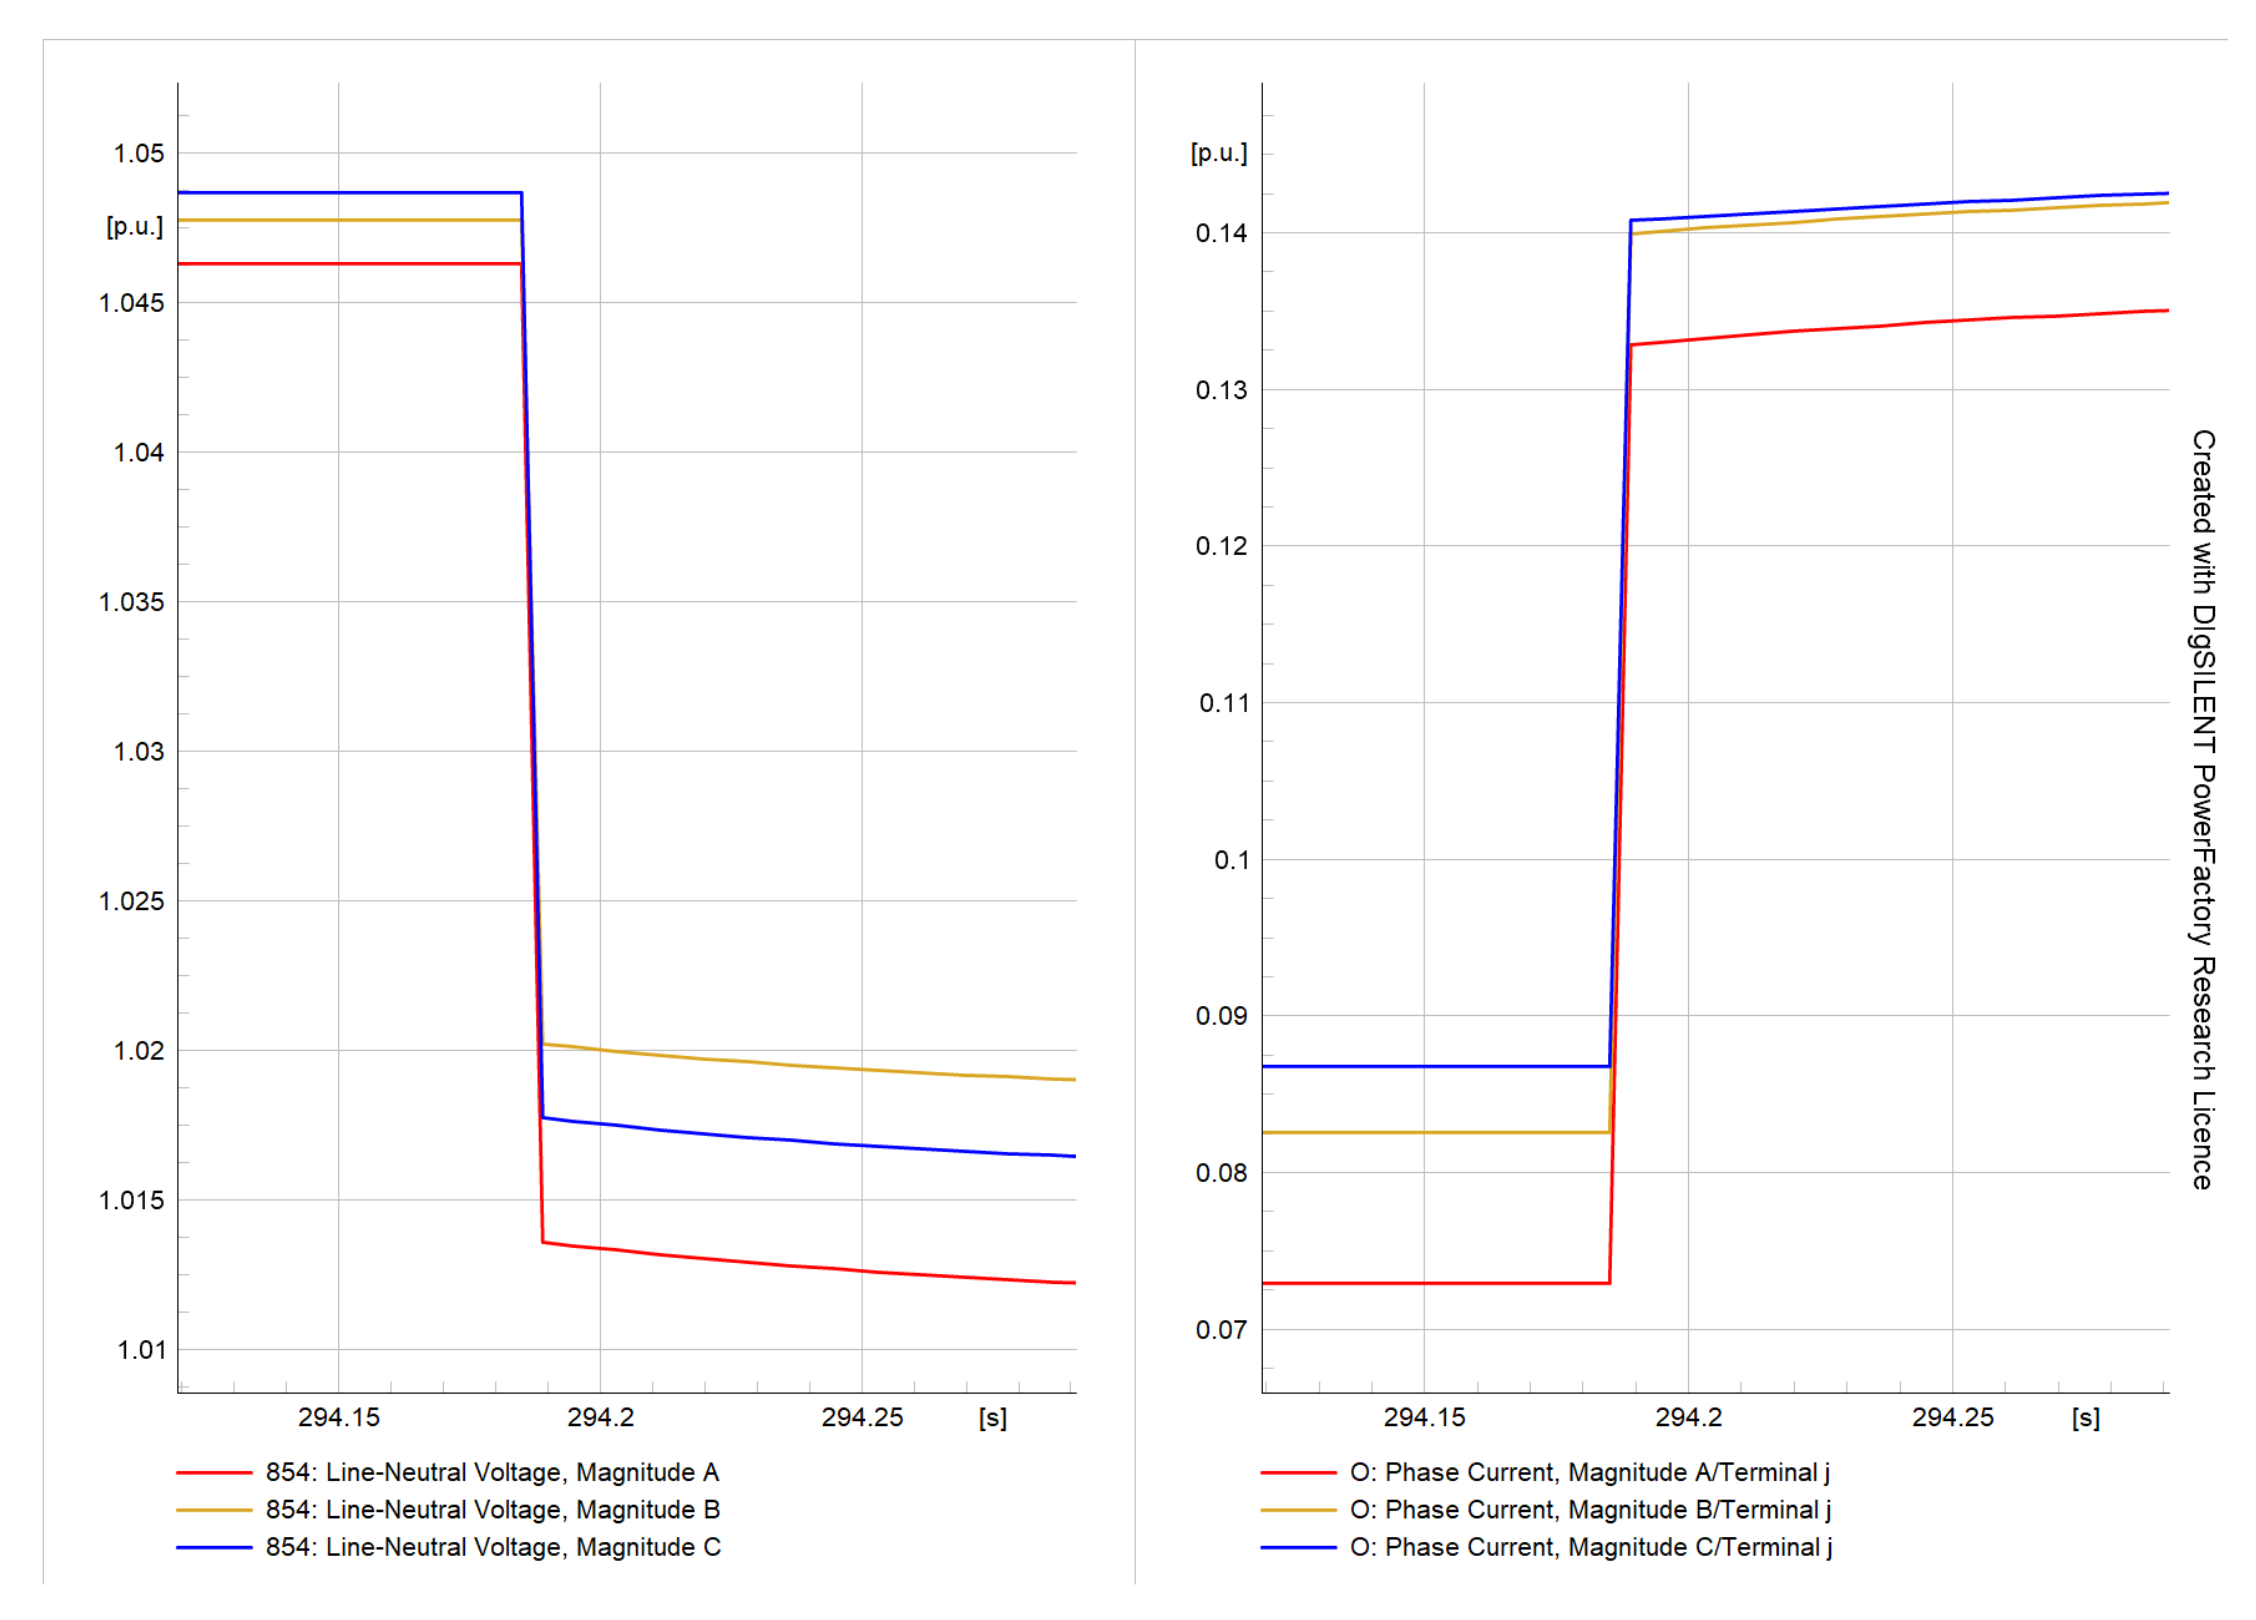
These categories of events are the normal events or planned events happening in the real DN as a part of its network operation or maintenance requirements. Load switching is one of the most common events in the real DN. Any abnormality in the load-connected circuit or the connected equipment that causes the load to trip or get disconnected is called load switching. The impact of this will be reflected in the total load currents per phase and even in the line currents and node voltage. These variations in the line currents are due to the switching of unbalanced loads. Another important and common event that happens in the real network is the capacitor bank switching. Utilities use reactive power compensation techniques to use equipment that generates local reactive power at the distribution level to make up for the necessary reactive power and obtain near-ideal power factor values [15]. With the increased penetration of different energy resources to the grid, DER integration has become a common trend for distribution because of the low-voltage (LV) integration flexibility. Although the DER installations support the DN during the required times, the inverter-based DERs pose a wide range of challenges to the grid operators and even the customers in terms of the quality and continuity of the services. Hence, DER or DG (distributed generation) switching is to be considered as yet another important dynamic event of the DN that is to be monitored and controlled very closely. Planned and unplanned transformer outages are another real-time event in the distribution grid. This transformer includes primary substation transformers, line transformers and load-level or customer-level distribution transformers (DTs). During planned outages, the transformer is de-energized from the LV side and then from the high-voltage (HV) side, based on the availability of CBs or fuse switches. After the proper isolation and grounding of the transformer, either the equipment is checked and repaired as a part of routine or preventive maintenance, or is repaired for a major defect that is determined during the condition monitoring of the equipment and parts. This is considered a periodic event in the DN in case of routine or scheduled transformer maintenance but an unplanned or emergency outage in the case of a major defect on the transformer. When transformers are kept out of service, the loads connected to them are also out of service automatically, and the impact is reflected in the node voltages as well as the line currents. So, these variations need to be distinguished and identified using a reliable and high-resolution monitoring device to capture and identify the transformer disconnection dynamics. Voltage-regulation events, popularly known as tap-changer events, are yet another common event that occurs in the DTs of the DN, where the busbar voltages of the different levels are kept within the limits either by lowering or raising the taps using on-load and off-load tap changers. Even though the tap-changer events have less impact on the line currents, the voltage variations can be observed at the corresponding nodes. All these events described above are considered normal events, as they do not trigger the protection devices that work on crossing the set points.

2.2. Fault Events

Unlike normal events, a fault event is an abnormal condition, caused by any power system component failures, human errors and environmental conditions, thus leading to an abnormal current flow through the network. Among the four parts of the power system, DN has the most interruptions, accounting for 80% of all interruptions. Real-time DN fault events can be split into two categories: transient and permanent, with transient faults making up 80% and permanent faults 20% of total fault events [22]. Transient faults mostly happened during extreme weather conditions and also mainly on the overhead lines (OHLs) and associated equipment. The normal procedure adopted by the utilities when a transient fault happens on the DN is reclosing the line either through the auto-recloser installed at the feeder’s heads or by closing the feeder CBs from the SCADA systems. If the breaker is closed after reclosing, then the fault is confirmed as a temporary or transient fault. However, if the breaker is tripped again, then the fault is confirmed to be a permanent fault. Most of the transient faults restorations lead to an open circuit fault in the OHL, as the reclosing surges weaken and open the OHL jumper connections between the overhead line poles. The four primary types of short circuit faults—line to ground (LG), line to line (LL), double line to ground (DLG), and three line to ground (LLLG)—are regarded as permanent faults [23].

3. Methodology

The realistic data-generation methodology basically considers the possibilities of creating all the realistic events planned as per the author’s real-time DN operation experience and data availability to model the network in the modeling and analysis tool. The main challenge faced during the formulation of the methodology is the implementation of real-time events to keep the data more realistic in nature. However, the challenge was addressed by selecting the best-suited network from the available reliable sources and a capable network modeling and analysis tool. The methodology employed in this study consisted of a rigorous seven-step process to analyze the behavior of a real-world DN. The first step involved selecting and modeling the real DN. Next, load flow analysis was performed on the network, with the results being validated against published results to ensure accuracy. Following this, μPMUs and DGs were strategically placed within the network to enable the precise monitoring of system behavior. Real-time events were then defined and their settings configured, with careful attention paid to ensuring that the event types and parameters are representatives of real-world scenarios. The data-generation settings were also established to generate accurate and representative data. Subsequently, the simulation of the different real-time events was performed, and the results were plotted for analysis. Finally, the data were validated to ensure that the results are reliable and accurate.

3.1. Real DN Selection and Modeling

Out of the available benchmark test feeders, the IEEE 34 node test feeder qualified as the best candidate for the analysis. This feeder is a real DN that is situated in Arizona. The system voltage of the feeder is 24.9 kV. The feeder is distinguished by its length and light load, the need for two in-line regulators to retain the specified voltage limits, and other factors. The DN has the inherent nature of unbalanced loading with both “spot” and “distributed” loads and shunt capacitors, an in-line transformer decreasing the voltage for a shorter portion of the feeder to 4.16 kV [24]. The feeder’s length and the unbalanced loading could help to generate realistic dynamics on the DN and visualize using the high-resolution data-measurement capability of μPMUs.
The test feeder is modeled using DP to create real-time events and scenarios. The IEEE 34 node is perfectly modeled using the feeder components data given in [25]. The DP has a rich components library and features that helped to model the network without any assumptions in connecting the components. The DP supports the modeling of three-phase, four-wire systems, which are very important in modeling the unbalanced three-phase DN [26,27]. The spot loads are placed at the nodes, and the distributed loads are connected at the middle of the line. The line sections of the network are labeled as shown in Table A1 of Appendix A.
The feeder is modeled without a substation transformer, as the load flow results published do not consider it for generating load flow results. However, an external grid connection with 1.05 p.u as reference phase-to-phase voltage for the base node 800 is selected for this study. The voltage regulator (VR) tap positions are kept as 12-05-05 (A-B-C) and 13-11-12 (A-B-C) for regulators 1 and 2, respectively. Figure 1 shows the test feeder modeled in DP. The phase A-N connection is represented by the components with red dotted lines, phase B-N connections are shown by yellow dotted lines, phase C-N connections are shown by blue dotted lines, and phase ABC-N connections are shown by black dotted lines. The components highlighted in grey color are the DGs.

3.2. Load Flow Simulations and Validations

From the provided load and generation data, the load flow algorithms are used to determine the line flows and voltages for a significant power system. It is a crucial and fundamental tool for power system analysis and is utilized during both the operational and planning phases. In systems where unbalances may be disregarded, single-phase power flow methods are typically employed. The three-phase balanced hypothesis, however, is inapplicable to distribution systems. For these situations, a three-phase load flow algorithm with full three-phase models is necessary. Additionally, it is imperative to resolve the load flow problem as fast as possible since several applications, particularly in distribution automation and optimization, call for its solution on a periodic basis [27,28].
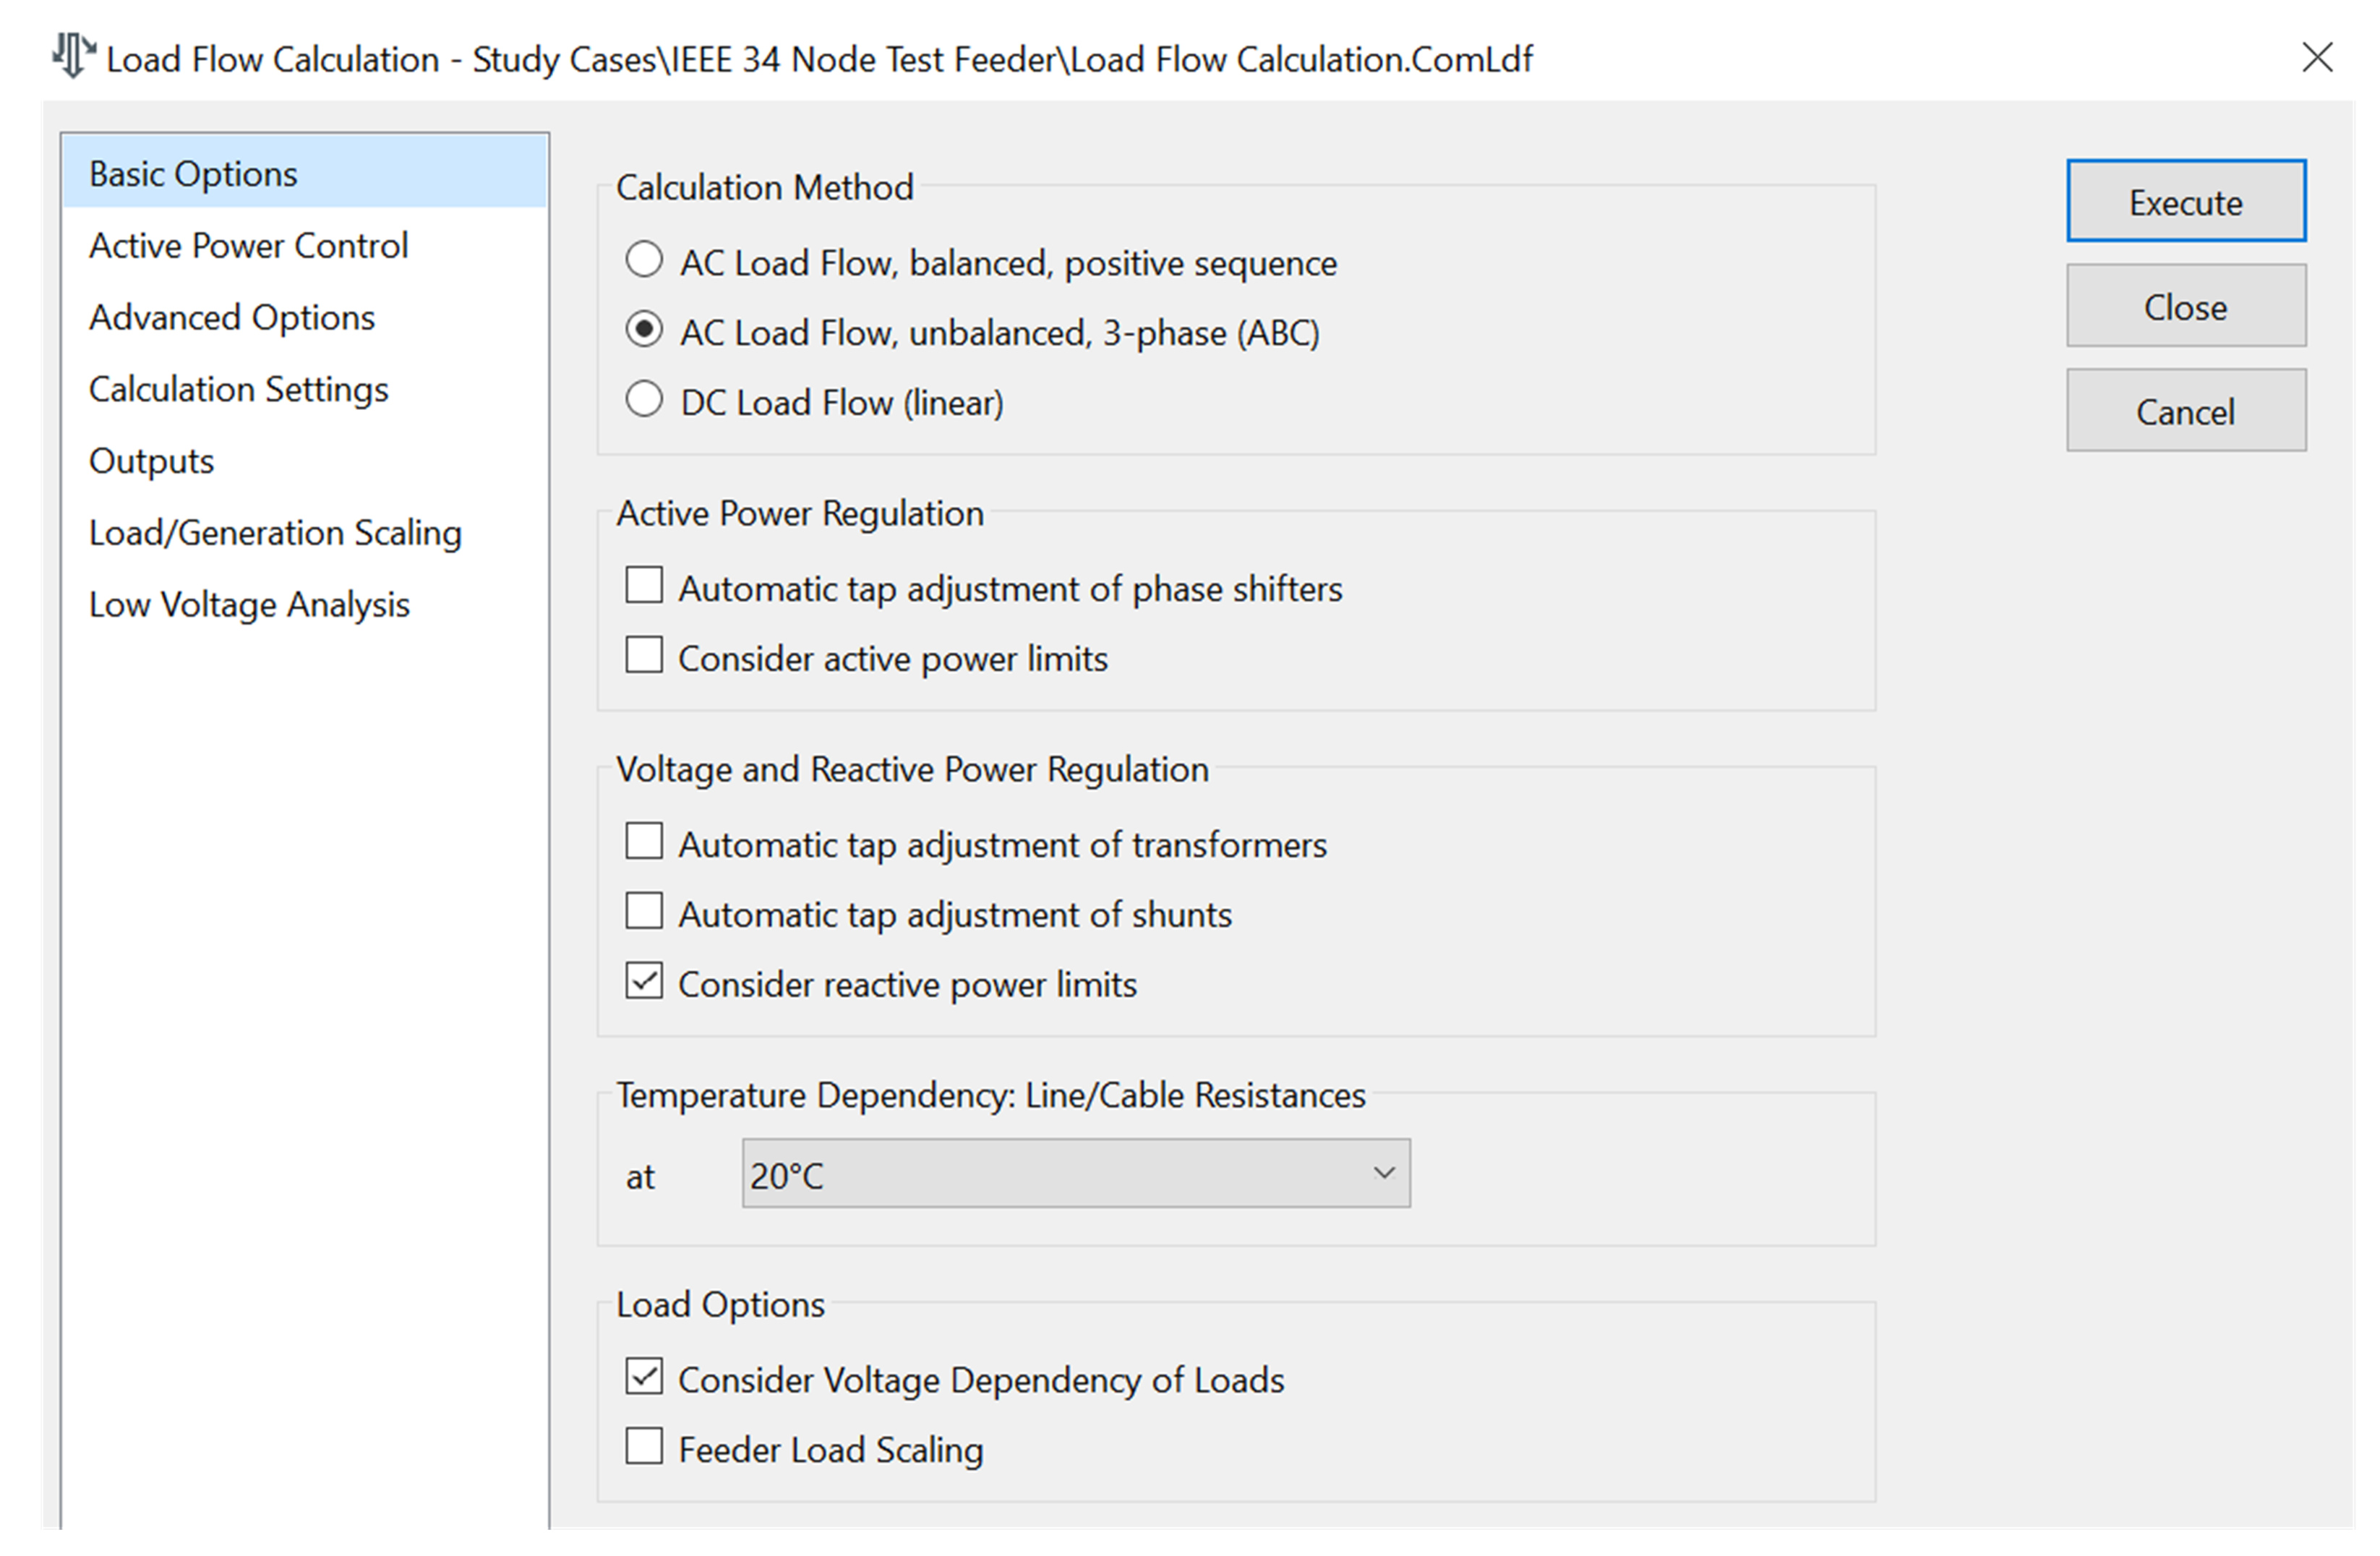
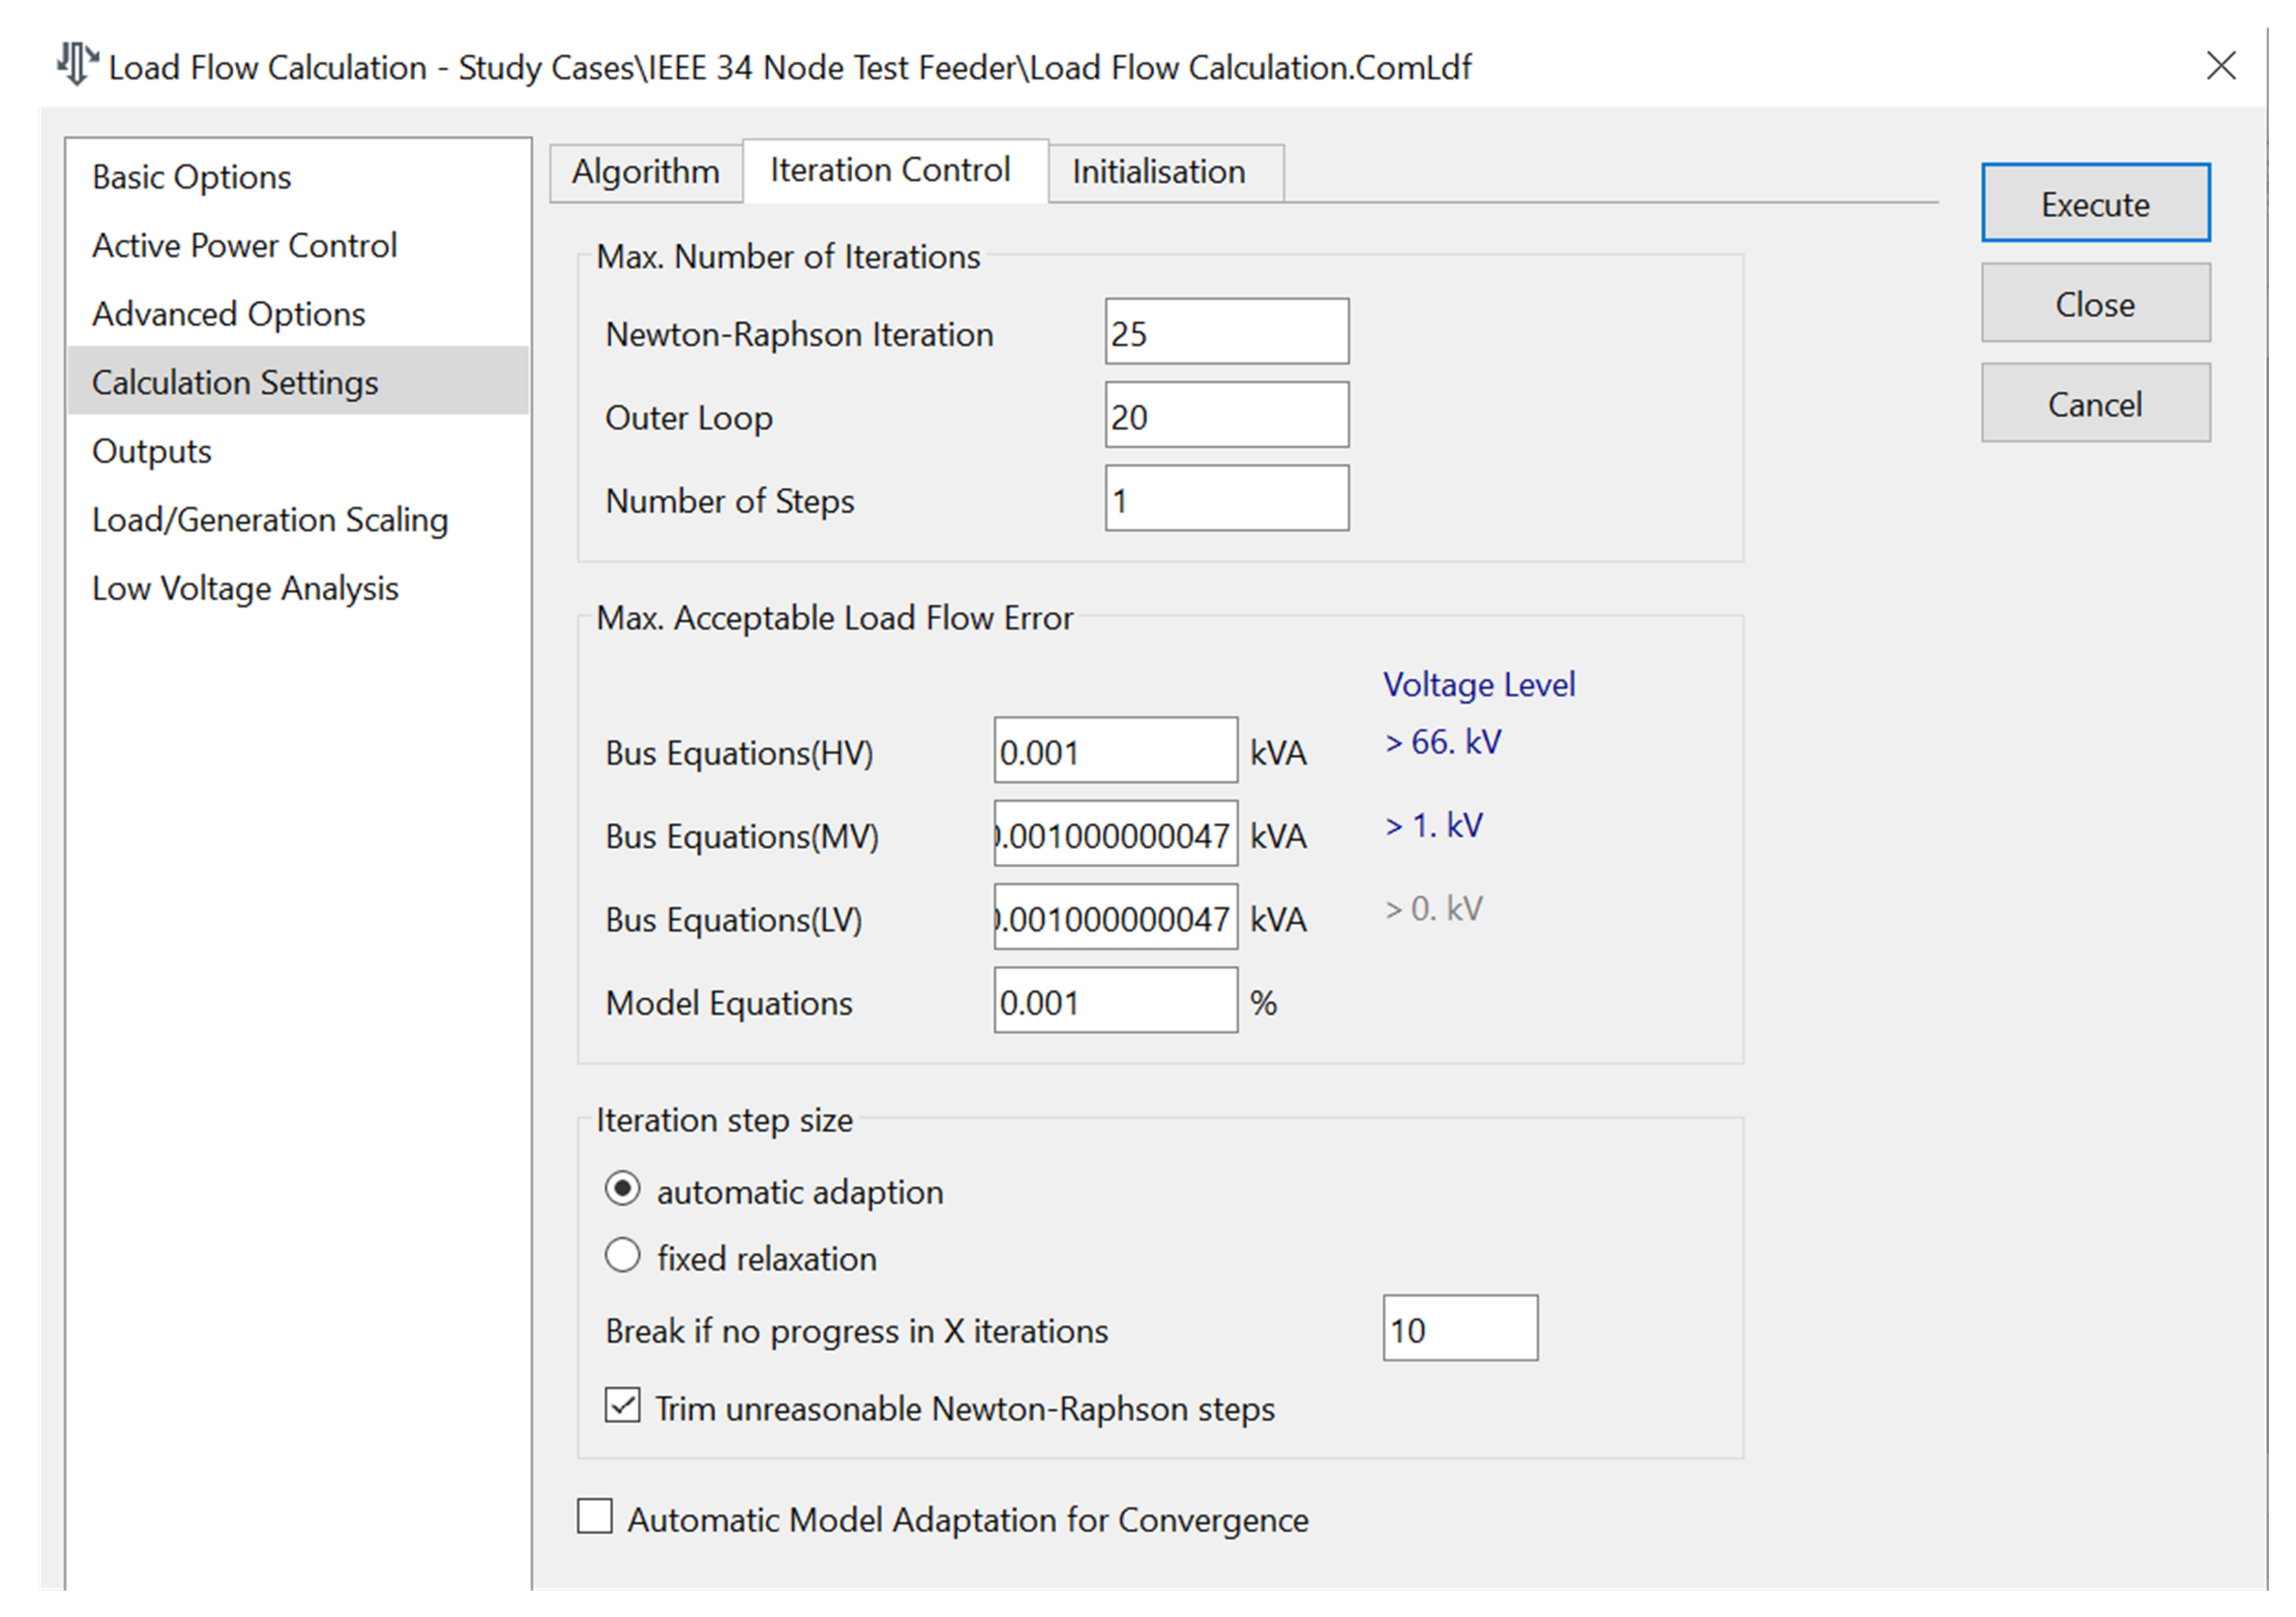
In the literature, a number of load flow algorithms specifically created for DN have been put forth. These compositions fall into two different categories. The bus voltages were employed as state variables in the first category [29,30,31,32] to resolve the load flow problem. This classification was based on the overall topology of a DN. The Gauss implicit Z-Bus approach is the most well-known load flow mechanism in this area [30,31]. Numerous applications have used this technology, which has been adopted by numerous electricity companies. The Newton–Raphson (NR) algorithm was proposed in [32] and was designed to expedite the three-phase load flow employing the rectangular-form voltages as state variables. Branch voltages are used as state variables in [33] to solve the load flow problem with an innovative quick three-phase load flow method for unbalanced radial distribution systems utilizing the NR algorithm. The load flow calculation method selected in DP is an unbalanced, 3-phase (ABC) NR (current equations), as it best suits the nature and behavior of the network model. The load flow simulation settings used in the DP are shown in Figure A1 and Figure A2 of Appendix B. The load flow simulation results show very close results to the results published by the IEEE PES DSAC [25]. The load flow results from the DP model with node voltages and line section currents along with their angles are given in Appendix A (Table A2 and Table A3, respectively).
Table 1 and Table 2 show the percentage errors in node voltage and angle following a comparison with published load flow values. Table 3 and Table 4 contain a list of the line current magnitude and angle percentage errors. The DP model load flow is converged in three iterations, and the results are shown in Table 5.
From the comparison of the load flow analysis results, it is clear that the results exactly match the results provided by the IEEE DSAC report, with very minimal errors.

3.3. μPMU Placement

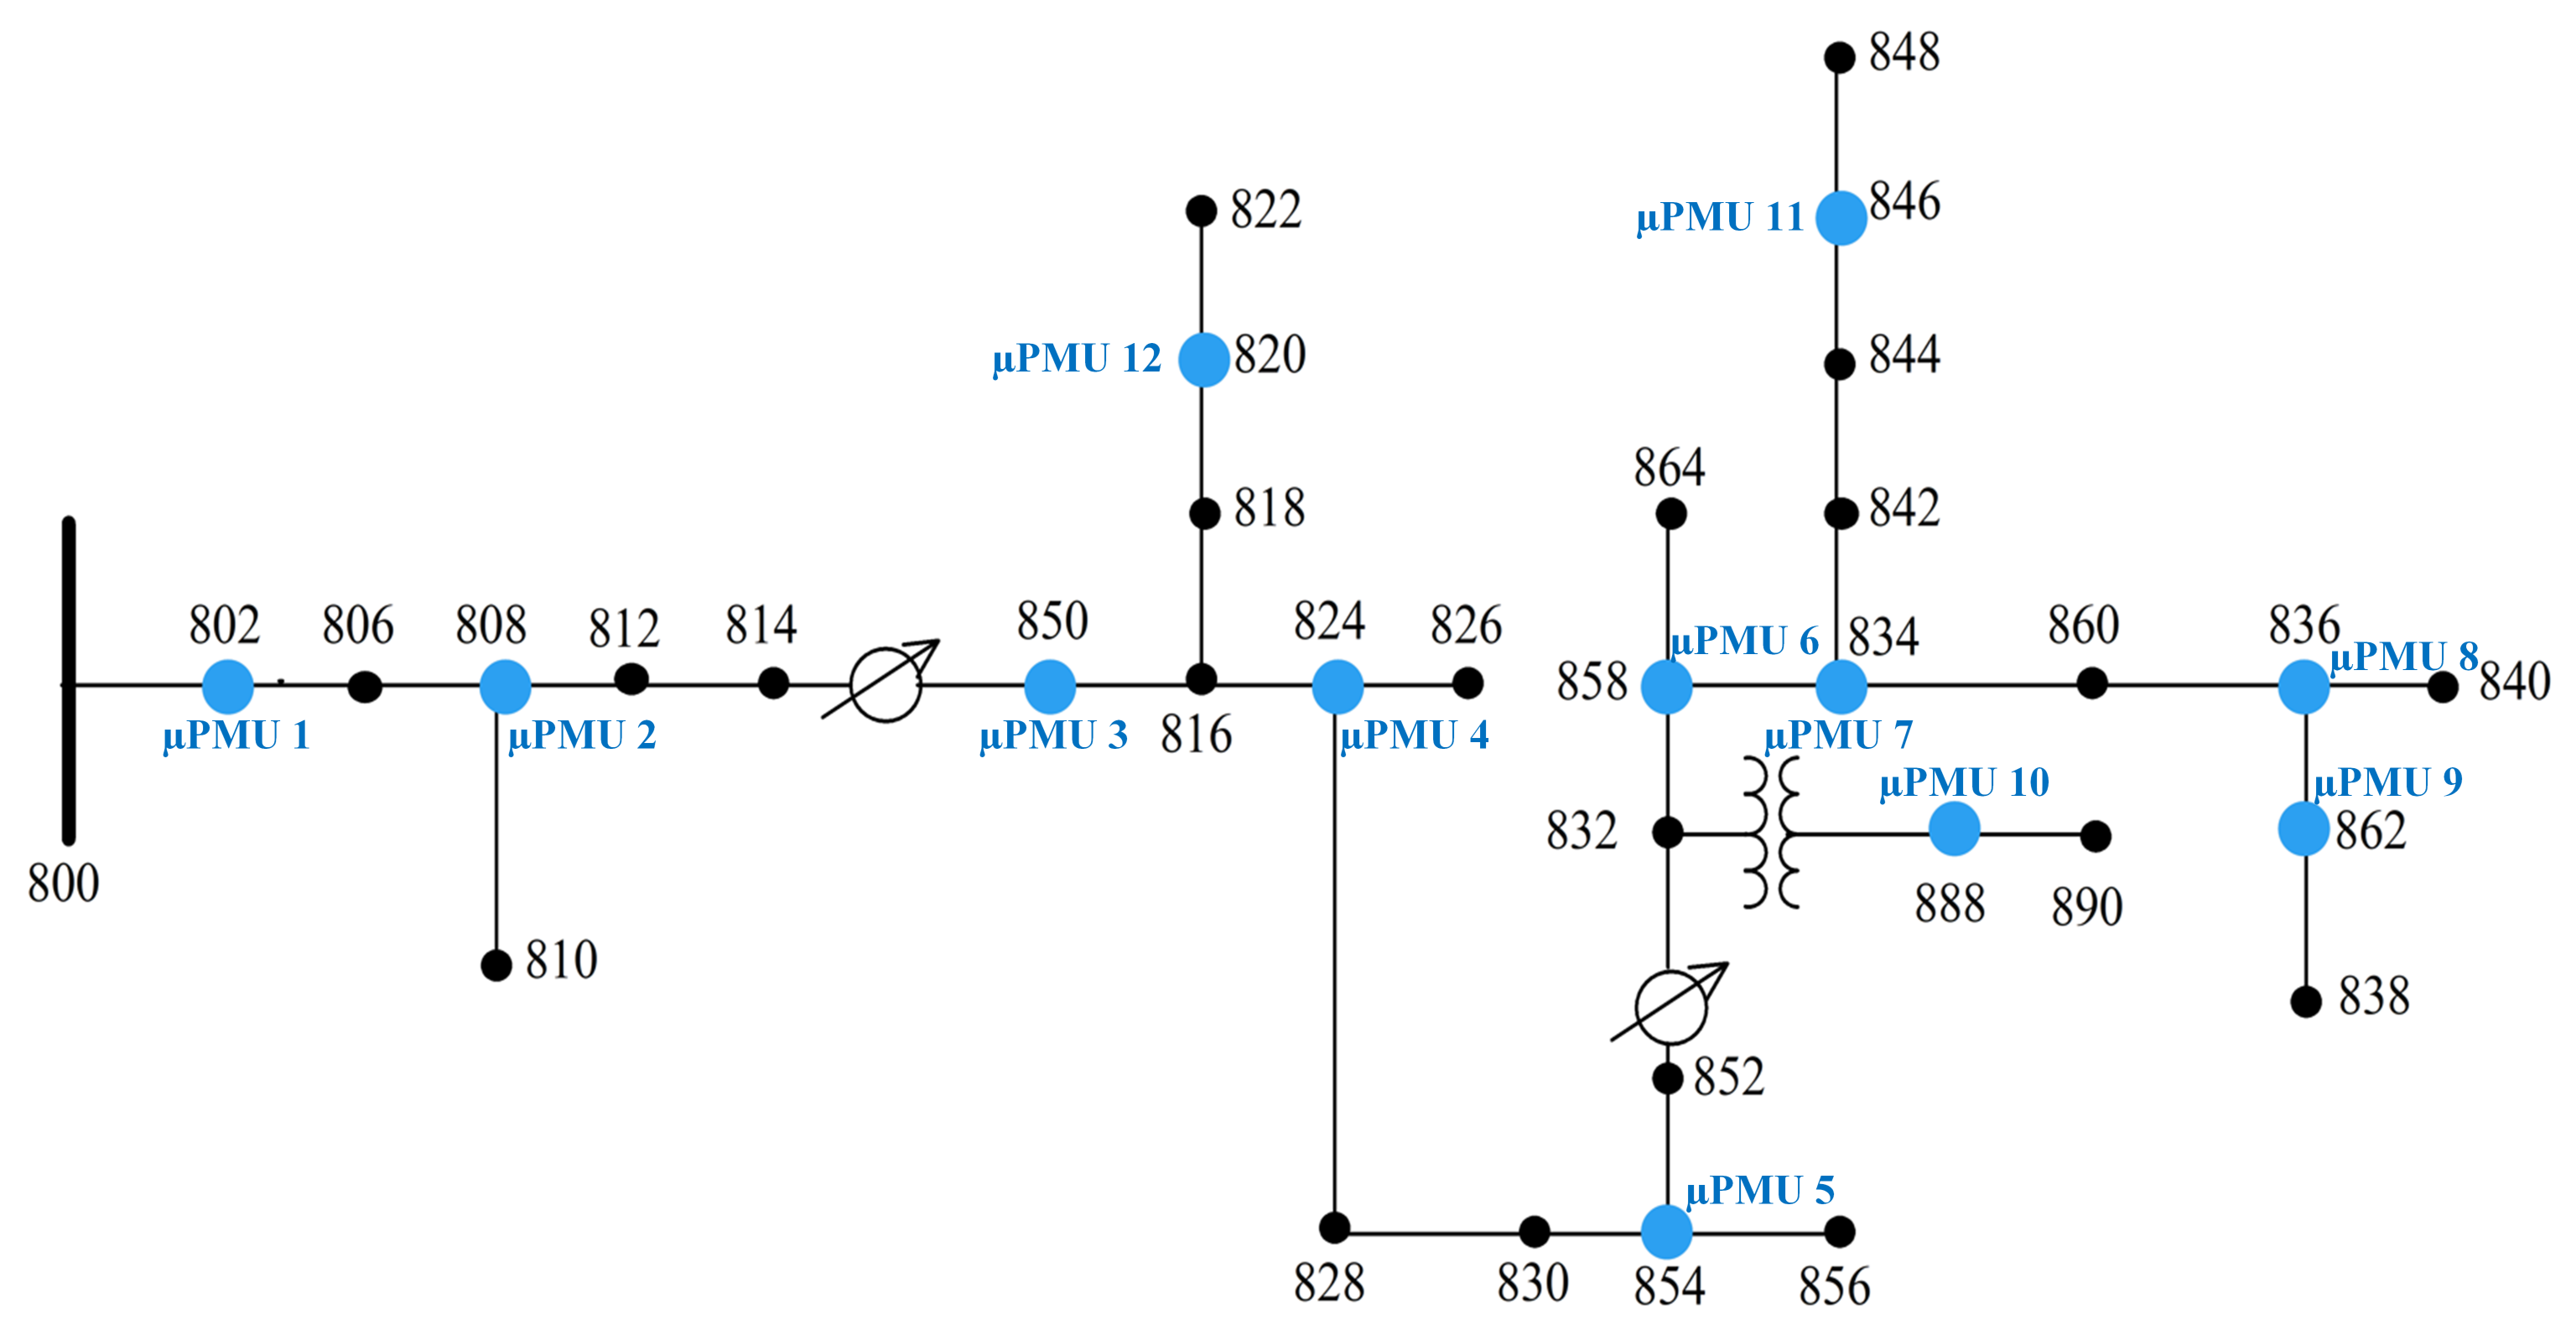
Traditional PMUs, which are used in transmission networks, are not ideal for radial DN because of their communication limitations and high cost. The introduction of μPMUs with a high reporting rate is suited for DN and may offer real-time synchrophasor data, such as frequency, ROCOF, and voltage phasors. Furthermore, the optimal deployment of μPMUs at smart radial DN buses reduces the economic burden. Only one main condition is taken into consideration while placing the μPMUs in the modeled IEEE 34 DP model. The condition is to achieve total deployment cost minimization while maintaining full system observability so that the generated events can be observed by at least any of the μPMU to have situational awareness of the event. The best solutions are determined using various optimization techniques, and a complete system observability redundancy index (CSORI) and cost index (CI). Maximum system redundancy is ensured by the highest value of CSORI. CI determines the total cost of optimal μPMUs deployment [34]. In order to identify the critical buses where μPMUs should be installed for effective monitoring, a graph-theoretic approach has been used in [35]. A hybrid approach based on a global search algorithm to determine the optimal subset of buses for μPMU placement is proposed in [36]. A heuristic algorithm based on the k-means clustering technique to determine the optimal placement of PMUs is proposed in [37]. All these investigations (Table 6) show that the test feeder can have 12 optimal locations for cost-effective installations, maintaining full system observability. Out of the two combinations of the 12 μPMU locations, the one with node 850 is considered instead of node 814, as node 850 is a DG connection node, and the downstream node with lateral tappings can be observed; additionally, the regulator (RG10) output parameters need to be monitored, rather than the regulator input parameters, to set the desired tap positions in case the DGs are not integrated. The locations of μPMUs are selected by carrying out a simulation study such that the planned realistic events can be observed by the node voltages and line currents reported by these μPMUs.
The DP does not have a μPMU component in the toolbox, but the features of the μPMU can be created as output while generating the output data of the nodes and line sections, such as the magnitude of the voltage, current, and their angles, frequency, etc. This data-generation study focused on the magnitude of μPMU node voltages and line currents and angles. These parameters will be collected from the 12 optimally placed μPMUs in the feeder as shown in Figure 2. Out of the 12 μPMUs, 11 are three-phase μPMUs and one is a single-phase μPMU.

3.4. Sizing and Placement of DGs

There are many different sorts of DGs, from conventional to renewable; however, this study is not specifically focused on any one kind of DG source. The main goal of this effort is to integrate DGs at various places in order to recognize and record their influence during various real-time occurrences using μPMU data. Each DG was modeled as a synchronous generator. The power levels utilized for a DG intended to supply 20% of the test feeder load, and the DG modeling parameters displayed in Table 7 were acquired from [38]. The parameters that were not listed adhered to the DP defaults.
To link the DGs to the nodes, a 500 kVA transformer in a delta–delta arrangement was used. The 500 kVA line transformer utilized in the selected feeder served as the basis for the modeling parameters for these transformers. DGs were only installed on the three-phase nodes and the three-phase radial tappings or laterals because only three-phase DGs were used. With the exception of the substation and the voltage regulators, radial tapping from 832 is the only area of the circuit that operates at the 4.16 kV level. It also houses the circuit’s line transformer. The only capacitors in the circuit are located at 844 and 848 on radial tapping from 834. There were numerous DG places that were feasible. The modifications tried were on the radial tapping points as well as the main feeder, close to and distant from the substation, close to the voltage regulators. The connection nodes 802, 840, 848, 850, 852, 862, and 890 were specifically evaluated. Each DG was built with a default size of 20% of the original feeder load, resulting in a 410 kVA unit with a 350 kW planned real-power output. The study’s focus is on the use of DGs at various feeder locations to produce data for various real-time occurrences and their classes.

3.5. μPMU-Based Real-Time Event Data Generation

At a 120 Hz sampling rate (or one sample every 0.008333 s), the optimally placed μPMUs record 4 fundamental measurements on 3 phases, for a total of 12 measurement channels: voltage magnitude, current magnitude, voltage phase angle and current phase angle. This paper generates 30 min of μPMU data considering the planned and unplanned outage events in the real rural overhead DN. The author defines a total of 109 real-time events from his real grid operation experience. This includes 62 planned and 47 unplanned network events. The 12 μPMUs measure and report 16,848,000 data points in 30 min.

3.5.1. Realistic Real-Time Events

The unbalanced overhead DN has quite a lot of real-time events, as it is inherent in nature with many complexities to be addressed. The idea behind selecting an unbalanced overhead DN is to incorporate all the relevant real-time events that happen in the network. The events range from planned to unplanned events. Even though most of the events can fall into both categories, the events that are created by the triggering of protection devices are considered unplanned, and all the scheduled events are considered as planned events. To keep the events more realistic, almost all the event types are included, covering different components and locations in the test feeder. A total of 109 realistic events were generated using the test feeder model as listed in Table A4 of Appendix A. The events include capacitor bank switching, circuit breaker (CB) switching, CB trip, DG switching, DG trip, line de-energization, line energization, load switching, load trip, overhead line (OHL) jumper events, faults events, temporary faults, tap-changer events, transformer outage and energization, transformer trip, fault-clearing events and low-voltage complaints from customers.

3.5.2. Data-Generation Settings in DP

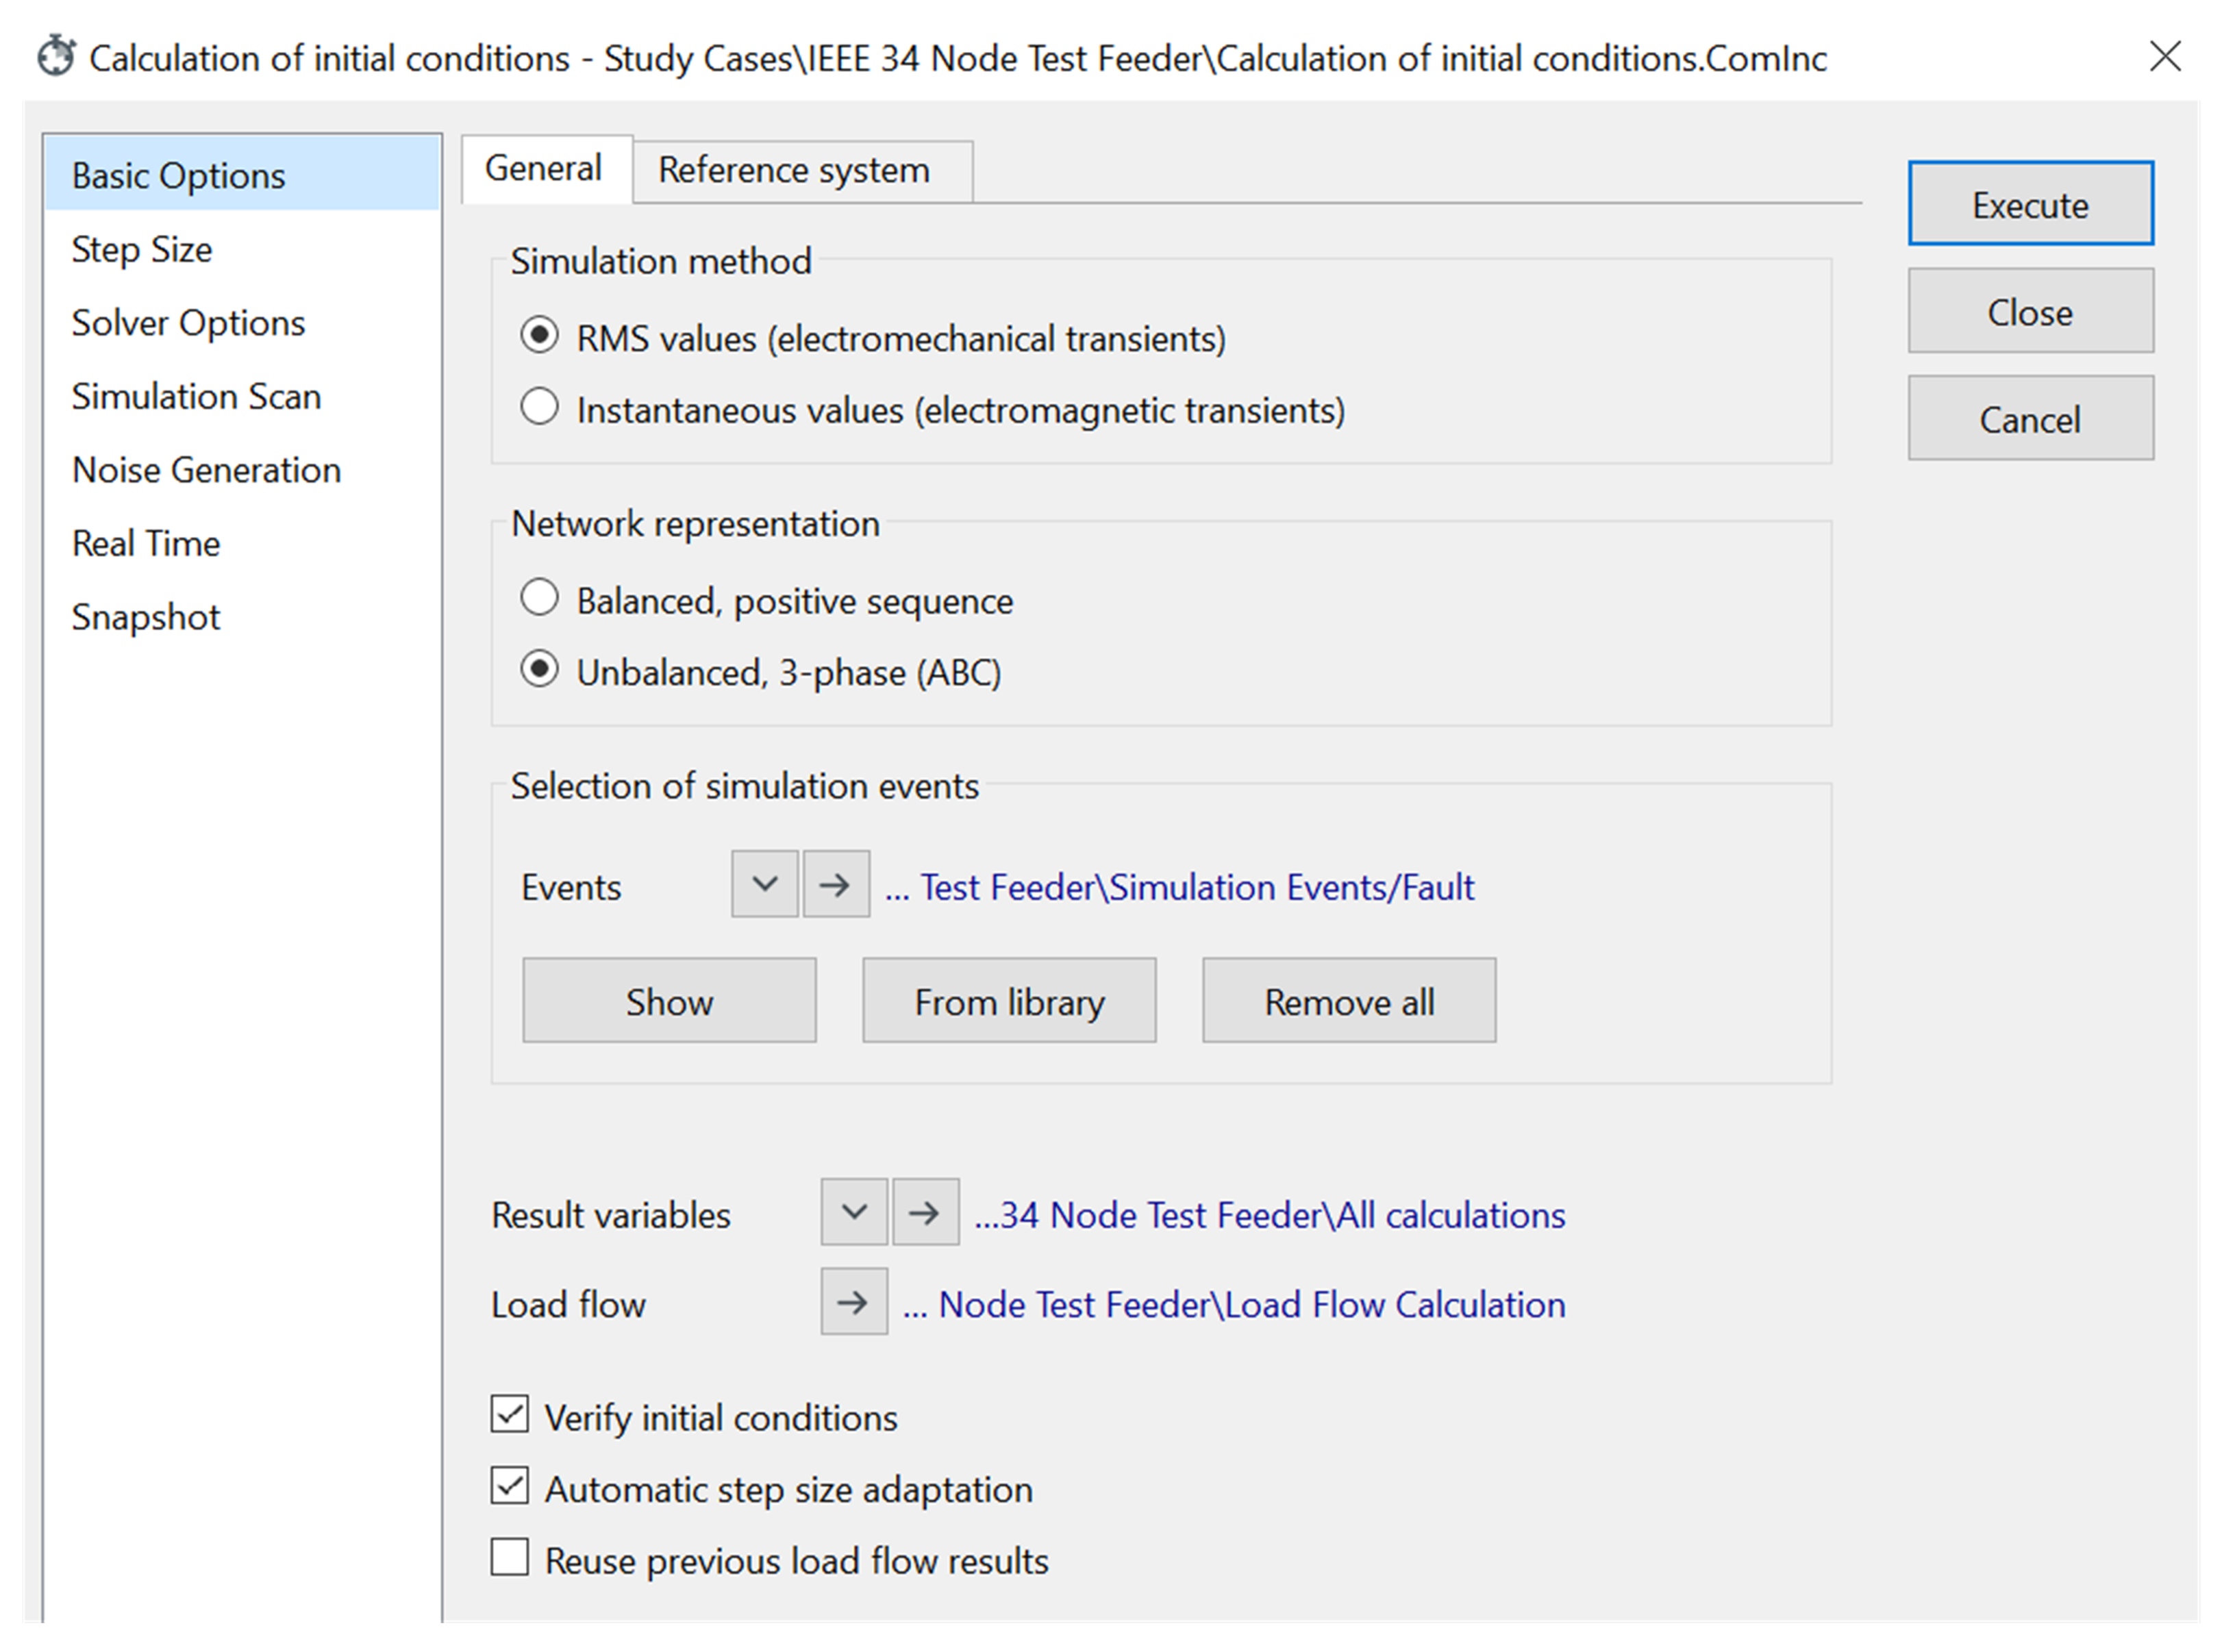
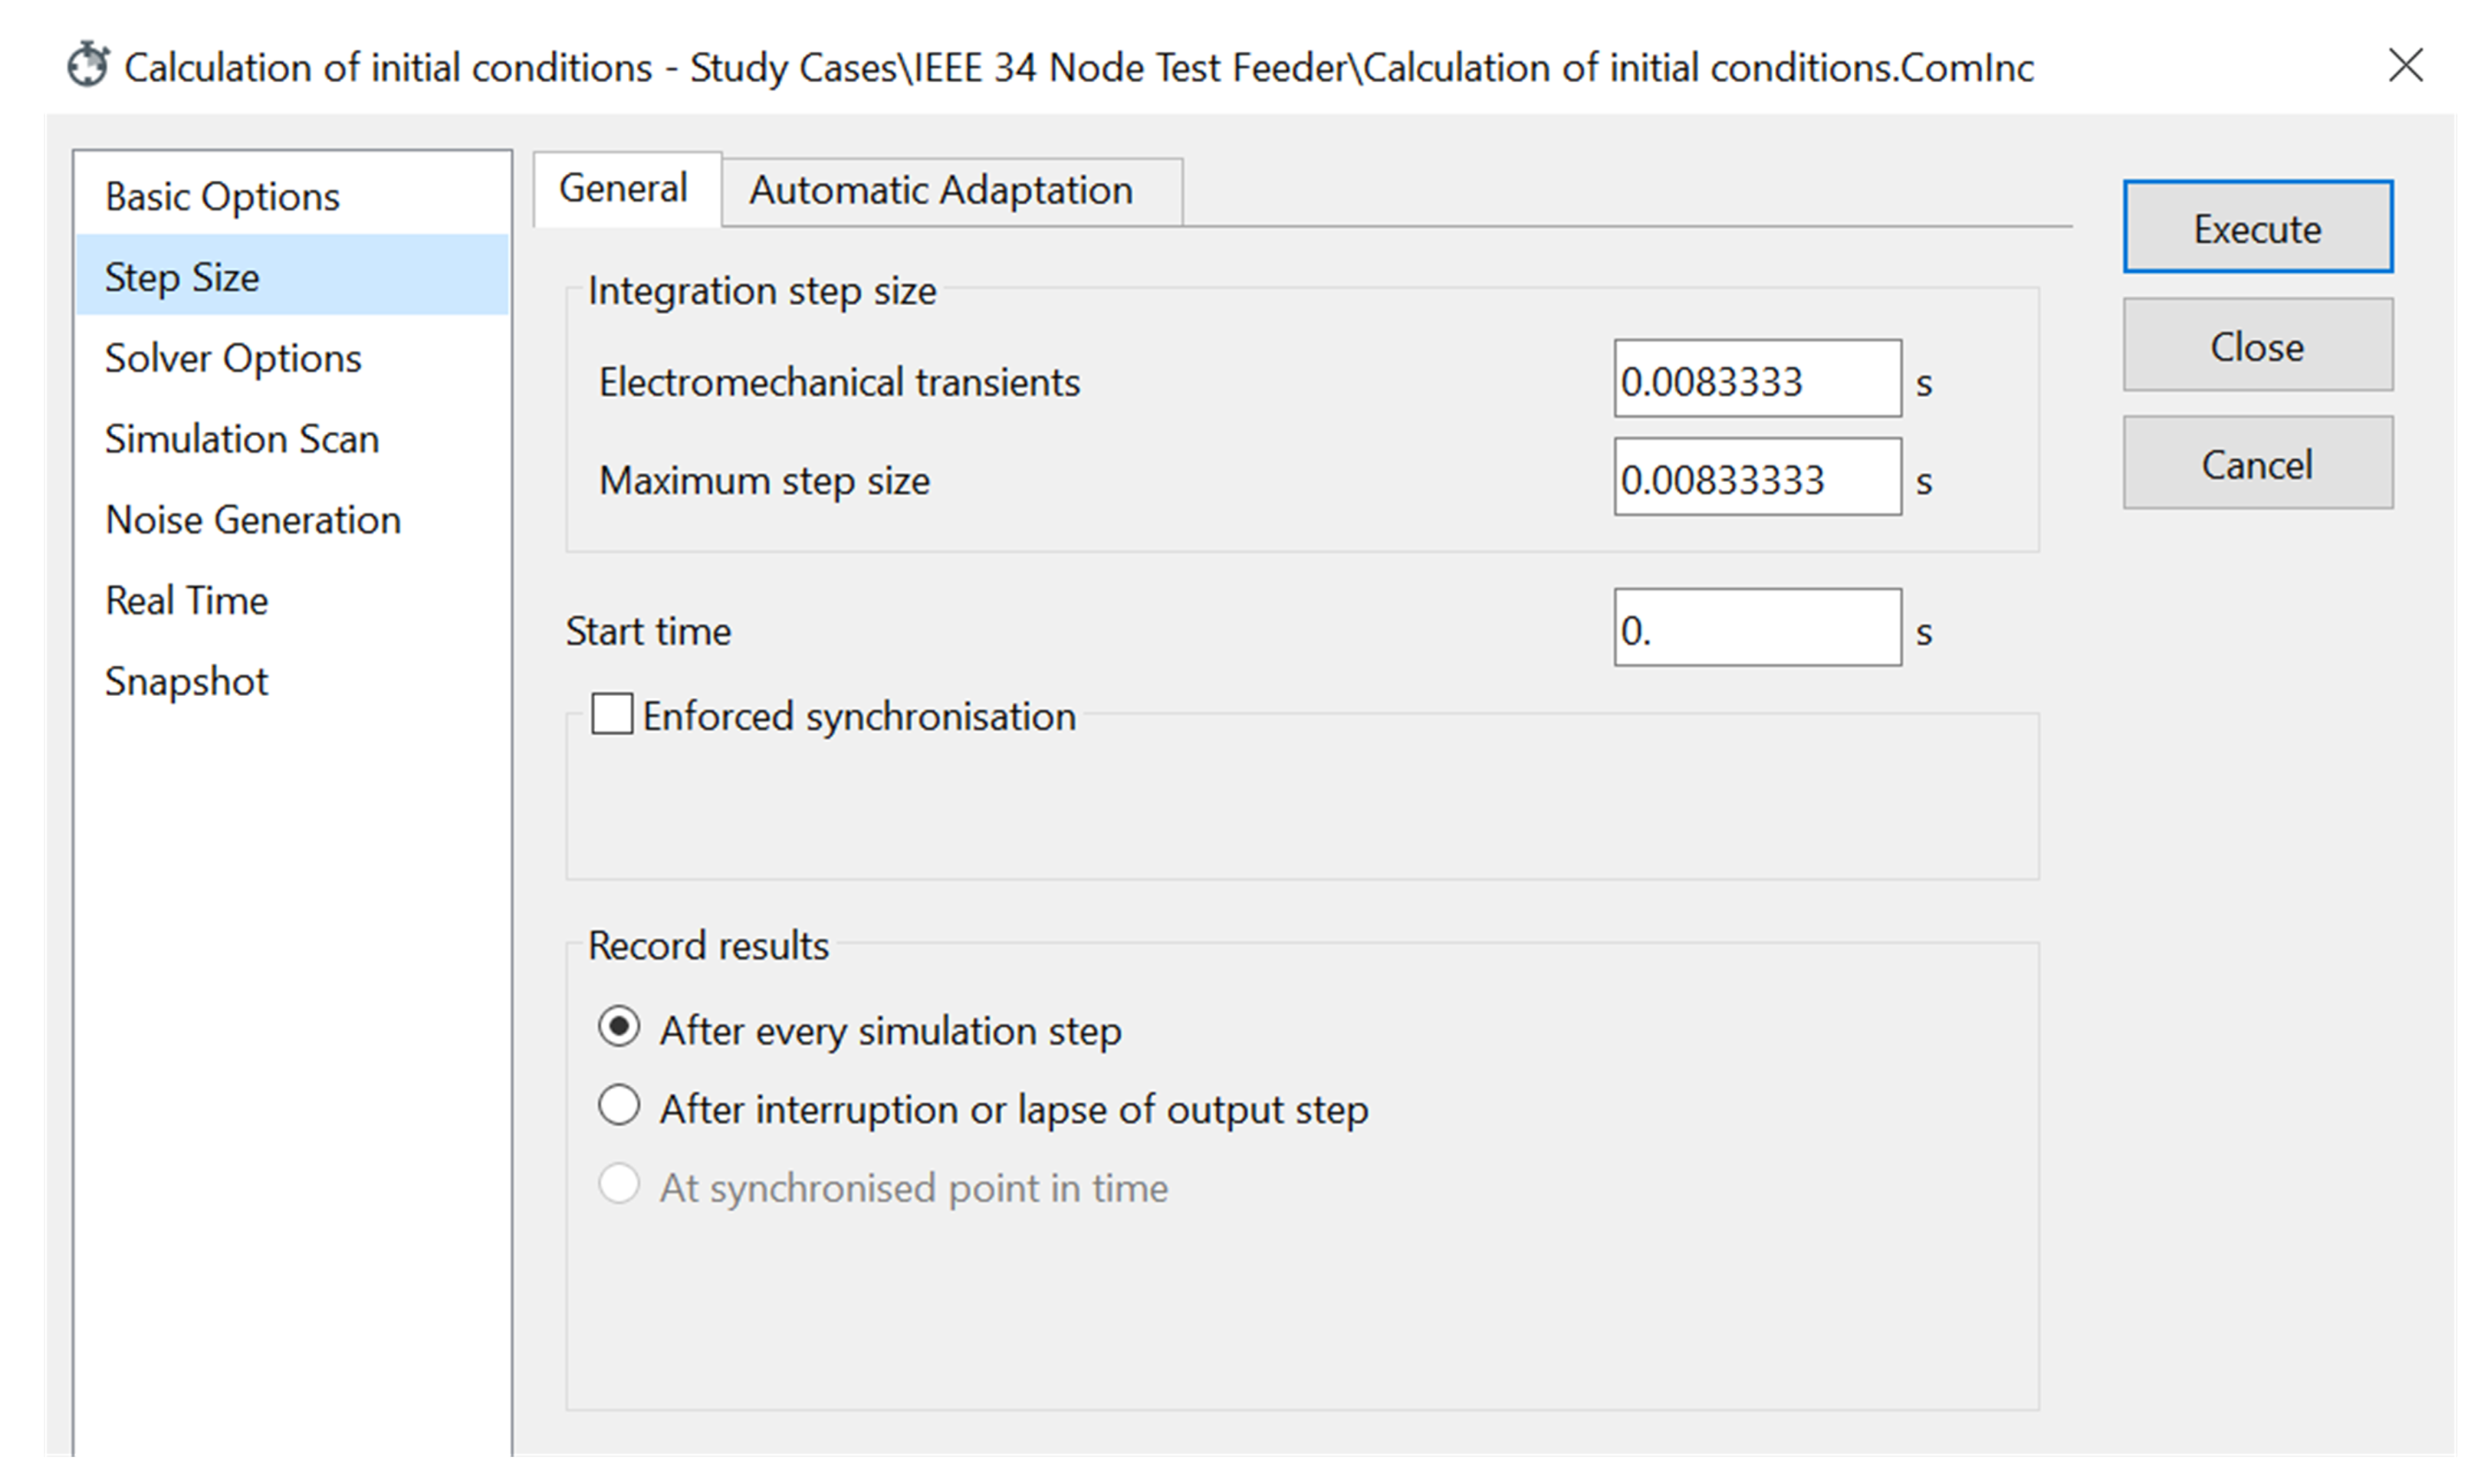
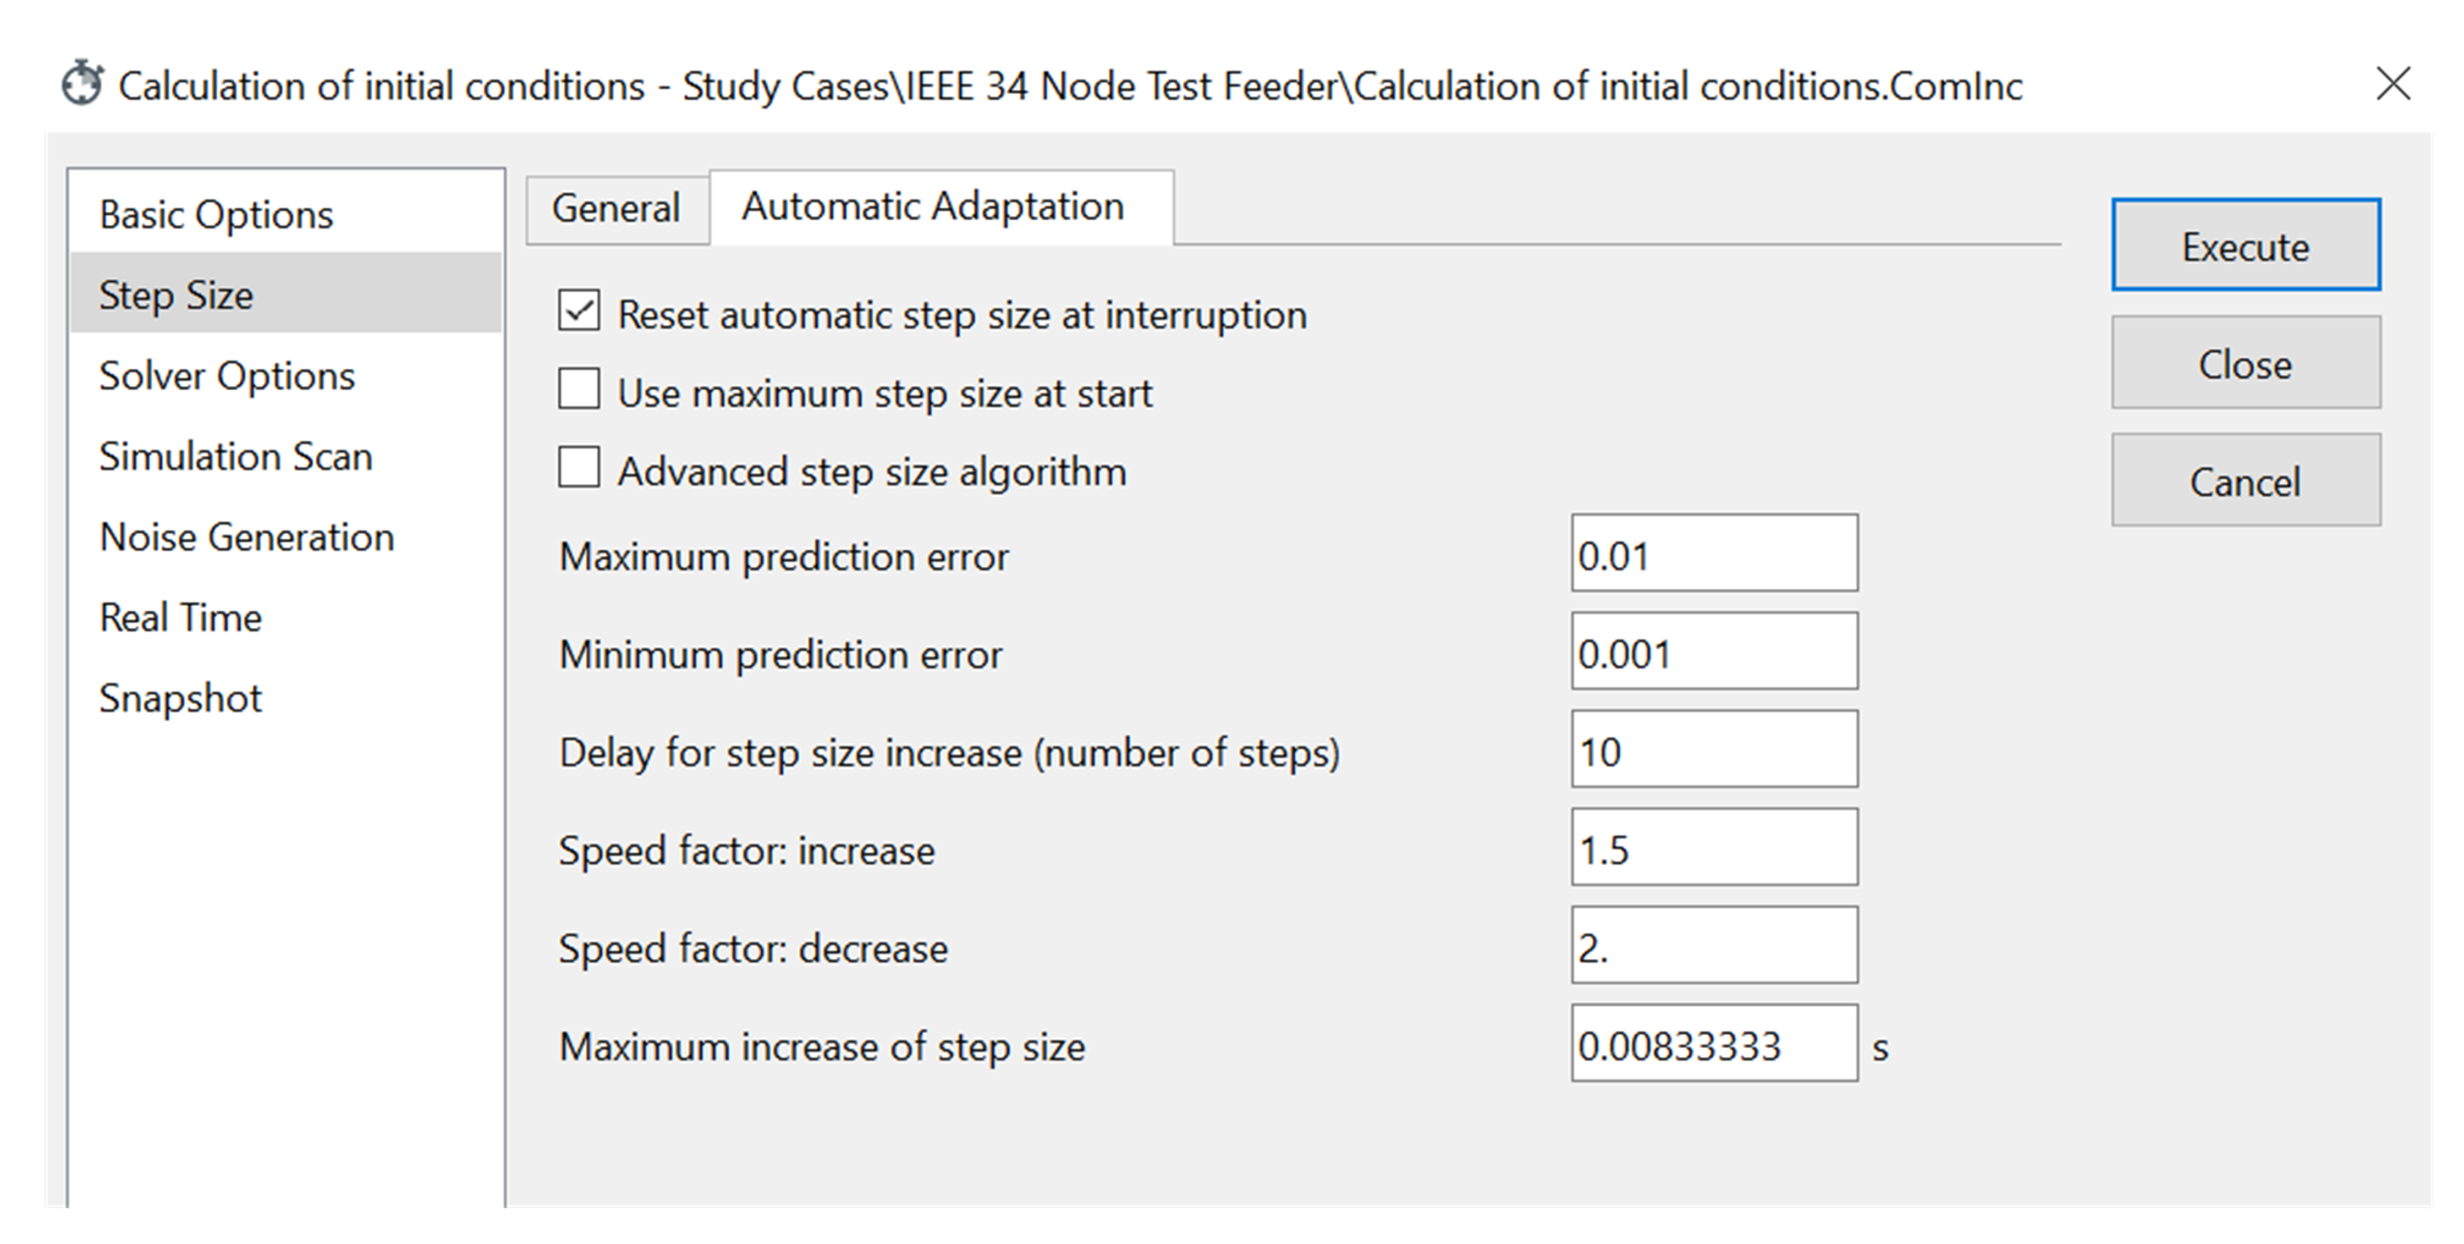
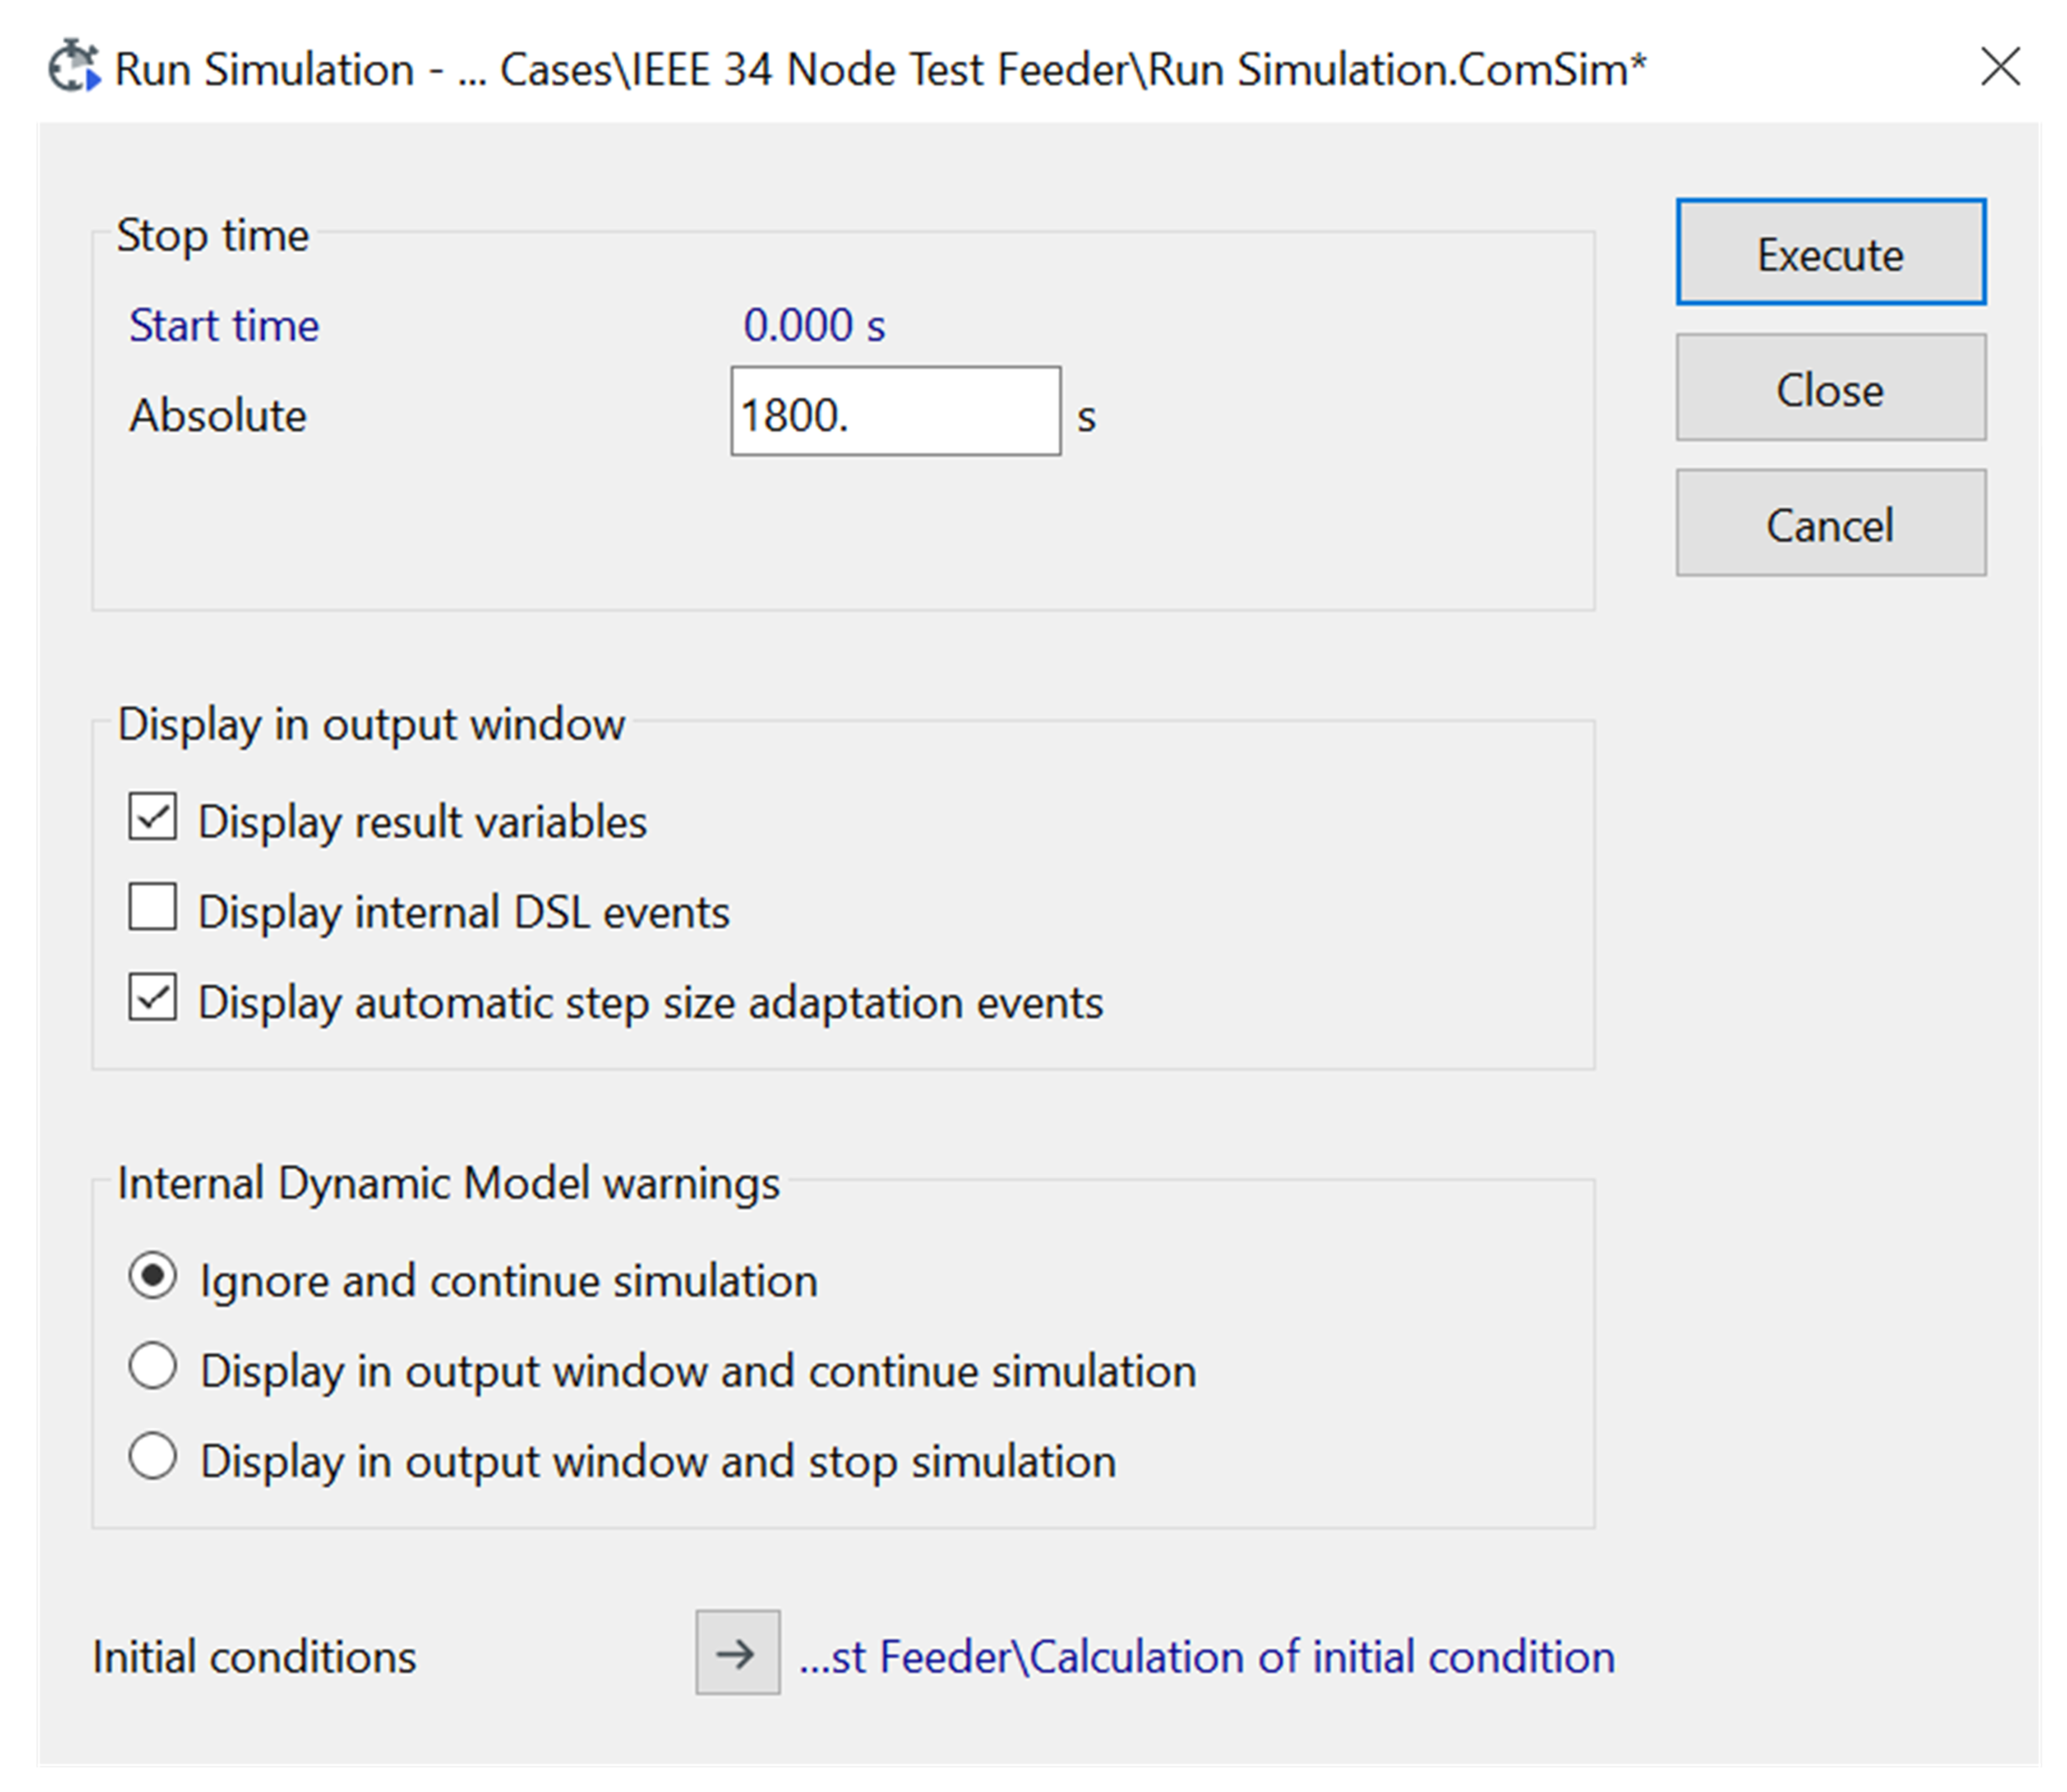
The chosen test feeder is flawlessly modeled in DP and is absolutely required for the data generated. The events are defined in relation to the chosen DN model elements. To categorize the events as switching, fault, or fault-clearing events, specific components are chosen. The features include a variety of execution time options in hour, minute, and second formats, as well as options for modifying the phase type individually. Moreover, they enable the usage of various fault classes, impedance levels, and the percentage of fault location distance in the line section. In order for the generated data resolution to match that of the actual data supplied by the PMU, the data-generation settings must be chosen with extreme care. With the DP settings listed below, the RMS simulation is run with all of the simulation occurrences. For the unbalanced, three-phase ABC system, RMS values (electrical and mechanical transients) with a step size of 0.008333 are chosen as the default initial condition settings (120 measurements per second). The default values are chosen for all other simulation settings. The main simulation settings used in the DP for the data generation are shown in Figure A3, Figure A4, Figure A5 and Figure A6 of Appendix B.

3.5.3. Event Simulations and Plots

By choosing the relevant component in the model and providing the type of event, execution time, selected element action, phases impacted, % of line section fault location, fault type, impedance, and other parameters, 109 intended events are simulated. If any adjustments to the simulation settings are required, the list of simulation events can be further changed.
Twelve μPMUs were already installed at the optimal nodes; hence, the focus of this study is exclusively on measuring them. The study only considers the node voltage (line-to-neutral) and the line currents, despite the fact that PMU devices can monitor a wide range of properties. The data-production criteria were designed to take into consideration these data for future work on event detection, categorization, and section identification. The unbalanced loading on the test feeder, which comprises a number of single-phase to-neutral and two-phase to-neutral loads, is what causes the phase-to-neutral voltage to be measured. The two fundamental graphs generated for each PMU are phase current vs. time and node voltage (phase to neutral) vs. time.

4. Results

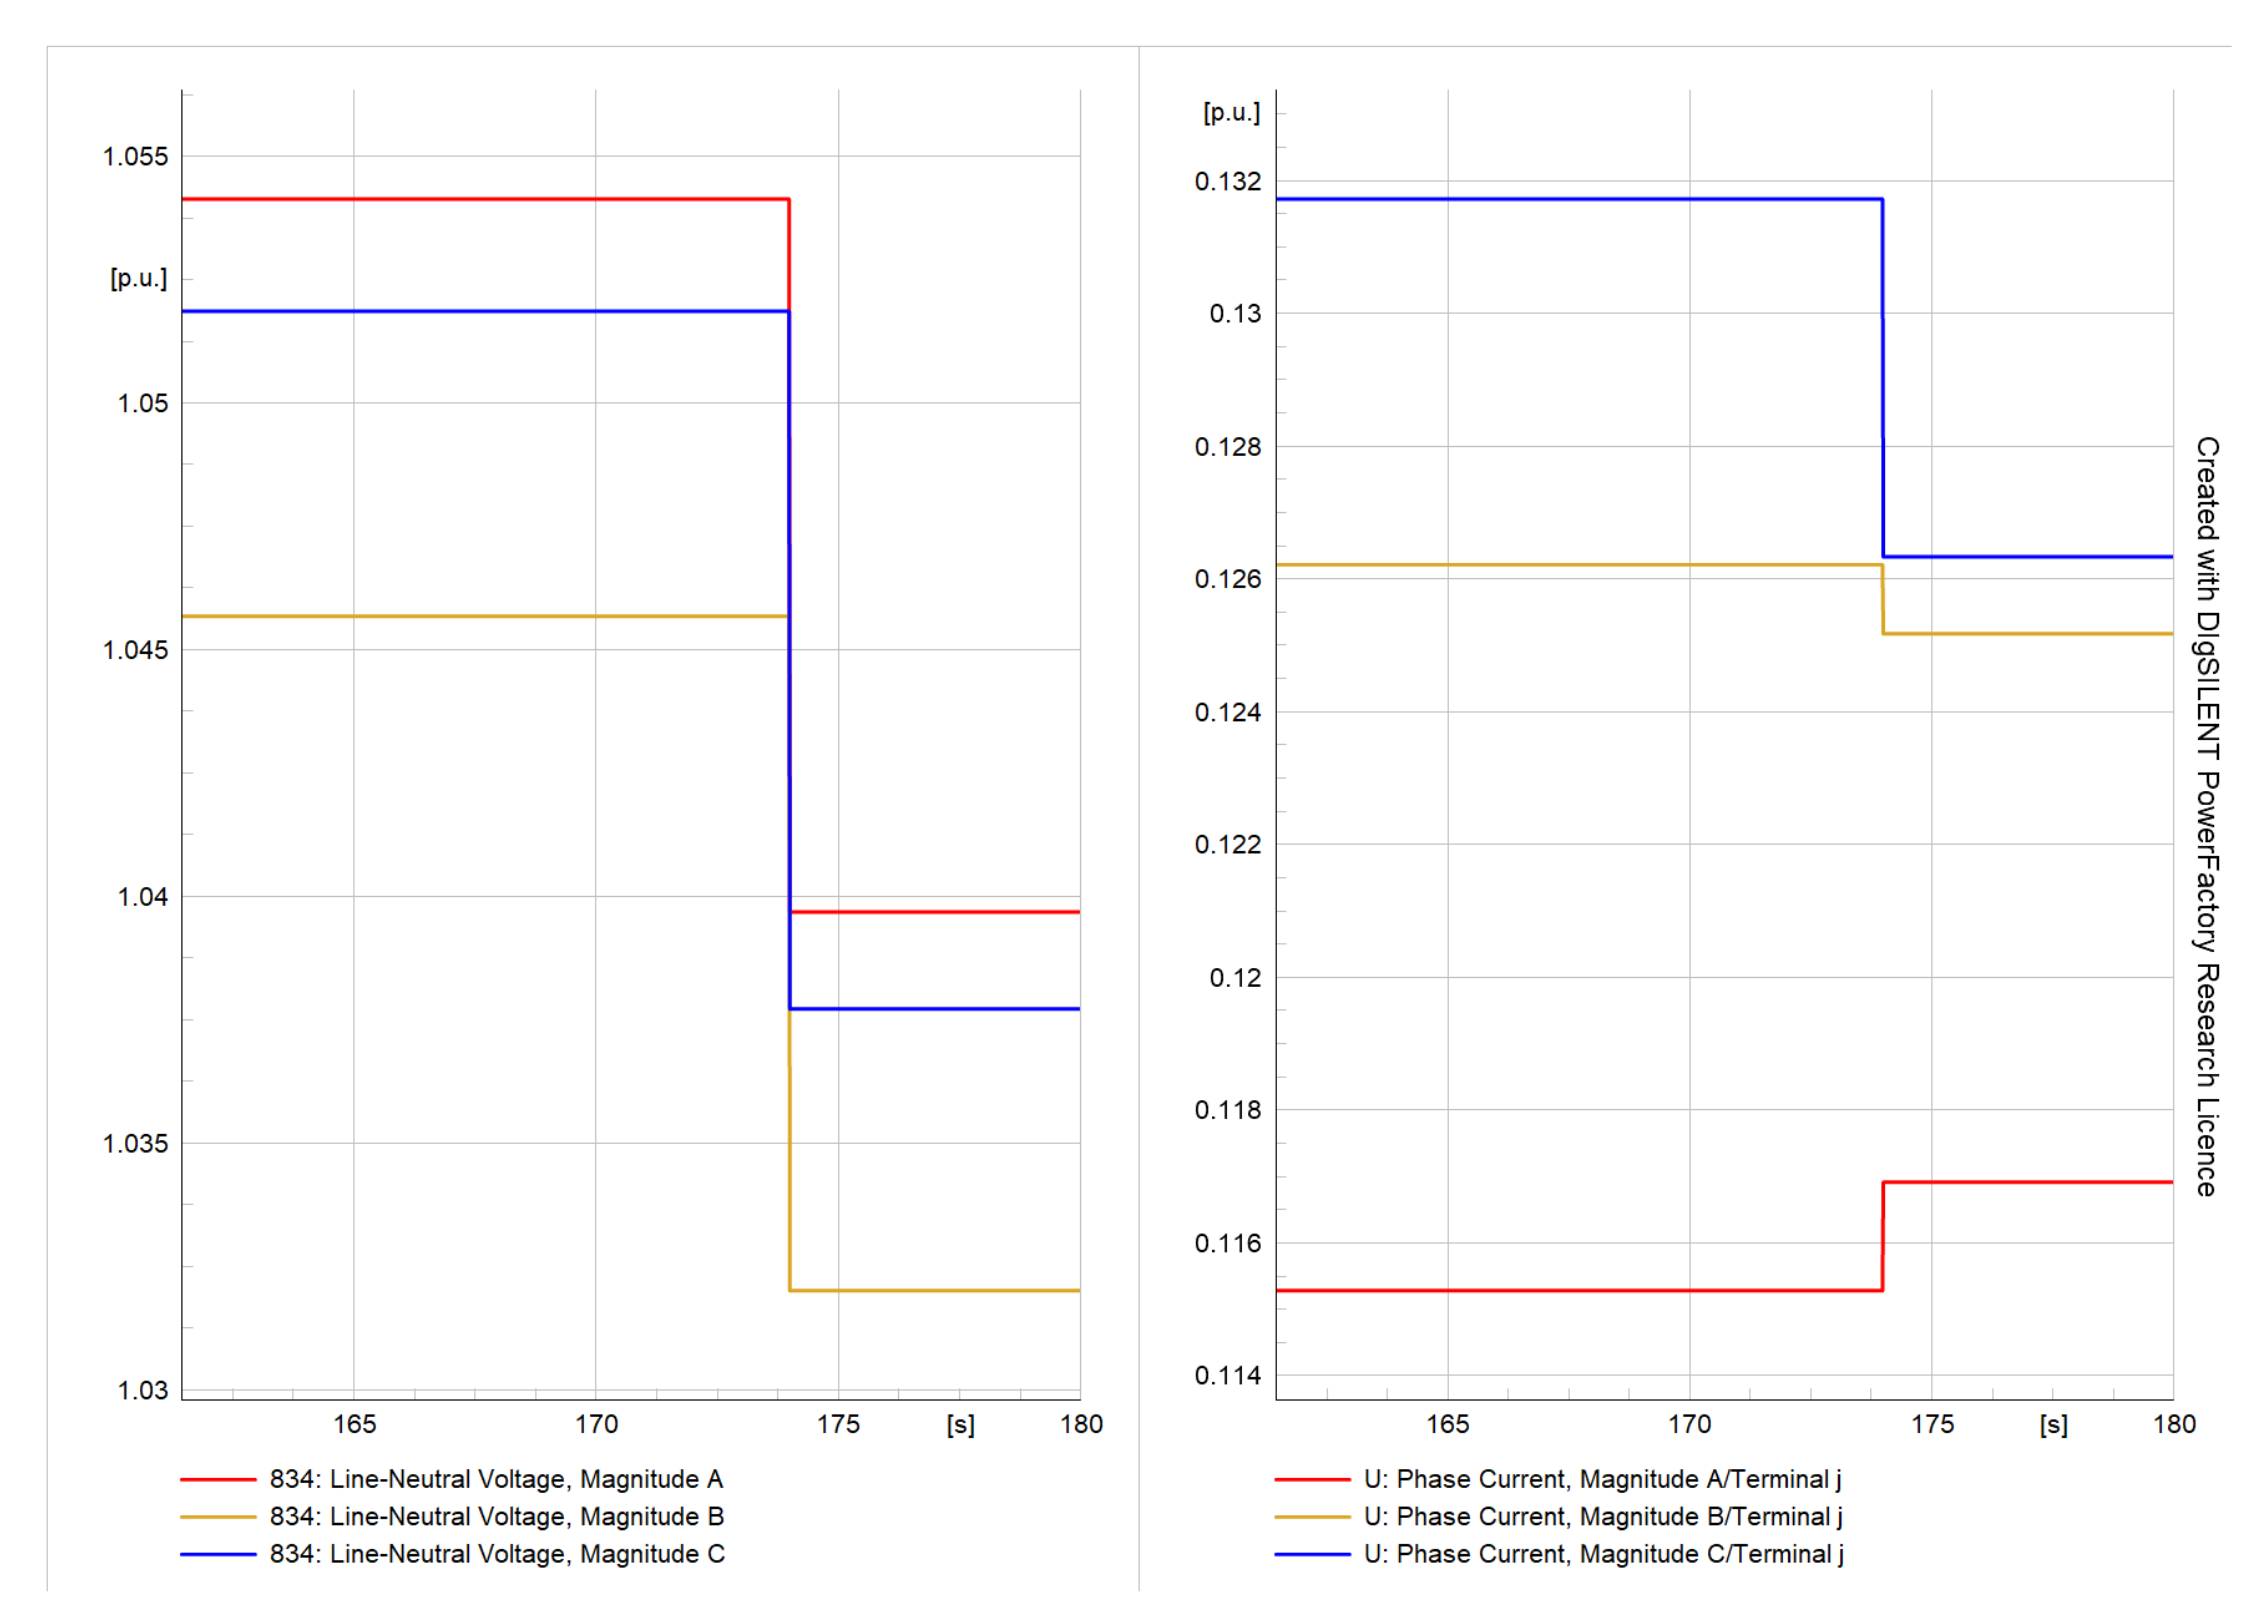
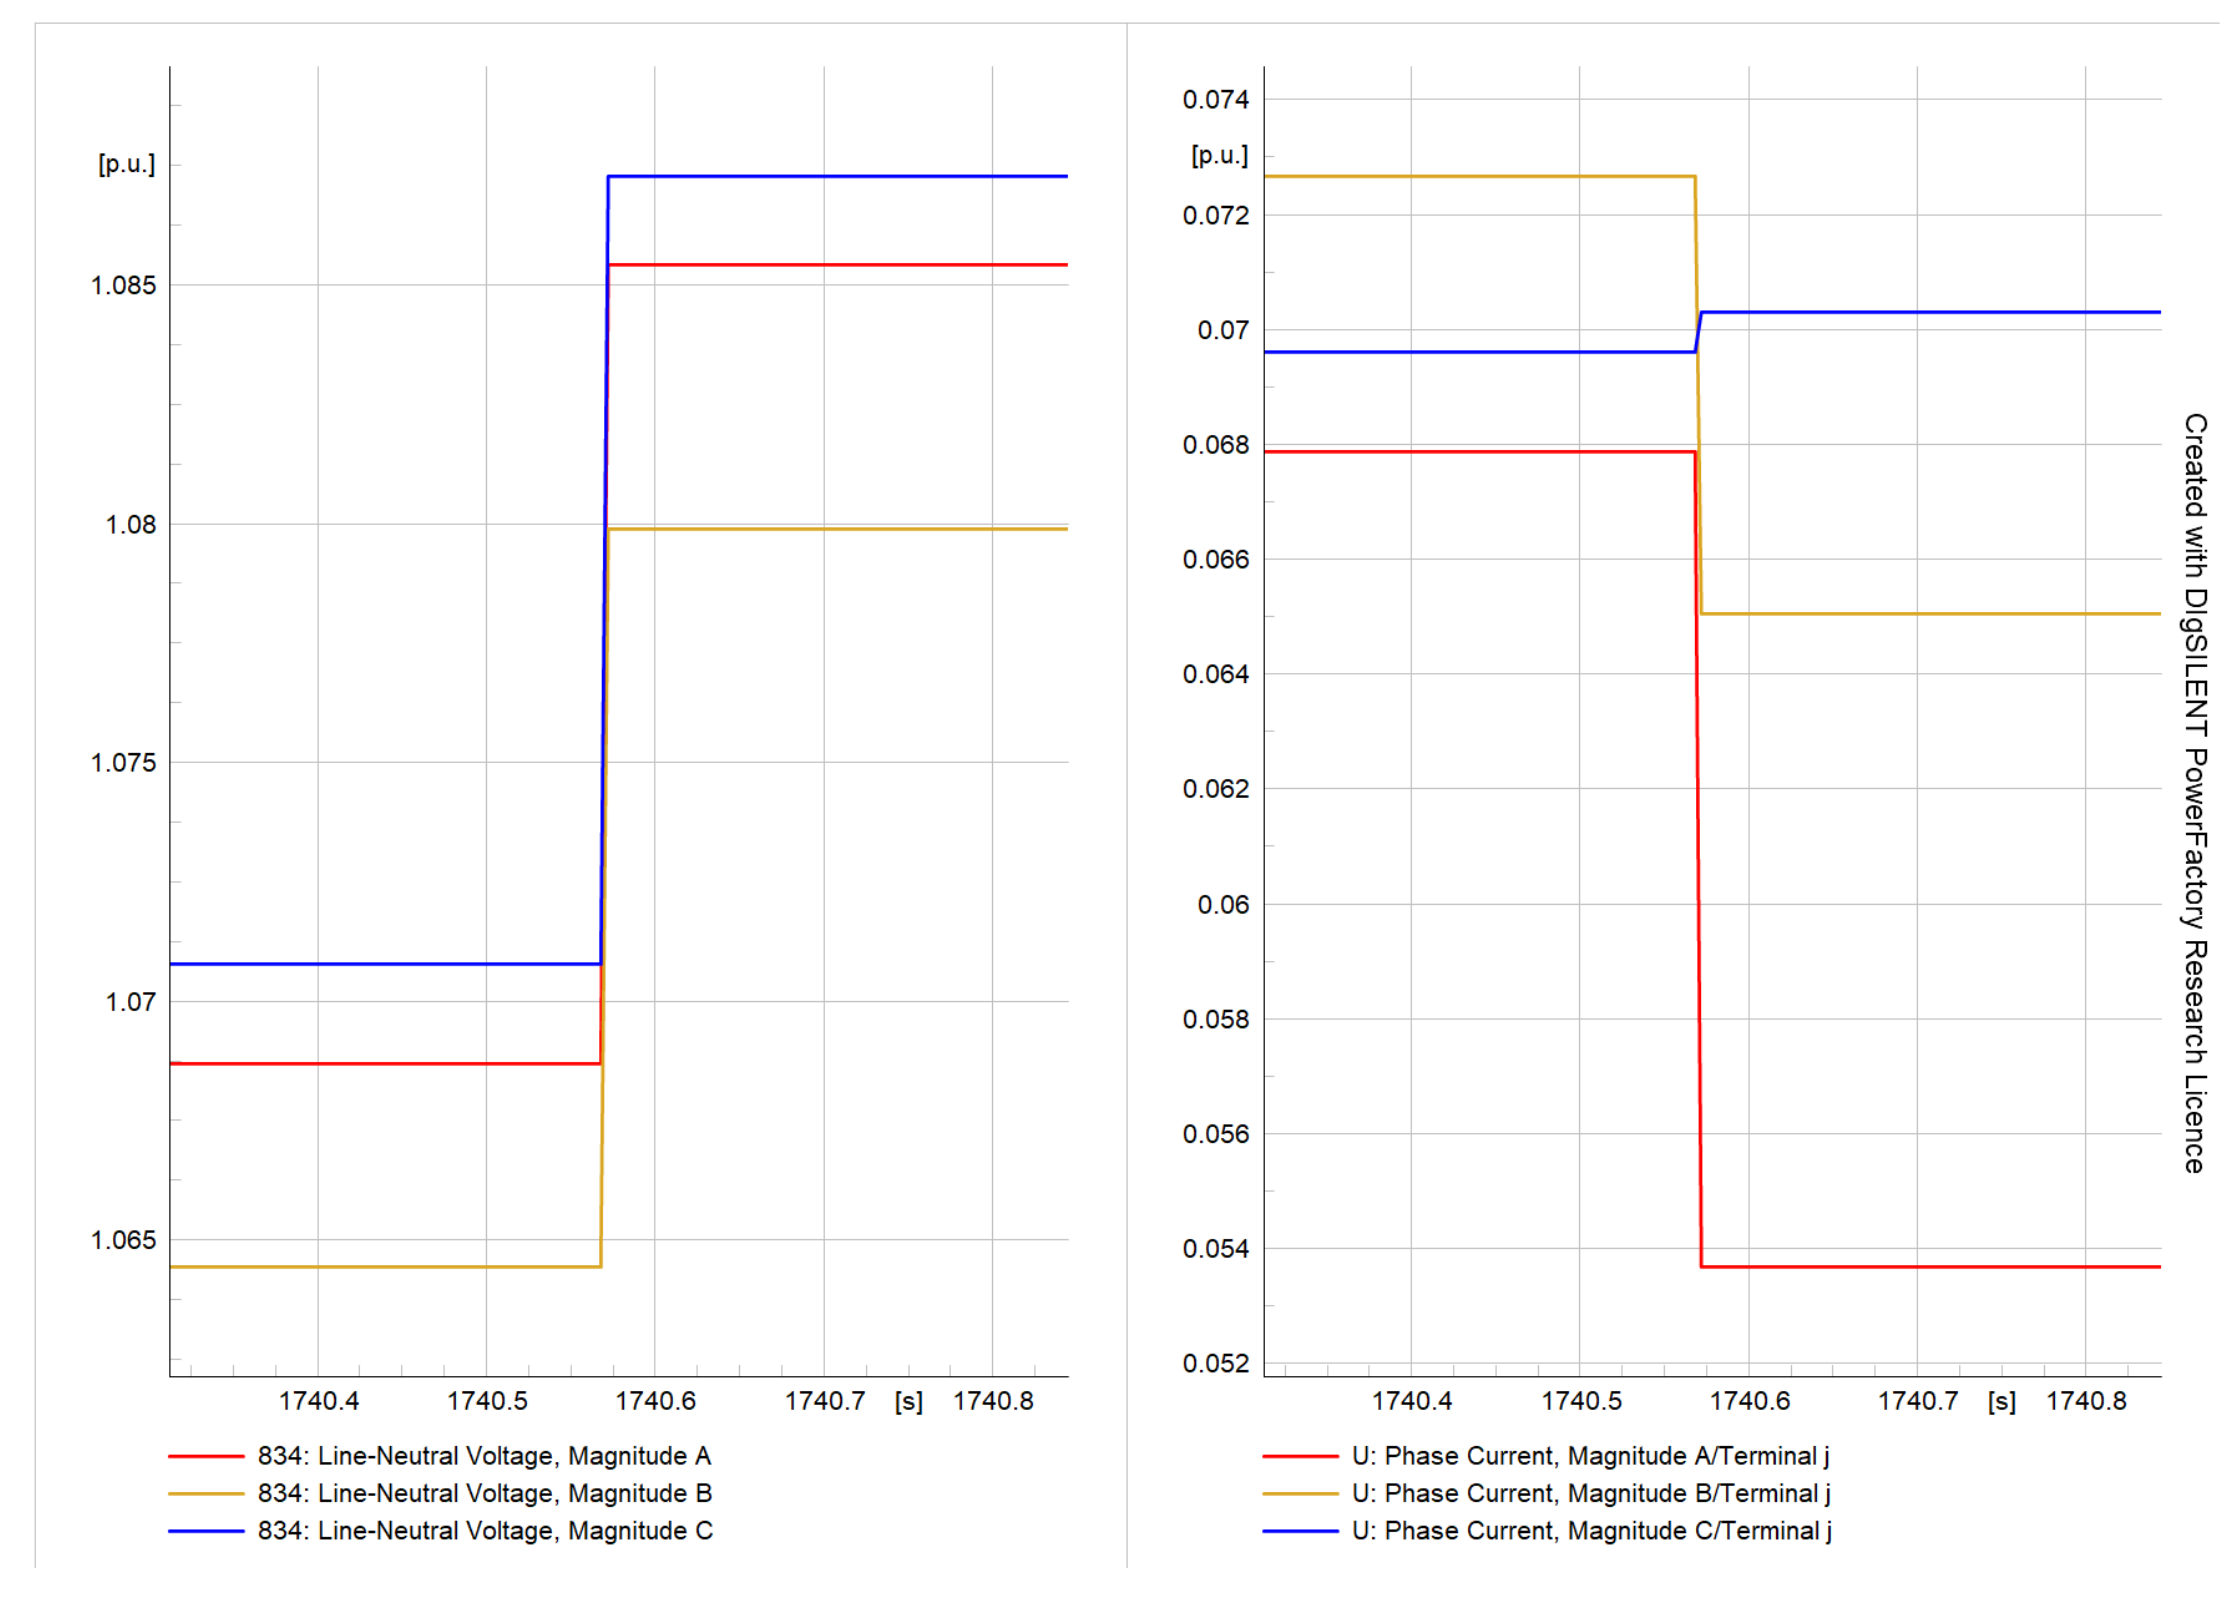
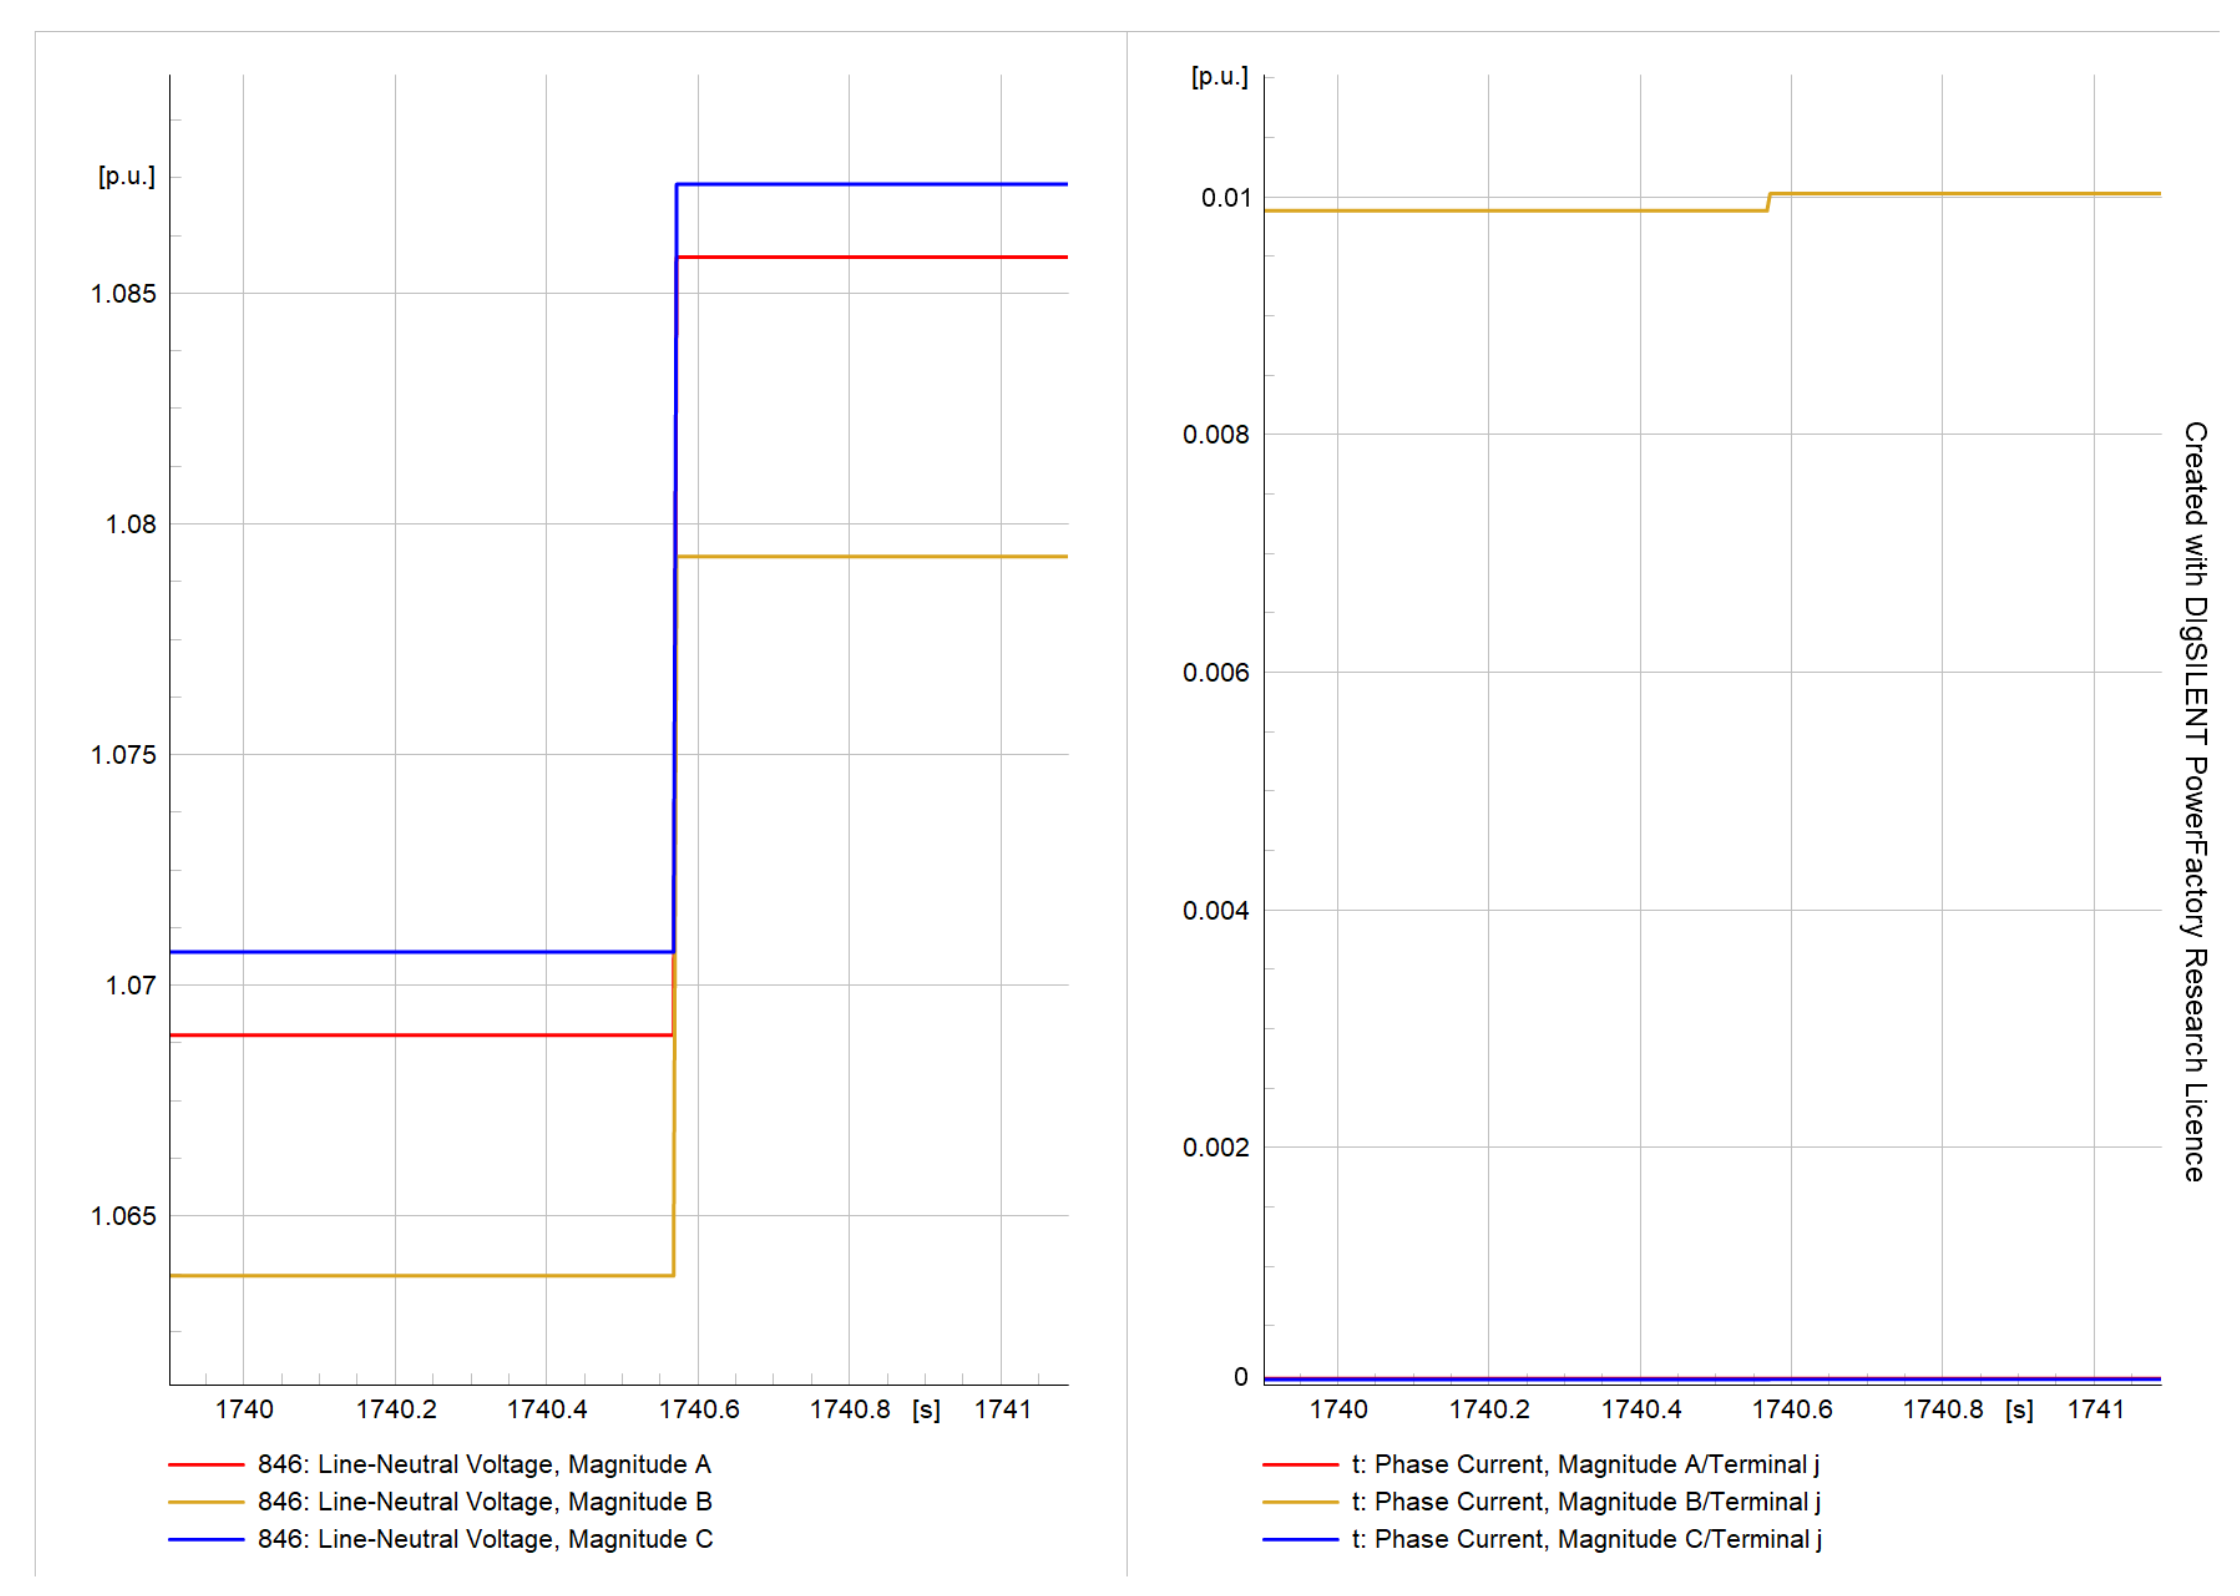
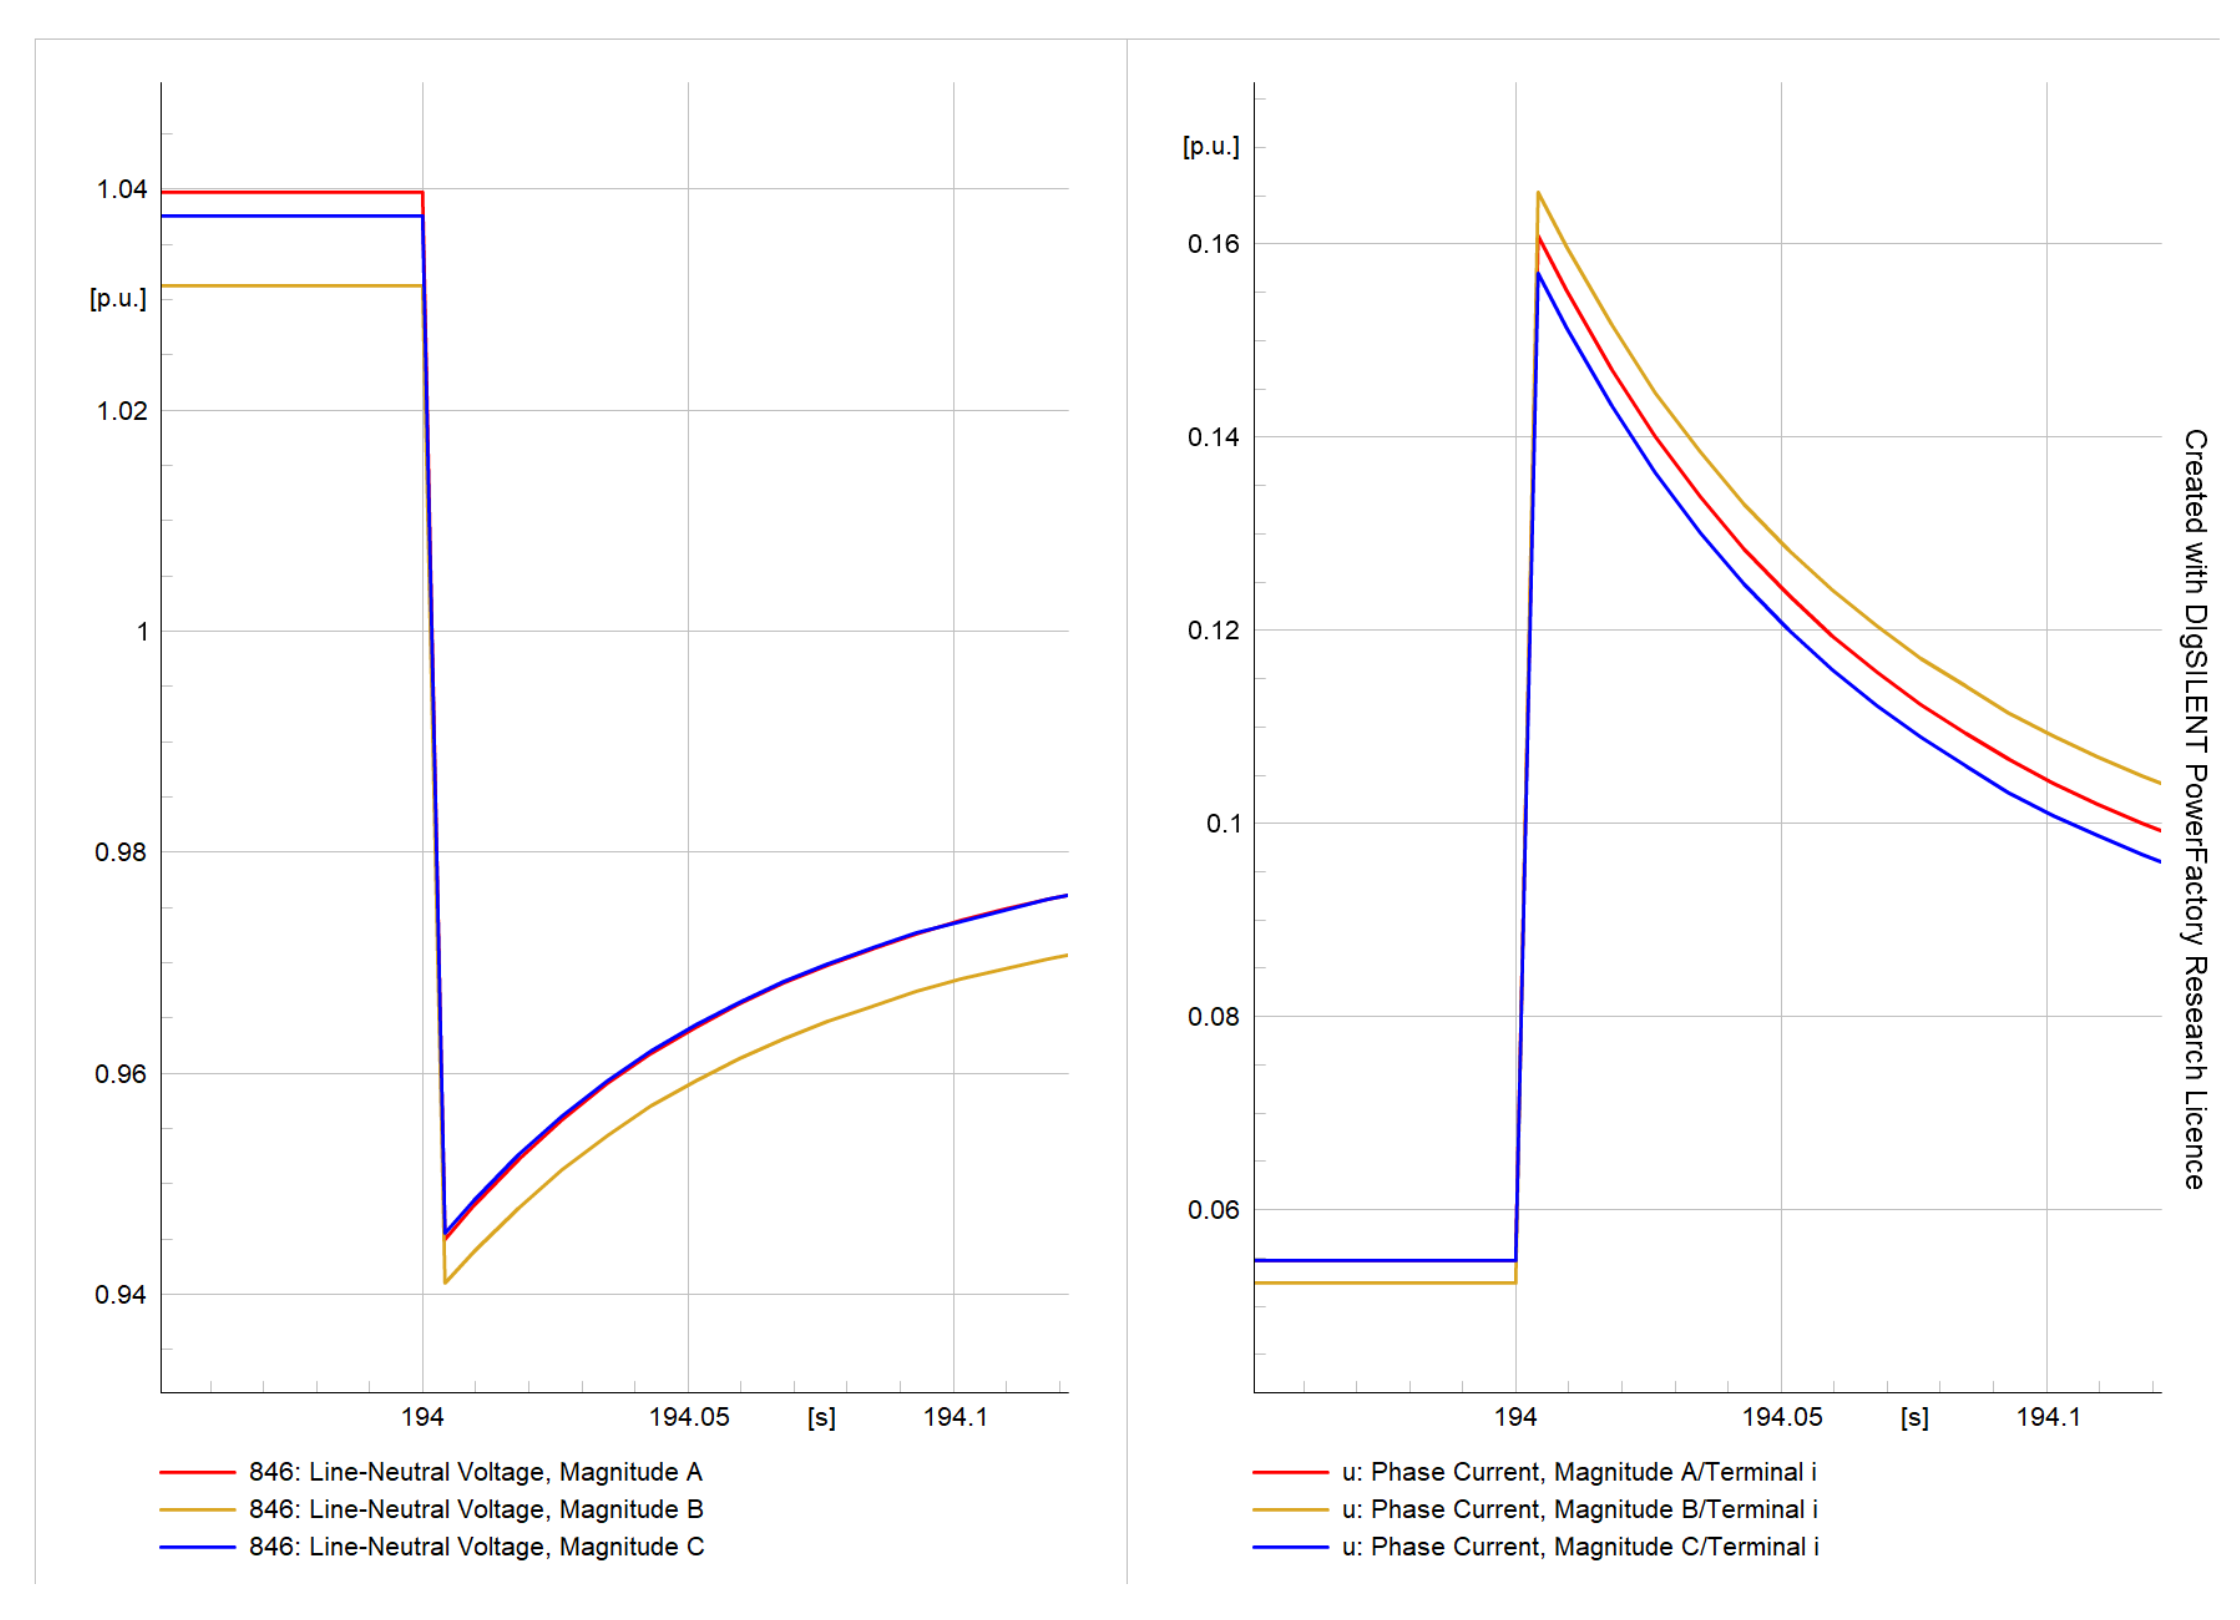
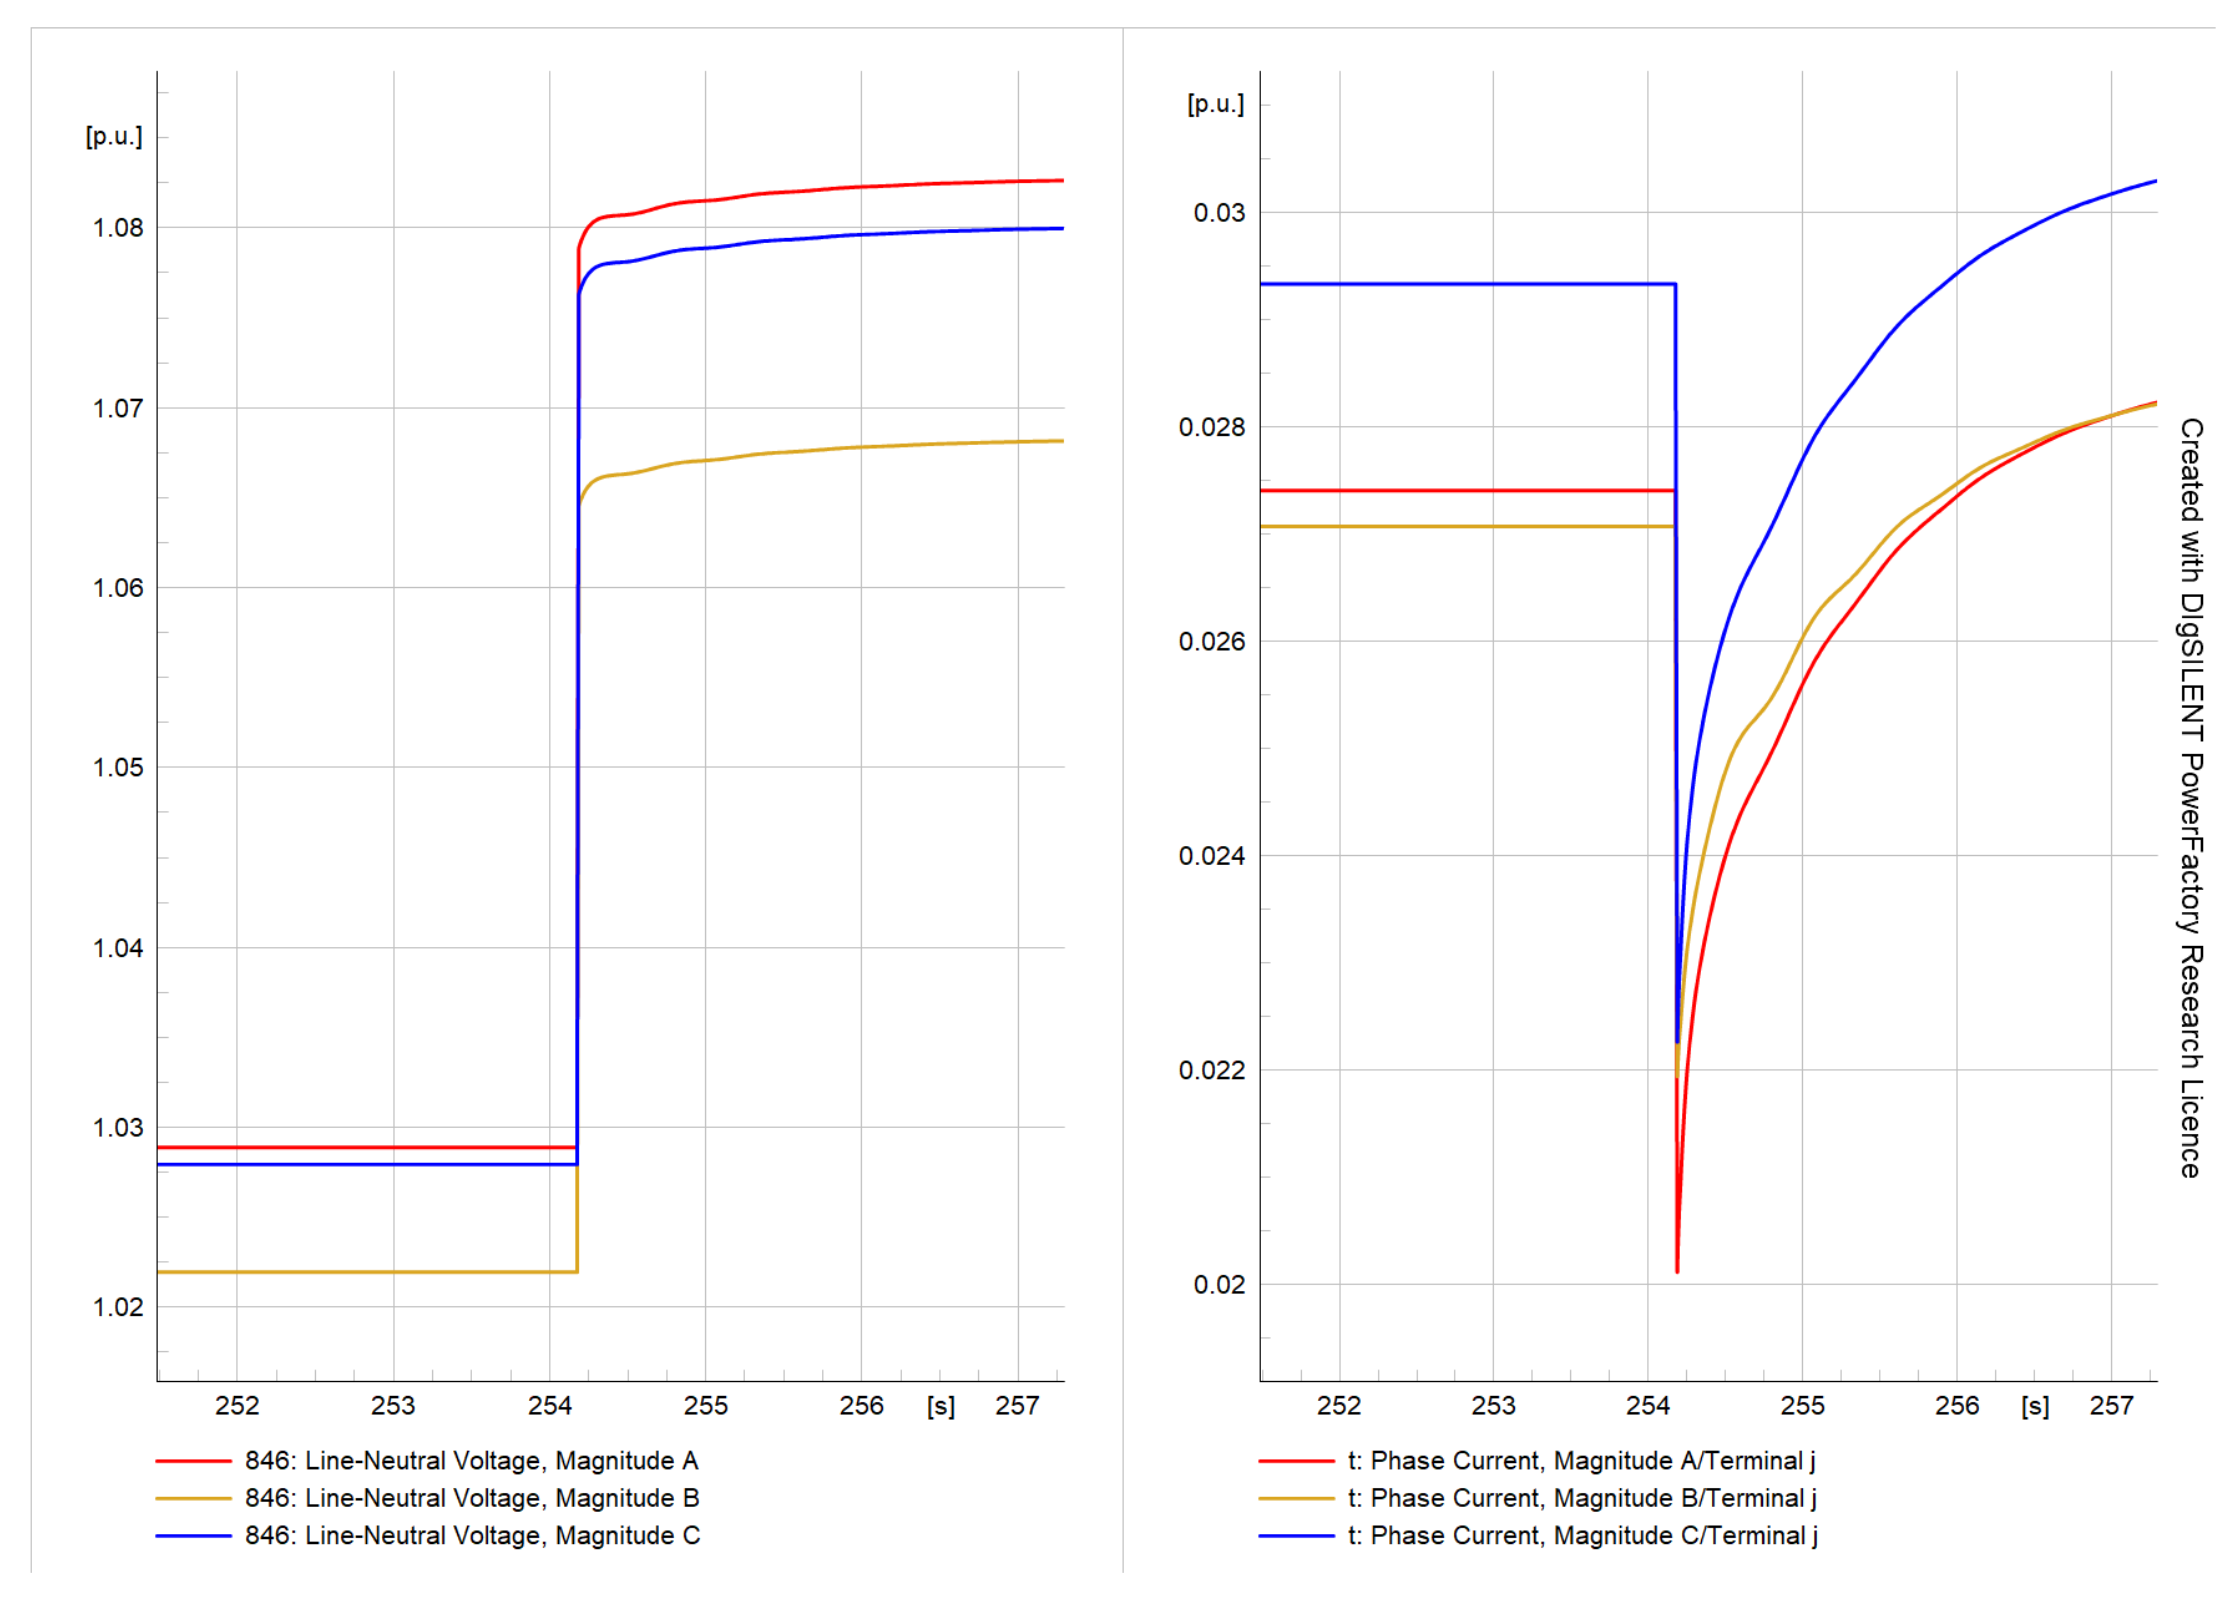
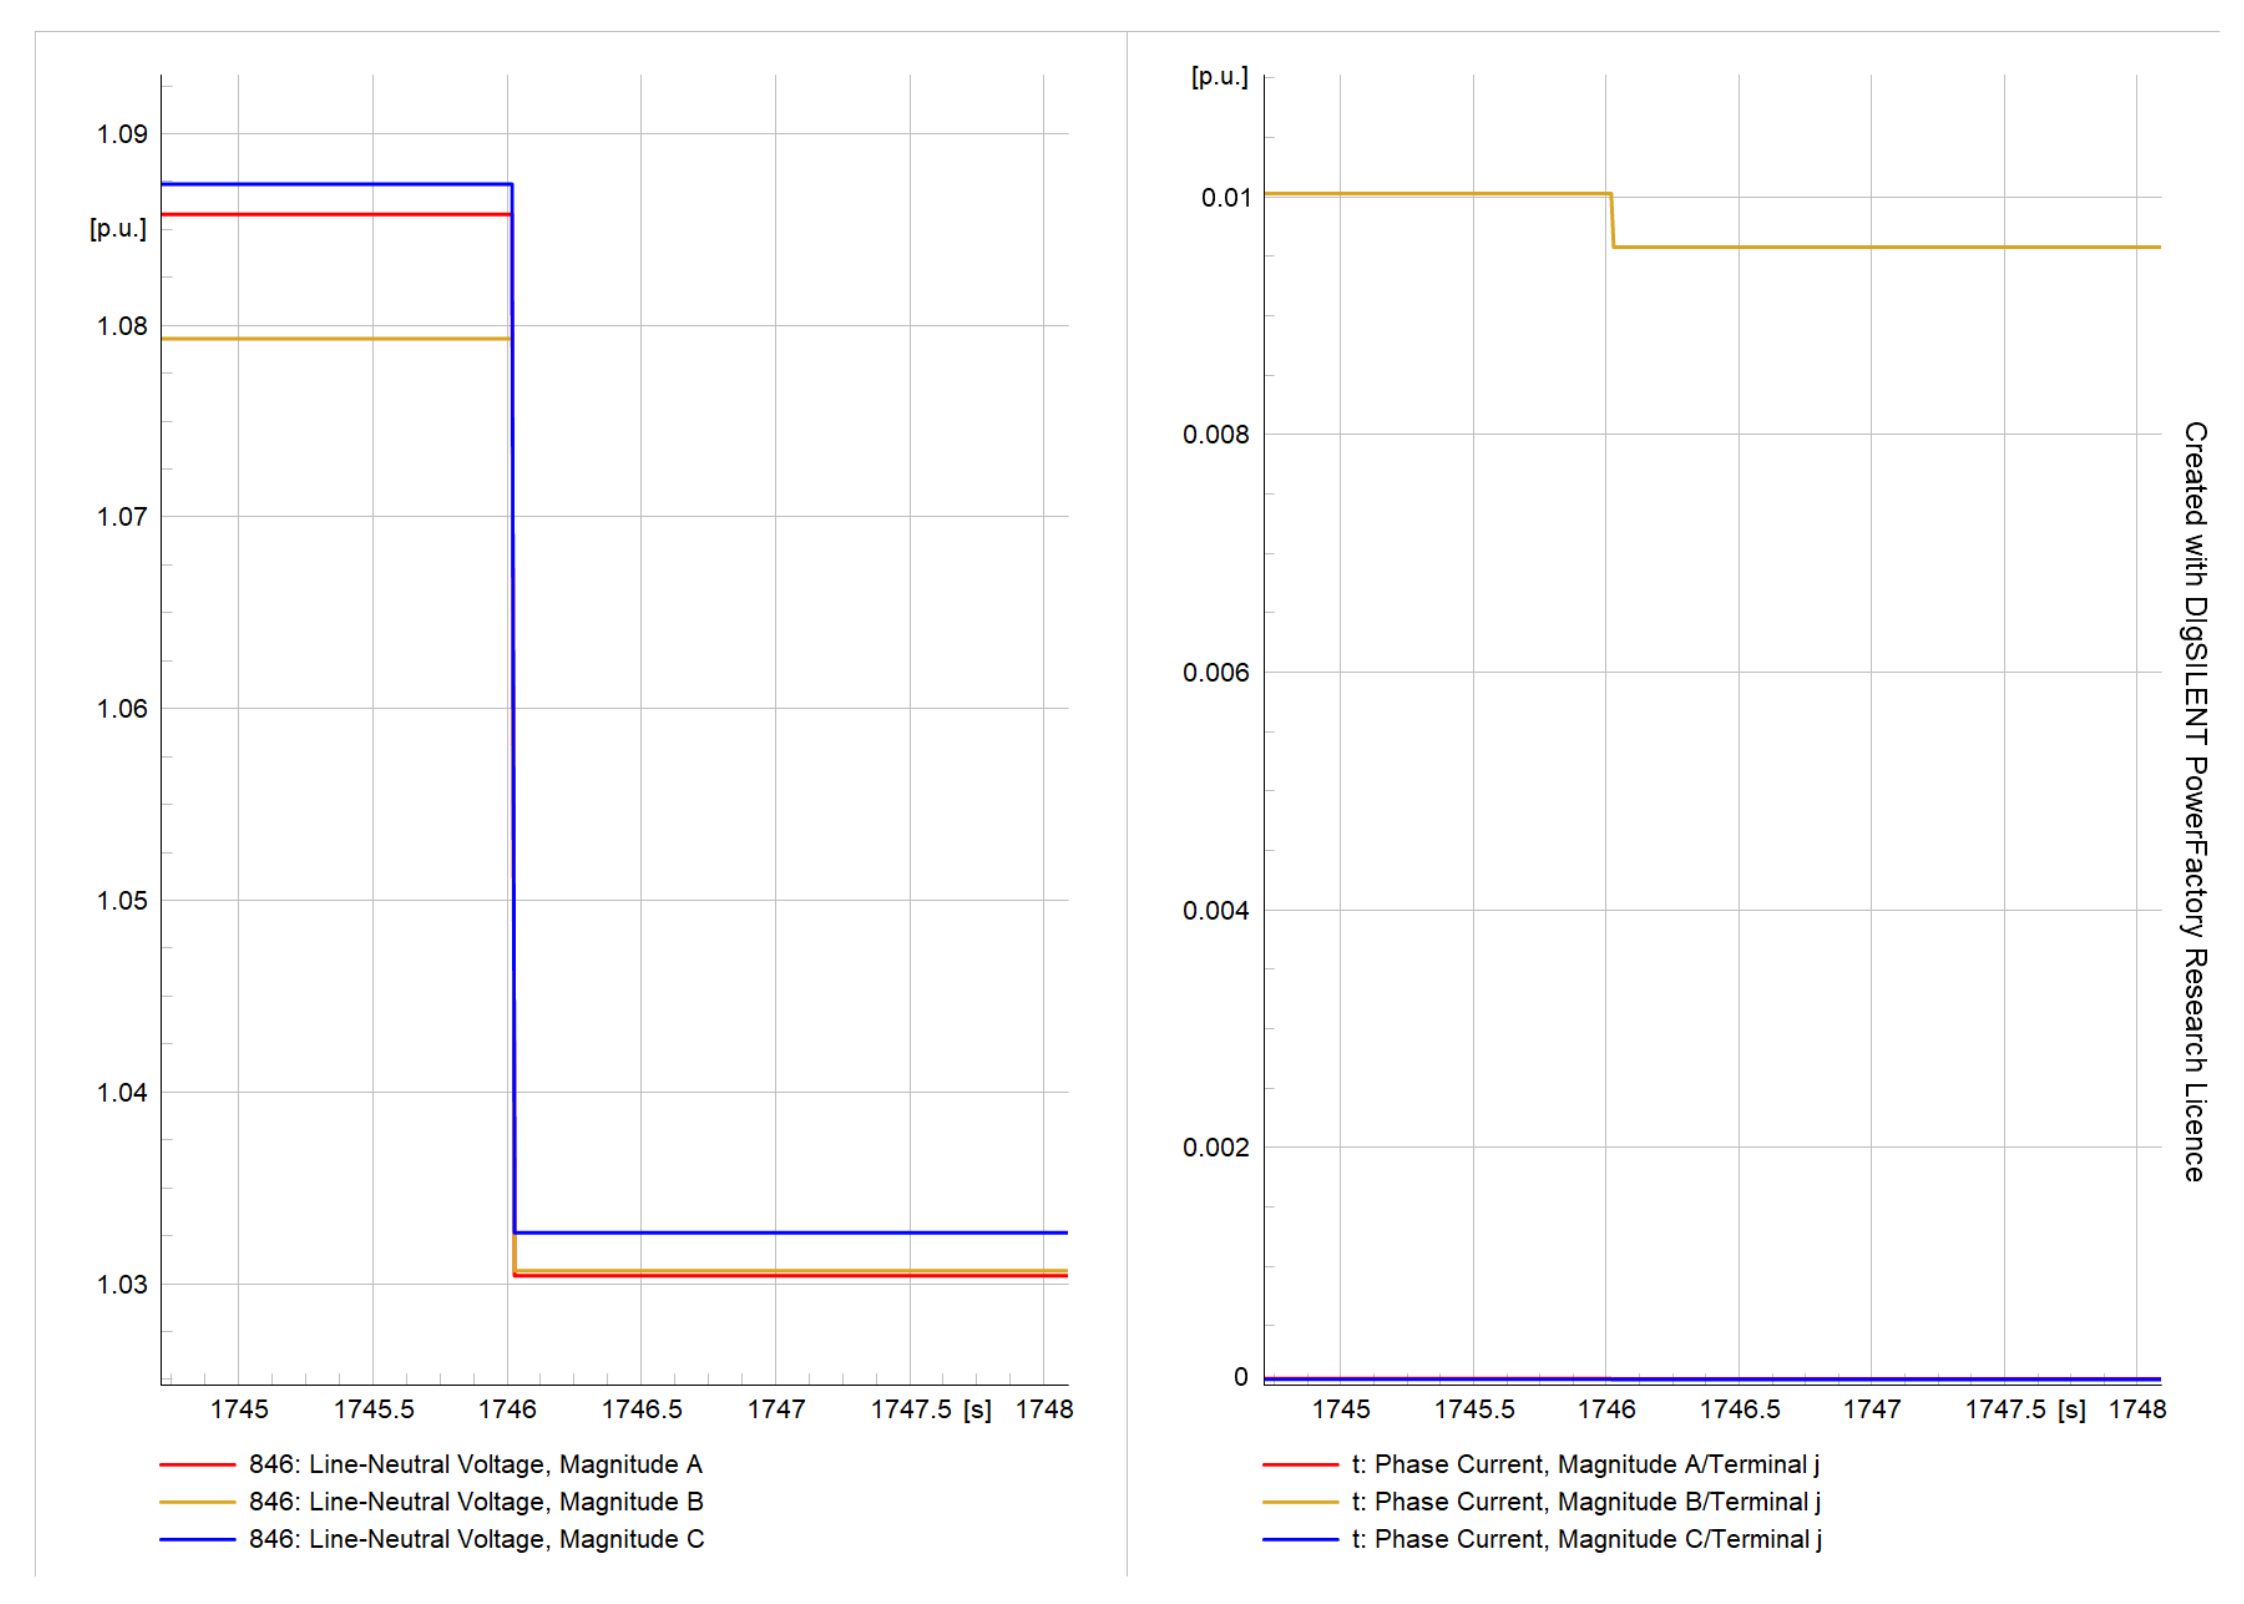
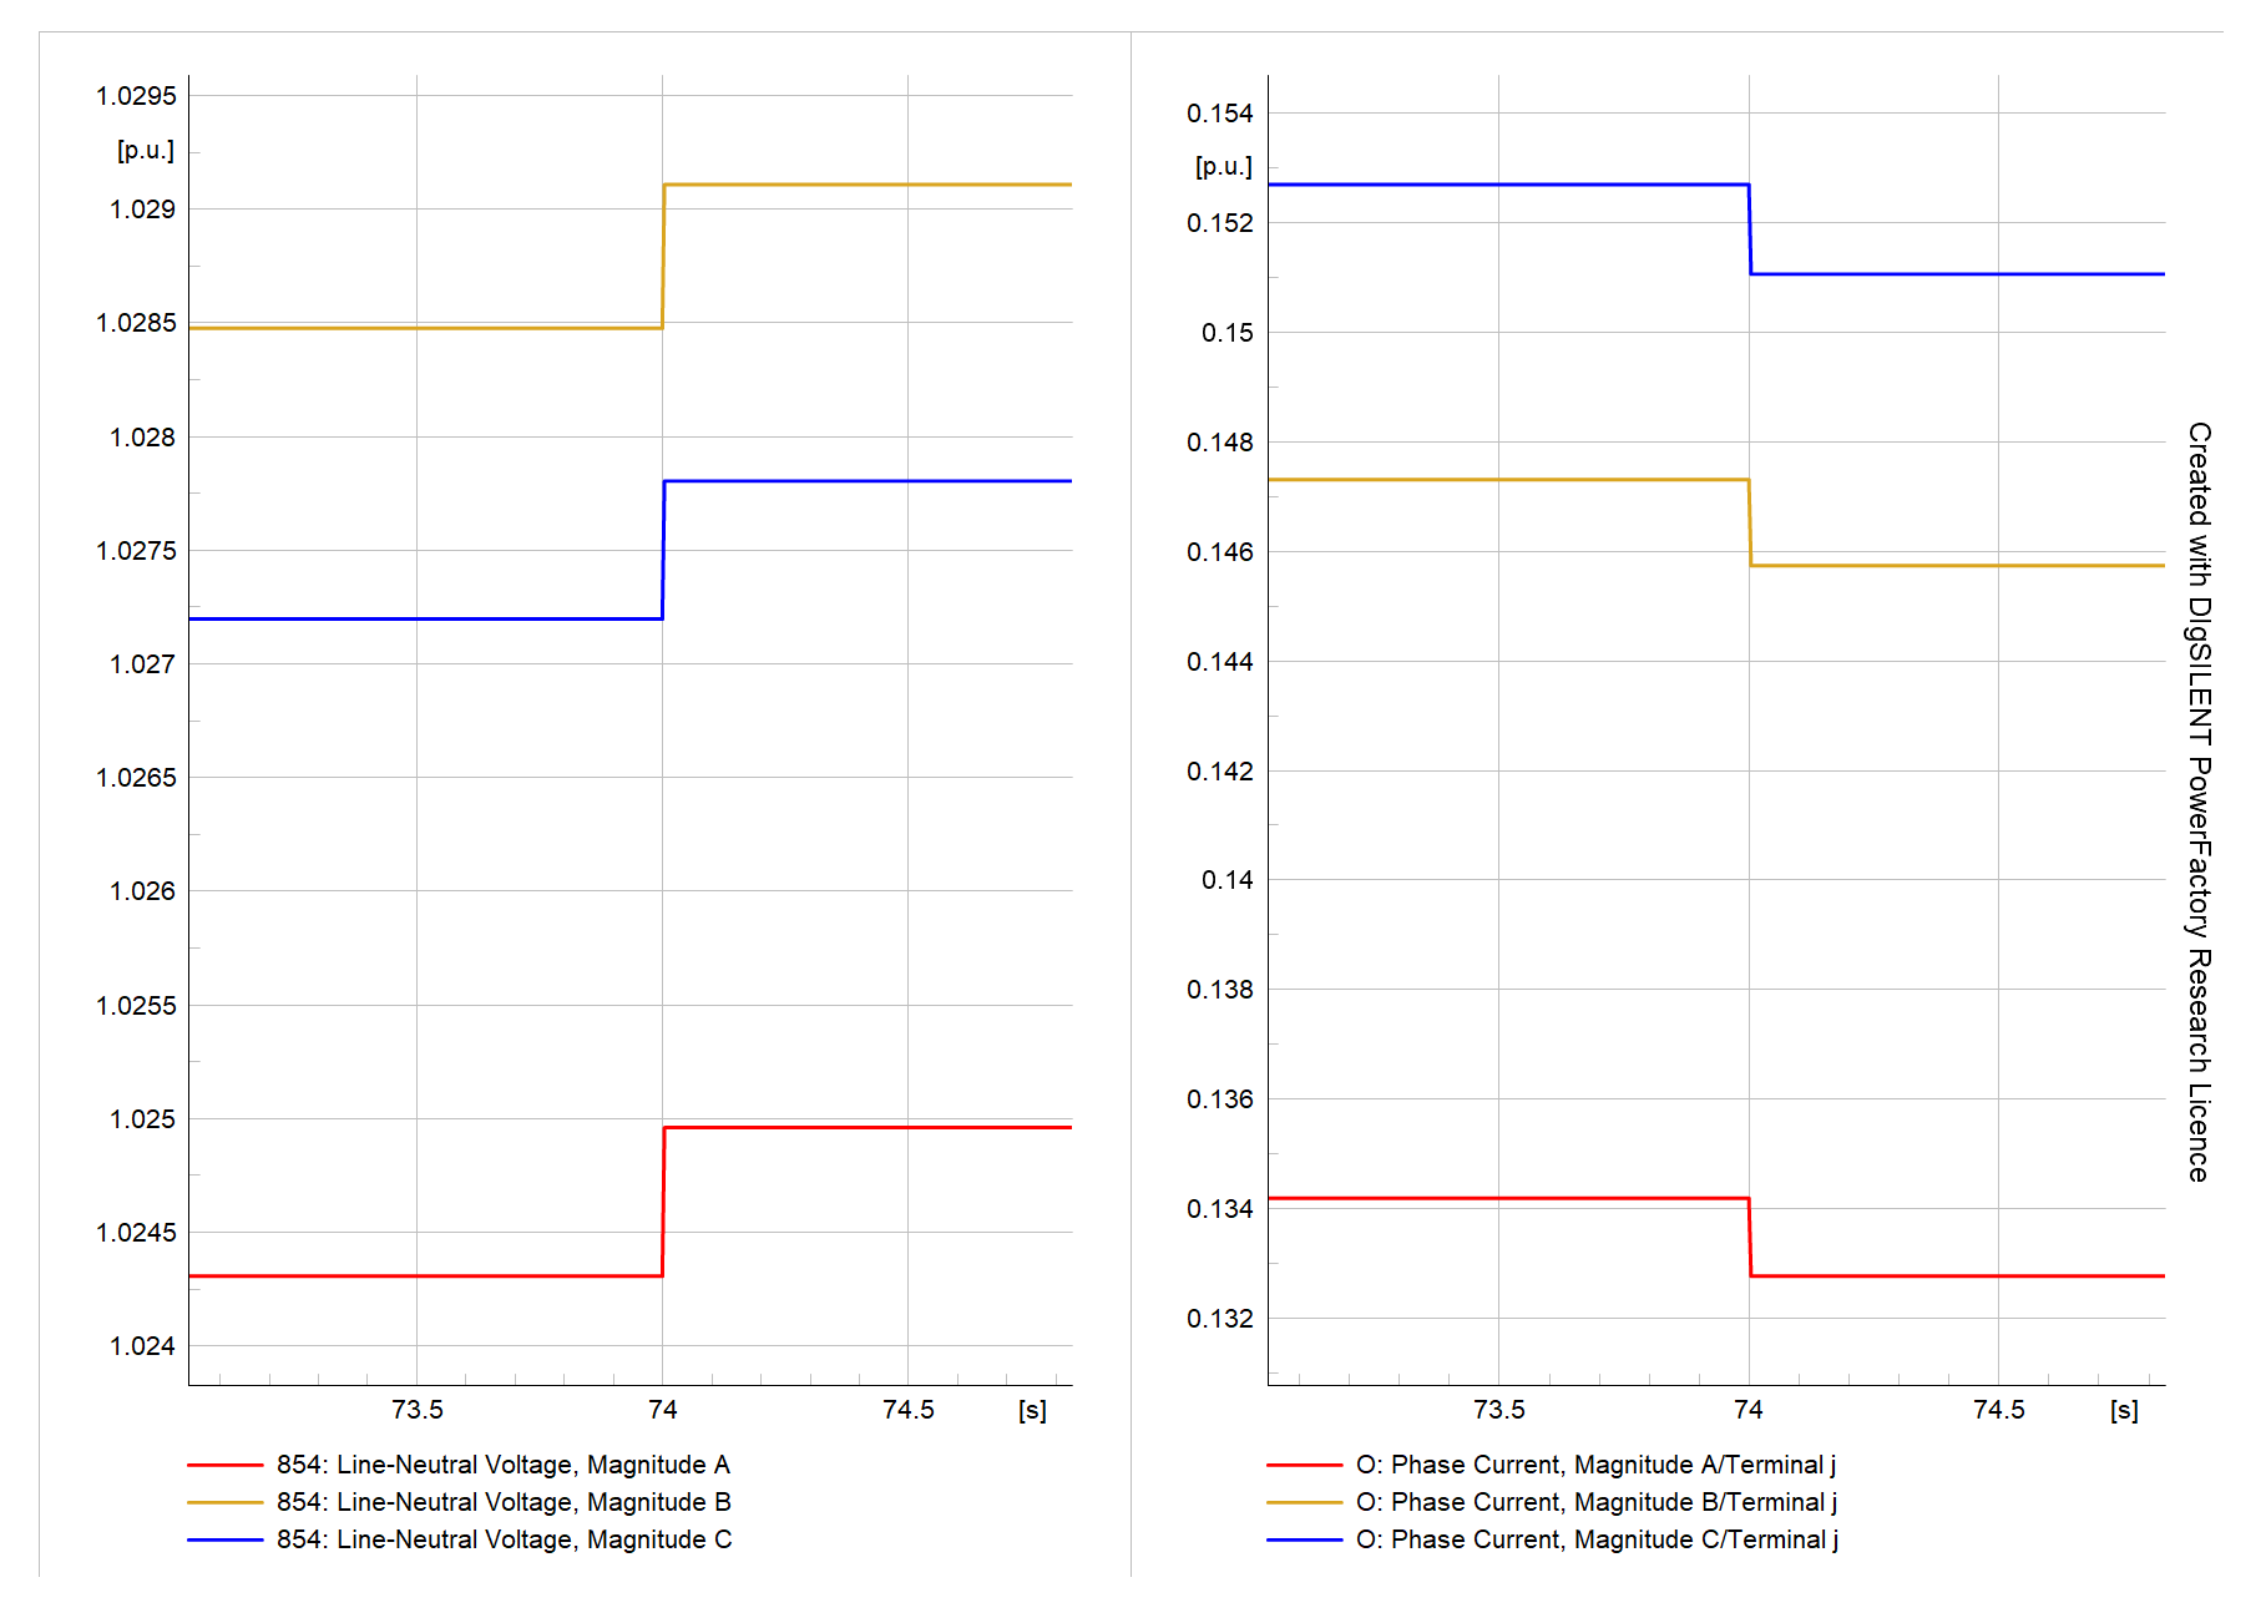
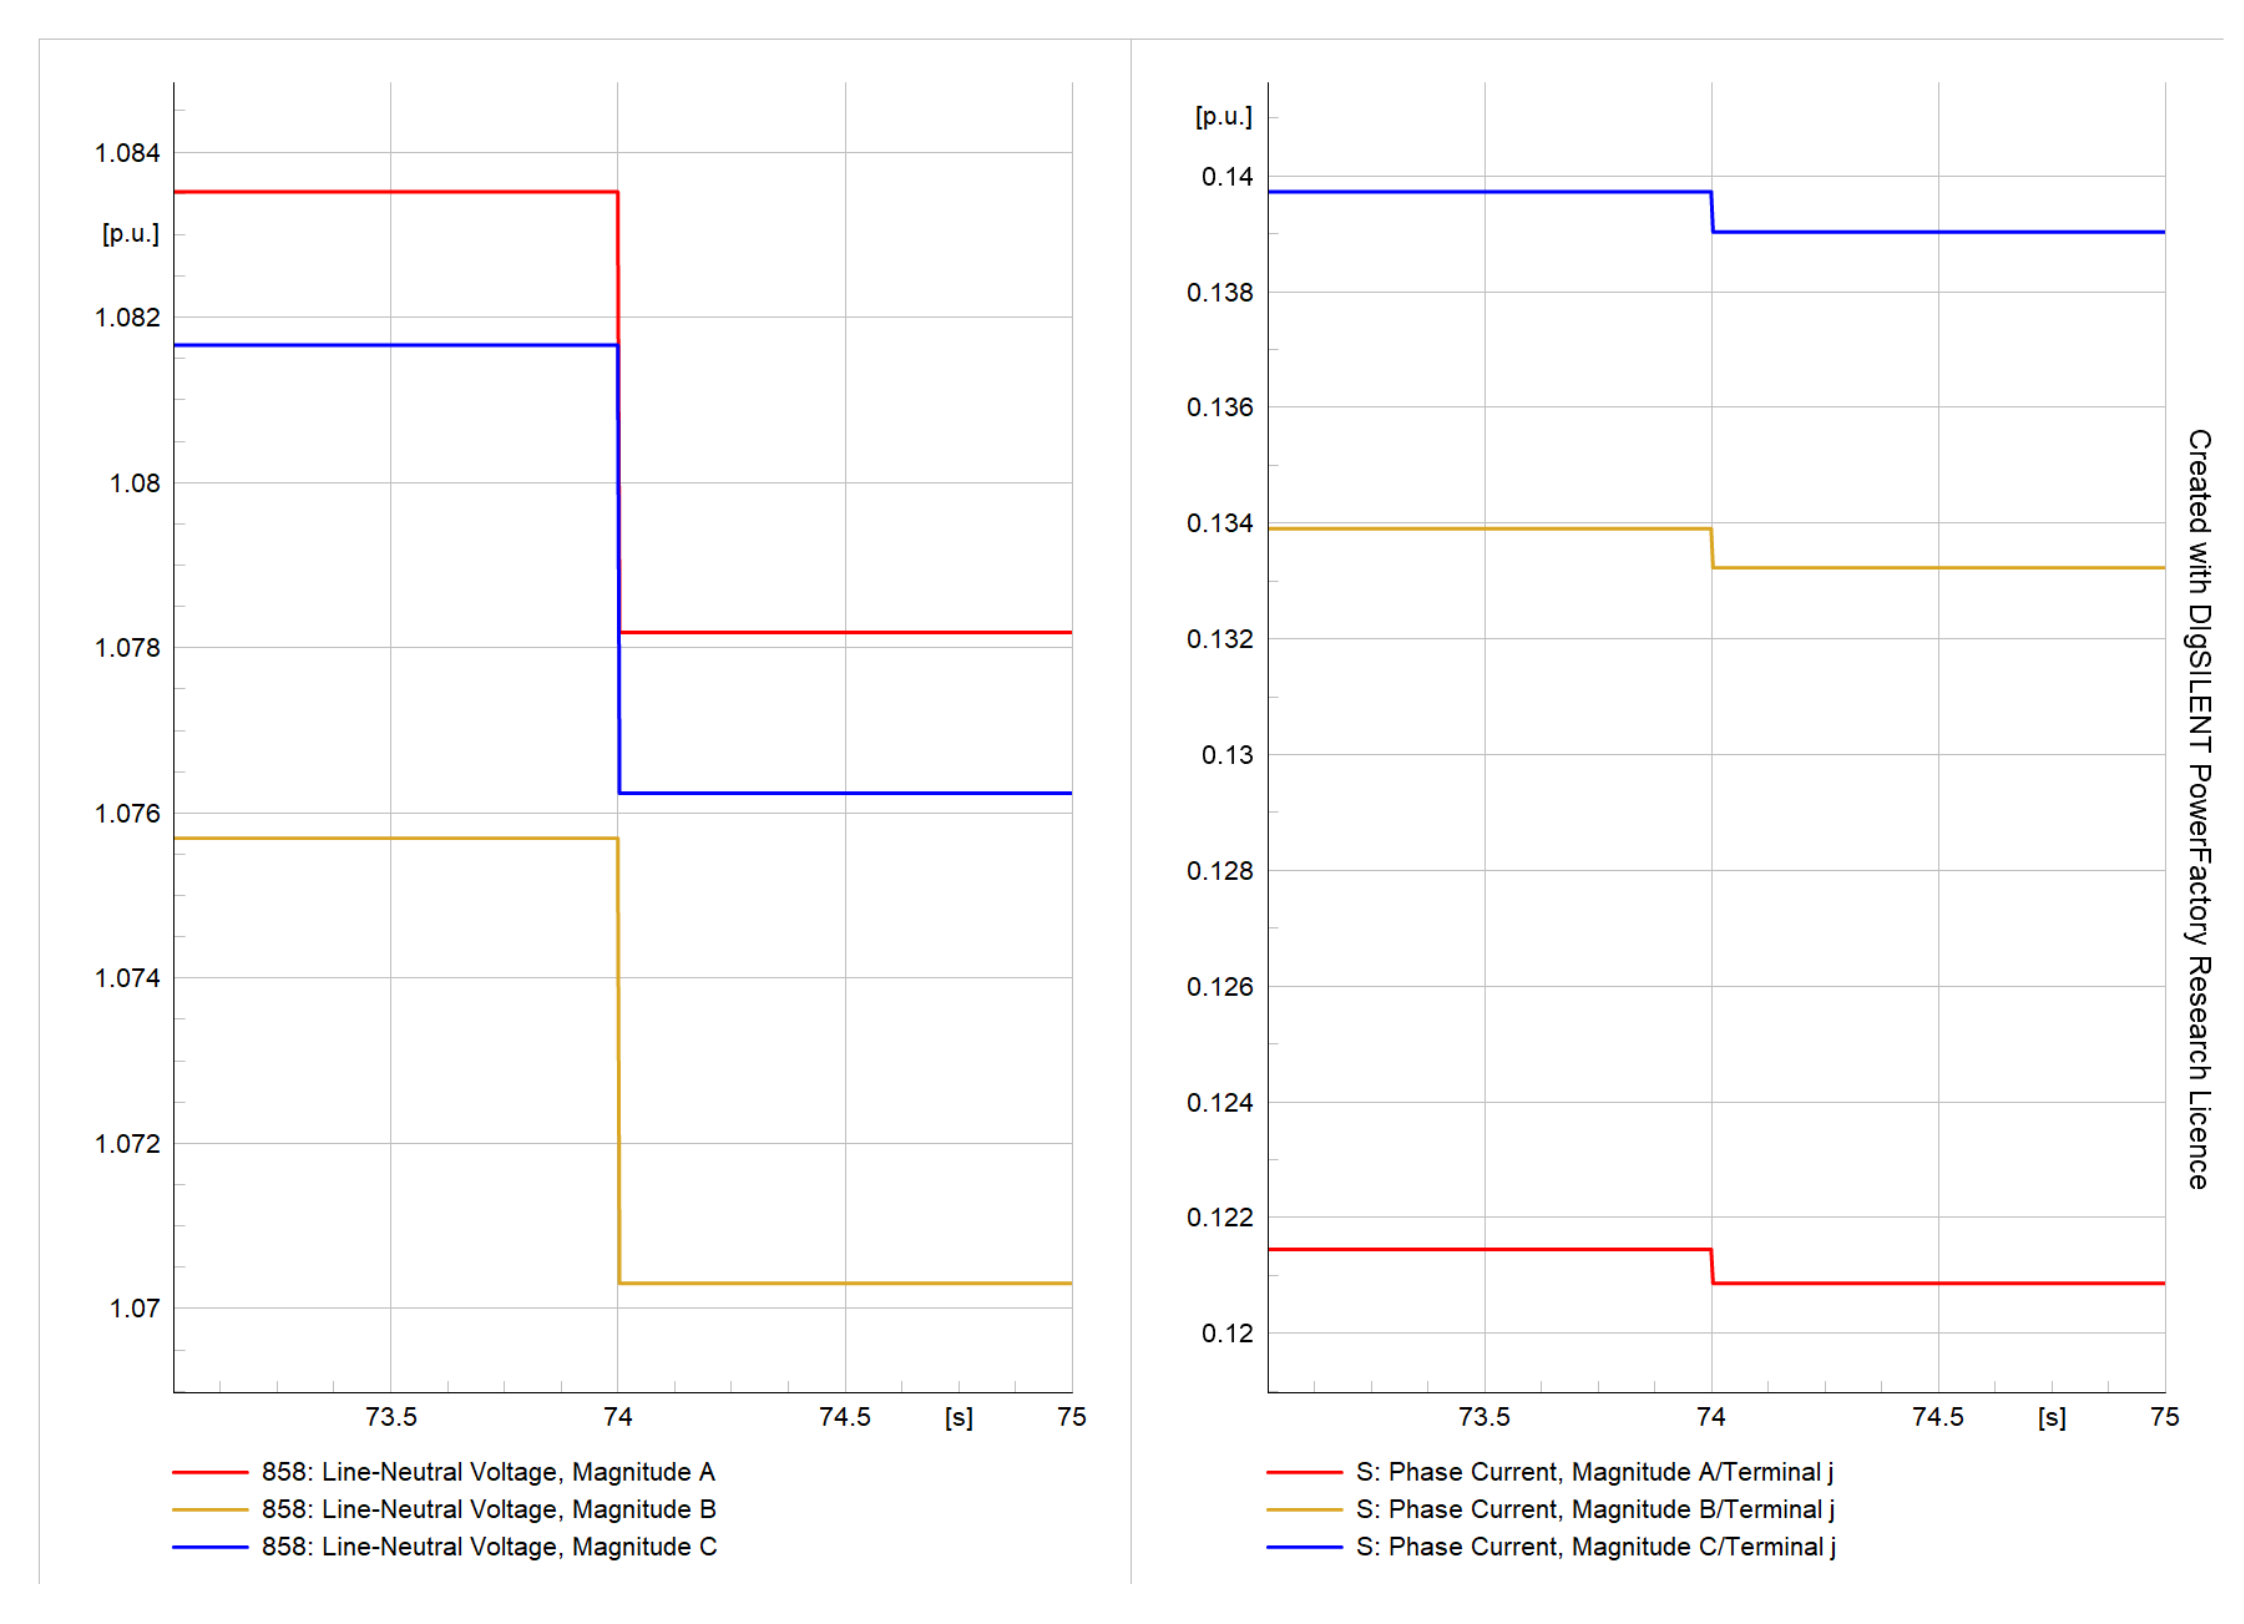
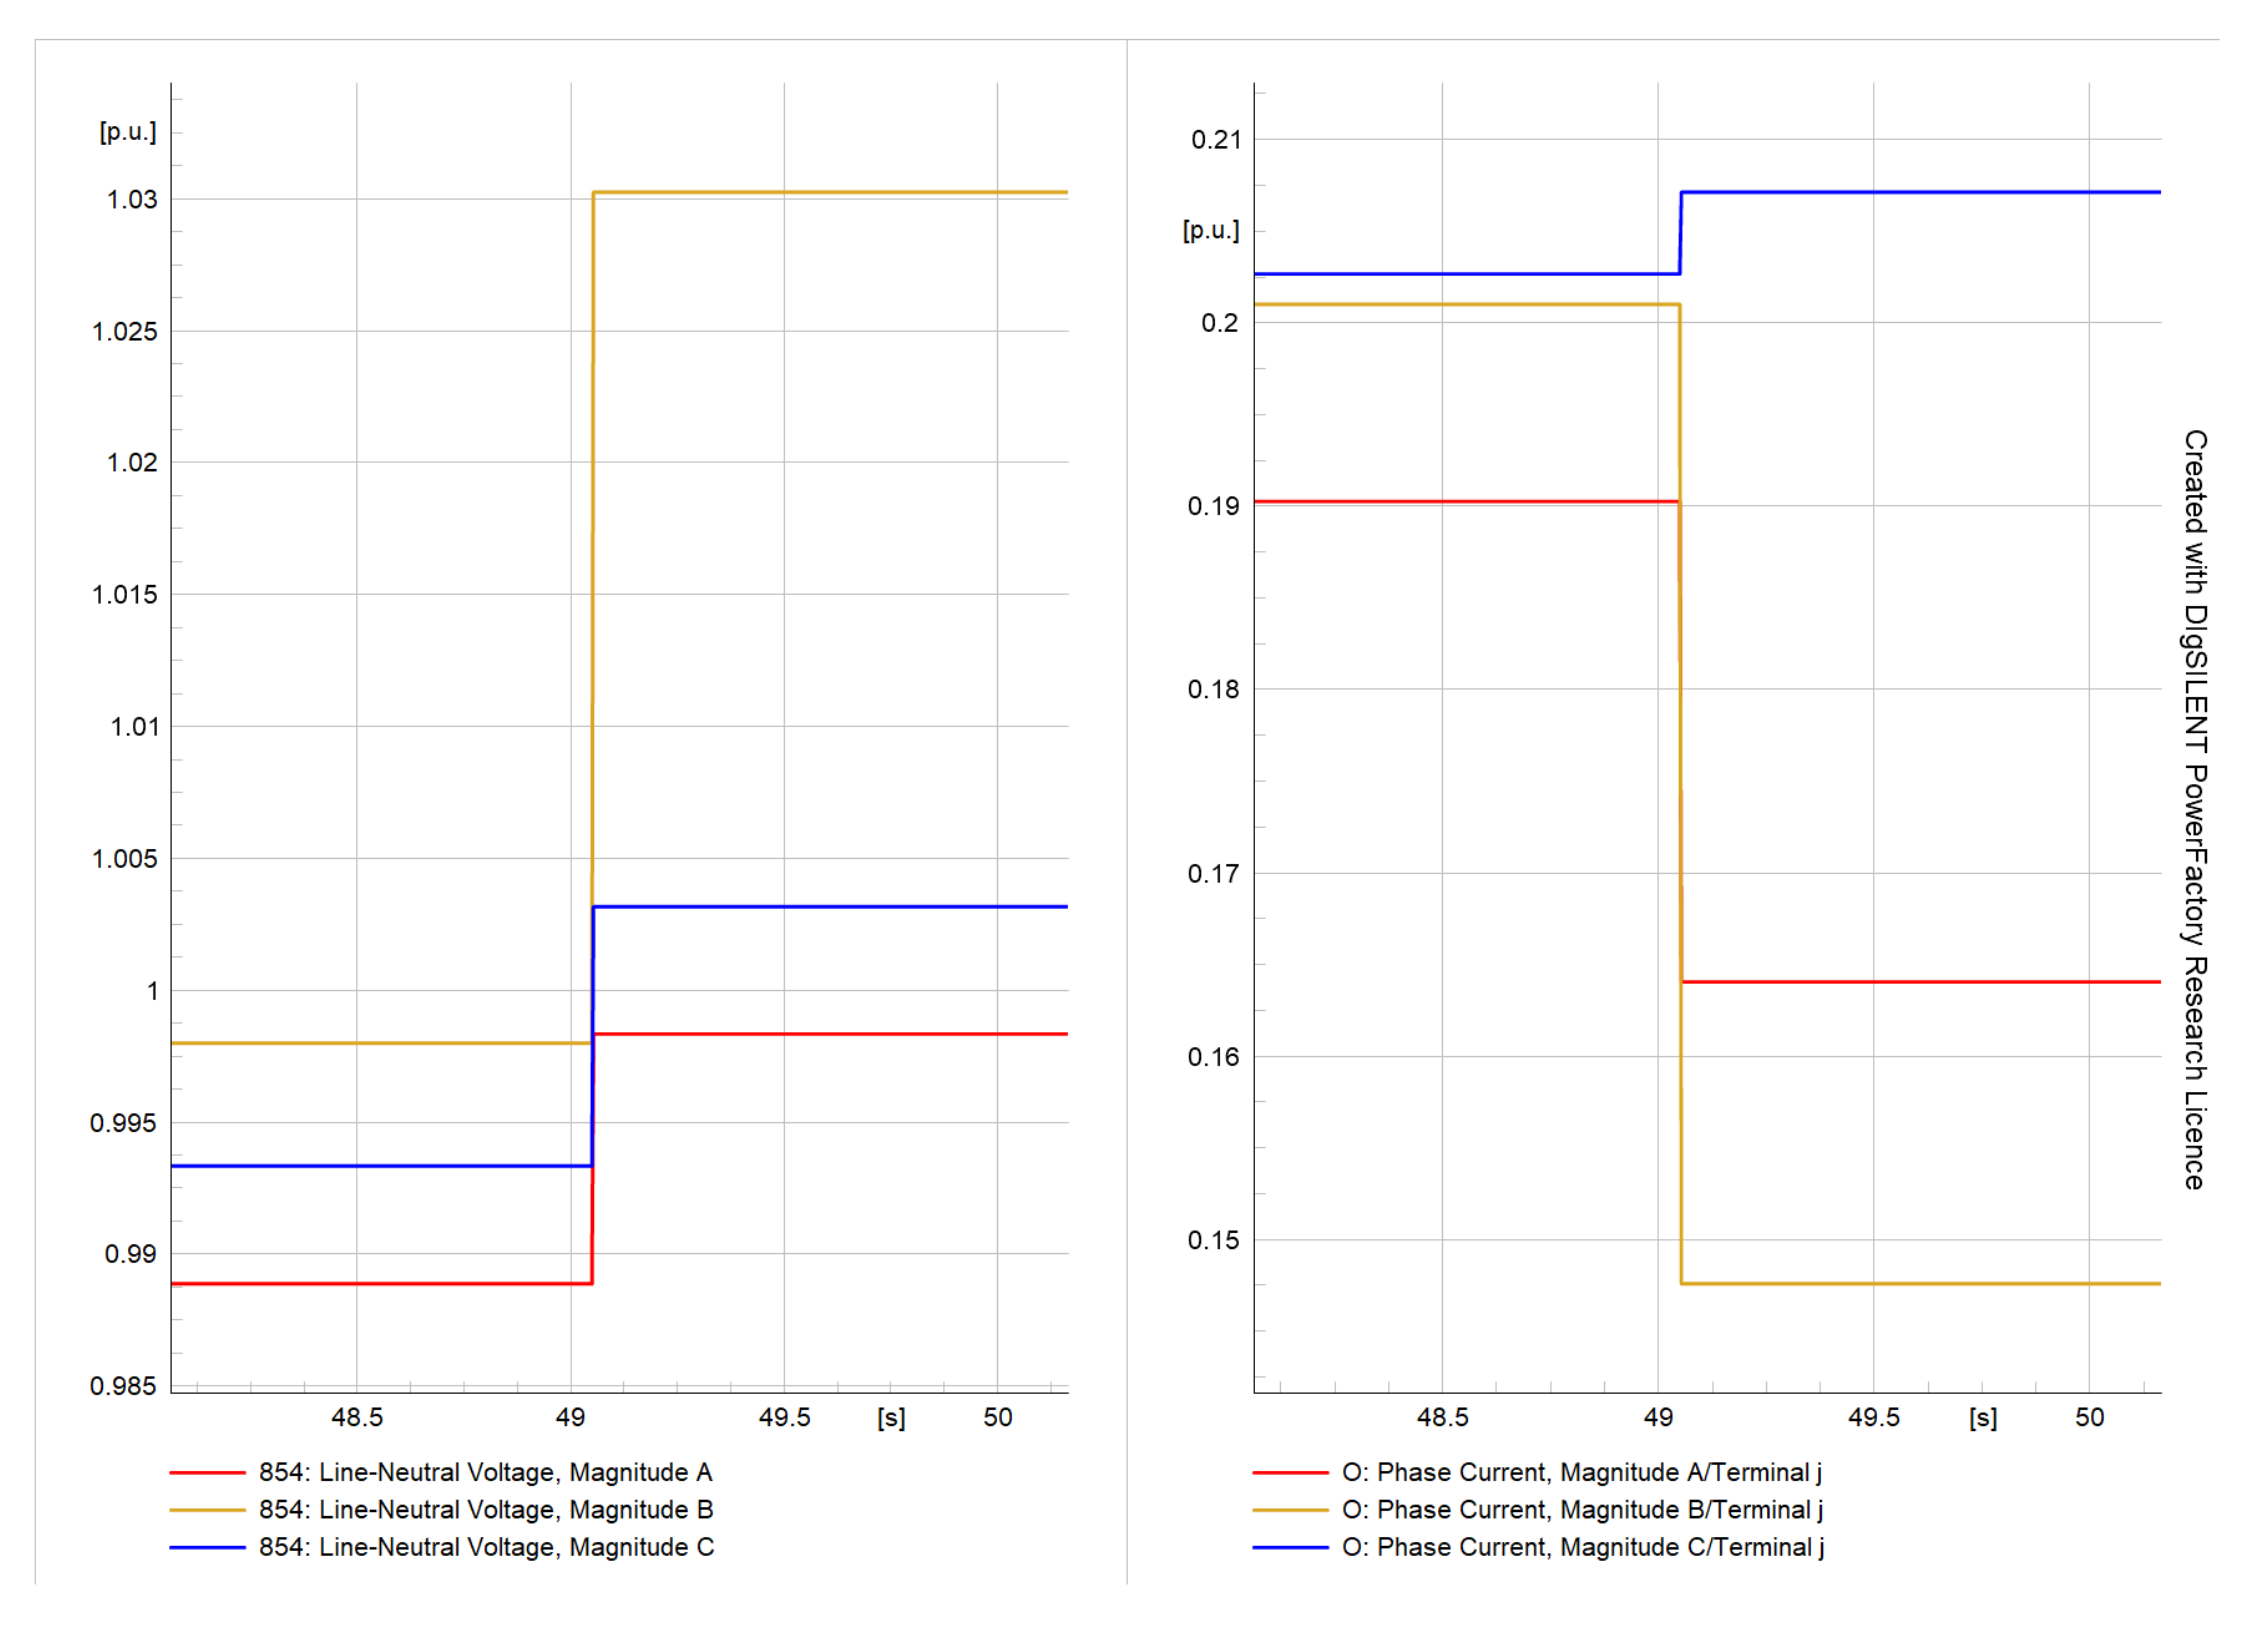
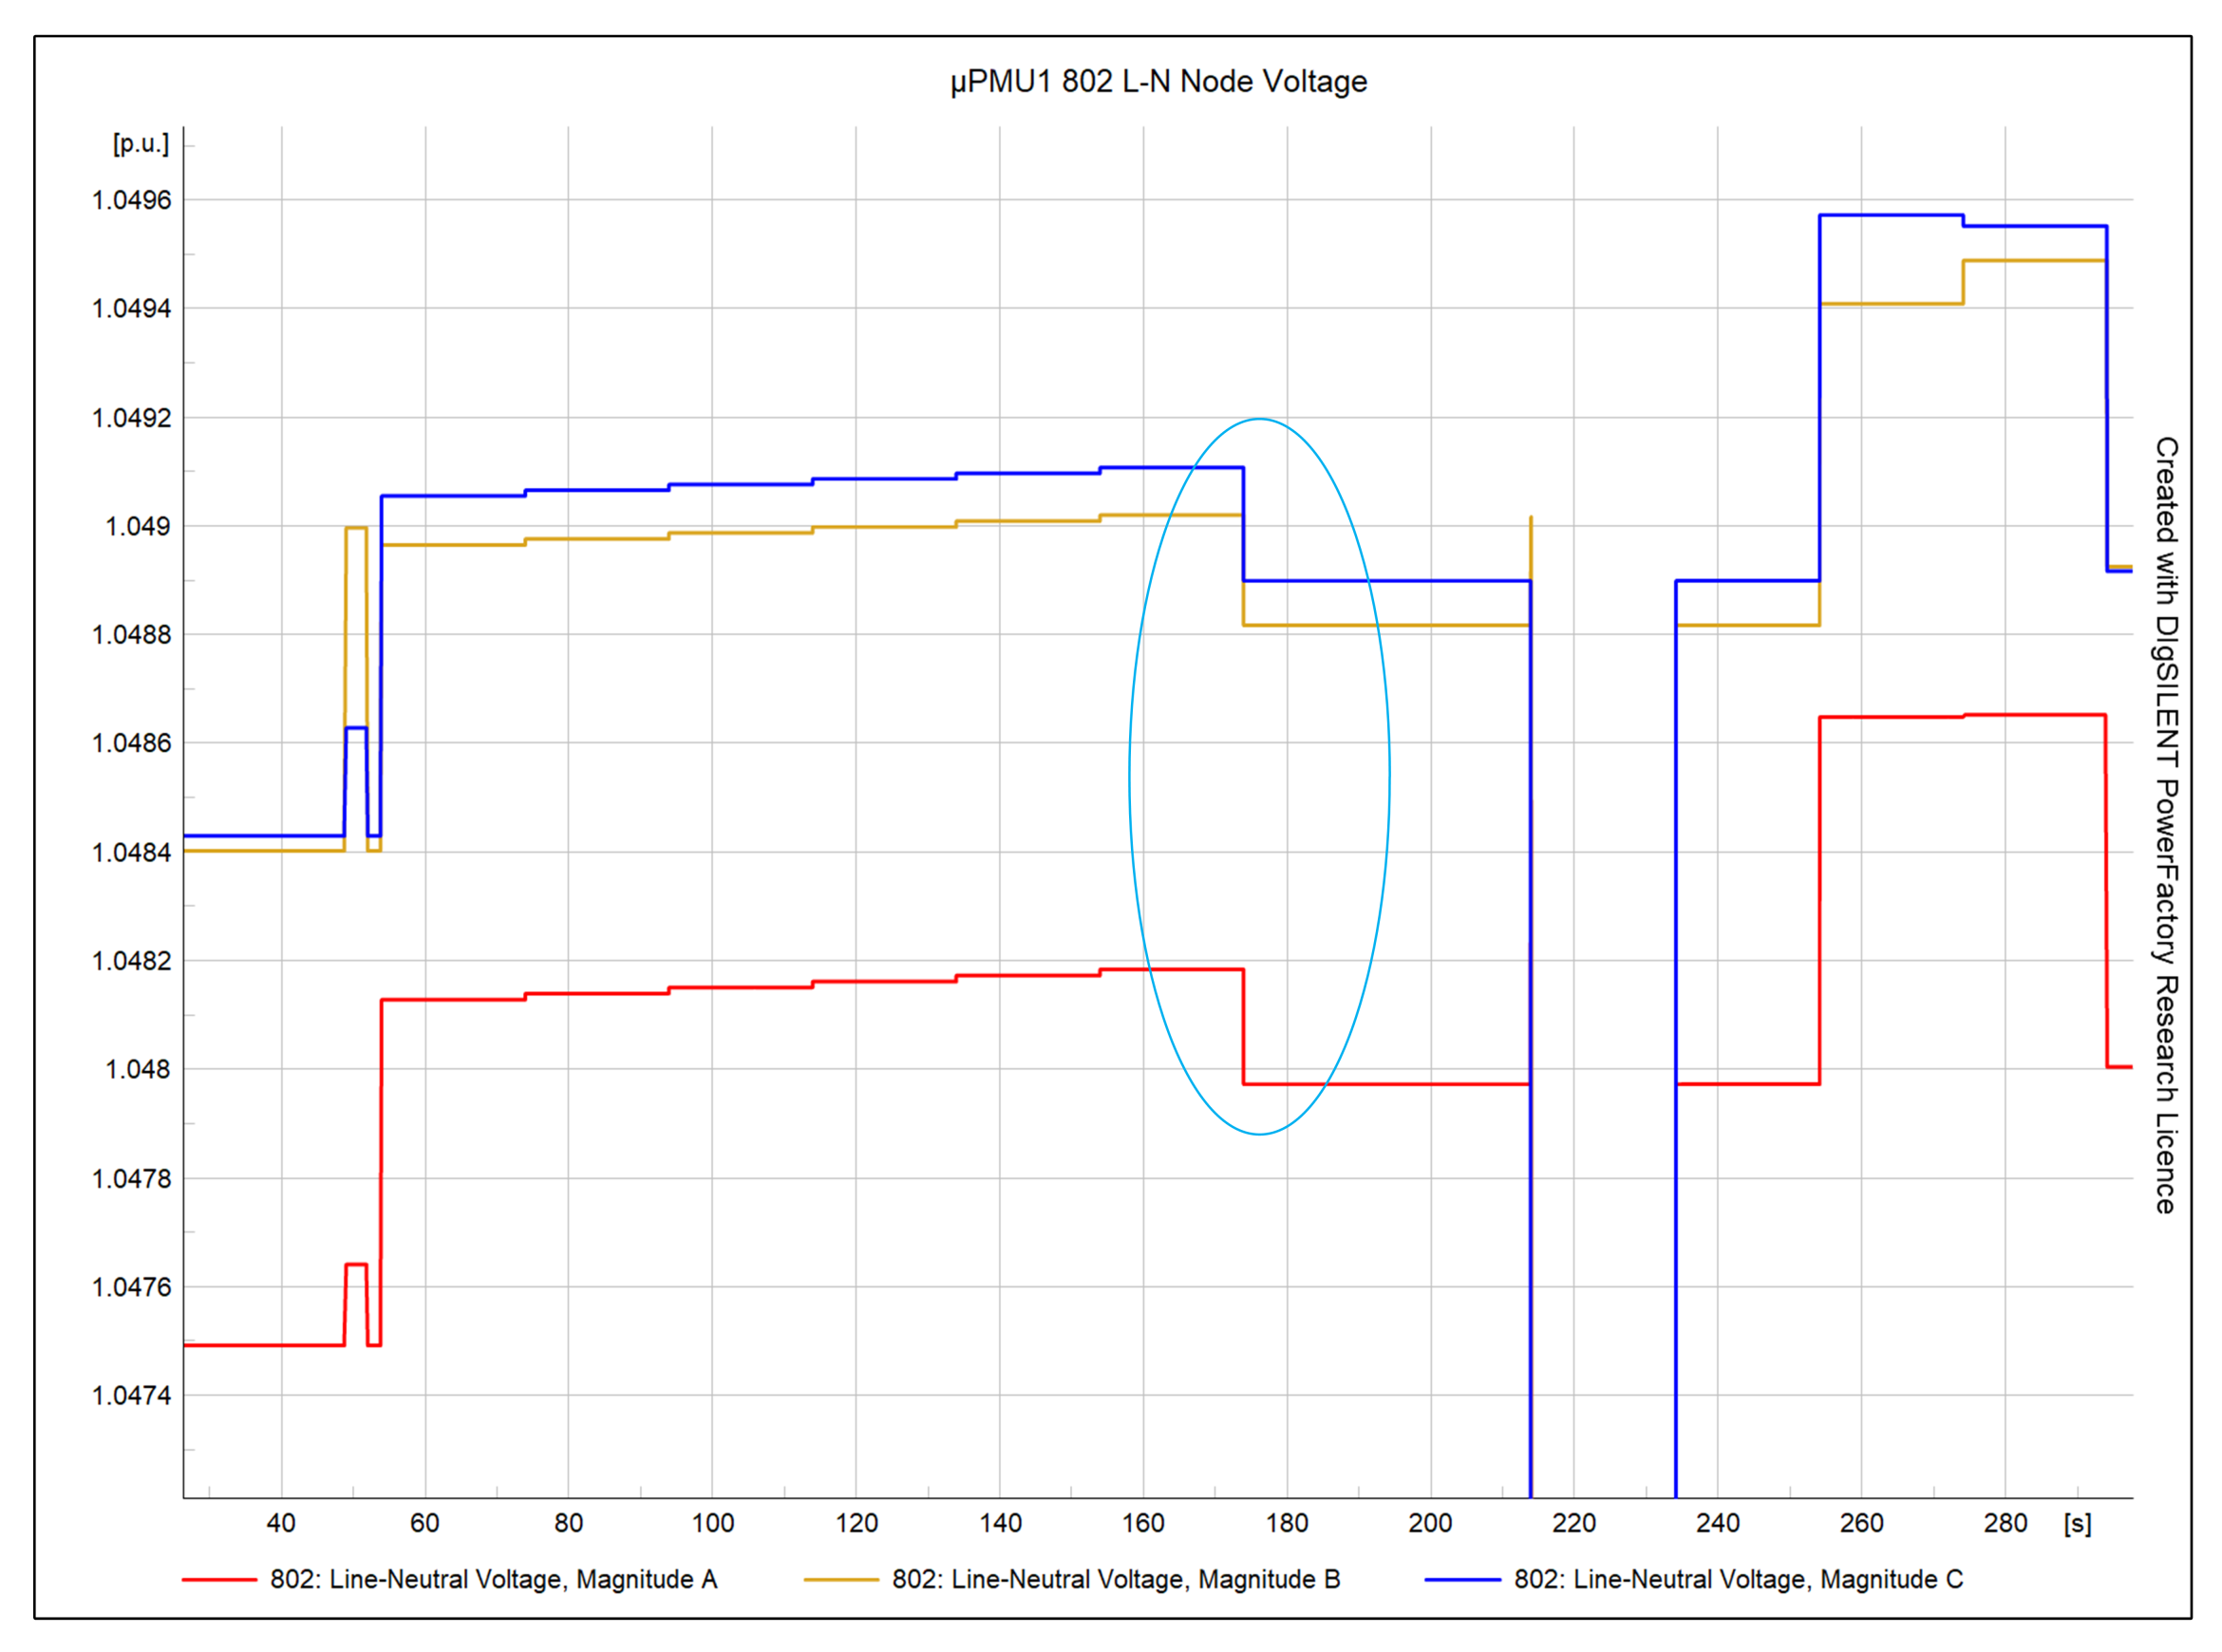
The plots shown here for each different event are the most impacted μPMUs in the network with respect to that particular event. Plots are in per-unit values of the line-to-neutral voltage and line currents of the relevant μPMUs over the time in seconds. The results demonstrate that when the capacitor bank is switched on, the voltage magnitude increases to compensate for the reactive power and decreases when it is switched off. The line currents that the upstream (US) and downstream (DS) μPMUs report are dependent on the initial switching conditions. For both capacitor switch-on and switch-off events, line current undershoots and overshoots are observed.
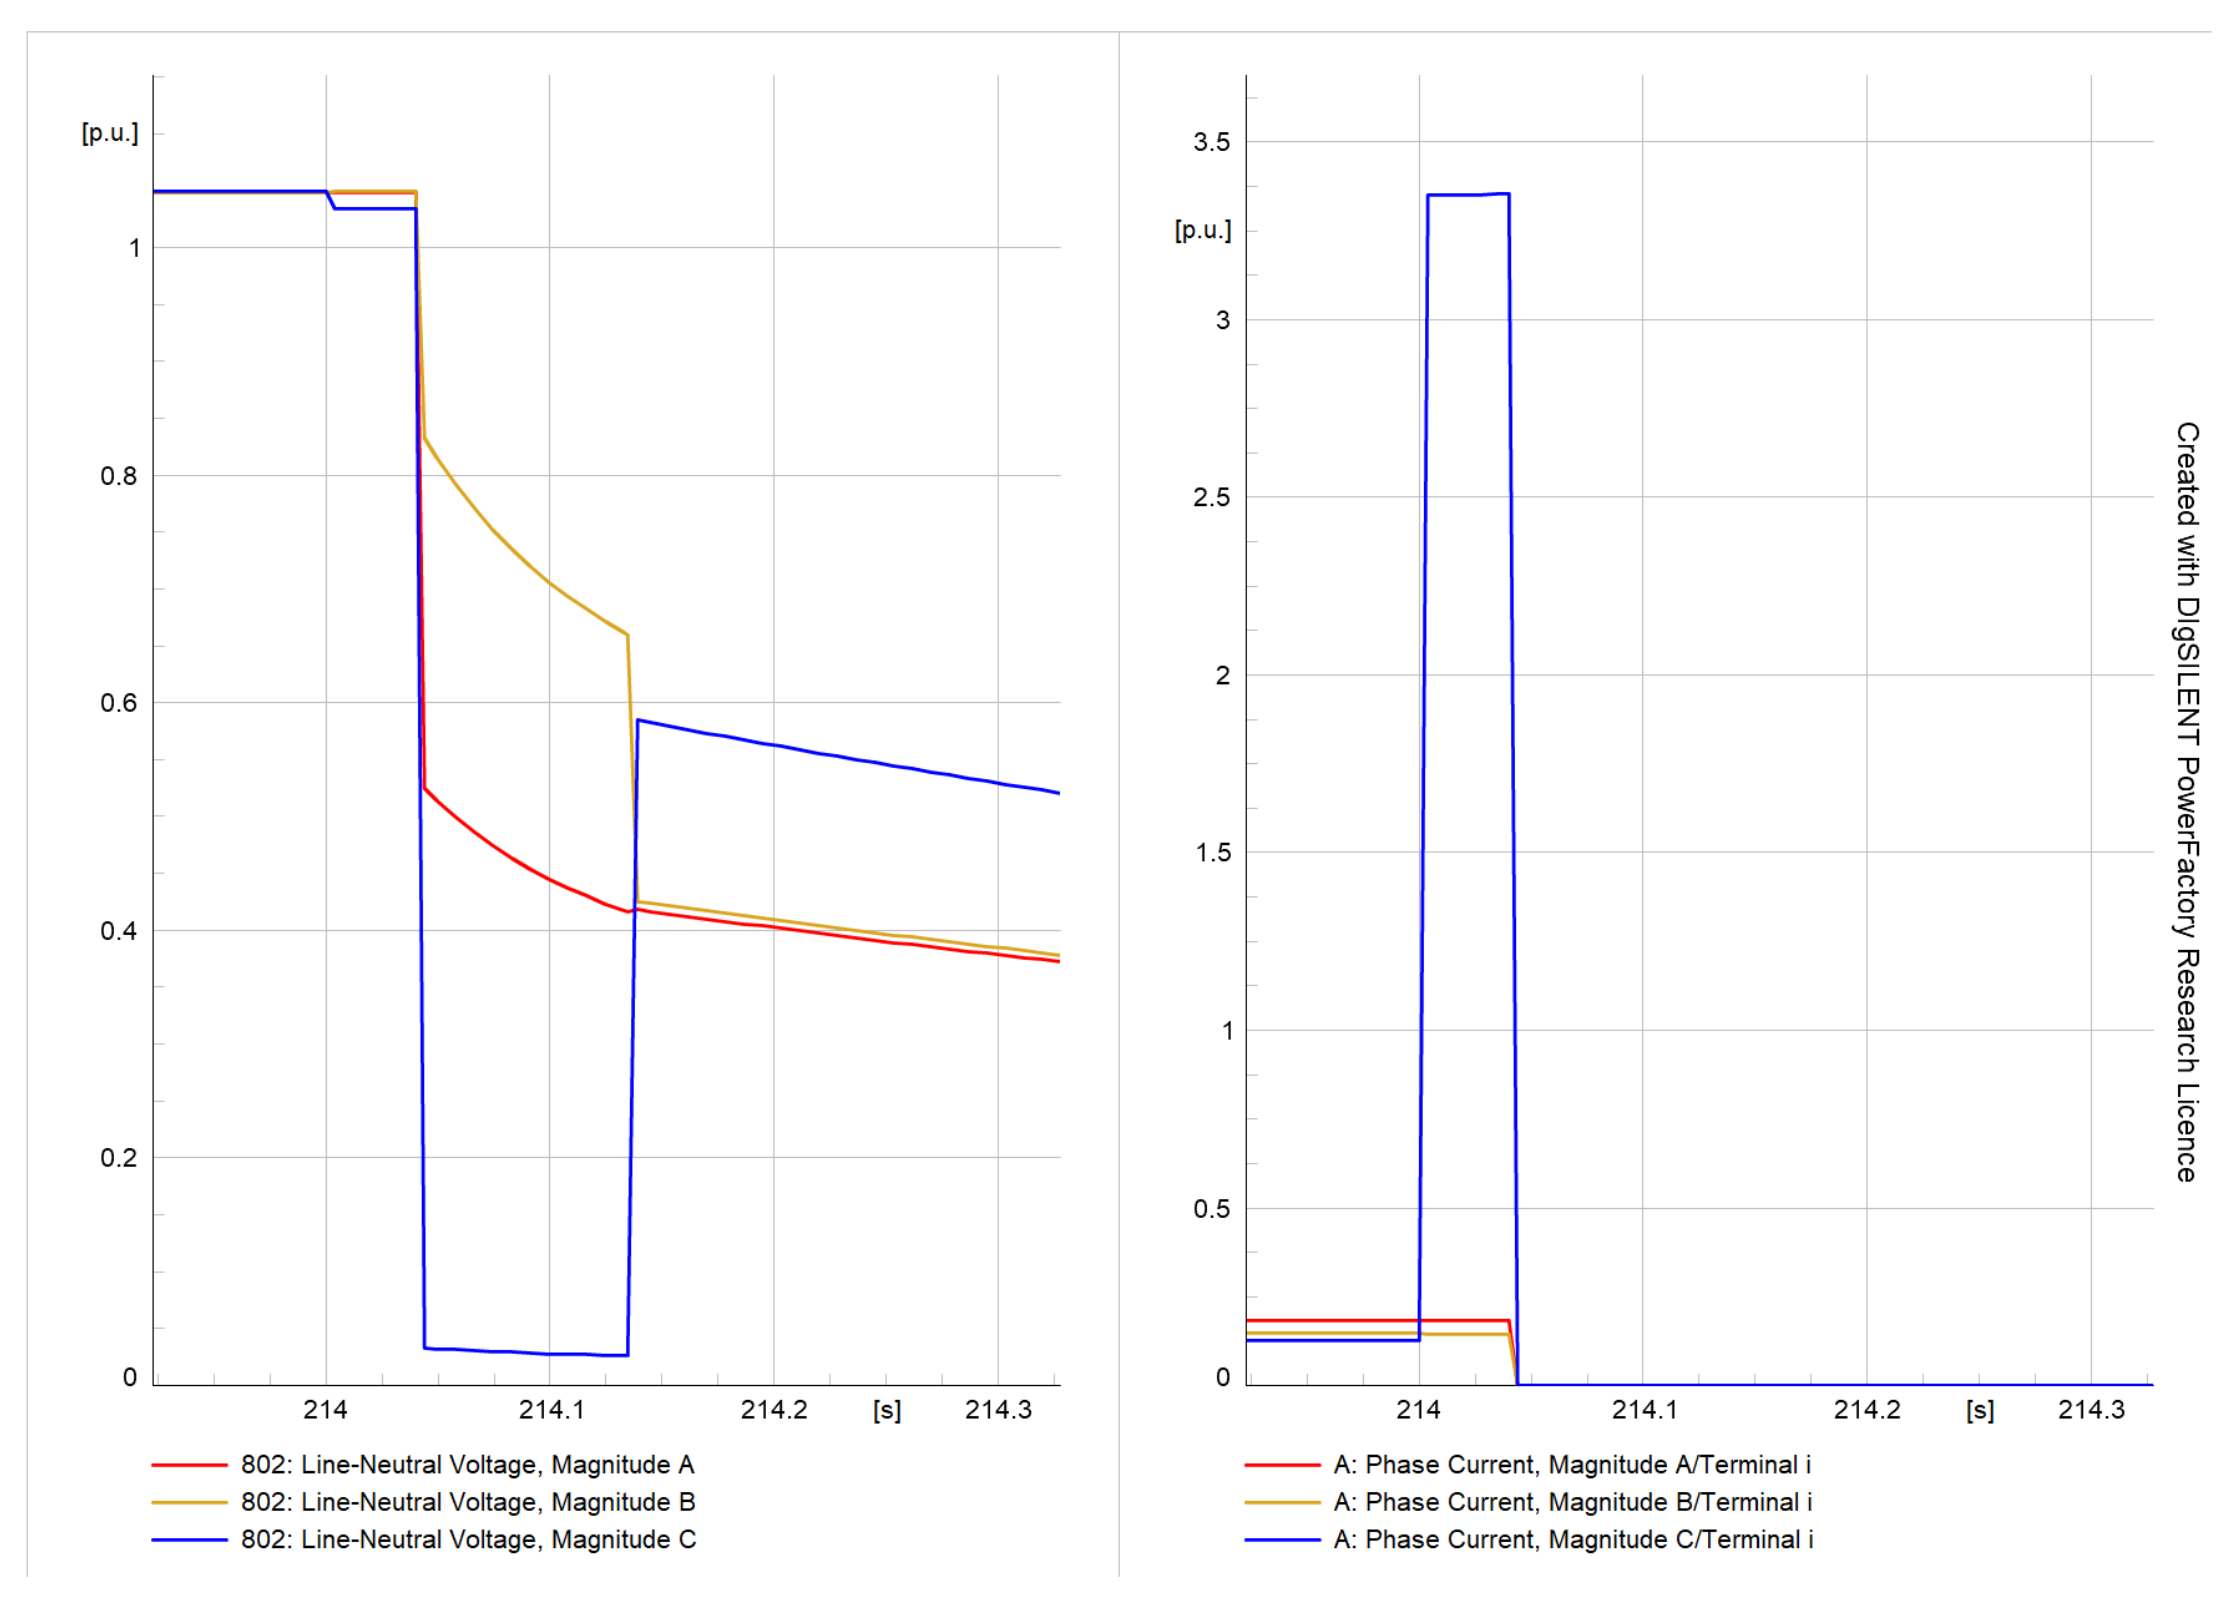
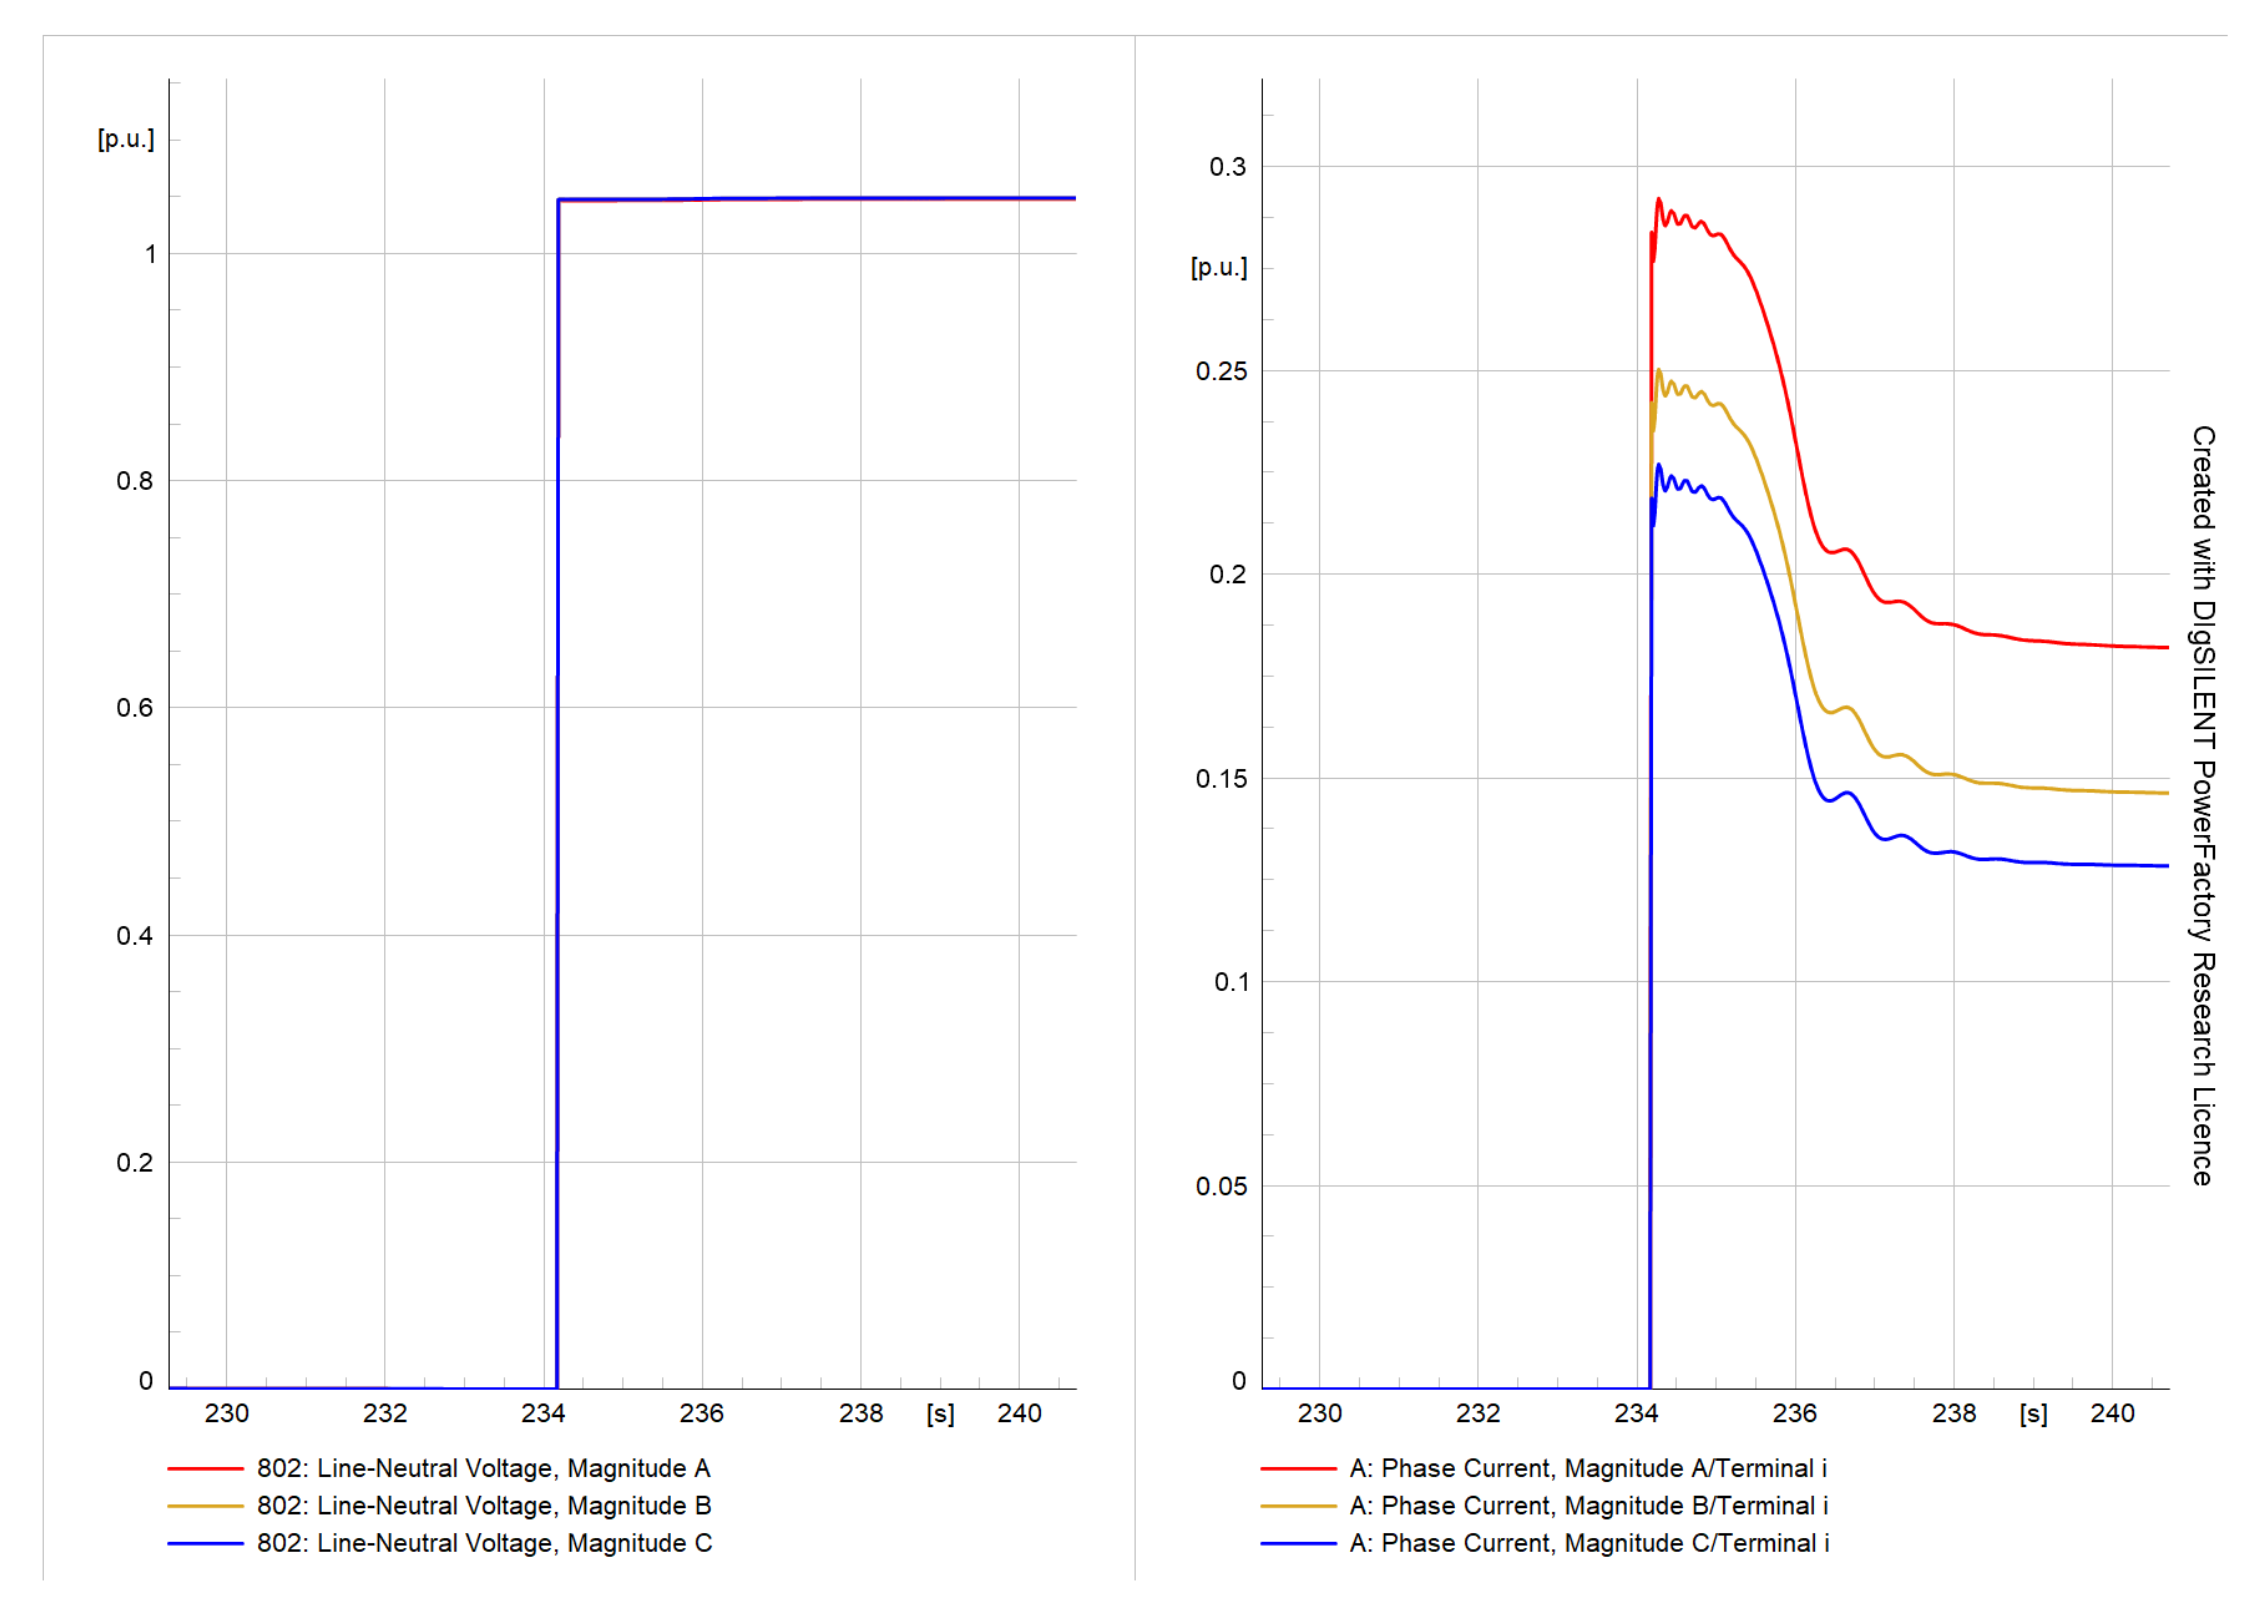
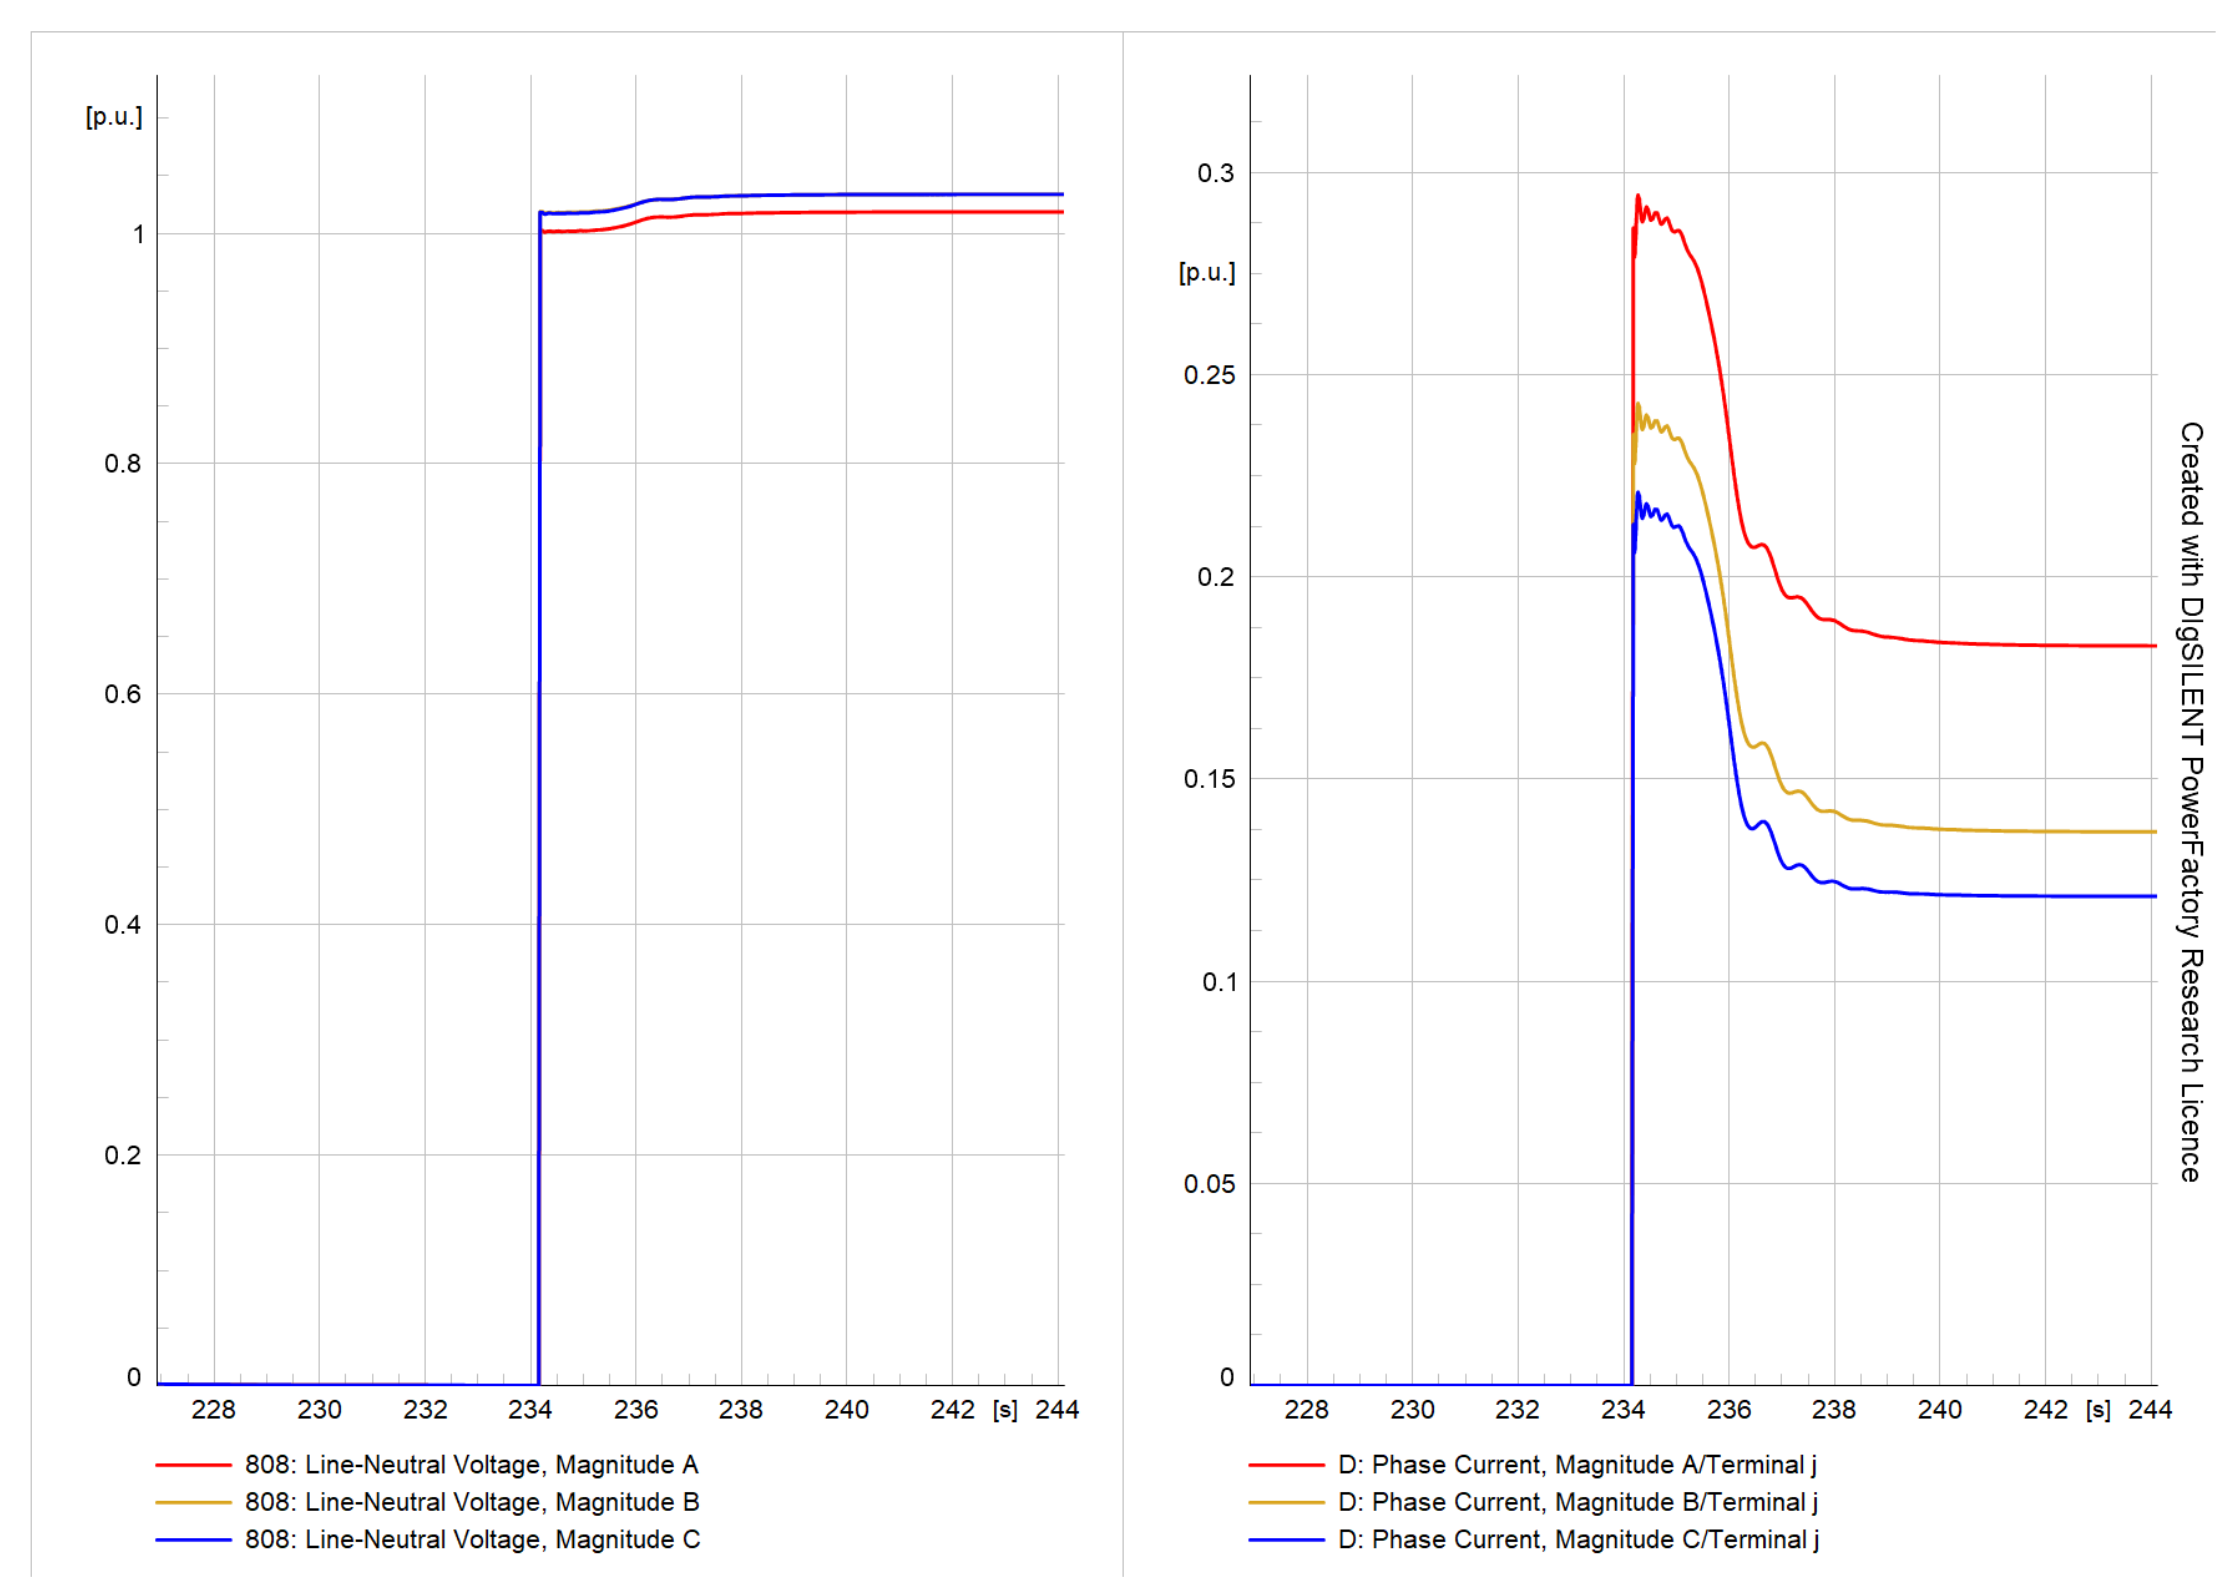
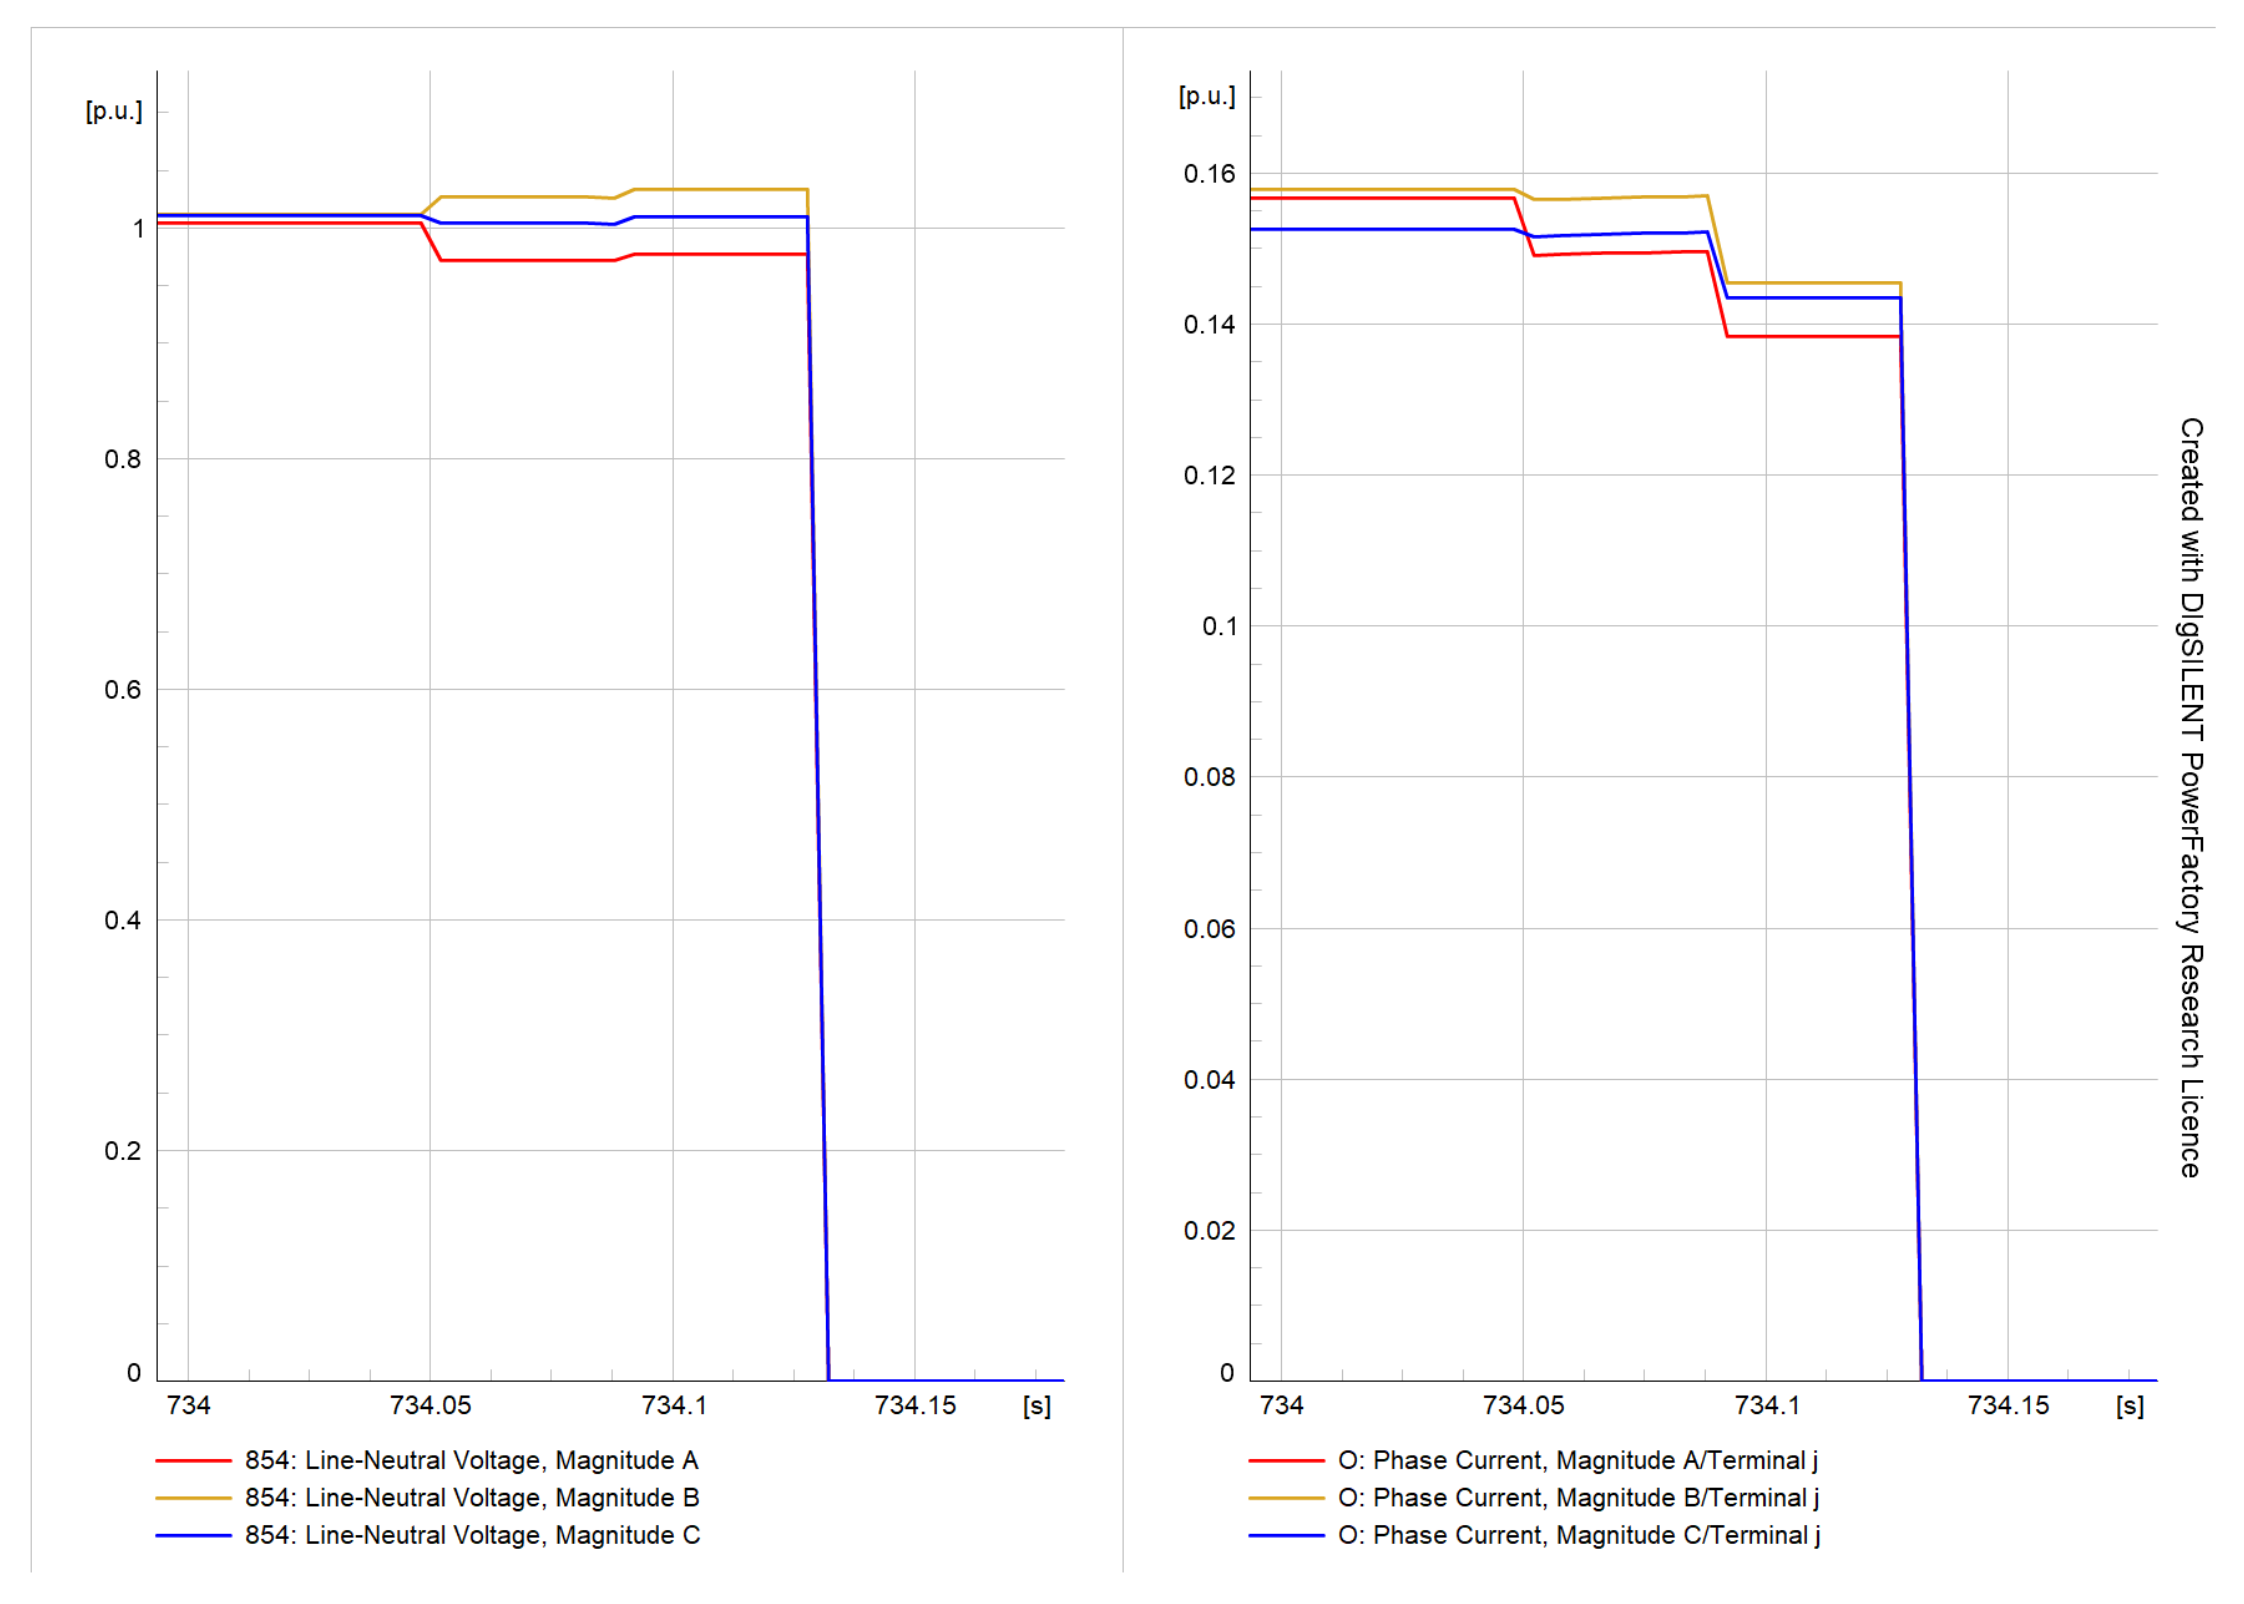
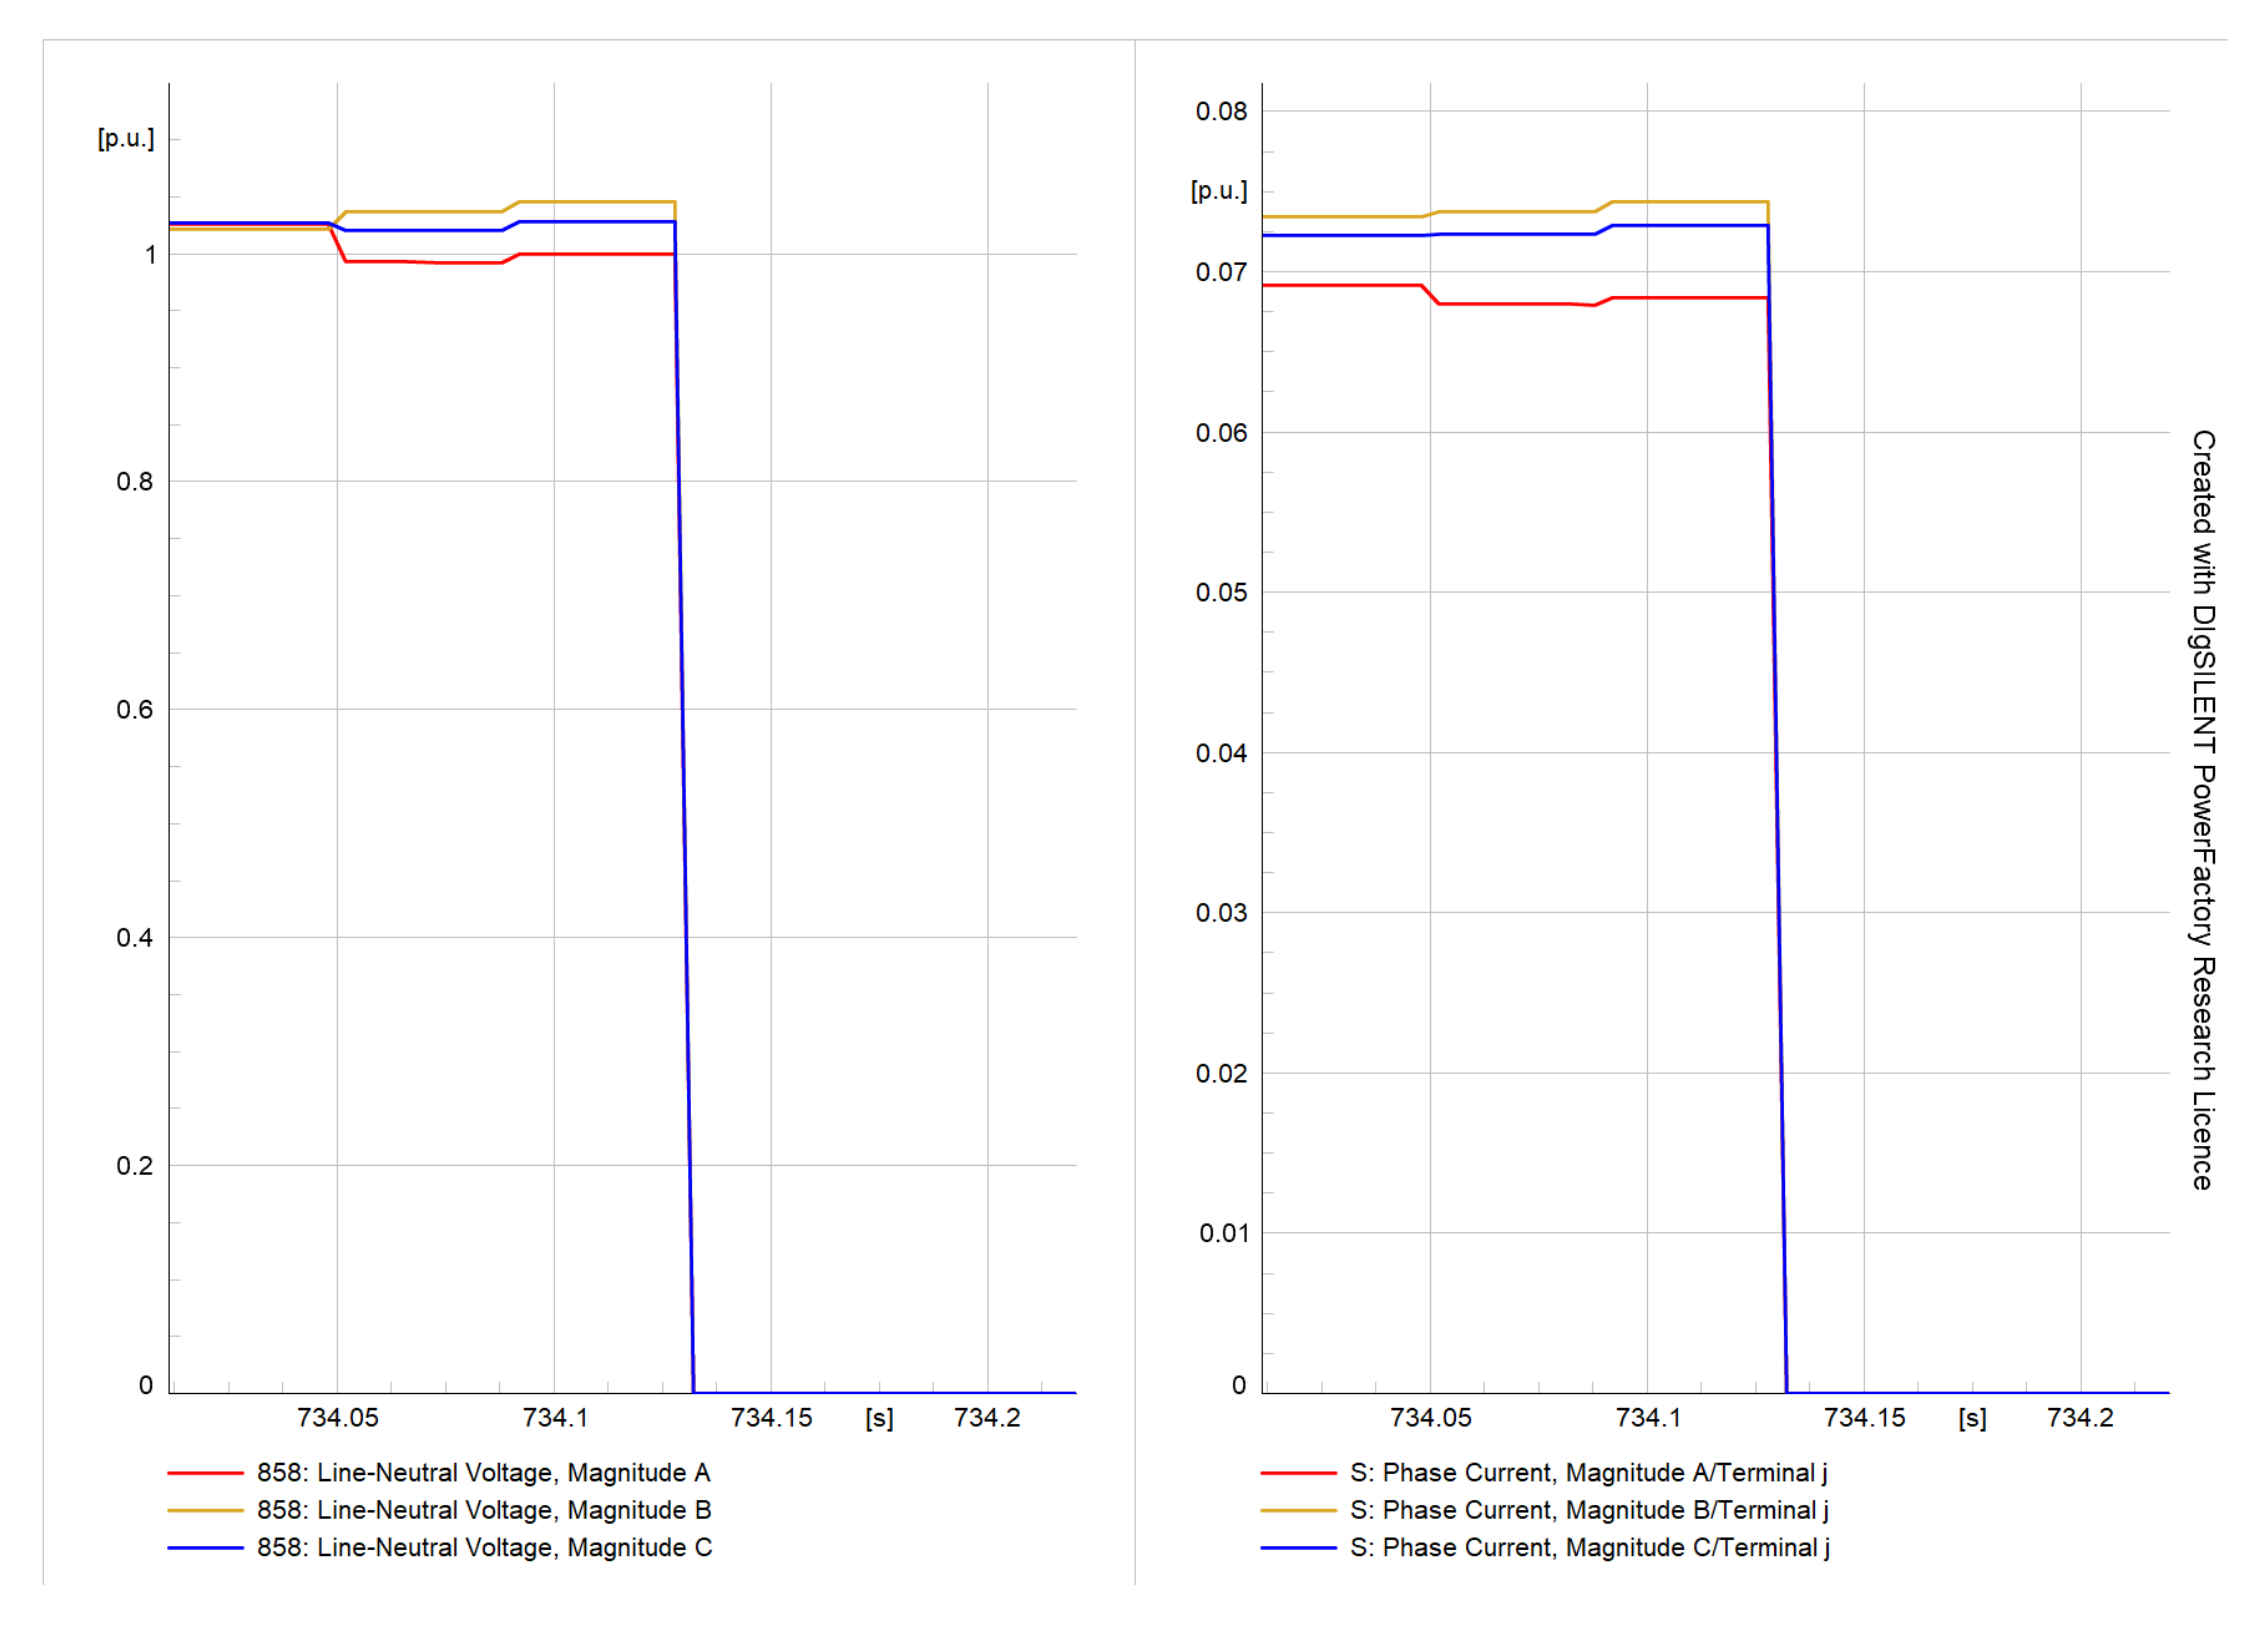
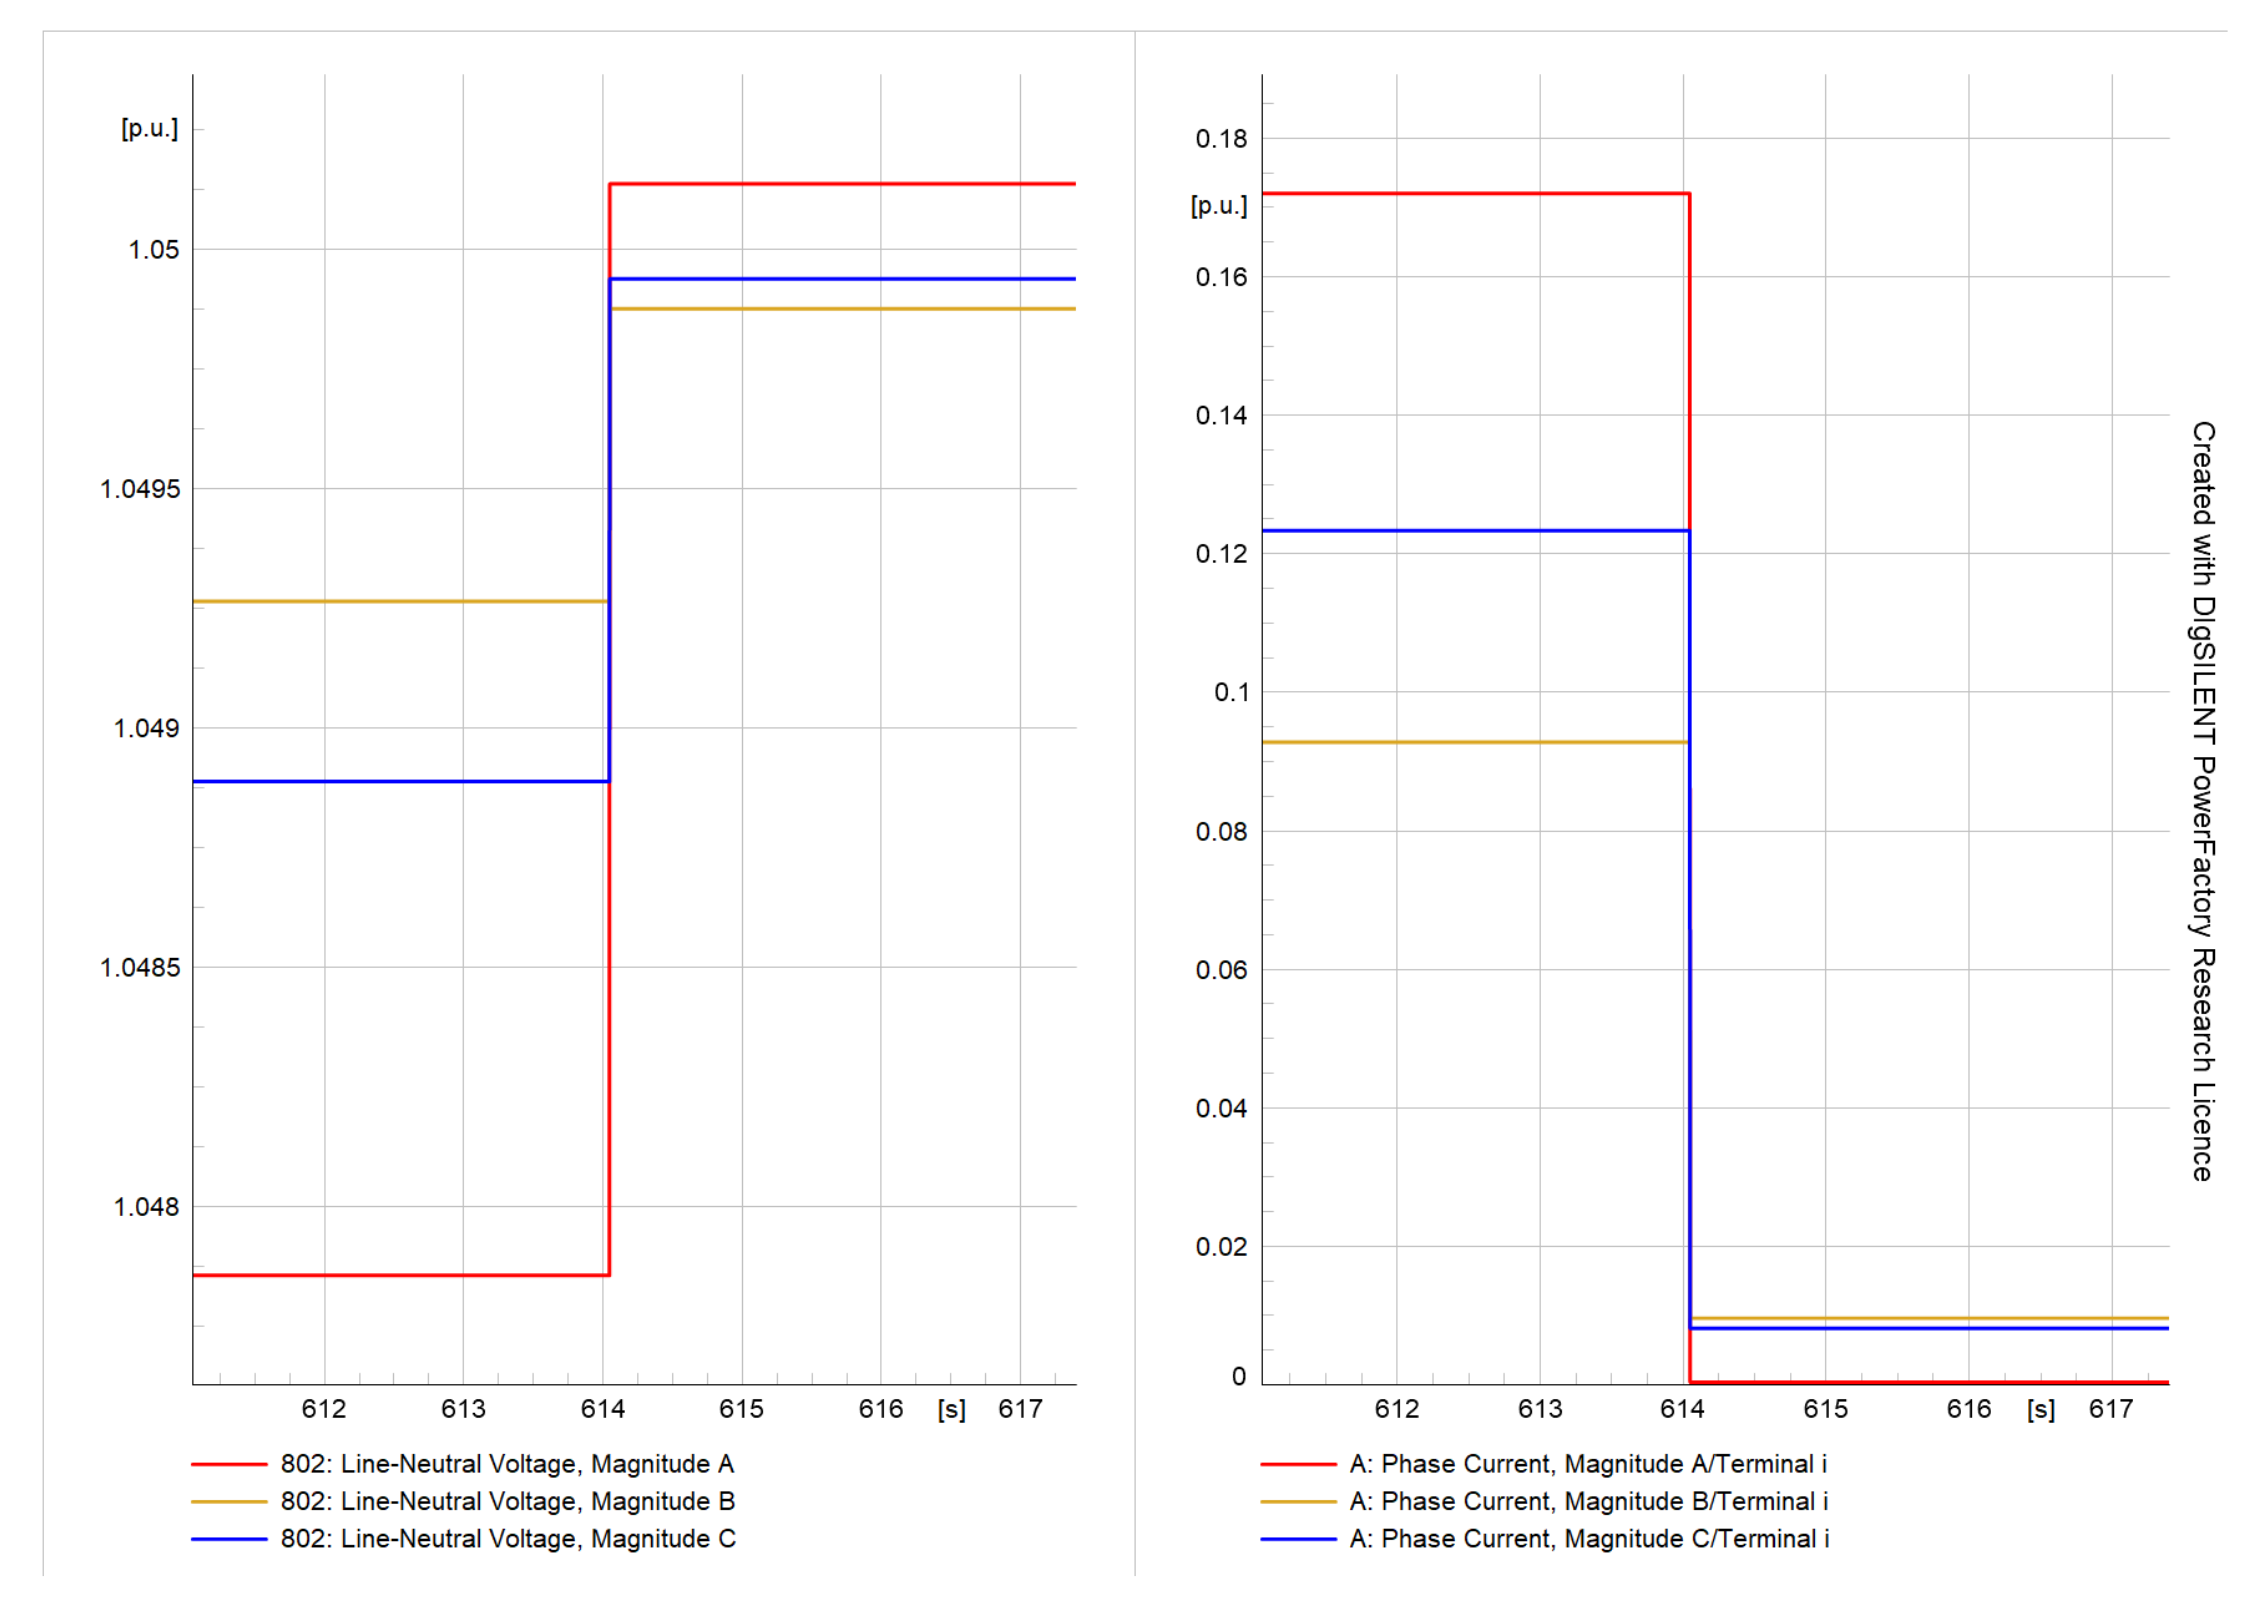
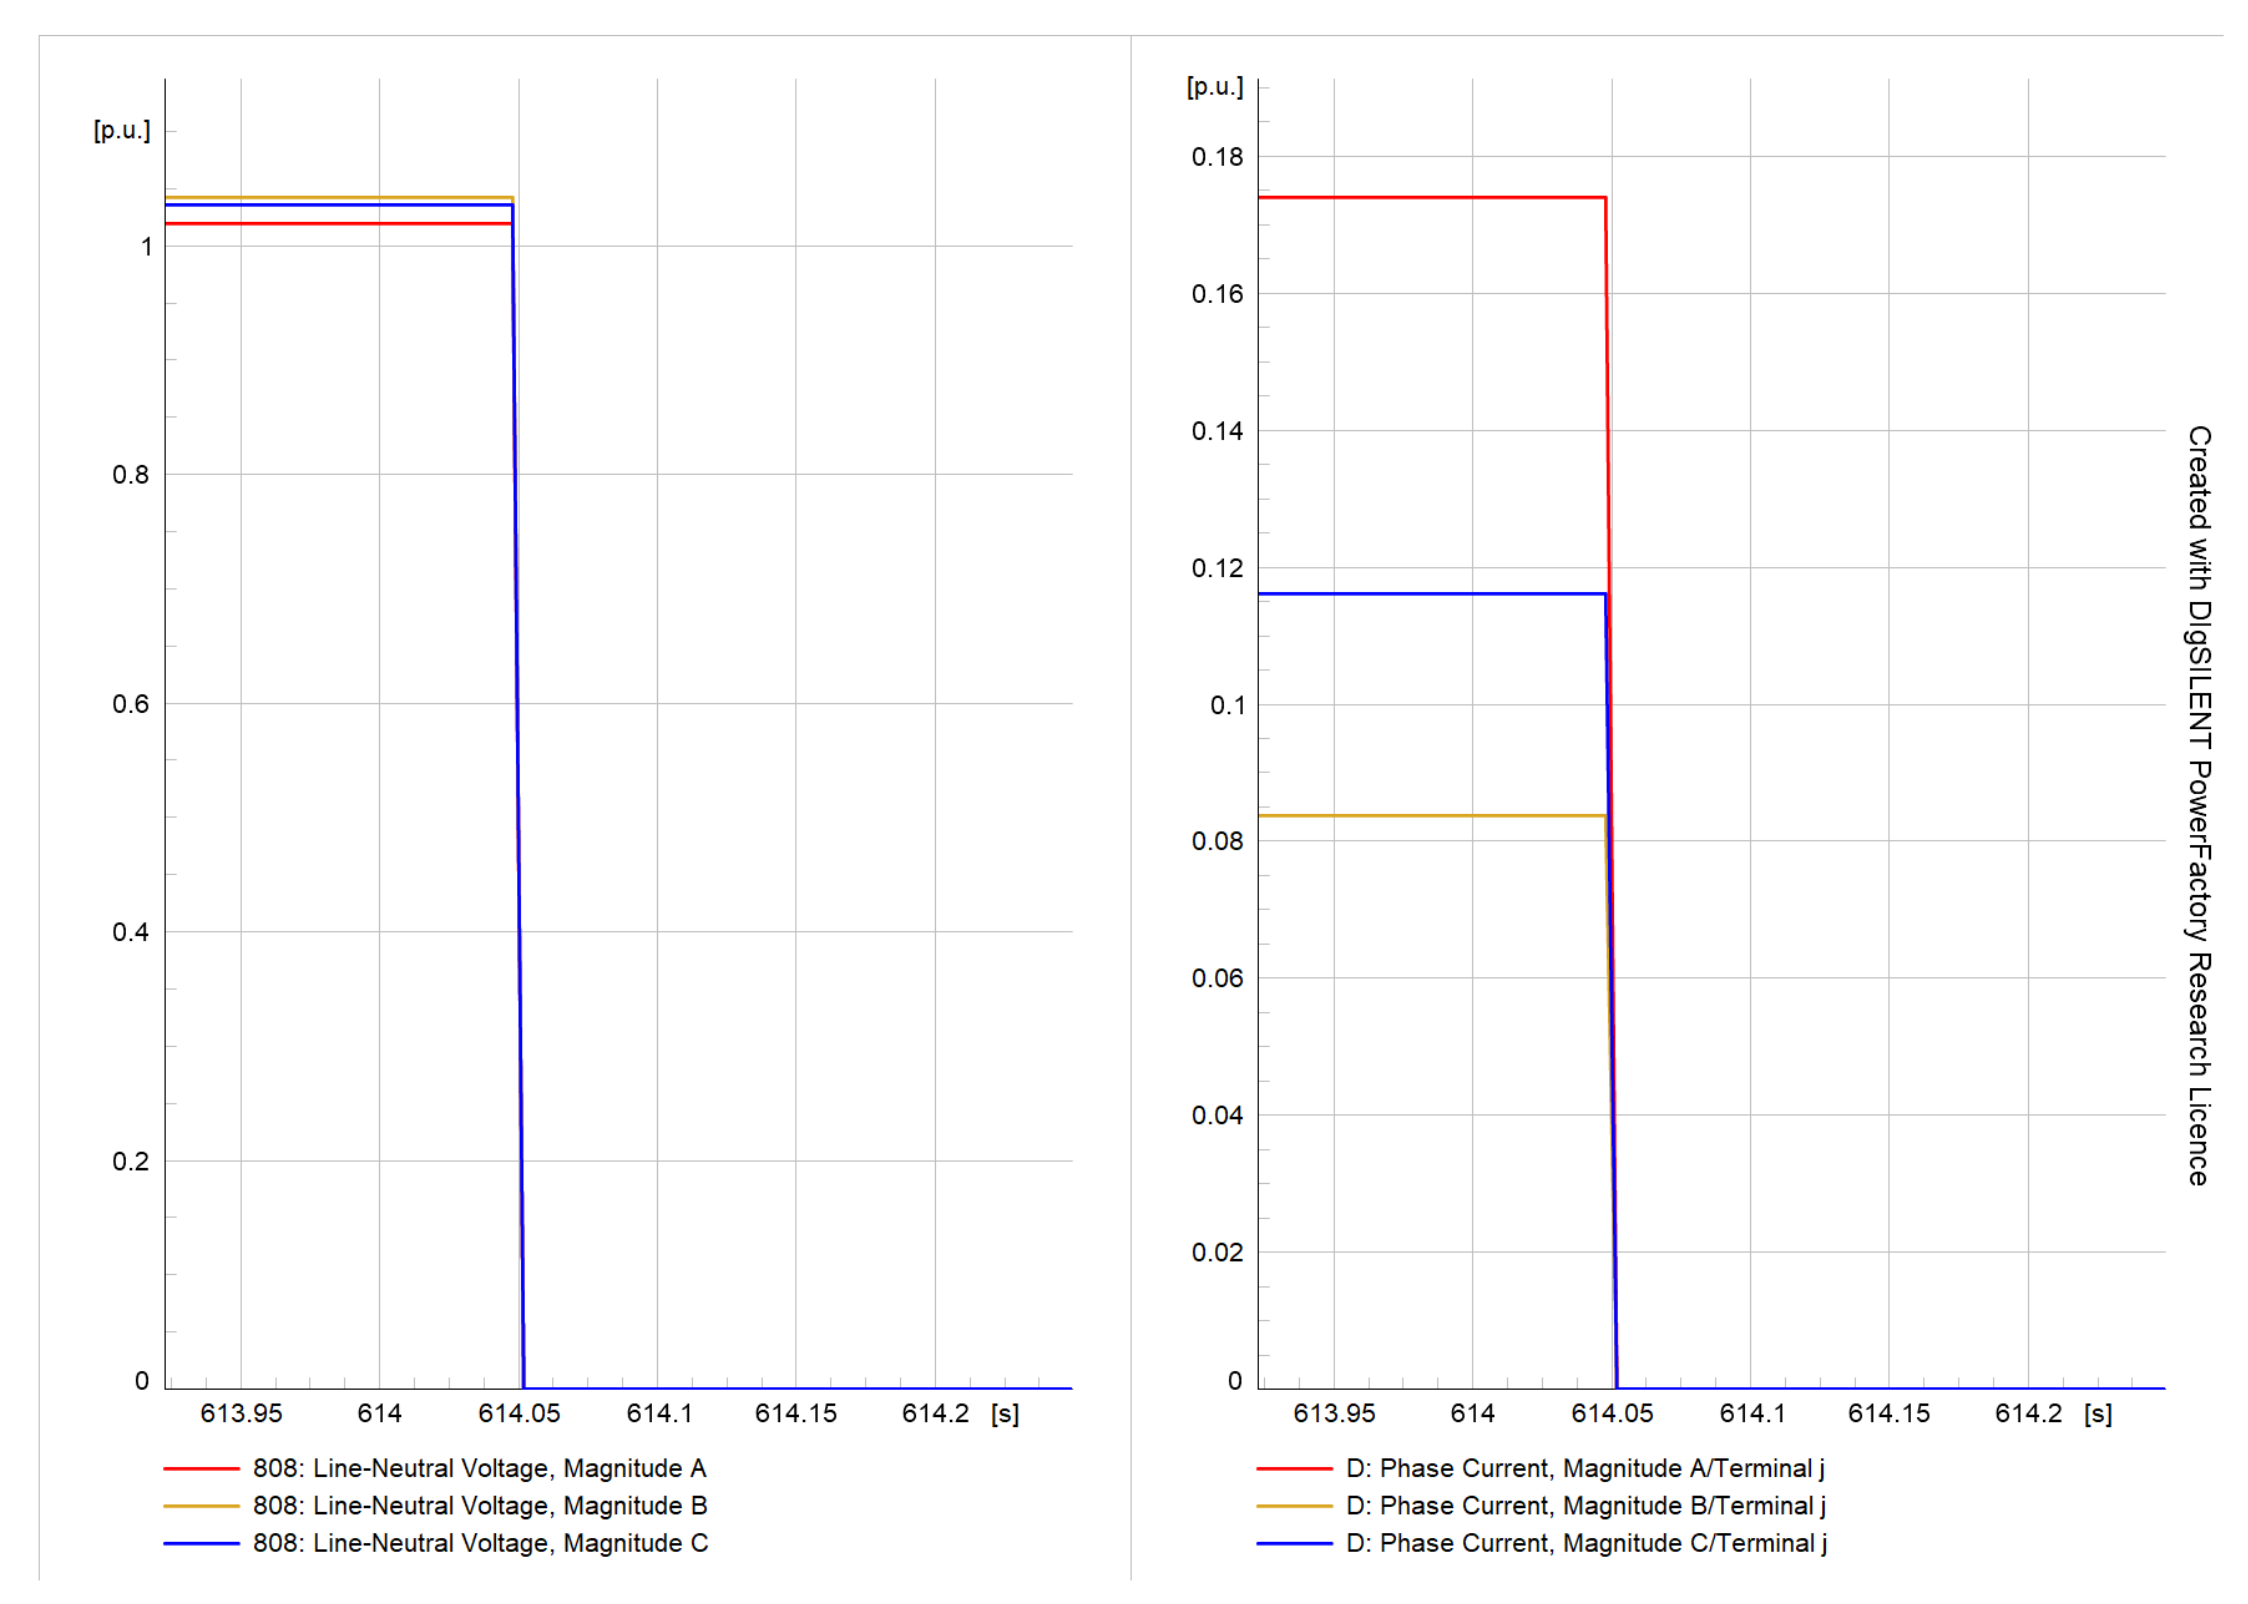
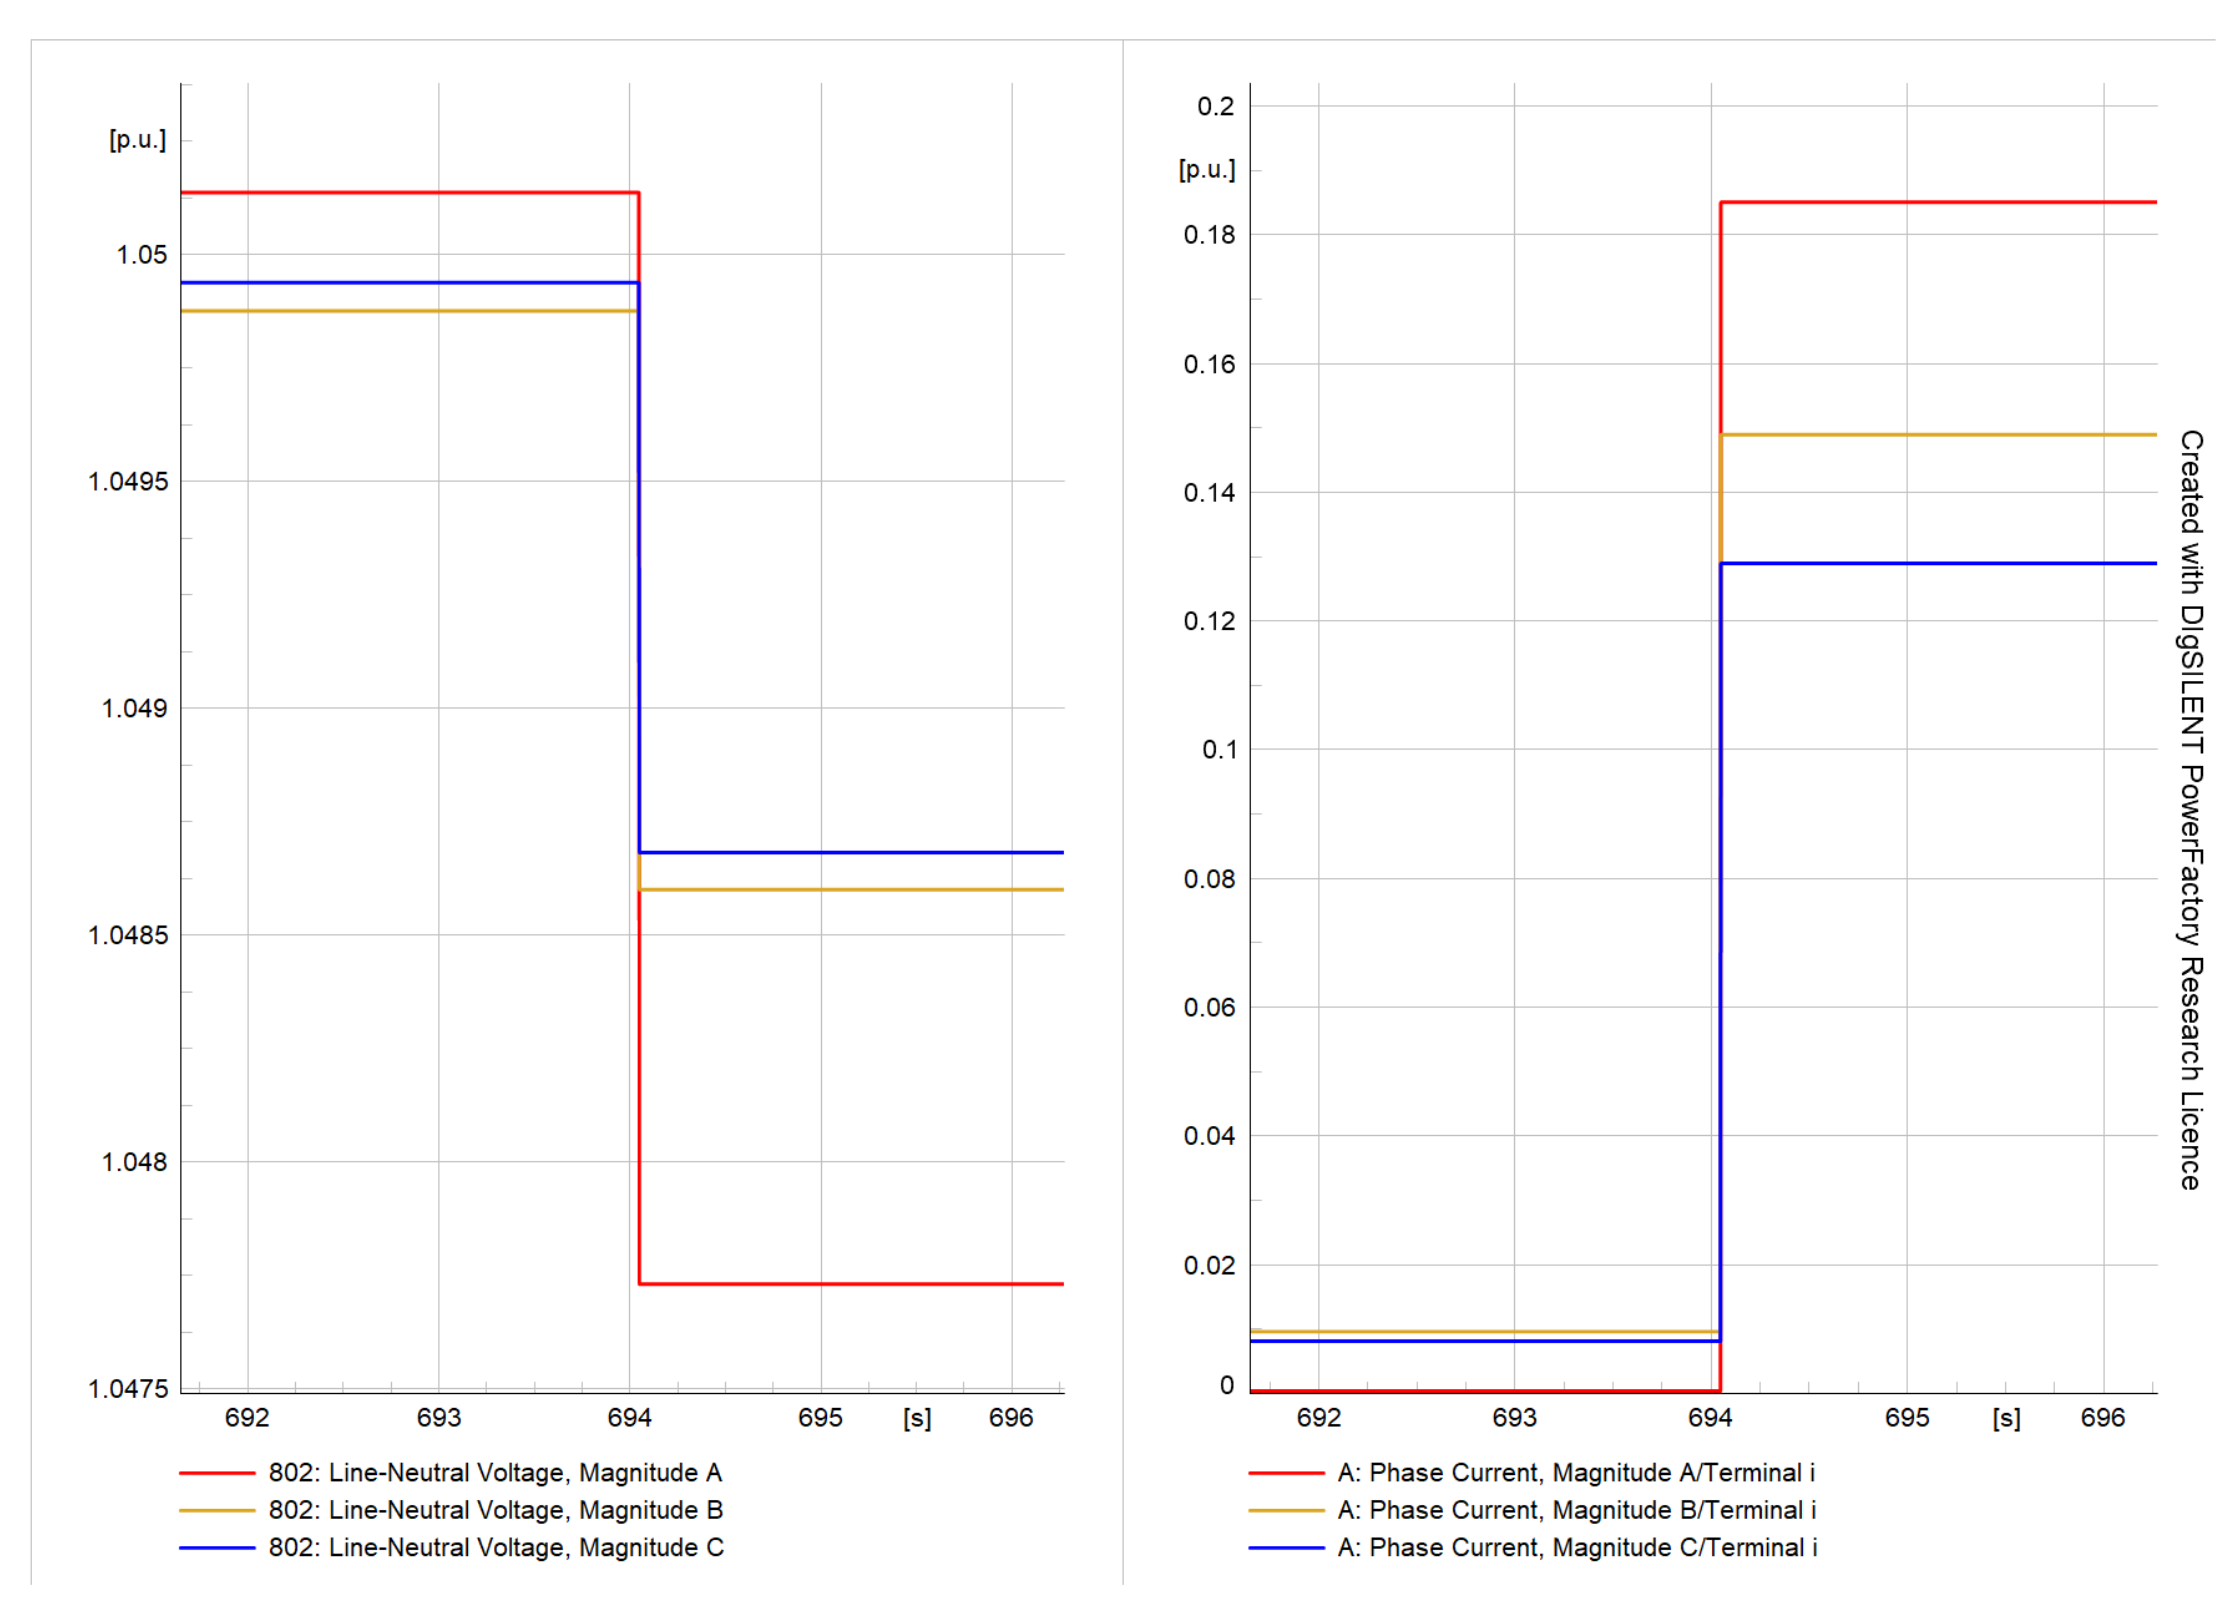
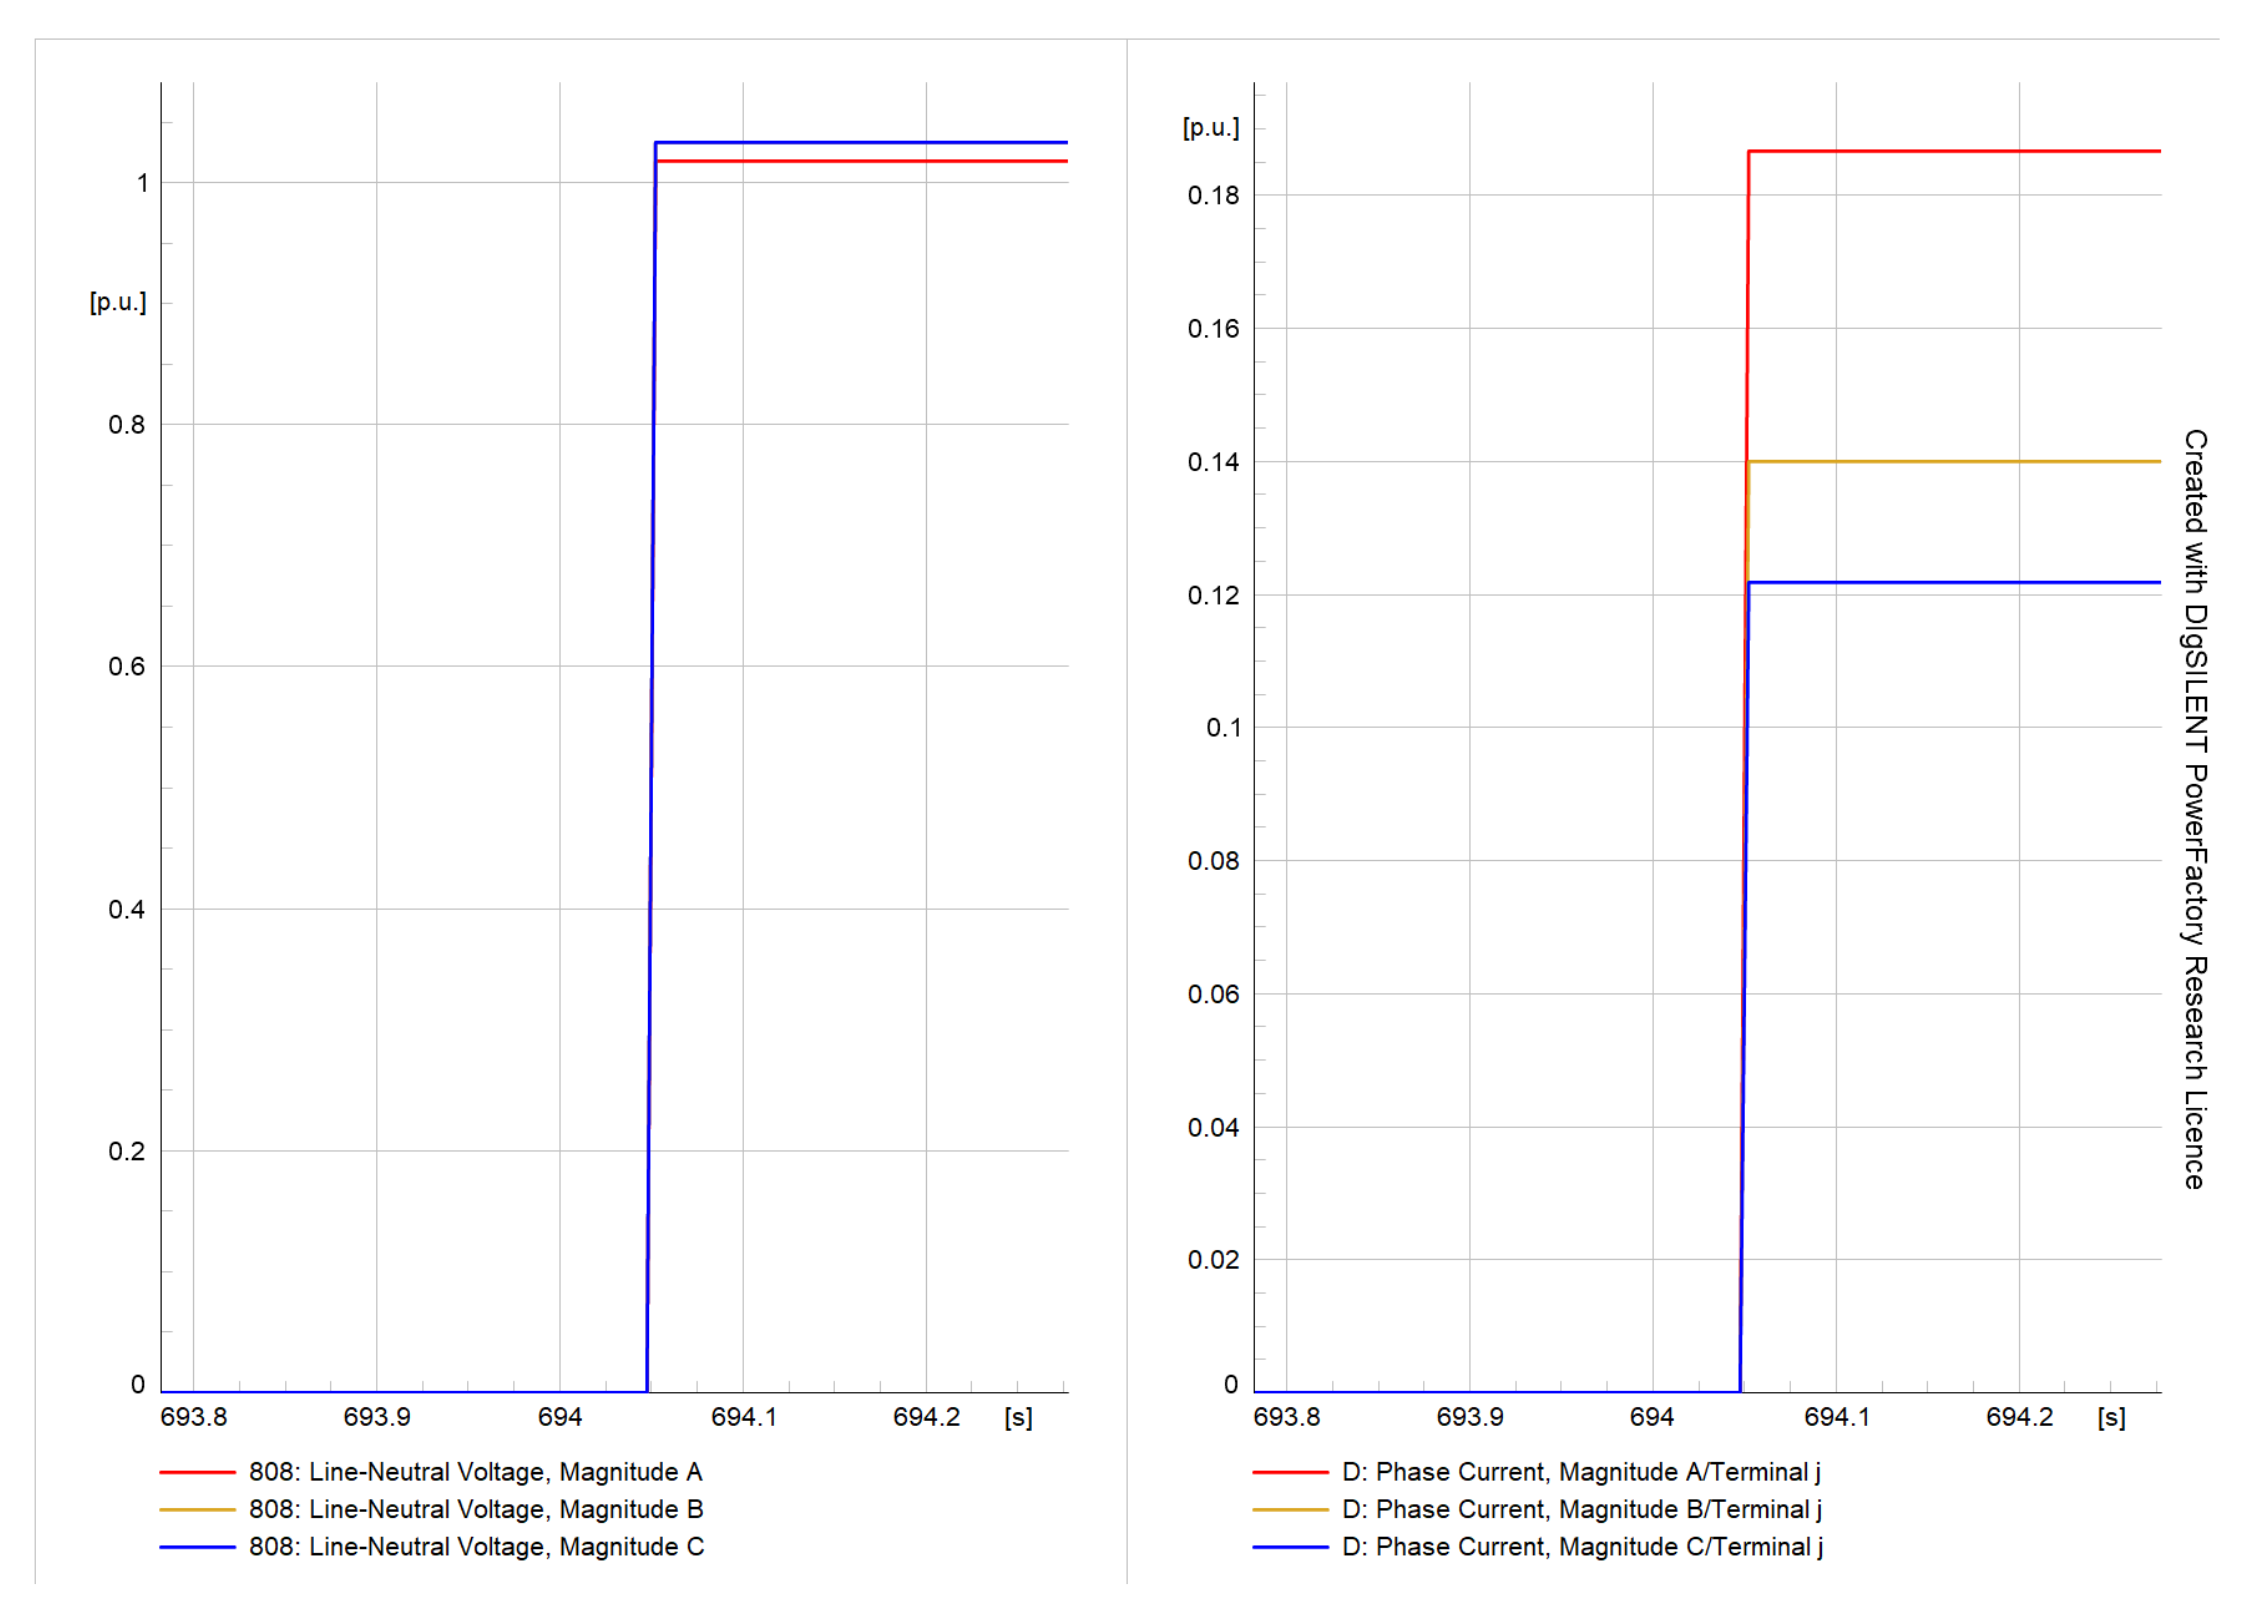
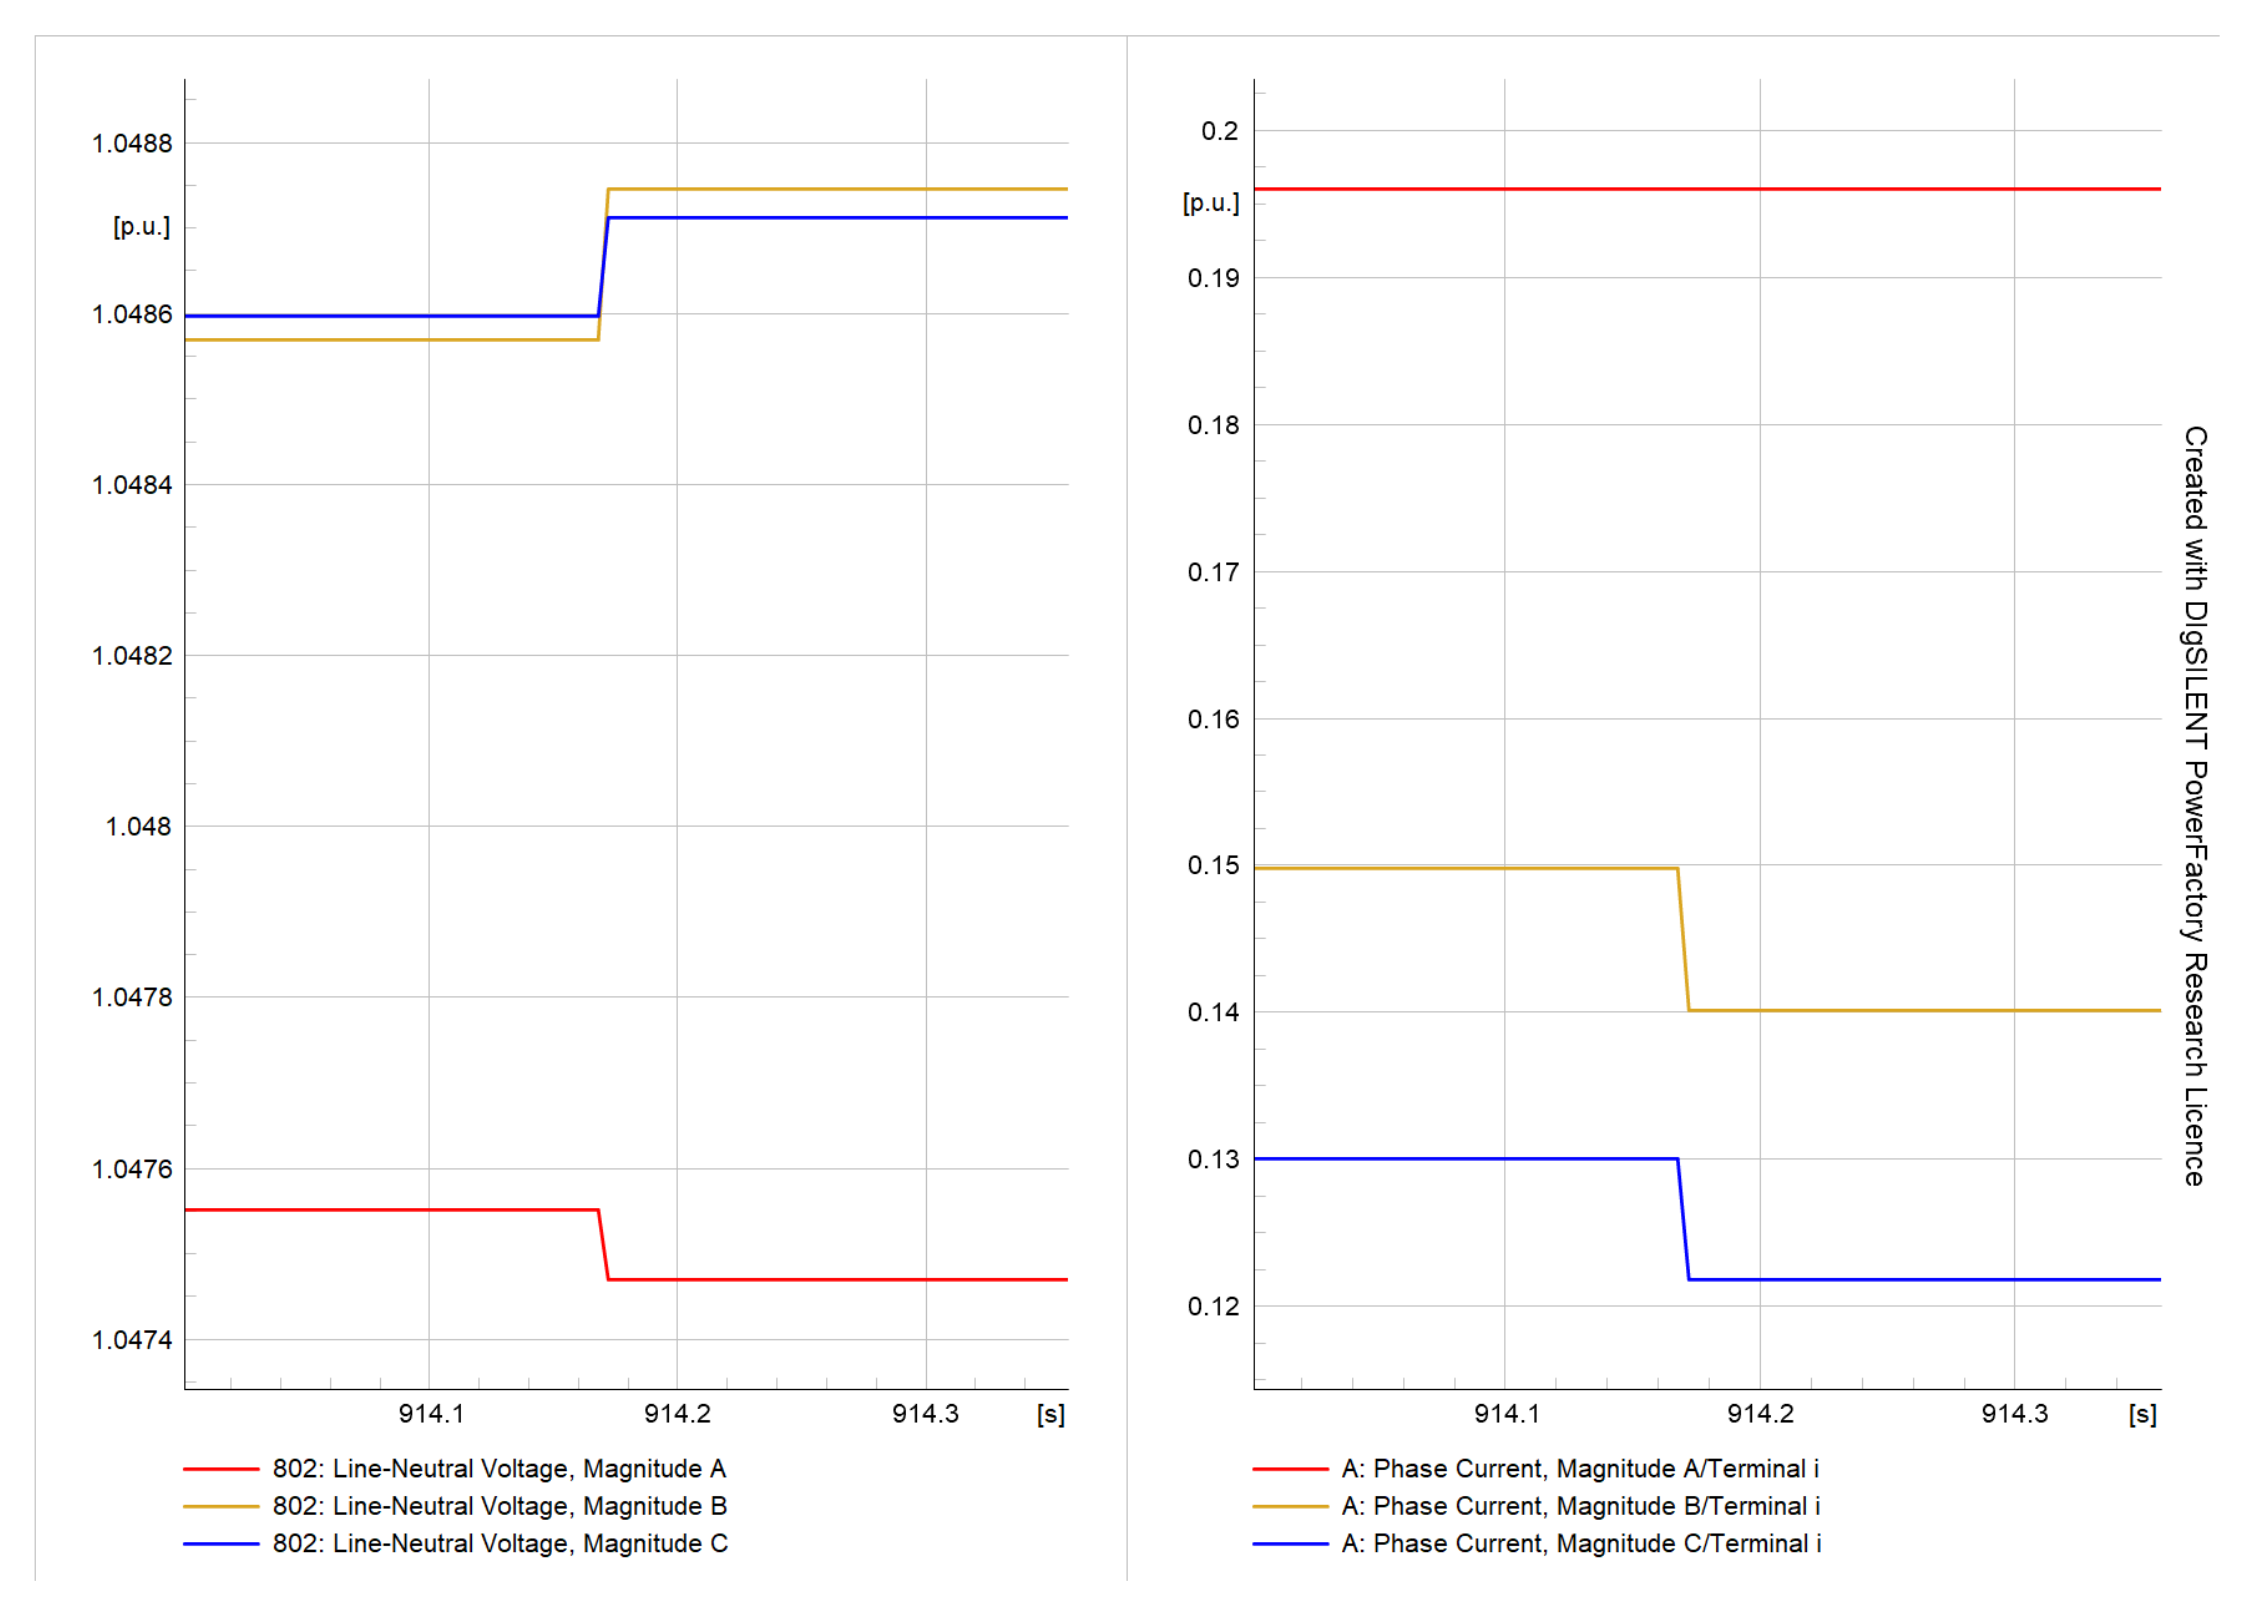
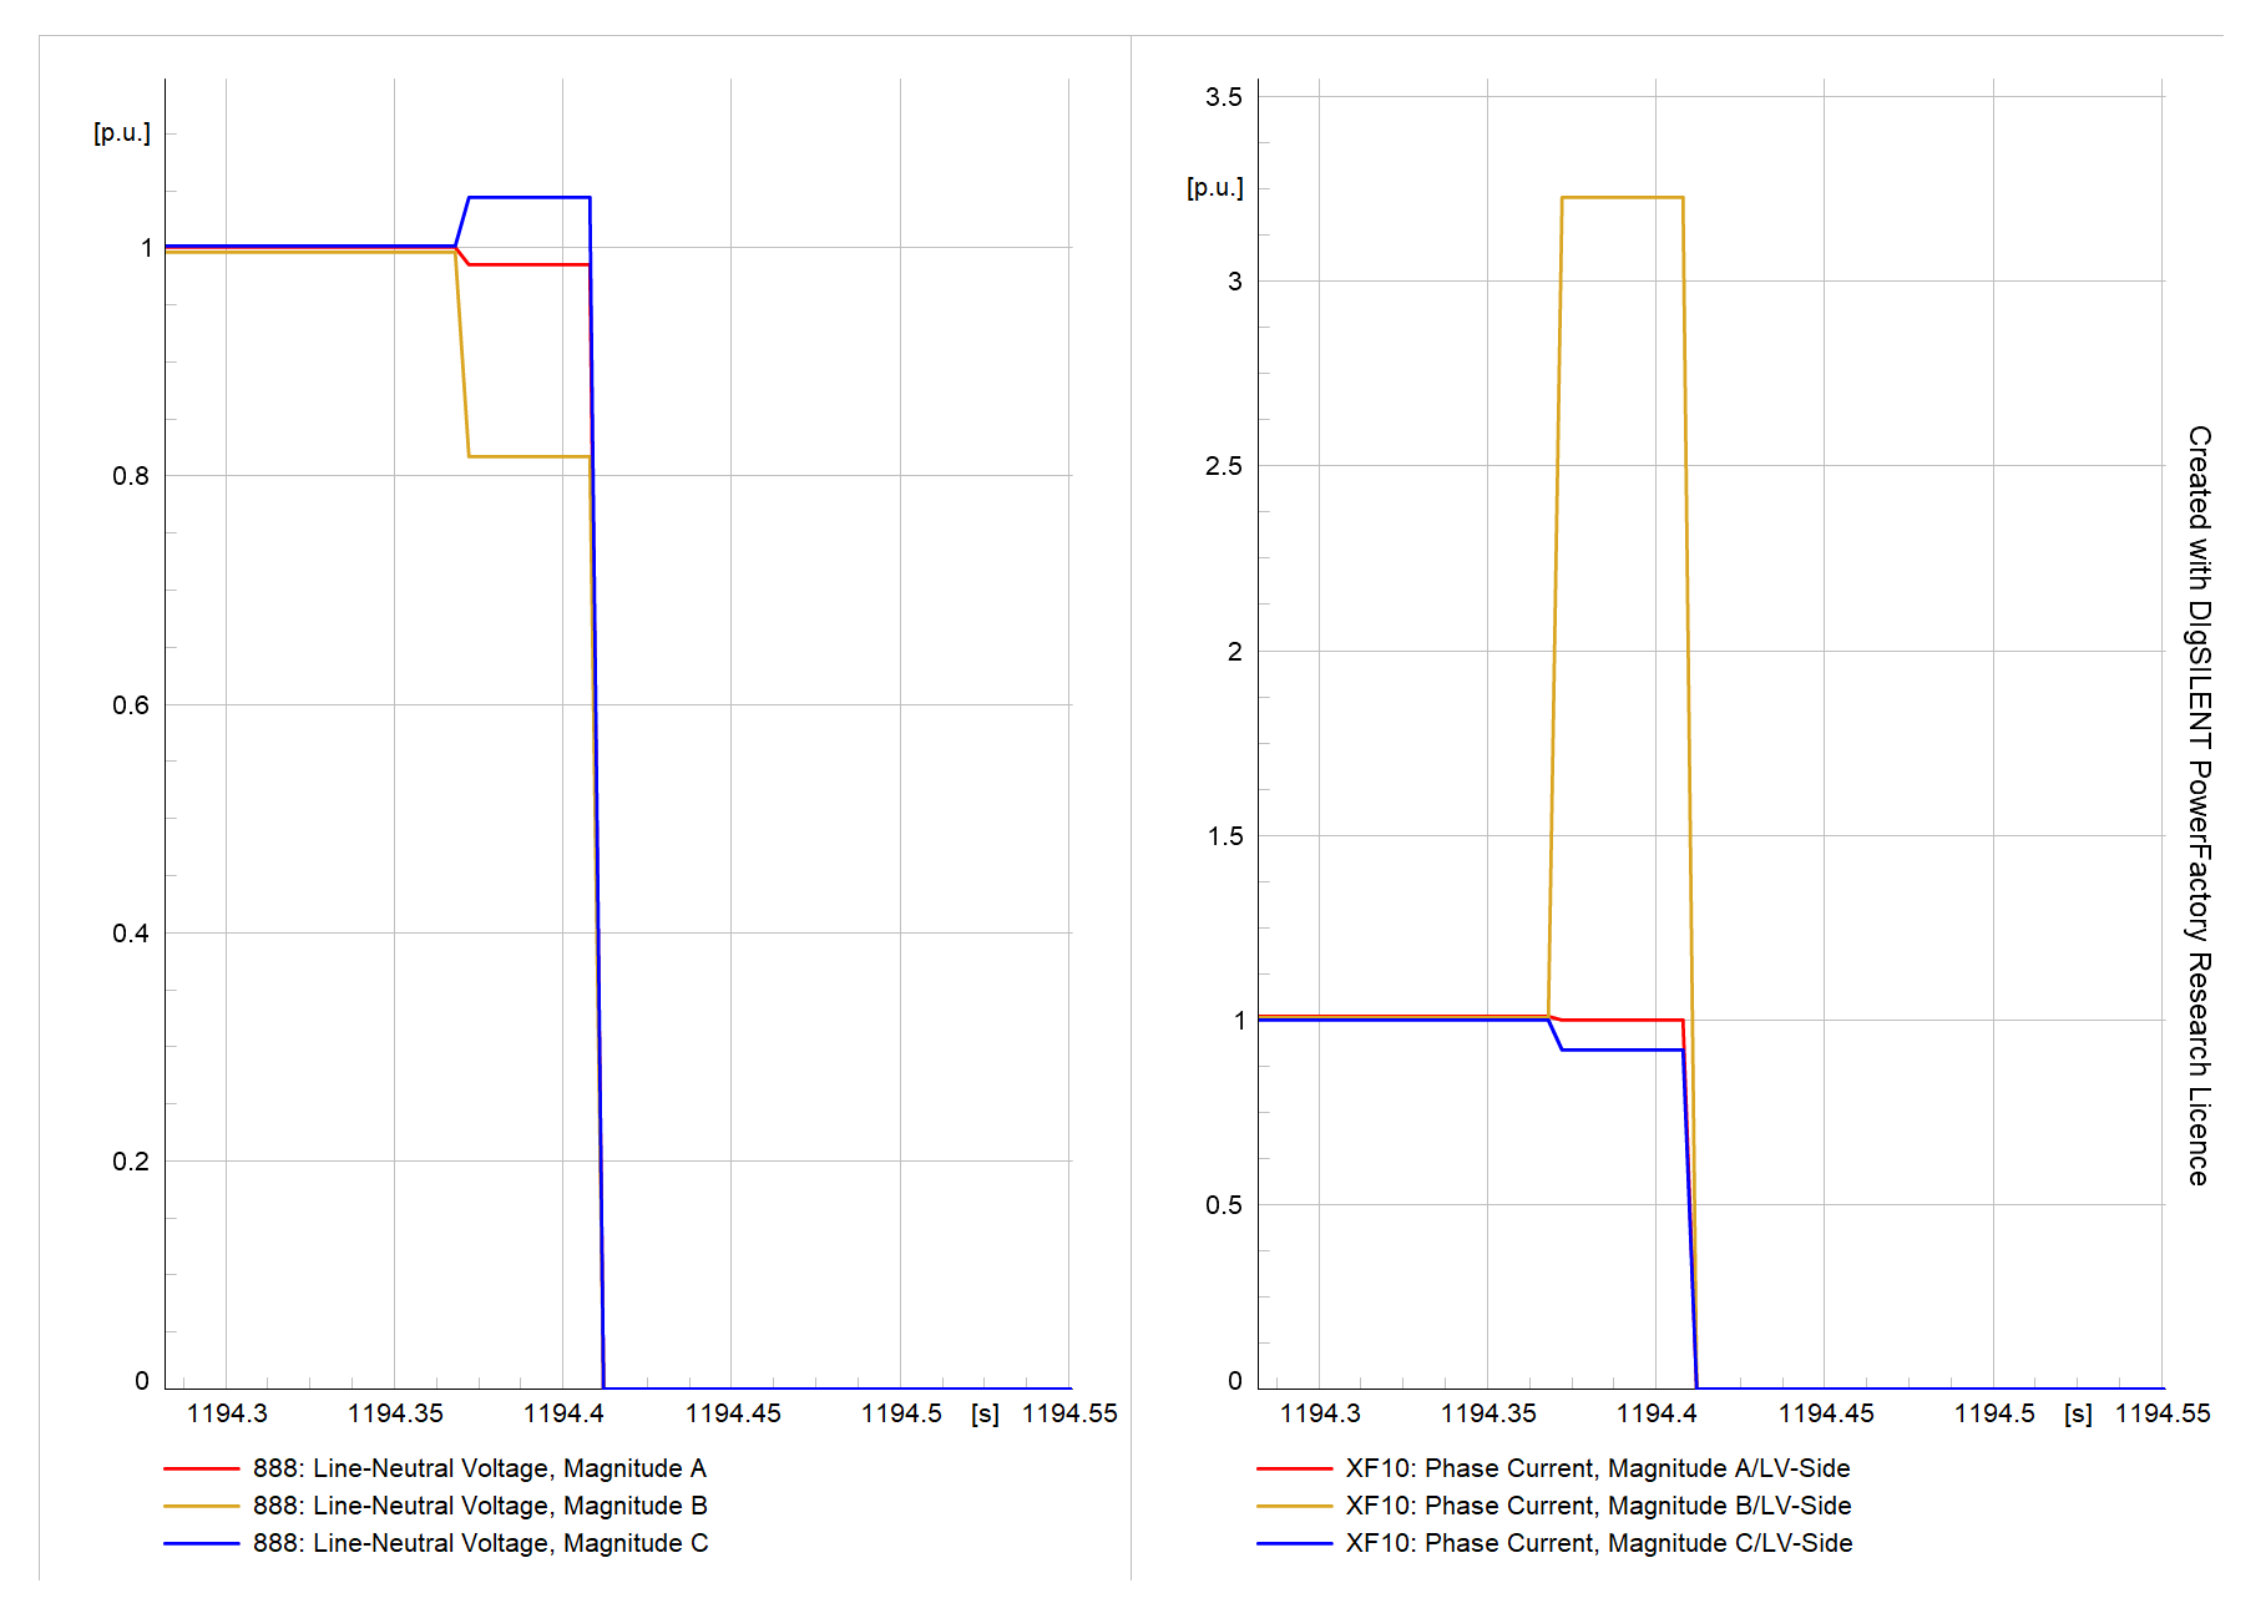
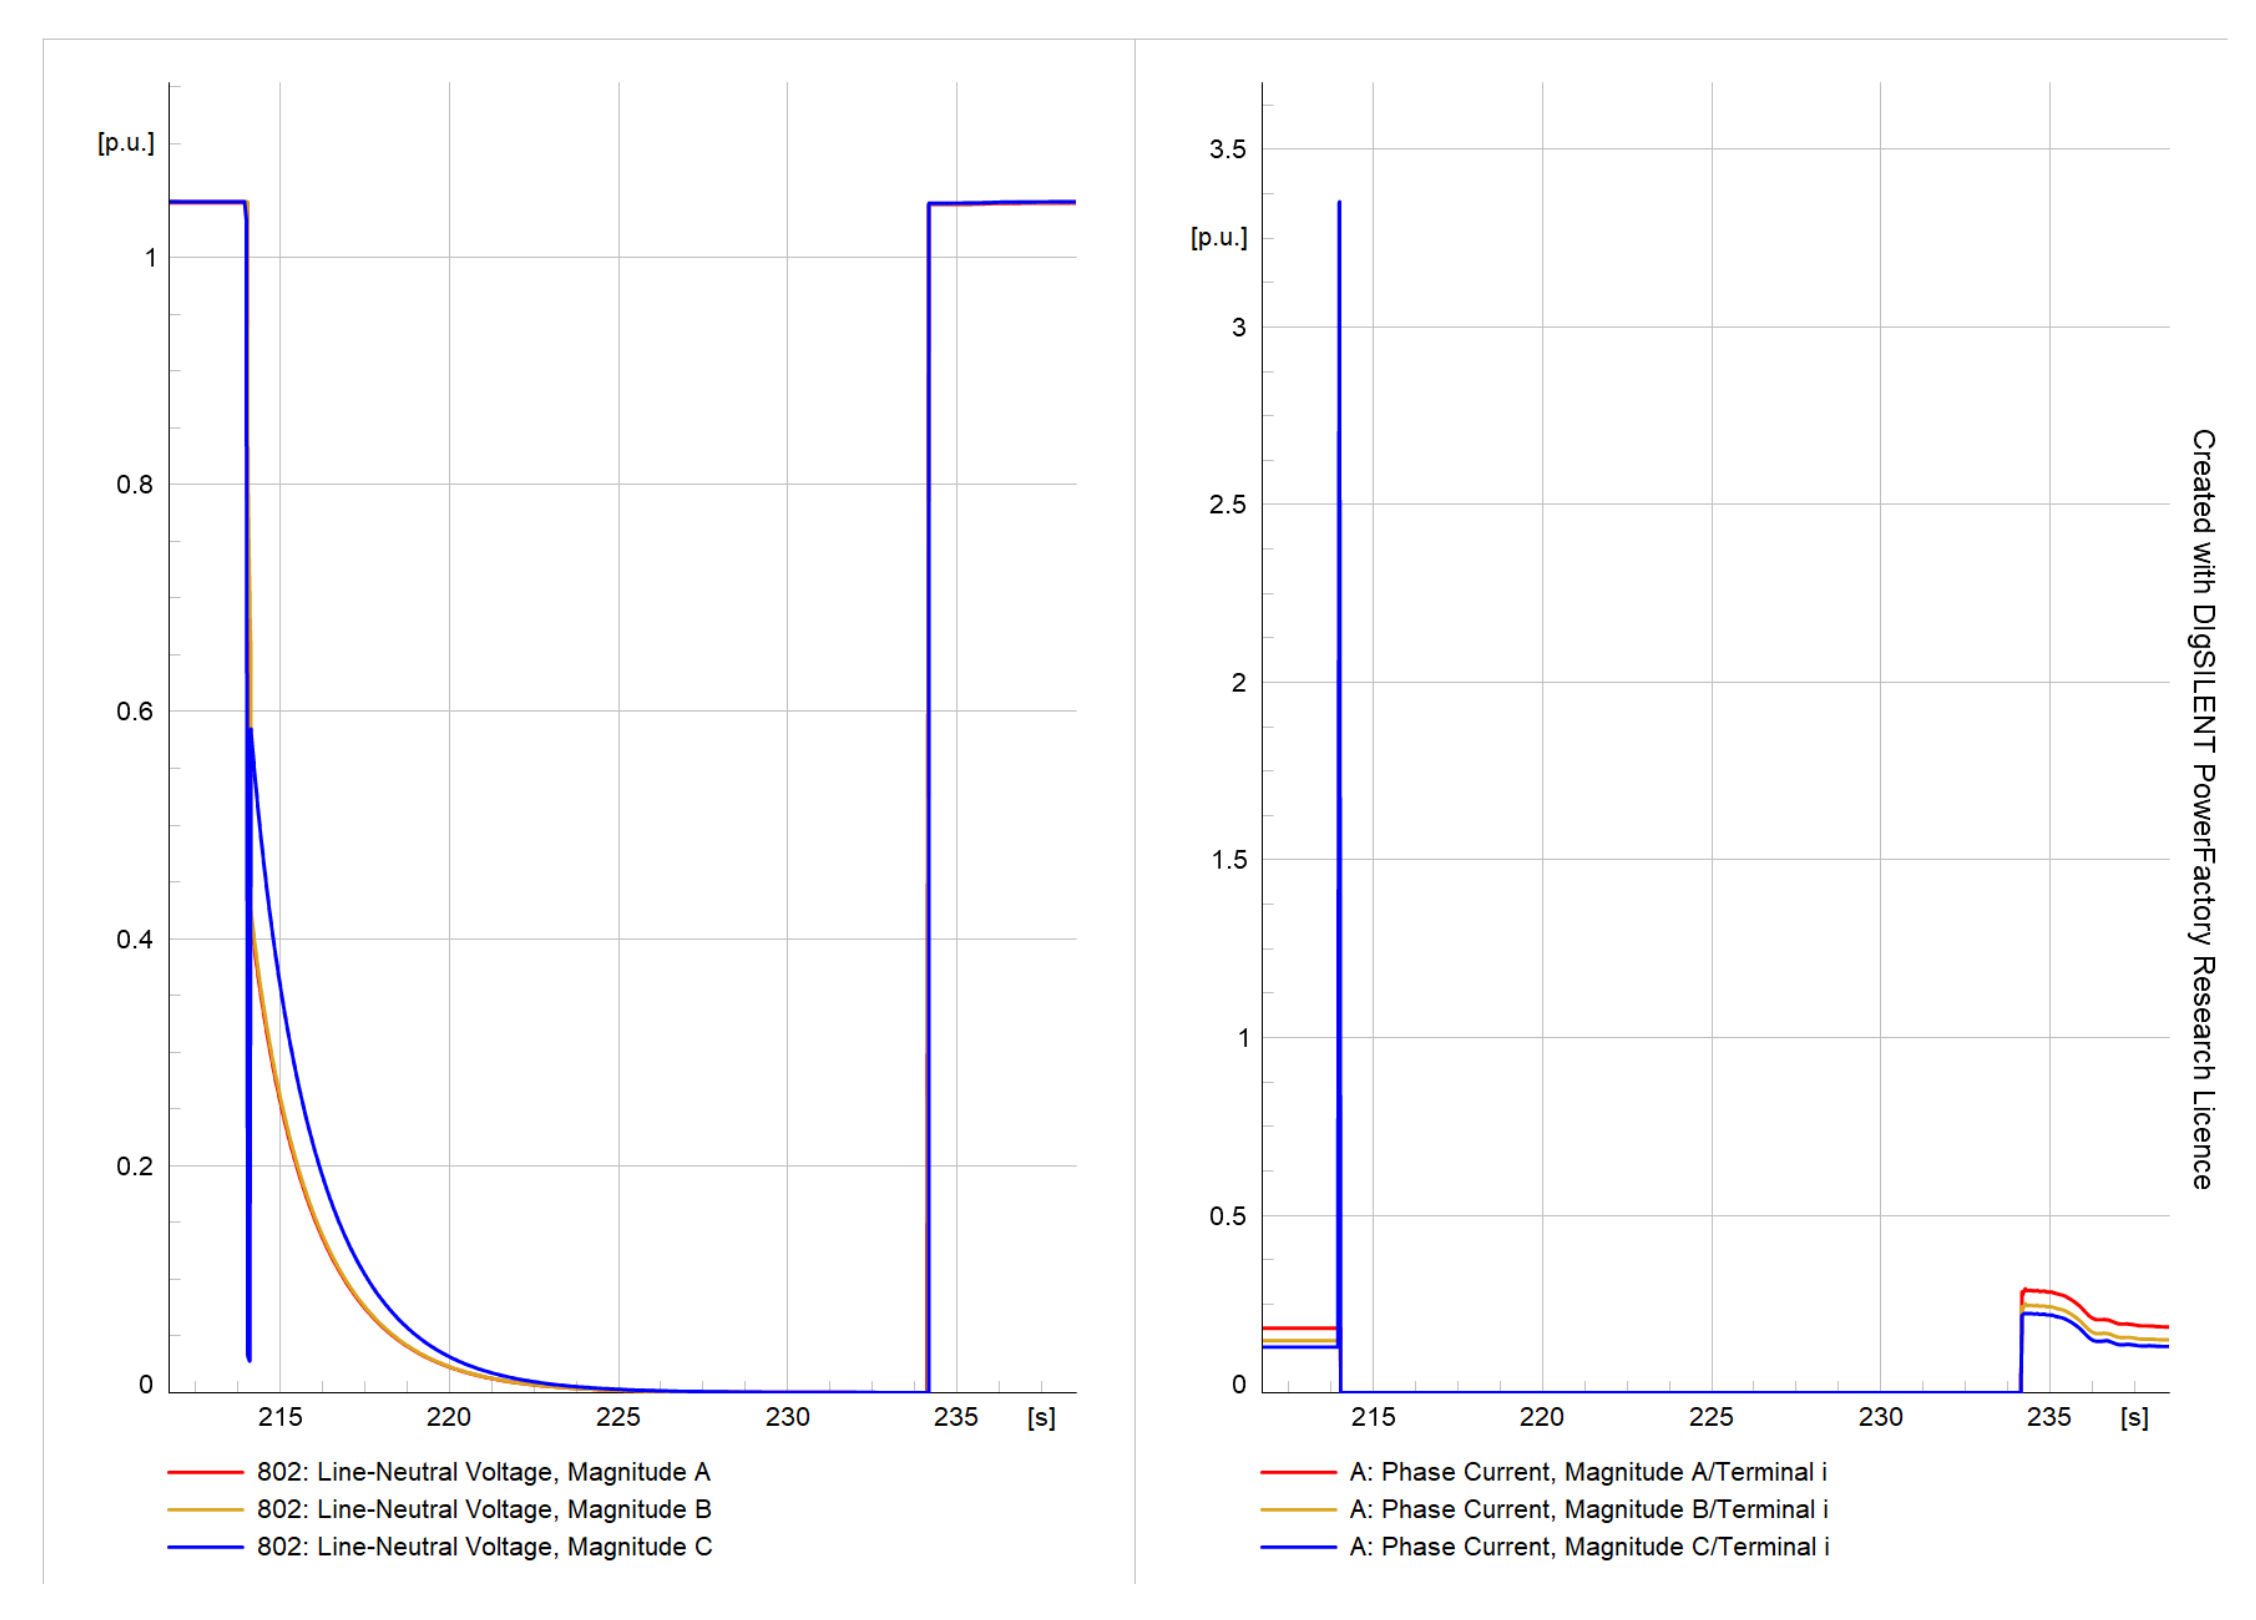
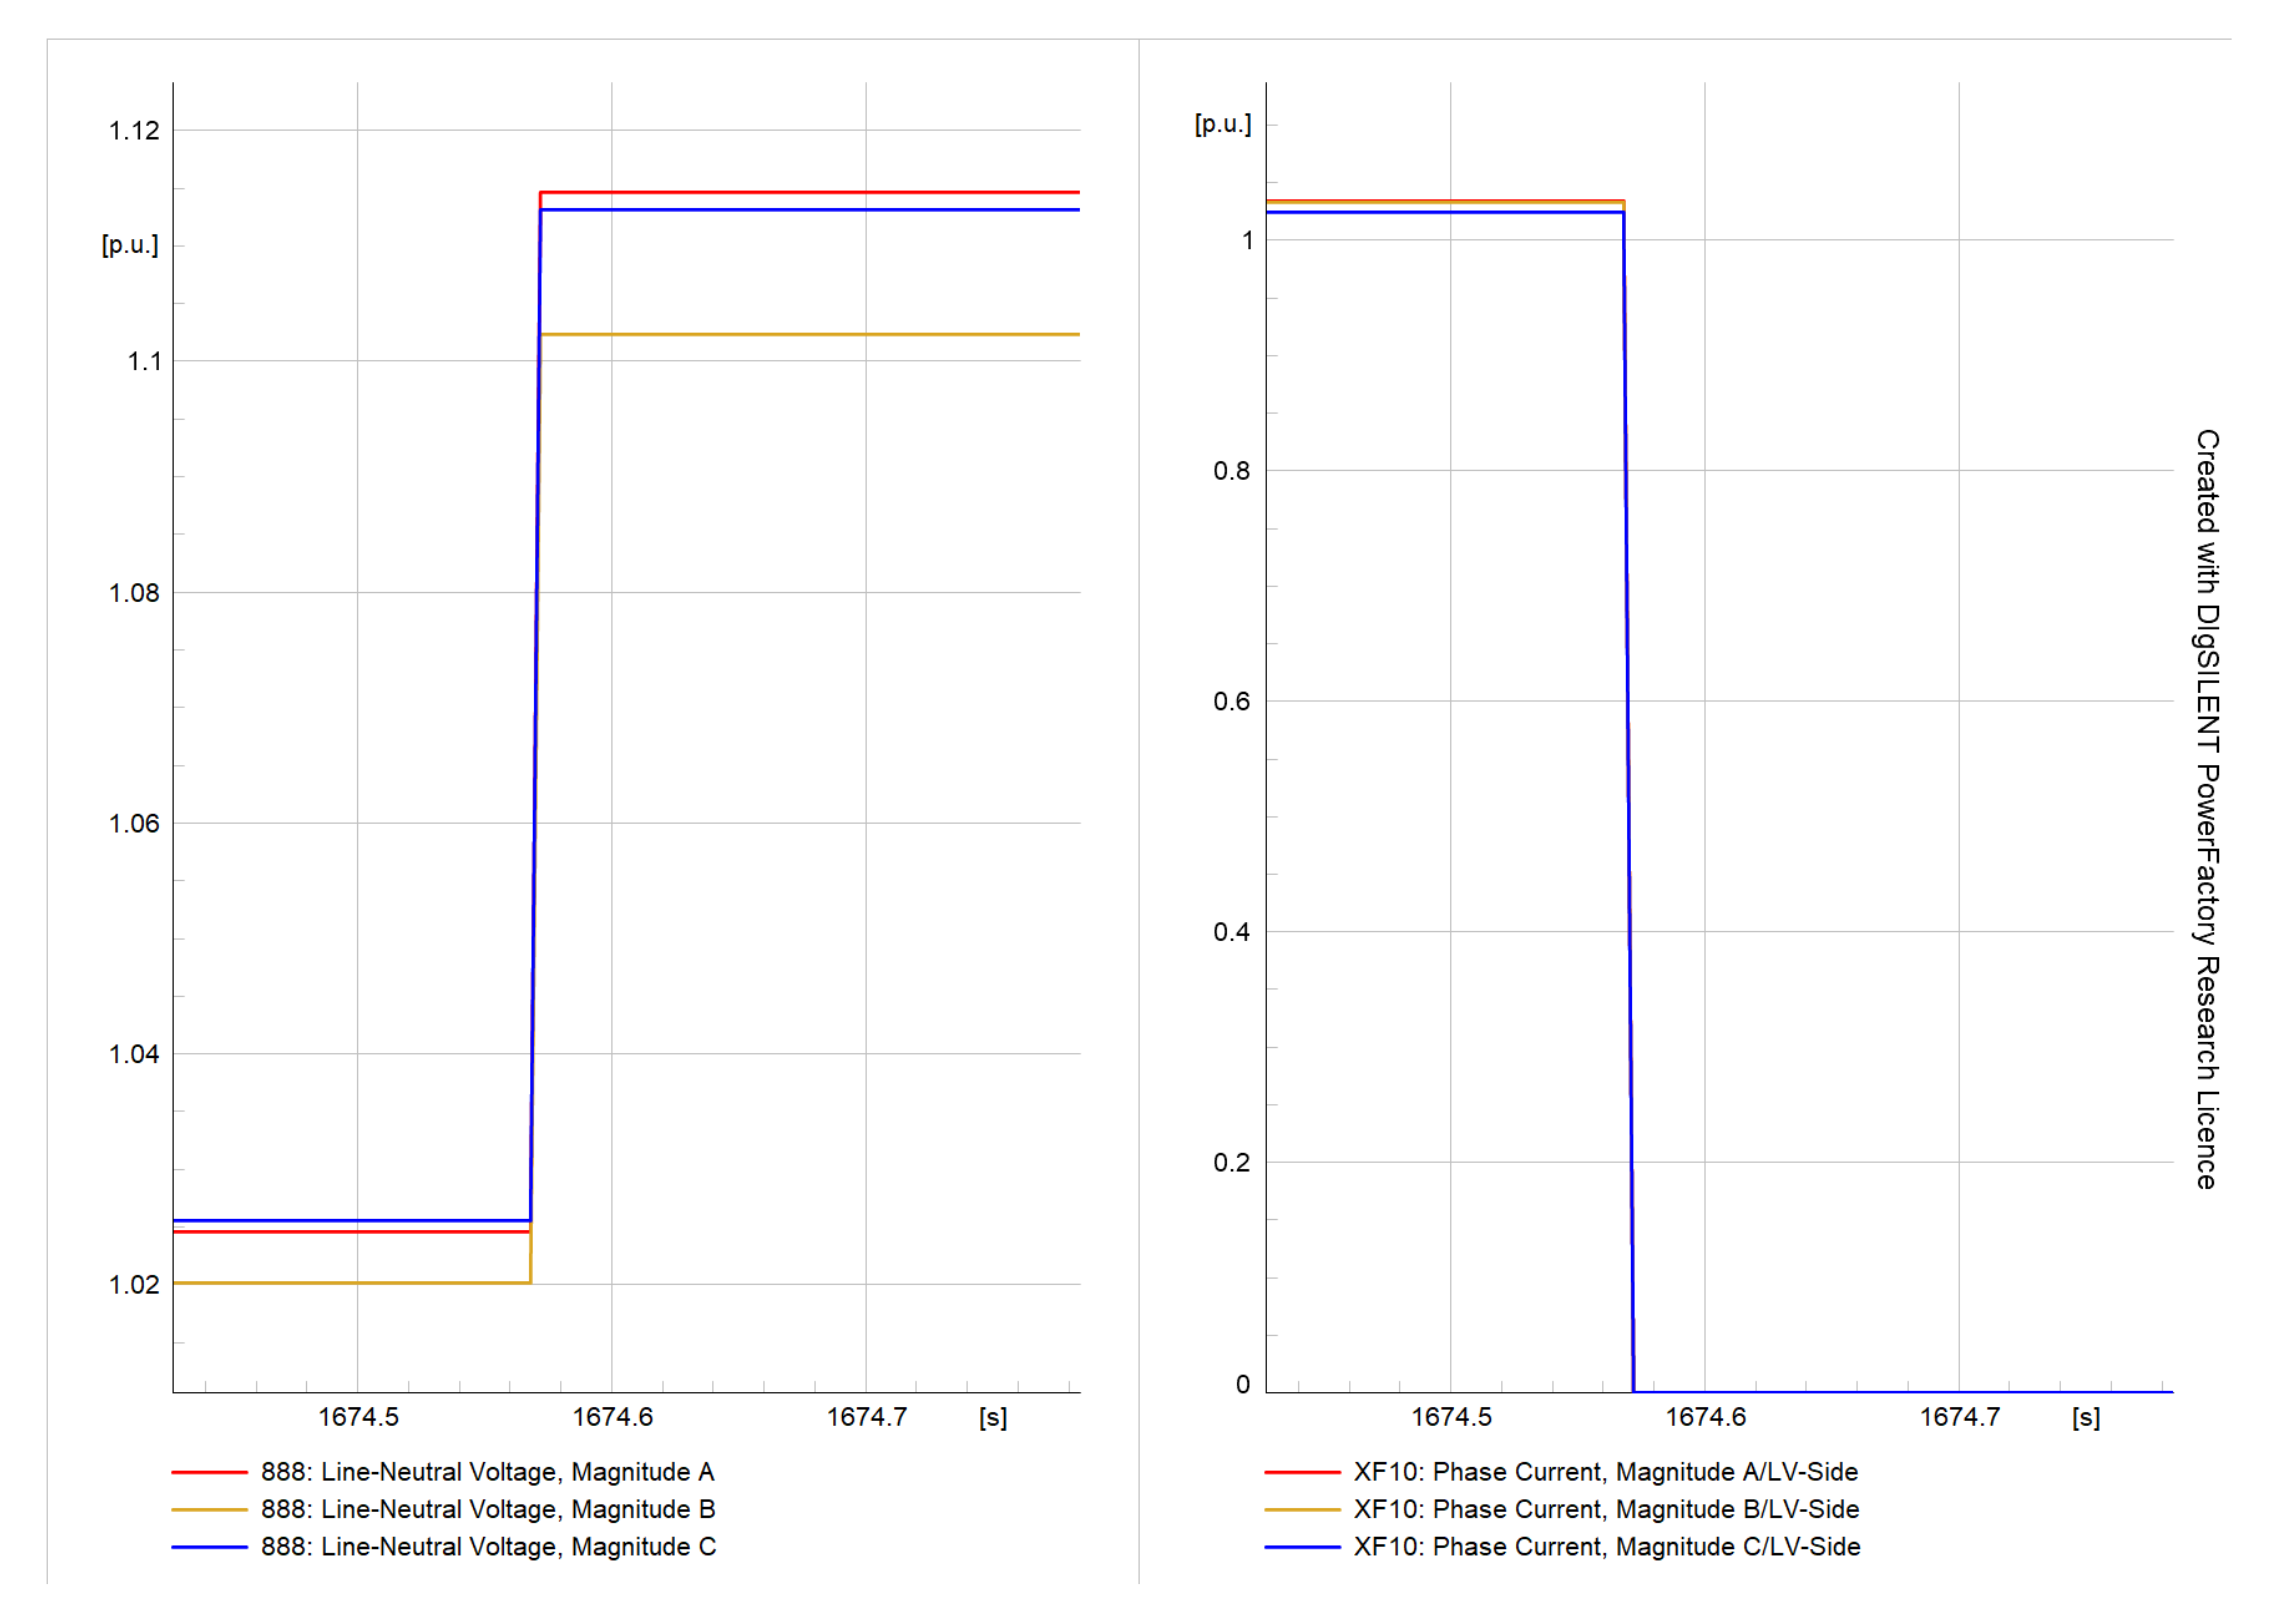
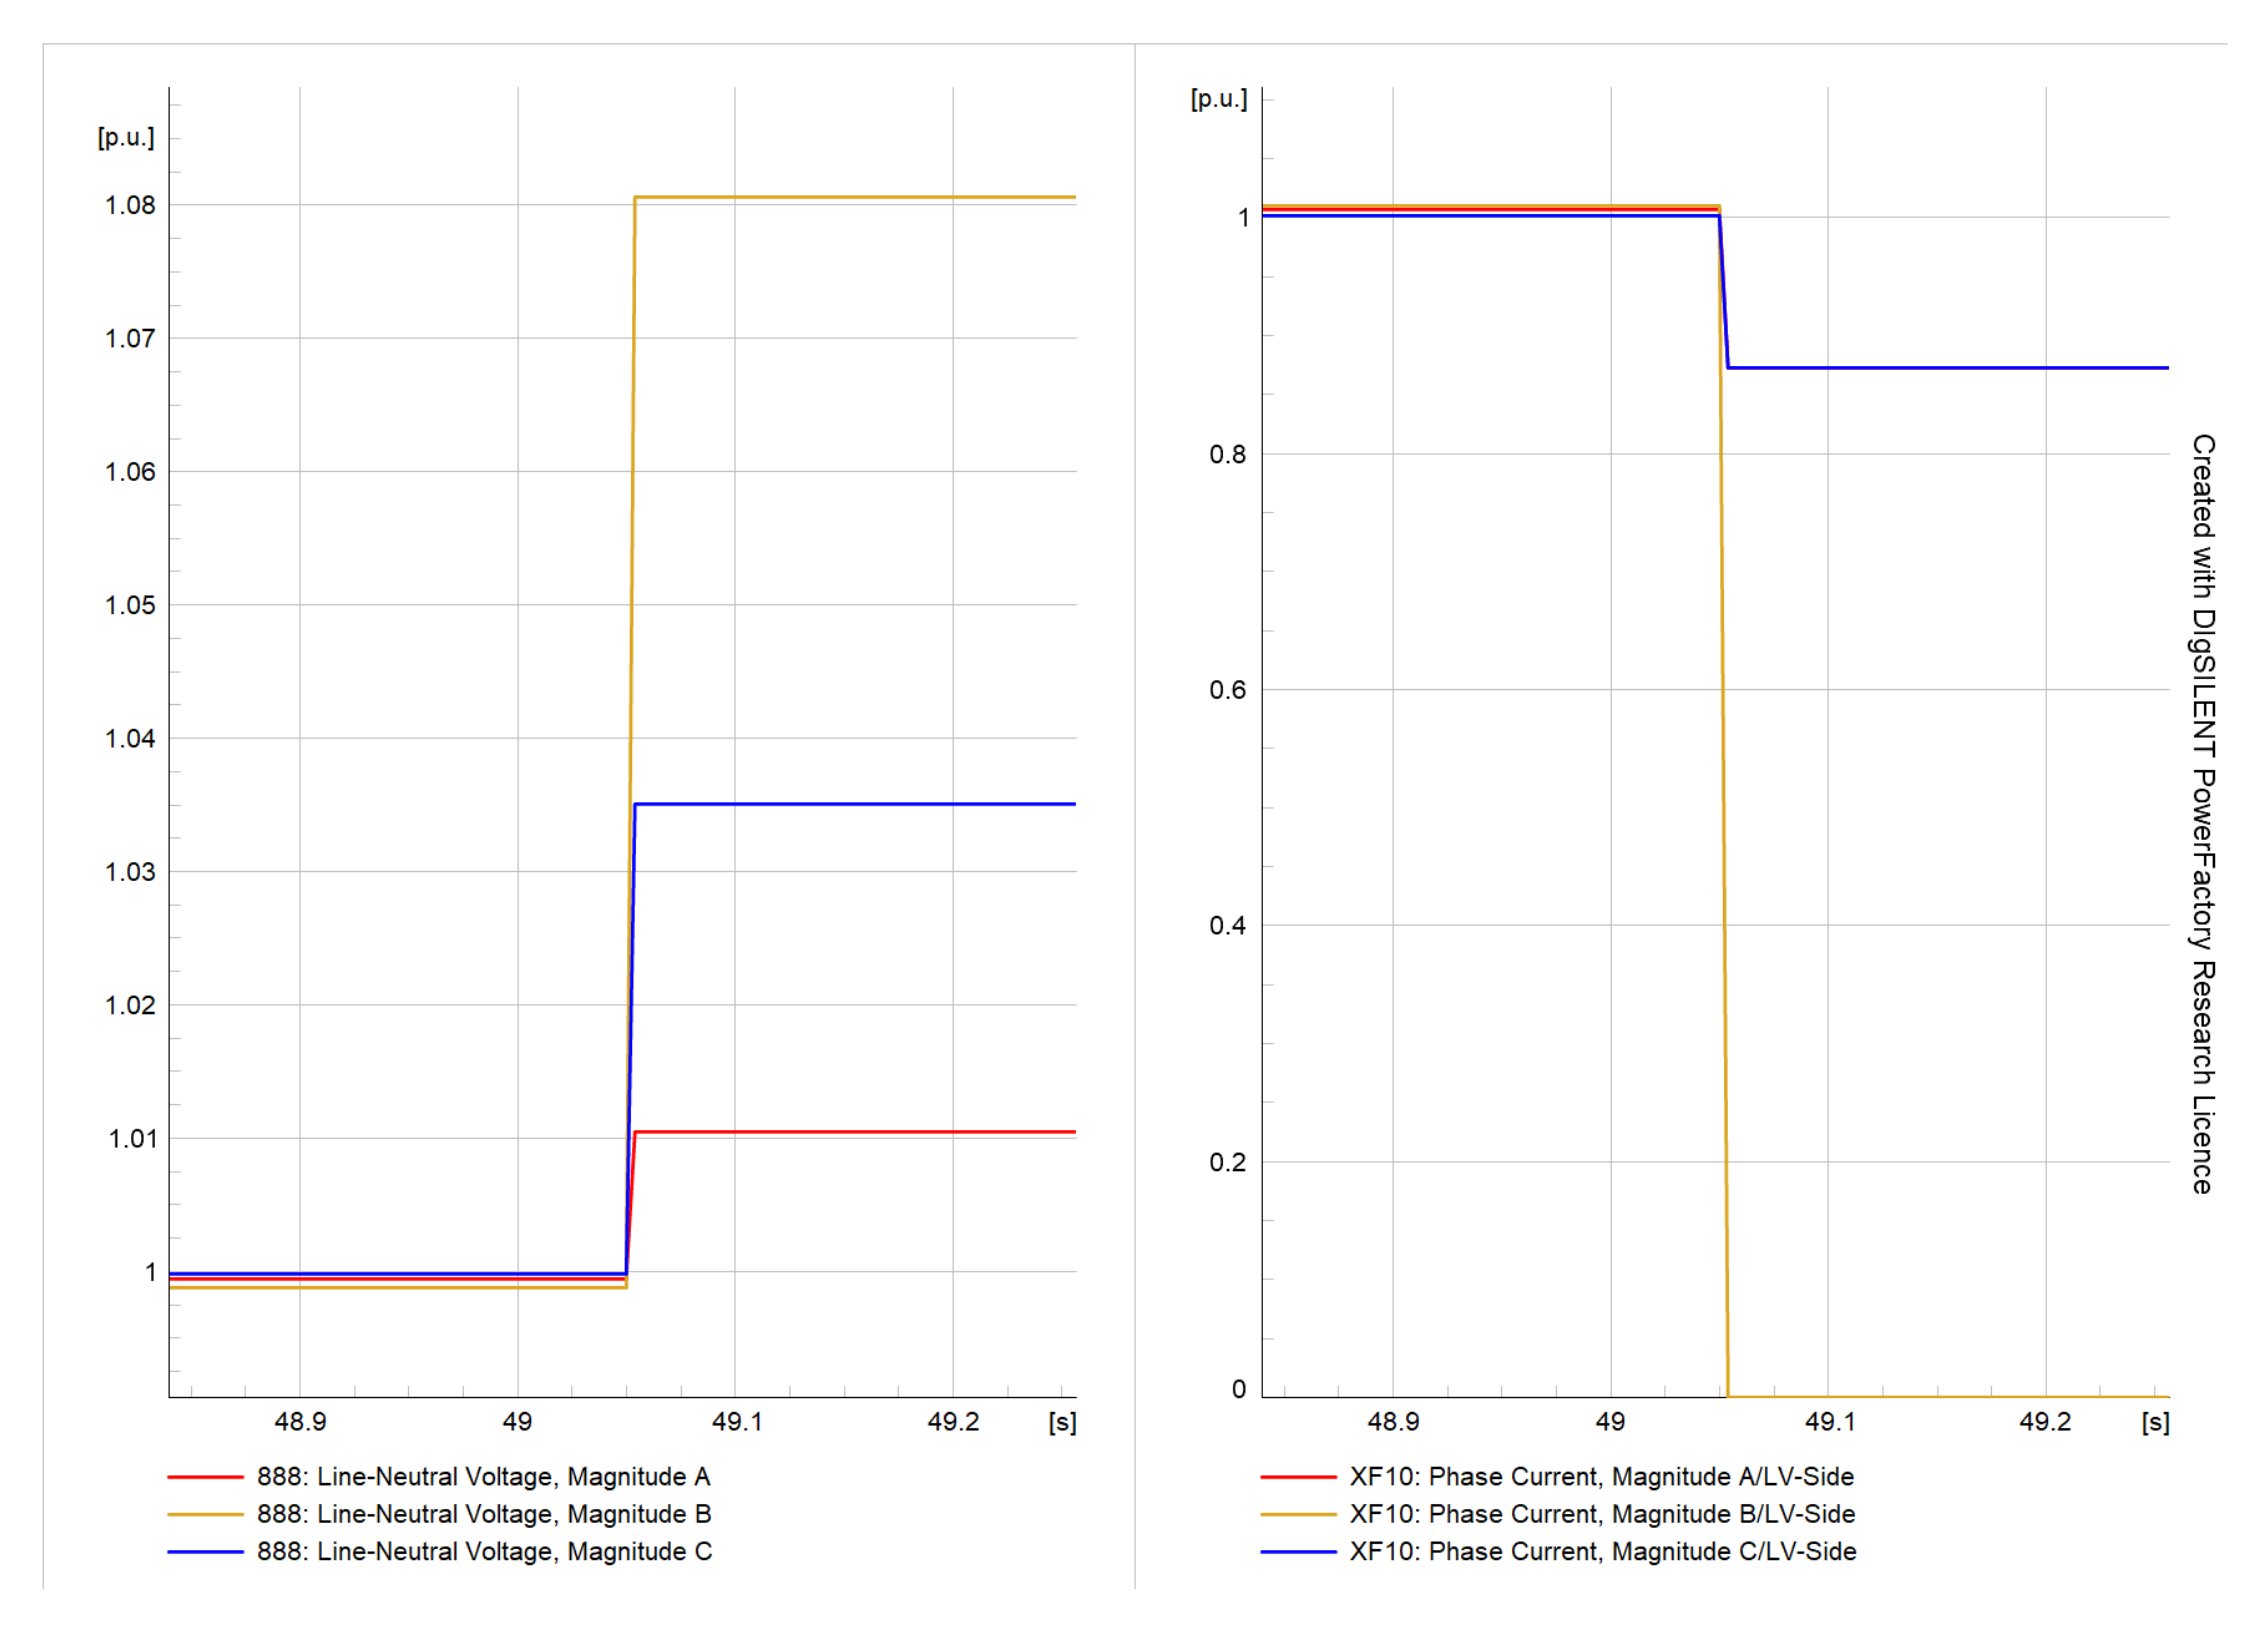
Line voltages drop to zero during main CB tripping occurrences, while line currents drop to zero following a switching spike, depending on the reason of the tripping. In the event of a failure, the voltage on the affected line or lines will drop to zero, while the current will rise to the fault level and remain there until the circuit breaker trips. When the CB closes, the voltage rises from zero to the nominal network voltage, and the current shoots up to the maximum current before settling back to the usual load current value after a few seconds. The results of DG switch-on events show a drop in line voltages and a rise in line currents, but both values return to normal after a few seconds, whereas the DG switch-on event indicates a voltage and current increase in the nearest μPMU and a voltage rise and current drop in the farthest μPMU. Similarly, all the key real-time events in an unbalanced DN selected for this study, along with their impact on the node voltages and line currents from the relevant μPMUs, are observed as listed in Table 8.
The realistic data created for numerous real grid events demonstrate how applicable they are in a wide range of use cases, including real-time μPMU data-based predictive maintenance of key assets (transformers, OHLs, CBs, DGs, etc.). The dynamics reported by μPMUs help with real-time asset health monitoring and aging analysis. Apart from these applications, the data can be further used to conduct offline analytics for network planning, scheduled maintenance, topology modifications, etc.
Table 8. Event category chart and their plots.
Sl. No.Event DescriptionFigure Numbers
1Capacitor Bank SwitchingFigure 3, Figure 4, Figure 5 and Figure 6
2Circuit Breaker TripFigure 7 and Figure 8
3Circuit Breaker SwitchingFigure 9 and Figure 10
4DG SwitchingFigure 11, Figure 12, Figure 13 and Figure 14
5DG TripFigure 15 and Figure 16
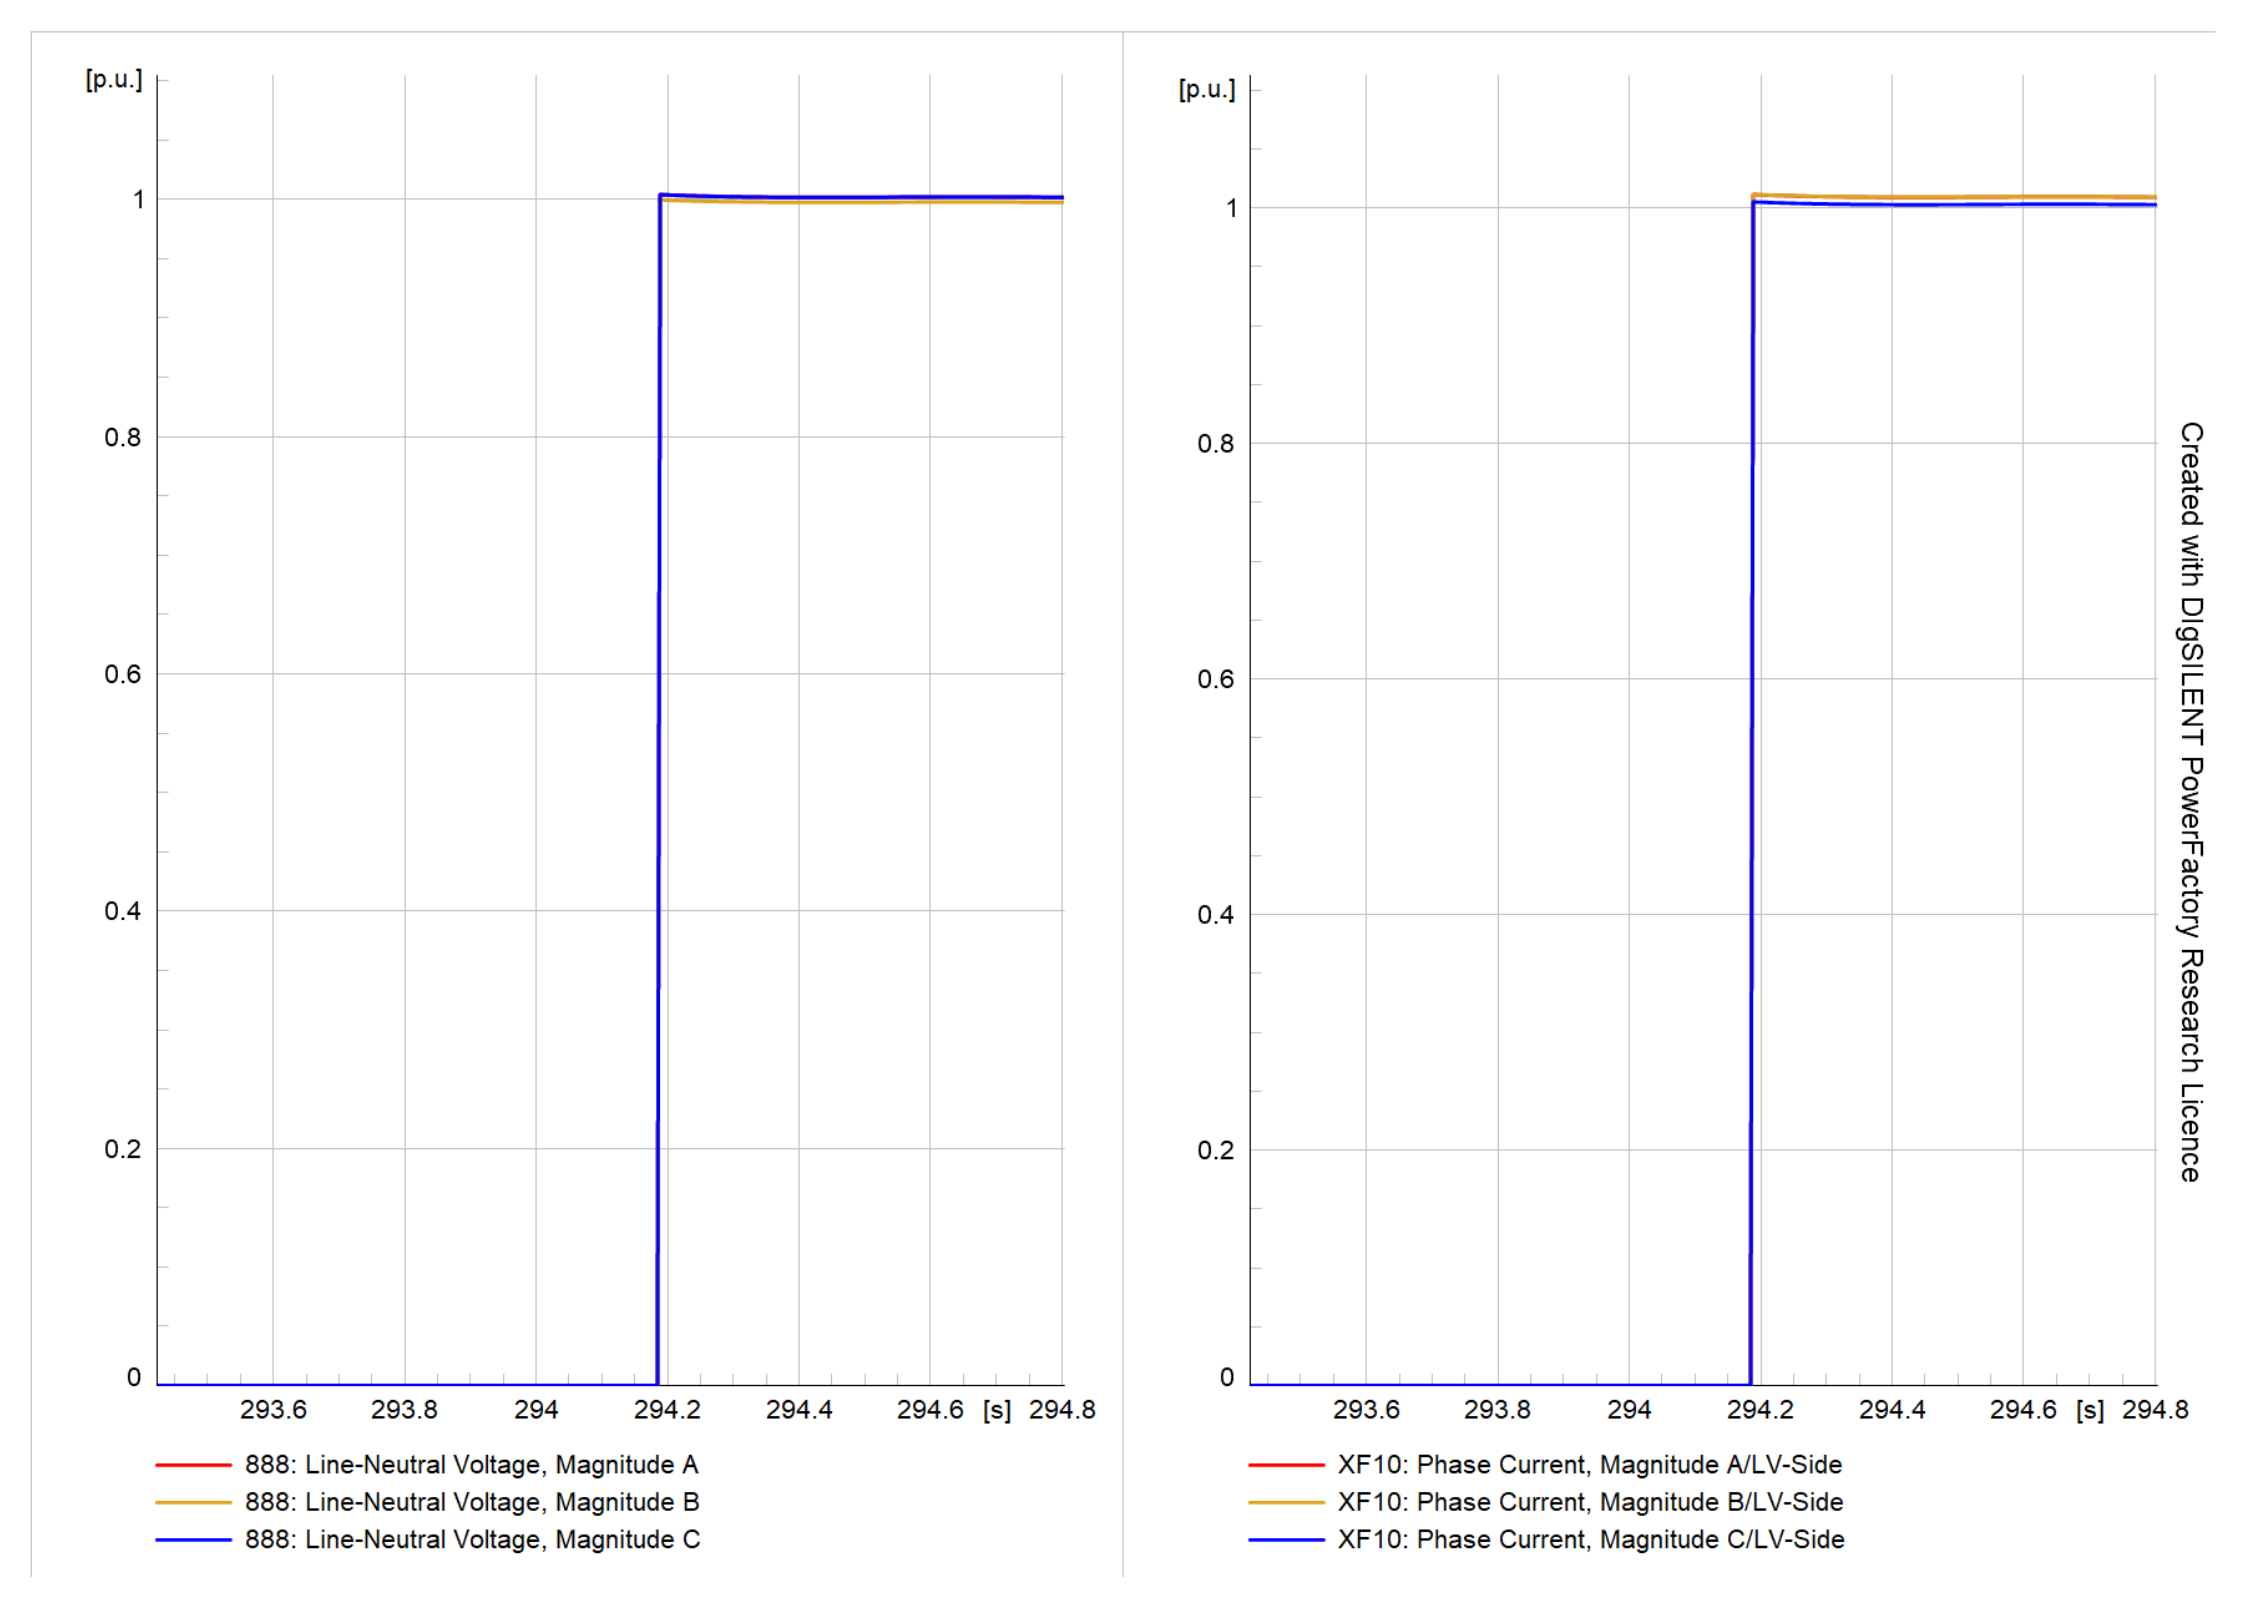
6Line De-energizationFigure 17 and Figure 18
7Line EnergizationFigure 19 and Figure 20
8Load switchingFigure 21, Figure 22, Figure 23 and Figure 24
9Load trip EventFigure 25 and Figure 26
10Open Circuit FaultFigure 27 and Figure 28
11Short Circuit FaultFigure 29 and Figure 30
12Tap ChangerFigure 31, Figure 32, Figure 33 and Figure 34
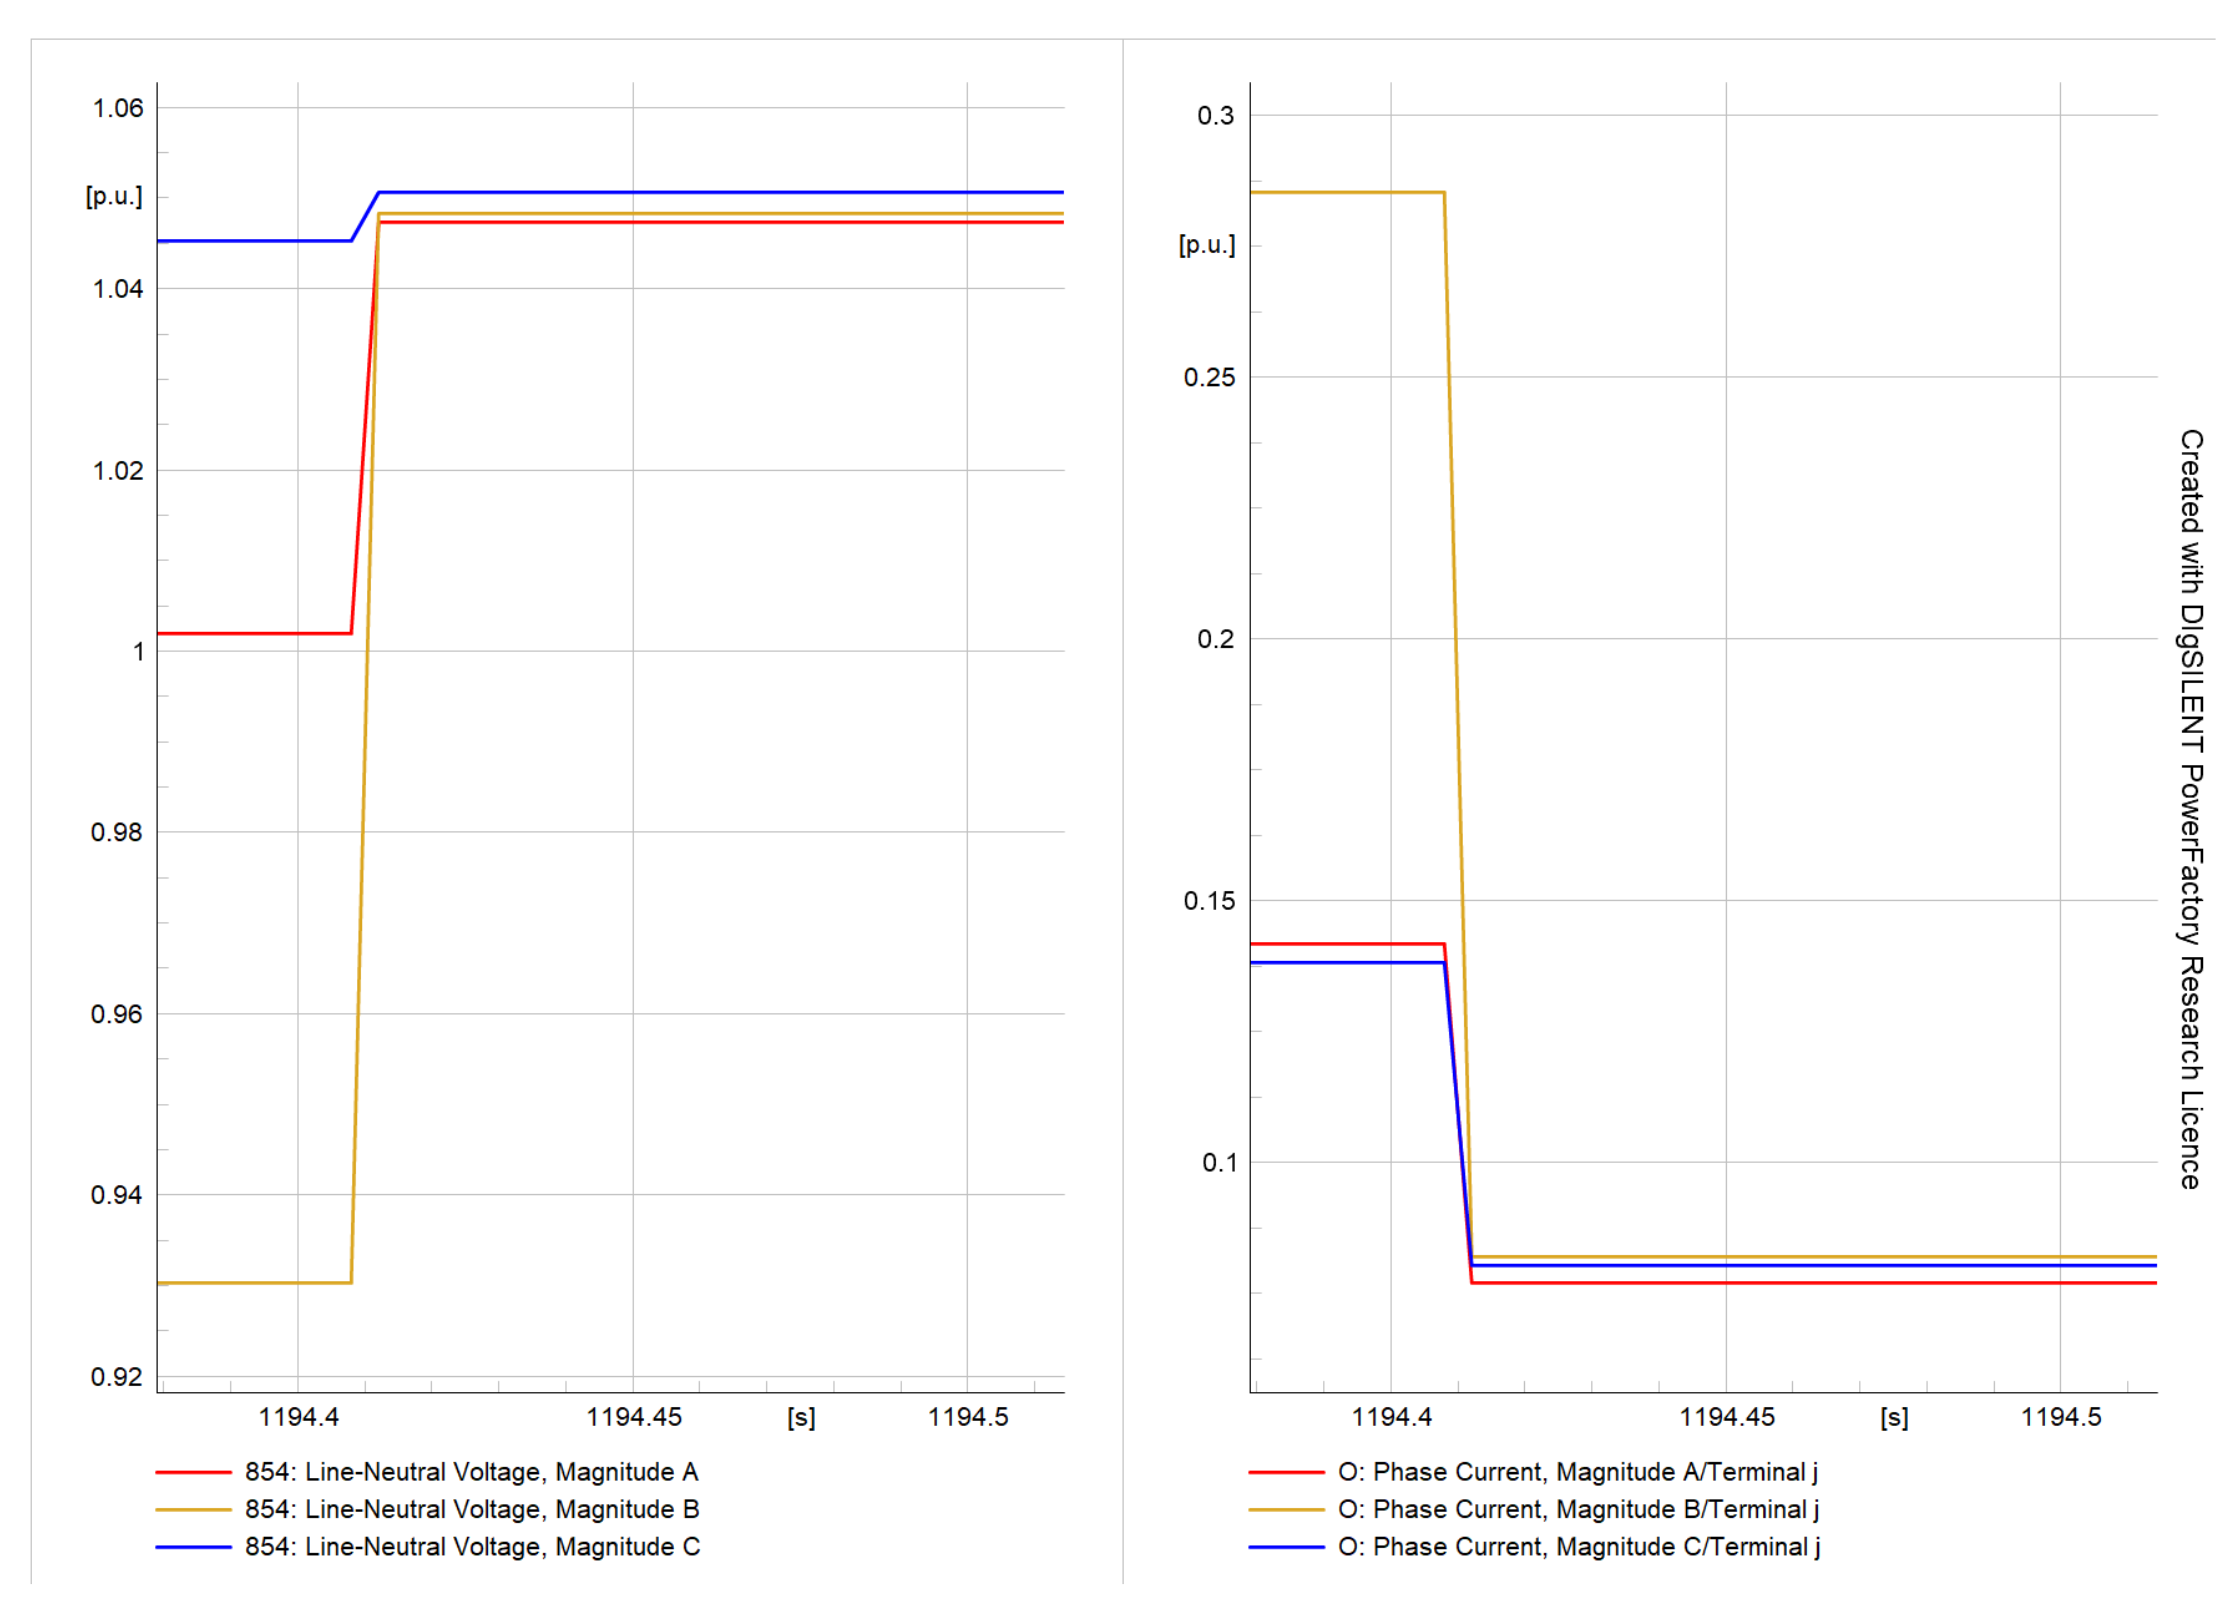
13Temporary FaultFigure 35 and Figure 36
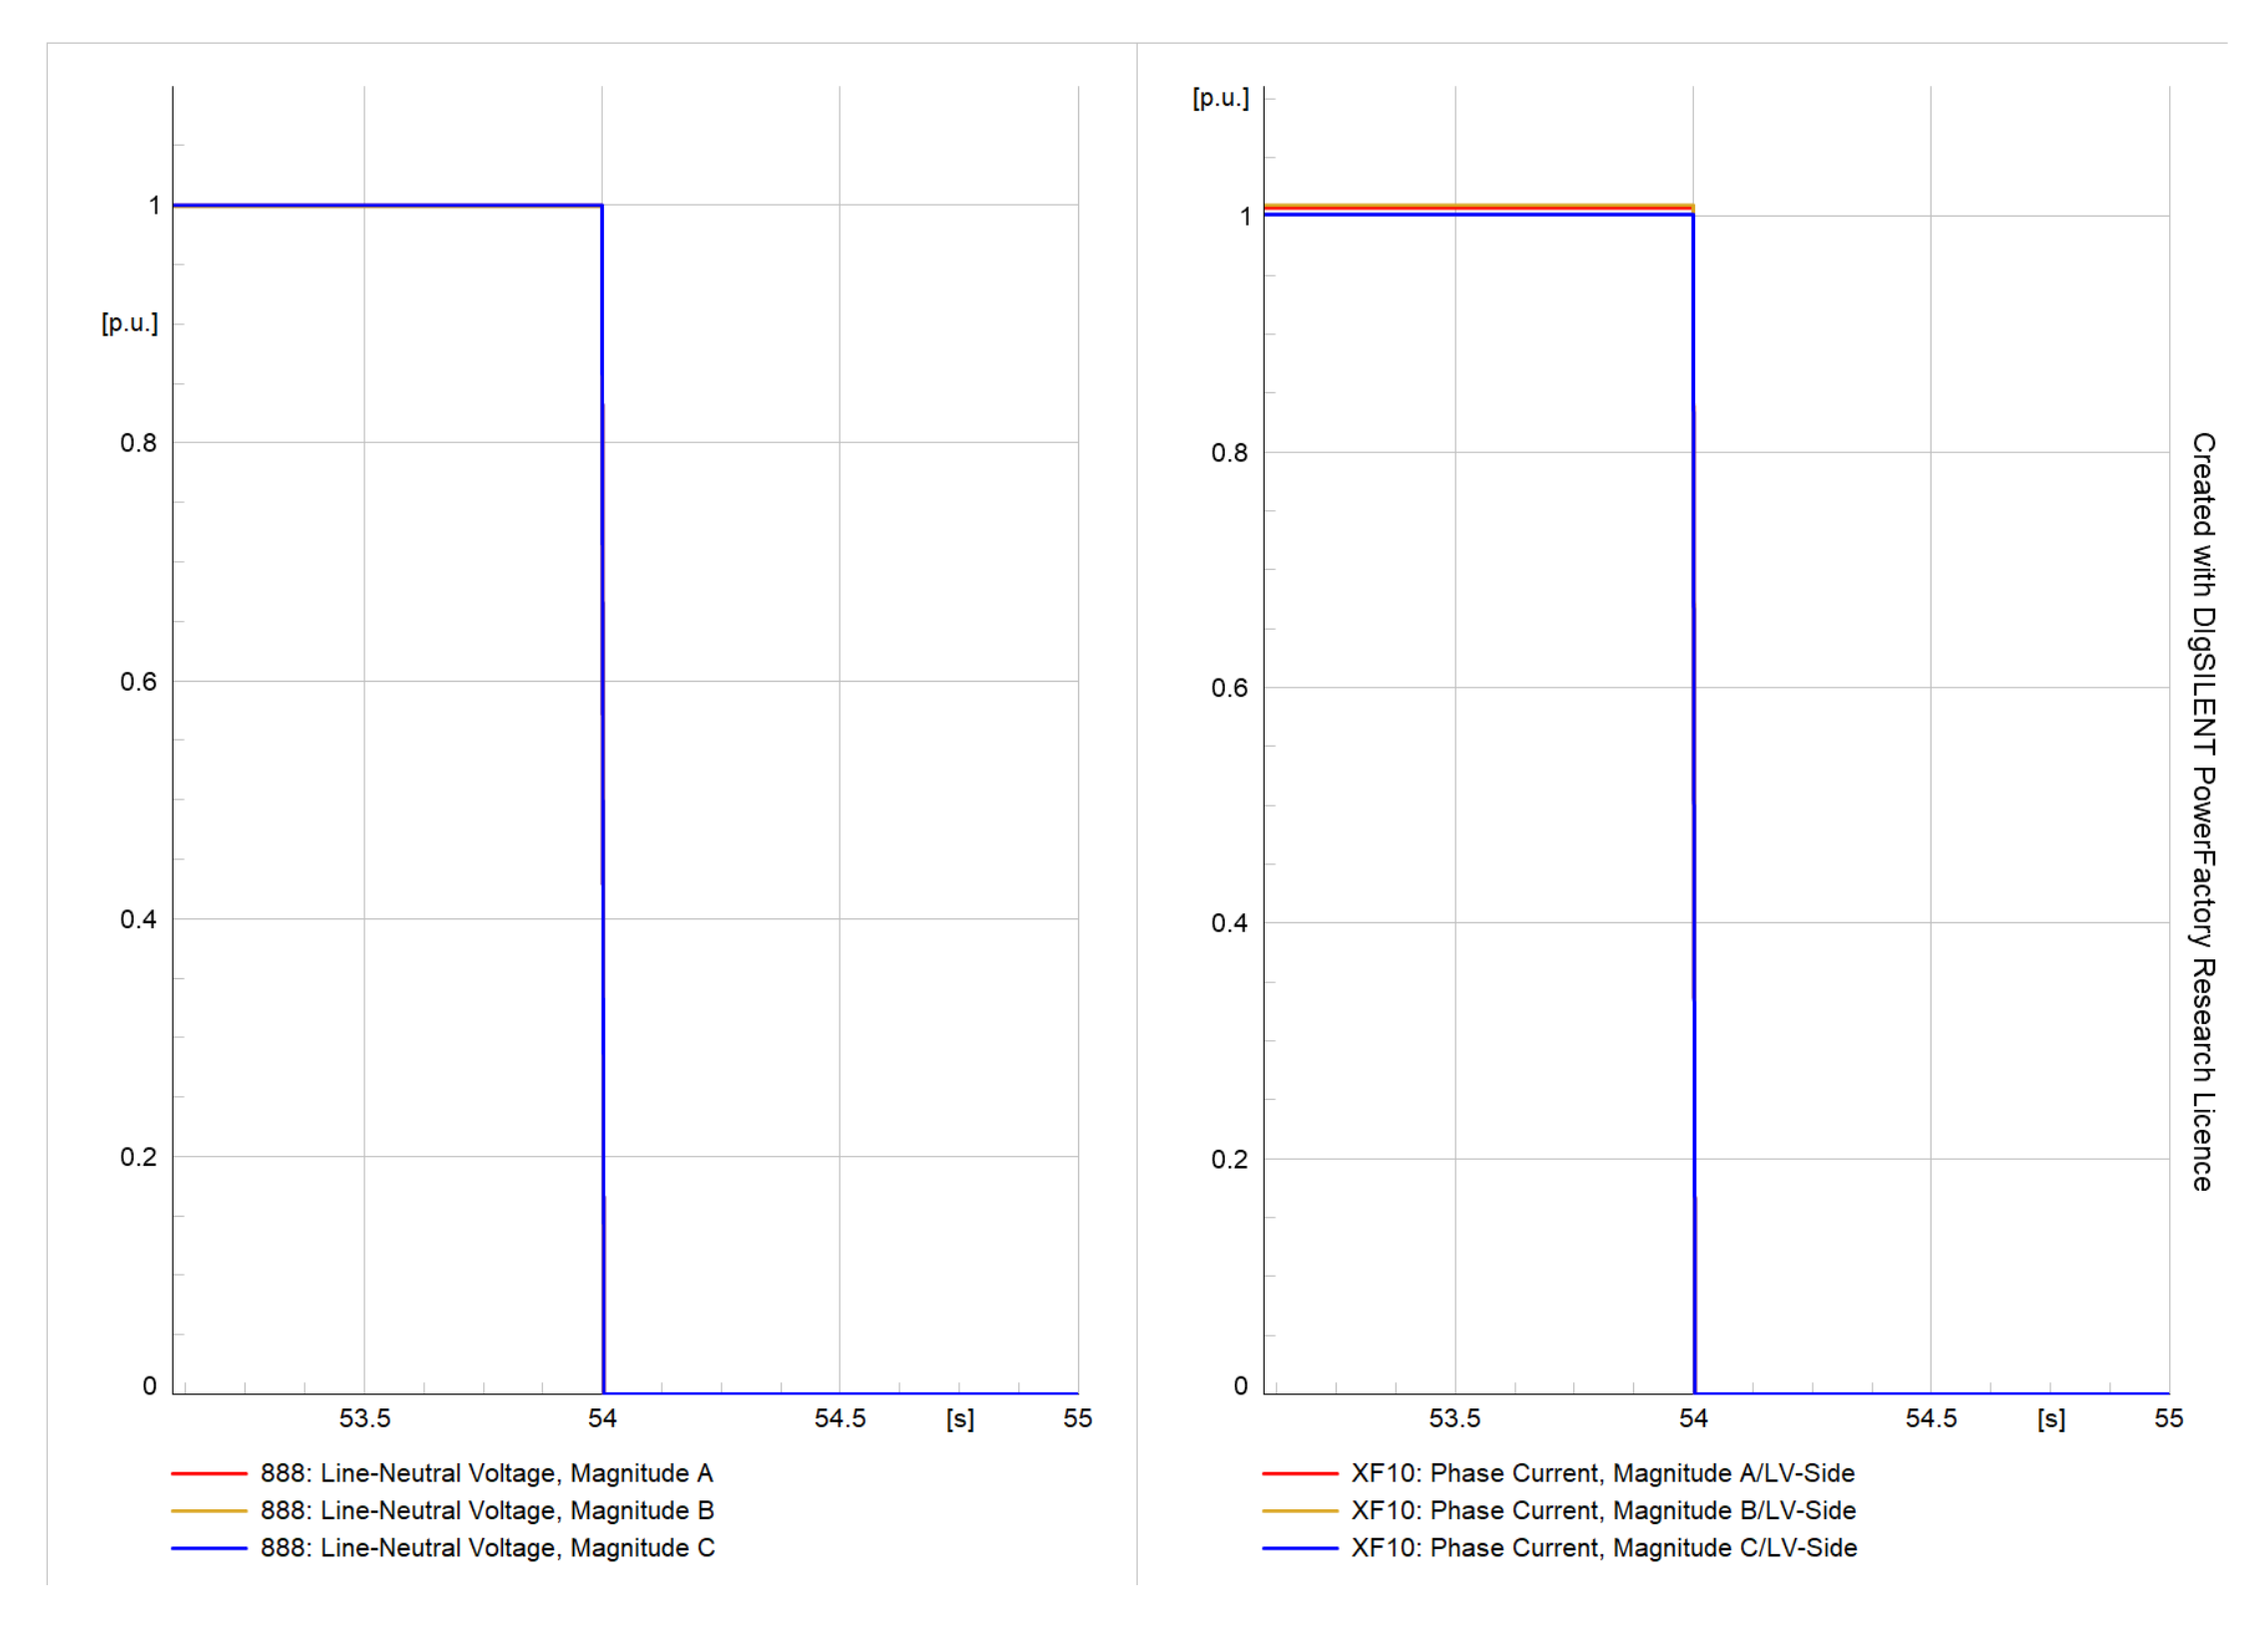
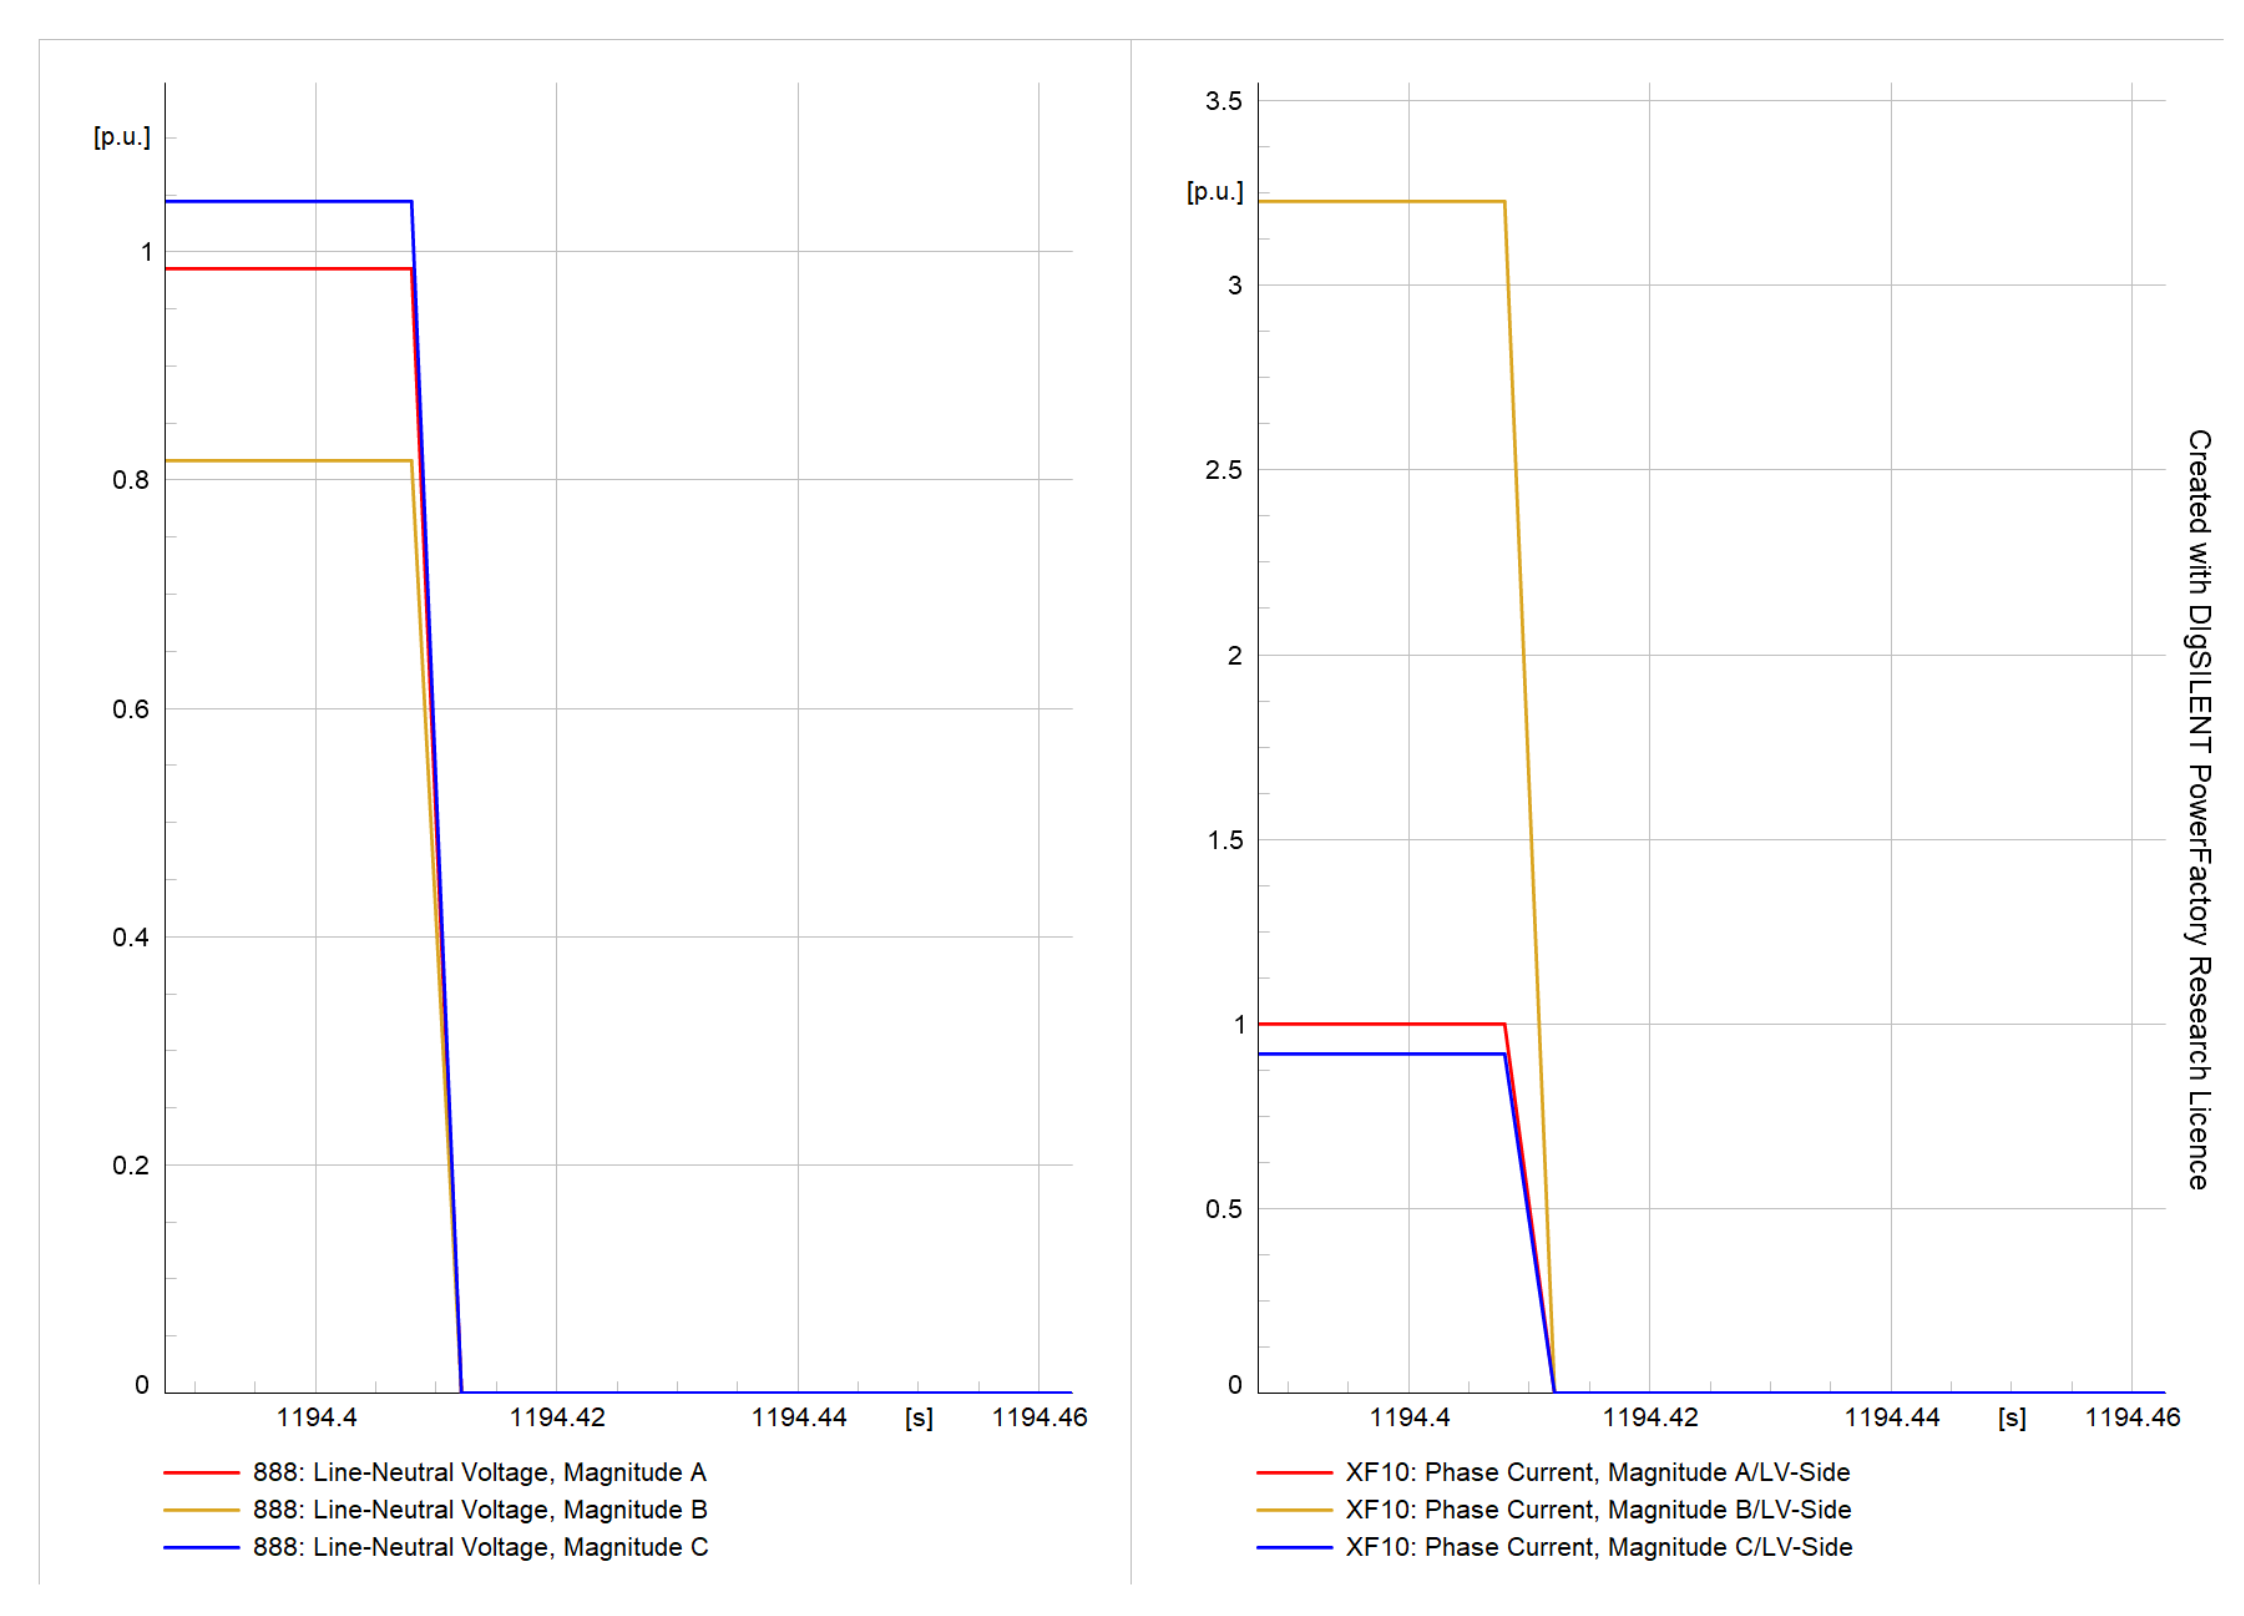
14Transformer OutageFigure 37 and Figure 38
15Transformer EnergizationFigure 39 and Figure 40
16Transformer tripFigure 41 and Figure 42
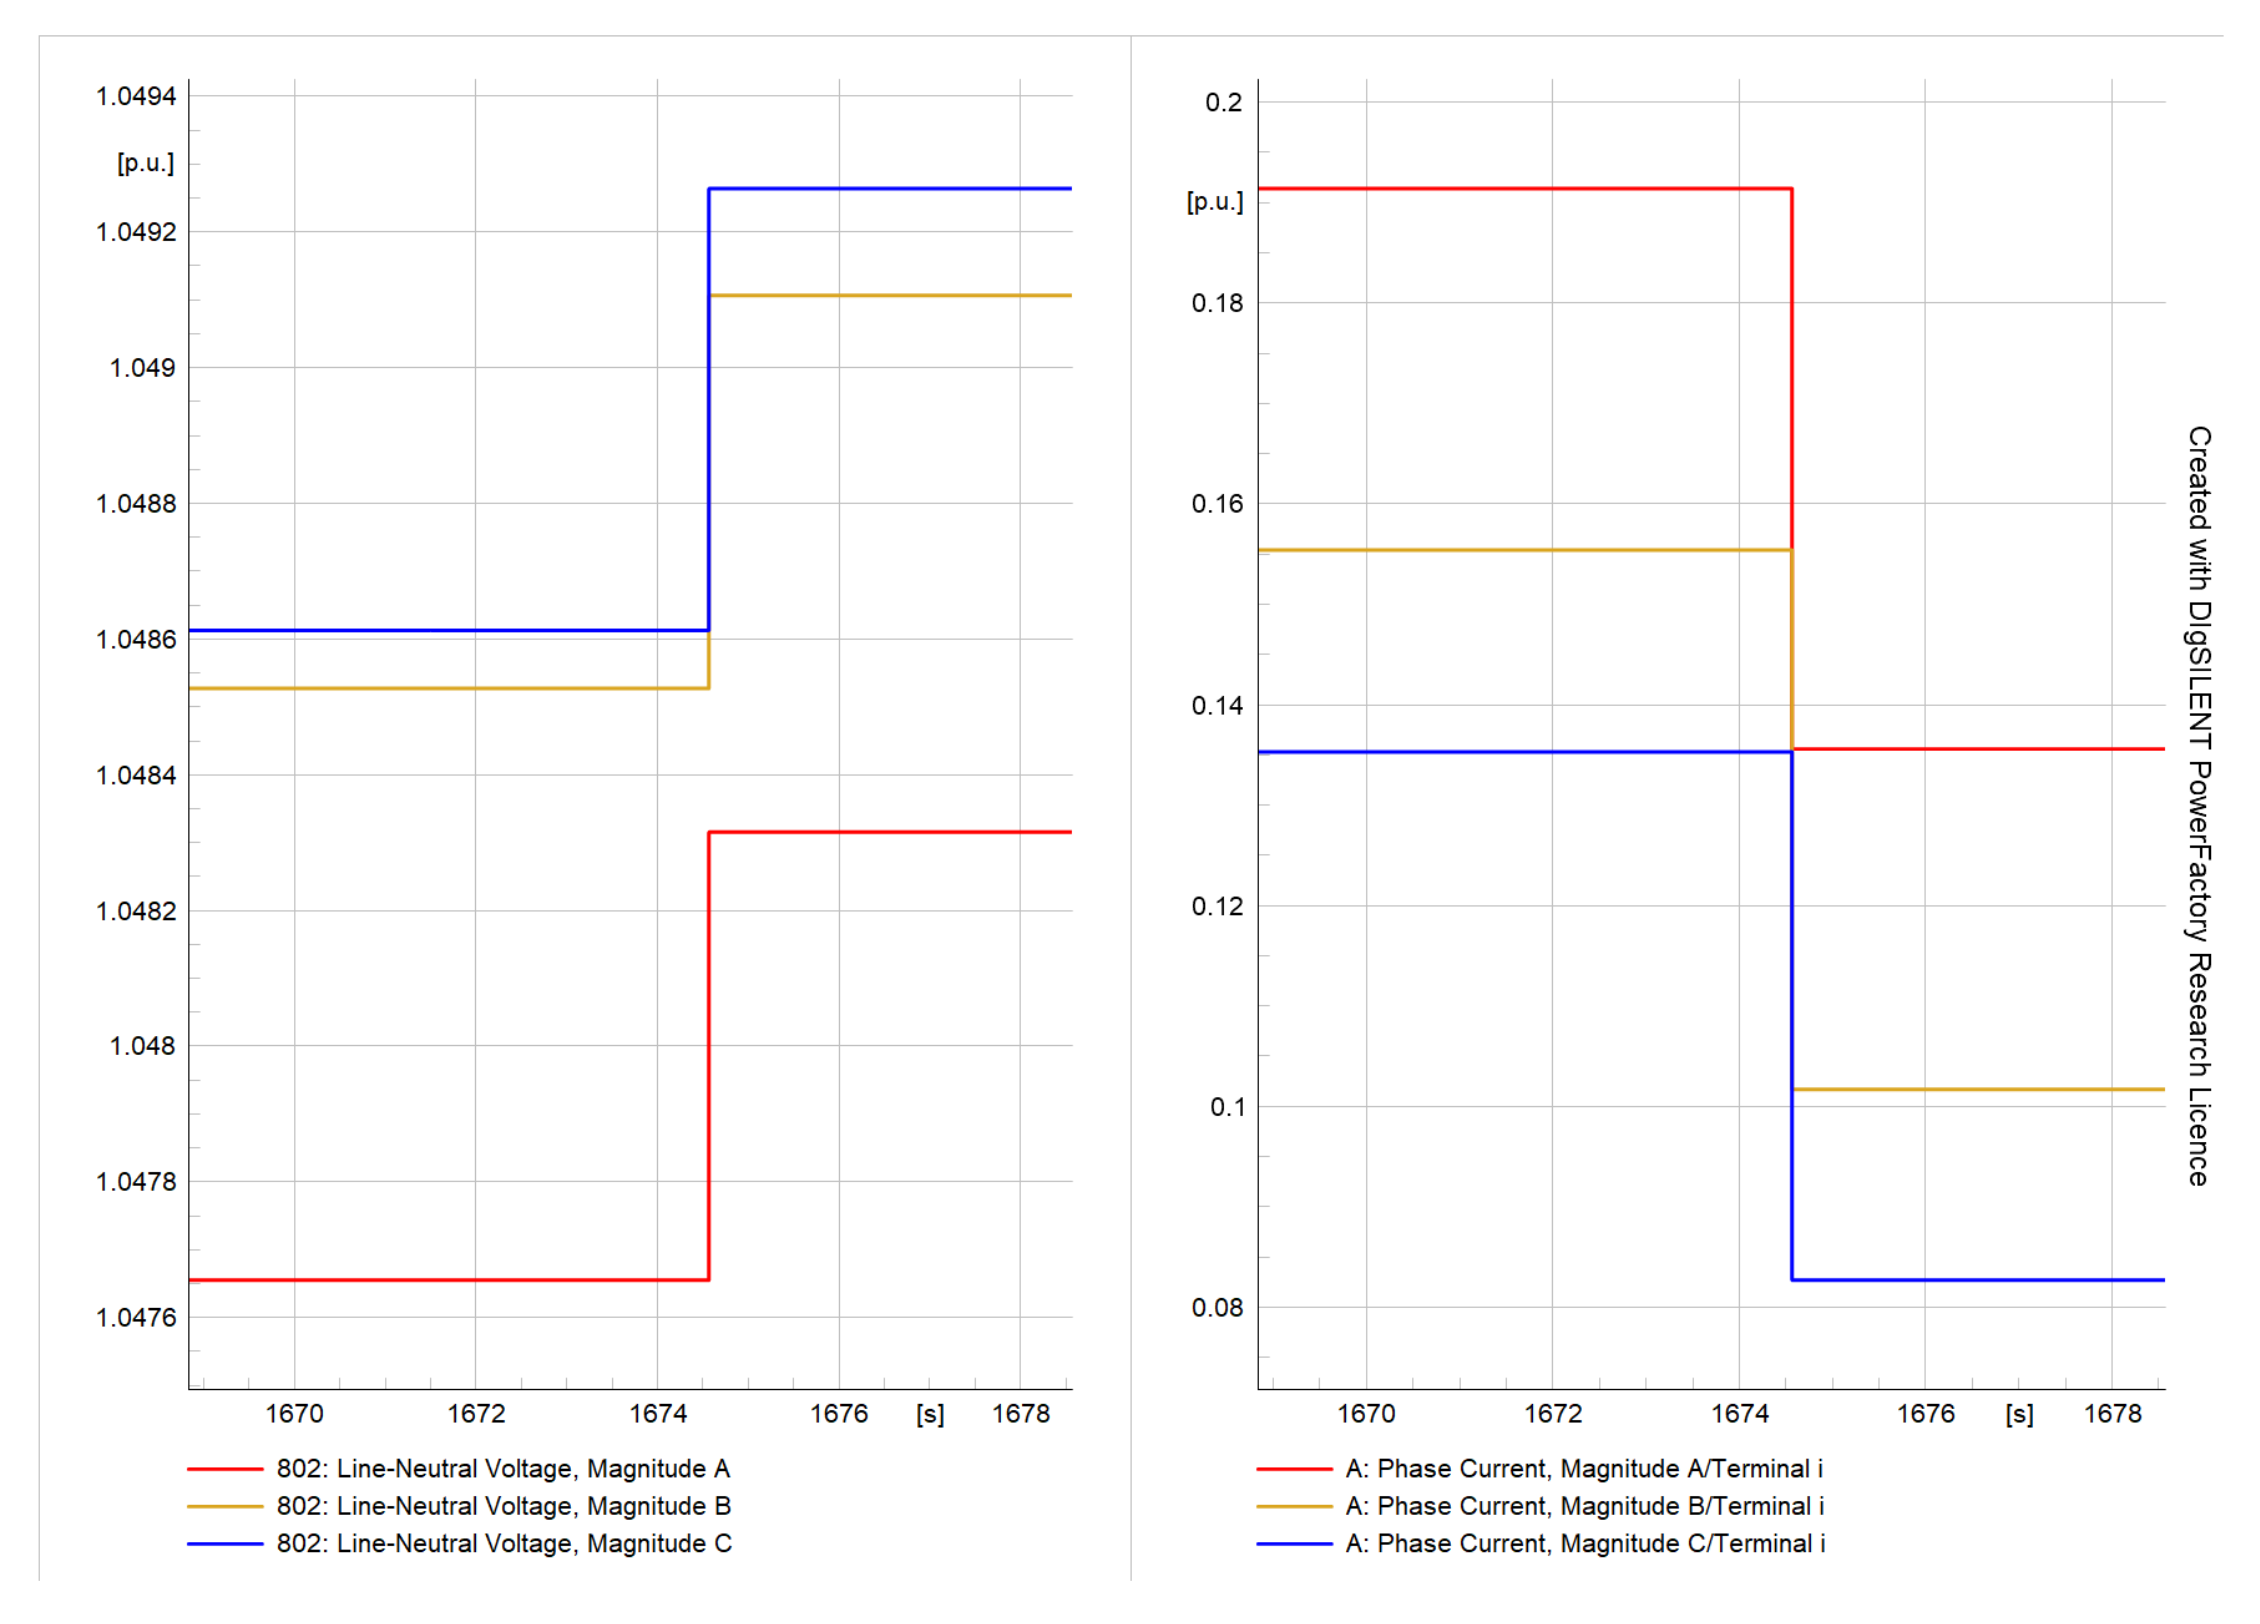
17Off Supply ComplaintFigure 43 and Figure 44
18Unbalance Voltage ComplaintFigure 45 and Figure 46
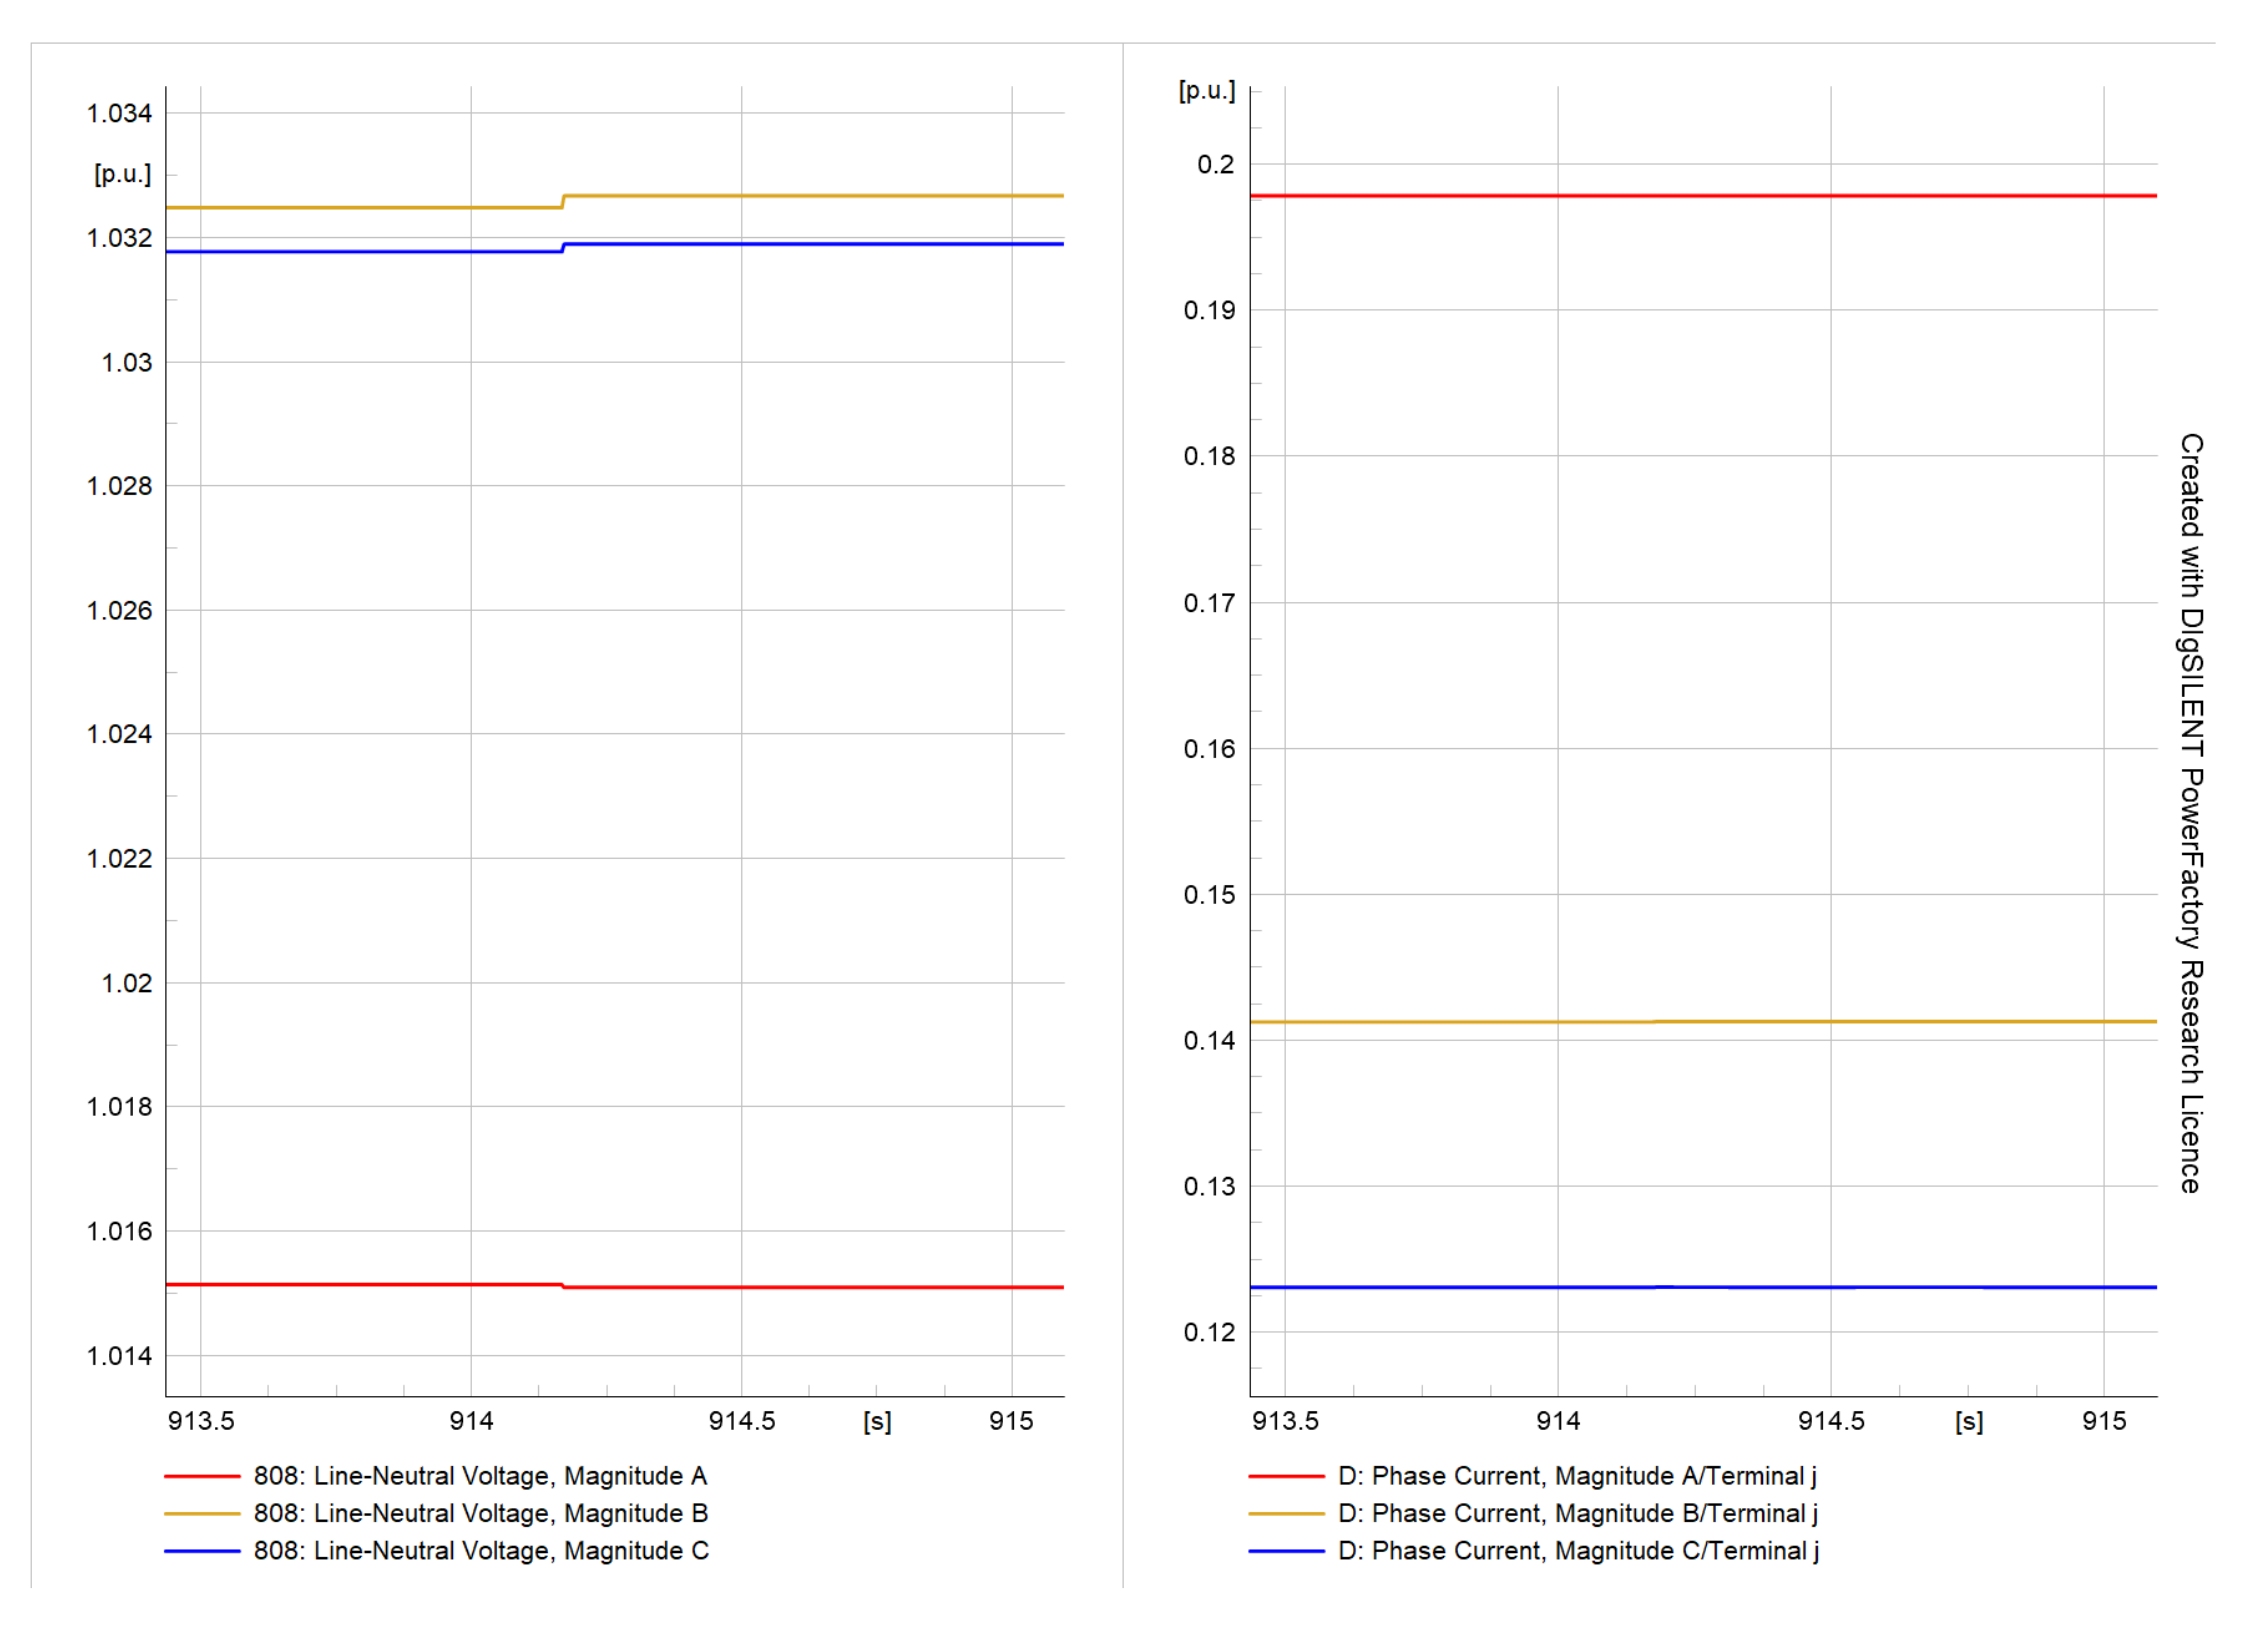
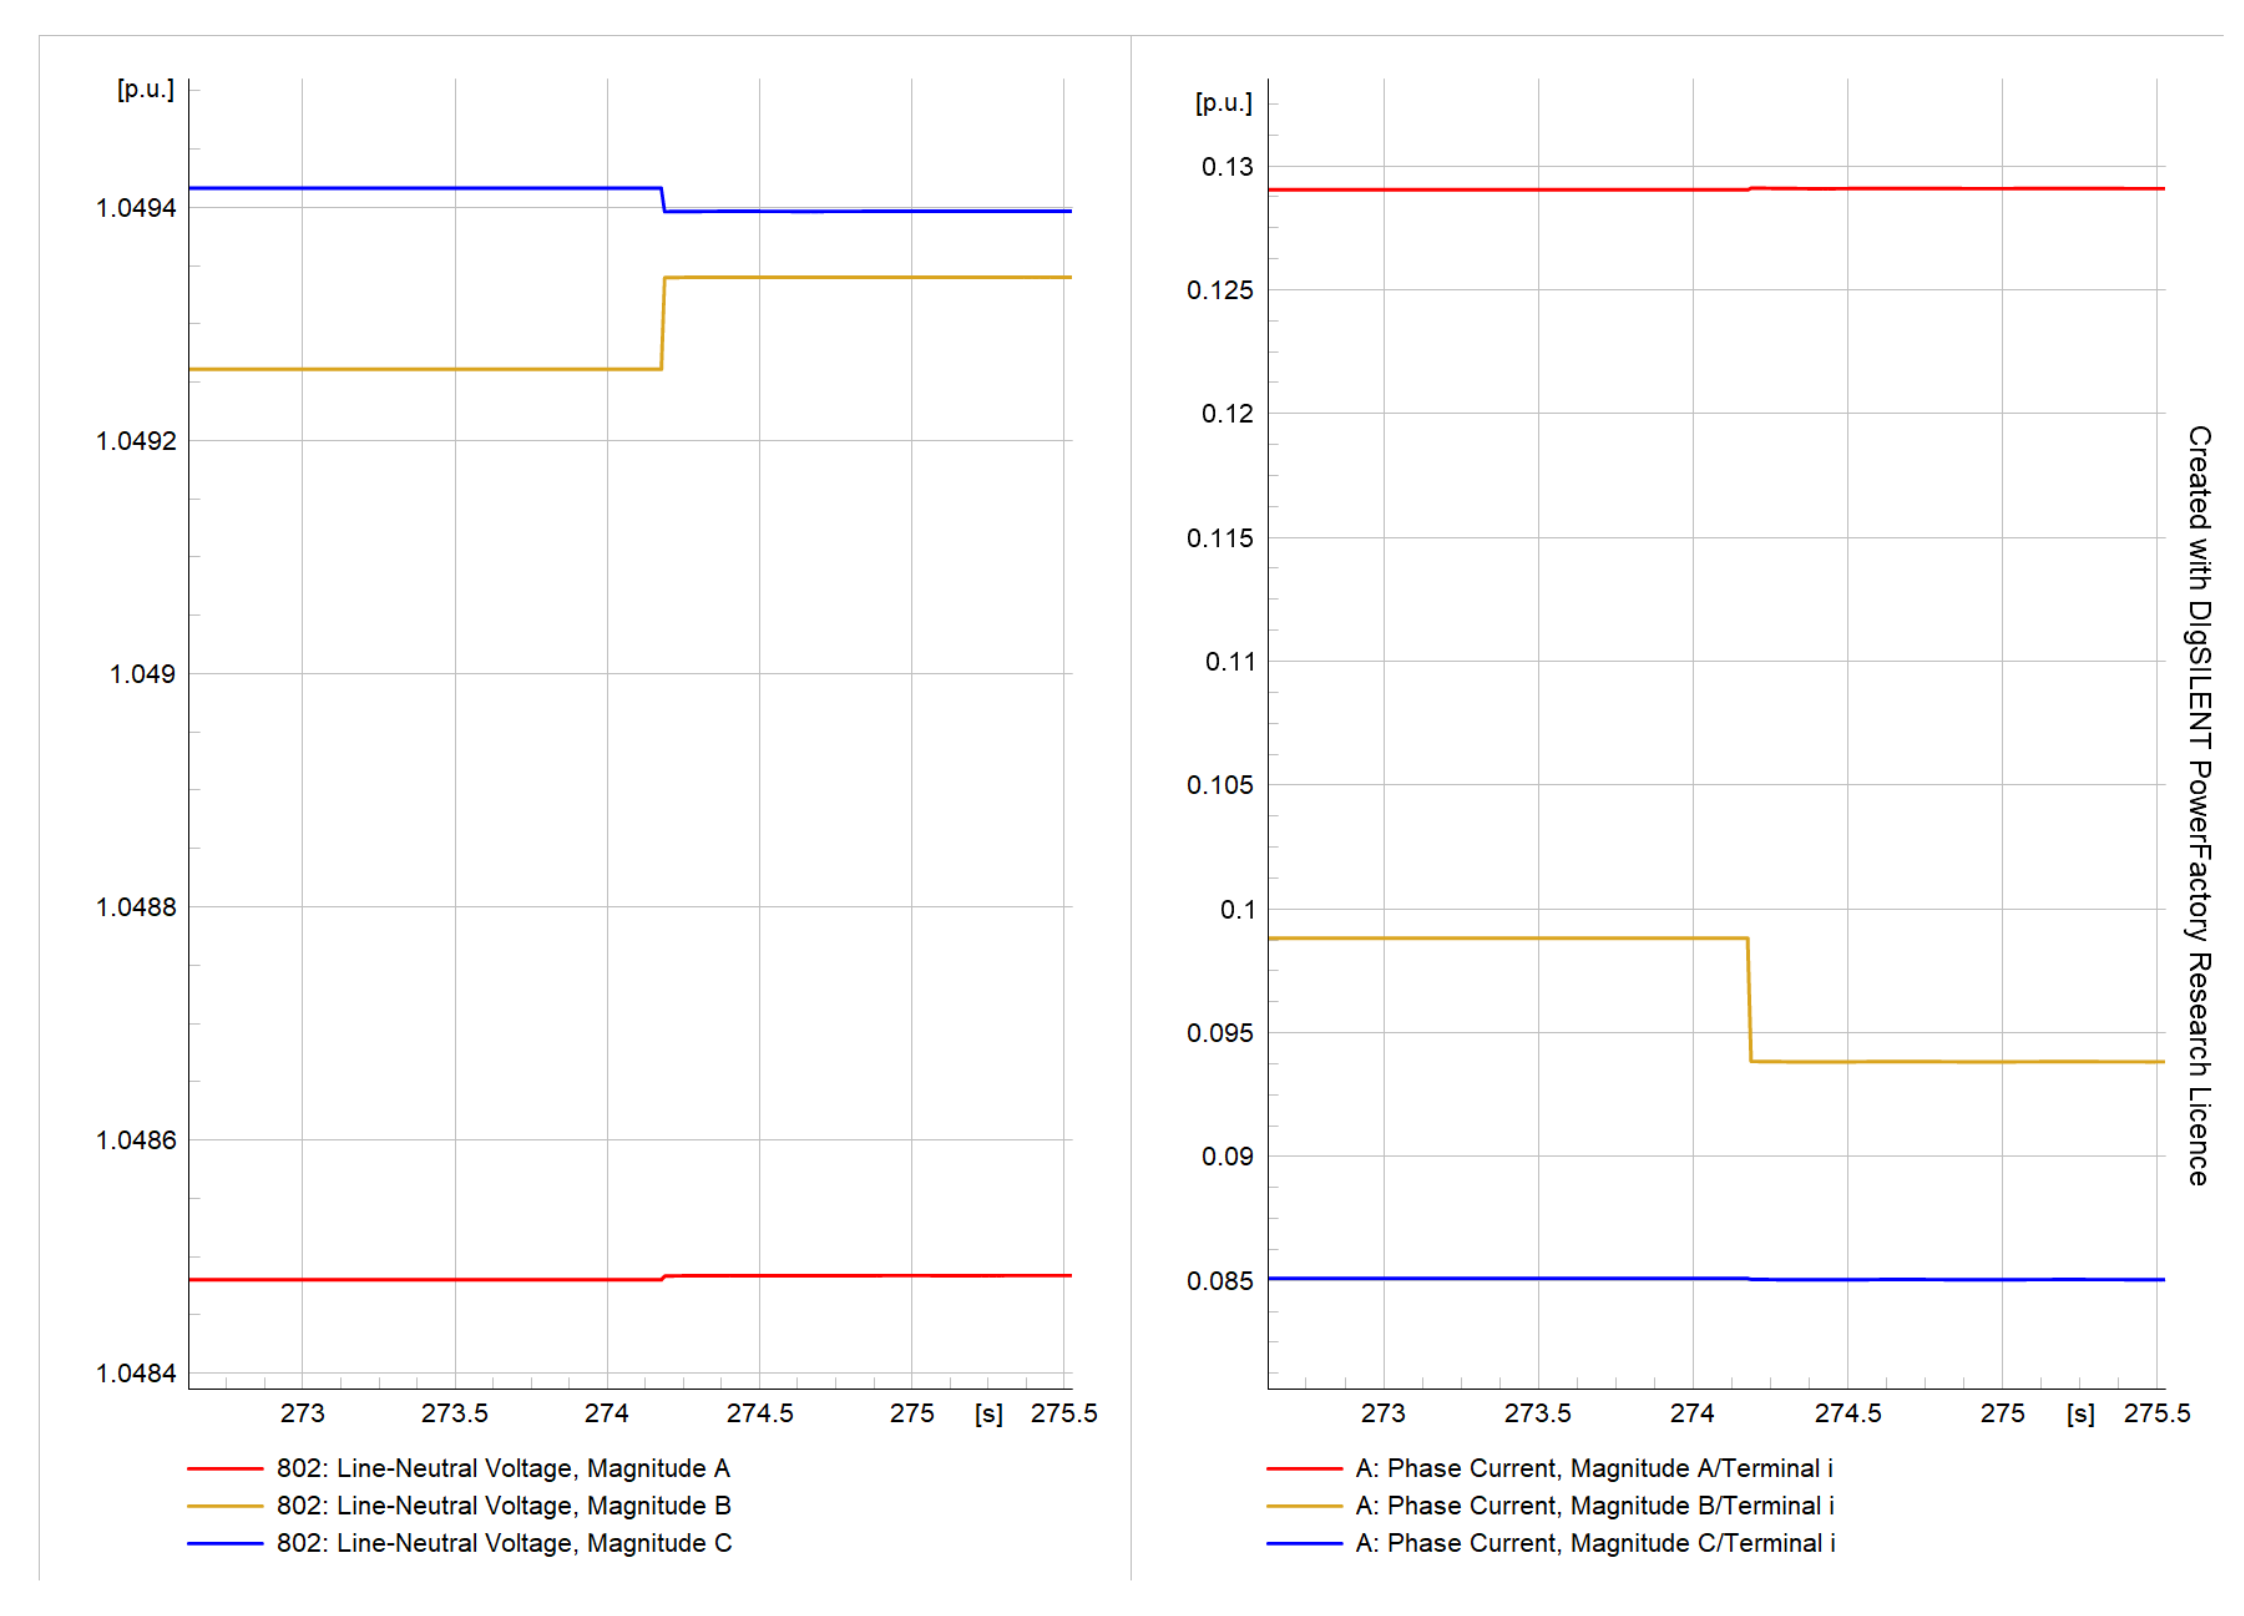
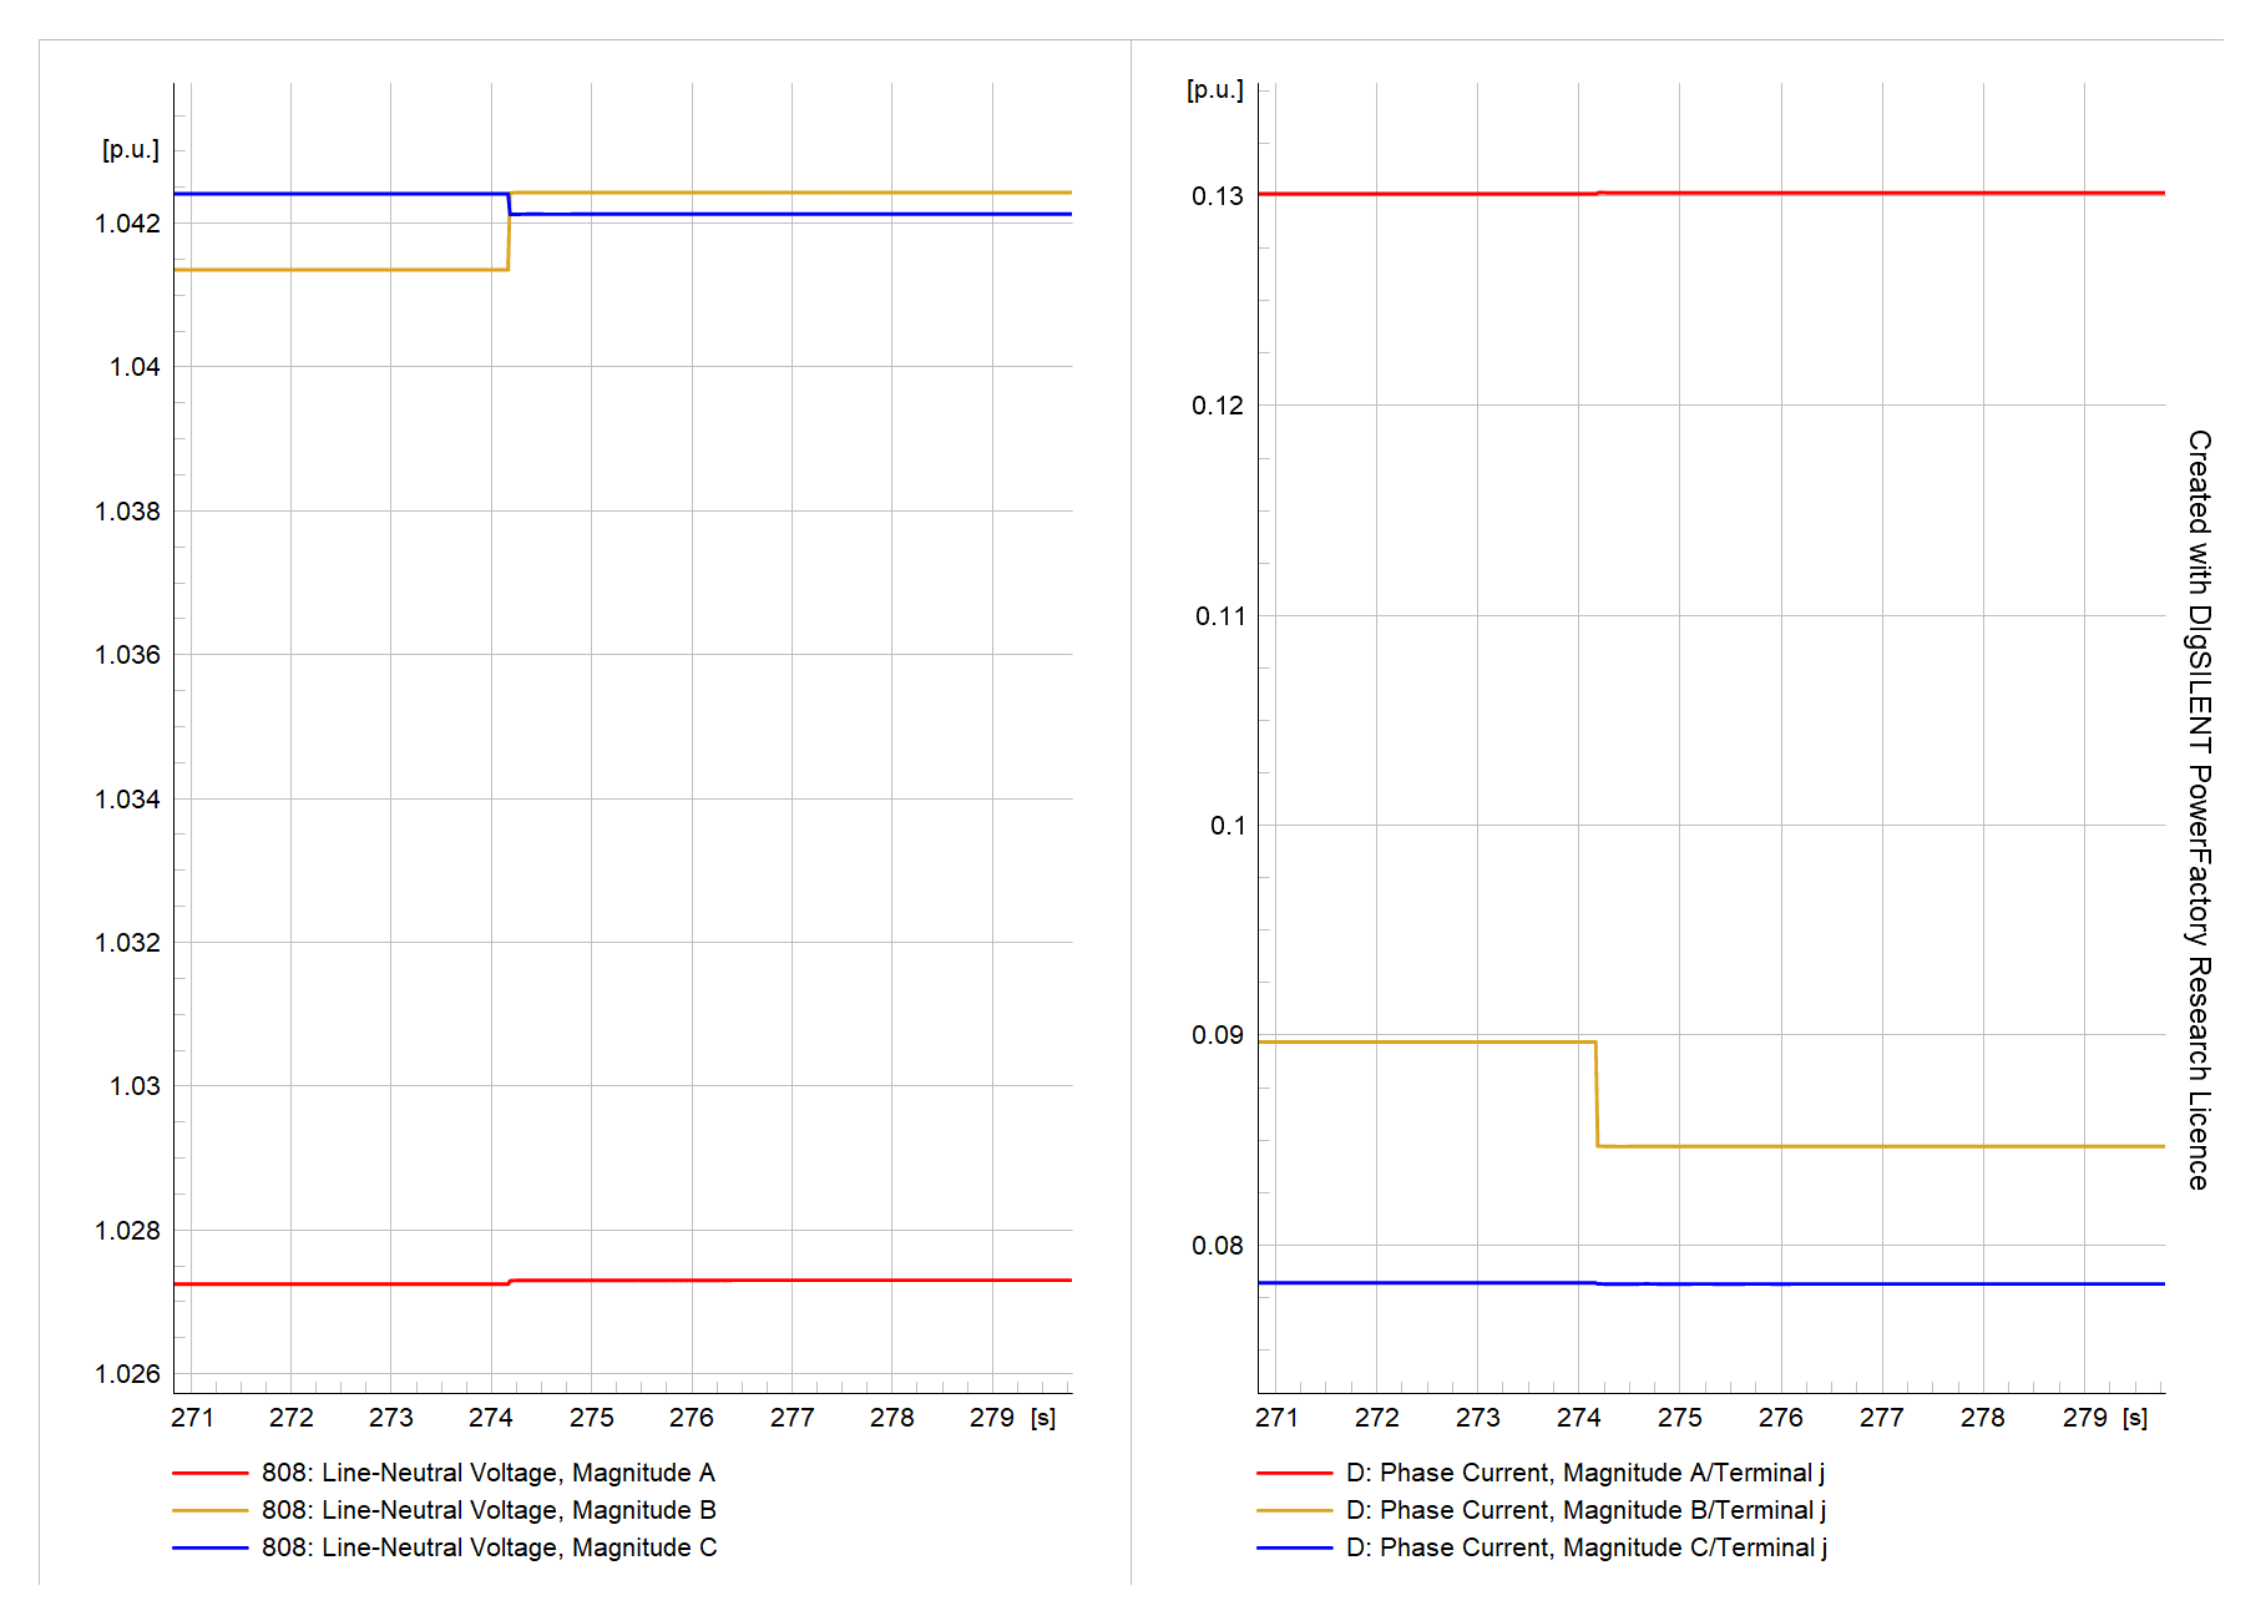
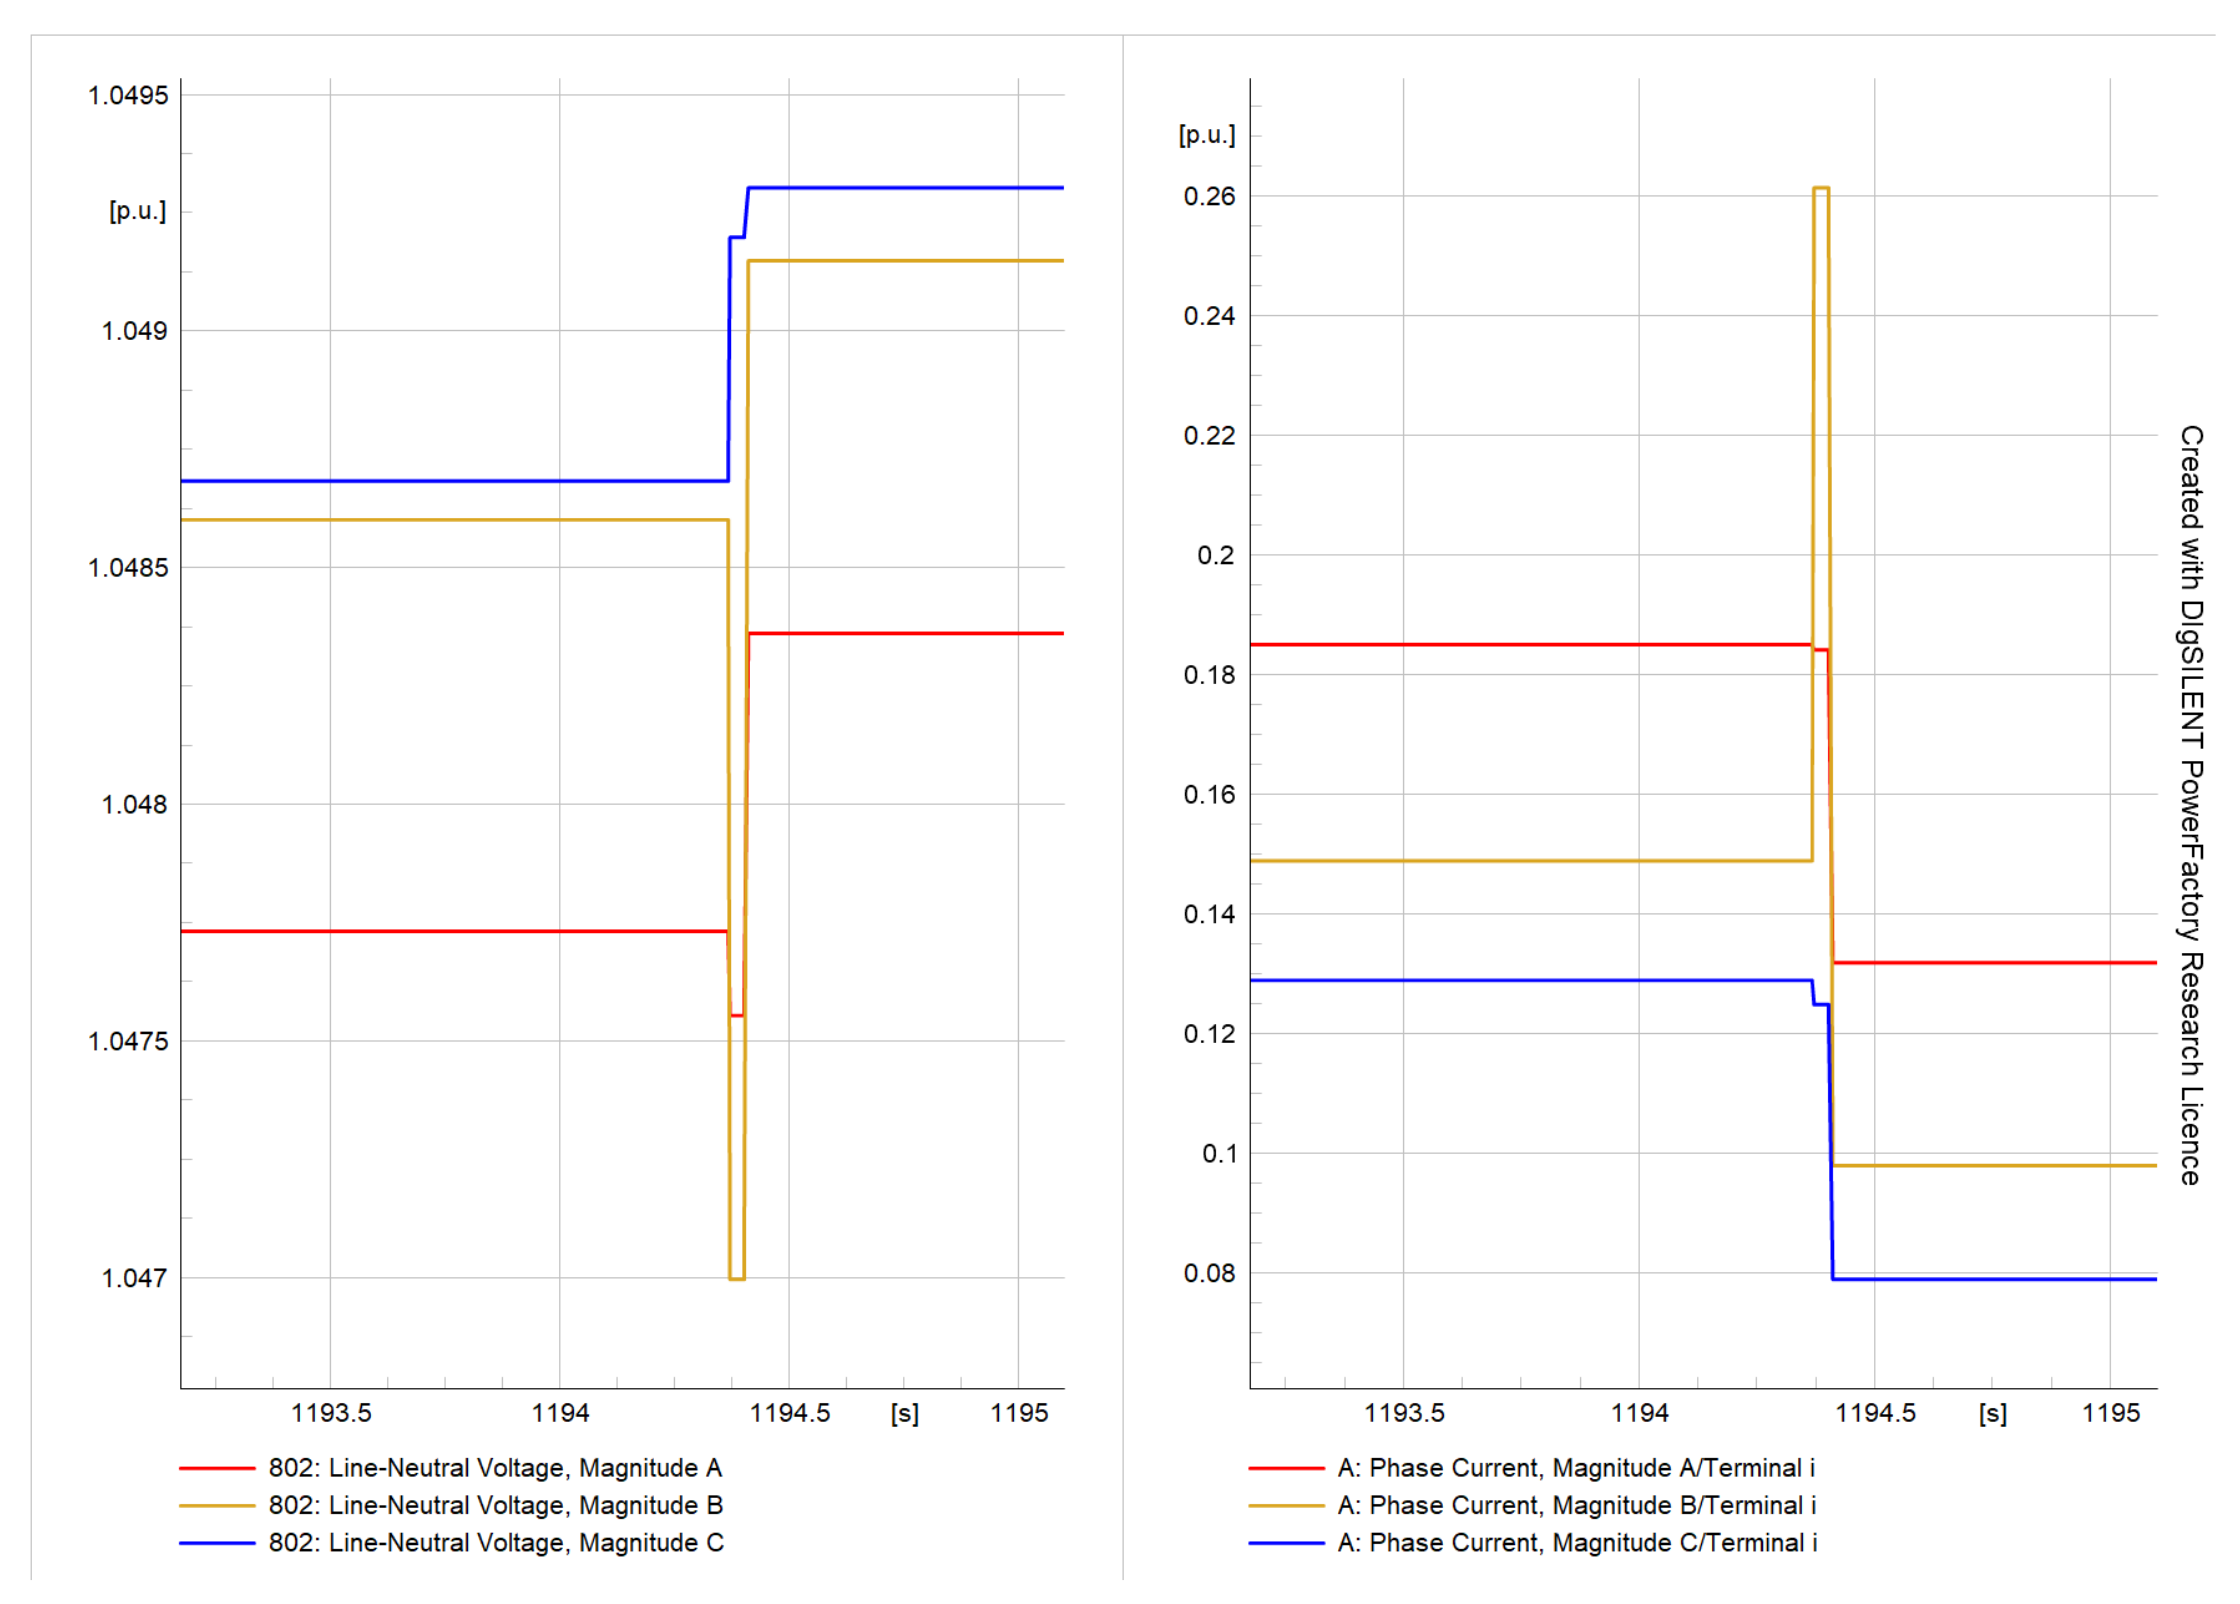
Figure 3. Capacitor bank switch-off event (μPMU7).
Energies 16 03842 g003
Figure 4. Capacitor bank switch-off event (μPMU11).
Energies 16 03842 g004
Figure 5. Capacitor bank switch-on event (μPMU7).
Energies 16 03842 g005
Figure 6. Capacitor bank switch-on event (μPMU11).
Energies 16 03842 g006
Figure 7. CB trip event (μPMU1).
Energies 16 03842 g007
Figure 8. CB trip event (μPMU2).
Energies 16 03842 g008
Figure 9. CB close event (μPMU1).
Energies 16 03842 g009
Figure 10. CB close event (μPMU2).
Energies 16 03842 g010
Figure 11. DG switch-on event (μPMU11).
Energies 16 03842 g011
Figure 12. DG switch-on event (μPMU1).
Energies 16 03842 g012
Figure 13. DG switch-off event (μPMU11).
Energies 16 03842 g013
Figure 14. DG switch-off event (μPMU1).
Energies 16 03842 g014
Figure 15. DG trip event (μPMU5).
Energies 16 03842 g015
Figure 16. DG trip event (μPMU6).
Energies 16 03842 g016
Figure 17. Line section de-energization (μPMU1).
Energies 16 03842 g017
Figure 18. Line section de-energization (μPMU2).
Energies 16 03842 g018
Figure 19. Line section energization (μPMU1).
Energies 16 03842 g019
Figure 20. Line section energization (μPMU2).
Energies 16 03842 g020
Figure 21. ABCN load switch-off event (μPMU7).
Energies 16 03842 g021
Figure 22. ABCN load switch-off event (μPMU11).
Energies 16 03842 g022
Figure 23. ABCN load switch-on event (μPMU7).
Energies 16 03842 g023
Figure 24. ABCN load switch-on event (μPMU11).
Energies 16 03842 g024
Figure 25. BCN load trip event (μPMU1).
Energies 16 03842 g025
Figure 26. BCN load Trip Event (μPMU2).
Energies 16 03842 g026
Figure 27. B-N jumper parted open circuit fault (μPMU1).
Energies 16 03842 g027
Figure 28. B-N jumper parted open circuit fault (μPMU2).
Energies 16 03842 g028
Figure 29. BG fault event (μPMU1).
Energies 16 03842 g029
Figure 30. BG fault event (μPMU2).
Energies 16 03842 g030
Figure 31. Tap lowering (μPMU5).
Energies 16 03842 g031
Figure 32. Tap lowering (μPMU6).
Energies 16 03842 g032
Figure 33. Tap Raising (μPMU5).
Energies 16 03842 g033
Figure 34. Tap raising (μPMU6).
Energies 16 03842 g034
Figure 35. Temporary fault and reclosing (μPMU1).
Energies 16 03842 g035
Figure 36. Temporary fault and reclosing (μPMU2).
Energies 16 03842 g036
Figure 37. Transformer outage (μPMU5).
Energies 16 03842 g037
Figure 38. Transformer outage (μPMU10).
Energies 16 03842 g038
Figure 39. Transformer energization (μPMU5).
Energies 16 03842 g039
Figure 40. Transformer energization (μPMU10).
Energies 16 03842 g040
Figure 41. Transformer trip (μPMU5).
Energies 16 03842 g041
Figure 42. Transformer trip (μPMU10).
Energies 16 03842 g042
Figure 43. Off supply complaint (μPMU1).
Energies 16 03842 g043
Figure 44. Off supply complaint (μPMU10).
Energies 16 03842 g044
Figure 45. Unbalance voltage complaint (μPMU5).
Energies 16 03842 g045
Figure 46. Unbalance voltage complaint (μPMU10).
Energies 16 03842 g046

5. Data Validation

Validation of the results obtained for the various real-time events was performed using published real data from the real DN. The generated data are based on a number of planned normal and abnormal events to observe and understand the dynamics created by them, whereas the real-time network data observed by the real μPMUs are capable of capturing all the grid dynamics over time. Because the event characteristics are solely determined by the network’s initial conditions and other inherent characteristics, the validation focuses on the main parameter features of the individual events, such as node voltage and line currents and their variations.
The generated μPMU data for real-time events, such as capacitor bank switching, fault, CB trip, open, reclosing, and DG switching, were validated by comparing them to the published real data. All other events were validated using the load flow variations at the respective nodes, as the real-time data for these events are unavailable in the literature.

5.1. Capacitor Bank Switching

Capacitor-bank-switching events refer to the switching on or off of capacitor banks in power systems. These events can cause transient and voltage disturbances, which can lead to equipment damage or system failure. Therefore, it is important to detect and monitor these events in real time. This can be achieved using a combination of current and voltage sensors equipped with the μPMUs installed in the DN. The sensors measure the current and voltage signals, which are then processed to detect the capacitor-switching events.

5.1.1. Capacitor Bank Switch-Off Event

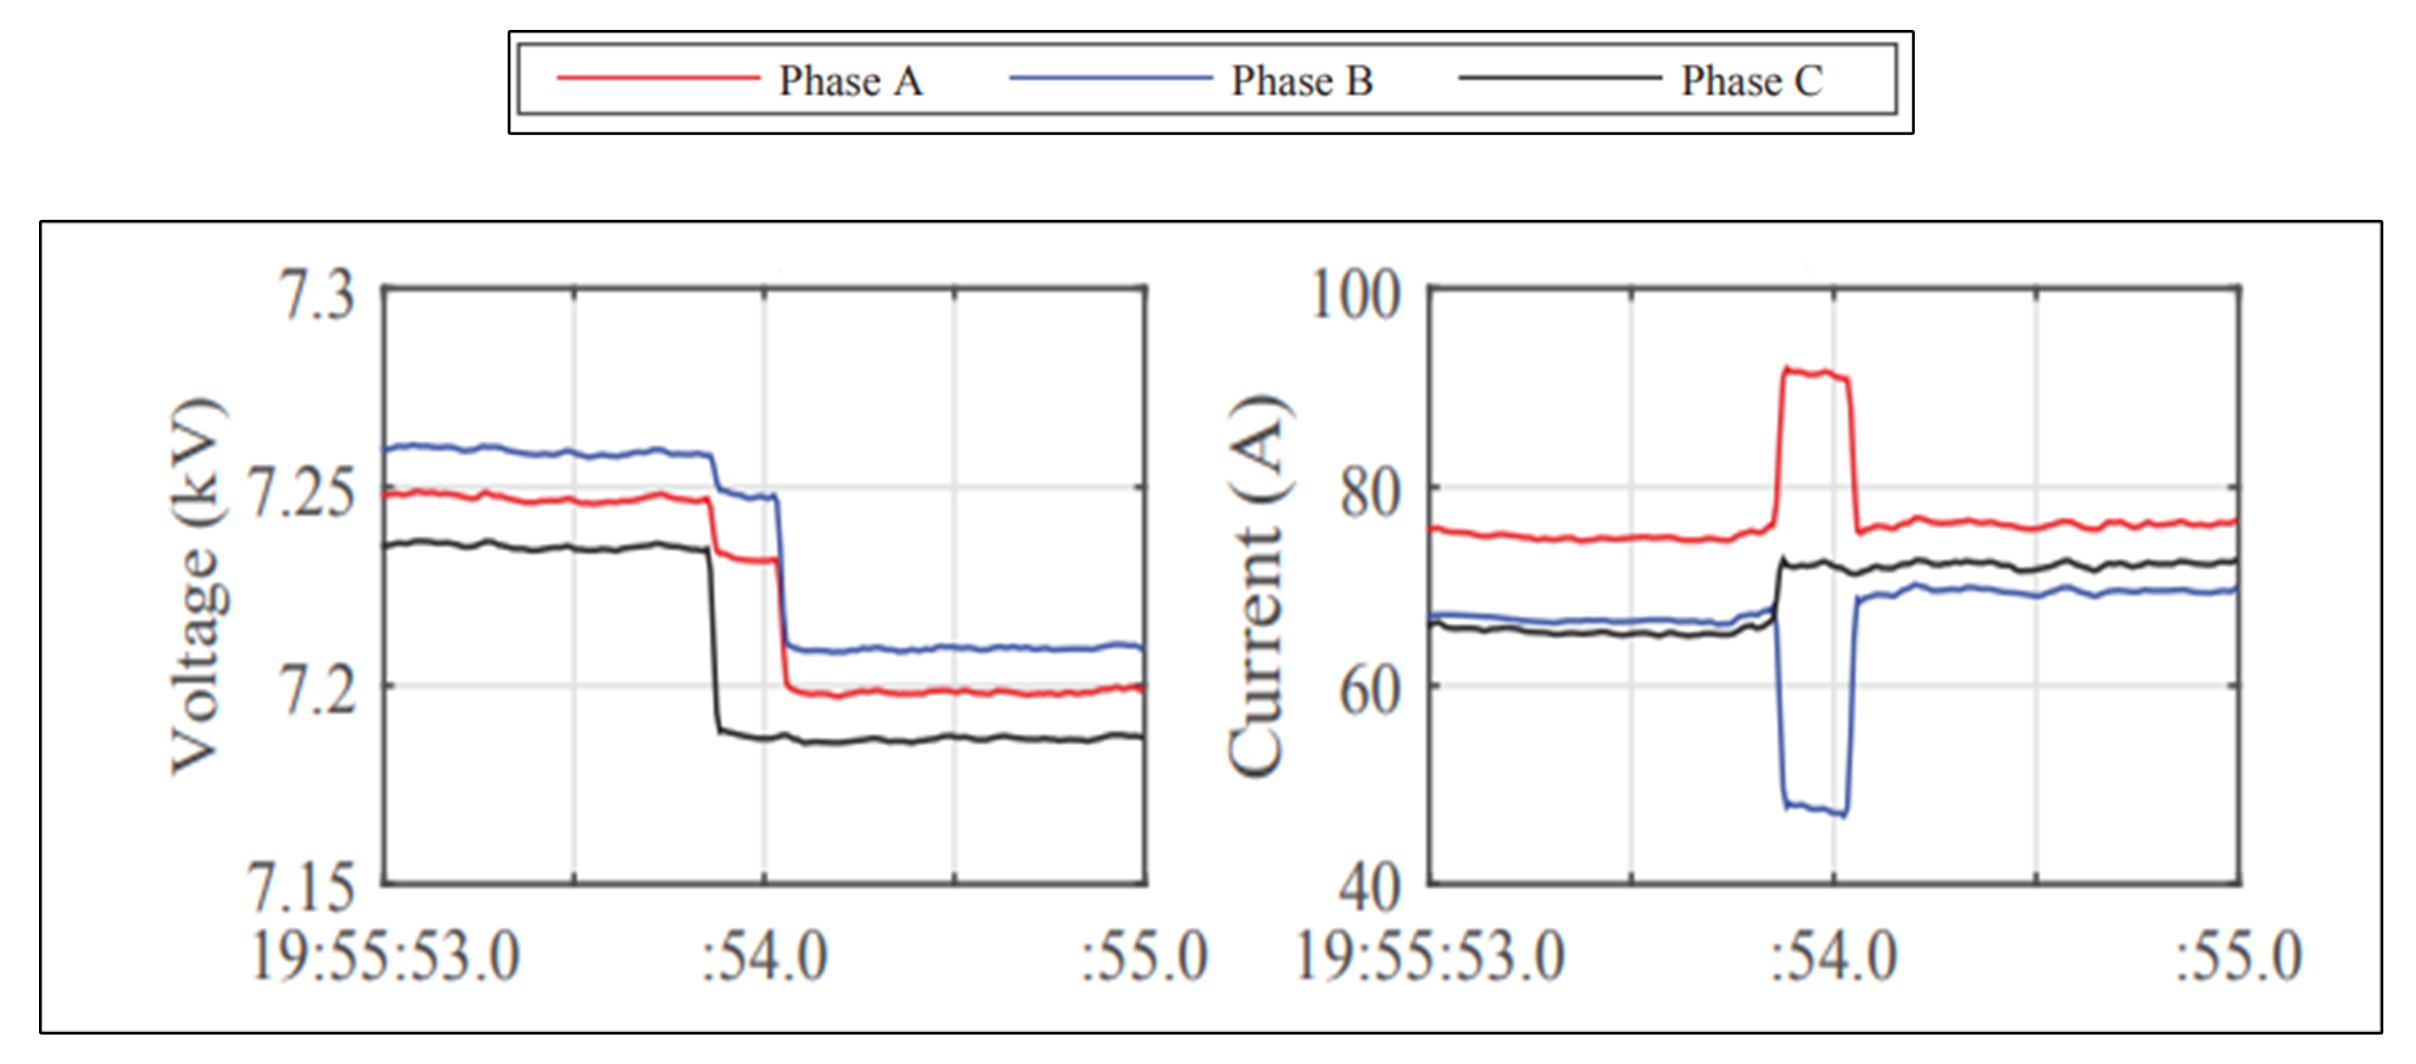
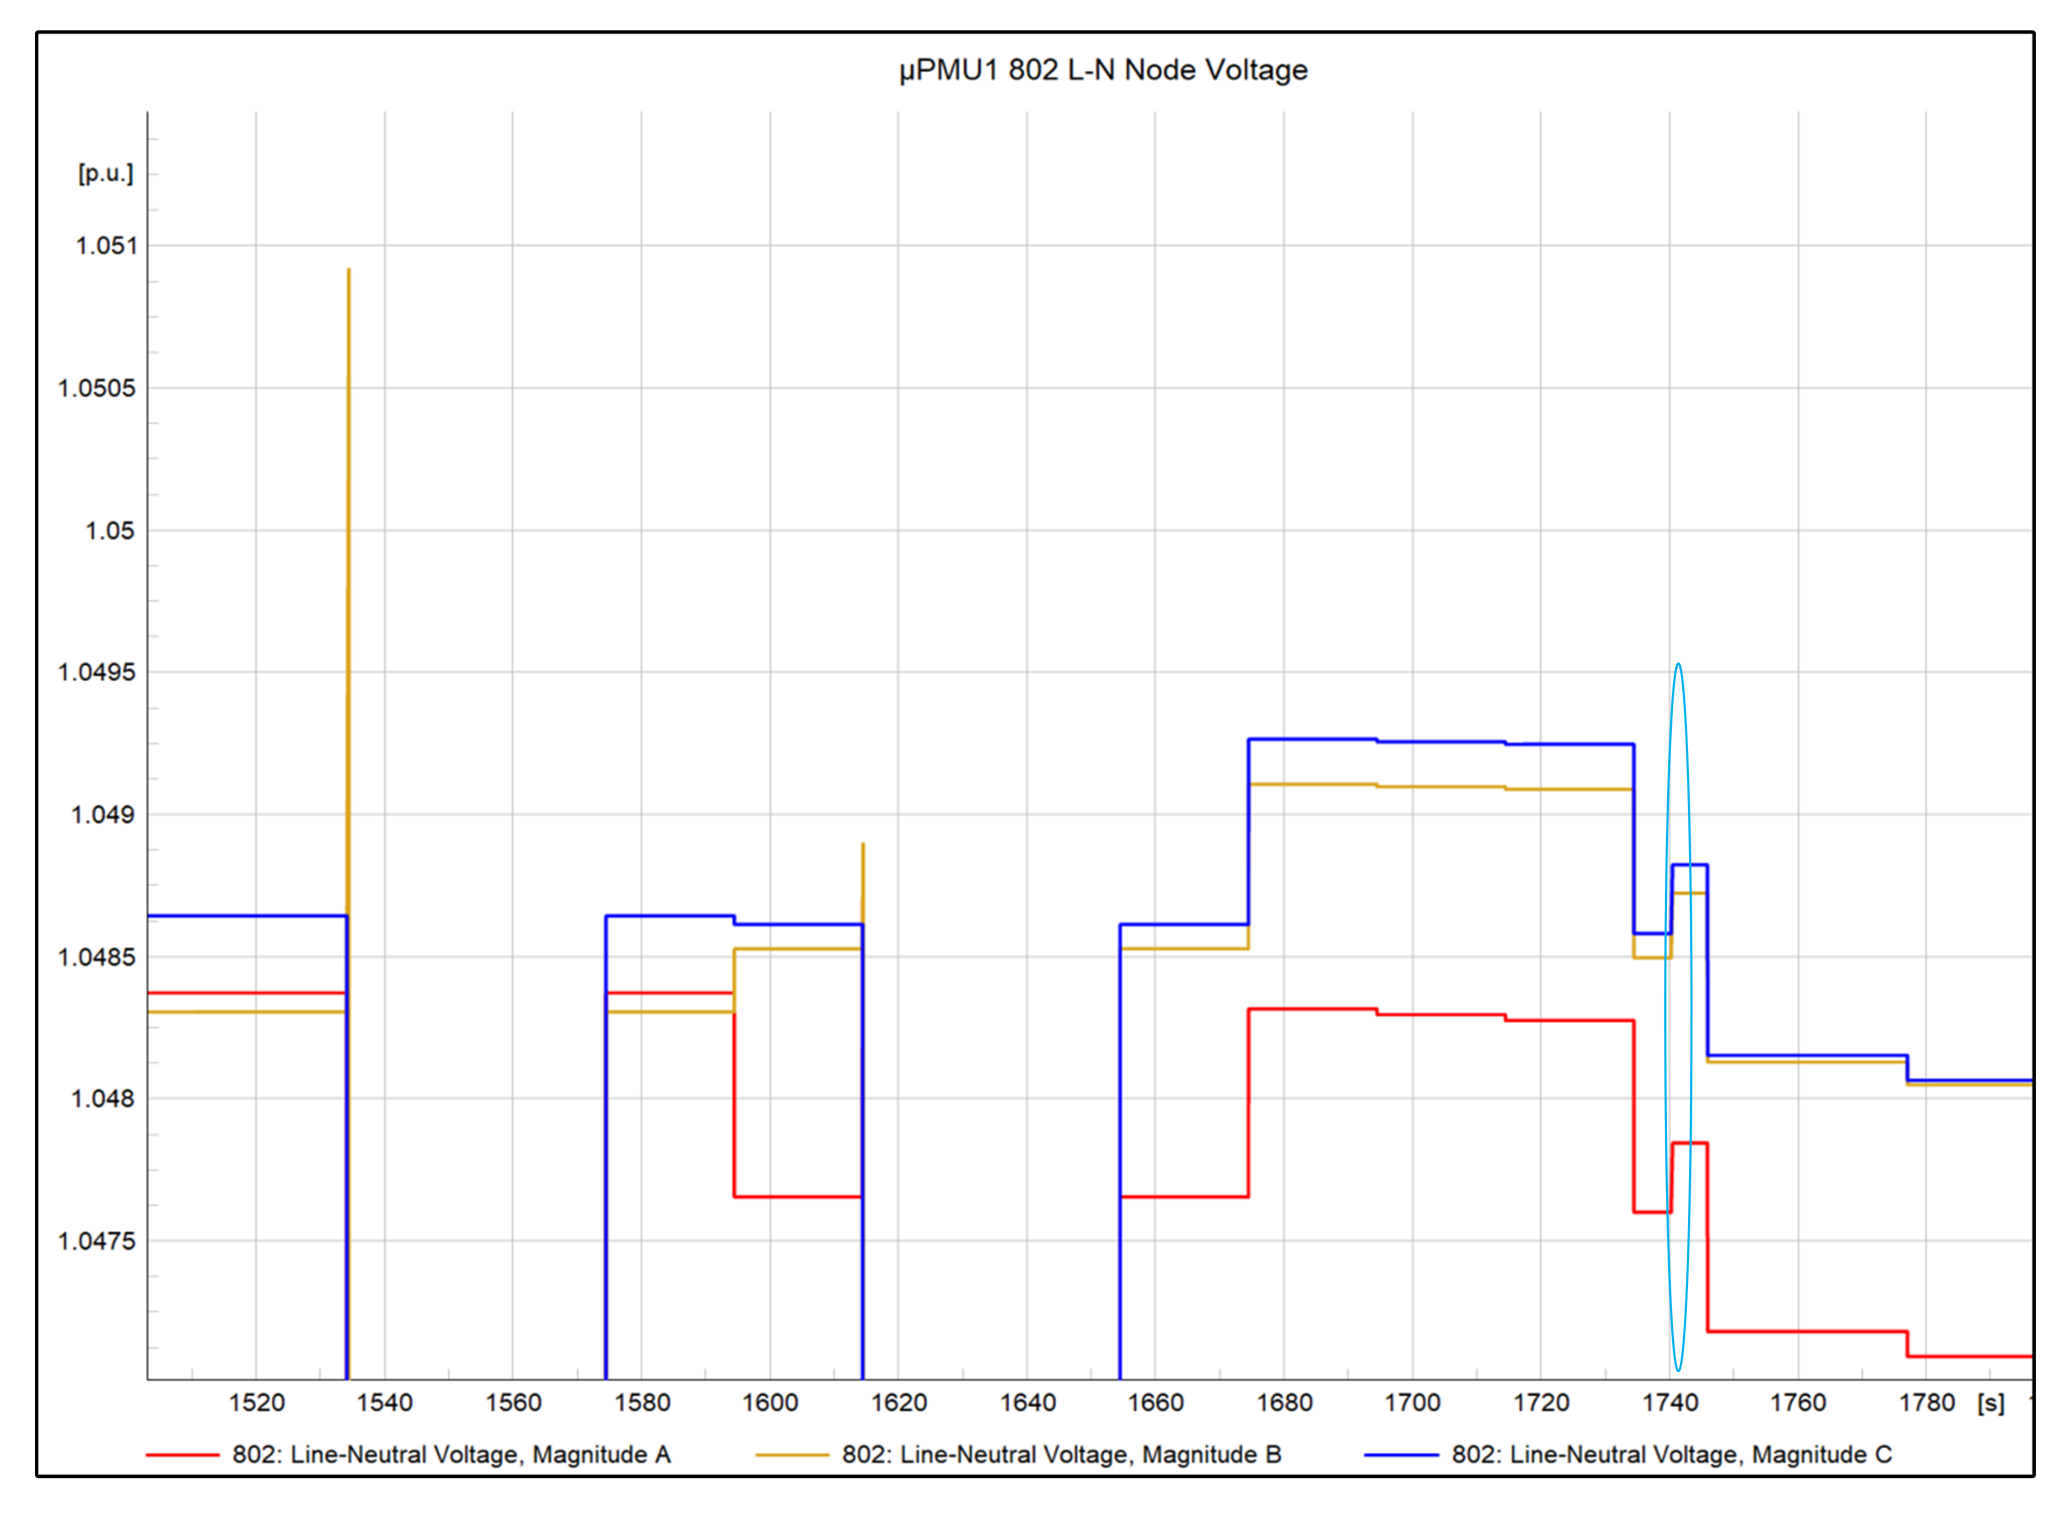
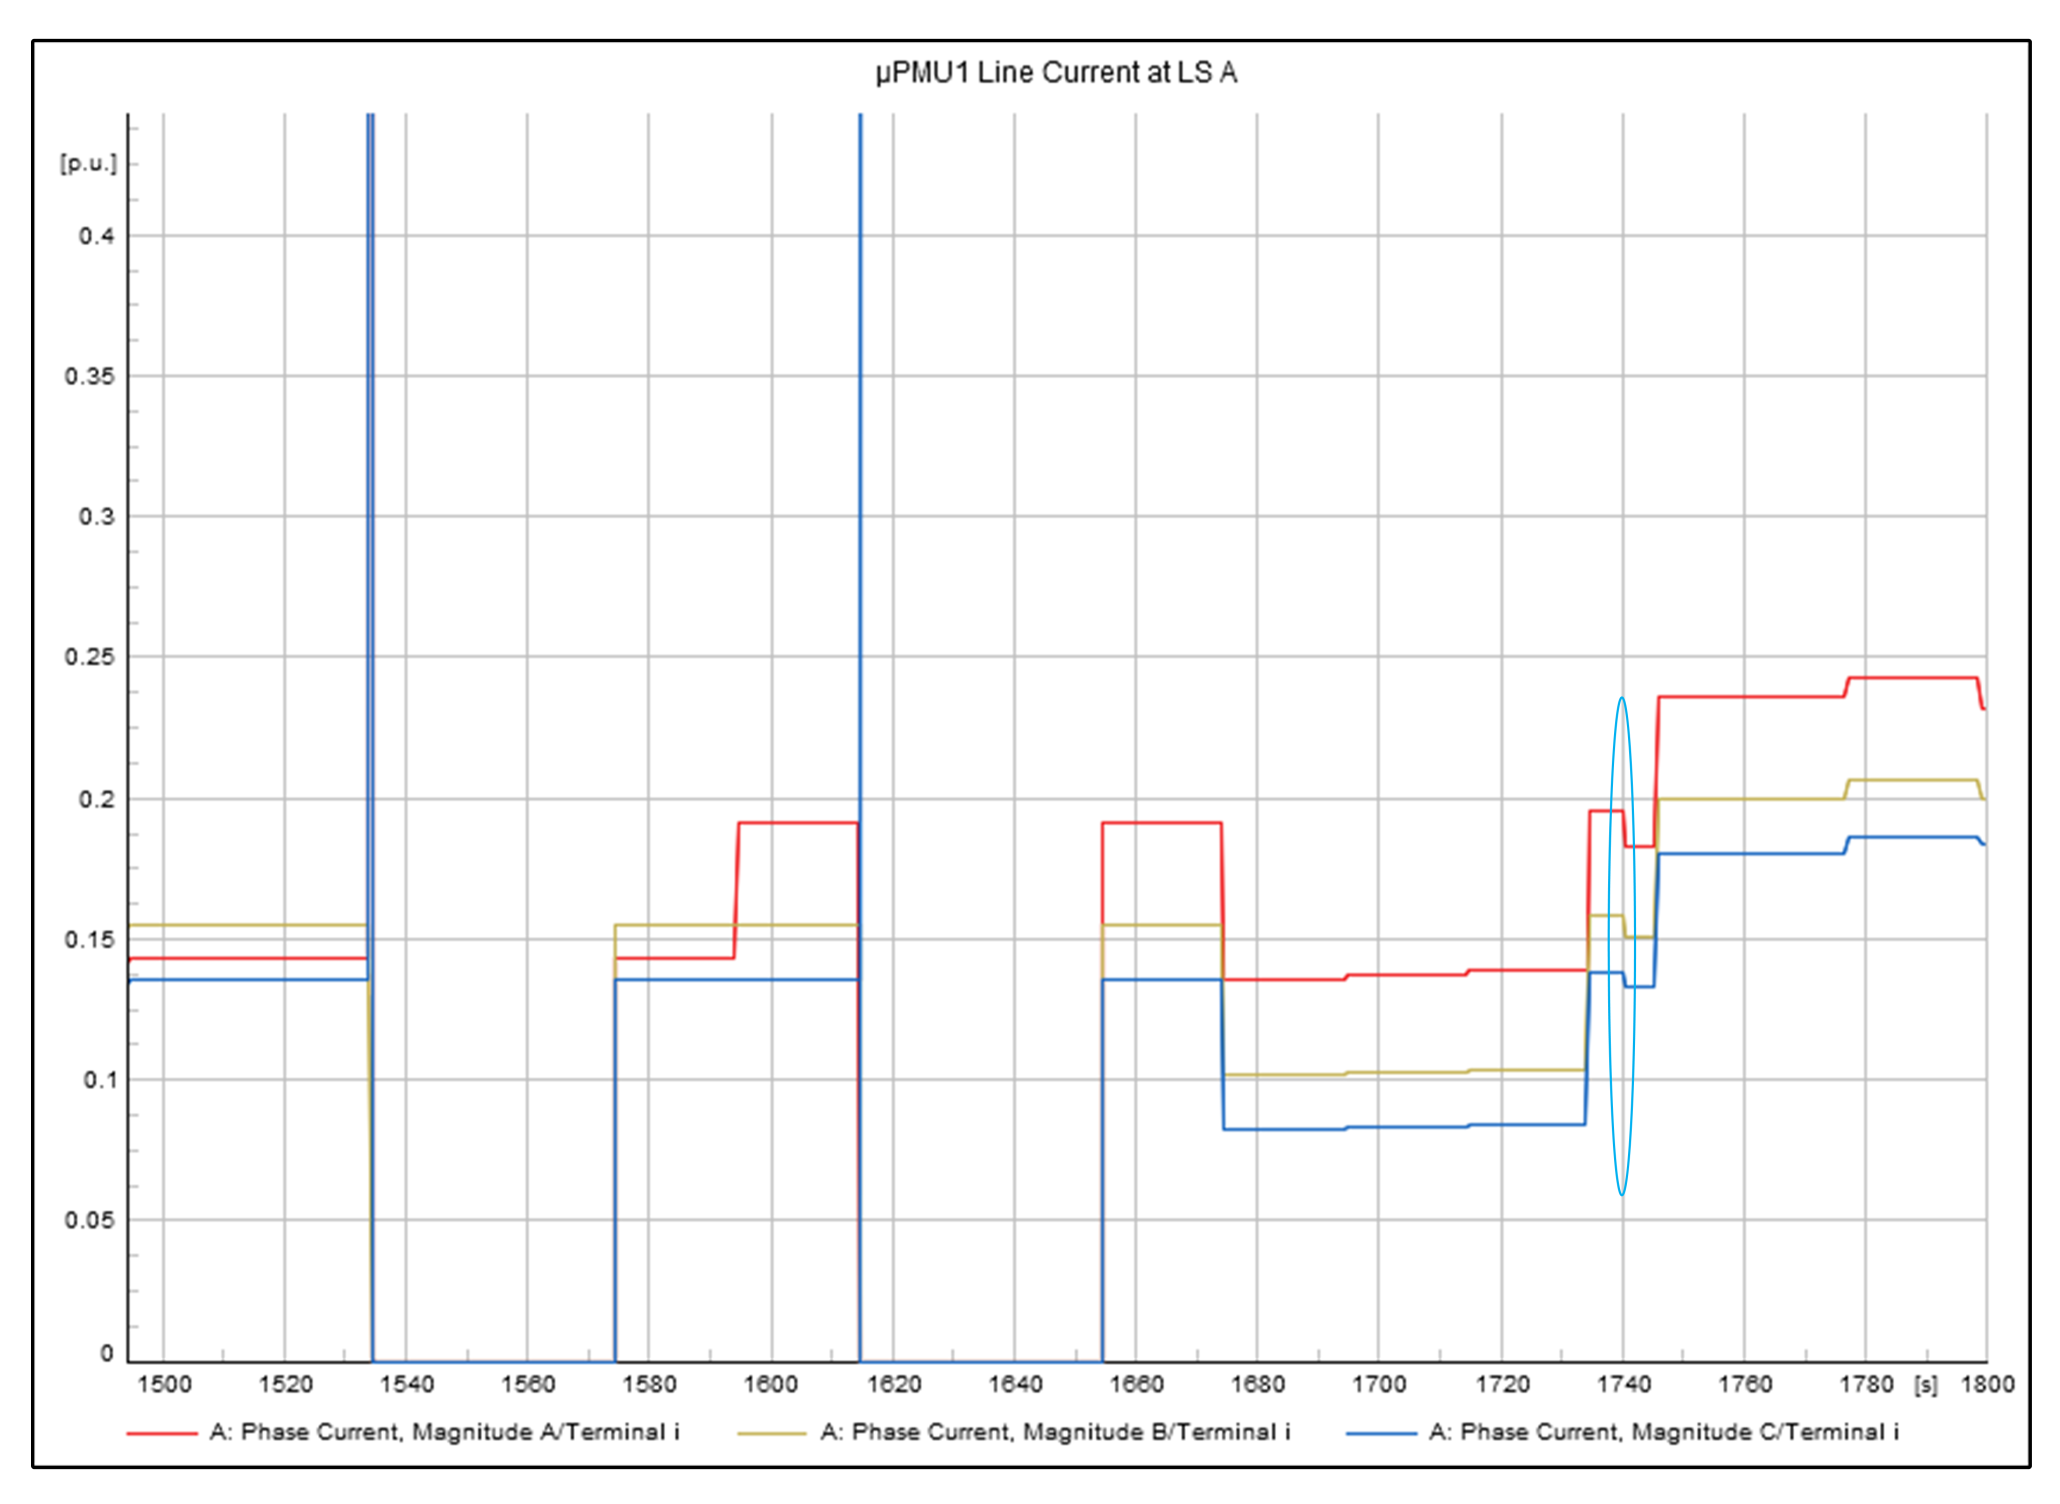
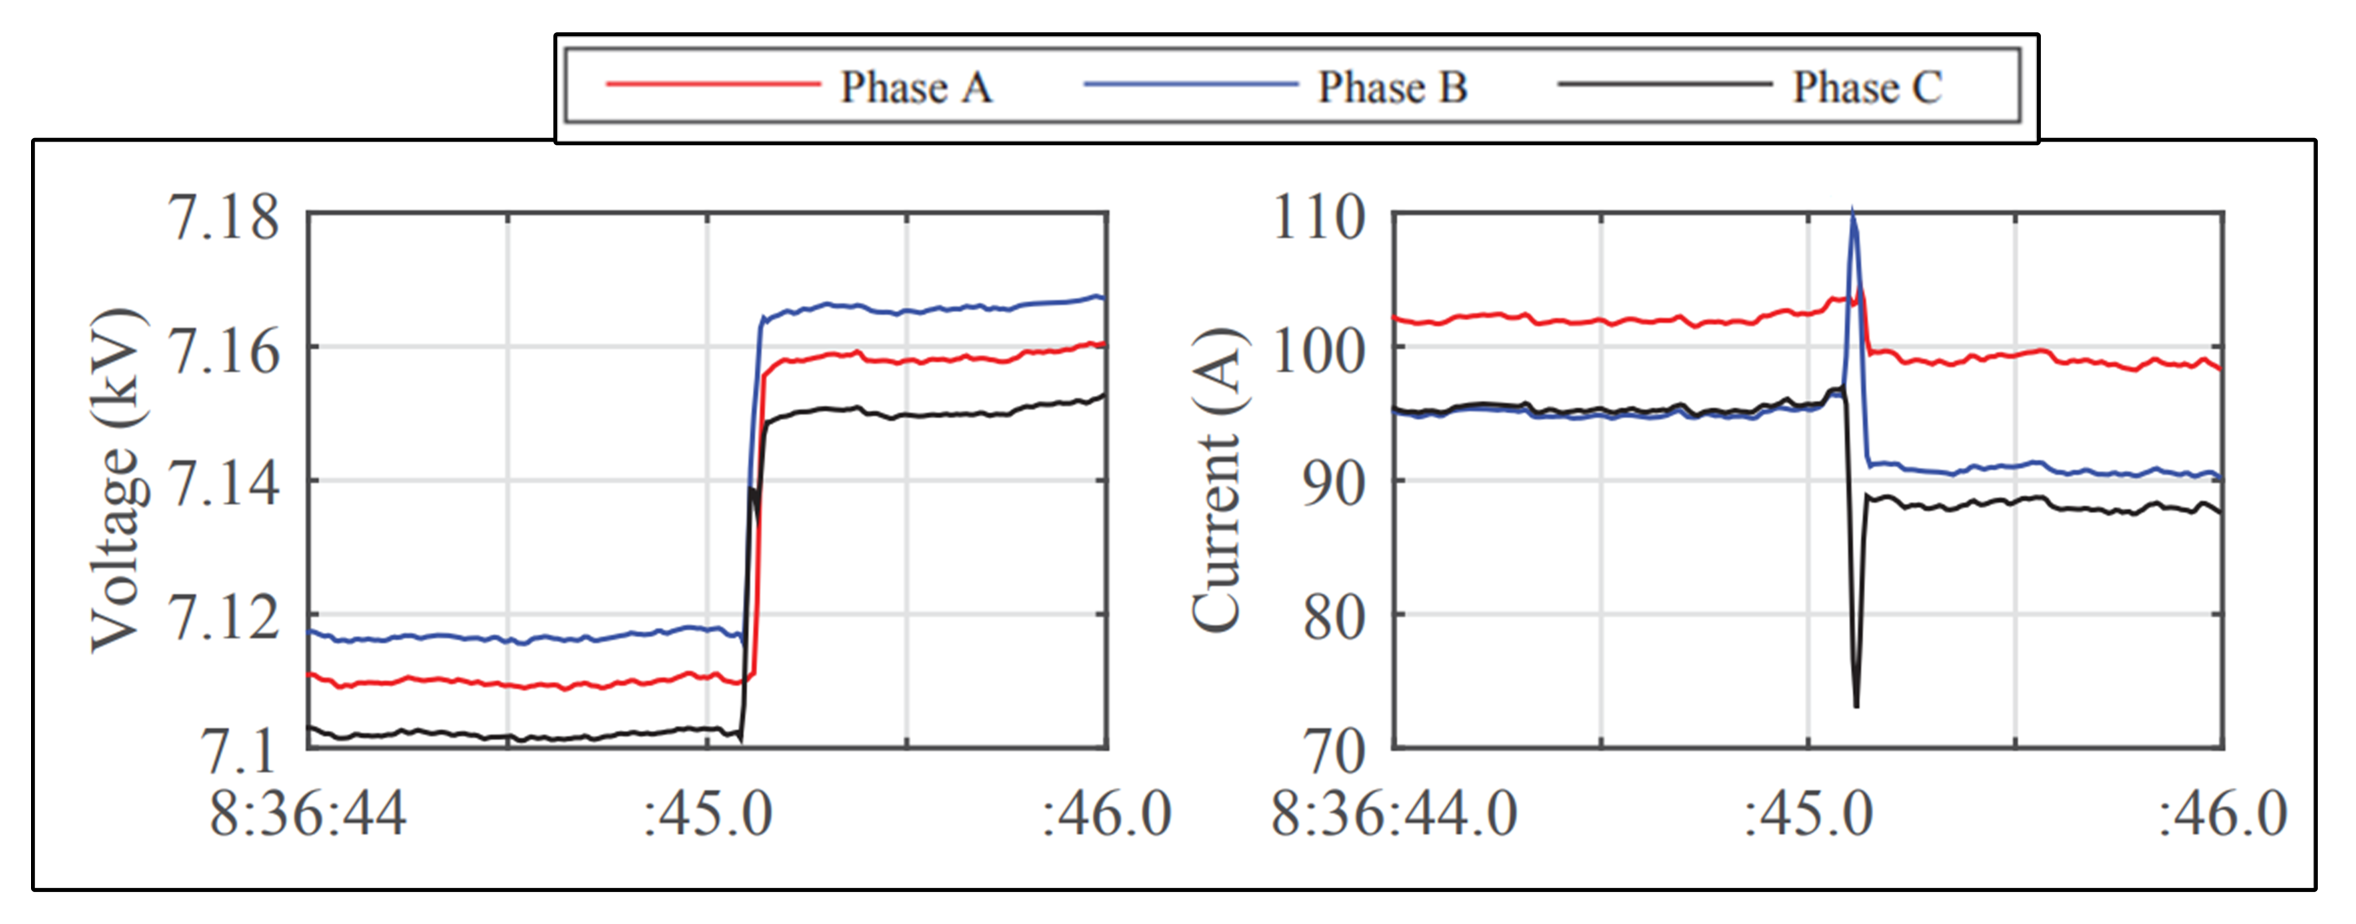
When the capacitor bank was kept off, all of the three-phase voltages dropped from their initial values, but all of the variations were within the defined limits. During this event, there was a rise in the R-phase current, no noticeable variation in the Y-phase current, and a drop in the B-phase current. The voltage and current variations shown in the generated data (Figure 47 and Figure 48) were compared and validated with the real μPMU data observed during the capacitor bank switch-off event (Figure 49) published in [15].

5.1.2. Capacitor Bank Switch-On Event

The voltage and current fluctuations of the generated data (Figure 50 and Figure 51) are as expected. The node voltage at all the phases was raised due to the capacitor bank switch-on event, and consequently, there was a reduction in the line currents at each phase. The same scenario was compared and validated against the actual μPMU data (Figure 52) provided in [15].
The three-phase capacitor bank switching study shows that the transient currents during the switching events depend on the initial conditions, with the possibility of a rise and drop in the current values. The system is considered normal until the parameter studies are within the limits.

5.2. Fault, Trip, CB Open, and Reclose Events

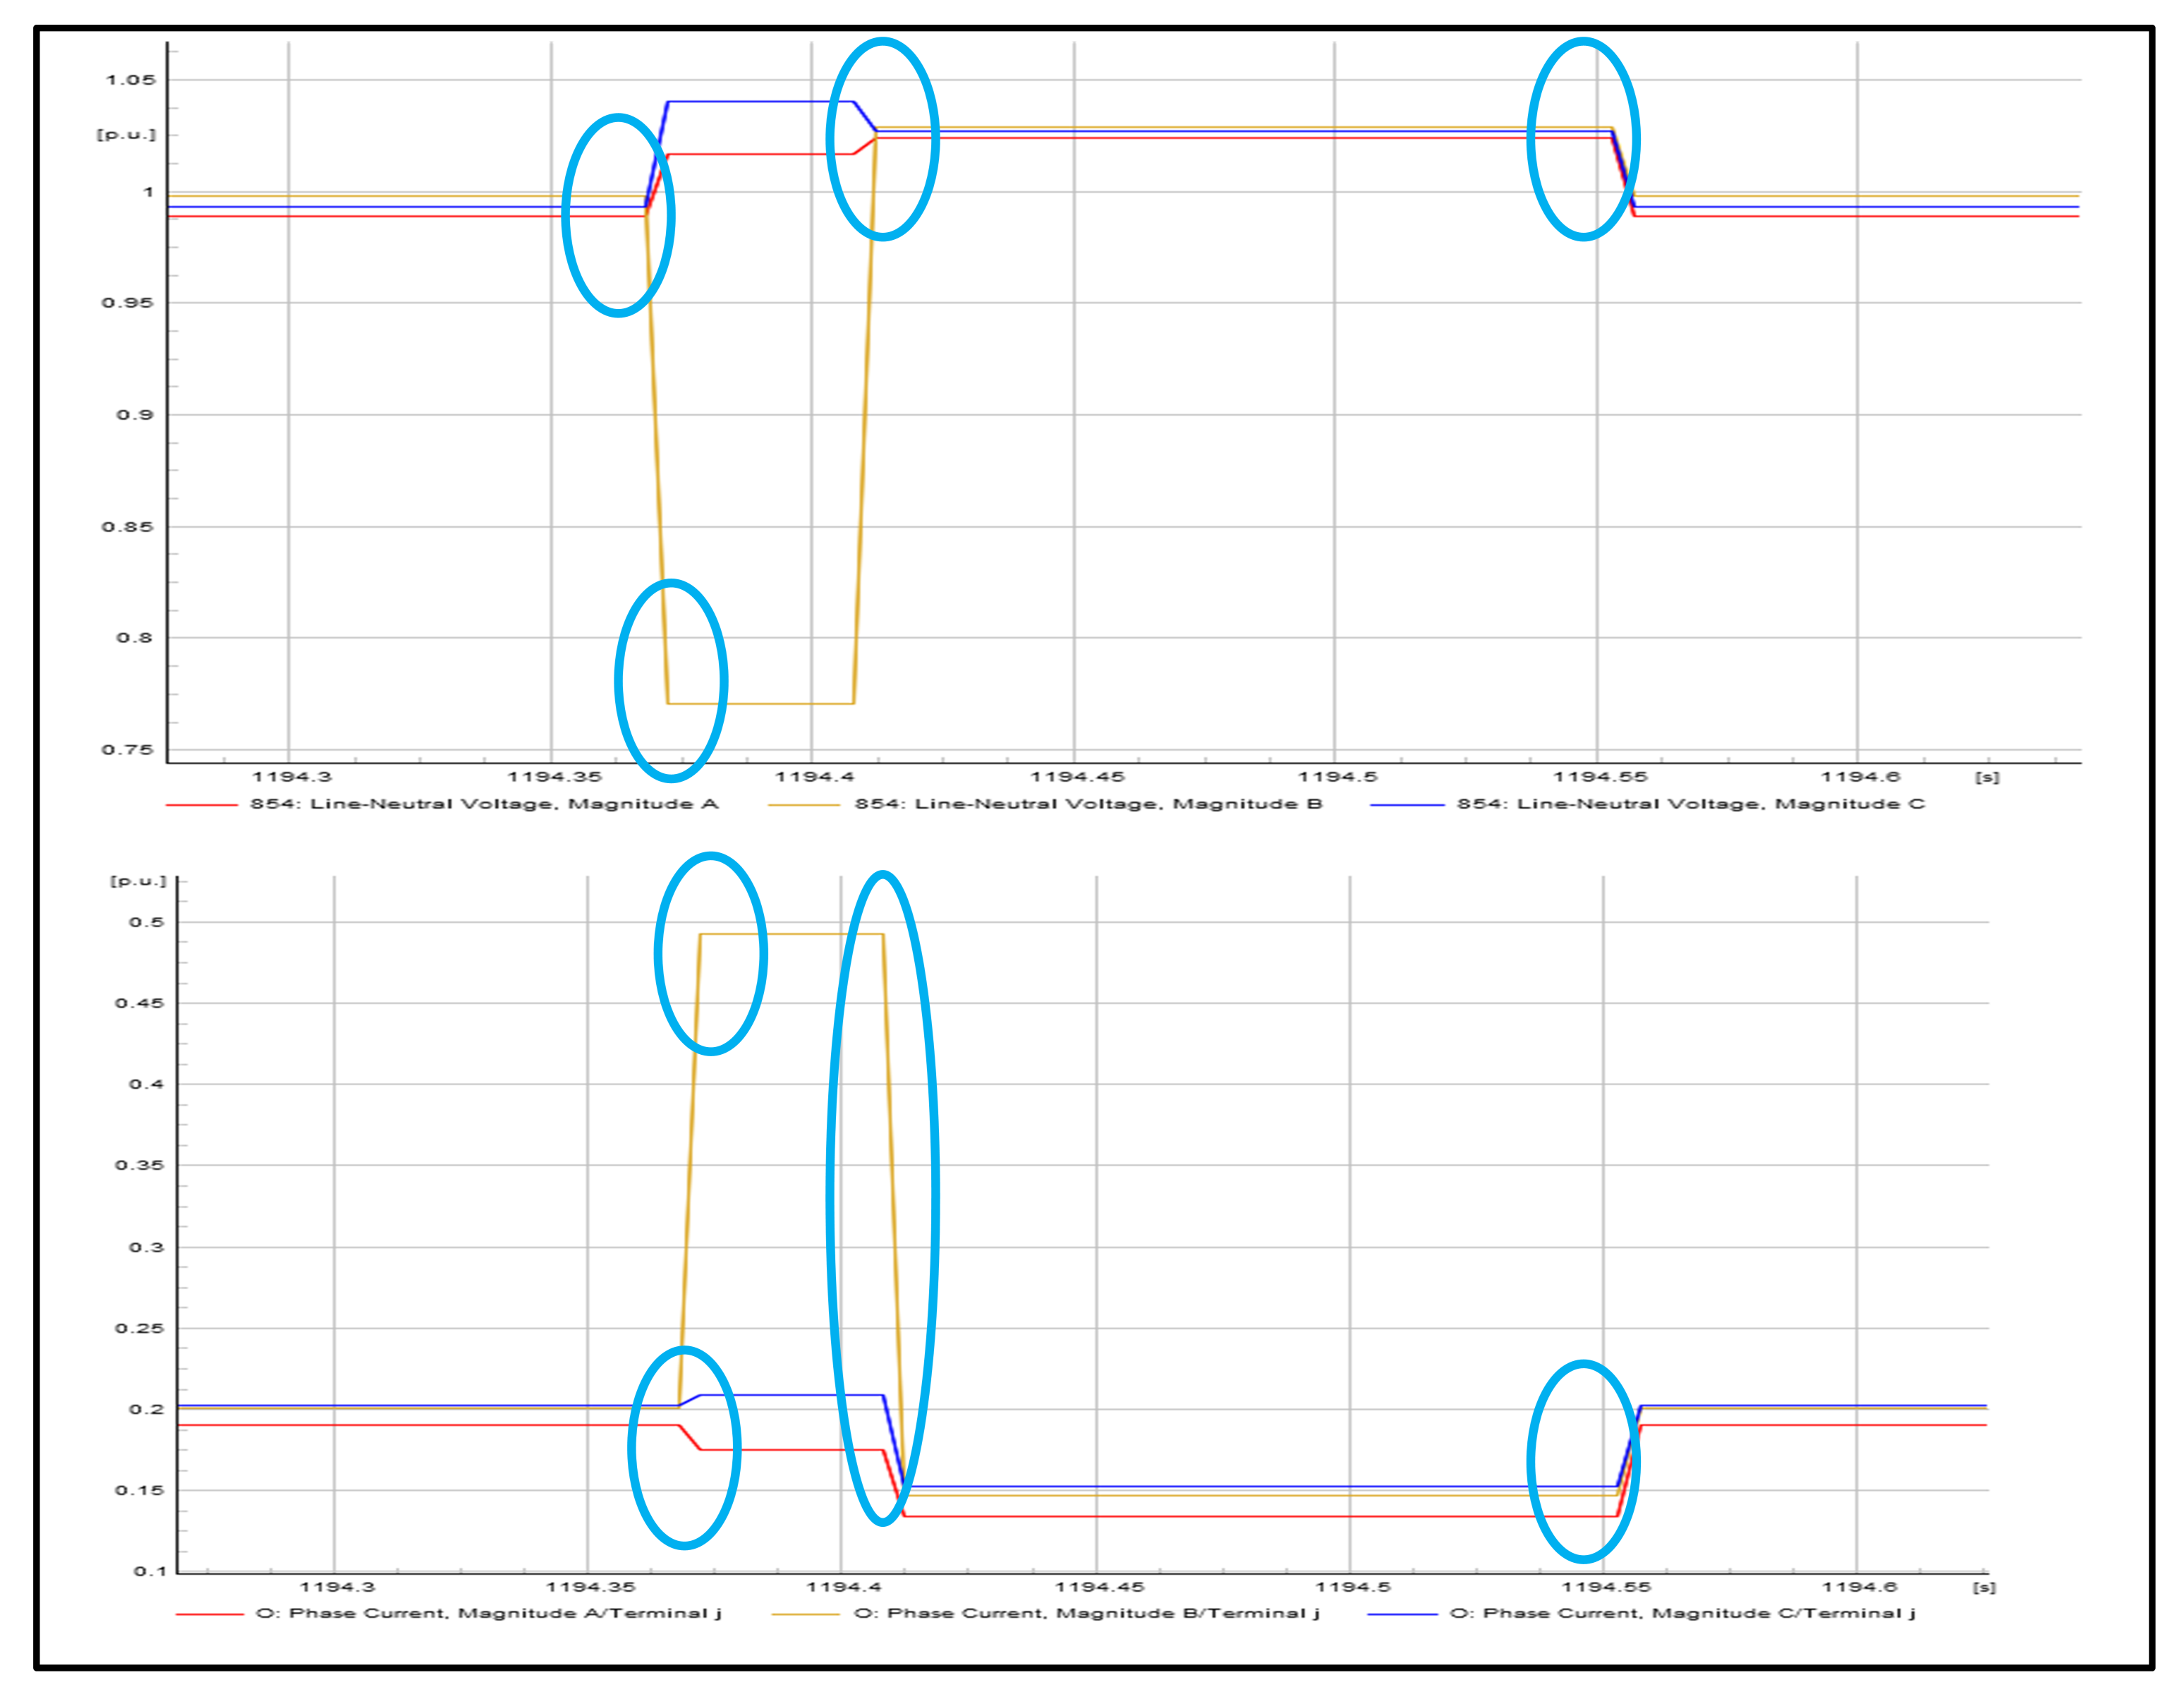
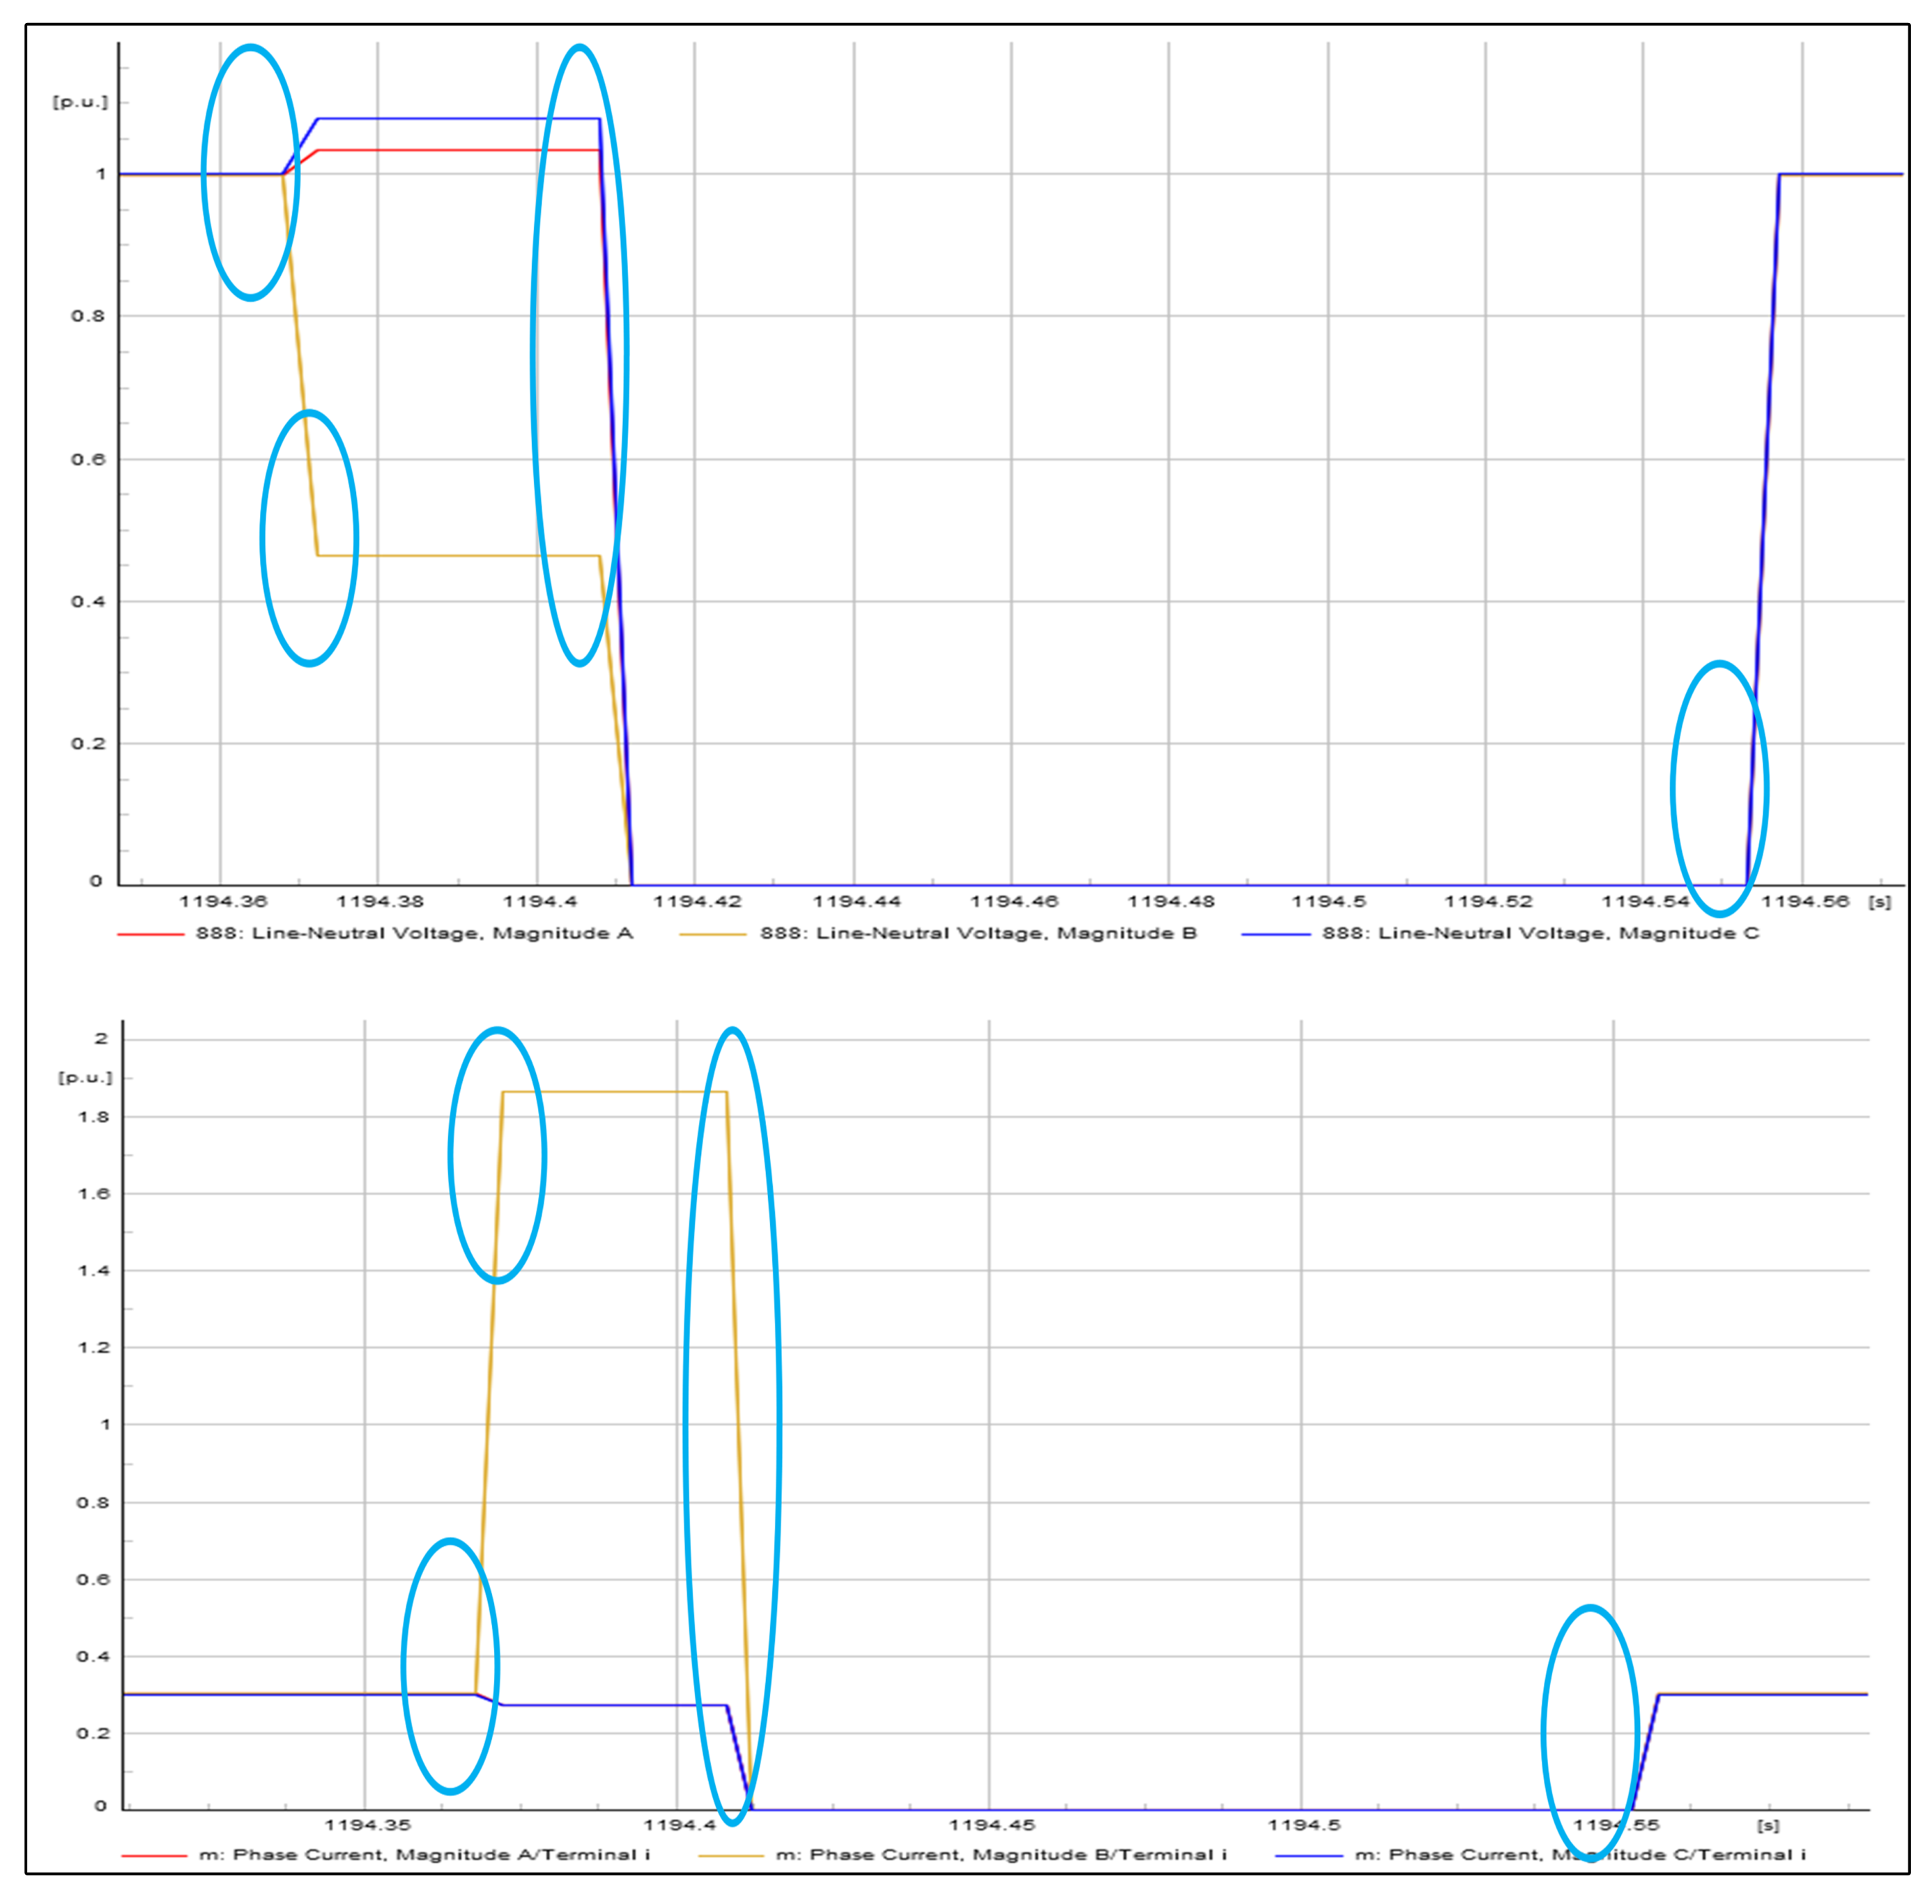
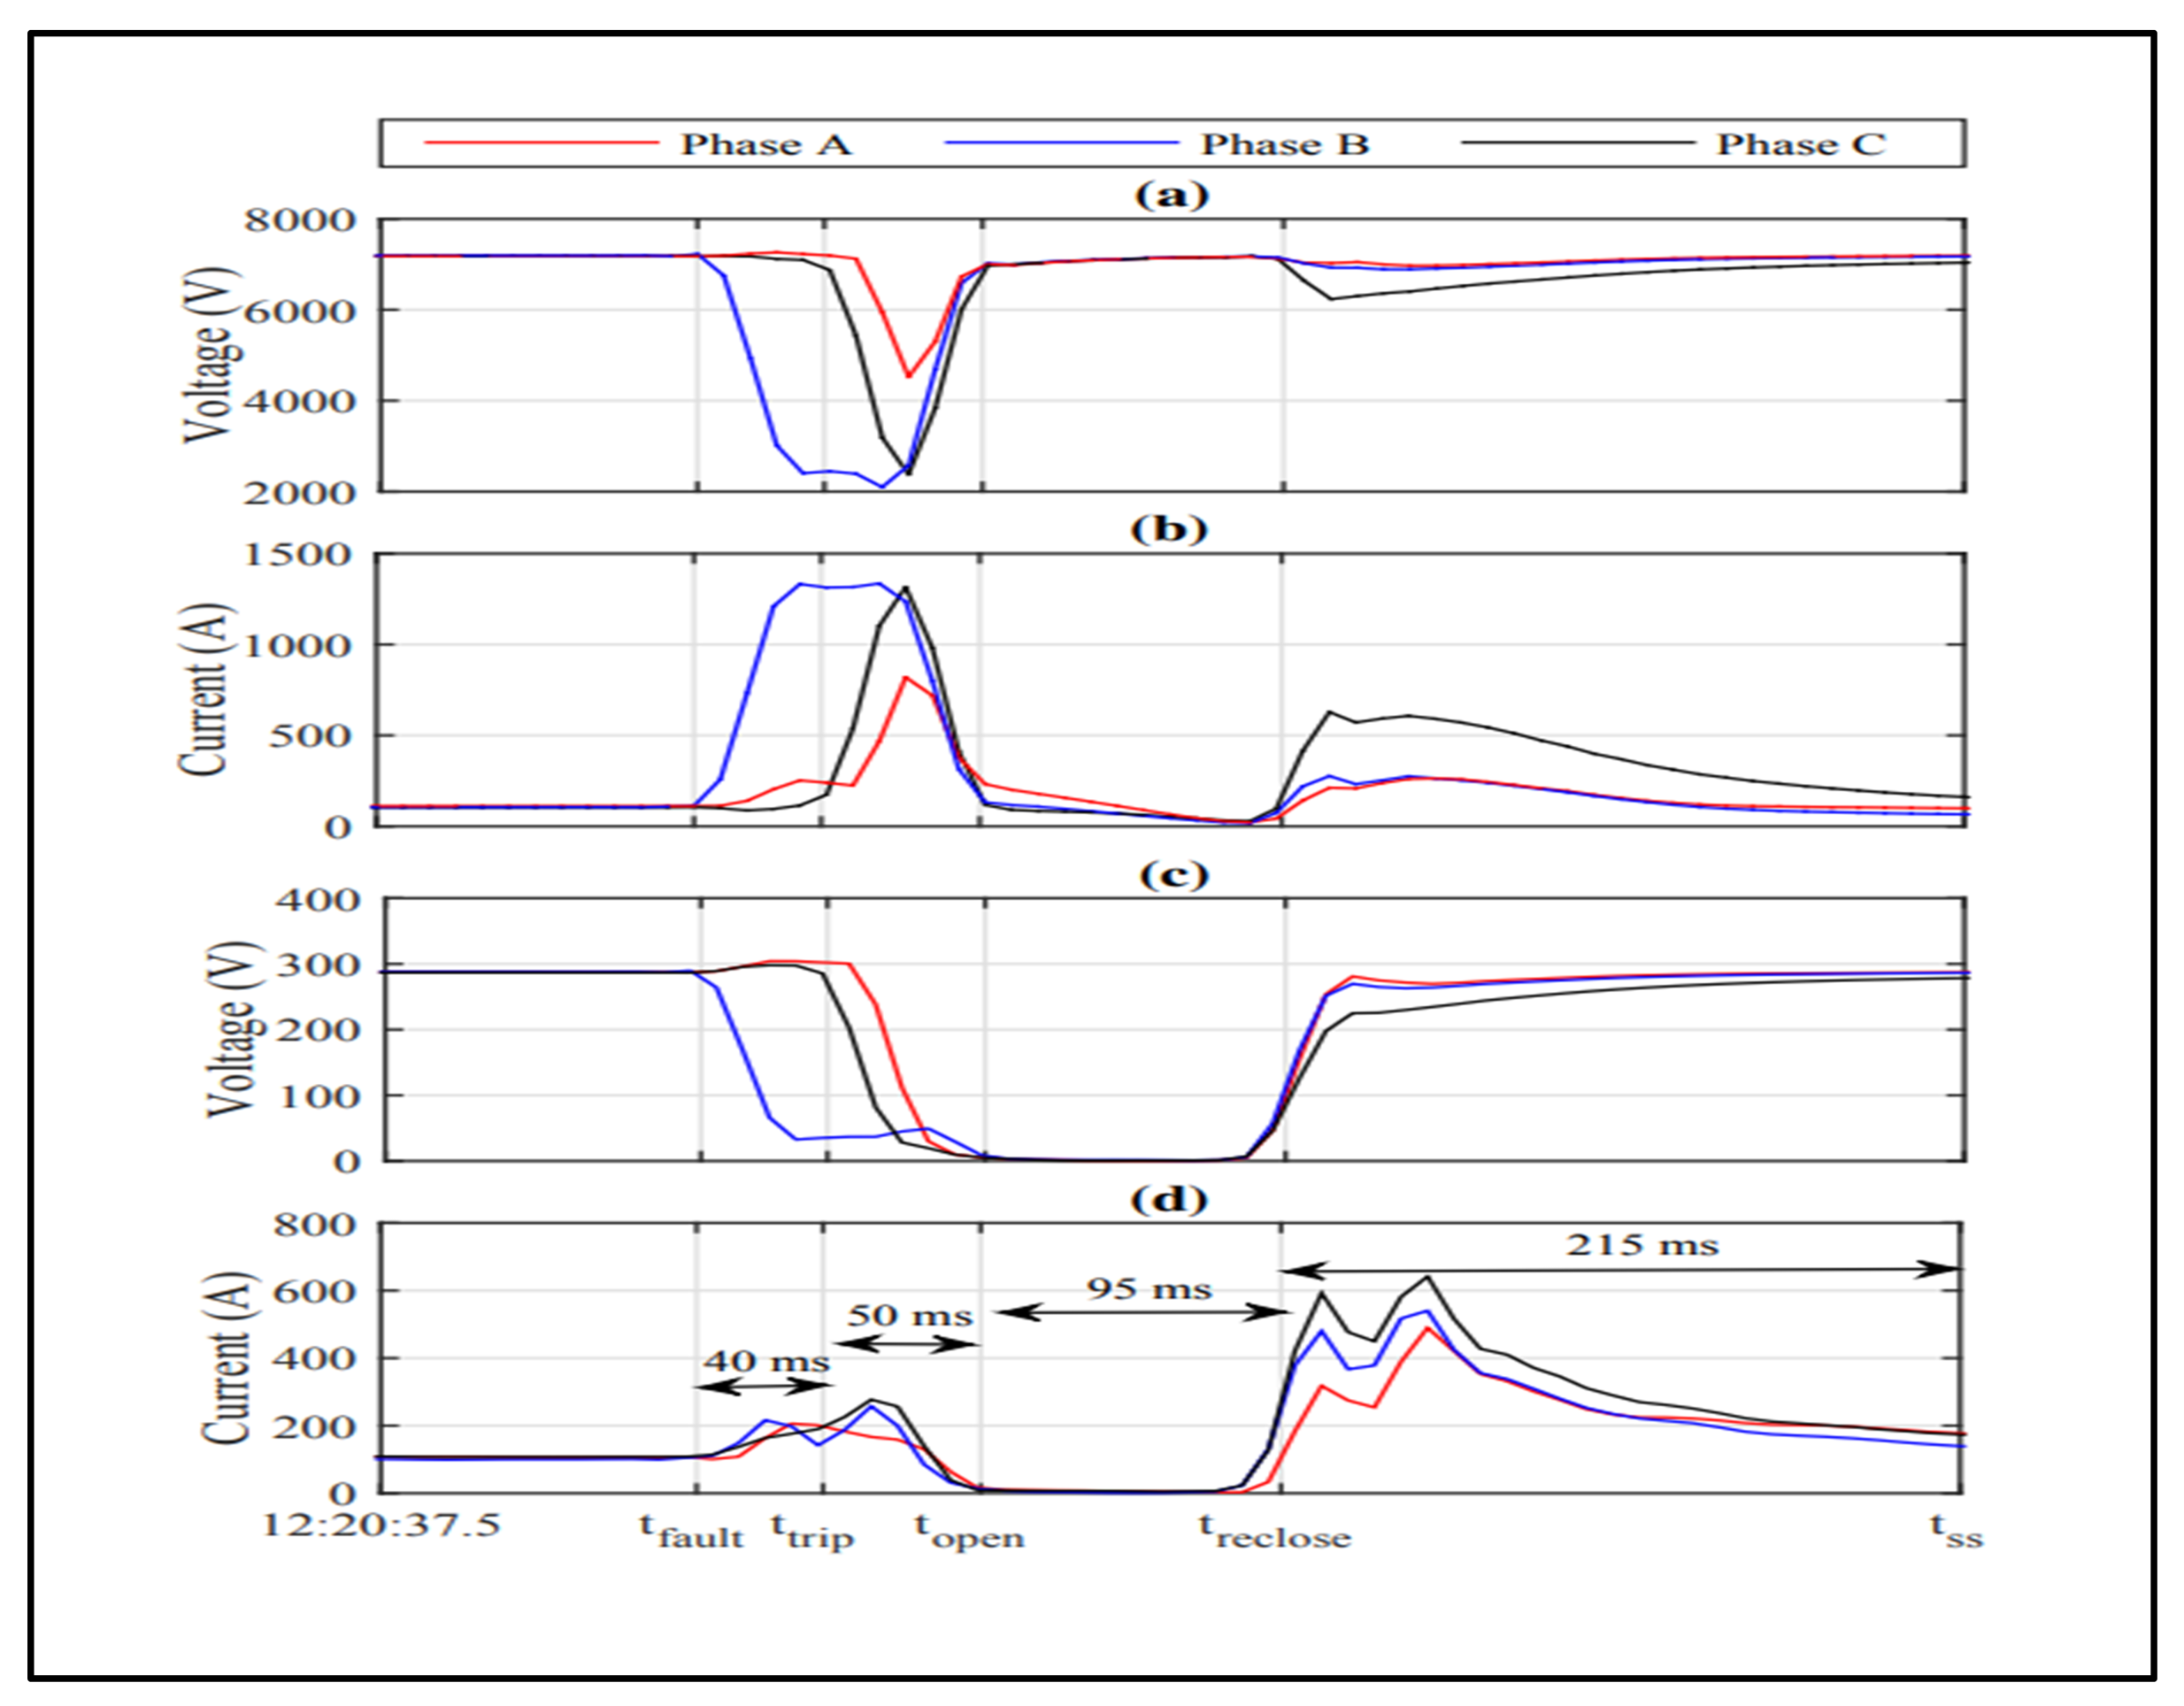
The generated event data for the fault, trip, CB open, and reclose events observed by the upstream and downstream μPMUs are shown in Figure 53 and Figure 54. These results are based on a B-phase-to-ground fault generated using the modeled network. The real data available in [10] are for a B-phase-to-neutral fault, but if the neutral wire in a three-phase distribution system is solidly grounded, a phase-to-neutral fault can be considered a type of phase-to-ground fault. This is because in a solidly grounded system, the neutral is connected directly to the earth, which means that any fault on the neutral wire will cause a current to flow directly to the ground. As a result, the fault can be considered a phase-to-ground fault, even though it originated on the neutral wire [39]. For validation, these events were compared with the published real data, adapting the relay settings from [10] as shown in Figure 55.
As soon as the fault occurs, the upstream μPMU shows a considerable drop in the voltage and a rise in the current of the B-phase, with minor changes in other phases. After the breaker trip event, almost all the phase voltages show similar values, but all the phase current values reach near zero. When CB completely opens, all the phase voltages reach the limits of their normal values, and the three-phase currents drop to zero. After the reclose event, all the node voltage and the line currents return to their pre-fault normal values as the breaker gets closed, and the loads are immediately connected. This means that the fault was temporary, and the closing of the CB will ensure the healthiness of the network and components.
The fault and trip events observed by the downstream μPMU are more or less the same dynamics observed by the upstream μPMU, but right after the CB opening event, both voltage and current values of the phases drop to zero. The reclose event observed by this μPMU is similar to the normal pre-fault values of the voltages and currents.
The generated fault event results are comparable with the dynamics of the fault occurrence process and reclose events presented in [10].

5.3. DG-Switching Event

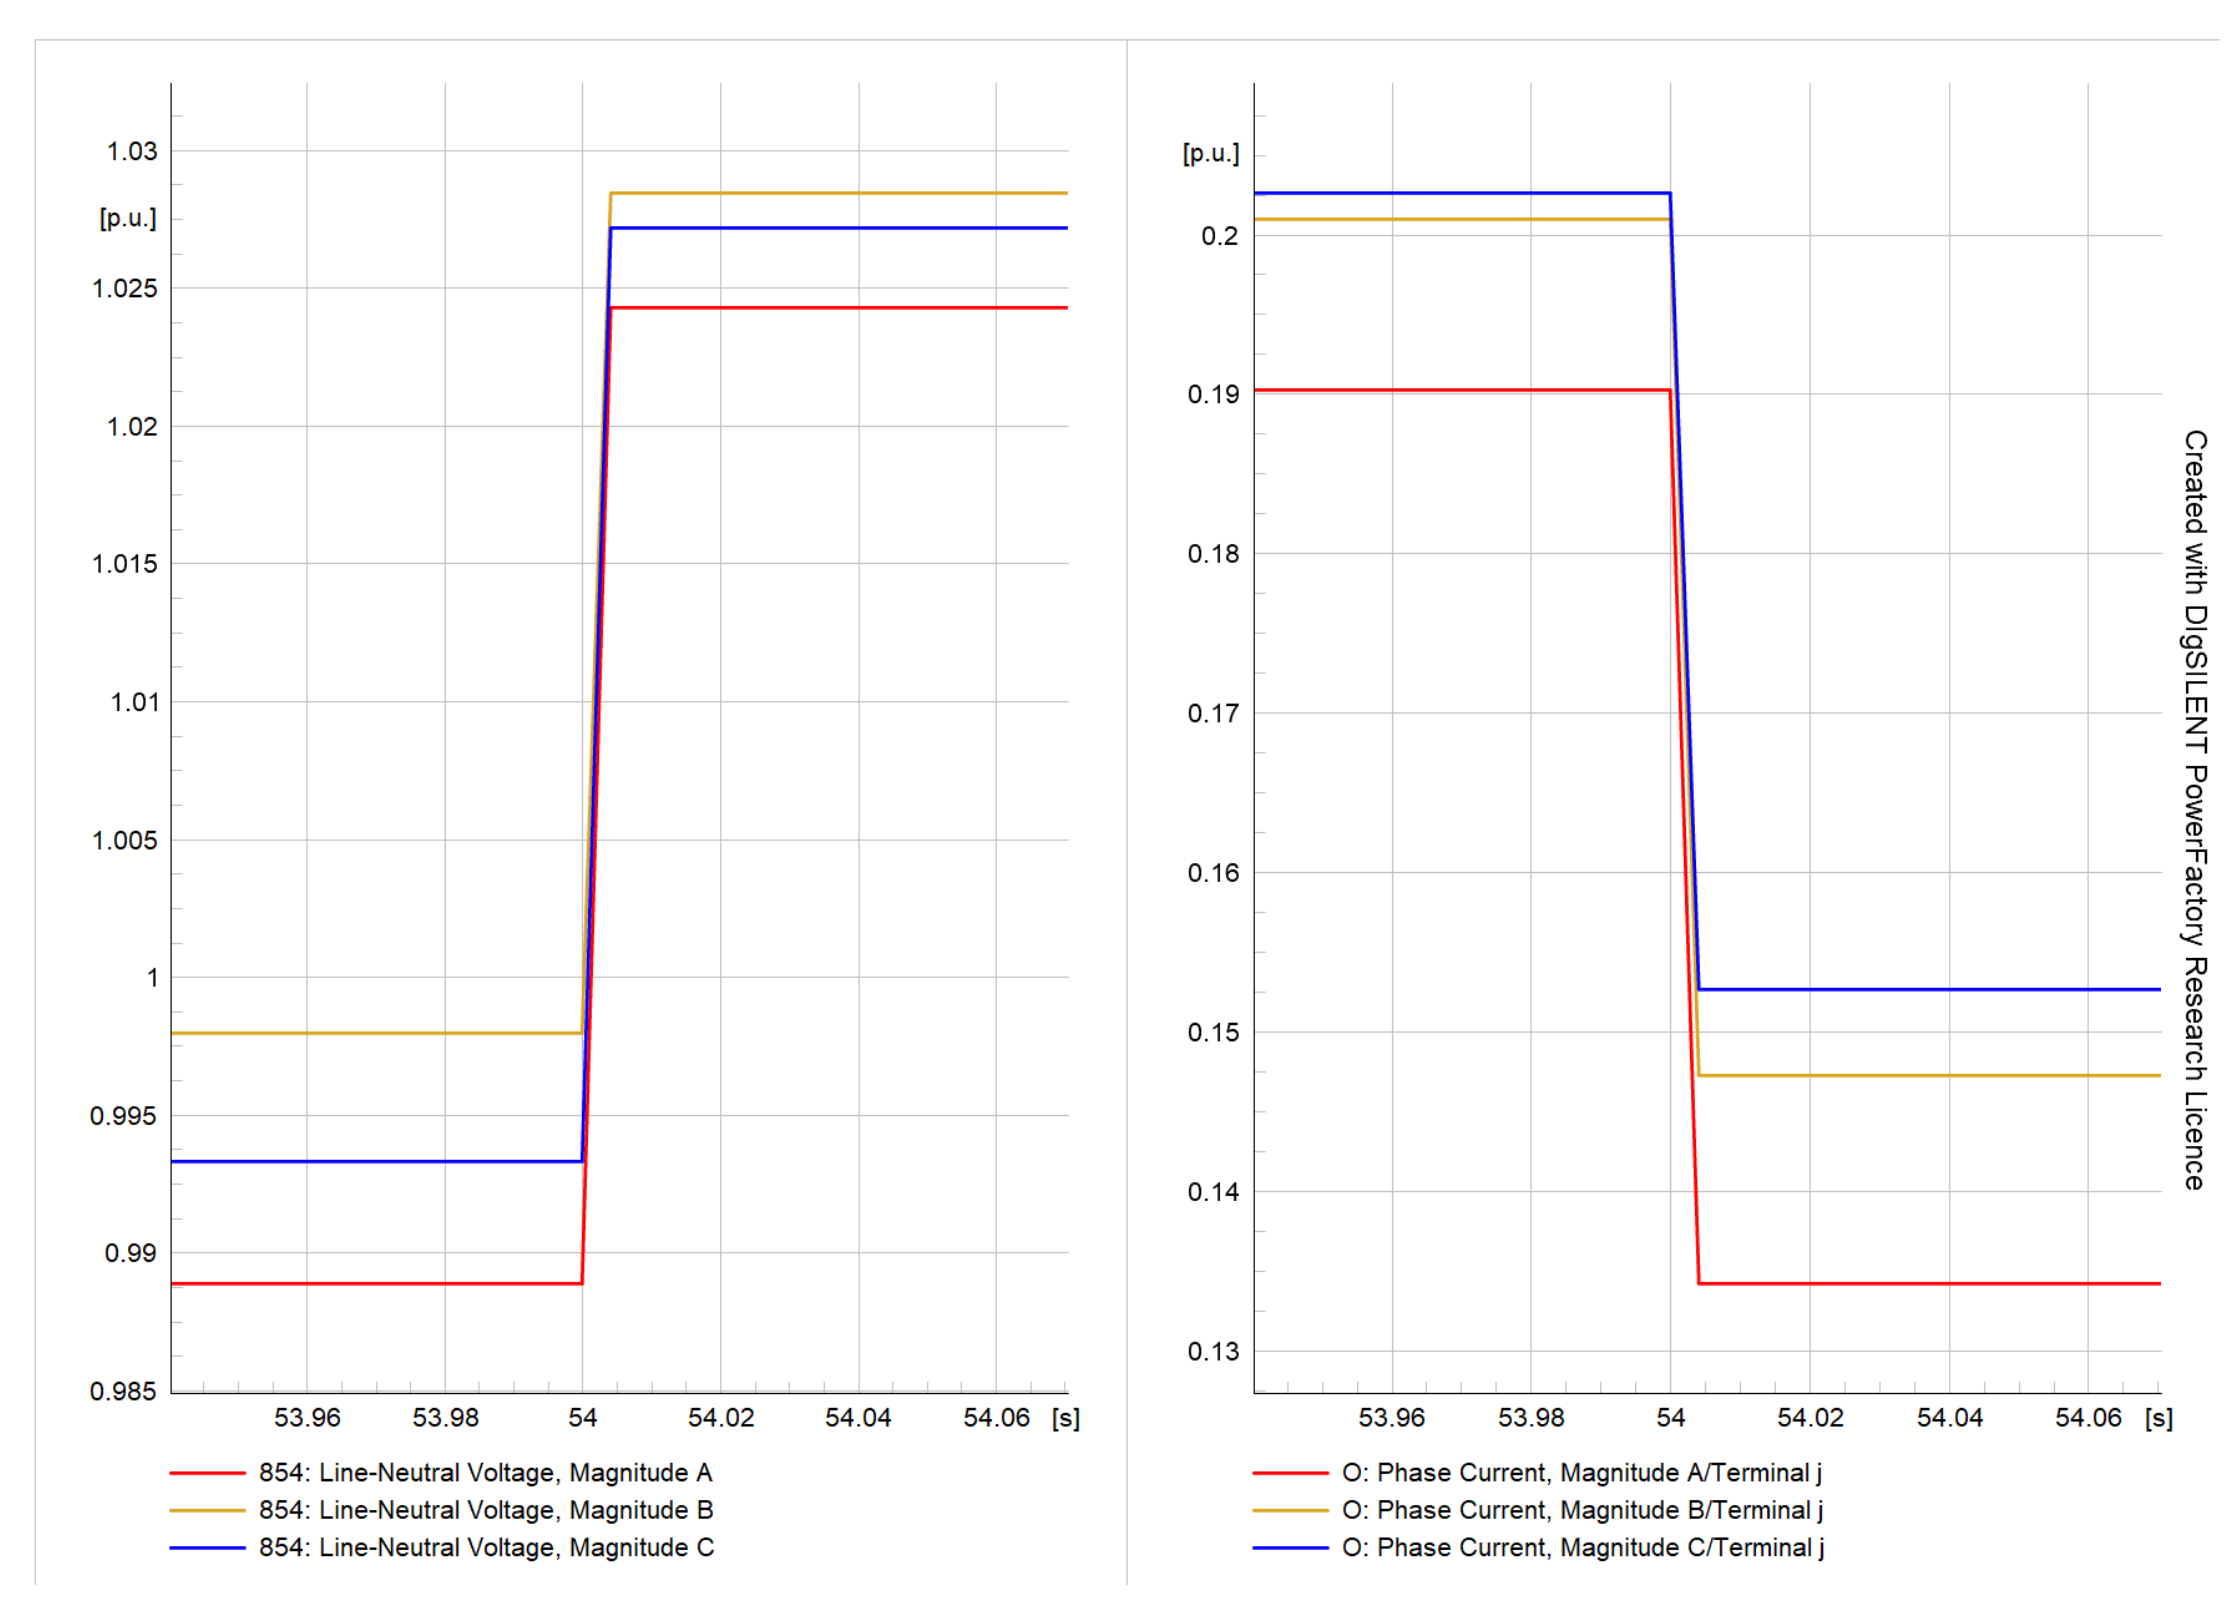
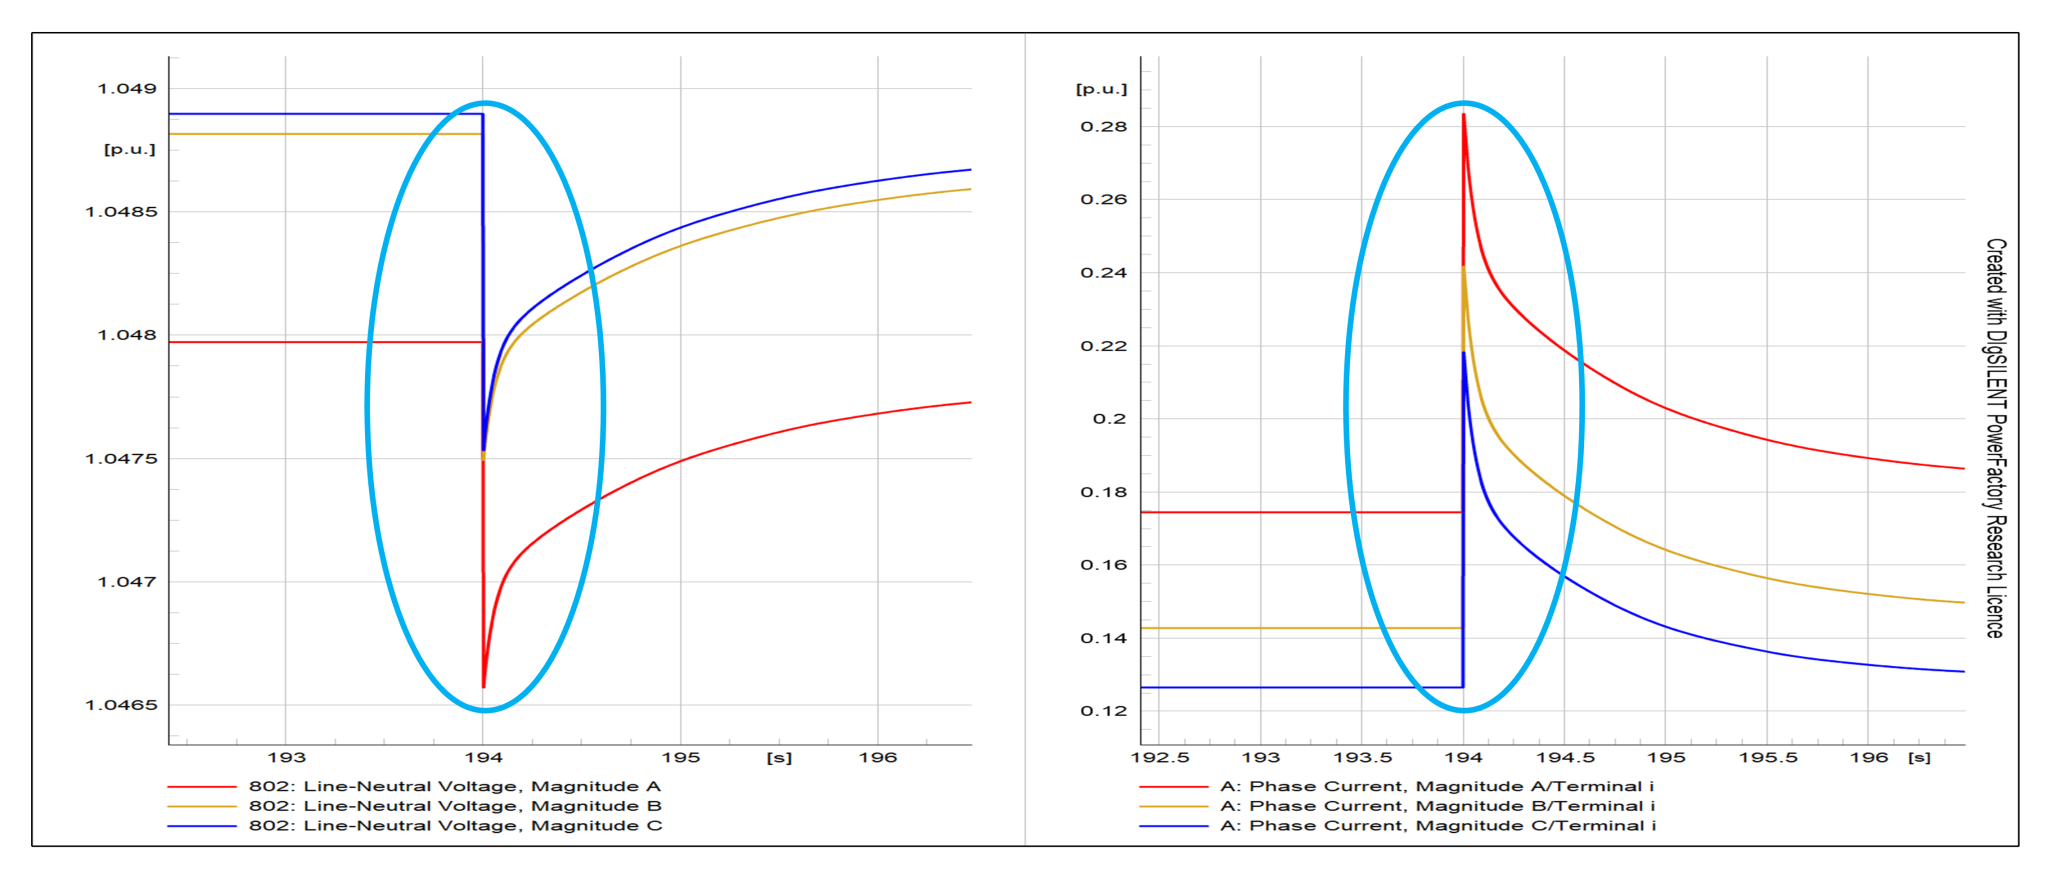
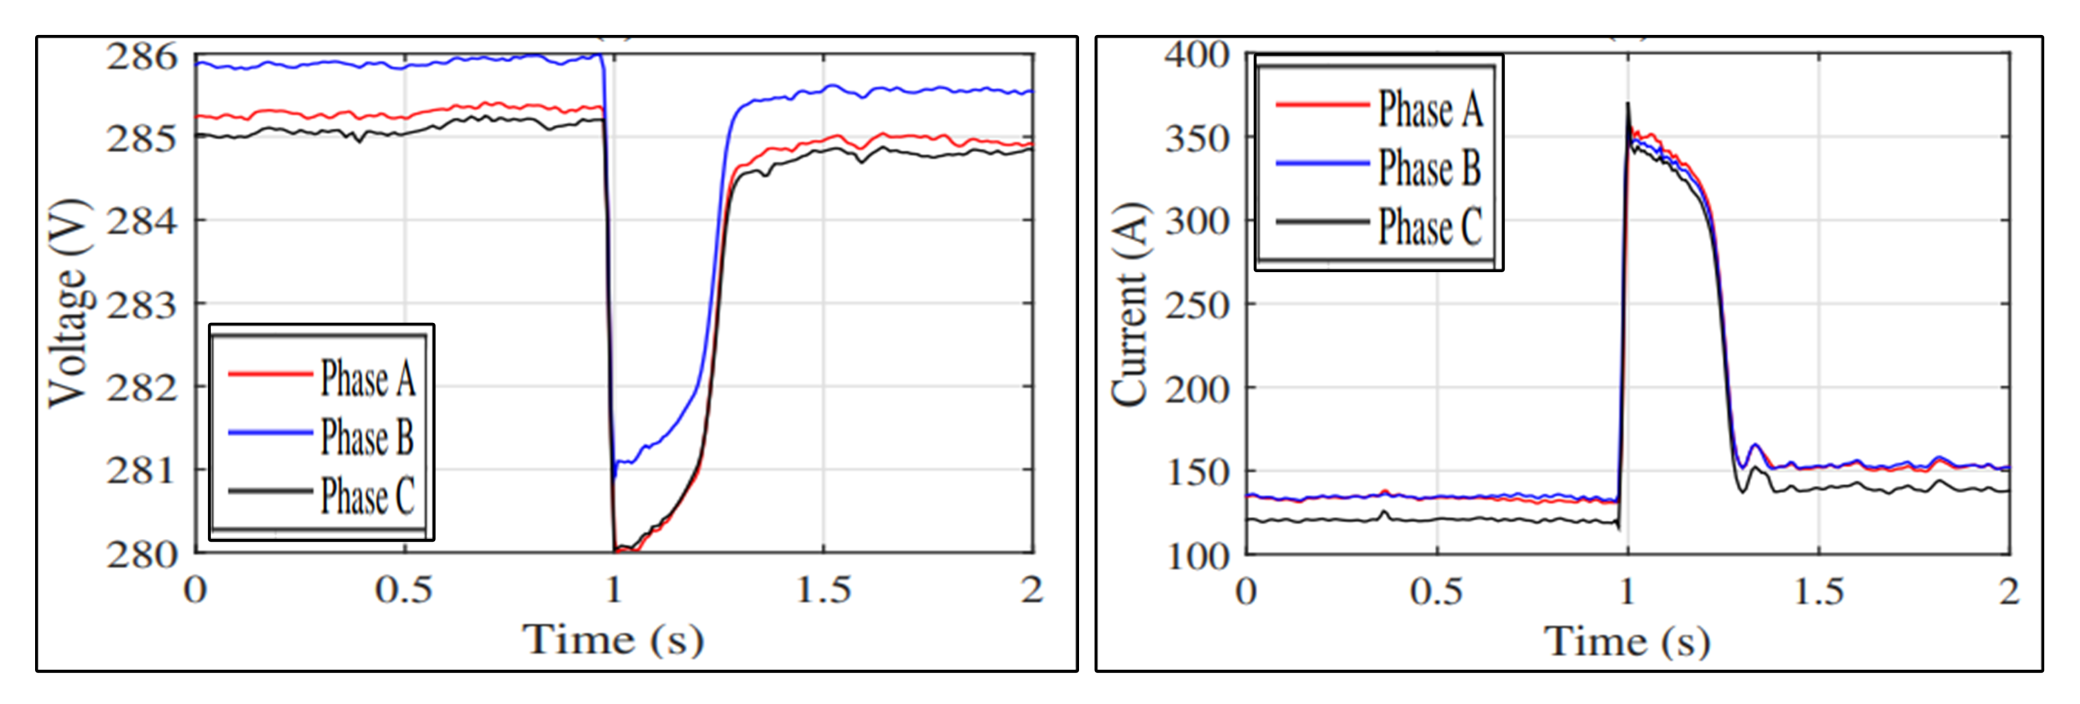
The event considered for validation is the DG switch-on event, as the real data available in the literature are for this event. Soon after the DG is switched on, the node voltage per phase drops a little bit from the initial conditions and settles down to a comparatively lower value than the initial values per phase, whereas the currents overshoot to a high value and settle down to a slightly higher value than the initial line current magnitude. The generated DG-switching event in Figure 56 is validated using the DG-switching event captured in [40]. The real μPMU observations are shown in Figure 57. The results are more or less close to the published real μPMU values.

5.4. Other Events

The remaining events are validated based on the fluctuations in load flow in the upstream and downstream μPMUs of the respective component because comprehensive observations of these events are not fully captured in the literature with regard to measurements of node voltage and line current. The validated data shows their applicability in developing and testing dedicated real-time DCC operational support applications for event detection, classification, and localization. This will help DCC operators with their daily planned and unplanned operations, as well as improving network reliability indices.

6. Experimental Use Case Test

To demonstrate the applicability of generated realistic μPMU data, a preliminary experimental study was carried out with the most relevant real-time use case.

Use Case: Event Classification

The real-time use case experimented in this section is the classification of an event that happened in the network. The experiment is to detect no-fault and fault events utilizing the μPMUs data collected from the network. For this investigation, the line currents measured by the μPMUs are utilized. The below-mentioned basic algorithm is used to classify the events:
Step 1: Calculate the minimum short circuit currents (MSCC) of the network per phase.
Step 2: If the line currents measured by the master μPMU (μPMU1) per phase are greater than or equal to the MSCC of any phase, and if any of the μPMU measures a line current greater than 0.5 p.u. (threshold) for a duration of more than 20 ms or 0.020 s (this time duration is selected for use case test purposes only), then it is a “fault event”; otherwise, it is a “no-fault event”.
The MSCC of phases A, B, and C are 0.2834 p.u., 0.2503 p.u., and 0.2343 p.u., respectively. Three-event data, such as tap changer (VR1), capacitor switching (844), and phase-to-ground fault (at 99.99% of line section “m” with 20 ohms), are used to test the data-driven approach. The results of these tests are shown in Table 9. The results show that the per-unit values of the line currents per phase for the tap changer and capacitor-switching events do not satisfy the conditions of the fault event, as the values do not touch the defined thresholds.

7. Conclusions

Realistic μPMU data generation for various real-time events in an unbalanced DN was successfully implemented using DP software. Realistic data were produced using real-time experience and combining μPMU elements in DP settings to fulfill the objectives of steady-state and dynamic data generation in an unbalanced benchmark DN. All potential real-time occurrences in the actual DN are covered by the created data, and the parameter variations are observed from their respective plots. Researchers can use this method to generate realistic data by reproducing the μPMU effect on the generated data because obtaining the original μPMU data can be difficult for a variety of reasons. Research and data-gathering times are reduced as a result. Additionally, realistic and useful data that match the replicated μPMU data are made available. This project’s primary goal was to use the generated data for various μPMU use cases, including event detection, classification, and localization. Future studies will examine several studies to increase the usability of the data in research projects and incorporate various data quality issues into the generated data.

Author Contributions

Conceptualization, A.H.M.I.; methodology, A.H.M.I.; software, A.H.M.I.; validation, A.H.M.I.; formal analysis, M.S.; investigation, A.H.M.I.; resources, V.S.R.; data curation, A.H.M.I.; writing—original draft preparation, A.H.M.I.; writing—review and editing, M.S. and V.S.R.; visualization, V.S.R.; supervision, M.S. and V.S.R.; project administration, M.S.; funding acquisition, V.S.R. All authors have read and agreed to the published version of the manuscript.

Funding

This research was funded by the Transnational Access program of the EU H2020 ERIGrid 2.0 project with grant agreement number 870620.

Data Availability Statement

The data and functional details presented in this study are available upon request from the corresponding author.

Acknowledgments

The authors are thankful to W. H. Kersting for his email assistance in the perfect modeling of the IEEE 34 test feeder and associated load flow analysis validations in DIgSILENT PowerFactory. The researchers would like to acknowledge the Intelligent Electrical Power Grids Group at Technische Universiteit Delft in the Netherlands, as well as their technical and administrative staff, for their assistance and direction in remotely accessing the lab facilities.

Conflicts of Interest

The authors declare that there are no potential conflict of interest in the research, authorship, or publication of this article.

Abbreviations

The following abbreviations are used in this manuscript:
μPMU Micro-Phasor Measurement Unit
DER Distributed Energy Resources
DN Distribution Network
ROCOF Rate of Change of Frequency
DP DIgSILENT PowerFactory
SCADA Supervisory Control and Data Acquisition
RTU Remote Terminal Unit
GPS Global Positioning System
DCC Distribution Control Centre
DG Distributed Generation
LV Low Voltage
DT Distribution Transformer
OHL Overhead Lines
IEEE Institute of Electrical and Electronics Engineers
PES Power and Energy Society
DSAC Distribution System Analysis Committee
NR Newton–Raphson
CSORI Complete System Observability Redundancy Index
CI Cost Index
CB Circuit Breaker
US Upstream
DS Downstream
XF10 Line Transformer
S Capacitor Shunt Capacitor
SL Spot Load
DL Distributed Load
MCB Miniature Circuit Breaker
MSCC Minimum Short Circuit Current

Appendix A

Table A1. Line section representation for IEEE 34 node model in DIgSILENT Powerfactory.
Line SectionNode (i)Node (j)
A800802
B802802’
C802’806
D806808
E808812
F812814
GRG10850
H850816
I816816’
J816’824
K824824’
L824’828
M828828’
N828’830
O830854
P854852
QRG11832
R832832’
S832’858
T858858’
U858’834
V834834’
W834’860
X860860’
Y860’836
Z836836’
a836’840
b808808’
c808’810
d816818
e818818’
f818’820
g820820’
h820’822
i824824’
j824’826
k854854’
l854’856
m888890
n858858’
o858’864
p834842
q842842’
r842’844
s844844’
t844’846
u846846’
v846’848
w836862
x862862’
y862’838
Table A2. Load flow results from DP model (node voltages and angles per phase).
NodeUln, Magnitude
A (p.u.)
Uln, Magnitude
B (p.u.)
Uln, Magnitude
C (p.u.)
Uln, Angle A
(deg)
Uln, Angle B
(deg)
Uln, Angle C
(deg)
8021.0471.0481.048−0.05−120.06119.95
8061.0461.0471.047−0.09−120.11119.91
8081.0141.031.029−0.75−120.95119.3
810 1.03 −120.95
8120.9761.011.007−1.58−121.92118.58
8140.9470.9950.989−2.27−122.7118.01
8161.0171.0251.02−2.28−122.71118
8181.016 −2.28
8200.99 −2.3
8220.99 −2.35
8241.0081.0161.012−2.39−122.93117.75
826 1.016 −122.94
8281.0071.0151.011−2.4−122.95117.73
8300.9890.9980.994−2.66−123.39117.23
8321.0361.0351.036−3.14−124.18116.32
8341.0311.031.031−3.27−124.38116.07
8361.031.0291.031−3.26−124.38116.07
838 1.029 −124.39
8401.031.0291.031−3.26−124.38116.07
8421.0311.031.031−3.27−124.38116.06
8441.0311.0291.031−3.29−124.41116.03
8461.0311.0291.031−3.33−124.45115.97
8481.0311.0291.031−3.34−124.45115.96
8501.0181.0261.02−2.27−122.7118.01
8520.9580.9680.964−3.14−124.18116.32
8540.9890.9980.993−2.66−123.4117.22
856 0.998 −123.41
8581.0331.0321.034−3.2−124.27116.21
8601.031.0291.031−3.26−124.38116.06
8621.031.0291.031−3.26−124.38116.07
8641.033 −3.2
8880.9990.9991−4.67−125.73114.8
8900.9170.9230.918−5.15−126.79113.91
DG802_BB000000
DG840_BB000000
DG848_BB000000
DG850_BB000000
DG852_BB000000
DG862_BB000000
RG101.0181.0261.02−2.27−122.7118.01
RG111.0361.0351.036−3.14−124.18116.32
RG111.0361.0351.036−3.1−124.2116.3
Table A3. Load flow results from DP model (line currents and angles per phase).
Line SectionPhase Current,
Magnitude A (A)
Phase Current,
Magnitude B (A)
Phase Current,
Magnitude C (A)
Phase Current,
Angle A (deg)
Phase Current,
Angle B (deg)
Phase Current,
Angle C (deg)
A51.644.640.9−12.74−127.67117.32
B51.644.640.9−12.79−127.73117.26
C51.642.539.2−12.81−126.78118.48
D51.642.539.2−12.83−126.8118.46
E51.841.339.3−13.46−127.07117.71
F5241.339.3−14.18−127.97116.85
G48.54038.2−14.73−128.67116.18
H48.54038.2−14.73−128.67116.18
I35.84038.2−10.43−128.67116.17
J35.939.838−10.57−128.87116.31
K35.936.938−10.7−127.36116.19
L35.936.937.8−10.72−127.37116.38
M35.936.937.8−10.73−127.38116.37
N35.436.937.8−10.79−127.64116.14
O34.236.236.5−9.98−127.44116.21
P34.235.936.5−9.99−127.69116.2
Q31.833.634−11.01−128.63115.35
R21.323.424.30.44−116.87128.32
S20.923.1240.95−116.27128.54
T20.723.1240.98−116.37128.45
U20.322.423.22.3−115.92130.14
V11.29.110.6−43.07−154.8299.32
W5.97.75.3−33.49−156.4186.22
X4.263.6−30.2−154.6390.23
Y1.54.41.7−18.98−150.4768.5
Z1.52.31.7−20.02−151.9767.98
a0.80.80.8−40.72−161.8178.55
b 1.2 −144.6
c 0 −30.95
d13 −26.66
e13 −26.74
f10.5 −27.6
g10.6 −28.96
h0.1 87.67
i 3.1 −148.91
j 0 −32.94
k 0.3 −98.38
l 0.1 −33.41
m69.97069.5−32.3−152.7487.37
n0.1 −22.8
o0 86.8
p14.716.315.134.63−95.6151.02
q14.716.315.134.62−95.61151.01
r14.516.315.137.11−95.64150.97
s9.89.49.478.83−63.85−170.68
t9.89.49.878.8−52.49−161.91
u9.89.49.878.76−52.53−161.94
v9.89.89.878.75−42.46−161.95
w02.1090.43−149.37−150.76
x 2.1 −149.49
y 0 −34.39
Table A4. List of realistic real-time events generated using DP in the test feeder.
Sl. NoEvent Execution Time(s) on
21 August 2022 11:00 AM
Event Description *Event LocationEvent Category
140.05Unbalanced Voltage complaint from SL 890SL 890Unbalanced voltage
252.05Rectification of Unbalanced Voltage from SL 890SL 890Unbalanced voltage rectification
354XF10 DE-ENERGIZED for MaintenanceXF10Transformer outage
474VR2 Tap Lowered (13-11-12 to 12-10-11)VR2Tap changer event
594VR2 Tap Lowered (12-10-11 to 11-09-10)VR2Tap changer event
6114VR2 Tap Lowered (11-09-10 to 10-08-09)VR2Tap changer event
7134VR2 Tap Lowered (10-08-09 to 09-07-08)VR2Tap changer event
8154VR2 Tap Lowered (09-07-08 to 08-06-07)VR2Tap changer event
9174Cap844 Switch OffS Capacitor 1Capacitor bank event
10194DG848 Switch OnDG848DG-switching event
11214C-G Fault 20ohm Temporary Fault at AATemporary fault event
12214.04Main Feeder Circuit Breaker Tripped on C-G FaultMain Feeder Circuit BreakerCB trip event
13214.135C-G Temporary Fault ClearedAFault clearing
14234.185Main Feeder Circuit Breaker ReclosedACB-switching event
15254.185Heavy Load 844 (3PH) Switch OffSL 844Load trip event
16274.185B-N Jumper Parted OpenCircuit Flt808-810808-810 B-N JumperOpen circuit fault event
17294.185XF10 ENERGIZED After MaintenanceXF10Transformer energization
18314.185DG848 Switch OffDG848DG-switching event
19334.1853Phase Short-Circuit Fault 10 ohms at GGShort circuit fault event
20334.225Main Feeder Circuit Breaker Tripped on ABC SC FaultMain Feeder Circuit BreakerCB trip event
21354.225Fault Rectified and Cable Kept in ServiceGFault Clearing
22374.225Main Feeder Circuit Breaker Closed_1Main Feeder Circuit BreakerCB-switching event
23394.225DG840 Switch OnDG840DG-switching event
24414.225ABC Short-Circuit Fault 10 ohm at G DG840GShort circuit fault event
25414.265Main Feeder Circuit Breaker Tripped on ABC SC wDG840Main Feeder Circuit BreakerCB trip event
26434.265Fault Rectified and Cable Kept in SrvcGFault clearing
27454.265Main Feeder Circuit Breaker Closed_2Main Feeder Circuit BreakerCB-switching event
28474.265VR1 Tap Lowered (12-05-05 to 13-06-06)VR1Tap changer event
29494.265DG840 Switch OffDG840DG-switching event
30514.265A-B Fault 10ohms at OOShort circuit fault event
31514.305Main Feeder Circuit Breaker Tripped on A-B FaultMain Feeder Circuit BreakerCB trip event
32534.048Fault Rectified and Cable Kept in SRVCOFault clearing
33554.048Main Feeder Circuit Breaker Closed_3Main Feeder Circuit BreakerCB-switching event
34574.048Customer requested outage at SL848SL 848Load-switching event
35594.048Cap 848 Switch OffS Capacitor 2Capacitor bank Event
36614.048OHL section D De-energized 4 Jumper ConnectionDLine De-energization
37634.048OHL section E De-energized 4 Jumper ConnectionELine energization
38654.048B-N Jumper 808-810 Connected808-810 B-N JumperOHL jumper connection
39674.048OHL section E Connected for engznELine energization
40694.048OHL section D Connected and Svc restd2alDLine energization
41714.048DG852 Switched OnDG852DG-switching event
42734.048A_G Fault at AAShort circuit fault event
43734.088DG852 Tripped on A-G FaultCBDG trip event
44734.128Main Feeder Circuit Breaker Tripped on A-G FaultMain Feeder Circuit BreakerCB trip event
45754.128Fault Rectified and Cable Kept in SVCAFault clearing
46774.128Main Feeder Circuit Breaker Closed_4ACB-switching event
47794.128B-C Jumper OP between 834-842pOHL jumper opening
48814.128B_C Fault at ppShort circuit fault event
49814.168Main Feeder Circuit Breaker Tripped on BC SC FaultMain Feeder Circuit BreakerCB trip event
50834.168SC Fault ClearedpFault Clearing
51854.168Jumper Closed 834 to 842JumperOHL jumper connection
52874.168Main Feeder Circuit Breaker Closed_5Main Feeder Circuit BreakerCB-switching event
53894.168DG 850 Switched OnDG850DG-switching event
54914.168BCN Load Trip EventDL 802-806Load trip event
55934.168A-B-G Fault at FFShort circuit fault event
56934.208DG850 TrippedDG850DG trip event
57934.248Main Feeder Circuit Breaker tripped on A-B-G FaultMain Feeder Circuit BreakerCB trip event
58954.248A-B-G Fault ClearedFFault clearing
59974.248Main Feeder Circuit Breaker Closed_6Main Feeder Circuit BreakerCB-switching event
60994.248C-phase of DL 834-860 TrippedDL 834-860Load trip event
611014.248MCB of C-phase Closed for DL 834-860DL 834-860Load-switching event
621034.248DG802 Switched OnDG802DG-switching event
631054.248DG840 Switched On Generation IncreasedDG840DG-switching event
641074.248ABCN-G Fault at LLShort circuit fault event
651074.288DG840 TrippedDG840DG trip event
661074.328DG802 TrippedDG802DG trip event
671074.368Main Feeder Circuit Breaker Tripped on ABCG FaultMain Feeder Circuit BreakerCB trip event
681094.368ABCG Fault ClearedLFault Clearing
691114.368Main feeder Circuit Breaker Closed07Main Feeder Circuit BreakerCB-switching event
701134.3682 PH YN load Switched On (DL 802-806)DL 802-806Load-switching event
711154.3682 PH YN load Switched Off (DL 844-846)byCDL 844-846Load-switching event
721174.3682 PH YN load Switched On (DL 844-846)by CDL 844-846Load-switching event
731194.368B-G Fault 10 ohms at mmShort circuit fault event
741194.408XF10 TrippedXF10Transformer trip event
751214.408B-C-G Fault 10 ohms at qqShort circuit fault event
761214.448Main Feeder Circuit Breaker Tripped on B-C-G FaultMain Feeder Circuit BreakerCB trip event
771234.448B-C-G Fault ClearedqFault Clearing
781254.448Main Feeder Circuit Breaker Closed_8Main Feeder Circuit BreakerCB-switching event
791274.448A-N load Switch Off (DL 820-822)DL 820-822Load-switching event
801294.448C-A Fault 10 ohms at BBShort circuit fault event
811294.488Main Feeder Circuit Breaker Tripped on C-A FaultMain Feeder Circuit BreakerCB trip event
821314.488C-A Fault ClearedBFault clearing
831334.488Main Feeder Circuit Breaker Closed_9Main Feeder Circuit BreakerCB-switching event
841354.488B-G Fault Cleared at mmFault clearing
851374.488XF10 Switched OnXF10Transformer energization
861394.488DG852 Switch OnDG852DG-switching event
871414.488VR2 Tap Raised (08-06-07 to 09-07-08)VR2Tap changer event
881434.488VR2 Tap Raised (09-07-08 to 10-08-09)VR2Tap changer event
891454.488VR2 Tap Raised (10-08-09 to 11-09-10)VR2Tap changer event
901474.488VR2 Tap Raised (11-09-10 TO 12-10-11)VR2Tap changer event
911494.488VR2 Tap Raised (12-10-11 to 13-11-12)VR2Tap changer event
921514.488DG852 Switch OffDG852DG-switching event
931534.488C-A-G Fault 10 ohms at AAShort circuit fault event
941534.528Main Feeder Circuit Breaker Tripped on C-A-G FaultMain Feeder Circuit BreakerCB trip event
951554.528C-A-G Fault Cleared at AAFault clearing
961574.528Main Feeder Circuit Breaker ClosedMain Feeder Circuit BreakerCB-switching event
971594.528A-N load Switch On (DL 820-822)DL 820-822Load-switching event
981614.528C-G Fault 10 ohms at AAShort circuit fault event
991614.568Main Feeder Circuit Breaker Tripped onC-G FaultMain Feeder Circuit BreakerCB trip event
1001634.568C-G Fault cleared at AAFault clearing
1011654.568Main Feeder Circuit Breaker ClosedMain Feeder Circuit BreakerCB-switching event
1021674.568Low Voltage Complaint from SL 890SL 890LV complaint
1031694.568VR1 Tap Raised (13-06-06 to 14-07-07)VR1Tap changer event
1041714.568VR1 Tap Raised (14-07-07 to 15-08-08)VR1Tap changer event
1051734.568SL 890 Energized after V regulationSL 890Load-switching event
1061740.568Cap844 Switch OnS Capacitor 1Capacitor bank event
1071746.025SL 844 Switch OnSL 844Load-switching event
1081777.123SL 848 Switch OnSL 848Load-switching event
1091799.001Cap848 Switch OnS Capacitor 2Capacitor bank event
* A, B, C, N, and G are Phases A, B, C, Neutral, and Ground respectively.

Appendix B

Figure A1. Load flow basic settings.
Energies 16 03842 g0a1
Figure A2. Load flow iteration control settings.
Energies 16 03842 g0a2
Figure A3. RMS Simulation basic settings.
Energies 16 03842 g0a3
Figure A4. Data generation step size settings1.
Energies 16 03842 g0a4
Figure A5. Data generation step size settings2.
Energies 16 03842 g0a5
Figure A6. Run Simulation Settings.
Energies 16 03842 g0a6

References

  1. Von Meier, A.; Stewart, E.; McEachern, A.; Andersen, M.; Mehrmanesh, L. Precision μ-Synchrophasors for Distribution Systems: A Summary of Applications. IEEE Trans. Smart Grid 2017, 2, 2926–2936. [Google Scholar] [CrossRef]
  2. Dusabimana, E.; Yoon, S.-G. A Survey on the μ-Phasor Measurement Unit in Distribution Networks. Energies 2020, 9, 305. [Google Scholar] [CrossRef]
  3. Shahsavari, A.; Farajollahi, M.; Stewart, E.M.; Cortez, E.; Mohsenian-Rad, H. Situational Awareness in Distribution Grid Using μPMU Data: A Machine Learning Approach. IEEE Trans. Smart Grid 2019, 10, 6167–6177. [Google Scholar] [CrossRef]
  4. Energy Technologies Area. Available online: https://eta-publications.lbl.gov/sites/default/files/lbnl-1006408_open_uμPMU_ieee_oct2016.pdf (accessed on 13 November 2022).
  5. Haridas, R.P. GPS Based Phasor Technology in Electrical Power System. IJEEE 2014, 3, 493–496. [Google Scholar] [CrossRef]
  6. Power Standards Lab. Introduction to μPMU. Available online: www.powerstandards.com$/wpcontent/uploads/dlm_uploads/2017/10/$Introduction-to-μμPMU.pdf (accessed on 13 November 2022).
  7. Lee, L.; Centeno, V. Comparison of mμPMU and μPMU. In Proceedings of the Clemson University Power Systems Conference (PSC), Charleston, SC, USA, 4–7 December 2018; pp. 1–6. [Google Scholar]
  8. Kummerow, A.; Rösch, D.; Monsalve, C.; Nicolai, S.; Bretschneider, P.; Brosinsky, C.; Westermann, D. Challenges and Opportunities for Phasor Data Based Event Detection in Transmission Control Centers under Cyber Security Constraints. In Proceedings of the 2019 IEEE Milan PowerTech, Milan, Italy, 23–27 June 2019; pp. 1–6. [Google Scholar]
  9. Sajan, K.S.; Bariya, M.; Basak, S.; Srivastava, A.; Dubey, A.; von Meier, A.; Biswas, G. Realistic Synchrophasor Data Generation for Anomaly Detection and Event Classification. In Proceedings of the 2020 8th Workshop on Modeling and Simulation of Cyber-Physical Energy Systems, Sydney, NSW, Australia, 21 April 2020; pp. 1–6. [Google Scholar]
  10. Shahsavari, A.; Farajollahi, M.; Stewart, E.; Roberts, C.; Megala, F.; Alvarez, L.; Cortez, E.; Mohsenian-Rad, H. Autopsy on active distribution networks: A data-driven fault analysis using μPMU data. In Proceedings of the 2017 North American Power Symposium (NAPS), Morgantown, WV, USA, 17–19 September 2017; pp. 1–7. [Google Scholar]
  11. Aligholian, A.; Shahsavari, A.; Stewart, E.M.; Cortez, E.; Mohsenian-Rad, H. Unsupervised Event Detection, Clustering, and Use Case Exposition in μPMU Measurements. IEEE Trans. Smart Grid 2021, 12, 3624–3636. [Google Scholar] [CrossRef]
  12. Soltani, Z.; Khorsand, M. Real-Time Topology Detection and State Estimation in Distribution Systems Using μPMU and Smart Meter Data. IEEE Syst. J. 2022, 16, 3554–3565. [Google Scholar] [CrossRef]
  13. Khaledian, P.; Mohsenian-Rad, H. Automated Event Region Identification and Its Data-Driven Applications in Behind-the-Meter Solar Farms Based on μPMU Measurements. IEEE Trans. Smart Grid 2022, 13, 2094–2106. [Google Scholar] [CrossRef]
  14. Bu, F.; Dehghanpour, K.; Wang, Z. Enriching Load Data Using μPMUs and Smart Meters. IEEE Trans. Smart Grid 2021, 12, 5084–5094. [Google Scholar] [CrossRef]
  15. Shahsavari, A.; Farajollahi, M.; Stewart, E.; von Meier, A.; Alvarez, L.; Cortez, E.; Mohsenian-Rad, H. A data-driven analysis of capacitor bank operation at a distribution feeder using μPMU data. In Proceedings of the 2017 IEEE Power & Energy Society Innovative Smart Grid Technologies Conference (ISGT), Washington, DC, USA, 23–26 April 2017; pp. 1–5. [Google Scholar]
  16. Farajollahi, M.; Shahsavari, A.; Stewart, E.M.; Mohsenian-Rad, H. Locating the Source of Events in Power Distribution Systems Using μPMU Data. IEEE Trans. Power Syst. 2018, 33, 6343–6354. [Google Scholar] [CrossRef]
  17. Zhang, Y.; Wang, J.; Khodayar, M.E. Graph-Based Faulted Line Identification Using μPMU Data in Distribution Systems. IEEE Trans. Smart Grid 2020, 11, 3982–3992. [Google Scholar] [CrossRef]
  18. Sanitha, G.; Shereef, R.M. μPMU data based location identification and classification of events. In Proceedings of the 2020 IEEE International Conference on Power Electronics, Smart Grid and Renewable Energy (PESGRE2020), Cochin, India, 2–4 January 2020; pp. 1–6. [Google Scholar]
  19. Duan, N.; Stewart, E.M. Frequency Event Categorization in Power Distribution Systems Using μPMU Measurements. IEEE Trans. Smart Grid 2020, 11, 3043–3053. [Google Scholar] [CrossRef]
  20. Stewart, E.M.; Kiliccote, S.; Shand, C.M.; McMorran, A.W.; Arghandeh, R.; von Meier, A. Addressing the challenges for integrating micro-synchrophasor data with operational system applications. In Proceedings of the 2014 IEEE PES General Meeting & Exposition, National Harbor, MD, USA, 27–31 July 2014; pp. 1–5. [Google Scholar]
  21. Jacob, R.A.; Paul, S.; Li, W.; Chowdhury, S.; Gel, Y.R.; Zhang, J. Reconfiguring Unbalanced Distribution Networks using Reinforcement Learning over Graphs. In Proceedings of the 2022 IEEE Texas Power and Energy Conference (TPEC), College Station, TX, USA, 28 February–1 March 2022; pp. 1–6. [Google Scholar]
  22. Dashti, R.; Ghasemi, M.; Daisy, M. Fault location in power distribution network with presence of distributed generation resources using impedance based method and applying π line model. Energy 2018, 159, 344–360. [Google Scholar] [CrossRef]
  23. Haleem, A.M.I.; Sharma, M.; Sajan, K.S.; Babu, K.N.D. A Comparative Review of Fault Location/Identification Methods in Distribution Networks. In Proceedings of the 2018 1st International Conference on Advanced Research in Engineering Sciences (ARES), Dubai, United Arab Emirates, 15 June 2018; pp. 1–6. [Google Scholar]
  24. Kersting, W. Radial distribution test feeders. IEEE Trans. Power Syst. 2001, 2, 908–912. [Google Scholar]
  25. Radial Distribution Test Feeders. Available online: http://ewh.ieee.org/soc/pes/dsacom/testfeeders.html (accessed on 13 November 2022).
  26. Digsilent Powerfactory 2022 Technical References. Available online: https://www.digsilent.de/en/powerfactory-download.html?folder=files%2Fdownloads%2Fprivate%2F10_PowerFactory%2F10_PowerFactory_2022%2F70_Technical+References (accessed on 13 November 2022).
  27. IEEE. IEEE Tutorial Course on Distribution Automation; 88 EH0280-8 PWR; IEEE Power Engineering Society: Piscataway, NJ, USA, 1988. [Google Scholar]
  28. IEEE. IEEE Tutorial Course on Power Distribution Planning; 92 EHO 381-6 PWR; IEEE Power Engineering Society: Piscataway, NJ, USA, 1992. [Google Scholar]
  29. Birt, K.A.; Graffy, J.J.; McDonald, J.D.; El-Abiad, A.H. Three phase load flow program. IEEE Trans. Power Appar. Syst. 1976, 952, 59–65. [Google Scholar] [CrossRef]
  30. Chen, T.H.; Chen, M.S.; Hwang, K.-J.; Kotas, P.; Chebli, E.A. Distribution system power flow analysis-A rigid approach. IEEE Trans. Power Deliv. 1991, 6, 1146–1152. [Google Scholar] [CrossRef]
  31. Chen, T.H.; Chen, M.S.; Inoue, T.; Chebli, E.A. Three-phase cogenerator and transformer models for distribution system analysis. IEEE Trans. Power Deliv. 1991, 6, 1671–1681. [Google Scholar] [CrossRef]
  32. Lin, W.M.; Teng, J.H. Three-phase distribution network fast decoupled power flow solution. Int. J. Elect. Power Energy Syst. 2000, 5, 375–380. [Google Scholar] [CrossRef]
  33. Teng, J.-H.; Chang, C.-Y. A novel and fast three-phase load flow for unbalanced radial distribution systems. IEEE Trans. Power Syst. 2002, 17, 1238–1244. [Google Scholar] [CrossRef]
  34. Kotha, S.K.; Rajpathak, B.; Ramesh, B.; Khedkar, M.K. Optimal Placement of μPMUs for Real-time Monitoring of Inter-Connected Smart Distribution Networks. In Proceedings of the 2nd Asian Conference on Innovation in Technology (ASIANCON), Ravet, India, 26–28 August 2022; pp. 1–5. [Google Scholar]
  35. Tahabilder, A.; Ghosh, P.K.; Chatterjee, S.; Rahman, N. Distribution system monitoring by using μPMU in graph theoretic way. In Proceedings of the 2017 4th International Conference on Advances in Electrical Engineering (ICAEE), Dhaka, Bangladesh, 28–30 September 2017; pp. 159–163. [Google Scholar]
  36. Chen, X.; Chen, T.; Tseng, K.J.; Sun, Y.; Amaratunga, G. Hybrid approach based on global search algorithm for optimal placement of μPMU in distribution networks. In Proceedings of the 2016 IEEE Innovative Smart Grid Technologies—Asia (ISGT-Asia), Melbourne, VIC, Australia, 28 November–1 December 2016; pp. 559–563. [Google Scholar]
  37. Jamil, E.; Rihan, M.; Anees, M.A. Towards optimal placement of phasor measurement units for smart distribution systems. In Proceedings of the 2014 6th IEEE Power India International Conference (PIICON), Delhi, India, 5–7 December 2014; pp. 1–6. [Google Scholar]
  38. Silva, J.A.; Funmilayo, H.B.; Bulter-Purry, K.L. Impact of Distributed Generation on the IEEE 34 Node Radial Test Feeder with Overcurrent Protection. In Proceedings of the 2007 39th North American Power Symposium, Las Cruces, NM, USA, 30 September–2 October 2007; pp. 49–57. [Google Scholar]
  39. Short, T.A. Electric Power Distribution Handbook, 2nd ed.; CRC Press: Boca Raton, FL, USA, 2014. [Google Scholar]
  40. Shahsavari, A. Data-Driven Analysis of Power Distribution Synchrophasors with Applications to Situational Awareness, Load Modeling, and Reliability. Ph.D. Thesis, University of California, Riverside, CA, USA, September 2019. [Google Scholar]
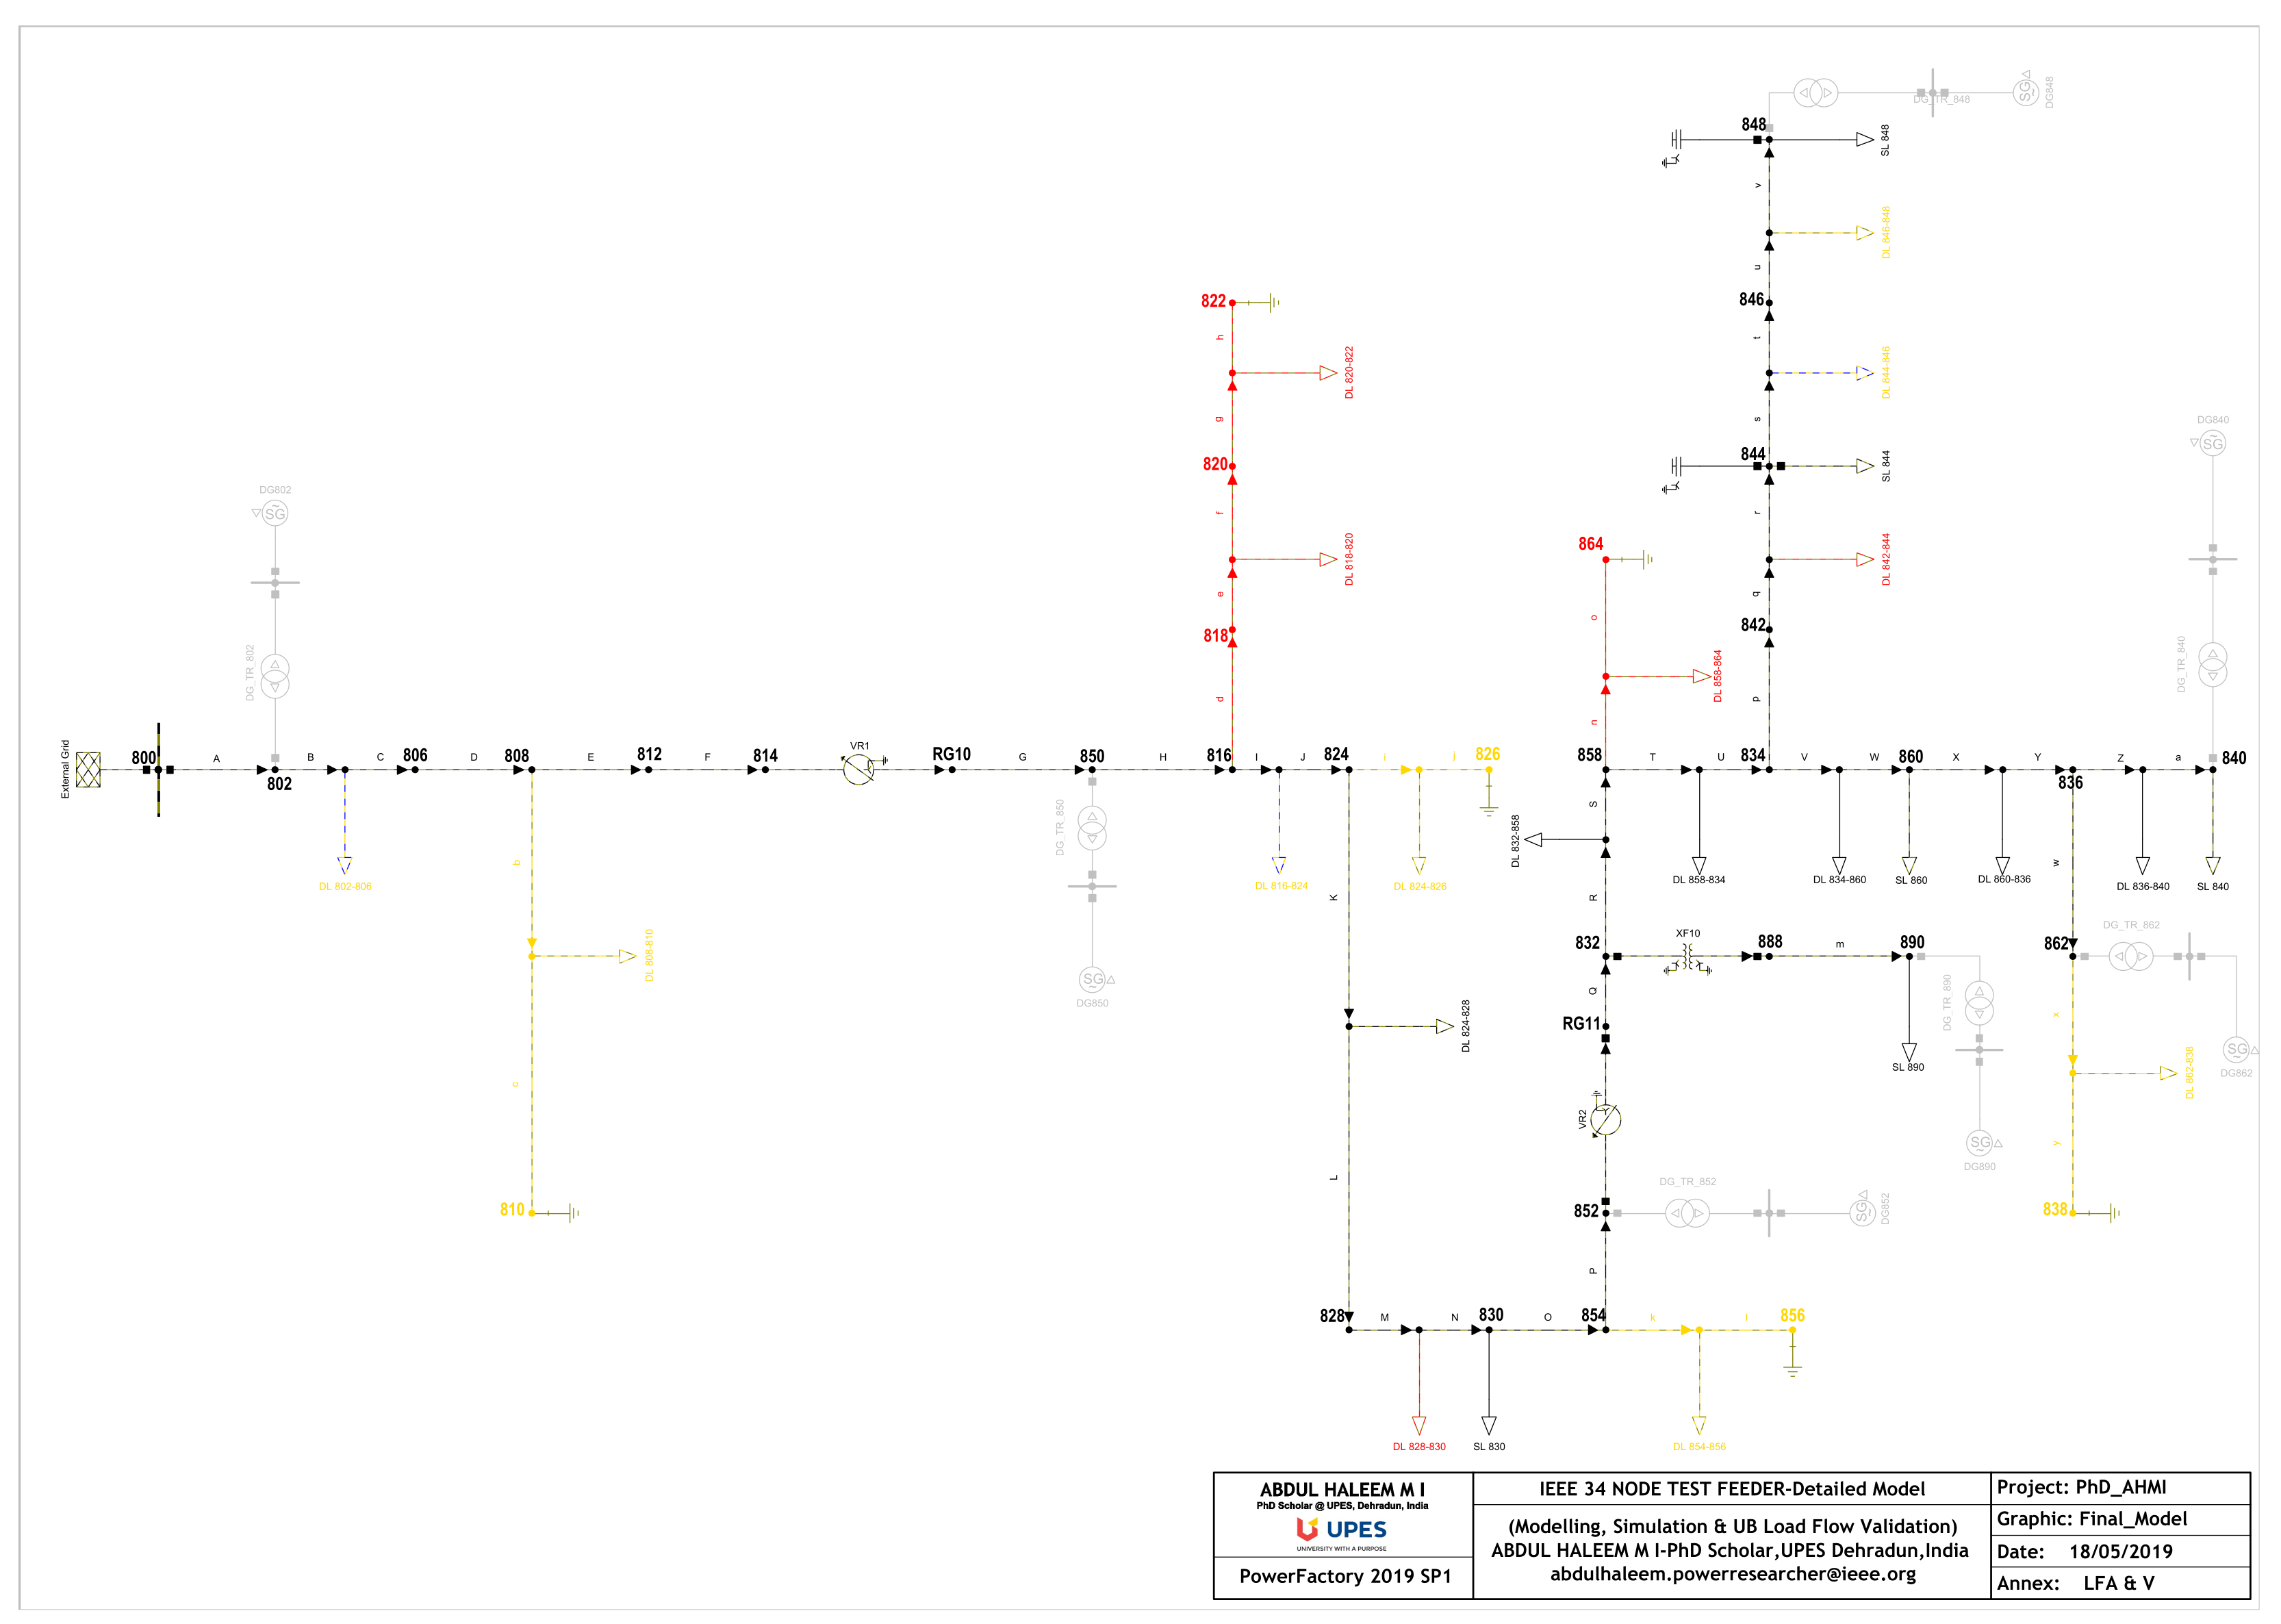
Figure 1. IEEE 34 node feeder modeled in DIgSILENT PowerFactory.
Energies 16 03842 g001
Figure 2. Optimal μPMU locations in the test feeder.
Energies 16 03842 g002
Figure 47. Capacitor bank switch-off event (voltage variations).
Energies 16 03842 g047
Figure 48. Capacitor bank switch-off event (current variations).
Energies 16 03842 g048
Figure 49. Capacitor bank switch-off event: voltage and current variations validation using real μPMU data [15].
Energies 16 03842 g049
Figure 50. Capacitor bank switch-on event (voltage magnitude).
Energies 16 03842 g050
Figure 51. Capacitor bank switch-on event (current magnitude).
Energies 16 03842 g051
Figure 52. Capacitor bank switch-on event (voltage and current magnitude) validation using real μPMU data [15].
Energies 16 03842 g052
Figure 53. B-G fault, trip, CB open, and reclose events observed upstream.
Energies 16 03842 g053
Figure 54. B-G fault, trip, CB open, and reclose events observed downstream.
Energies 16 03842 g054
Figure 55. B-G fault, trip, CB open, and reclose events observed at upstream (a,b) and downstream (c,d) (voltage and current magnitude) [10].
Energies 16 03842 g055
Figure 56. DG-switching event (voltage and current variations).
Energies 16 03842 g056
Figure 57. DG-switching event observed by the real μPMU [40].
Energies 16 03842 g057
Table 1. Line to neutral voltage error deviation from the IEEE published results.
A-N Voltage *B-N Voltage *C-N Voltage *
Minimum Error−0.0021−0.0007−0.0002
Maximum Error0.00020.00040.0006
Average Error−0.00010.00010.0000
* per unit.
Table 2. Line-to-neutral angle error deviation from the IEEE published results.
A-N Angle *B-N Angle *C-N Angle *
Minimum Error−0.0091−0.0001−0.0006
Maximum Error0.07370.00000.0000
Average Error0.00950.0000−0.0001
* degree.
Table 3. Line current error deviation from the IEEE published results.
Line A *Line B *Line C *
Minimum Error−0.0256−0.0067−0.0020
Maximum Error0.28570.03220.0285
Average Error0.01110.00200.0017
* Ampere (A).
Table 4. Line current angle error deviation from the IEEE published results.
Line A Current Angle *Line B Current Angle *Line C Current Angle *
Minimum Error−0.0004−0.0029−0.0128
Maximum Error0.00140.00040.0004
Average Error0.00000.0000−0.0003
* degree.
Table 5. Load flow results from DP model vs. IEEE published results (in brackets).
Active Power (kW)Reactive Power (kVAr)% Error
Total System Input2043.13 (2042.872)290.47 (290.258)kW = 0.0001 kVAr = 0.0007
Total Load *1769.66 (1769.824)1051.47 (1051.547)kW = 0.0000 kVAr = 0.0000
Total Losses273.47 (273.049)35.28 (34.999)kW = 0.0015 kVAr = 0.0080
* Total Power factor = 0.86 (0.8597).
Table 6. Investigations on optimal μPMU placements in IEEE 34 node feeder.
MethodApproachNo. of μPMUsOptimal Locations
[34]Deployment cost minimization12802, 810, 814, 820, 824, 834, 838, 840, 846, 854, 864, and 888
Full system observability12 *802, 808, 820, 824, 834, 836, 846, 850, 854, 858, 862, and 888
[35]Full system observability12802, 808, 814, 820, 824, 834, 836, 846, 854, 858, 862, and 888
Full system observability12 *802, 808, 850, 820, 824, 834, 836, 846, 854, 858, 862, and 888
[36]Full system observability
(with Min. No. of μPMUs)
12802, 808, 814, 820, 824, 834, 836, 846, 854, 858, 862, and 888
Full system observability
(with Min. No. of μPMUs)
12 *802, 808, 850, 820, 824, 834, 836, 846, 854, 858, 862, and 888
[37]Full system observability12802, 808, 814, 820, 824, 834, 836, 846, 854, 858, 862, and 888
* Optimal locations selected for data generation.
Table 7. DG modeling parameters [38].
V r a t e d = 480 (V)kVA r a t e d = 410 (kVA)P r a t e d = 350 (kW)
V S c h e d = 1 (p.u.)Q m a x = 0.5 (p.u.)Q m i n = −0.25 (p.u.)
pf = 0.8536585X d = 1.76 (p.u.)X q = 1.66 (p.u.)
X d = 0.21 (p.u.)X q = 0.18 (p.u.)X d = 0.13 (p.u.)
X q = 0.11 (p.u.)r a = 0 (p.u.)r = 0 (p.u.)
r 1 r = 0 (p.u.)X 1 r = 0 (p.u.)X 0 = 0 (p.u.)
Table 9. Use case test results: fault and no-fault event classification.
Tested DataEvent LocationIf Master μPMU
ValueMSSC
If Any μPMU
ValueThreshold
Classified Event
Tap LoweringVR1NoNoNo-fault
A-G faultAt 99.99% of line section “m” with 20 ohmsYesYesFault
Capacitor Off844NoNoNo-fault
Disclaimer/Publisher’s Note: The statements, opinions and data contained in all publications are solely those of the individual author(s) and contributor(s) and not of MDPI and/or the editor(s). MDPI and/or the editor(s) disclaim responsibility for any injury to people or property resulting from any ideas, methods, instructions or products referred to in the content.