
Validation of a Holistic System for Operational Analysis and Provision of Ancillary Services in Active Distribution Networks

 ,
,  , ,
, ,  , , and
Abstract
1. Introduction
- The ASs framework is applied to solve realistic problems in large-scale studies, including both primary and secondary DNs.
- The efficiency of the proposed hybrid control strategies is validated for different operating conditions via quasi-static simulations.
- Dynamic equivalent models (DEM) [10] are implemented and incorporated into simulation models.
- The impact of IBRs and load modeling on the dynamic performance of DNs is investigated.
- The mode estimation algorithm of [10] for small-signal analysis is evaluated by using the PHIL results.
2. Proposed Ancillary Services
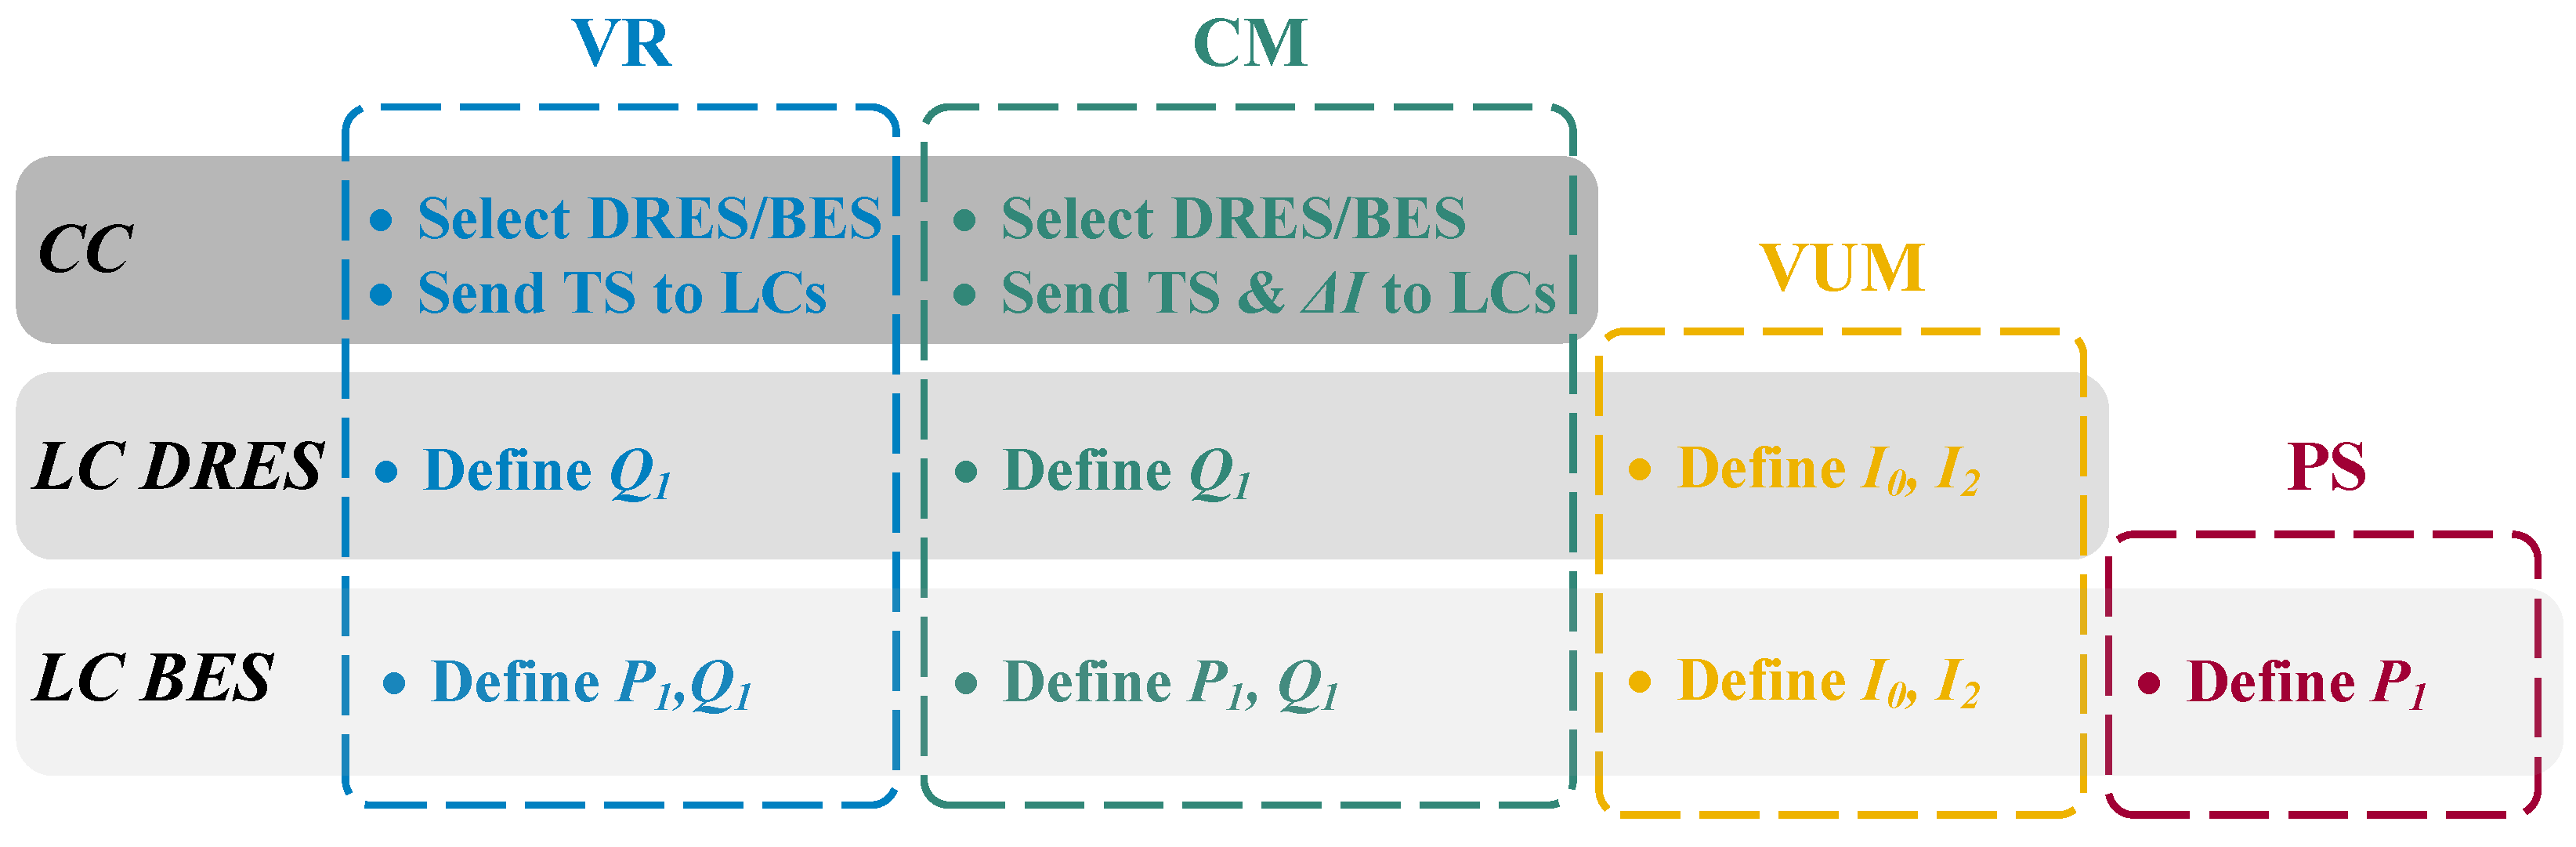
2.1. Hybrid Control Strategy
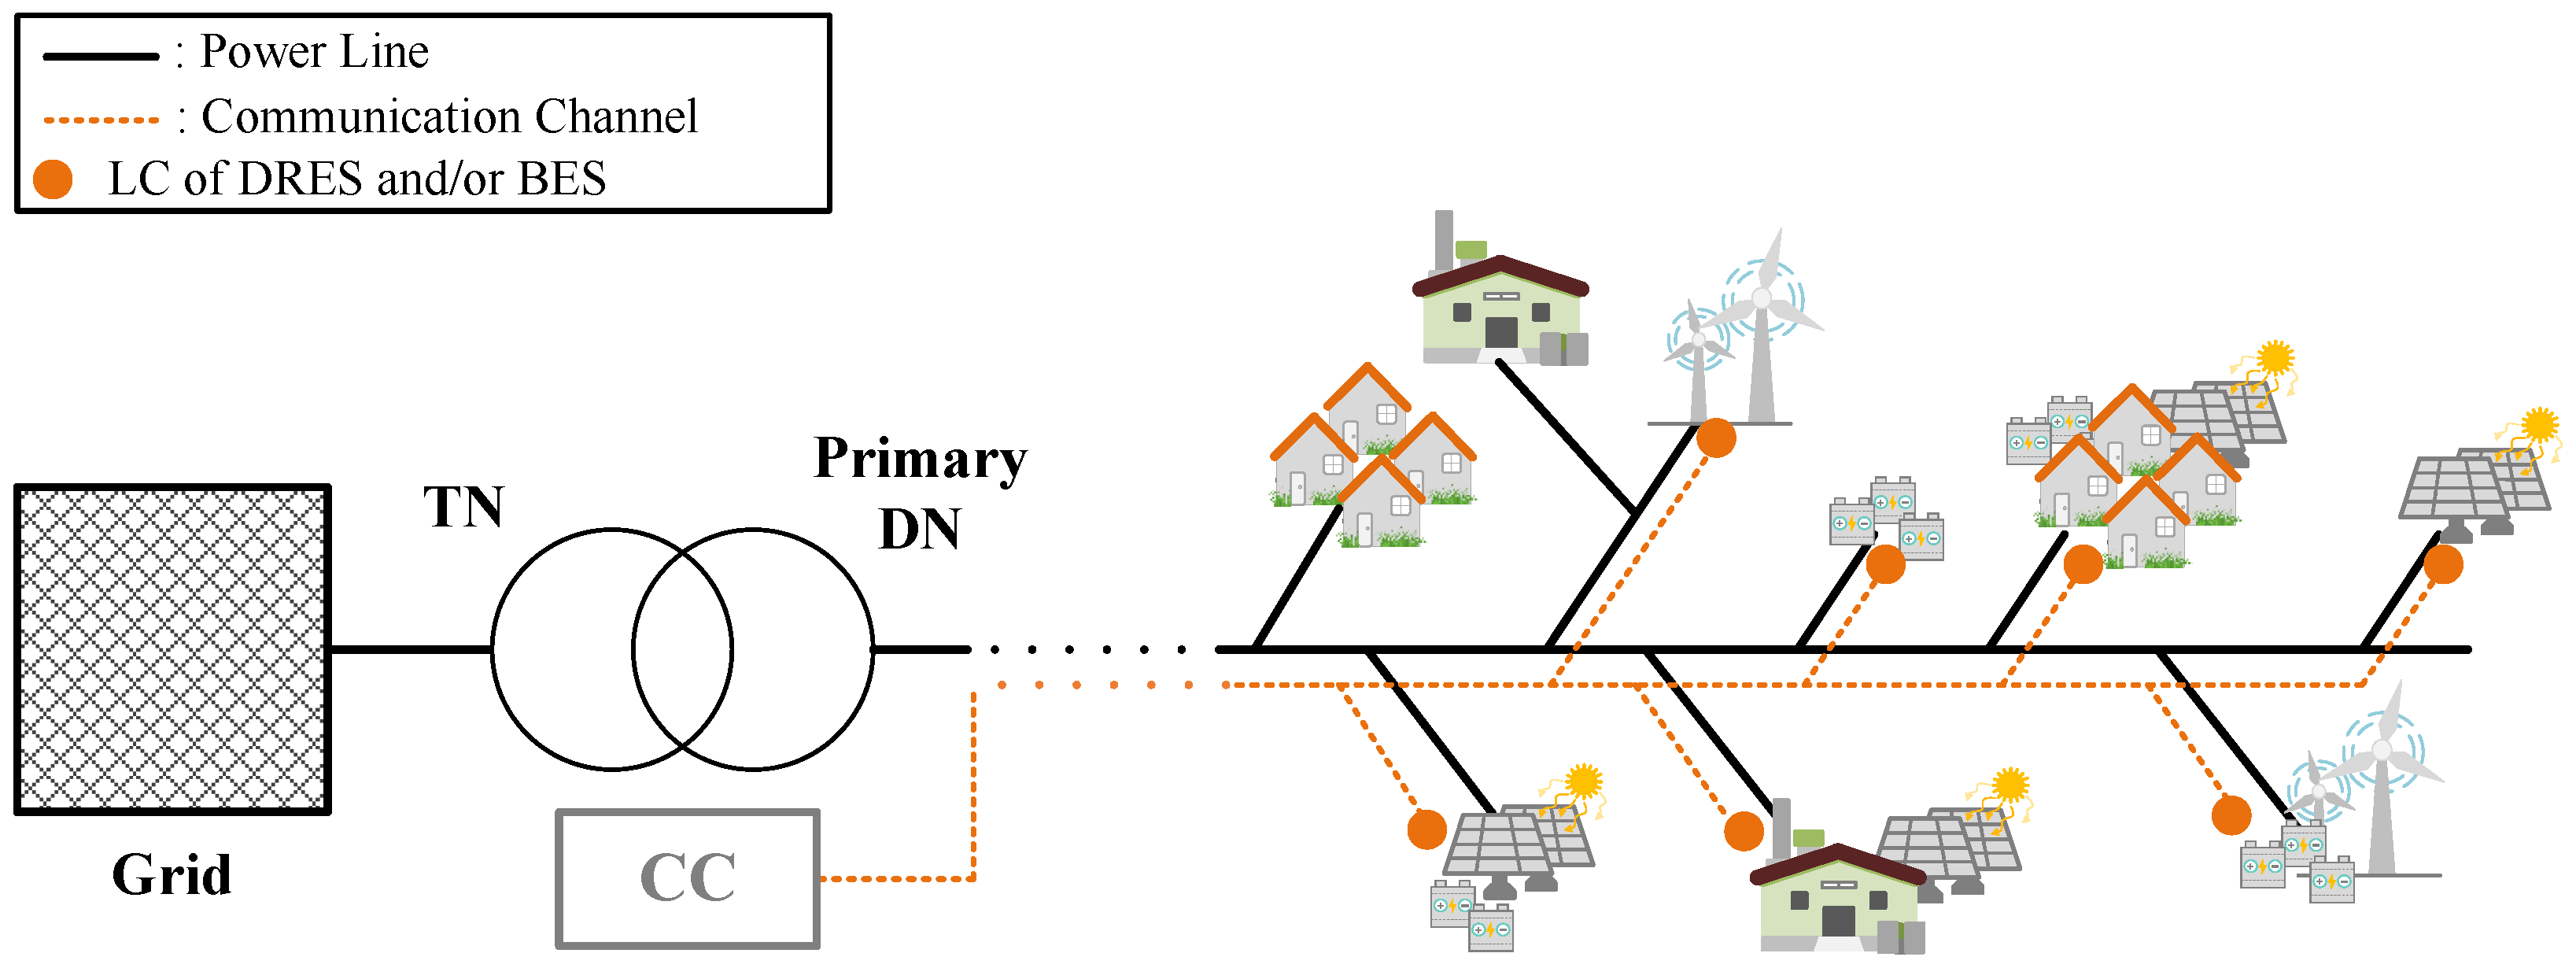
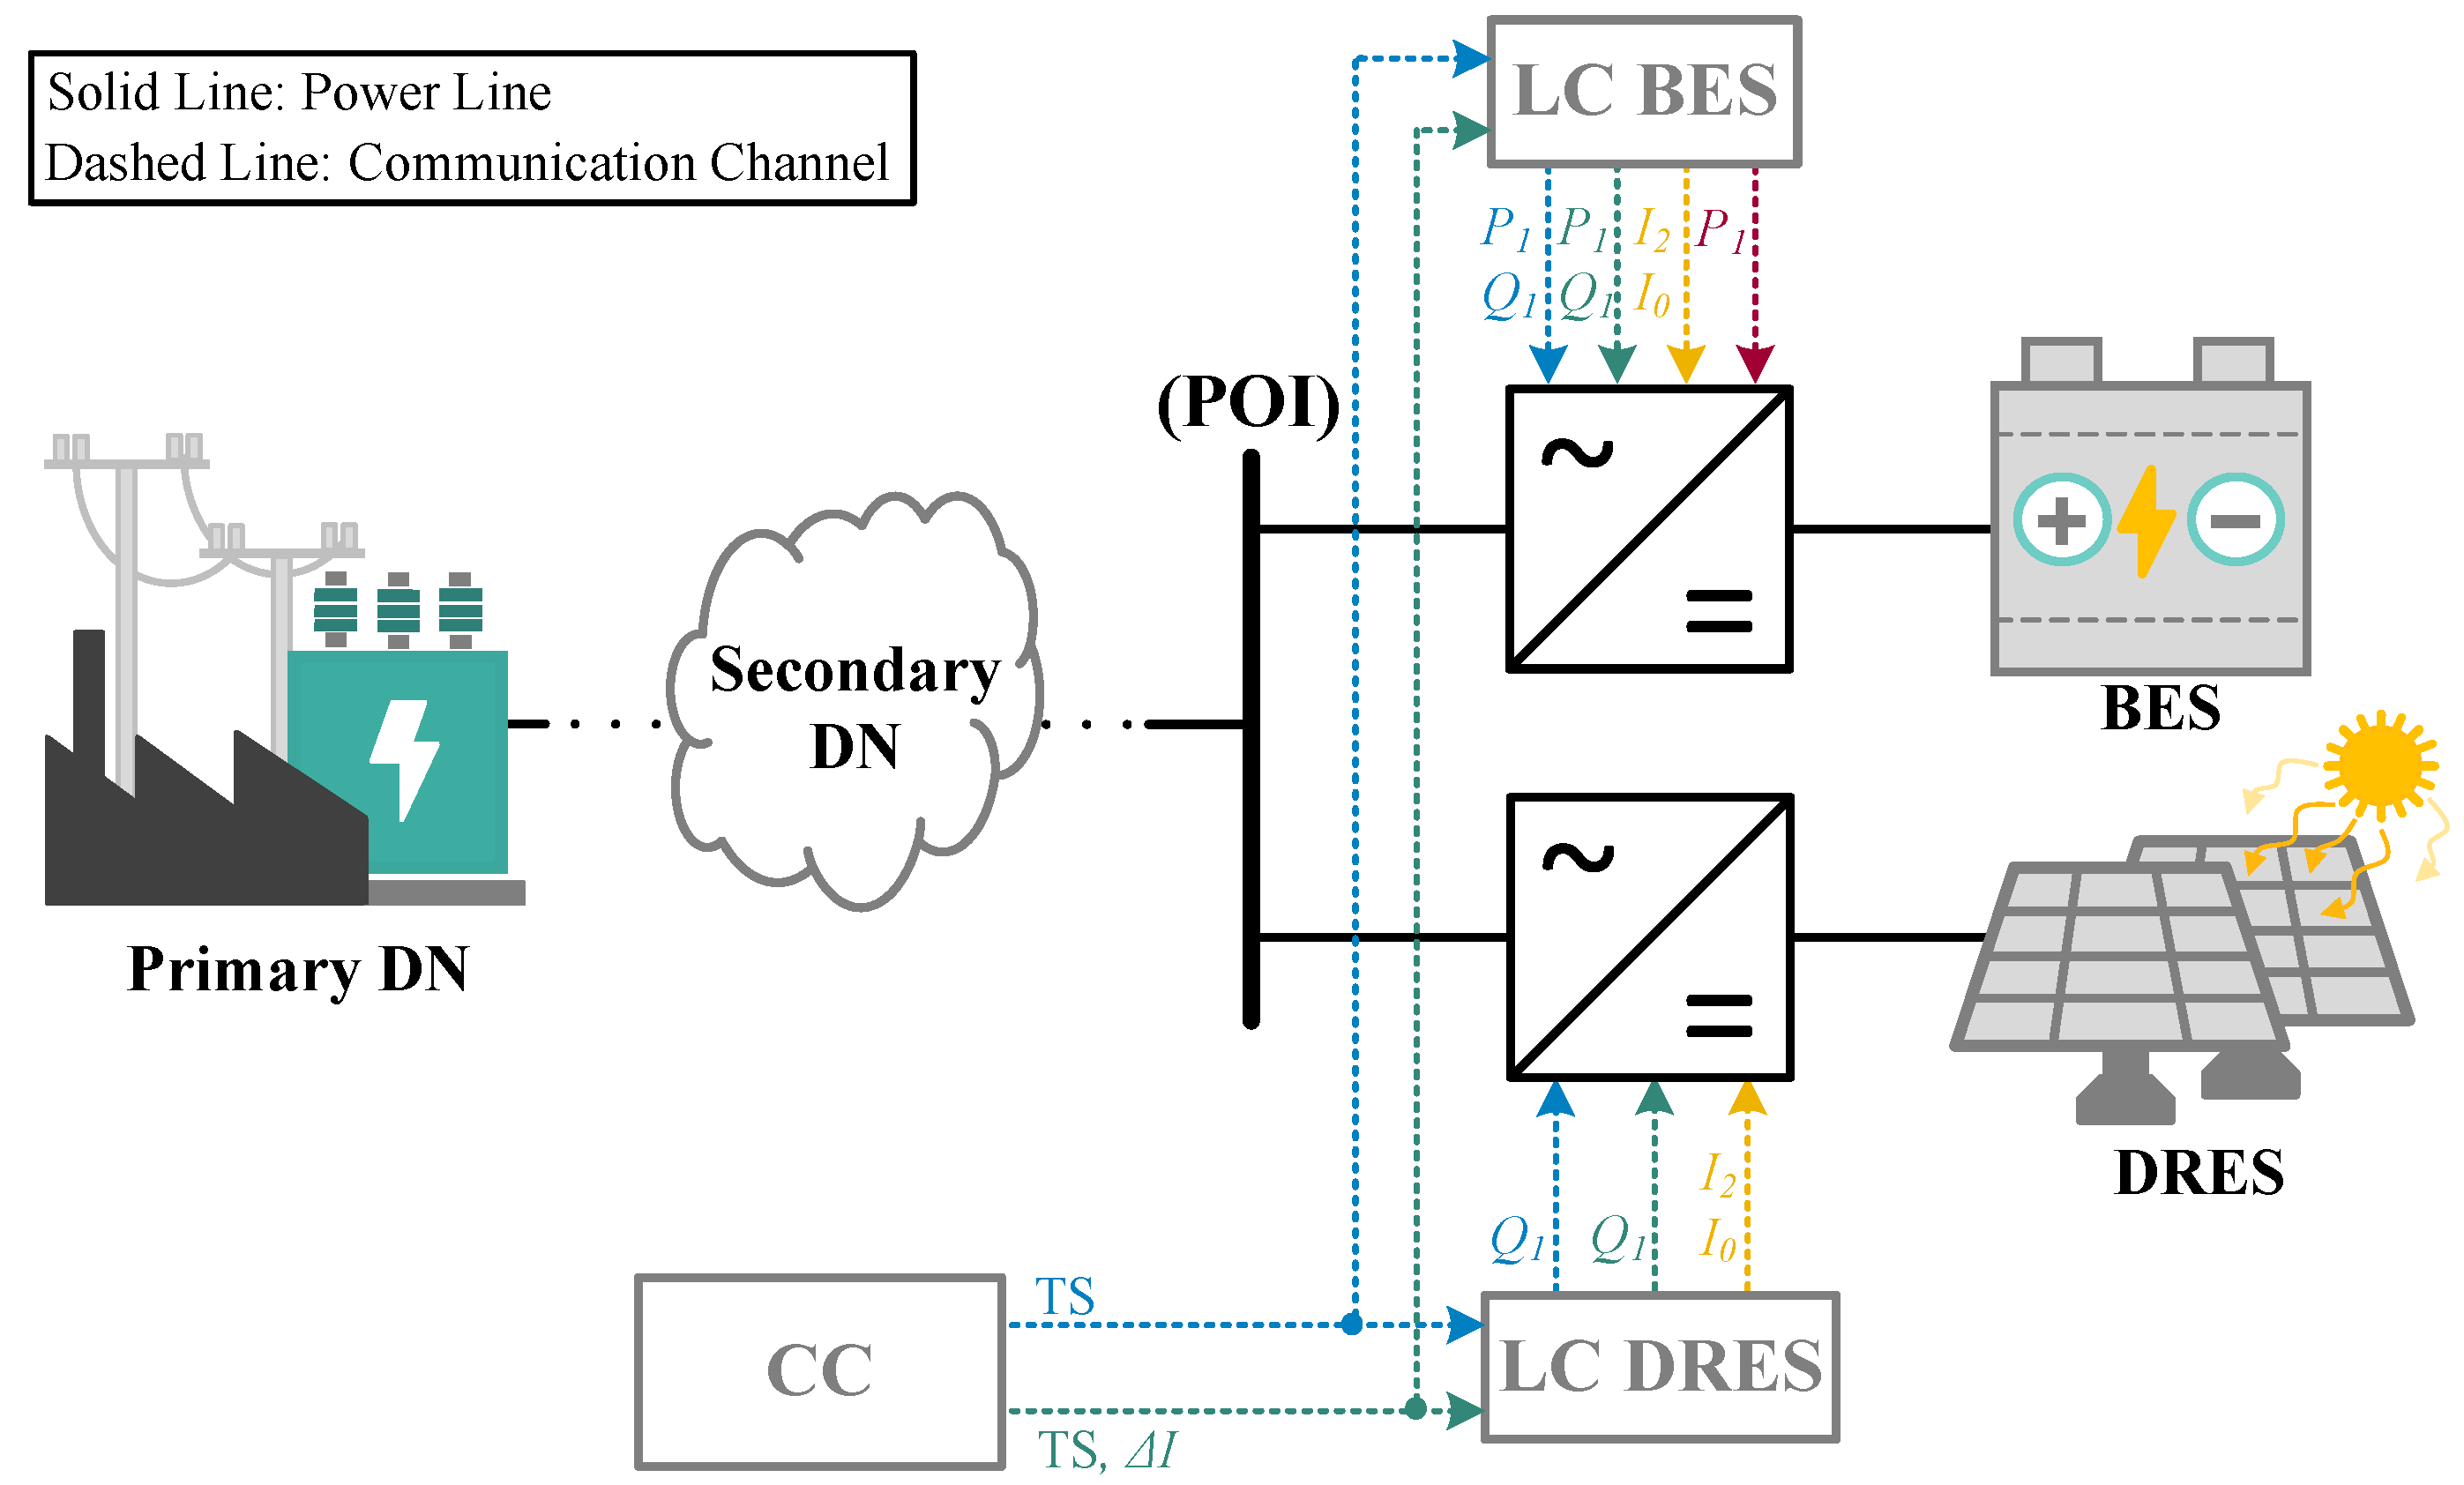
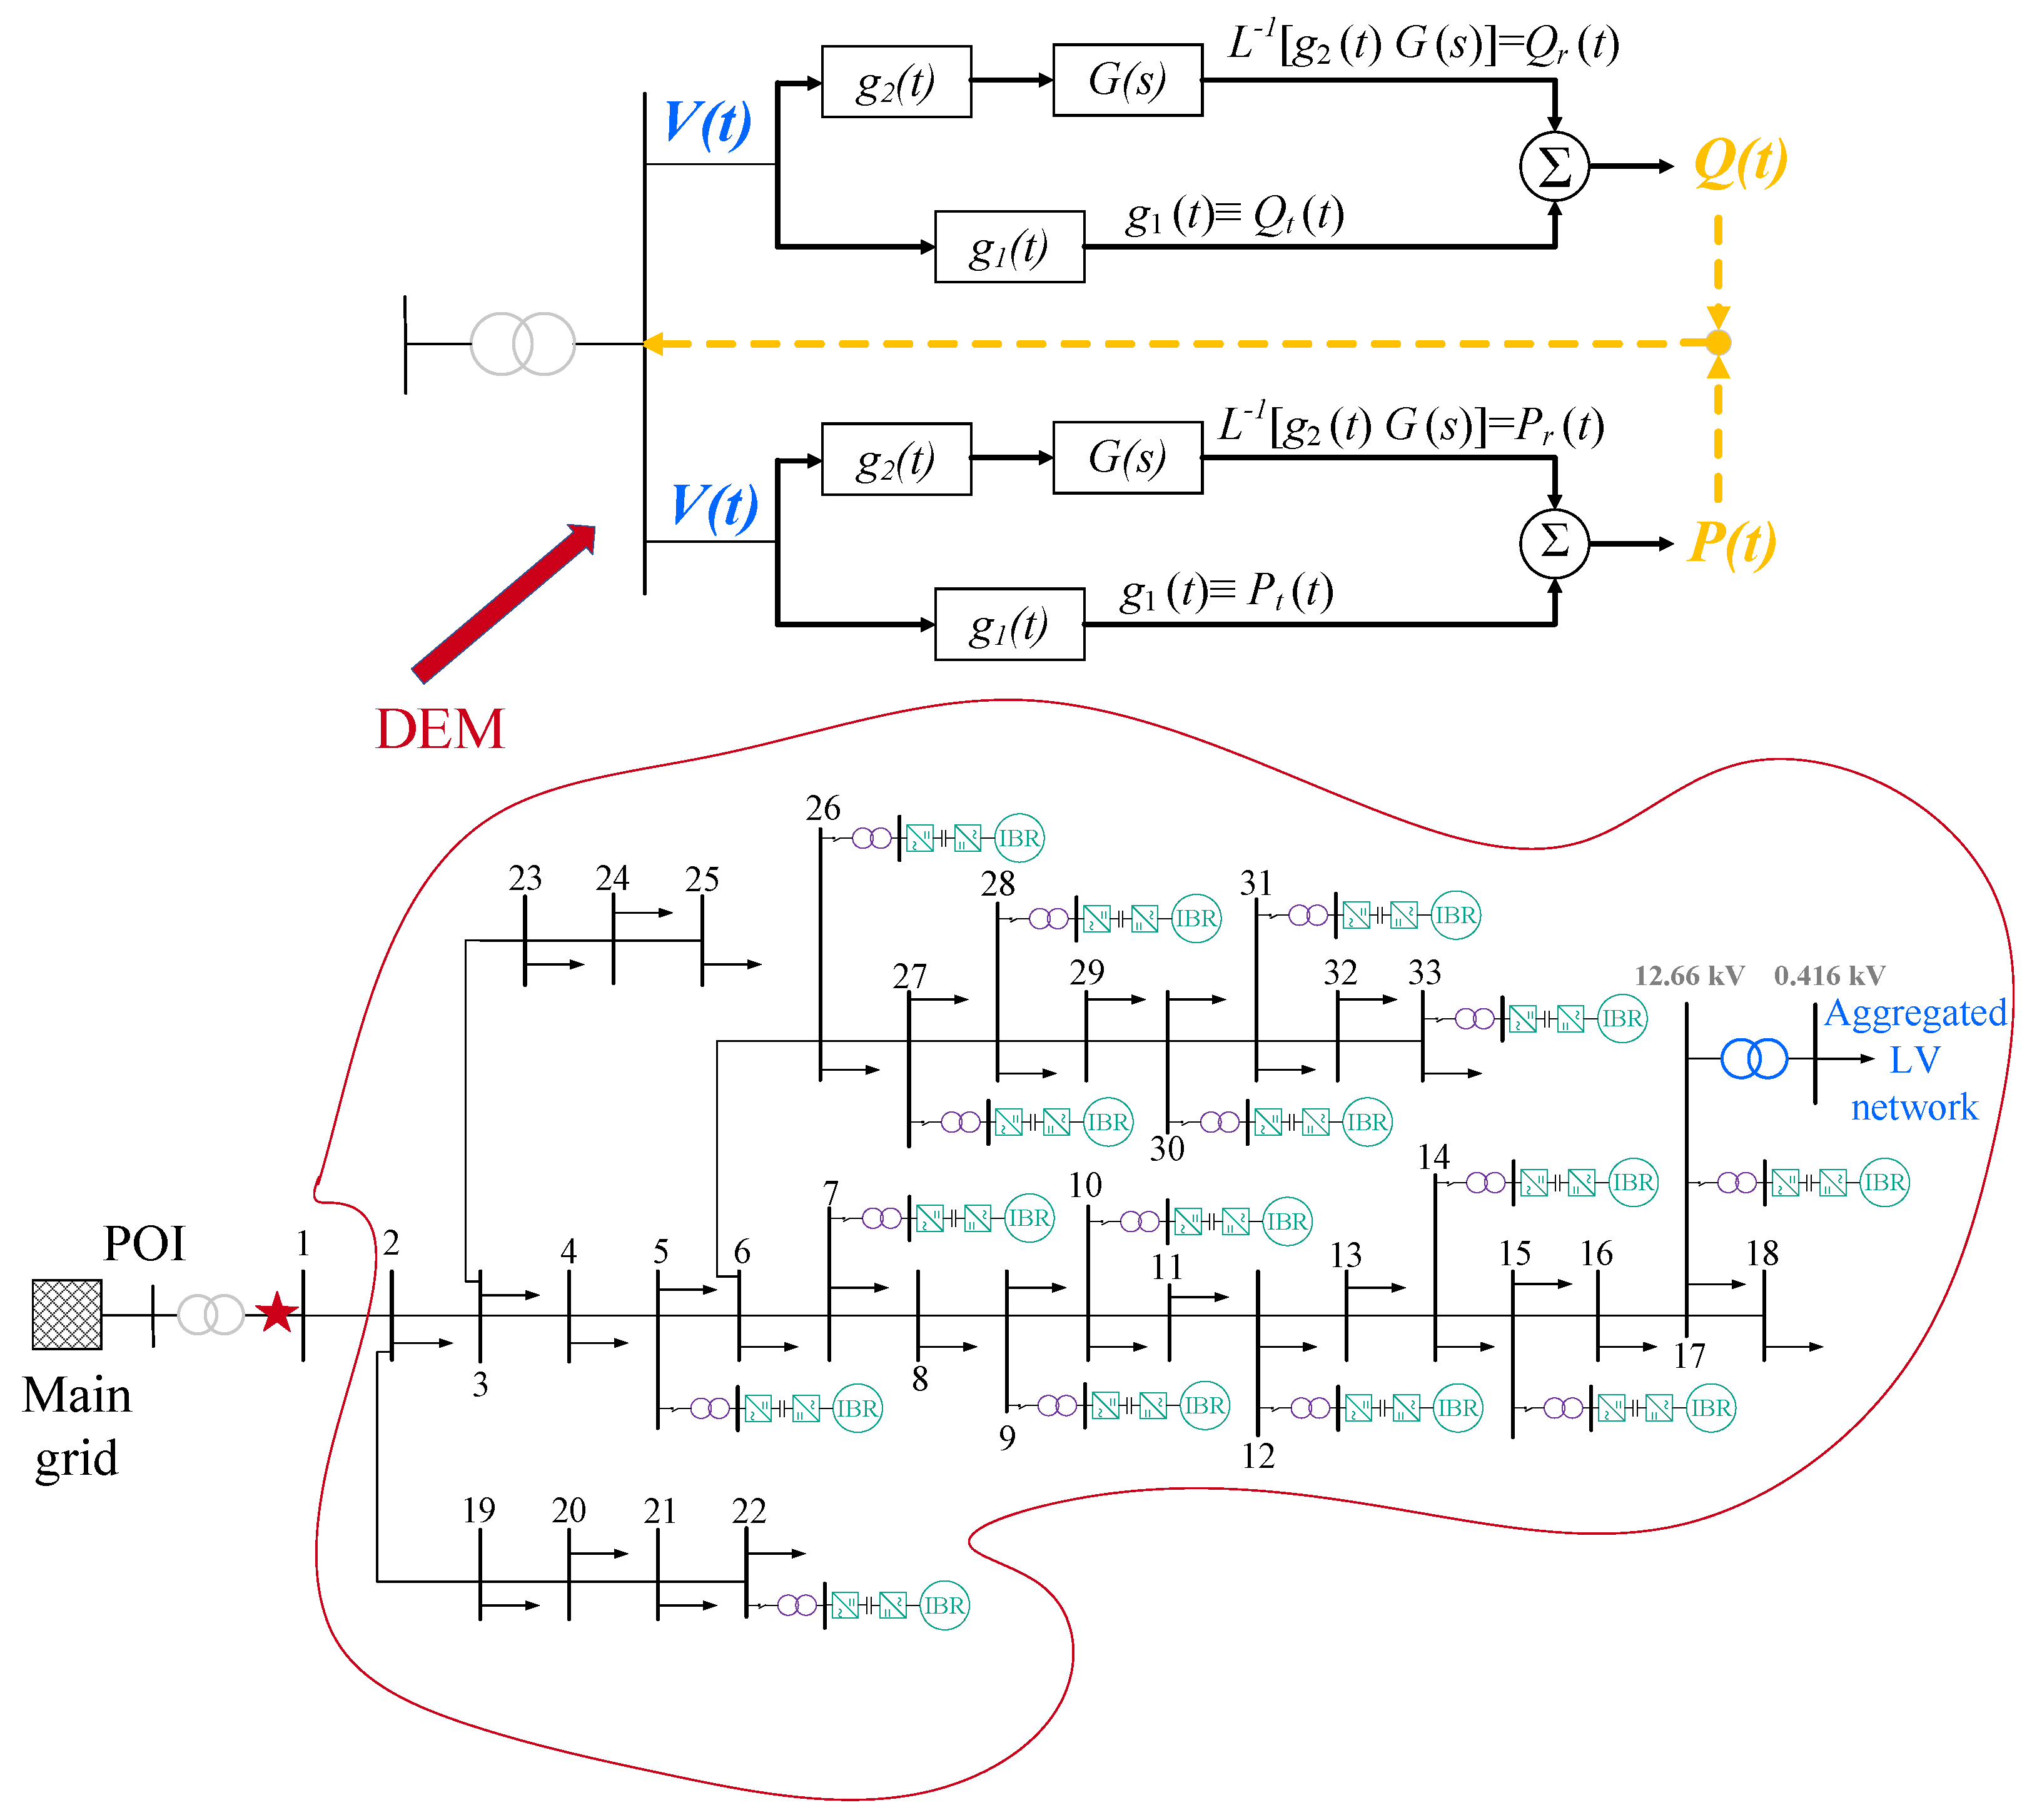
- Central controller (CC) layer: The CC is employed to coordinate the operation of DRES/BES units via their local controllers (LCs) by sending control signals in case of voltage violation and/or current overload events. The CC coordination concept is depicted in Figure 2 and Figure 3 for the primary and the secondary DN, respectively.
- Local controller (LC) layer: LCs are integrated into the DRES/BES converters and exchange information with the CC on a regular basis. The operation of the LC is sub-divided into the DRES and the BES LC layer (Figure 3). Note that, a dedicated converter is considered for each of the DRES and the BES units (see Figure 3). The DRES LC is responsible for adjusting the DRES converter output power based only on the measurements acquired at point of interconnection (POI) to address potential voltage violations and asymmetries as well as current overloads. In addition, to smooth out possible DRES power fluctuations, a PS algorithm is applied and the BES is used to cover the power mismatch between the maximum power point (MPP) generated from the DRES and the injected smoothed power to the grid. For this purpose, and also as a supplementary solution for CM, VR and VUM the BES LC at the BES converter is used.
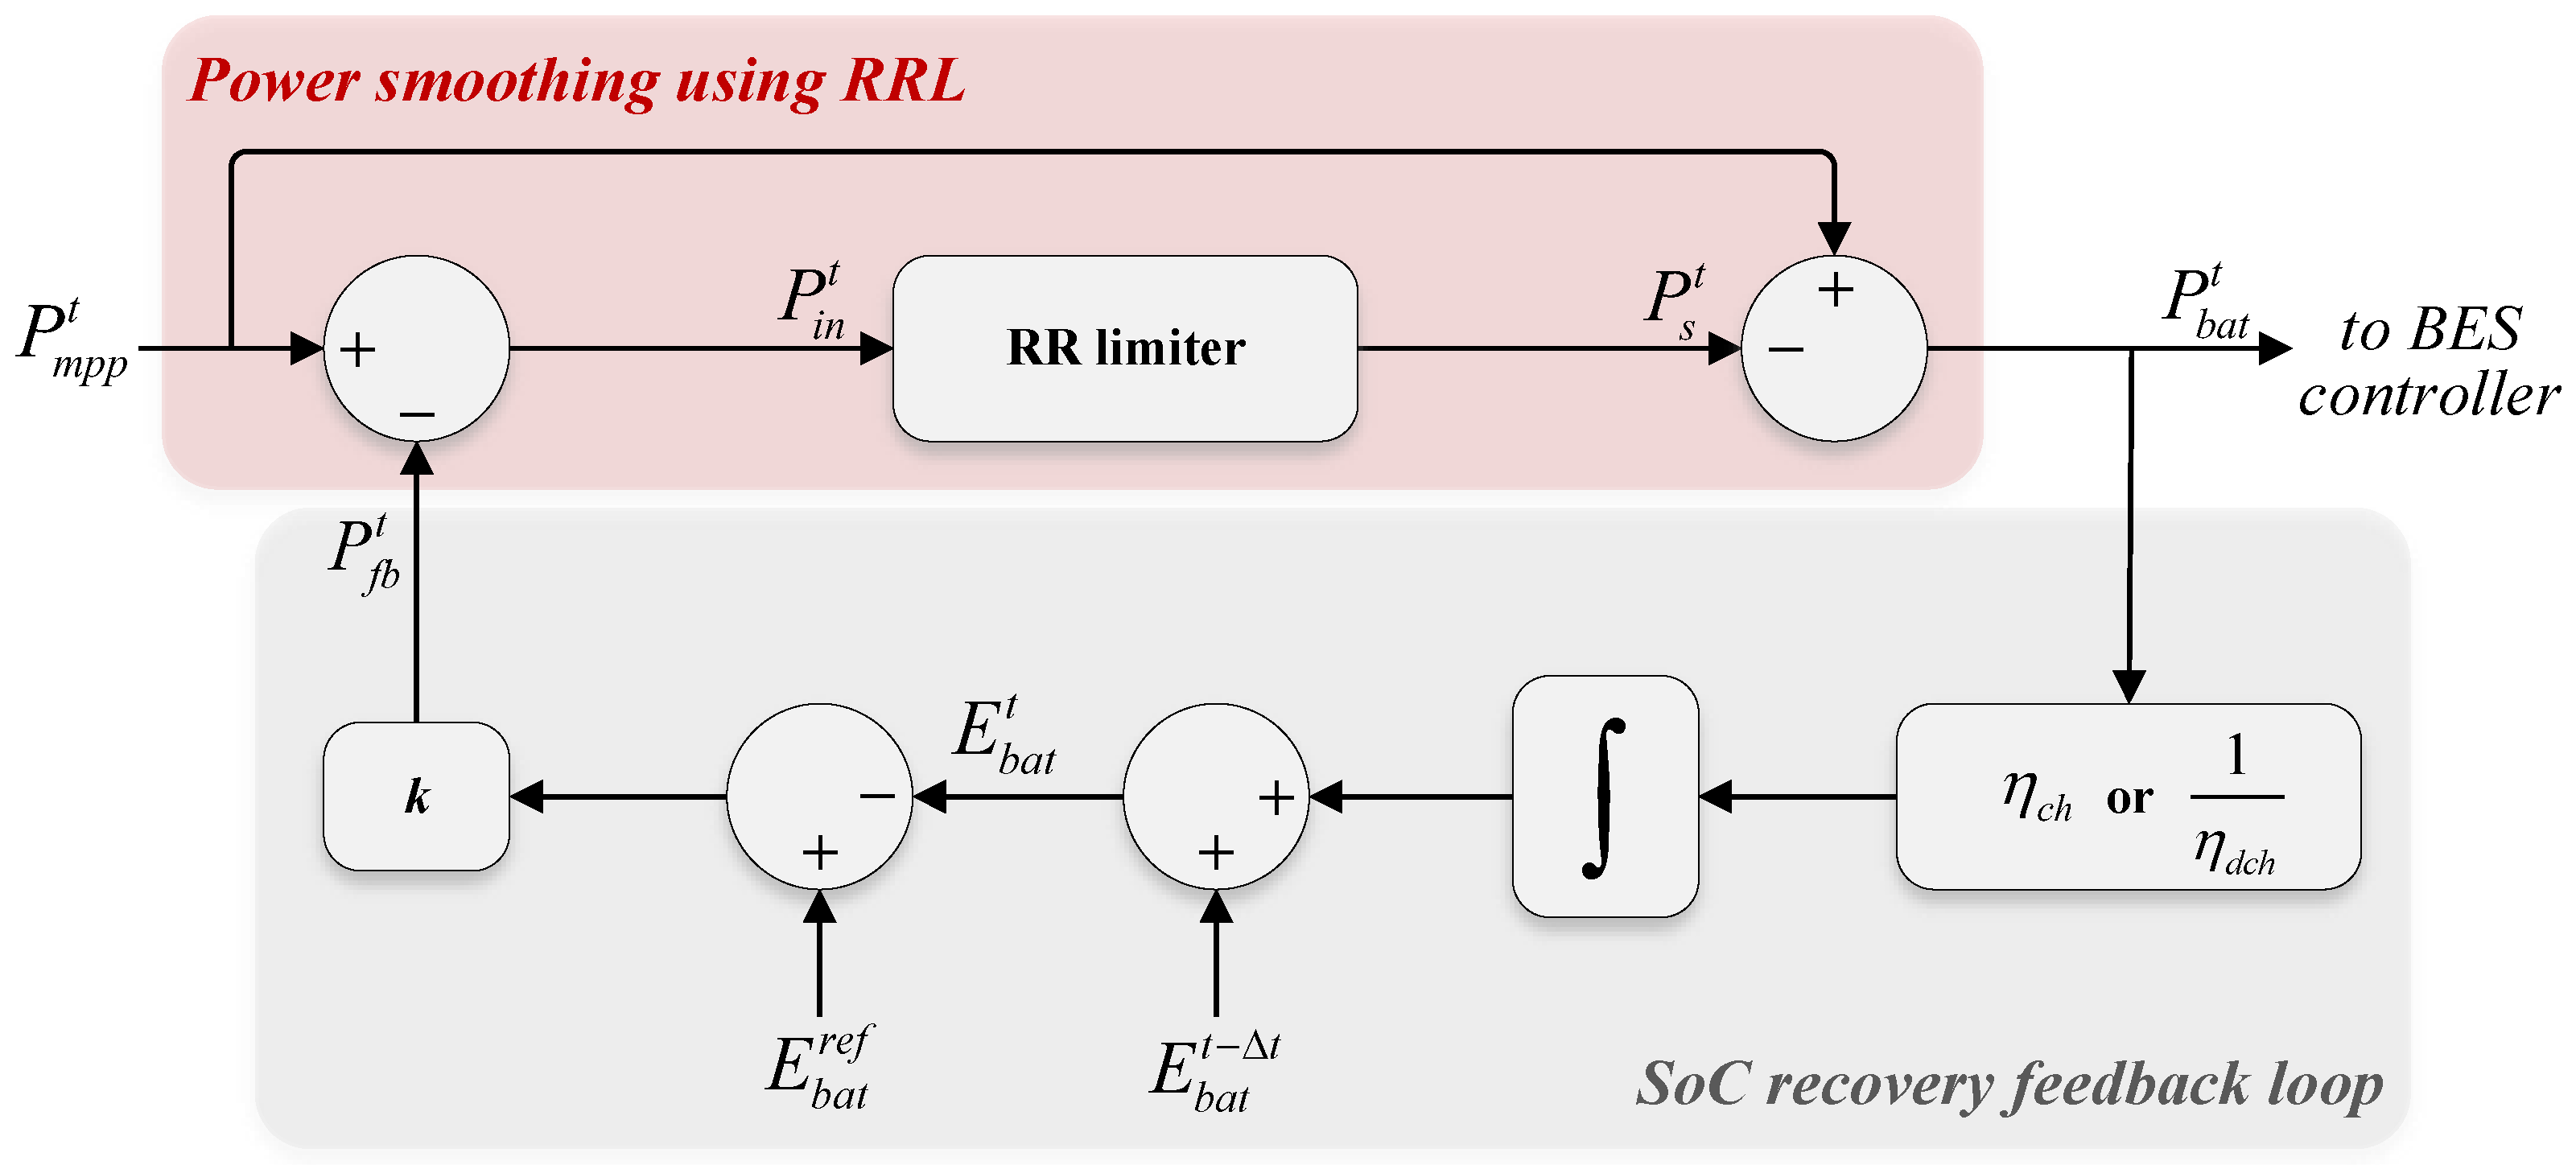
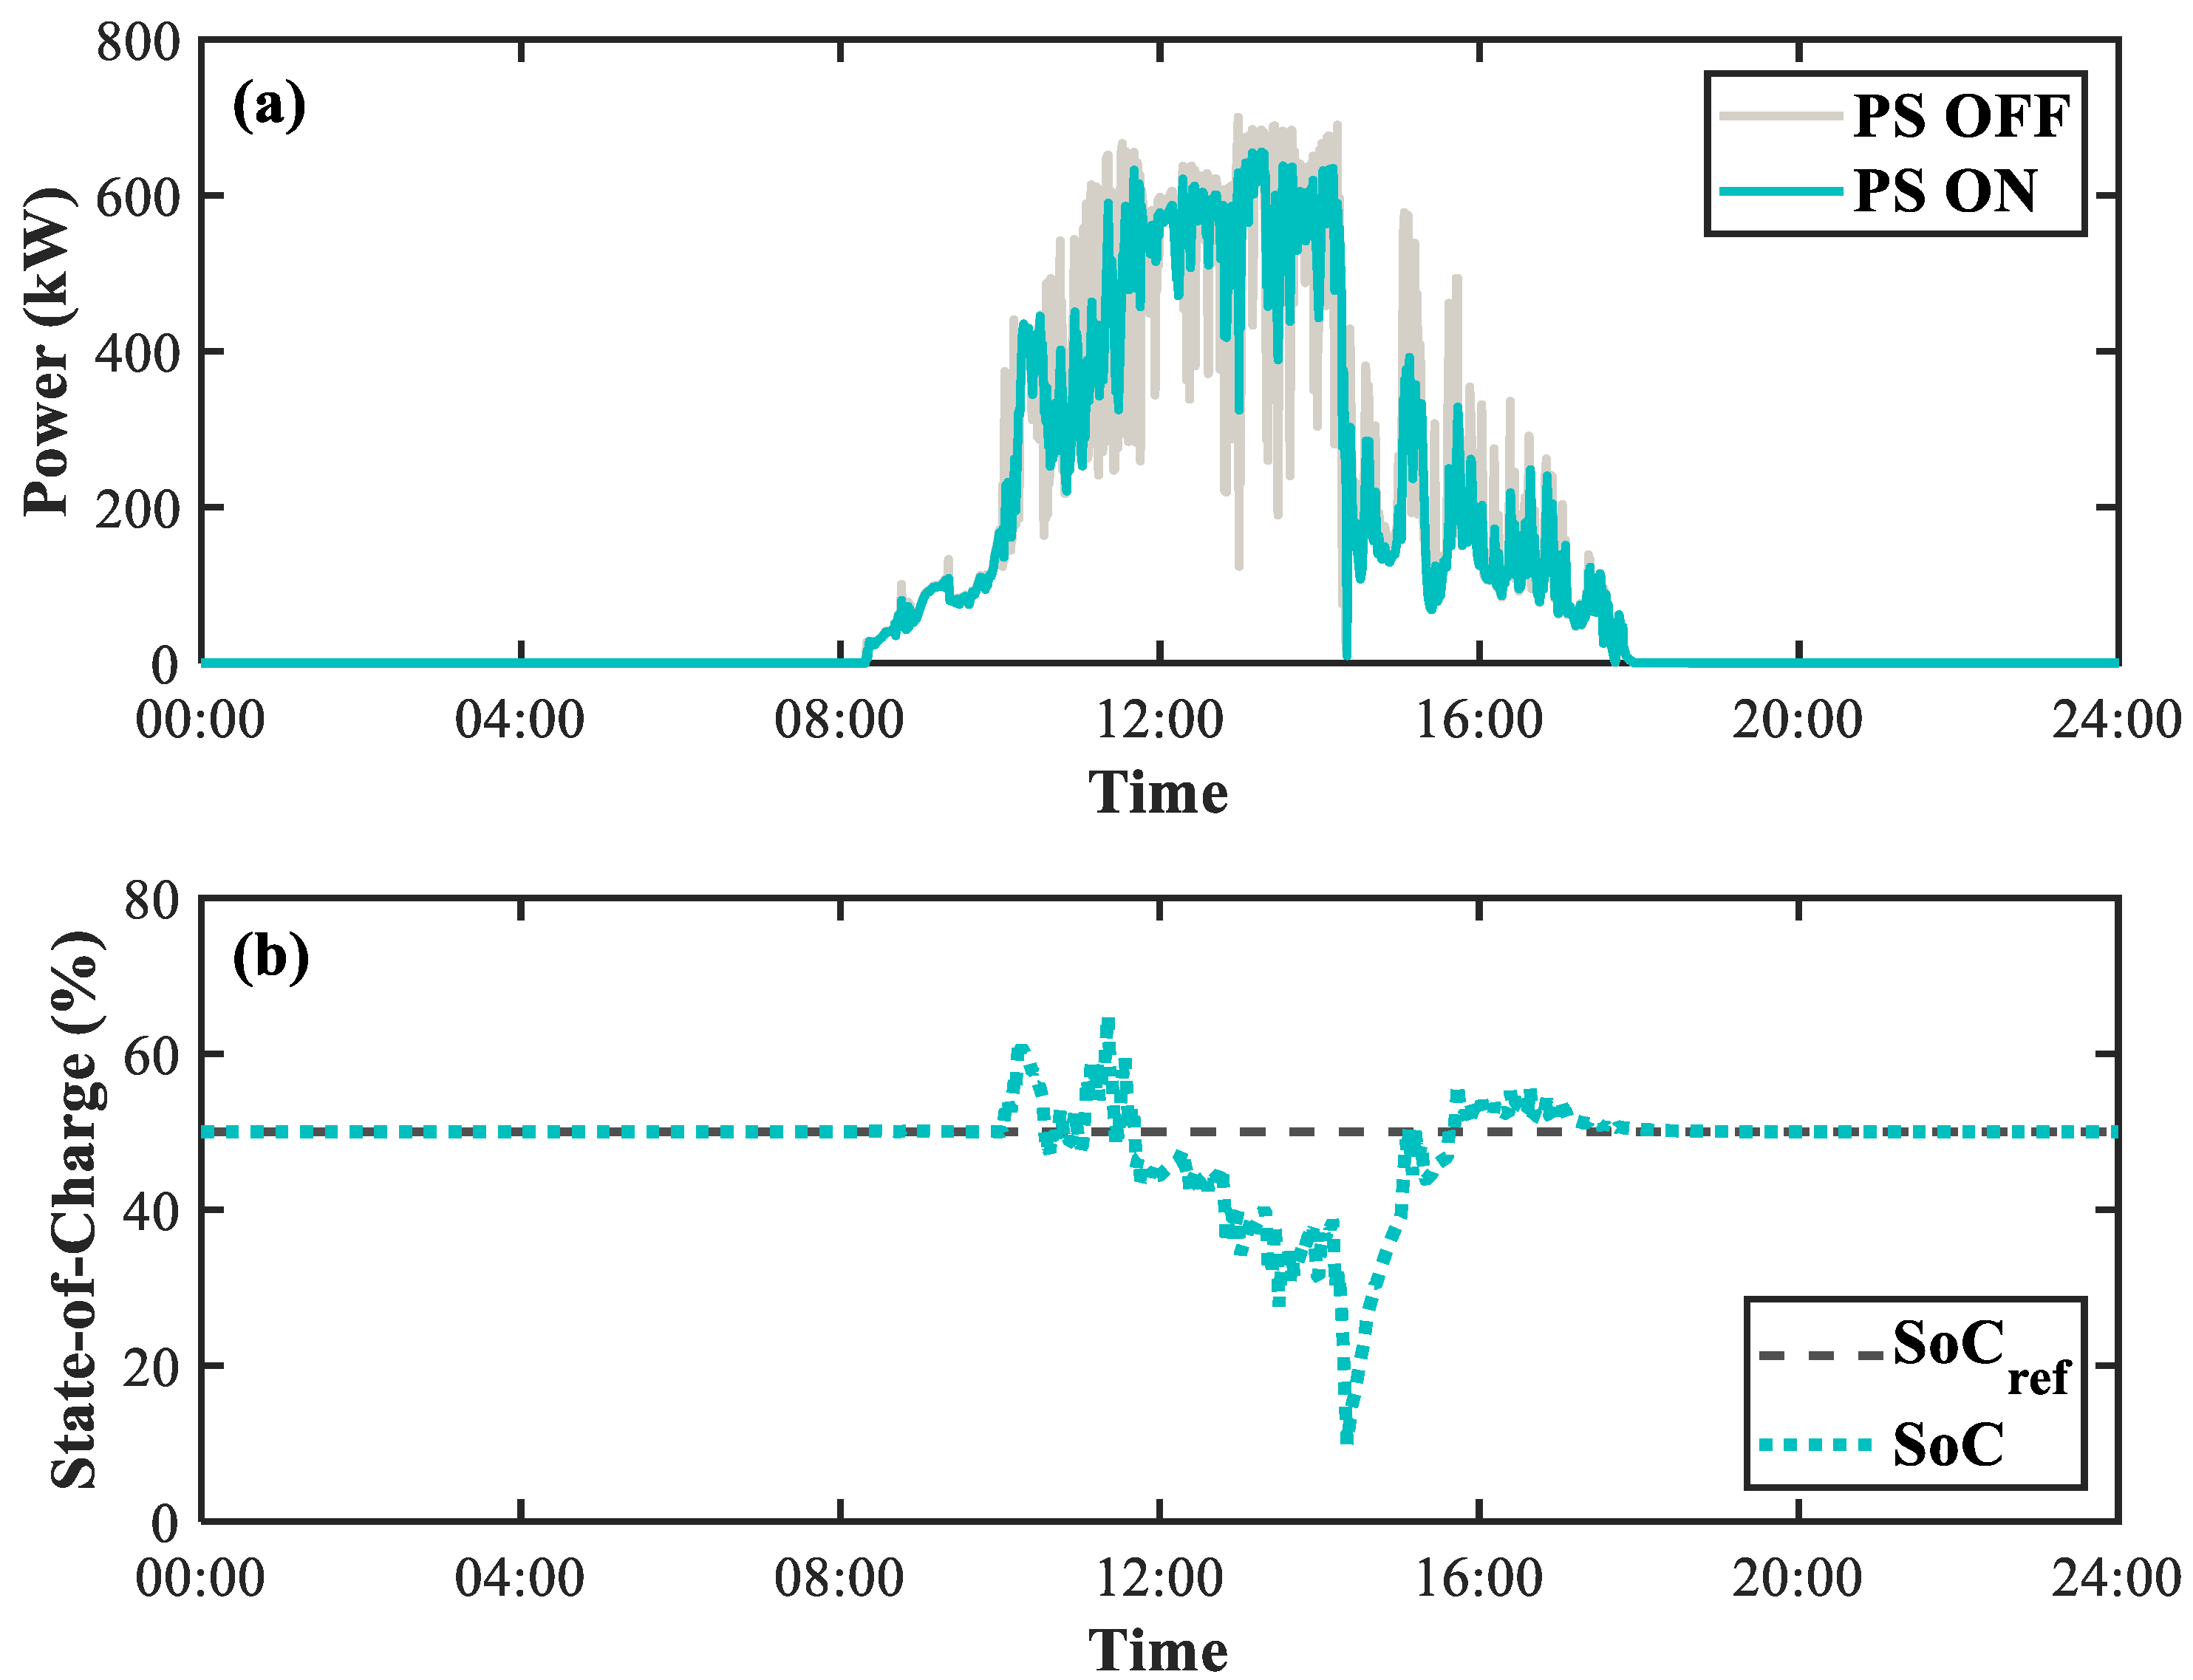
2.2. Power Smoothing Technique
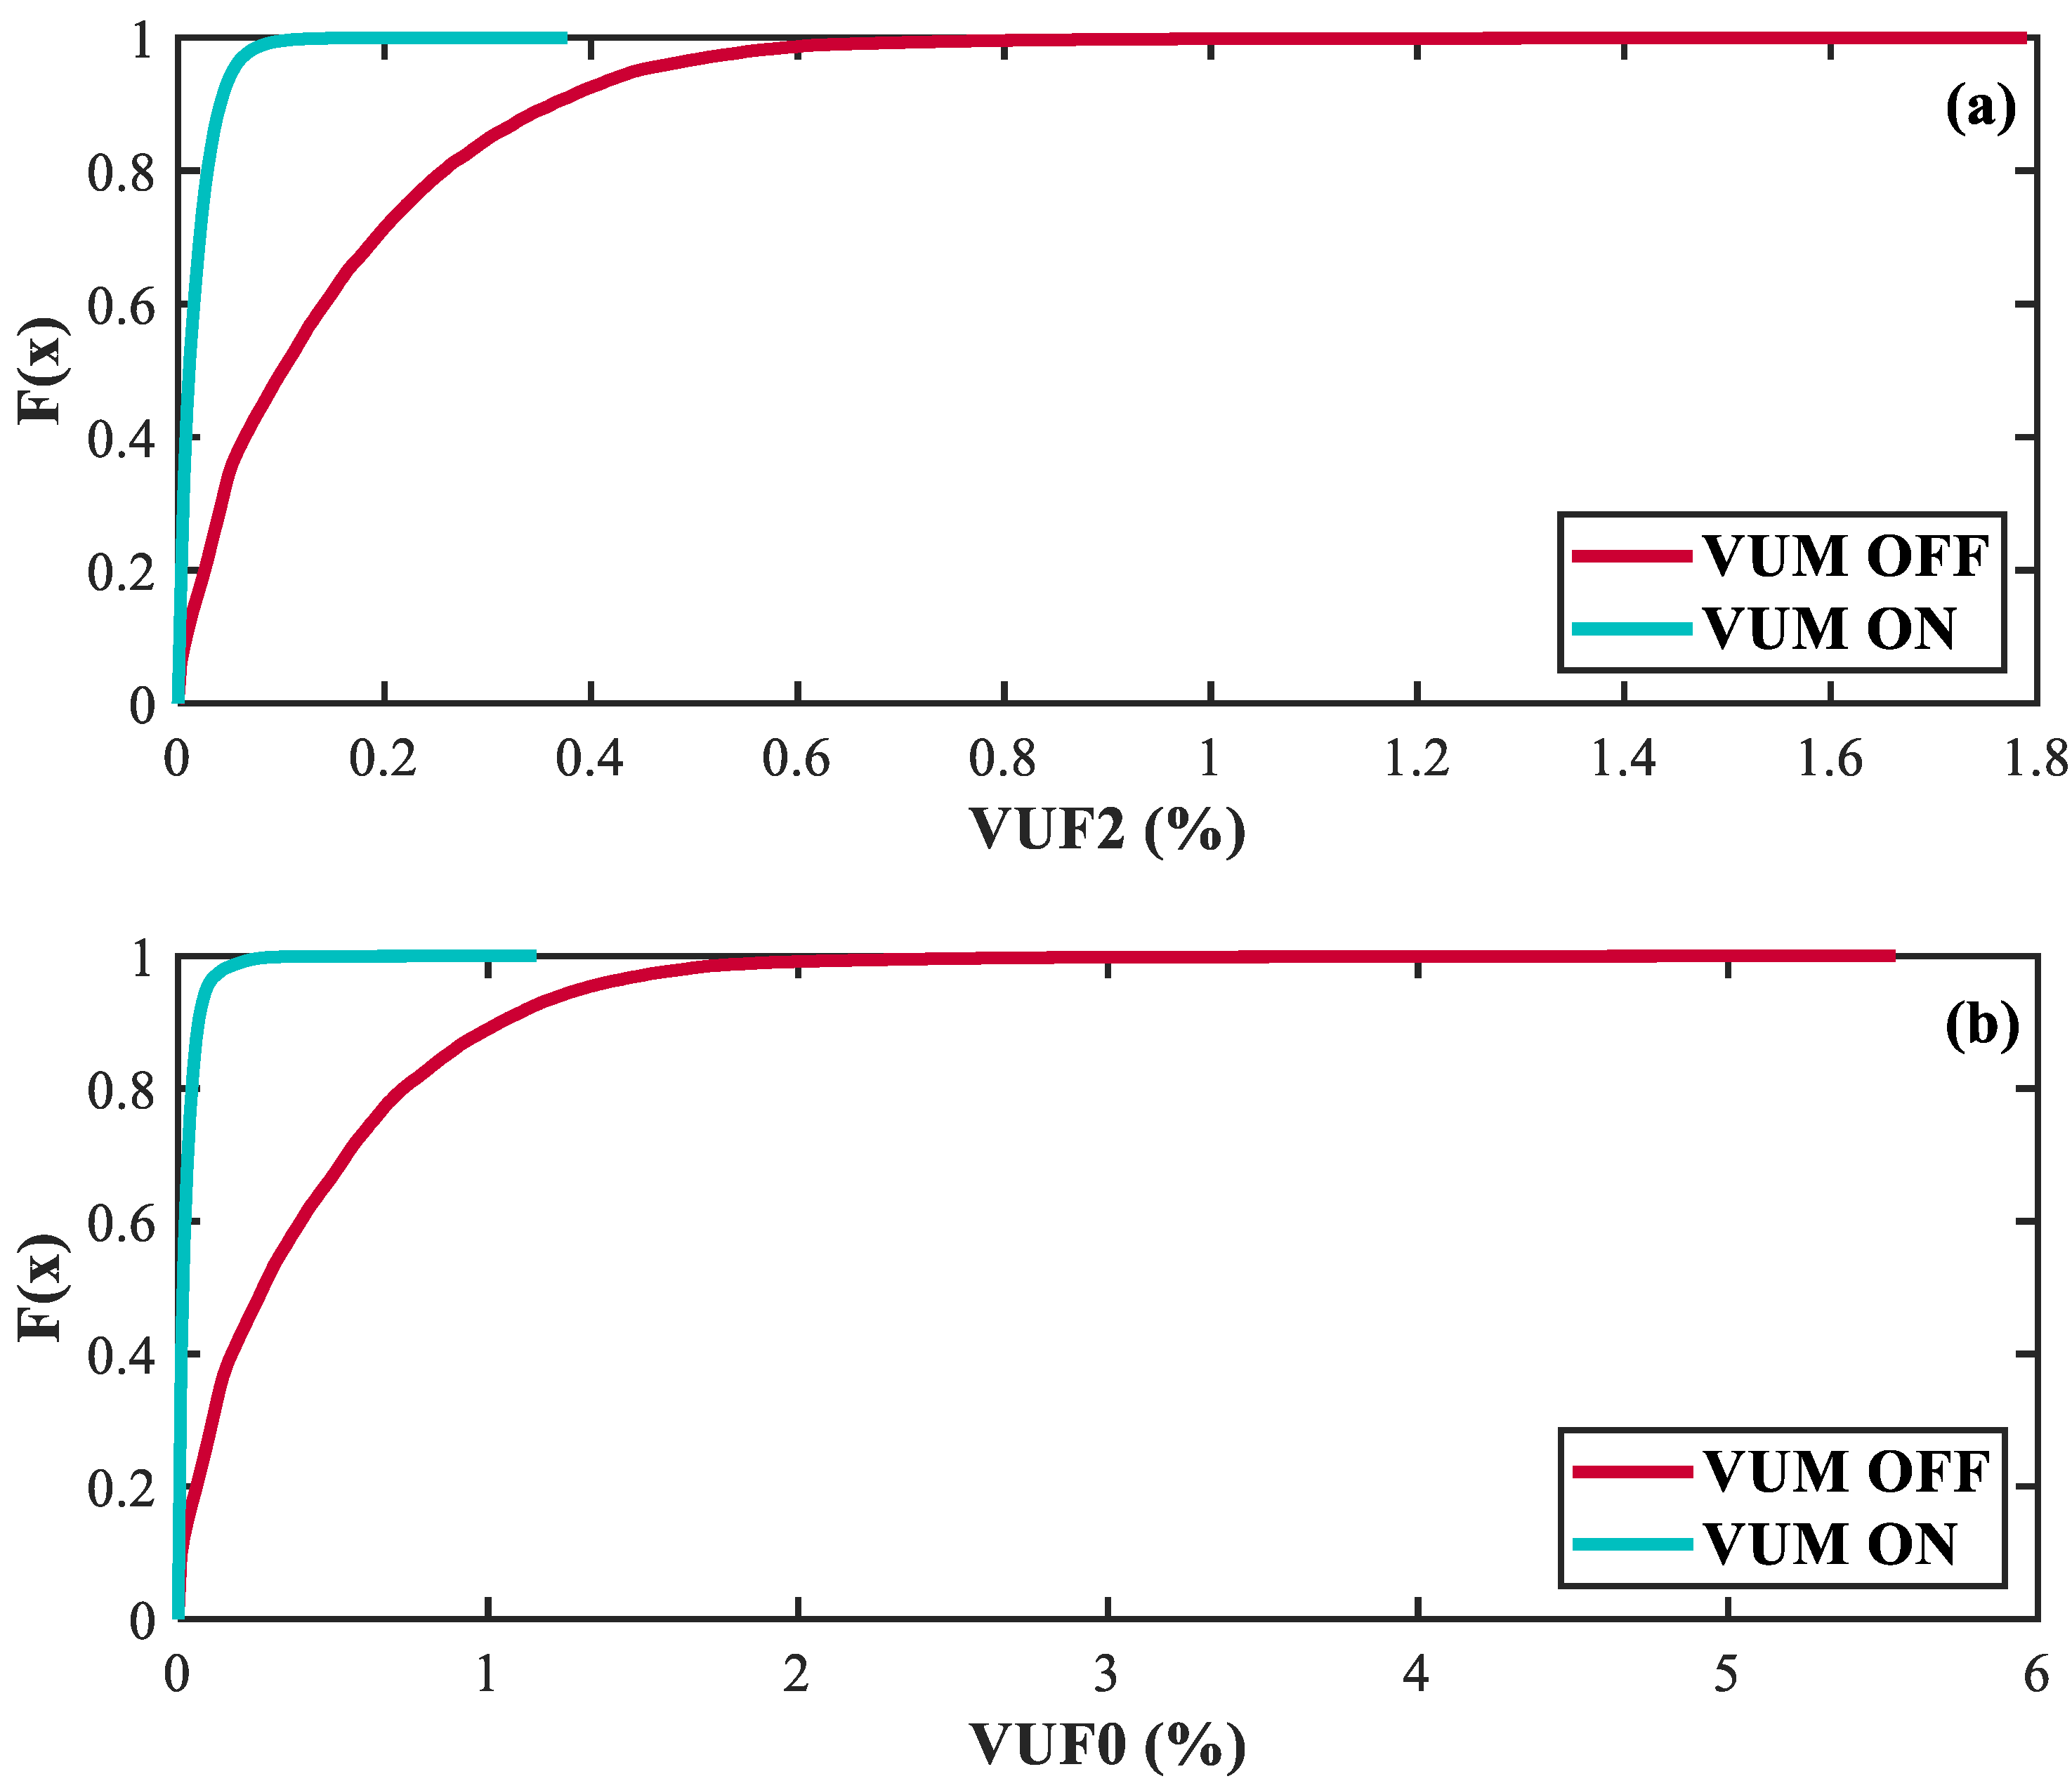
2.3. VUM Scheme
2.4. VR Strategy
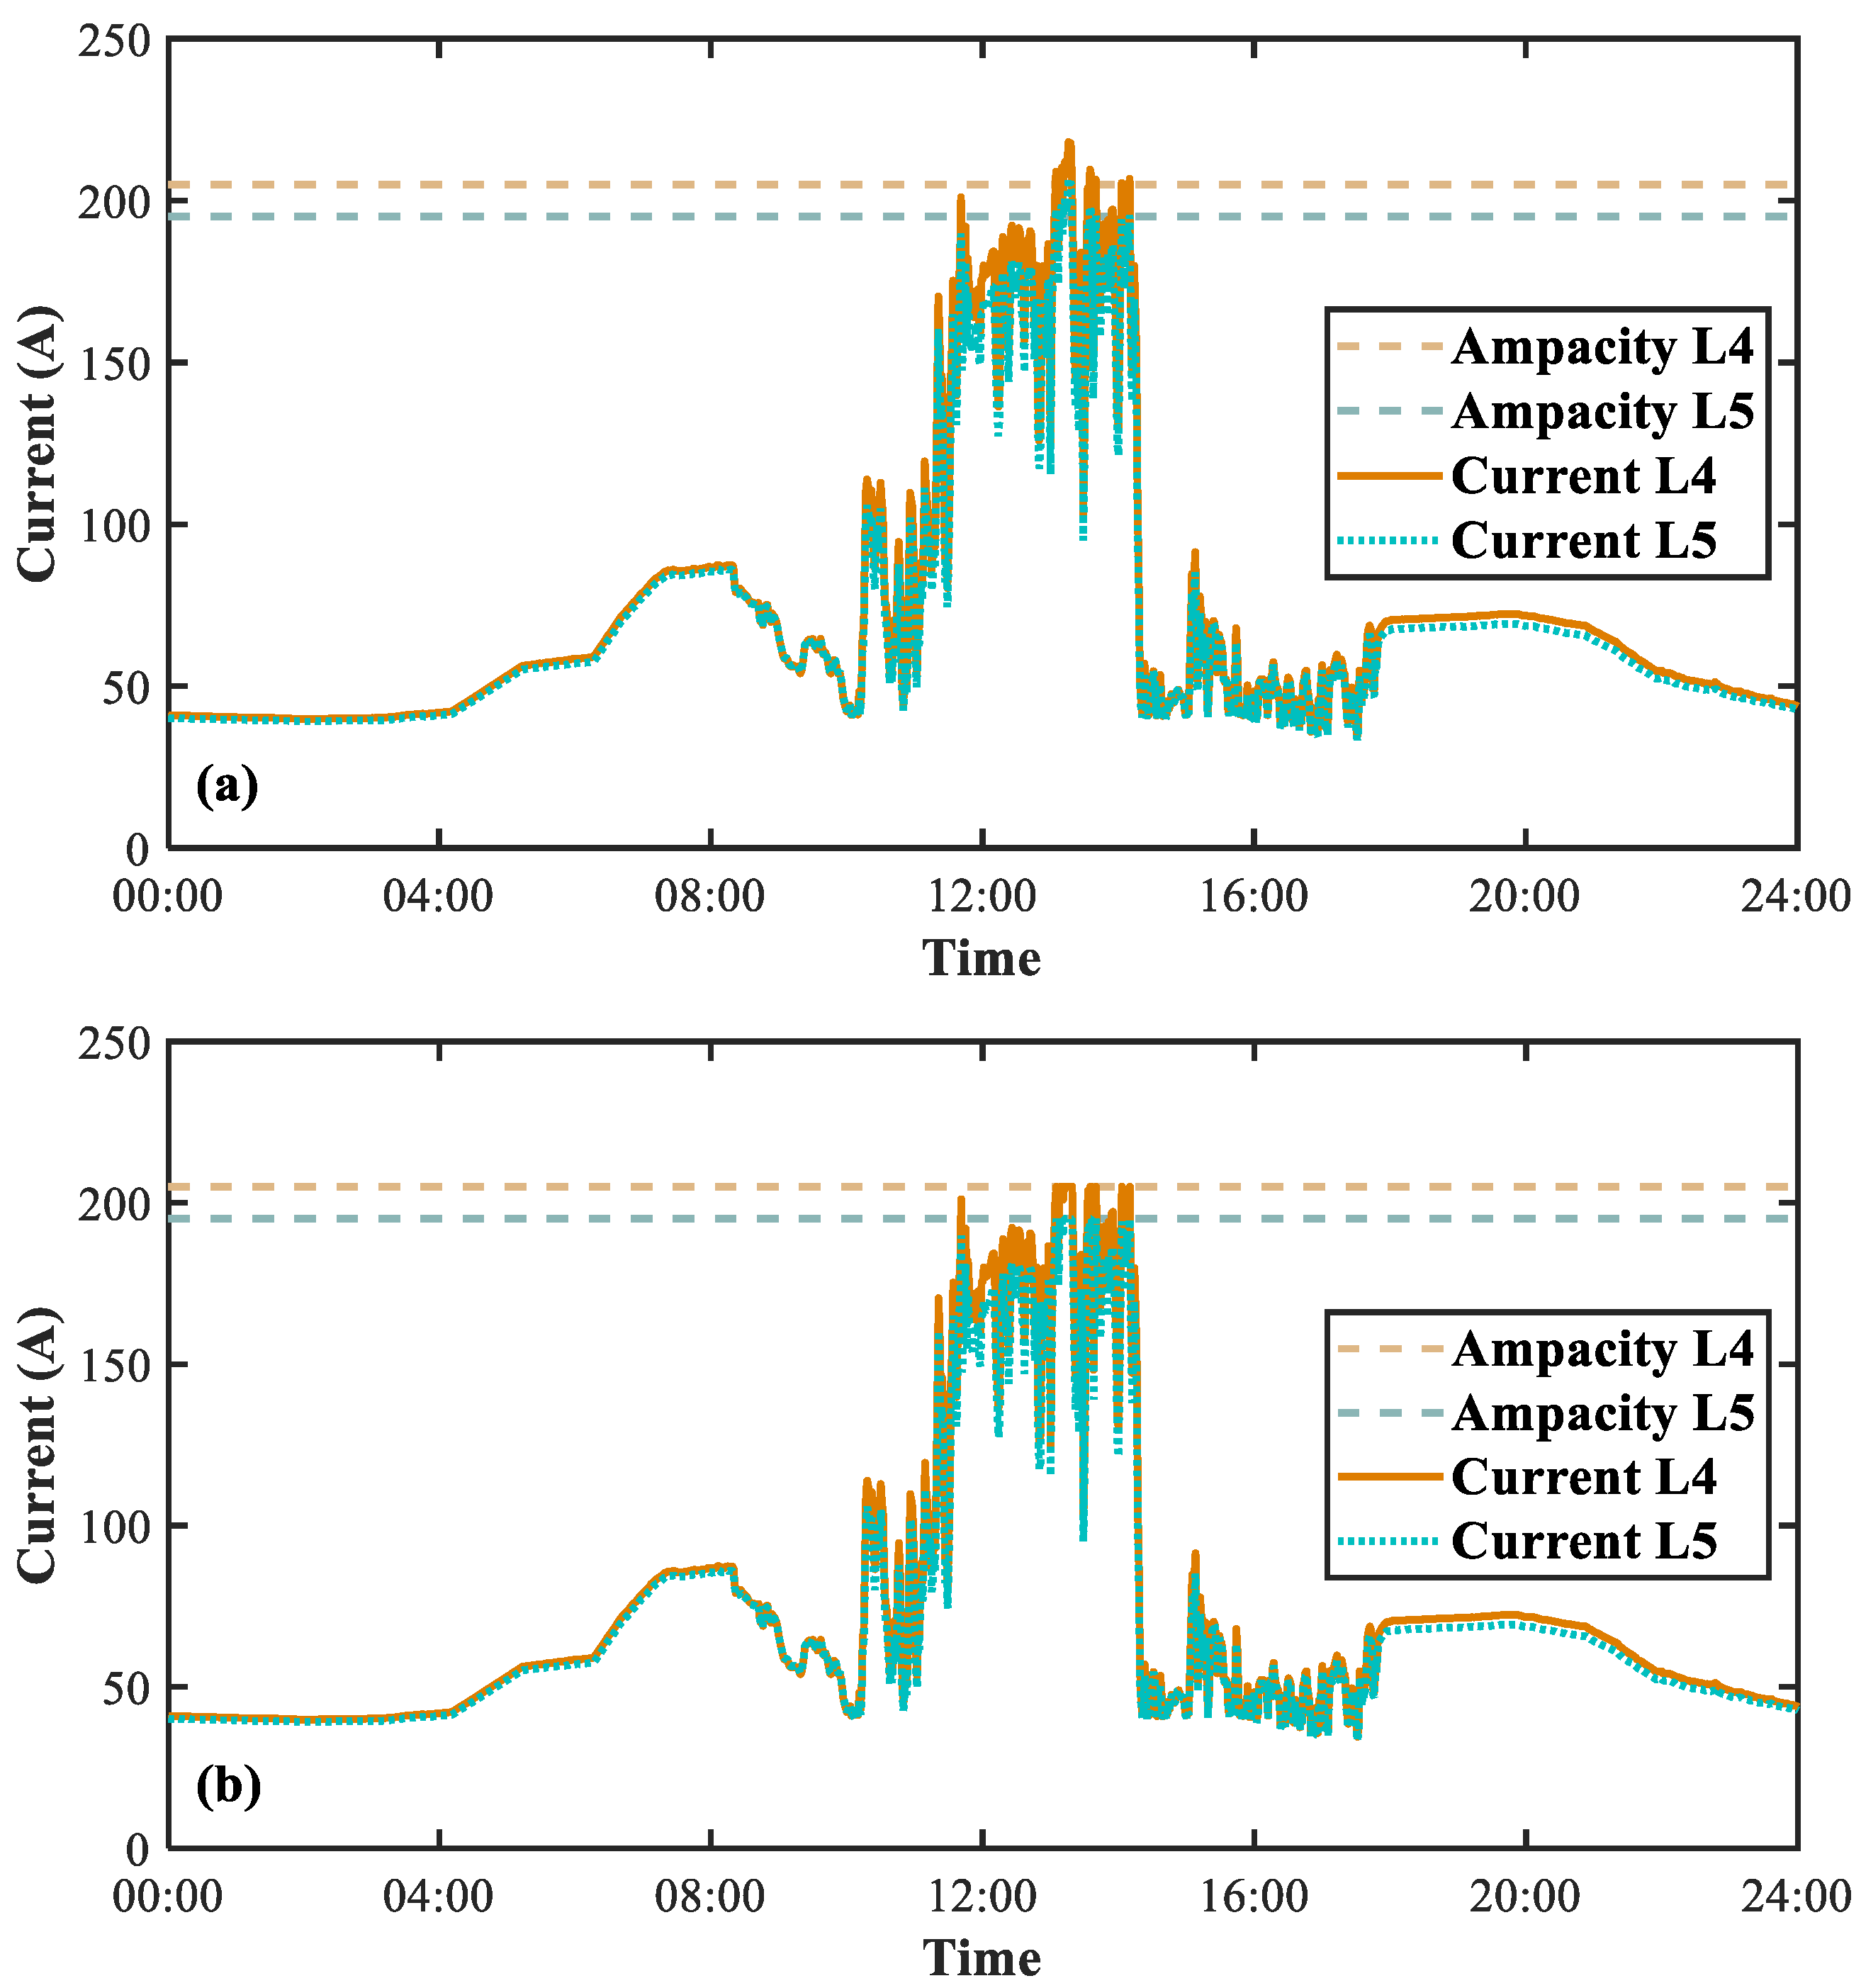
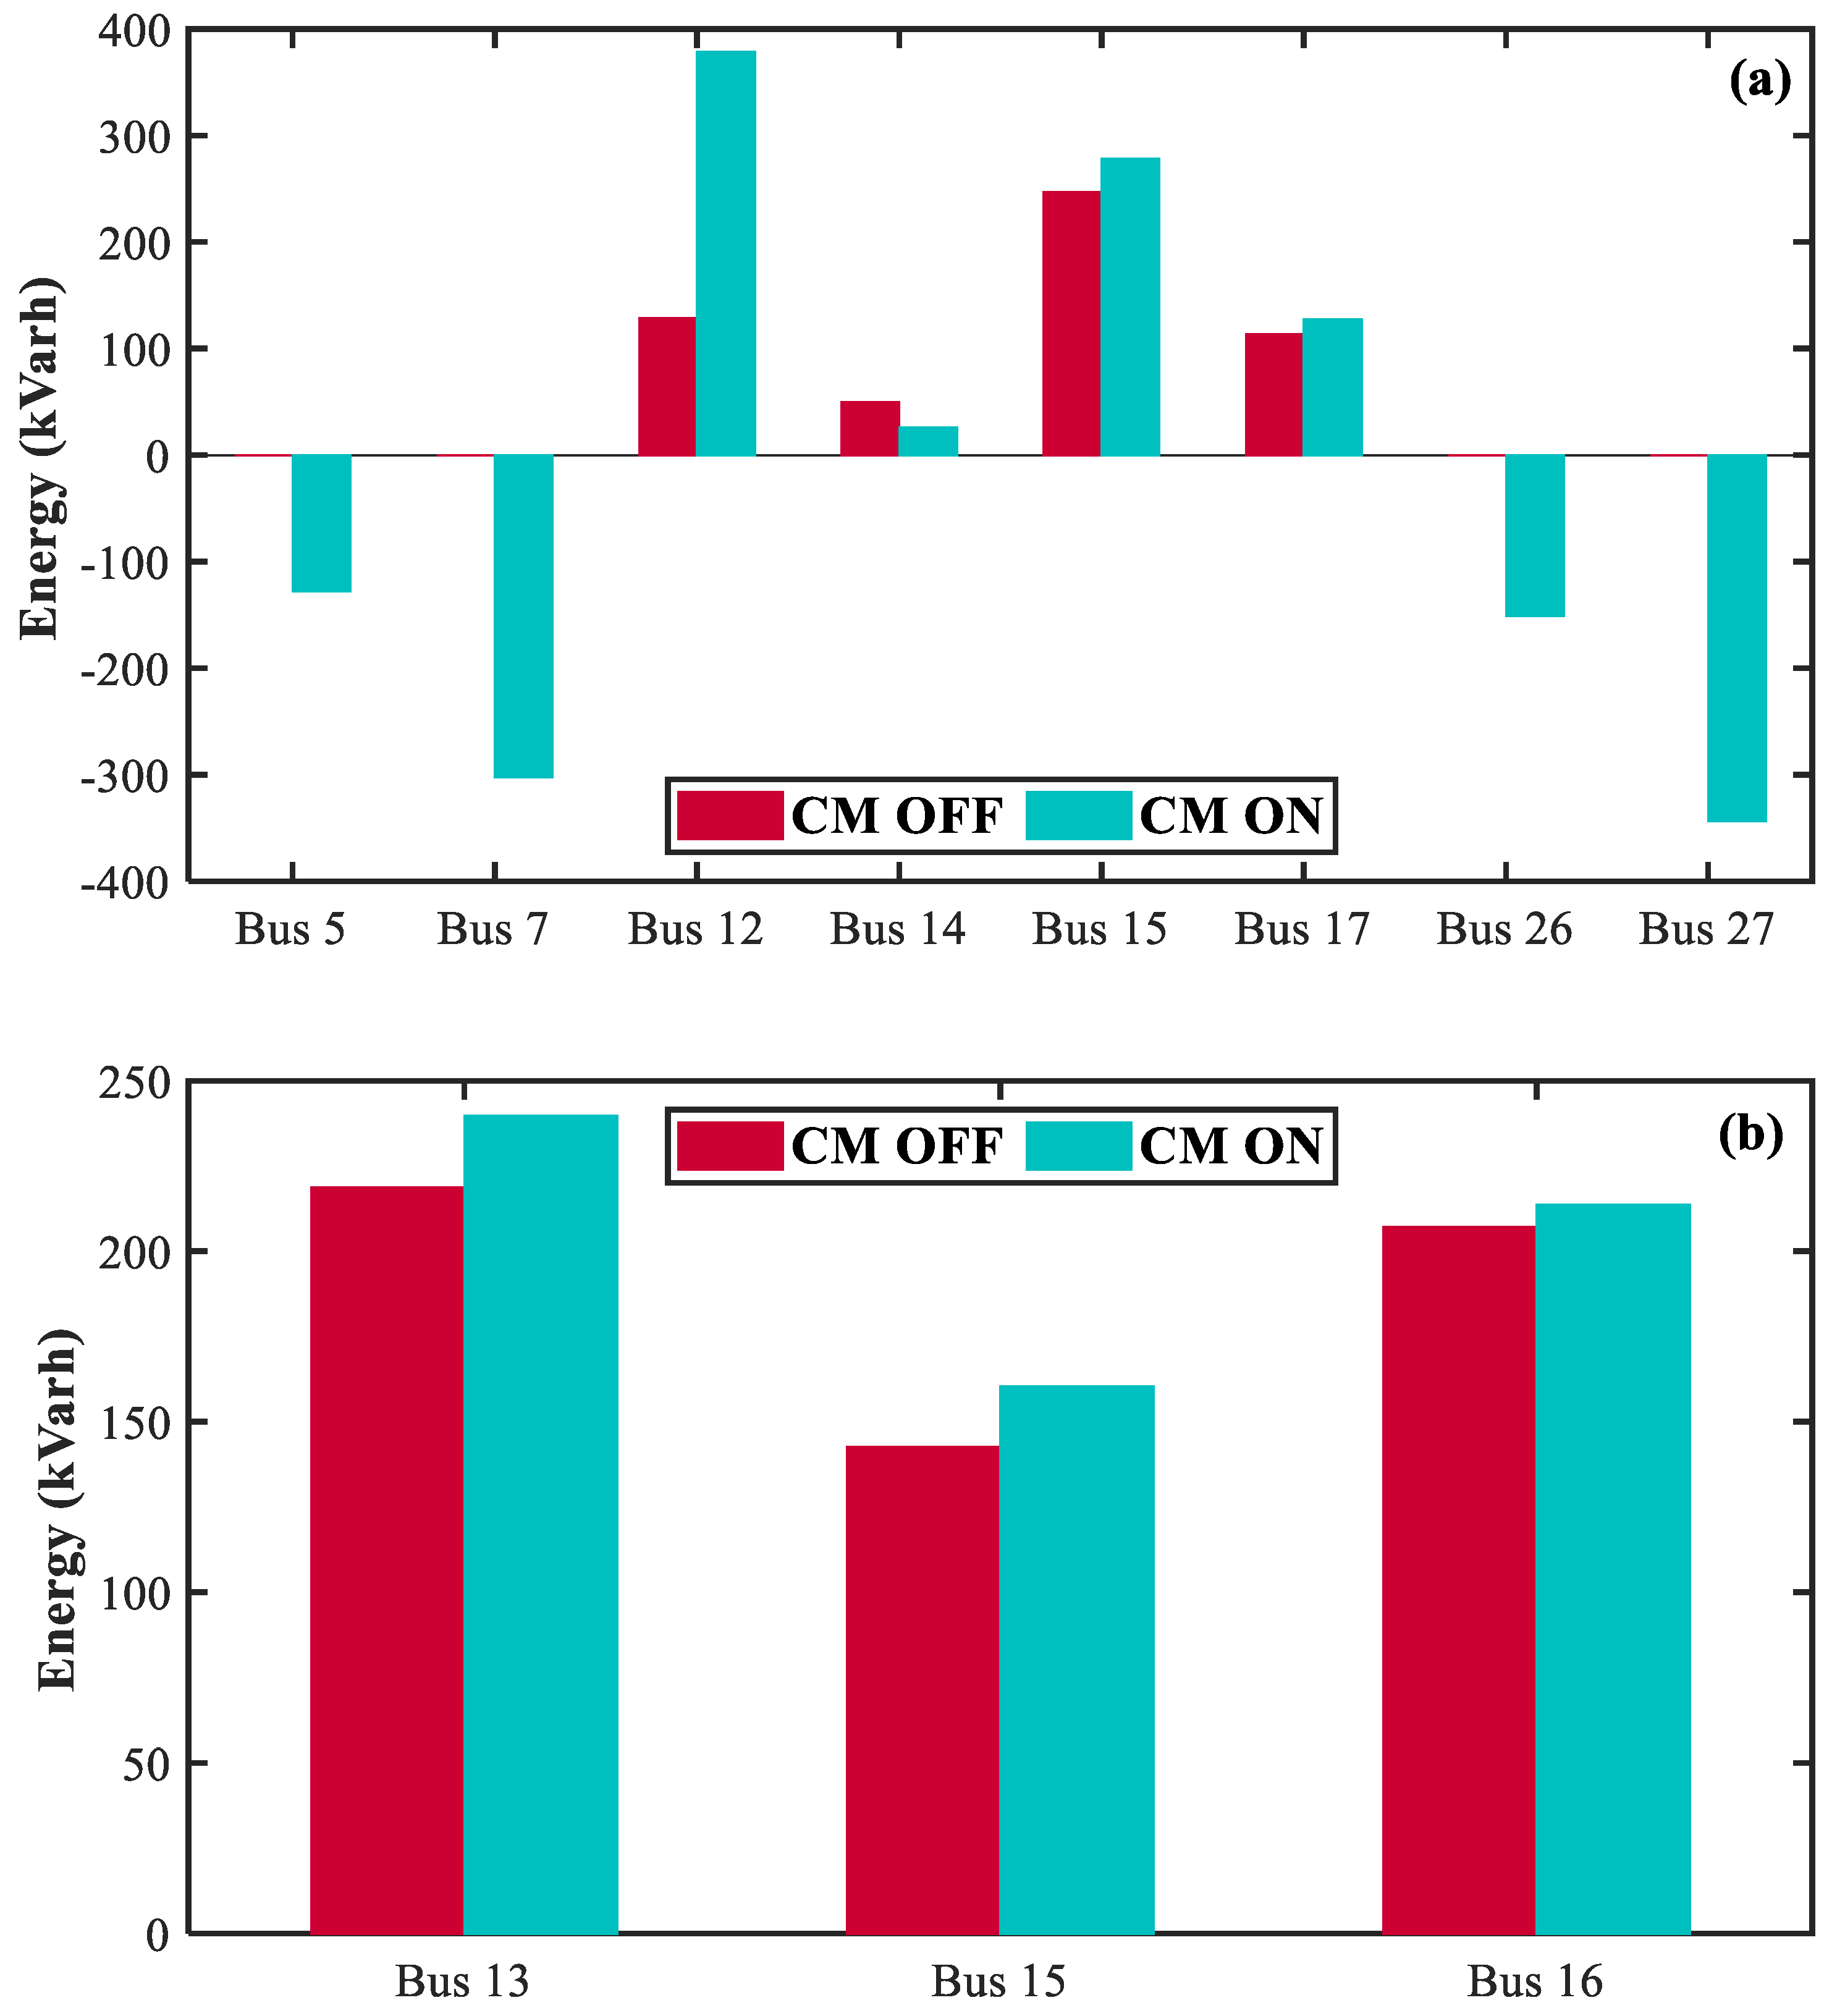
2.5. CM Strategy
- Step 1: The CC selects the DRES/BES of the node presenting the lowest impact on the network voltages to participate in the CM scheme. This is determined by means of the network sensitivity matrix:where is the inverse Jacobian matrix in the positive-sequence quantifying the voltage magnitude and angle () variations with respect to active () and reactive power () fluctuations. and are the sub-matrices of (7) containing the partial derivatives and , respectively. Using these sub-matrices, the CC can identify the available DRES/BES of the node with the lowest impact of the network voltages. This way, the interaction between the CM and the VR is kept as minimal as possible. Concerning secondary DNs, sub-matrix is considered in the DRES/BES selection process since the network voltages are more sensitive to active power variations due to the high ratio of the lines. On the contrary, in primary DNs, sub-matrix is used in the selection process due to the higher sensitivity of network voltages to reactive power variations. It is worth mentioning that in case either the Jacobian is singular or its condition number exceeds a certain limit, the sensitivity matrix can be estimated using the inversion-free analytical calculations of [21].
- Step 2: The CC communicates with the identified LC to adjust its available DRES/BES converter active and reactive power to reduce the currents flowing through the lines.
- Step 3: The LC, via a dedicated PI controller, increases the DRES/BES output current as requested by the CC, i.e., . Additionally in this case, the use of the reactive power is prioritized against active power. Therefore, the BES active power is used only if the BES maximum reactive power has first been reached.
- Step 4: If the maximum active power has been reached, the process shifts to the succeeding DRES/BES (according to (7)), having the lowest impact on the network voltages.
- Step 5: The procedure repeats till the line overloads have finally been eliminated.
3. Developed Network Monitoring System
3.1. Mode Estimation
- Step 1: The available signals (dynamic responses) are sampled at a fixed rate allowing the use of z-transform as follows:where and constitute the transfer function of the system and is the unknown input of the system, e.g., noise. The polynomials of (9) are defined asHere, , and are the parameters of the autoregressive model, the exogenous inputs and the moving average model of order , and , respectively. The optimal model order is determined via an iterative process until a pre-defined tolerance between two successive steps h and is achieved [10]. This way, only the dominant system modes are included in (9). The coefficient of determination at step h is defined aswhere is the mean value of the measured signal y.
- Step 2: Screening of the derived mode estimates is applied to exclude possible artificial components. As such, we can consider modes with frequencies outside the range of 0.05 Hz to 3 Hz [22] and/or having a damping factor higher than, for example, 10 s.
- Step 3: If signals from several system buses are available, multi-signal analysis is performed via k-medoids clustering, considering as inputs the mode frequency, damping factor and normalized energy, the latter being defined for the i-th mode (here, i = 1, …, W) as
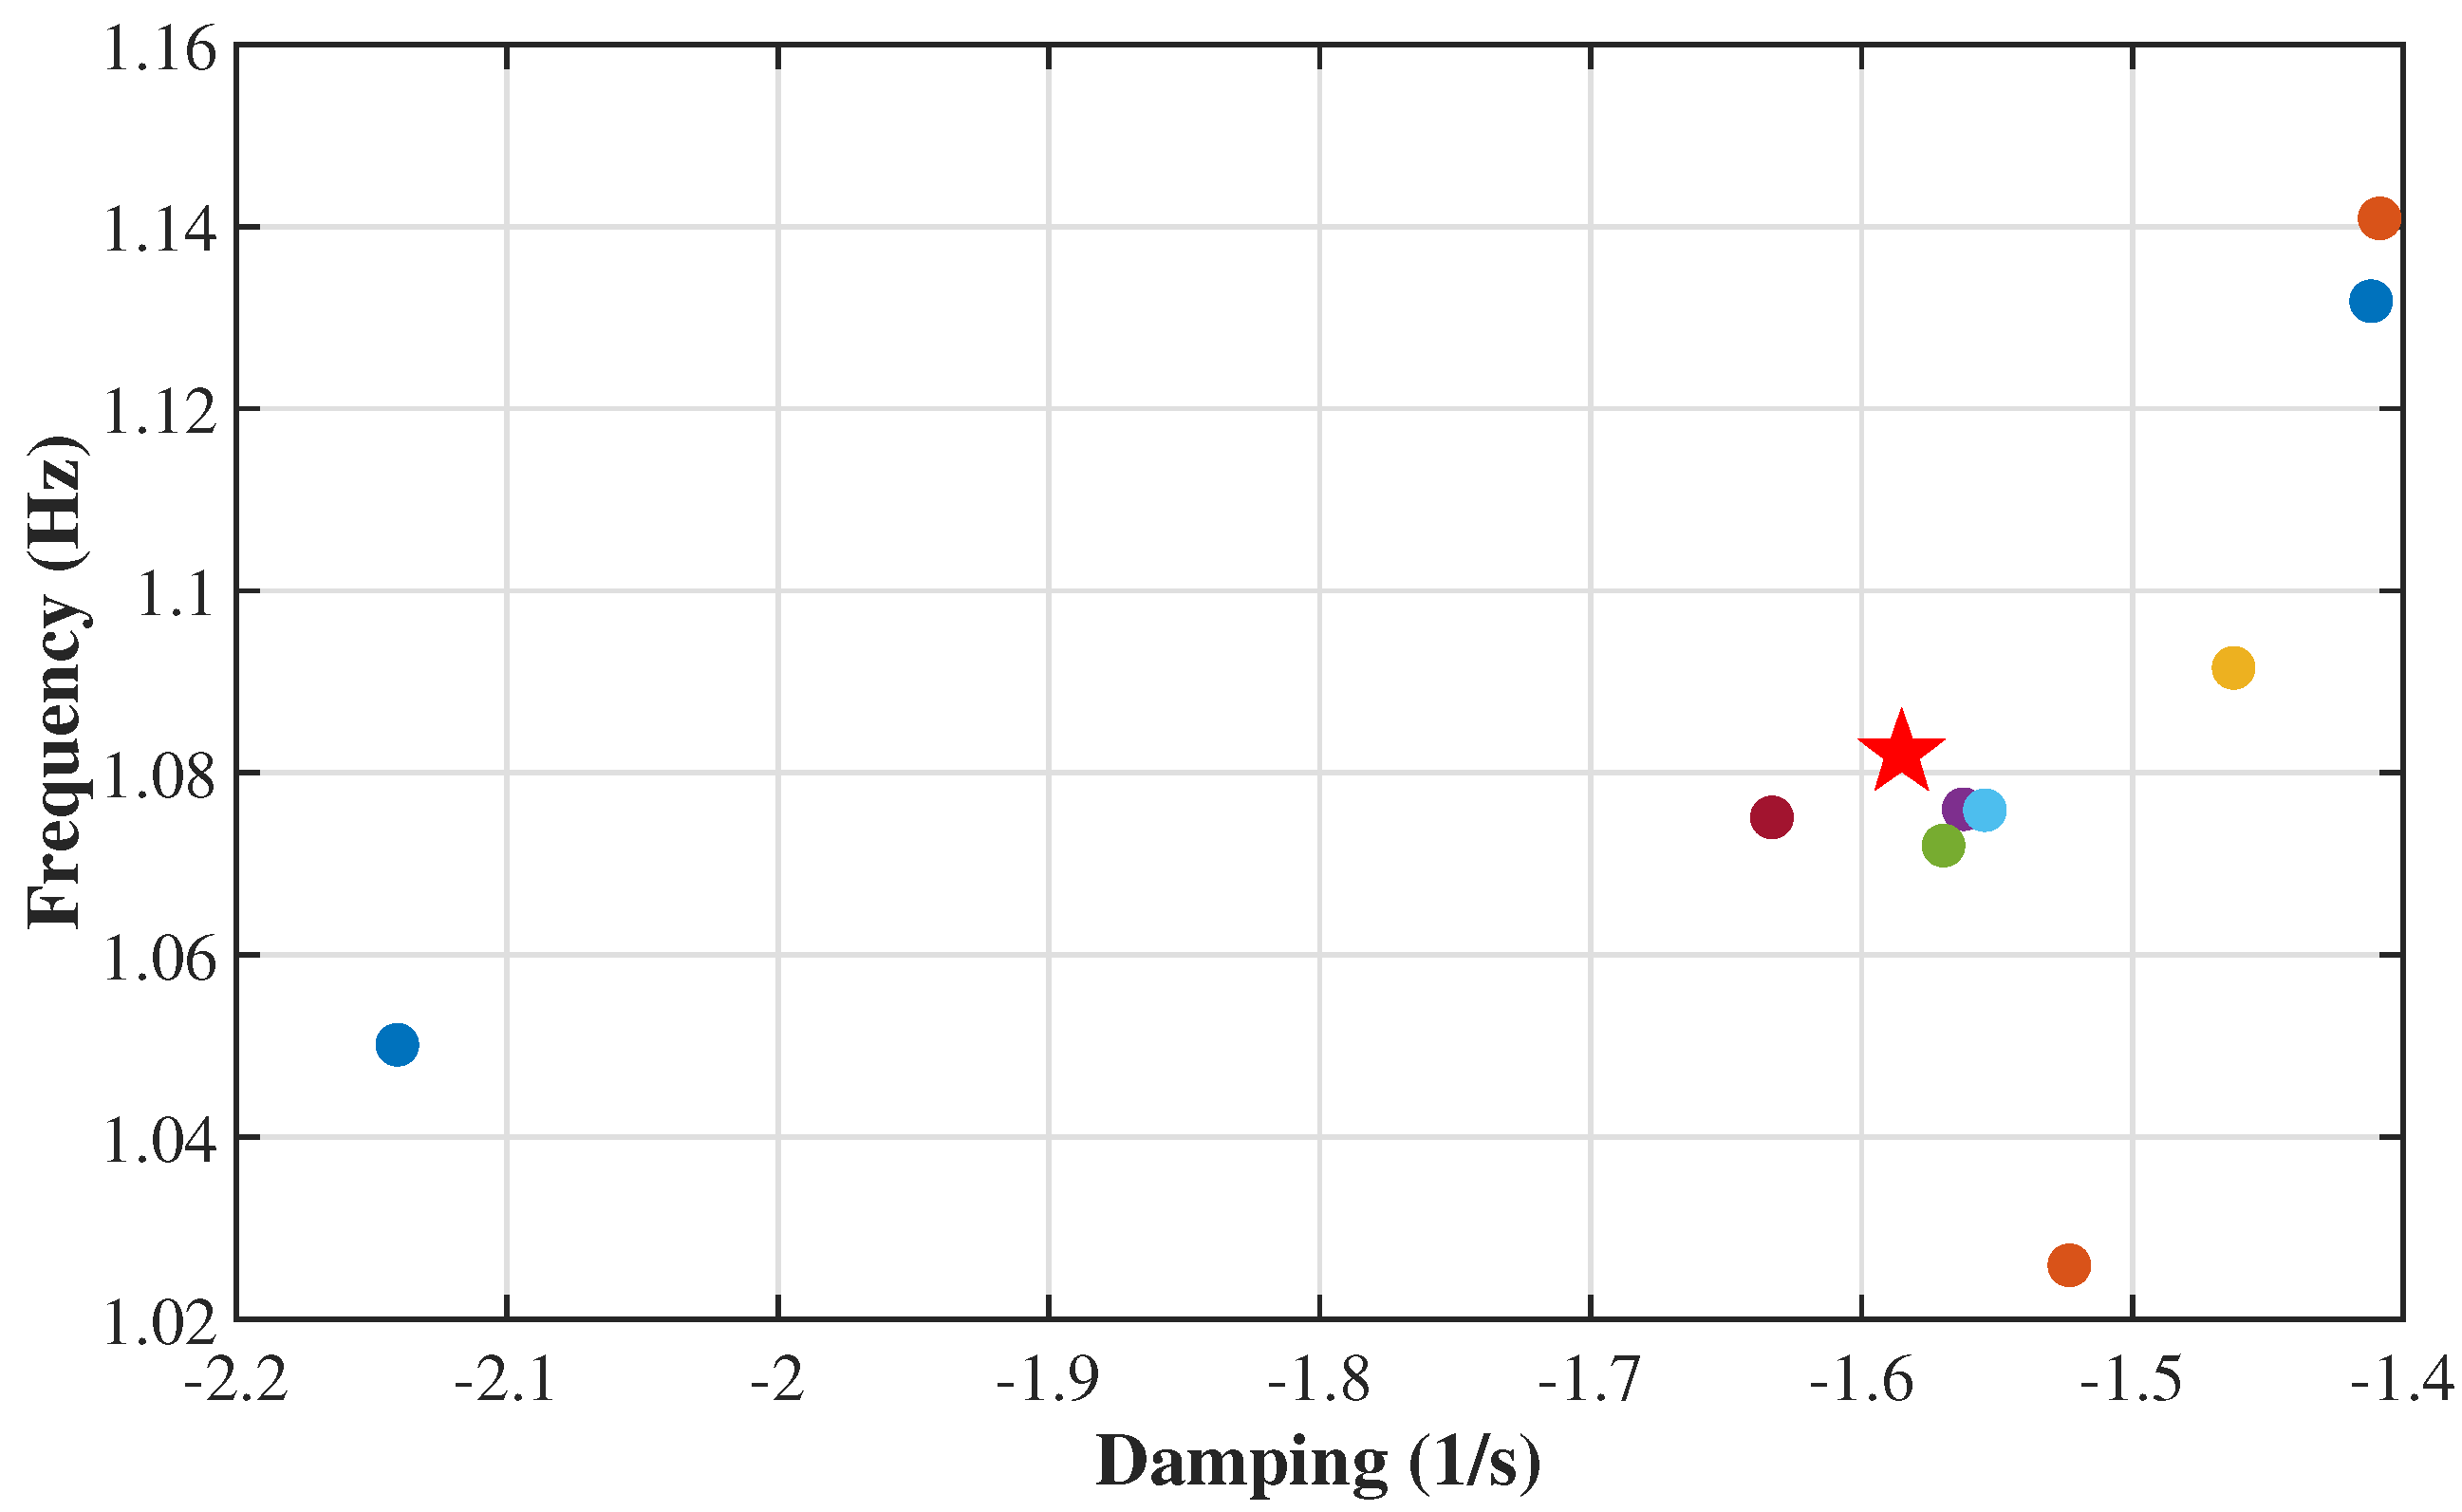
- Step 4: A two-step mode classification procedure is applied. Initially, modes are classified in terms of mode frequency, i.e., low (below 1 Hz) and high frequency (above 1 Hz) oscillatory modes [22]. At the second level, modes are distinguished as poorly or well damped. The mode with the lowest damping factor is characterized as the critical system mode and is used as a indicator of the overall system small-signal stability.
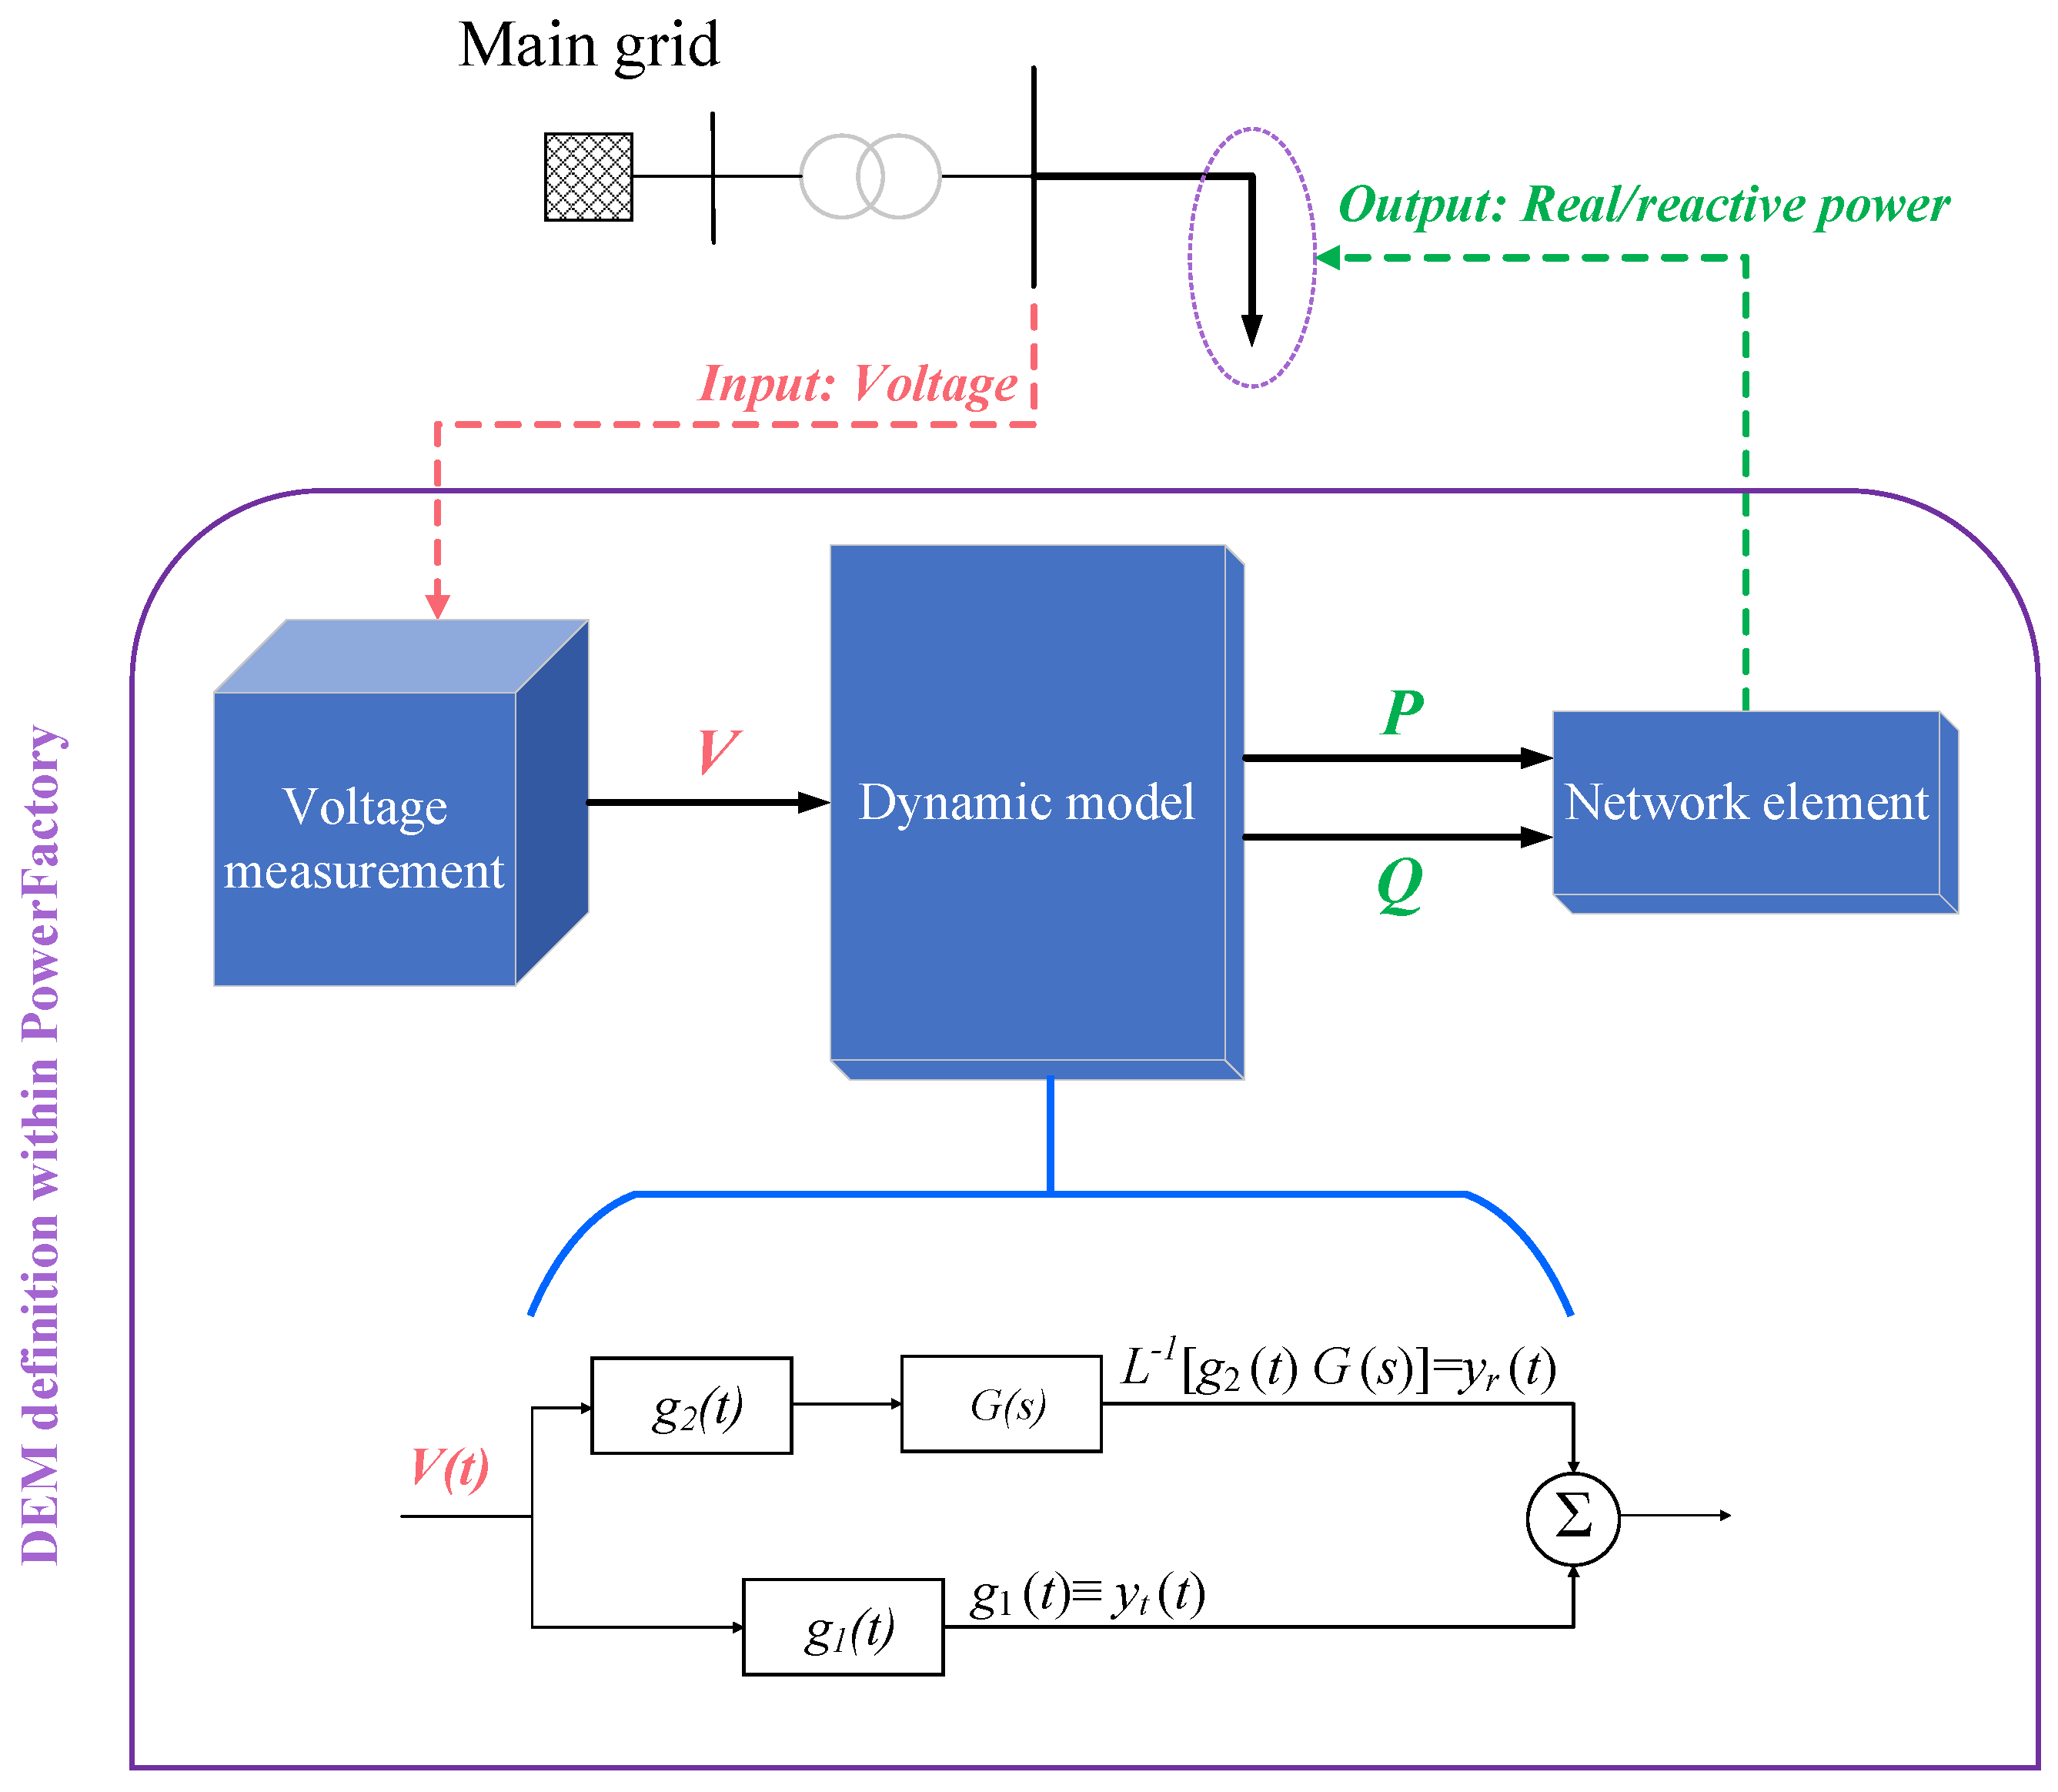
3.2. DN Dynamic Equivalent Modelling
4. Simulation Model
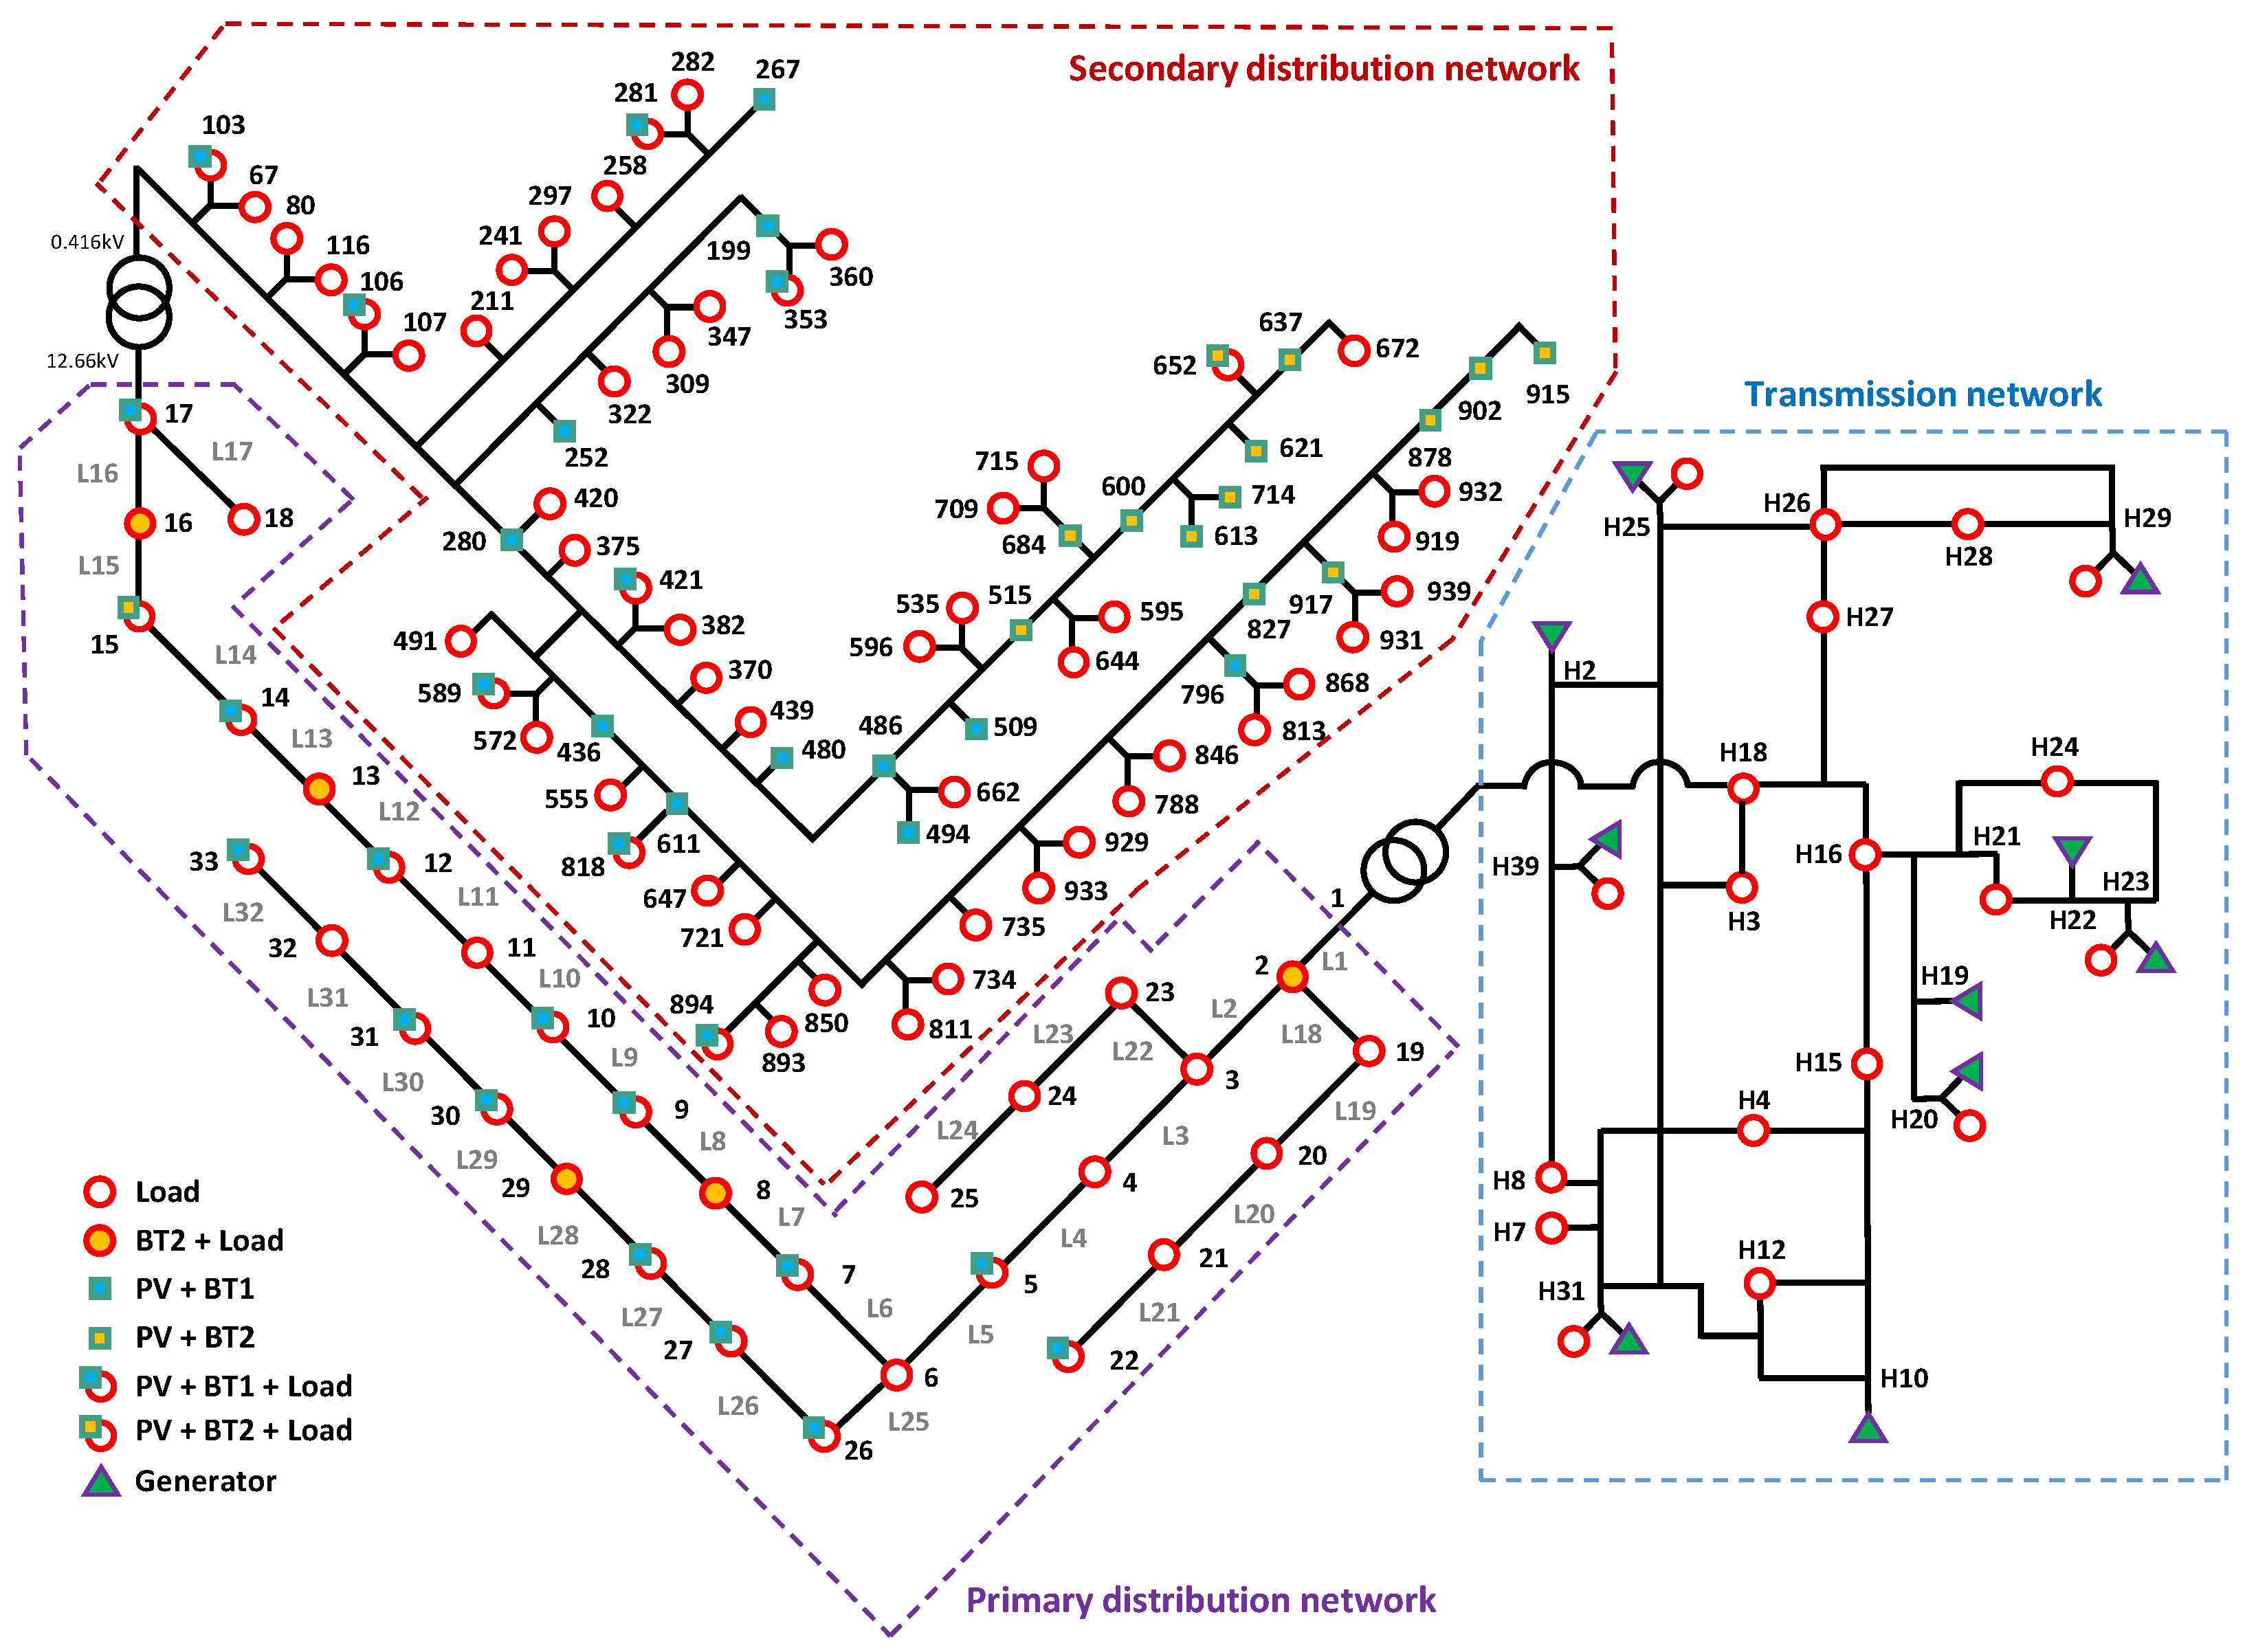
4.1. T&D Network
4.2. Quasi-Static Modelling
- BT1: are only equipped with PS capabilities, assuming an initial = 50%,
- BT2: provide VR, VUM and PS ASs, assuming an initial = 30% and 10% during a cloudy and a sunny day, respectively.
4.3. Power System Dynamics Modelling
5. Quasi-Static Simulation Results
5.1. Quasi-Static Simulation
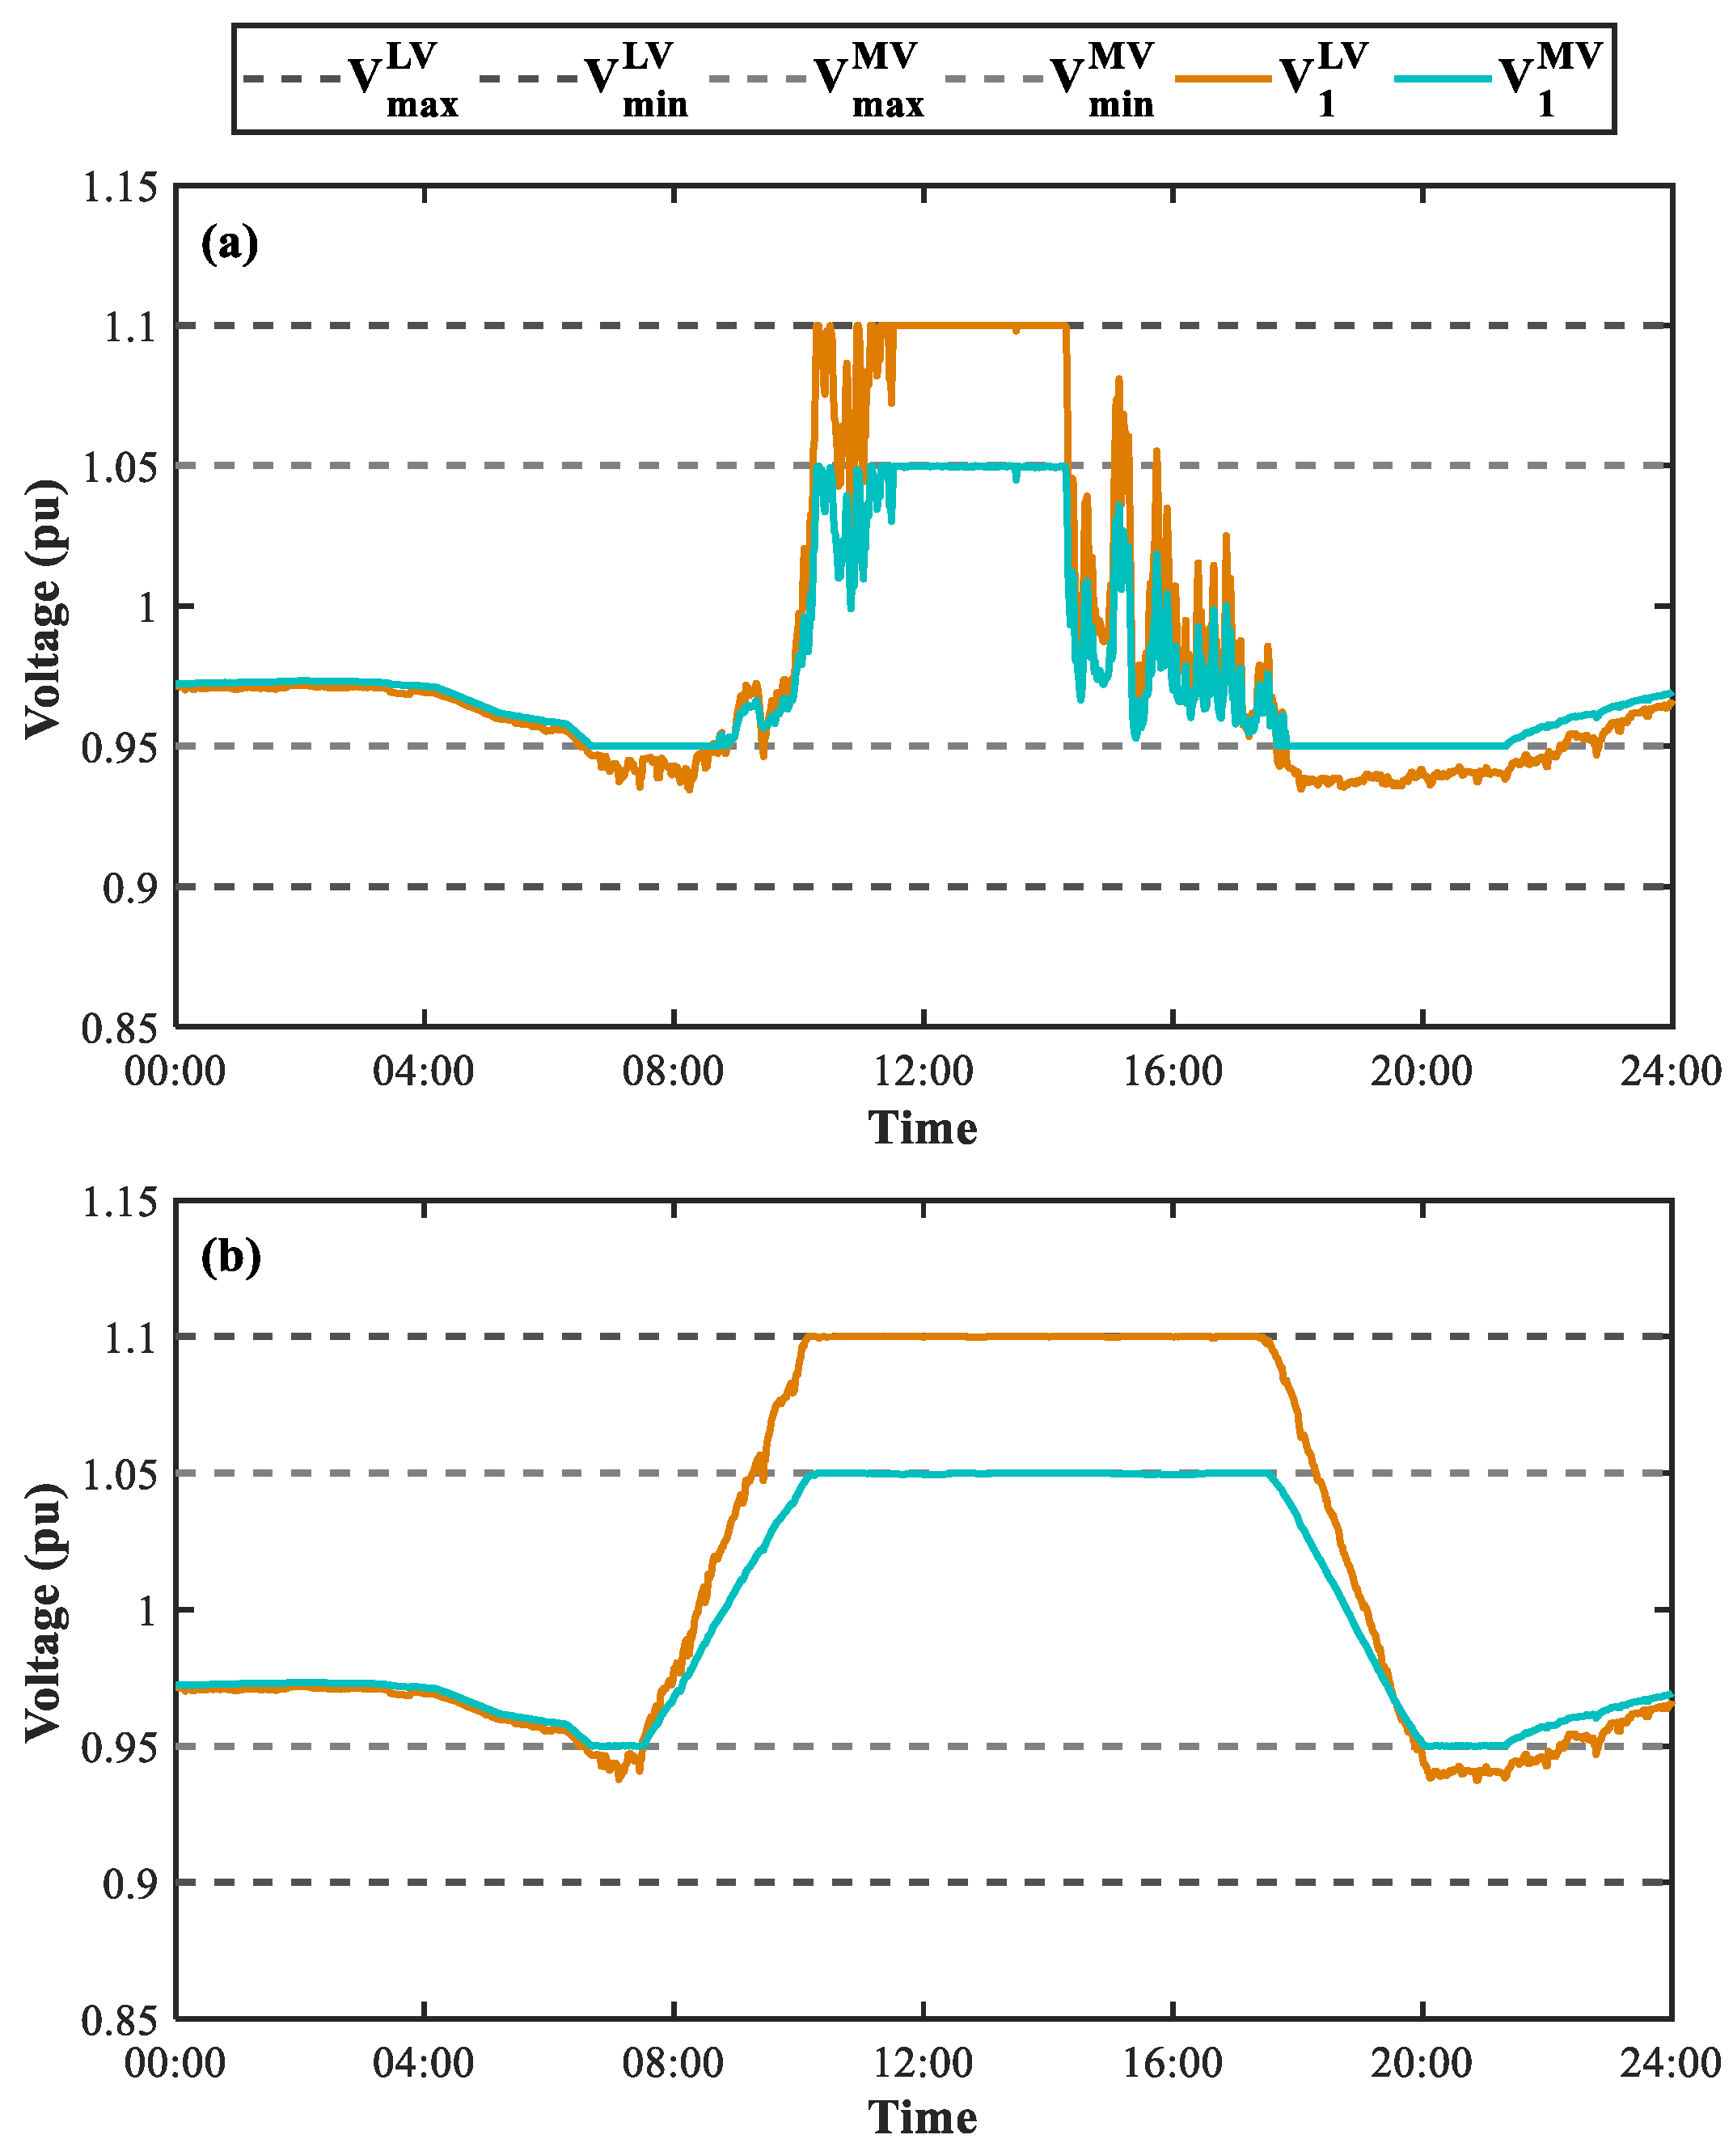
- Scenario 1: VR, VUM and PS are examined
- -
- Sunny day: in the primary DN VR is provided by the DRES/BT2 units. In the secondary DN, both VUM and VR issues are solved by the DRES/BT2 units; BT1 units remain idle.
- -
- Cloudy day: in the primary DN PS and VR are provided by the DRES/BT2 units. In the secondary DN, PS, VUM and VR issues are solved by the DRES/BT2 units. In both the primary and secondary DNs BT1 units are used to provide only PS AS.
- Scenario 2: VR, VUM, PS and CM are examined
- -
- Cloudy day: in the primary DN PS, VR and CM is attributed to DRES/BT2 units and PS to BT1 units. For the secondary DN the same assumptions as in Scenario 1 apply.
5.1.1. Scenario 1
- Comparing the cloudy and sunny day:
- -
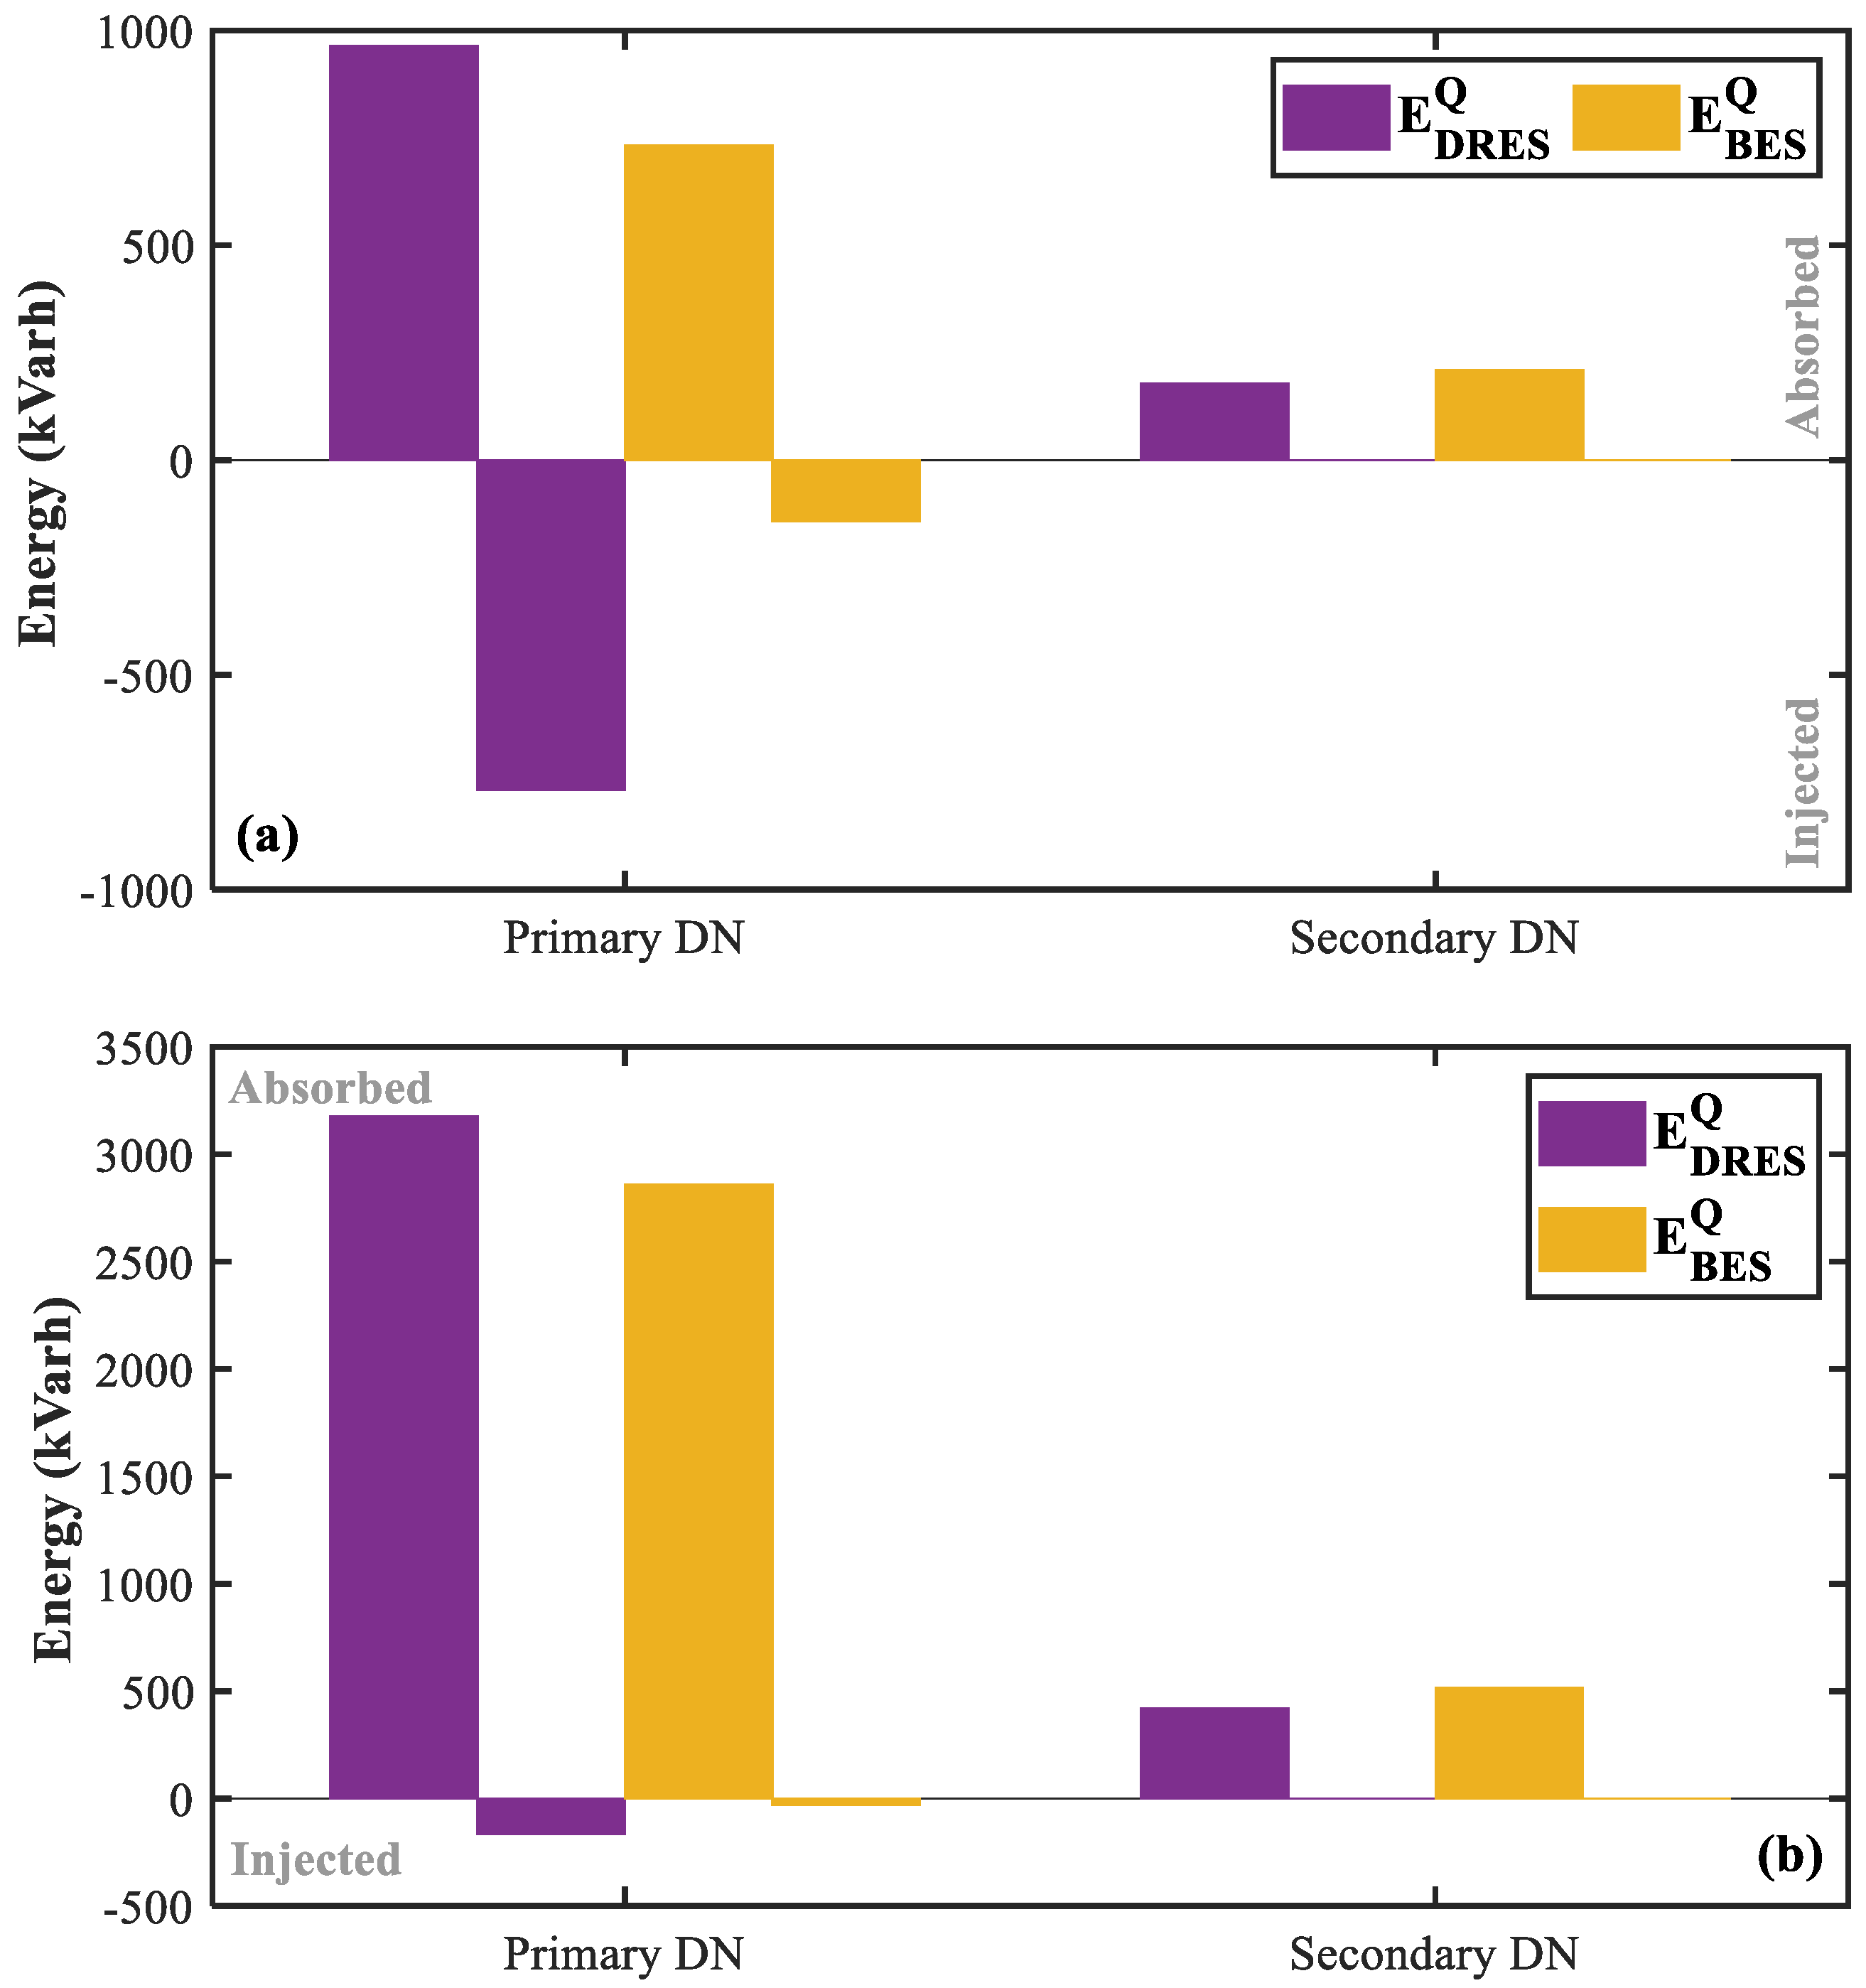
- Considering the cloudy day significantly higher amounts of energy are used for PS compared to VR. This is because of the excessive primary source (PV) fluctuations and their pronounced effect compared to network overvoltages.
- -
- Considering the sunny day, due to the higher PV generation and the inherently smoothed sun irradiation, PS descends and VR becomes important; thus, high amounts of active and reactive power are absorbed to resolve the resulting overvoltage issues.
- Primary and secondary DNs:
- -
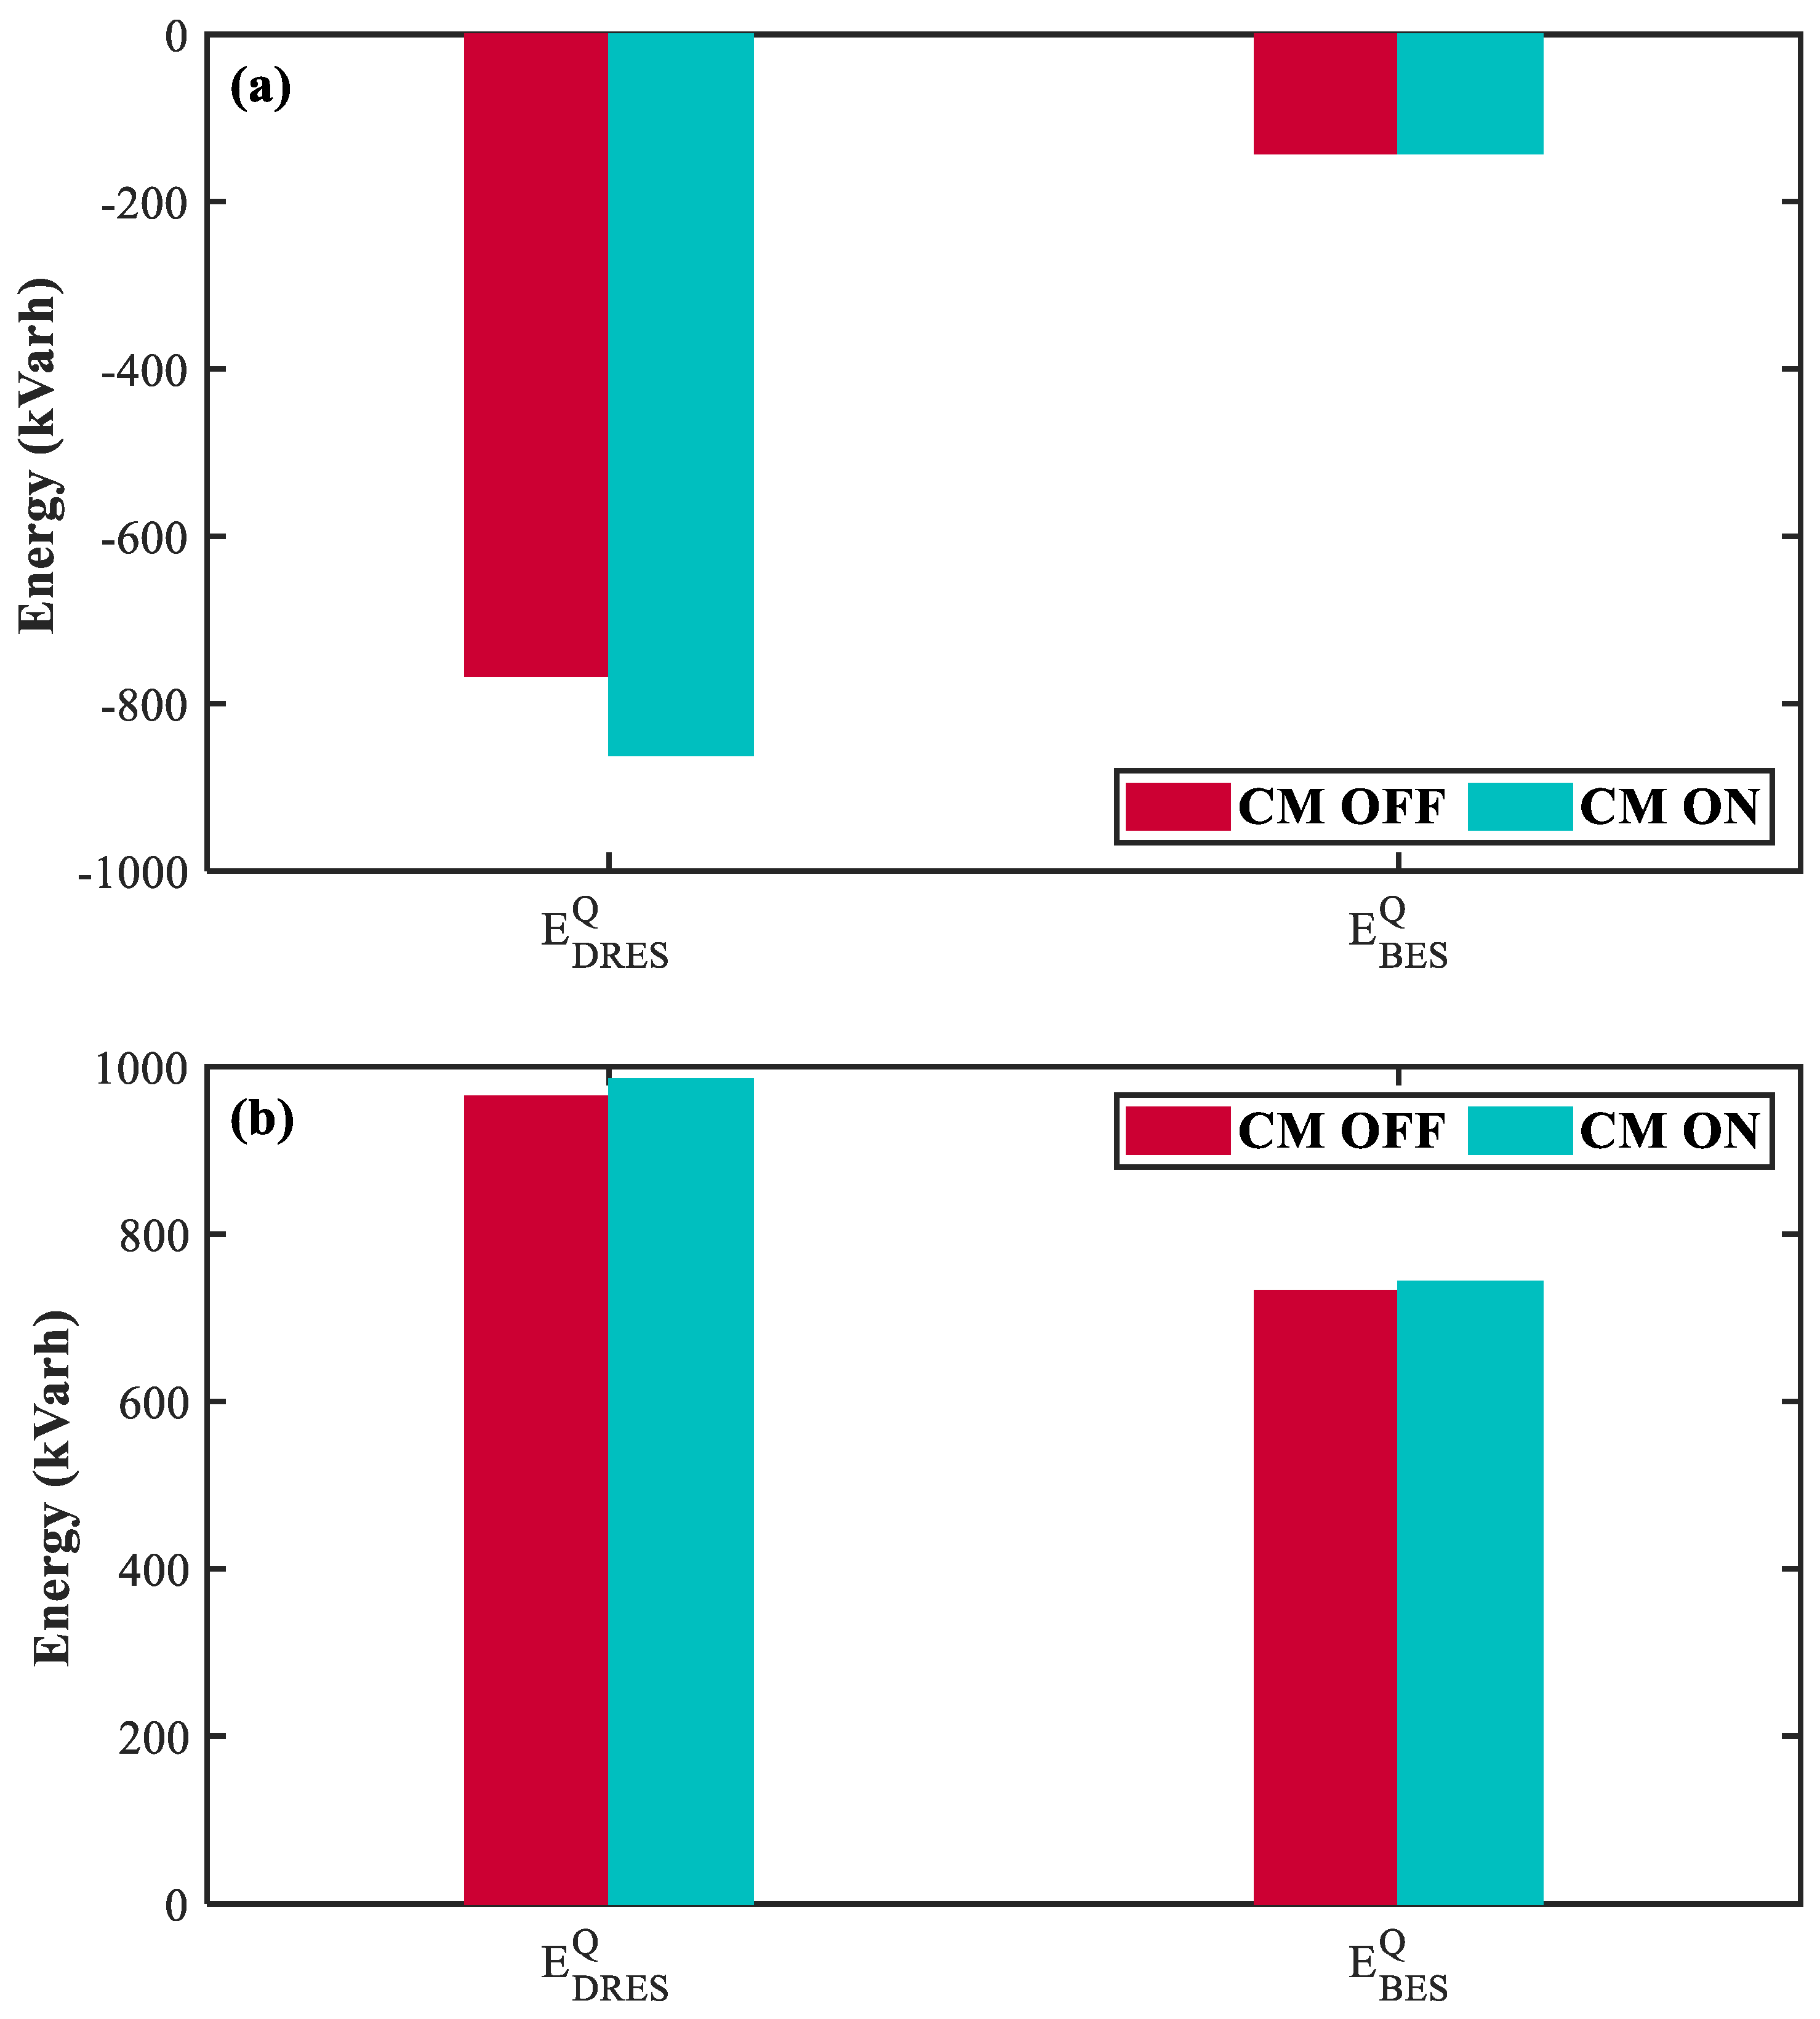
- Significant amounts of reactive power are used in the primary DN to solve overvoltage problems. Such issues are of less importance in the secondary DN for the examined case.
- -
- Due to primary DN stiffness higher amounts of reactive power are required for VR. This is also attributed to the higher ratio of the distribution lines.
- -
- accordingly, for VR at the secondary DN more active power is absorbed by the BES units than those of the primary DN.
5.1.2. Scenario 2
6. Dynamic Simulation Results
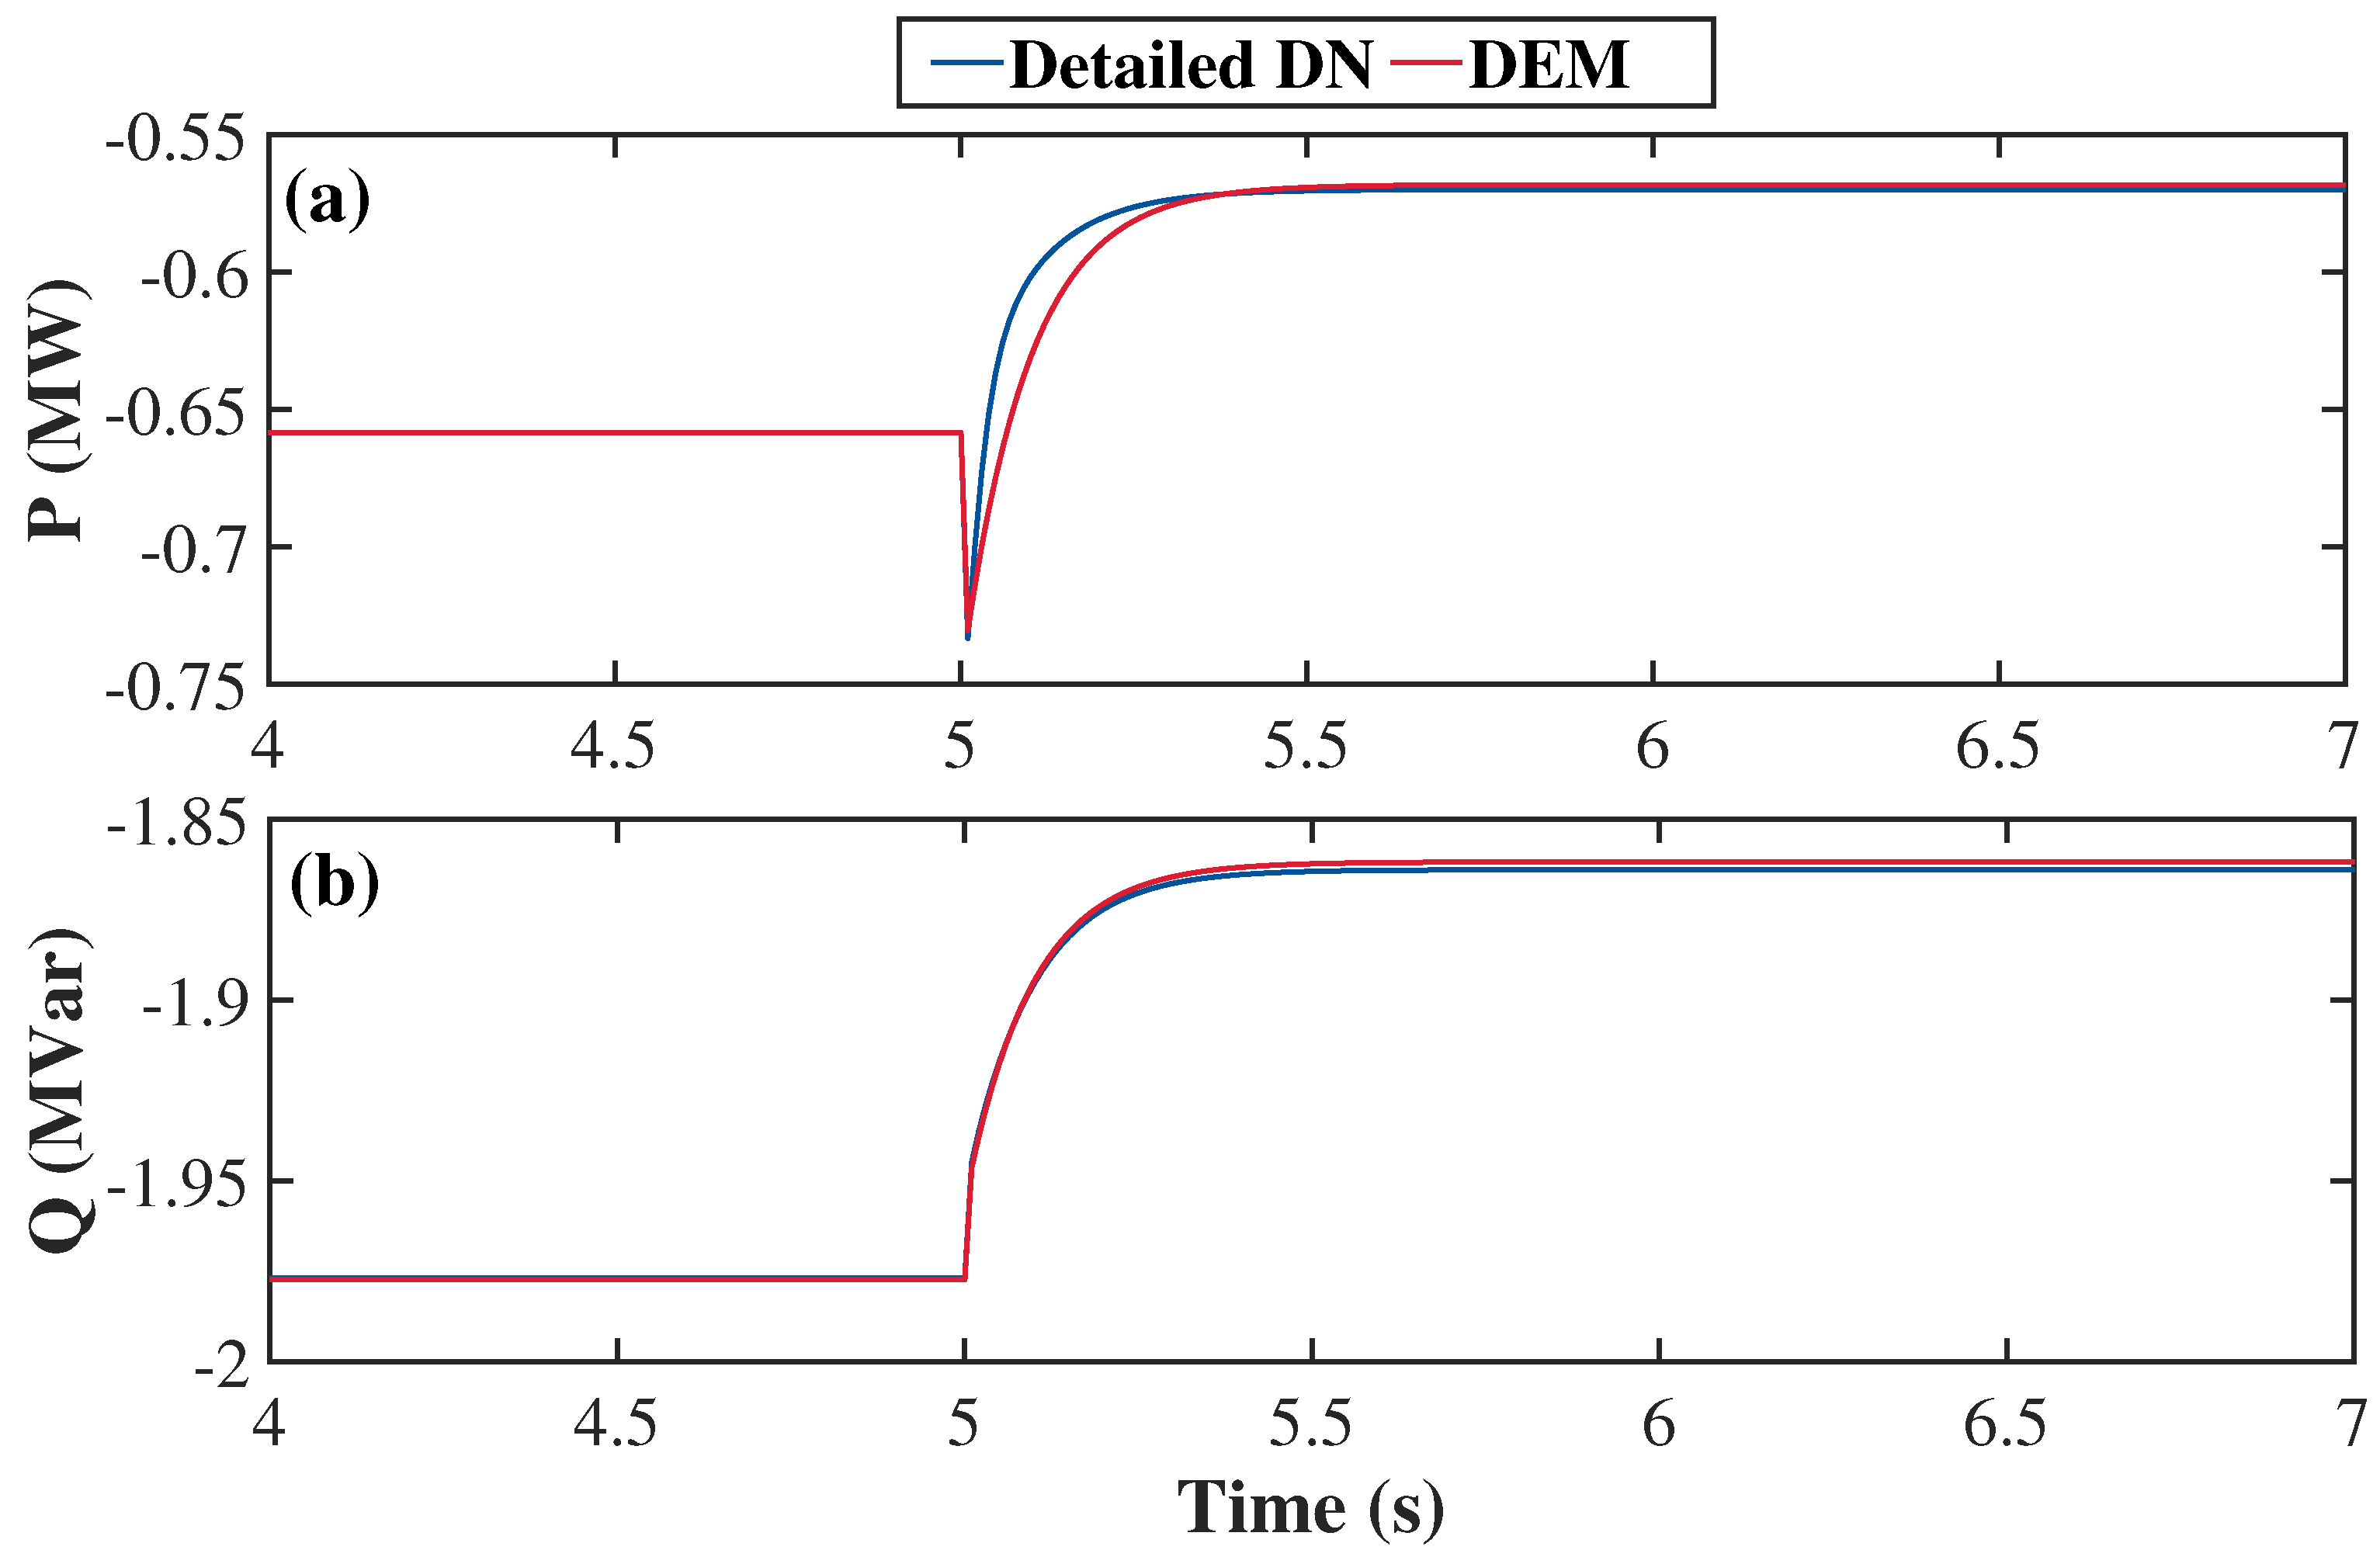
6.1. DN Dynamic Equivalencing
6.2. Effect of IBRs and Load Modelling
6.3. Mirroring the DN in Dynamic Simulations
7. PHIL Testing
8. Conclusions
- The proposed VUM, VR, PS and CM ASs can tackle holistically problems in both primary and secondary DNs under different operating conditions.
- The SoC recovery algorithm ensures the availability of BES units for the provision of PS ASs for the next day.
- The provision of the ASs depends on the weather conditions. This entails the different usage of the real and reactive power from DRES/BES units.
- Reactive power can be utilized to solve VR issues in primary DNs as well as in secondary DNs, despite the generally low distribution line ratio of the latter.
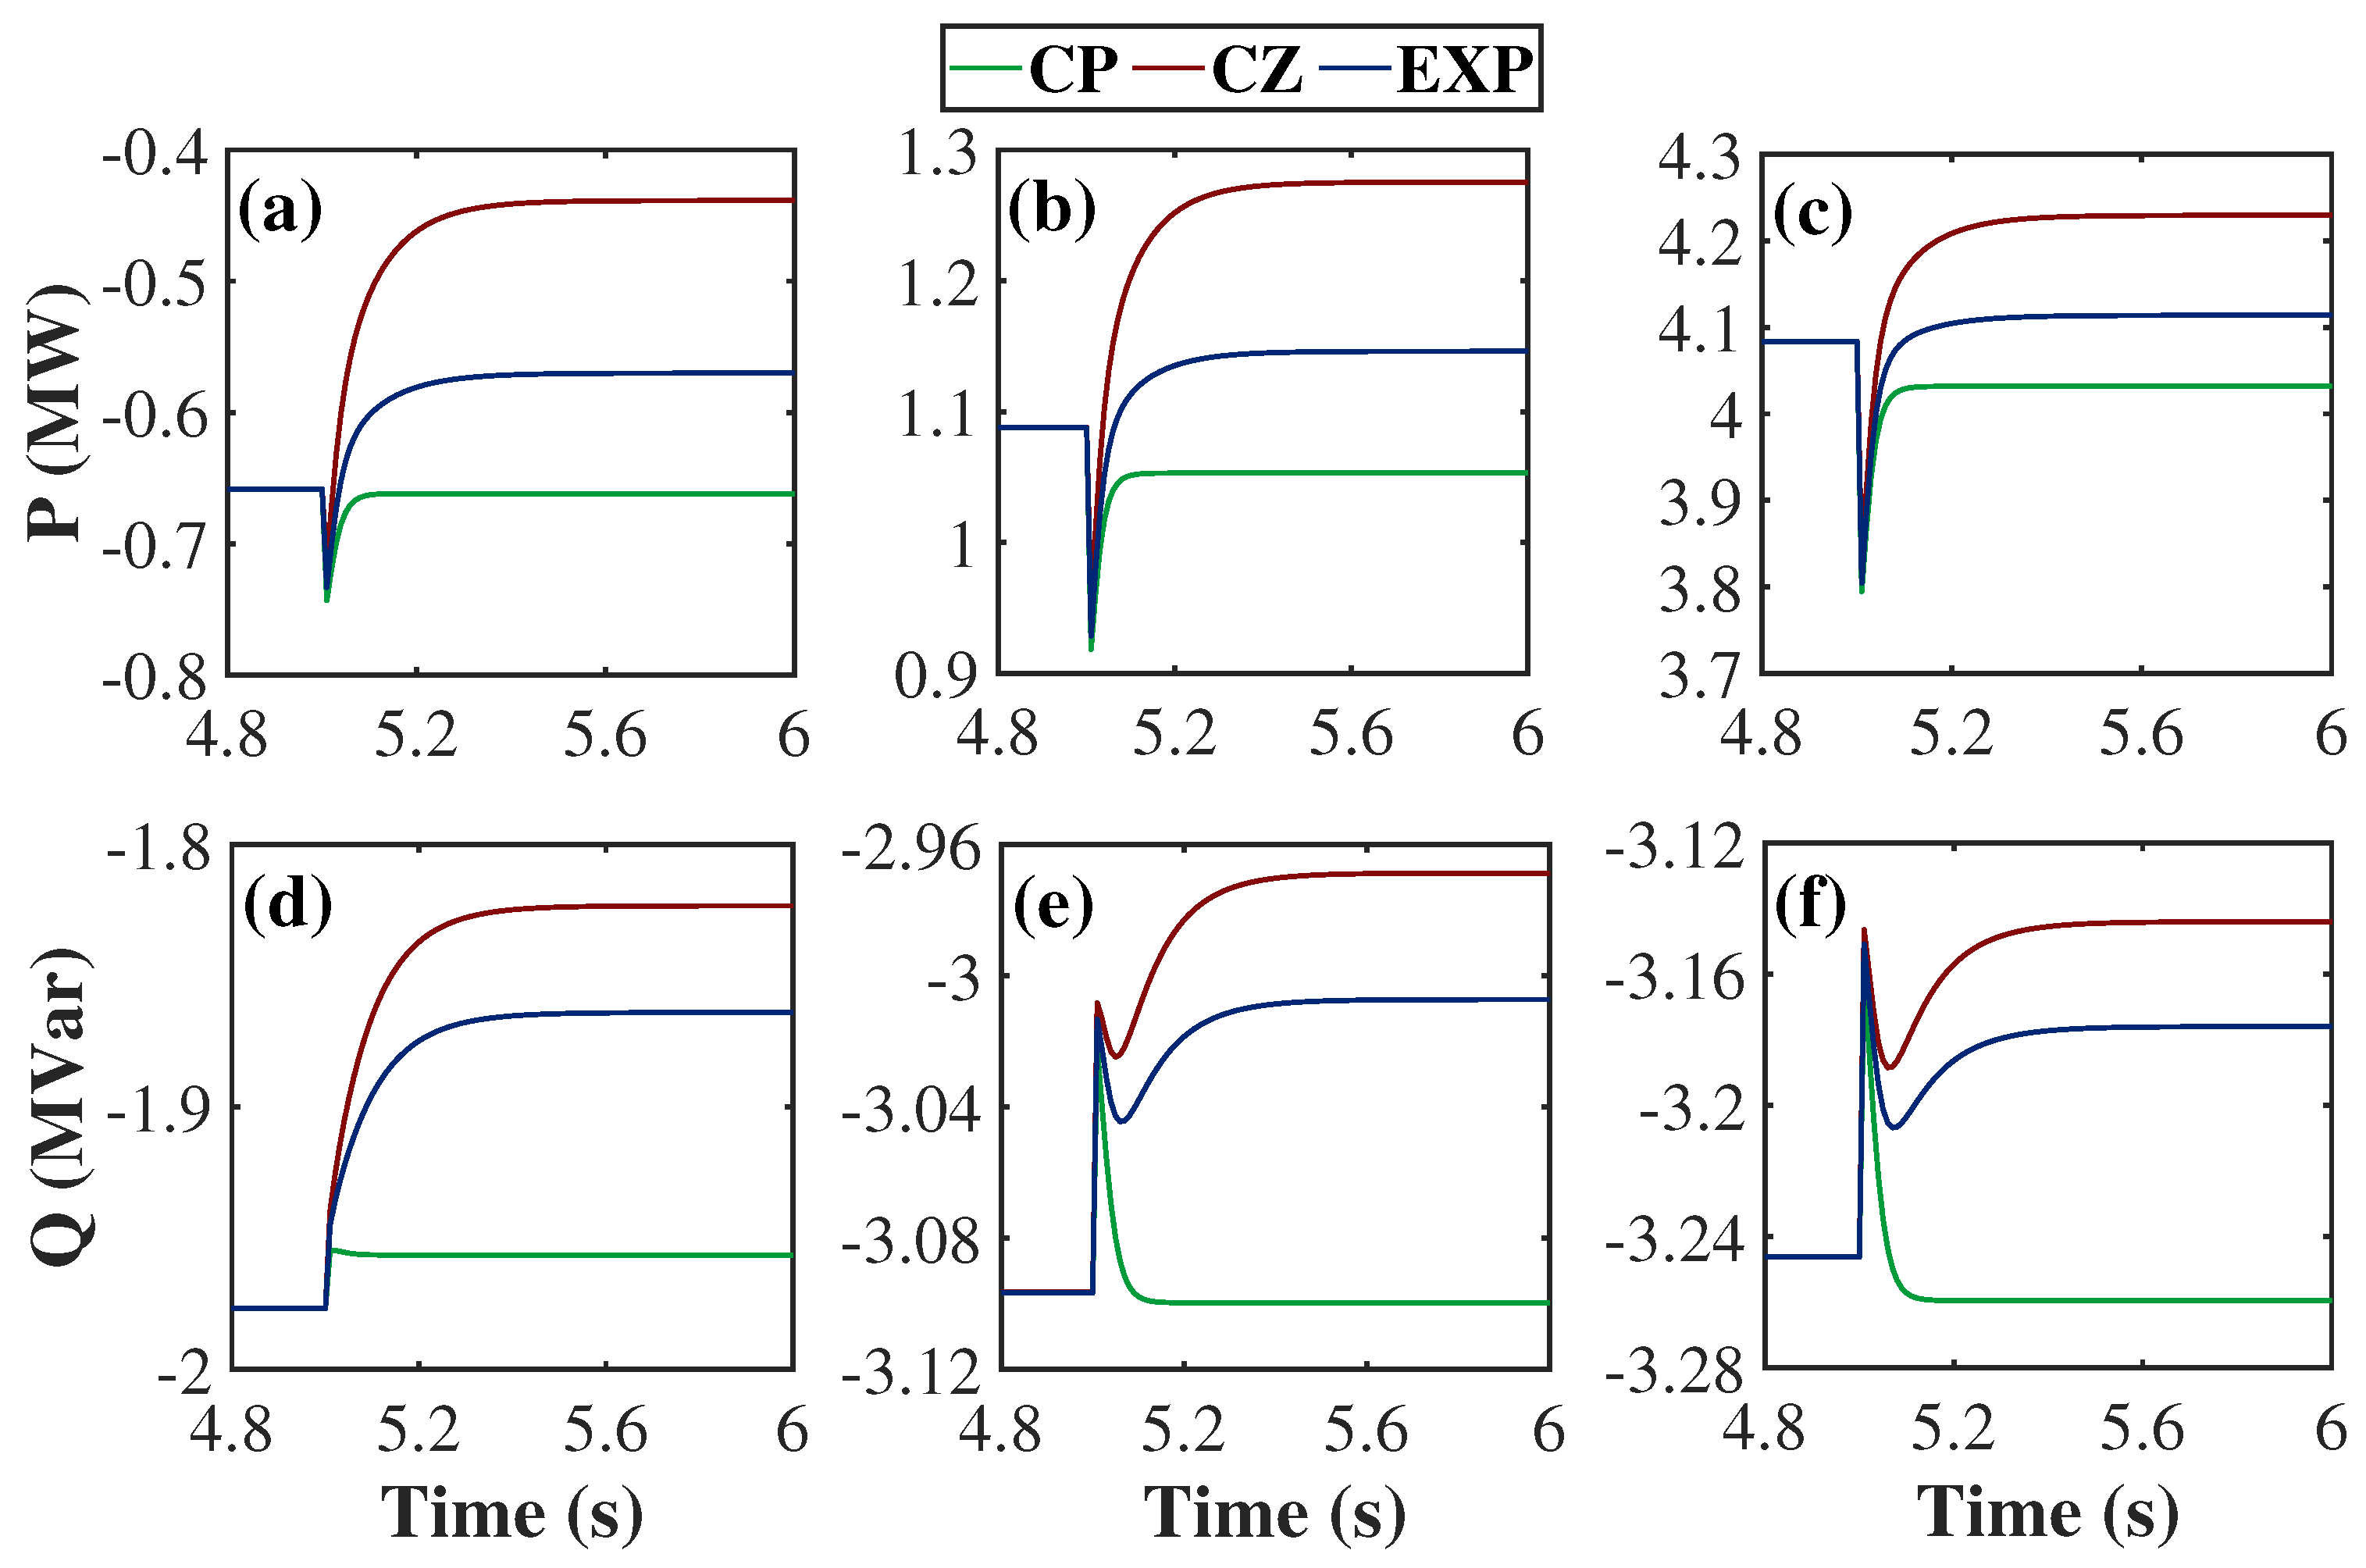
- IBRs influence the transient response of DNs. The transient overshoot of the real and reactive power response increases with IBR penetration and generally the DN dynamics become faster (most importantly for the real power) and more oscillatory (more evident for the reactive power).
- Load modeling has a significant impact on the steady state after the disturbance and the transient response. In particular, the new steady state depends on the DN power recovery that is directly related to the load model. CP models result into faster recovery and smaller power variations prior to and after the disturbance. Accordingly, their transient responses are more steep and fast compared to CZ and EXP models.
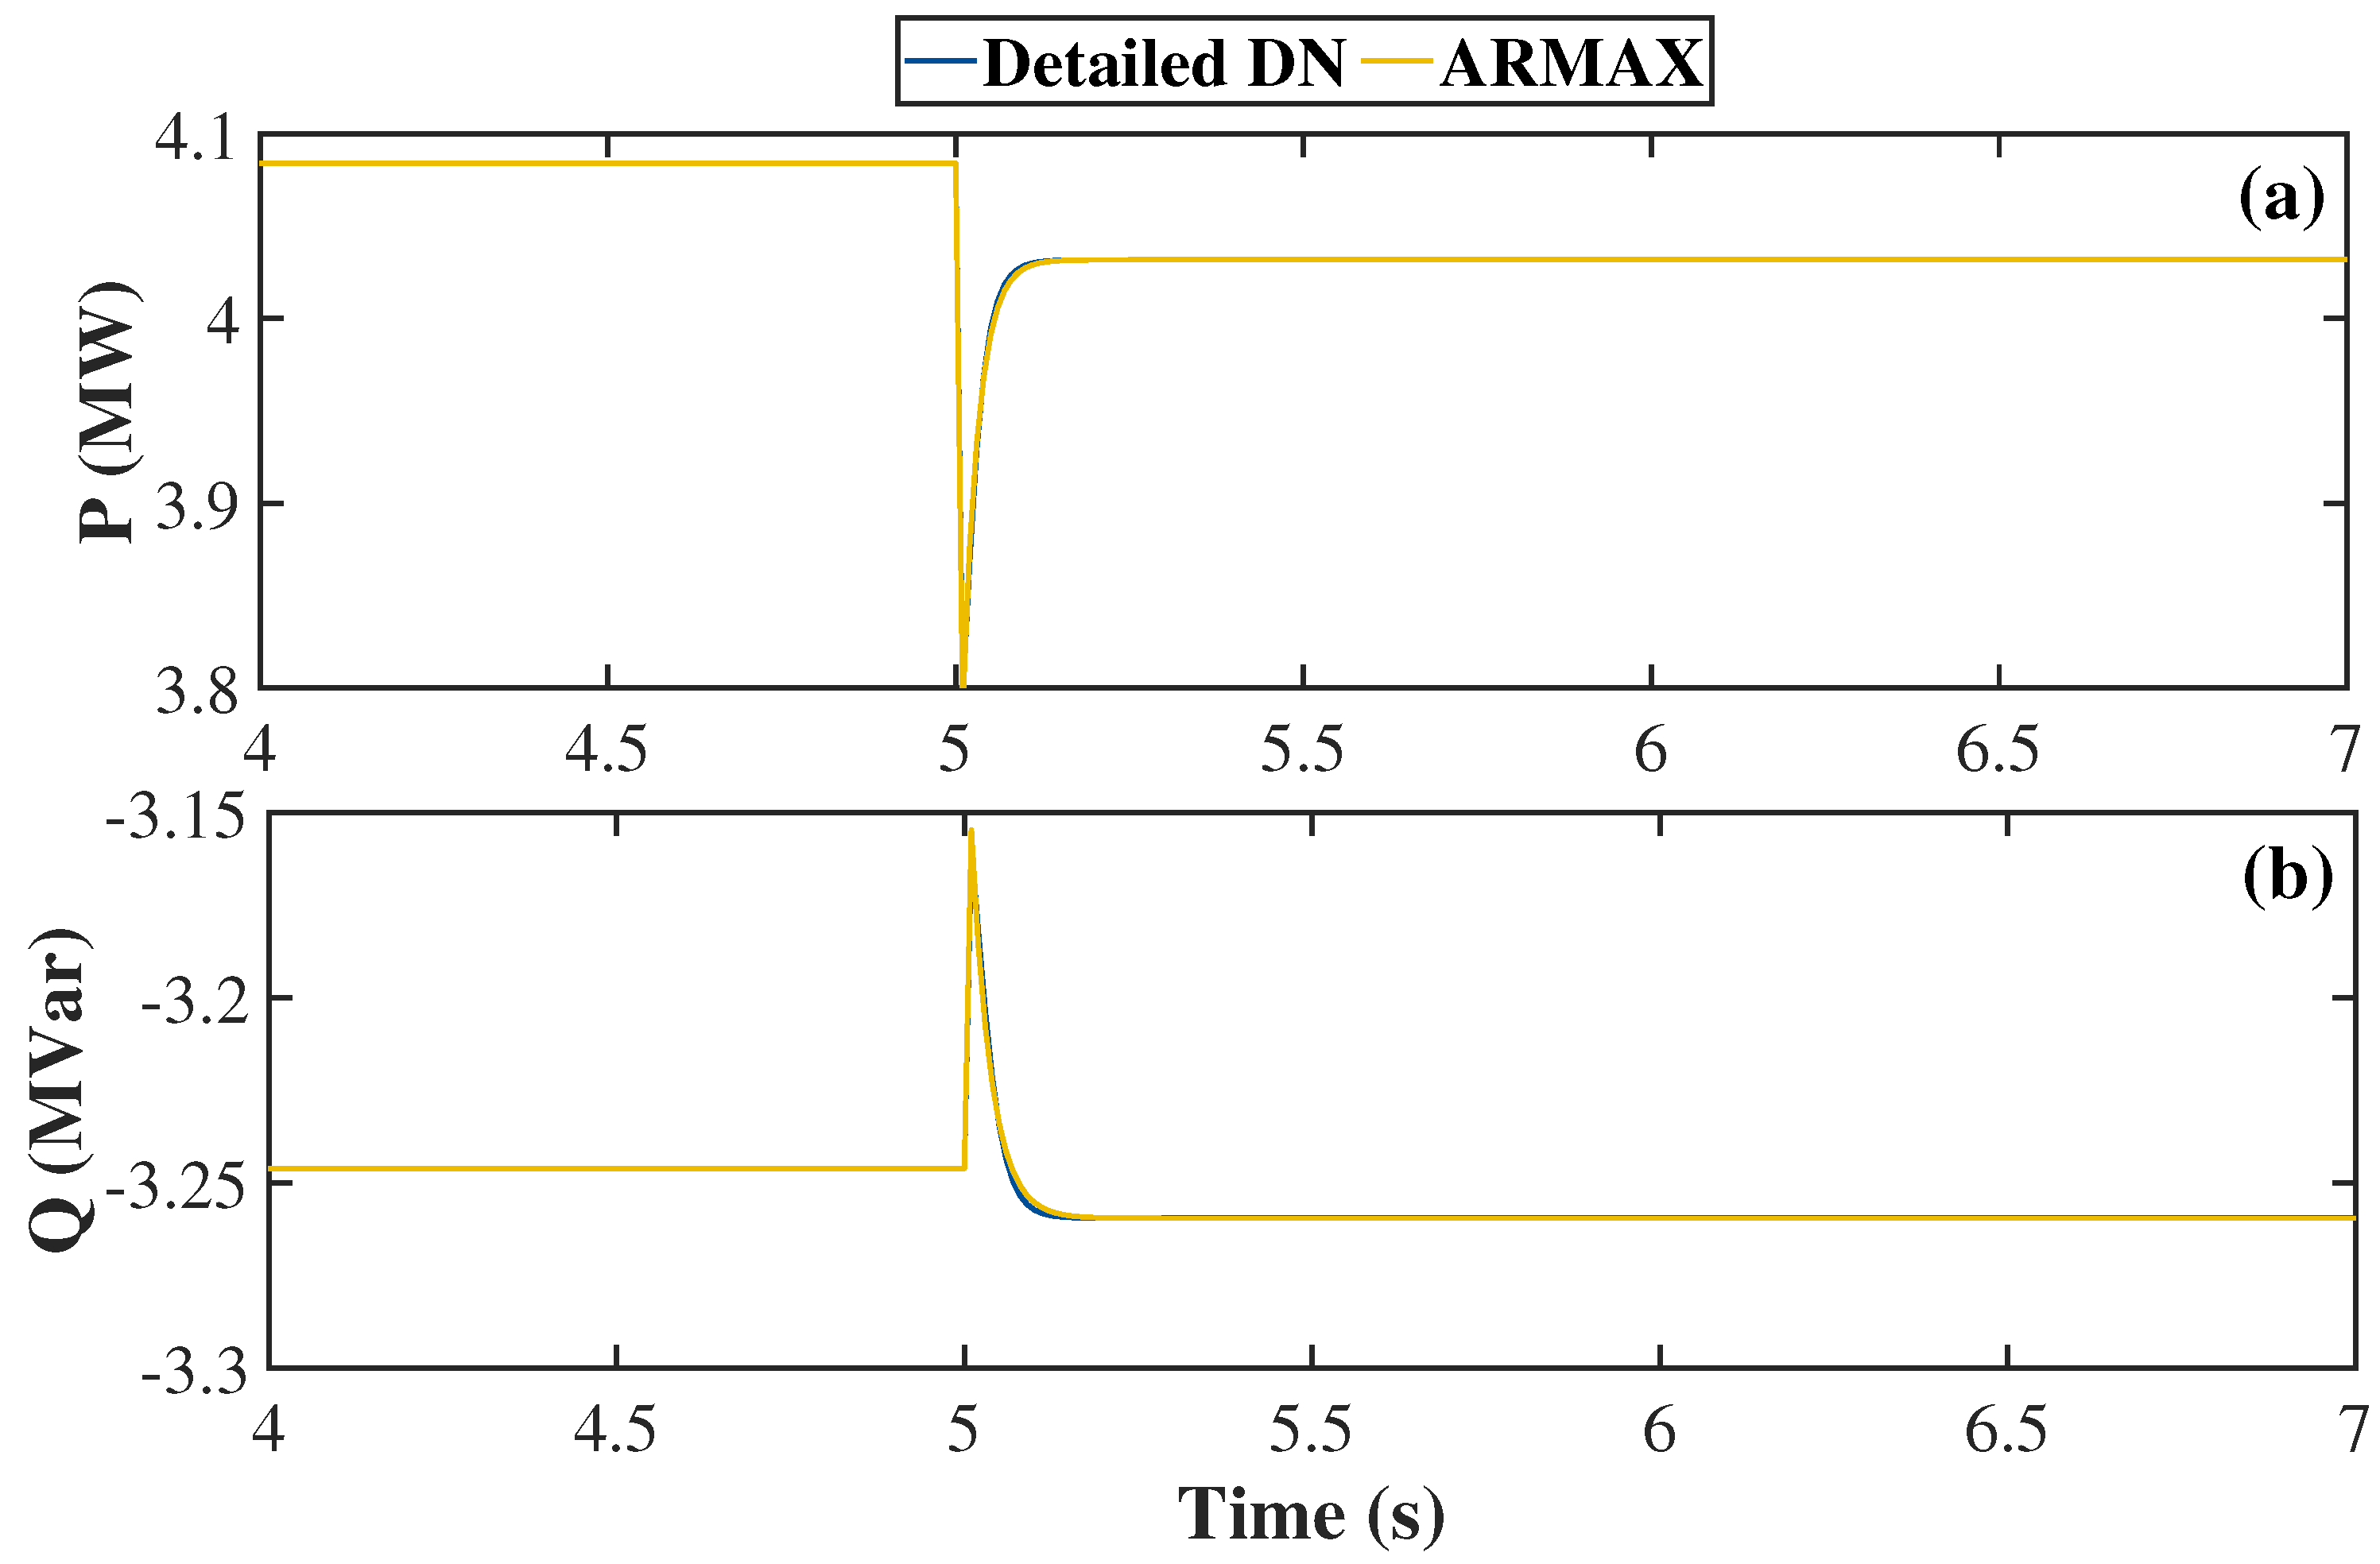
- The developed DEM can accurately reproduce the dynamic response of the DN to external disturbances.
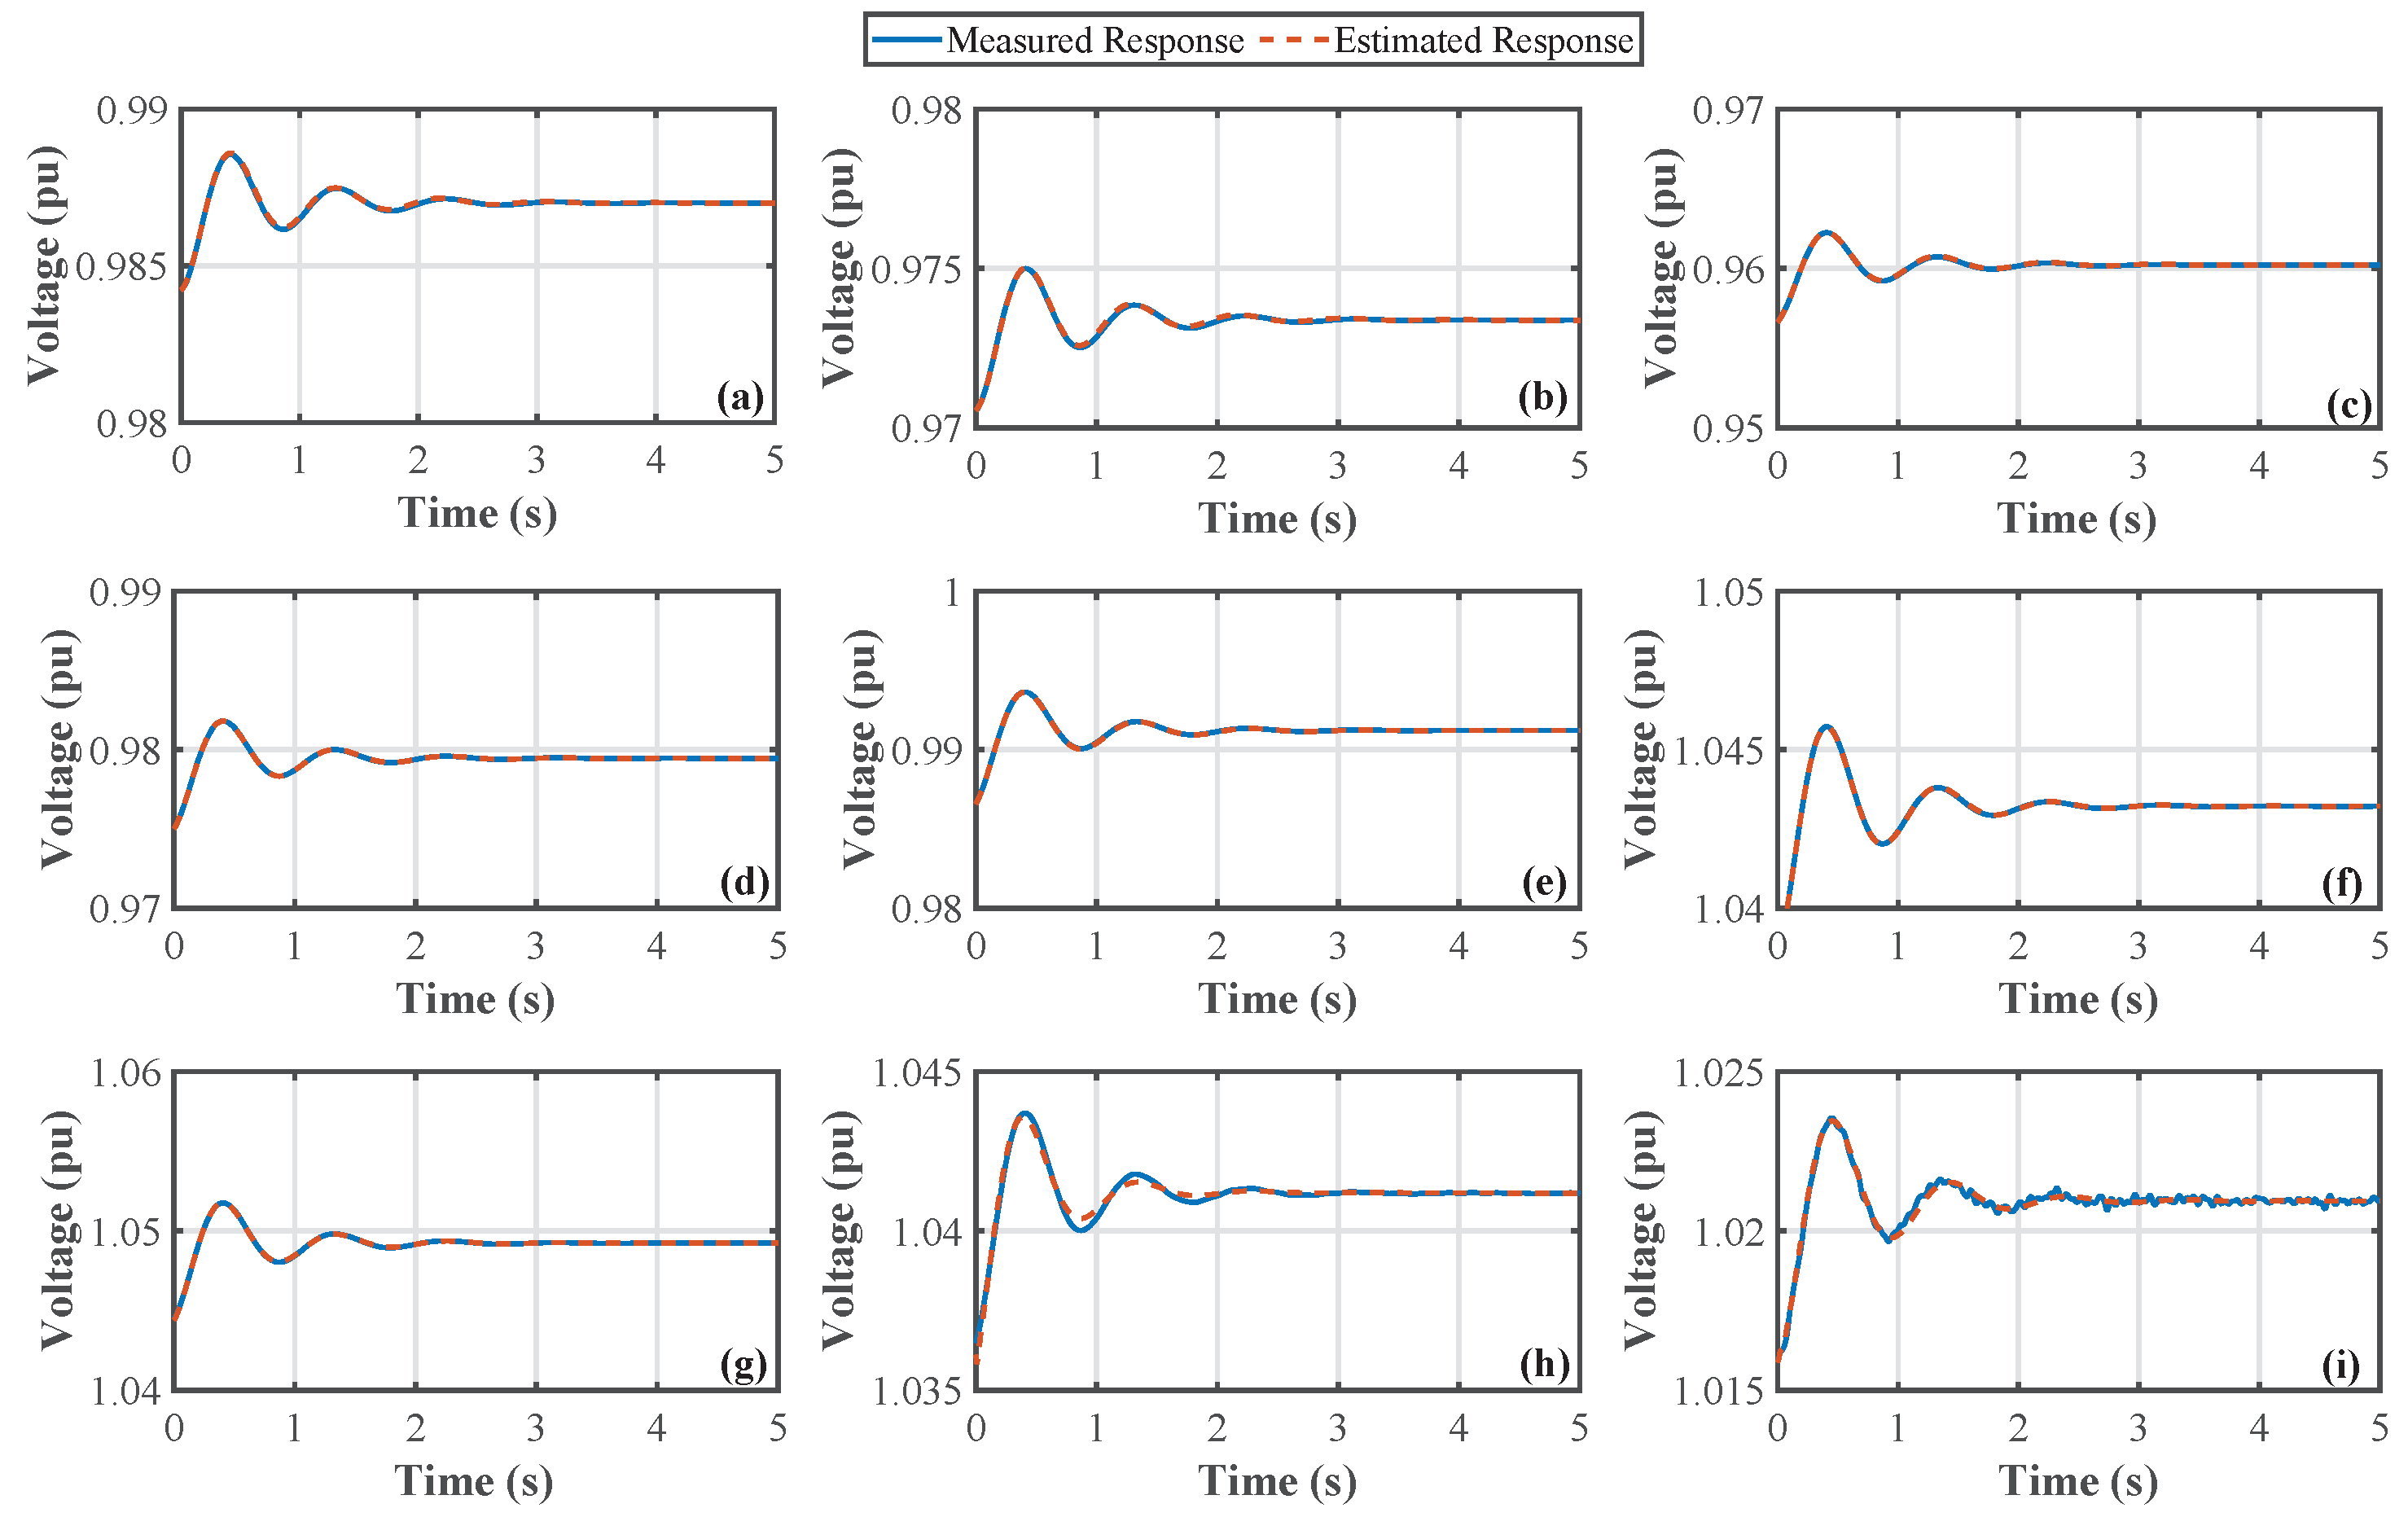
- The performance of the ARMAX mode estimation algorithm was successfully validated in the PHIL setup by using measurements at the three levels (transmission, primary and secondary distribution) of the power system.
- The results of the simulation and PHIL tests prove the consistency and the accuracy of the proposed AS and the dynamic response analysis tools, highlighting the adaptability to different power system configurations.
Author Contributions
Funding
Data Availability Statement
Conflicts of Interest
Abbreviations
| ARMAX | Autoregressive–moving average with exogenous inputs |
| AS | Ancillary Services |
| BES | Battery Energy Storage |
| CC | Central Controller |
| CP | Constant Power |
| CM | Congestion Management |
| CZ | Constant Impedance |
| DEM | Dynamic Equivalent Model |
| DN | Distribution Network |
| DRES | Distributed Renewable Energy Sources |
| DSO | Distribution System Operator |
| EXP | Exponential |
| IBR | Inverter Based Resources |
| LC | Local Controller |
| MPP | Maximum Power Point |
| PDC | Phasor Data Concentrator |
| PHIL | Power hardware-in-the-loop |
| PMU | Phasor Measurement Unit |
| POI | Point of Interconnection |
| PS | Power Smoothing |
| PV | Photovoltaic |
| RES | Renewable Energy Sources |
| RRL | Ramp-rate Limitation |
| SoC | State of Charge |
| TN | Transmission Network |
| TSO | Transmission System Operator |
| VR | Voltage Regulation |
| VUM | Voltage Unbalance Mitigation |
References
- Oureilidis, K.; Malamaki, K.-N.; Gallos, K.; Tsitsimelis, A.; Dikaiakos, C.; Gkavanoudis, S.; Cvetkovic, M.; Mauricio, J.M.; Maza Ortega, J.M.; Ramos, J.L.M.; et al. Ancillary Services Market Design in Distribution Networks: Review and Identification of Barriers. Energies 2020, 13, 917. [Google Scholar] [CrossRef]
- Kaushal, A.; Van Hertem, D. An Overview of Ancillary Services and HVDC Systems in European Context. Energies 2019, 12, 3481. [Google Scholar] [CrossRef]
- Jay, D.; Swarup, K.S. A comprehensive survey on reactive power ancillary service markets. Renew. Sustain. Energy Rev. 2021, 144, 110967. [Google Scholar] [CrossRef]
- Vatandoust, B.; Ahmadian, A.; Golkar, M.A.; Elkamel, A.; Almansoori, A.; Ghaljehei, M. Risk-Averse Optimal Bidding of Electric Vehicles and Energy Storage Aggregator in Day-Ahead Frequency Regulation Market. IEEE Trans. Power Syst. 2019, 34, 2036–2047. [Google Scholar] [CrossRef]
- Ku, T.-T.; Lin, C.-H.; Hsu, C.-T.; Chen, C.-S.; Liao, Z.-Y.; Wang, S.-D.; Chen, F.-F. Enhancement of Power System Operation by Renewable Ancillary Service. IEEE Trans. Ind. Appl. 2020, 56, 6150–6157. [Google Scholar] [CrossRef]
- Kotsampopoulos, P.; Hatziargyriou, N.; Bletterie, B.; Lauss, G. Review, analysis and recommendations on recent guidelines for the provision of ancillary services by Distributed Generation. In Proceedings of the 2013 IEEE International Workshop on Inteligent Energy Systems (IWIES), Vienna, Austria, 14 November 2013; pp. 185–190. [Google Scholar] [CrossRef]
- Kryonidis, G.C.; Kontis, E.O.; Papadopoulos, T.A.; Pippi, K.D.; Nousdilis, A.I.; Barzegkar-Ntovom, G.A.; Boubaris, A.D.; Papanikolaou, N.P. Ancillary services in active distribution networks: A review of technological trends from operational and online analysis perspective. Renew. Sustain. Energy Rev. 2021, 147, 111198. [Google Scholar] [CrossRef]
- IEEE Std 1159-2019 (Revision of IEEE Std 1159-2009); IEEE Recommended Practice for Monitoring Electric Power Quality–Redline. IEEE, 2019; pp. 1–180, (Place of Publication Not Identified).
- Kreeumporn, W.; Ngamroo, I. Integrated superconducting coil into PV generator for power smoothing and voltage regulation. In Proceedings of the 2015 IEEE International Conference on Applied Superconductivity and Electromagnetic Devices (ASEMD), Shanghai, China, 20–23 November 2015; pp. 159–160. [Google Scholar] [CrossRef]
- Papadopoulos, T.A.; Kontis, E.O.; Barzegkar-Ntovom, G.A.; Papadopoulos, P.N. A Three-Level Distributed Architecture for the Real-Time Monitoring of Modern Power Systems. IEEE Access 2022, 10, 29287–29306. [Google Scholar] [CrossRef]
- Ning, J.; Sarmadi, S.A.N.; Venkatasubramanian, V. Two-Level Ambient Oscillation Modal Estimation from Synchrophasor Measurements. IEEE Trans. Power Syst. 2015, 30, 2913–2922. [Google Scholar] [CrossRef]
- Trudnowski, D.J.; Pierre, J.W. Overview of algorithms for estimating swing modes from measured responses. In Proceedings of the 2009 IEEE Power & Energy Society General Meeting, Calgary, AB, Canada, 26–30 July 2009; pp. 1–8. [Google Scholar] [CrossRef]
- ACTIVATE. Ancillary Services in Active Distribution Networks, Based on Monitoring and Control Techniques. Available online: https://activate.ee.duth.gr/ (accessed on 7 March 2023).
- Pippi, K.D.; Kryonidis, G.C.; Nousdilis, A.I.; Papadopoulos, T.A. A unified control strategy for voltage regulation and congestion management in active distribution networks. Electr. Power Syst. Res. 2022, 212, 108648. [Google Scholar] [CrossRef]
- Pippi, K.D.; Kryonidis, G.C.; Nousdilis, A.I.; Papadopoulos, T.A. Assessing the Provision of Ancillary Services Considering BES Capacity Degradation. In Proceedings of the 2022 International Conference on Smart Energy Systems and Technologies (SEST), Eindhoven, The Netherlands, 5–7 September 2022; pp. 1–6. [Google Scholar] [CrossRef]
- Li, X.; Hui, D.; Lai, X. Battery Energy Storage Station (BESS)-Based Smoothing Control of Photovoltaic (PV) and Wind Power Generation Fluctuations. IEEE Trans. Sustain. Energy 2013, 4, 464–473. [Google Scholar] [CrossRef]
- de la Parra, I.; Marcos, J.; García, M.; Marroyo, L. Control strategies to use the minimum energy storage requirement for PV power ramp-rate control. Solar Energy 2015, 111, 332–343. [Google Scholar] [CrossRef]
- Malamaki, K.-N.D.; Casado-Machado, F.; Barragán-Villarejo, M.; Gross, A.M.; Kryonidis, G.C.; Martinez-Ramos, J.L.; Demoulias, C.S. Ramp-Rate Limitation Control of Distributed Renewable Energy Sources via Supercapacitors. IEEE Trans. Ind. Appl. 2022, 58, 7581–7594. [Google Scholar] [CrossRef]
- Blanco, C.; Reigosa, D.; Vasquez, J.C.; Guerrero, J.M.; Briz, F. Virtual Admittance Loop for Voltage Harmonic Compensation in Microgrids. IEEE Trans. Ind. Appl. 2016, 52, 3348–3356. [Google Scholar] [CrossRef]
- Mokhtari, G.; Nourbakhsh, G.; Ghosh, A. Smart Coordination of Energy Storage Units (ESUs) for Voltage and Loading Management in Distribution Networks. IEEE Trans. Power Syst. 2013, 28, 4812–4820. [Google Scholar] [CrossRef]
- Brenna, M.; De Berardinis, E.; Delli Carpini, L.; Foiadelli, F.; Paulon, P.; Petroni, P.; Sapienza, G.; Scrosati, G.; Zaninelli, D. Automatic Distributed Voltage Control Algorithm in Smart Grids Applications. IEEE Trans. Smart Grid 2013, 4, 877–885. [Google Scholar] [CrossRef]
- EPRI. Power Systems Dynamics Tutorial; EPRI: Palo Alto, CA, USA, 2009; p. 1016042. [Google Scholar]
- IEEE 39-Bus System. Available online: https://icseg.iti.illinois.edu/ieee-39-bus-system/ (accessed on 3 February 2023).
- Baran, M.E.; Wu, F. Network reconfiguration in distribution systems for loss reduction and load balancing. IEEE Trans. Power Del. 1989, 4, 1401–1407. [Google Scholar] [CrossRef]
- European Low Voltage Test Feeder. Available online: https://cmte.ieee.org/pes-testfeeders/resources/ (accessed on 1 April 2021).
- Dugan, R.C.; Montenegro, D. Reference Guide: The Open Distribution System Simulator; EPRI: Palo Alto, CA, USA, 2020. [Google Scholar]
- National Renewable Energy Laboratory. Commercial and Residential Hourly Load Profiles for all TMY3 Locations in the United States. 2014. Available online: https://data.openei.org/submissions/153 (accessed on 3 February 2023).
- Pfenninger, S.; Staffell, I. Long-term patterns of European PV output using 30 years of validated hourly reanalysis and satellite data. Energy 2016, 114, 1251–1265. [Google Scholar] [CrossRef]
- DIgSILENT GmbH. DIgSILENT Solutions PowerFactory Version 20.
- Electrical Simulation Models–Generic Models. IEC Wind Energy Generation Systems Part 27-1, 2020.
- Meersman, B.; Renders, B.; Degroote, L.; Vandoorn, T.; Vandevelde, L. Three-phase inverter-connected DG-units and voltage unbalance. Electr. Power Syst. Res. 2011, 81, 899–906. [Google Scholar] [CrossRef]
- IEEE Std 1547-2018 (Revision of IEEE Std 1547-2003); IEEE Standard for Interconnection and Interoperability of Distributed Energy Resources with Associated Electric Power Systems Interfaces. IEEE: New York, NY, USA, 2018; pp. 1–138.
- Karlsson, D.; Hill, D. Modelling and identification of nonlinear dynamic loads in power systems. IEEE Trans. Power Syst. 1994, 9, 157–166. [Google Scholar] [CrossRef]
- Milanovic, J.V.; Yamashita, K.; Martínez, S.V.; Djokic, S.Z.; Korunović, L.M. International Industry Practice on Power System Load Modeling. IEEE Trans. Power Syst. 2013, 28, 3038–3046. [Google Scholar] [CrossRef]
- Pasiopoulou, I.; Kontis, E.; Papadopoulos, T.; Papagiannis, G. Effect of load modeling on power system stability studies. Electr. Power Syst. Res. 2022, 207, 107846. [Google Scholar] [CrossRef]
- Kundur, P. Power System Stability and Control; McGraw-Hill: New York, NY, USA, 1994. [Google Scholar]
- CIGRE. Benchmark systems for network integration of renewable and distributed energy resources. CIGRE Task Force C6.04.02. 2014.
- Kontis, E.O.; Nousdilis, A.I.; Papagiannis, G.K.; Syed, M.H.; Guillo-Sansano, E.; Burt, G.M.; Papadopoulos, T.A. Power Hardware-in-the-Loop Setup for Developing, Analyzing and Testing Mode Identification Techniques and Dynamic Equivalent Models. In Proceedings of the 2019 IEEE Milan PowerTech, Milan, Italy, 23–27 June 2019. [Google Scholar]


| Primary DN | Secondary DN | ||
|---|---|---|---|
| Node | kWp | Node | kWp |
| 5, 14, 31, 33 | 350 | 103, 199, 267, 280, 281, 421, | 7.5 |
| 7, 22 | 500 | 436, 480, 486, 515, 589, 600, | |
| 9, 12, 15, 27 | 700 | 613, 621, 652, 684, 796, | |
| 10, 17 | 300 | 818, 878, 894, 902, 917 | |
| 26, 28 | 250 | 106, 252, 353, 494, 509, | 15 |
| 30 | 800 | 611, 637, 714, 827, 915 | |
| BT1 | |||||
|---|---|---|---|---|---|
| Node | kWh | kW | |||
| Primary DN | 5, 14, 31, 33 | 35 | 100 | ||
| 7, 22 | 50 | 145 | |||
| 9, 12, 15, 27 | 70 | 200 | |||
| 10, 17 | 30 | 85 | |||
| 26, 28 | 25 | 70 | |||
| 30 | 80 | 230 | |||
| Secondary DN | 106, 252, 353, 494, 509, 611 | 1.5 | 2.15 | ||
| 103, 280, 199, 267, 281, 421, 436, | 0.75 | 4.35 | |||
| 480, 486, 589, 818, 796, 894 | |||||
| BT2 | |||||
| Primary DN | Secondary DN | ||||
| Node | kWh | kW | Node | kWh | kW |
| 2 | 1000 | 500 | 515, 714, 878 | 10 | 5 |
| 8 | 500 | 250 | 600, 613, 621 | 22.5 | 7.5 |
| 13 | 450 | 225 | 652, 684 | 30 | 7.5 |
| 15 | 250 | 220 | 902 | 15 | 7.5 |
| 16 | 550 | 275 | 915 | 25 | 12.5 |
| 29 | 600 | 300 | 637 | 45 | 15 |
| 827 | 5 | 5 | |||
| 917 | 5 | 2.5 | |||
| Day | Network | AS | (kWh) | |
|---|---|---|---|---|
| Cloudy | Primary DN | VR | Absorbed | - |
| Injected | - | |||
| PS | Absorbed | |||
| Injected | ||||
| Secondary DN | VR | Absorbed | ||
| Injected | - | |||
| PS | Absorbed | |||
| Injected | ||||
| Sunny | Primary DN | VR | Absorbed | |
| Injected | - | |||
| PS | Absorbed | - | ||
| Injected | - | |||
| Secondary DN | VR | Absorbed | ||
| Injected | - | |||
| PS | Absorbed | - | ||
| Injected | - | |||
| Cable No. | Ampacity (A) | |
|---|---|---|
| L1–L4, L25, L26, L29 | 1.96 | 205 |
| L5, L14, L19, L27, L28 | 1.25 | 195 |
| L6 | 0.30 | 150 |
| L7, L10, L11 | 3.02 | 150 |
| L8, L9, L15, L22 | 1.40 | 150 |
| L12, L17, L23, L24 | 1.27 | 115 |
| L13, L16, L21 | 0.75 | 115 |
| L18, L30 | 1.02 | 70 |
| L20, L31 | 0.85 | 70 |
| L32 | 0.65 | 70 |
| Case | Load Model | Real Power | Reactive Power |
|---|---|---|---|
| Low IBR penetration | CP | 0.0819 s | 0.1011 s |
| CZ | 0.3216 s | 0.3516 s | |
| EXP | 0.3042 s | 0.3707 s | |
| Moderate IBR penetration | CP | 0.0817 s | 0.0948 s |
| CZ | 0.3053 s | 0.4218 s | |
| EXP | 0.2769 s | 0.4486 s | |
| High IBR penetration | CP | 0.0806 s | 0.0931 s |
| CZ | 0.2768 s | 0.4373 s | |
| EXP | 0.2299 s | 0.4594 s |
Disclaimer/Publisher’s Note: The statements, opinions and data contained in all publications are solely those of the individual author(s) and contributor(s) and not of MDPI and/or the editor(s). MDPI and/or the editor(s) disclaim responsibility for any injury to people or property resulting from any ideas, methods, instructions or products referred to in the content. |
© 2023 by the authors. Licensee MDPI, Basel, Switzerland. This article is an open access article distributed under the terms and conditions of the Creative Commons Attribution (CC BY) license (https://creativecommons.org/licenses/by/4.0/).
Share and Cite
Papadopoulos, T.A.; Pippi, K.D.; Barzegkar-Ntovom, G.A.; Kontis, E.O.; Nousdilis, A.I.; Athanasiadis, C.L.; Kryonidis, G.C. Validation of a Holistic System for Operational Analysis and Provision of Ancillary Services in Active Distribution Networks. Energies 2023, 16, 2787. https://doi.org/10.3390/en16062787
Papadopoulos TA, Pippi KD, Barzegkar-Ntovom GA, Kontis EO, Nousdilis AI, Athanasiadis CL, Kryonidis GC. Validation of a Holistic System for Operational Analysis and Provision of Ancillary Services in Active Distribution Networks. Energies. 2023; 16(6):2787. https://doi.org/10.3390/en16062787
Chicago/Turabian StylePapadopoulos, Theofilos A., Kalliopi D. Pippi, Georgios A. Barzegkar-Ntovom, Eleftherios O. Kontis, Angelos I. Nousdilis, Christos L. Athanasiadis, and Georgios C. Kryonidis. 2023. "Validation of a Holistic System for Operational Analysis and Provision of Ancillary Services in Active Distribution Networks" Energies 16, no. 6: 2787. https://doi.org/10.3390/en16062787
APA StylePapadopoulos, T. A., Pippi, K. D., Barzegkar-Ntovom, G. A., Kontis, E. O., Nousdilis, A. I., Athanasiadis, C. L., & Kryonidis, G. C. (2023). Validation of a Holistic System for Operational Analysis and Provision of Ancillary Services in Active Distribution Networks. Energies, 16(6), 2787. https://doi.org/10.3390/en16062787