Article

The Development of Renewable Energy in Mineral Resource Clusters—The Case of the Siberian Federal District

1
Department of Trade and Marketing, Siberian Federal University, 79 Svobodny Av., 660041 Krasnoyarsk, Russia
2
Department of Open Pit Mining, T.F. Gorbachev Kuzbass State Technical University, 28 Vesennya St., 650000 Kemerovo, Russia
3
Department of Electronic Computers, Faculty of lnformation Technologies, Tver State Technical Unversity, 22 Afanasiya Nikitina Emb., 170026 Tver, Russia
4
Department of Political Economy and History of Economic Science, Plekhanov Russian University of Economics, 36 Stremyanny Lane, 117997 Moscow, Russia
*
Author to whom correspondence should be addressed.
Energies 2023, 16(9), 3843; https://doi.org/10.3390/en16093843
Submission received: 29 March 2023 / Revised: 21 April 2023 / Accepted: 27 April 2023 / Published: 29 April 2023

Abstract

:
This article presents a study of the specific features and development factors of renewable energy in macro-regions that combine extractive and industrial clusters with rural, sparsely populated areas. While in some countries—leaders in energy transition (the EU, China)—the growth of investments in solar, wind, and hydropower production is taking place systematically within the framework of an increasing number of national and international strategies and programs, in the Russian Federation there is a lack of renewable generation capacity. Particular difficulties are experienced in regions that, on the one hand, have a developed fuel and raw material complex and, therefore, fuel generation (which makes a significant contribution to global greenhouse gas emissions), and, on the other hand, many rural, sparsely populated areas that are in need of new distributed generation. The aim of the study is to analyze the factors of transition to renewable energy in mineral-resource regions, such as the Siberian Federal District (Siberia), as well as to identify measures to enhance their effectivity. The article shows the place of Siberia in the national energy system and considers the factors related to its energy transition in detail, e.g., the saturation with main powerlines, the control of air pollution caused by fuel energy facilities, its provision with fuel resources, investments in renewable energy, and ways of improving the health and well-being of the local population. Attention is drawn to the challenges and obstacles related to the development of renewable energy in the Siberian Federal District, associated, on the one hand, with Russia’s lagging behind other countries in the dynamics of energy transition, and on the other hand, with external and internal technological and investment restrictions.

1. Introduction

In general, world energy consumption has increased by 49% since the beginning of the 21st century. At the same time, the share of the Asia-Pacific region more than doubled during the new round of industrialization (from 22% to 45%), and the share of Europe and North America decreased due to a move towards energy saving (from 22% and 28% to 14% and 19%, respectively). This led to the redistribution of environmental damage associated with energy production between these regions [1].
The emerging energy transition (a structural change in the global energy production system) is accompanied by an increase in the share of renewable primary energy sources, with the displacement of non-renewable (fossil) ones in the context of a widespread overall increase in energy consumption. Since the beginning of the 21st century, the installed capacity of renewable energy sources worldwide has increased by a factor of 7 and reached in 3.3 TW (38.3% of world capacity) in 2022, mainly due to the growth of solar and wind energy sources by a factor of more than 10. At the same time, hydropower generation has grown by only 35% over the past two decades. In general, for the decade 2012–2021 the share of wind power plants in the global installed electric capacity increased from 4.8 to 10.3%, solar power plants—from 1.9% to 10.6%, while the share of hydropower plants (a traditional source of renewable energy) decreased from 17.9% to 15.4%. In 2021, the world share of renewable energy in the new energy capacity was 81%; therefore, the trend in energy transition is obvious (the share of fuel energy capacity in the world decreased from 73.8% to 61.7% in 2012–2021) [1].
According to a report from the International Energy Agency, by 2027, renewable energy will provide the majority of human energy needs, and its installed capacity will be increased by 2400 GW (in 2021, this figure closely matched the entire installed capacity of China’s power grid). Accordingly, the share of coal, natural gas, and nuclear energy will drastically decrease by the end of this decade. Such changes will lead to the restructuring of energy systems around the world, the main driving force of which is the reduction of greenhouse gas emissions to prevent the irreversible effects of climate change [2].
A high share of wind and solar power plants in a country’s energy balance is now becoming a reality. For example, in Denmark, solar and wind power plants generate 63% of electricity; the proportion in Greece is 36%, in Portugal, Ireland, and the Netherlands 34%, and in Germany and Spain 33% [3]. A noticeable increase in the share of renewable energy is also taking place in China and India, the world leaders in pace of development. Thus, China plans to increase the total installed capacity of solar and wind generation to 1200 GW and India to 500 GW by 2030 [2].
The following reasons for the active development of renewable energy among others highlighted since the beginning of this millennium can be given: the need for increased energy security and a decrease in political dependence on other countries; the negative environmental impact of traditional fuel energy, intensified in the second half of the 20th century, which led to global climate problems; the inexhaustibility and unlimited nature of renewable energy sources, along with an increase in the economic efficiency of their consumption.
World investments in renewable energy are gradually starting to exceed non-renewable energy funds, and in the commissioning of new capacity, the former are outpacing the latter. Thus, in 2022, the European Commission published a EUR 300 billion Plan to Acceleratedly Reduce Dependence on Russian Fossil Fuels and Accelerate the Energy Transition (REPowerEU) with a planned introduction of a new renewable energy capacity of 1236 GW. For comparison: the installed capacity of all available power plants in the energy system of Russia is about 250 GW, the share of solar and wind power plants is less than 4 GW [4].
Therefore, in studies of the prospects for energy transition, it is necessary to take into account the significant differences between the sectoral, technological, institutional and spatial conditions for the development of renewable energy in the EU countries, China, India, and Russia with its macro-regions, in order to harmonize national energy interests and security imperatives, as well as the global impact on climate and the energy market.
In particular, it is important to take into account the problems and prospects for the development of renewable energy in areas with highly concentrated industrial and mineral resource clusters, along with sparsely populated rural areas. One of these territories is the Siberian Federal District (Siberia)—a macro-region of the Russian Federation, the area of which occupies more than a quarter of the country’s territory (the second largest, not much inferior to the Far Eastern Federal District). Siberia is characterized by an extremely low population density (less than 4 people/km², one of the lowest in Russia). At the same time, in 2022, the share of Siberia in national industrial production exceeded 14%, and in electricity production it exceeded 20%. The vast majority of electricity is produced at fuel power plants from fossil sources mined also in Siberia, as well as at large hydroelectric power plants built during the Soviet period in 1960–1970. At the same time, along with the industrialized Siberian south, saturated with power plants and main powerlines, which affects global greenhouse gas emissions, in underpopulated areas of the North of Siberia there is a significant need for small-scale distributed generation, which is promising for the development of renewable energy. This unique combination of conditions requires a detailed analysis of energy transition factors.

2. Research Methodology

The purpose of the study is to develop proposals for expanding renewable energy in macro-regions that combine significant fuel and hydropower capacities, are highly supplied with fossil energy sources, and include sparsely populated rural areas.
The hypothesis of the study is the following. The development of renewable energy in regions saturated with fuel energy and fossil energy deposits stands under the influence of factors not related to the national energy policy and foreign investment (external factors). It is instead related to the development of non-industrial entrepreneurship (tourism, agriculture, etc.), the creation of new urban agglomerations, and improving the health and quality of life of the population (internal factors.)

2.1. Literature Review

The literature review allowed singling out a number of approaches to the study of factors and conditions of renewable energy development.
The market approach is of interest, linking the development of renewable energy with the response to crises in the global hydrocarbon market (both endogenous and exogenous), associated with the construction of a more sustainable energy system, independent of market fluctuations [5,6]. The positive environmental effect here is seen rather as a spillover in relation to investments in renewable energy [7,8]. The importance of attracting the attention of researchers to the renewable energy market is obvious. At the same time, today, the environmental problems of energy transition are proclaimed to be key, primary in relation to the market.
Achieving carbon neutrality as a result of accelerating the energy transition is also seen as a contingent effect of the implementation of a policy initiative to replace fossil fuels with renewables (such as REPowerEU 2022) [9]. This is why the main measures for the energy transition in the European Union are economic ones, such as consumer subsidies and investment tax incentives [10,11]. With regard to the Russian economy, a number of authors have noted the lack of state support for renewable energy, the development of which is carried out by Russian and foreign raw material companies, with hidden conflicts of interest [12,13].
The need for political decisions following discussions regarding the transition to renewable energy is especially relevant for countries producing and exporting main energy carriers (like coal and natural gas) [14] and experiencing significant development difficulties associated with fluctuations in raw material prices and the accumulation of environmental problems [15,16].
We emphasize the importance of environmental policy in moving towards renewable energy, but adherents of this approach often do not take into account the price and infrastructure constraints on the energy transition that exist in many countries.
With regard to Russia, the pricing in the electricity market depends on the development of main powerlines. A number of authors have zoned the territories according to the efficiency of pricing, and concluded that in zones of inefficient pricing (the so-called “isolated zones” with a low level of development of main powerlines, including a part of Siberia), the economic benefits of investing in renewable energy are relatively high [17,18]. At the same time, authors who link the development of renewable energy with advantages for local areas with a high concentration of consumers that are not tied to main power lines.
This possibility of renewable energy development is observed within the framework of the urban approach, which considers, in particular, the formation of smart cities based on artificial intelligence. There a high level of energy consumption optimization that makes it possible to reduce the consumption of energy obtained from non-renewable sources (including power plants operating on natural gas and nuclear fuel) [19]. This is largely due to a decrease in the environmental damage caused by fuel energy, which has become especially important in the last decade [20,21]. The development of smart cities, taking into account the saturation of energy from renewable sources [22], is also considered from the perspective of Penta Helix, which unites think tanks, business and authorities, as well as civil society and environmental activists [23].
We note the fact that there is often an overestimation of the impact of smart cities on the global development of renewable energy due to their low number in the modern world. On the contrary, other authors discuss the benefits of renewable energy for rural areas, especially distant from cities, where agriculture and eco-tourism are the main sources of income [24,25]. However, it is obvious that the nearness or remoteness of renewable energy facilities from the infrastructure of smart cities cannot determine the prospects for their expansion, which depends on a number of factors.
In this regard, an interesting approach takes into account related investment and environmental factors. In this framework, the interests of investors in renewable energy are analyzed, dictated by a shift in consumption priorities towards products manufactured using green energy [26], the expansion of environmental values (especially in the real estate market) and the reduction in the cost of solar and wind energy production [27].
ESG investments and “green” corporate strategies have become an indispensable factor in the market competitiveness of corporations, including the raw materials sector, which makes them invest in renewable energy [28,29].
Along with the value of analyzing the investment component of the transition to renewable energy, one cannot fail to note the focus on environmental rather than technological factors. On the contrary, the technological approach to the development of renewable energy considers the digital technologies of Industry 4.0 (neural networks and artificial intelligence, digital twins and clones, etc. [30]) as a means to increase the efficiency of energy production from renewable sources, redistributing it in modern energy systems [31]. The opposite idea is put forward by authors who consider renewable energy as a factor in the development of Industry 4.0 [32].
There are a number of studies devoted to the national specifics of the transition to renewable energy in the developing countries of Africa [33], Southeast Asia [34,35], South America [36,37], etc., mainly focusing on environmental benefits. Russian features of the transition to renewable energy are typical for the BRICS countries. They are associated with the need to reduce greenhouse gas emissions (Russia was in fifth place in terms of CO2 emissions in the world with 5.13% in 2021, after China, the USA, the EU and India [38]), increase the efficiency of environmental degradation measures, and create new jobs in the high-tech industries of solar, wind, and bioenergy [39], in which foreign investment plays an important role [40].
A number of authors have considered the problems of the CIS countries (including Russia) in the field of decarbonization, considering renewable energy as a key tool for reducing greenhouse gas emissions [41]. In addition, the development of renewable energy is considered as a factor in the conservation of forests [42], which is relevant for remote regions of Eastern Siberia and Transbaikalia, where timber is used as fuel by farmers and households, an alternative to which is the use of solar and wind energy [43]. At the same time, not enough attention is paid to the differences in energy supply of the territories of Russia, combining clusters of thermal, hydro-, and nuclear power, with which renewable energy will compete in the national market, and the psychological perception of which by the population is also ambiguous.
The socio-psychological factor of the energy transition (pro-environmental behavior) is seen as gaining momentum in the Russian Federation to a similar extent as in other BRICS countries [44]. At the same time, one study notes a more positive attitude of Russians towards the development of nuclear energy with “near-zero” emissions than towards renewable energy, while Italian respondents showed a negative attitude towards nuclear energy and a positive attitude towards renewable energy [45]. Moreover, this reflects the essence of the Environmental Kuznets Curve (as the income of the population increases, interest in environmental problems increases too [46]), which, in relation to renewable energy, is confirmed by the example of the BRICS countries. Their demand for renewable energy has been steadily increasing over the past decade along with the relevance of reducing emissions into the atmosphere [47].
The reduction of emissions from thermal power plants is not the only environmentally positive result of the transition to alternative energy. Thus, a number of authors have singled out a side effect from the reduction in coal consumption by power plants in the form of a decrease in the area of coal warehouses in ports. Their volumes reach hundreds of thousands cubic meters, often located near cities, and they are large sources of coal dust (see the example of the Russian city of Murmansk and the positive experience of Scandinavian countries) [48]. A number of authors consider the transition from coal and gas to nuclear and hydrogen as the most promising step for Russia towards renewable energy [49], which generally corresponds to the understanding of their role in the transitional stage in the EU [50]. One of the first steps in such a transition may be a long-term trend of reducing oil and gas production in response to the decline in world prices as part of a downward wave of the commodity supercycle (up to 12–15 years [51]) [52].
A review of approaches to the development of renewable energy has made it possible to identify the main factors, such as the need to stabilize the energy market and decarbonize the economy, the development of smart cities, Green and ESG investments, the diffusion of Industry 4.0 technologies in energy production, and the public demand for an environmentally friendly energy.
At the same time, the challenges and obstacles to the development of renewable energy should be noted, such as its high cost, the need for energy storage sizing and virtual synchronous generation for grid stability.
In particular, the cost of renewable energy is higher than for non-renewables [53]. At the initial stage (until 2010), with relatively small renewable power production on a global scale (up to 100 GW), this gap reached a factor of 4; later, as renewable energy grew (over 1000 GW by 2019), the difference decreased to a factor of 1.5–2.5 [54]. Now cost parity is expected by 2030 due to increased investment and rising costs of greenhouse gas emissions [55].
For renewable power producing facilities, energy storage systems are required to reduce grid frequency variation caused by fast fluctuations of wind [56] and solar [57]. However, their high cost is an obstacle to their wide use [58]; other ones include low energy density for vanadium and lead acid batteries, and a high fire hazard for lithium-ion batteries [59].
A similar purpose is served by virtual synchronous generators—inverters that provide “synthetic inertia” to increase grid stability for renewable-energy-based distributed generation [60]. Virtual synchronous generators have proven effectiveness for microgrids [61]; however, for large grids (which in the future will connect all renewable energy facilities with consumers), low inertia is more challenging [62].
Along with studies of the problems and prospects for renewable energy development in Russia as well as in BRICS and CIS countries, studies on the features of this process in the Siberian Federal District, which occupies a quarter of the Russian Federation territory, are insufficient ([63] can be considered as an exception). Therefore, we use a multi-factorial approach to the study of renewable energy development in Siberia, taking into account the advantages and limitations of the approaches presented above.
Before we move on to characterizing the role of Russia in the development of global energy and its renewable segment, it is advisable to define the terminology of the subject. We use International Recommendations for Energy Statistics (IRES) as a basis, classifying energy sources as shown in Table 1 [64].

2.2. Analysis of Current Trends in Renewable Energy Development

As will be confirmed by the statistical data below, for the analysis of the current trend in the development of Russian renewable energy, especially in Siberia, it makes sense to pay attention to solar, wind, and hydropower, while thermal, wave, and biological energy are not widely used. In addition, the projects for the development of the hydrogen energy sector were suspended due to external technological restrictions and sanctions in 2022.
The impact of the COVID-19 pandemic on the development of renewable energy should be noted, which temporarily slowed down not only production, logistics, adjustment, and service work, but also significantly increased world energy prices. Thus, we can talk about the predominance of factors stimulating the development of renewable energy at the post-COVID stage, especially since the governments of different countries have increased the incentives for energy transition (cumulative measures exceeded USD 450 billion) [65].
However, the imbalance of supply and demand for energy in the world persisted and resulted in the so-called energy crisis of 2021, when natural gas prices in Europe reached a historic maximum. Later, the political turbulence of 2022 contributed to the increase in gas prices to USD 1300 per thousand m3, which, coupled with supply restrictions caused by sanctions, embargoes, and denials, as well as negative weather conditions, caused local energy shortages. The response from the European Union was the decision to speed up the energy transition in order to, firstly, avoid an increase in emissions into the atmosphere in case of increasing the share of fuel energy and, secondly, stop depending on the market conditions of traditional energy sources. As a result, by 2023 many countries and regions of the world have approached a significant share of renewable energy in the installed capacity of power plants (Figure 1).
As follows from Figure 1, the share of renewable energy in installed capacity ranges from 30% (India, Japan) to 43–53% (China, EU, UK), reaching 69–83% in Brazil and Canada. In Russia, only 21% of the installed capacity of power plants is represented by renewable energy, in general, due to the developed system of large hydroelectric power plants built during the Soviet era. In China, India, the European Union, the UK, Japan, and the USA, solar and wind power plants dominate in the renewable energy capacity structure, while hydropower is widely represented in Brazil and Canada.
The significant accumulated installed capacity of renewable energy in the world is associated with the rapid growth of its investment. According to Bloomberg, investments in this area for 2004–2020 increased more than 6 times from 11.4 (2004, first quarter) to USD 69.9 billion (2020, second quarter), with a peak of USD 87.7 billion in the fourth quarter of 2019. China has been the major investor since 2014 (its share increased from 19 to 32% by 2017), displacing the United States, which since 2014 has accounted for no more than 15% of global investments in renewable energy [67].
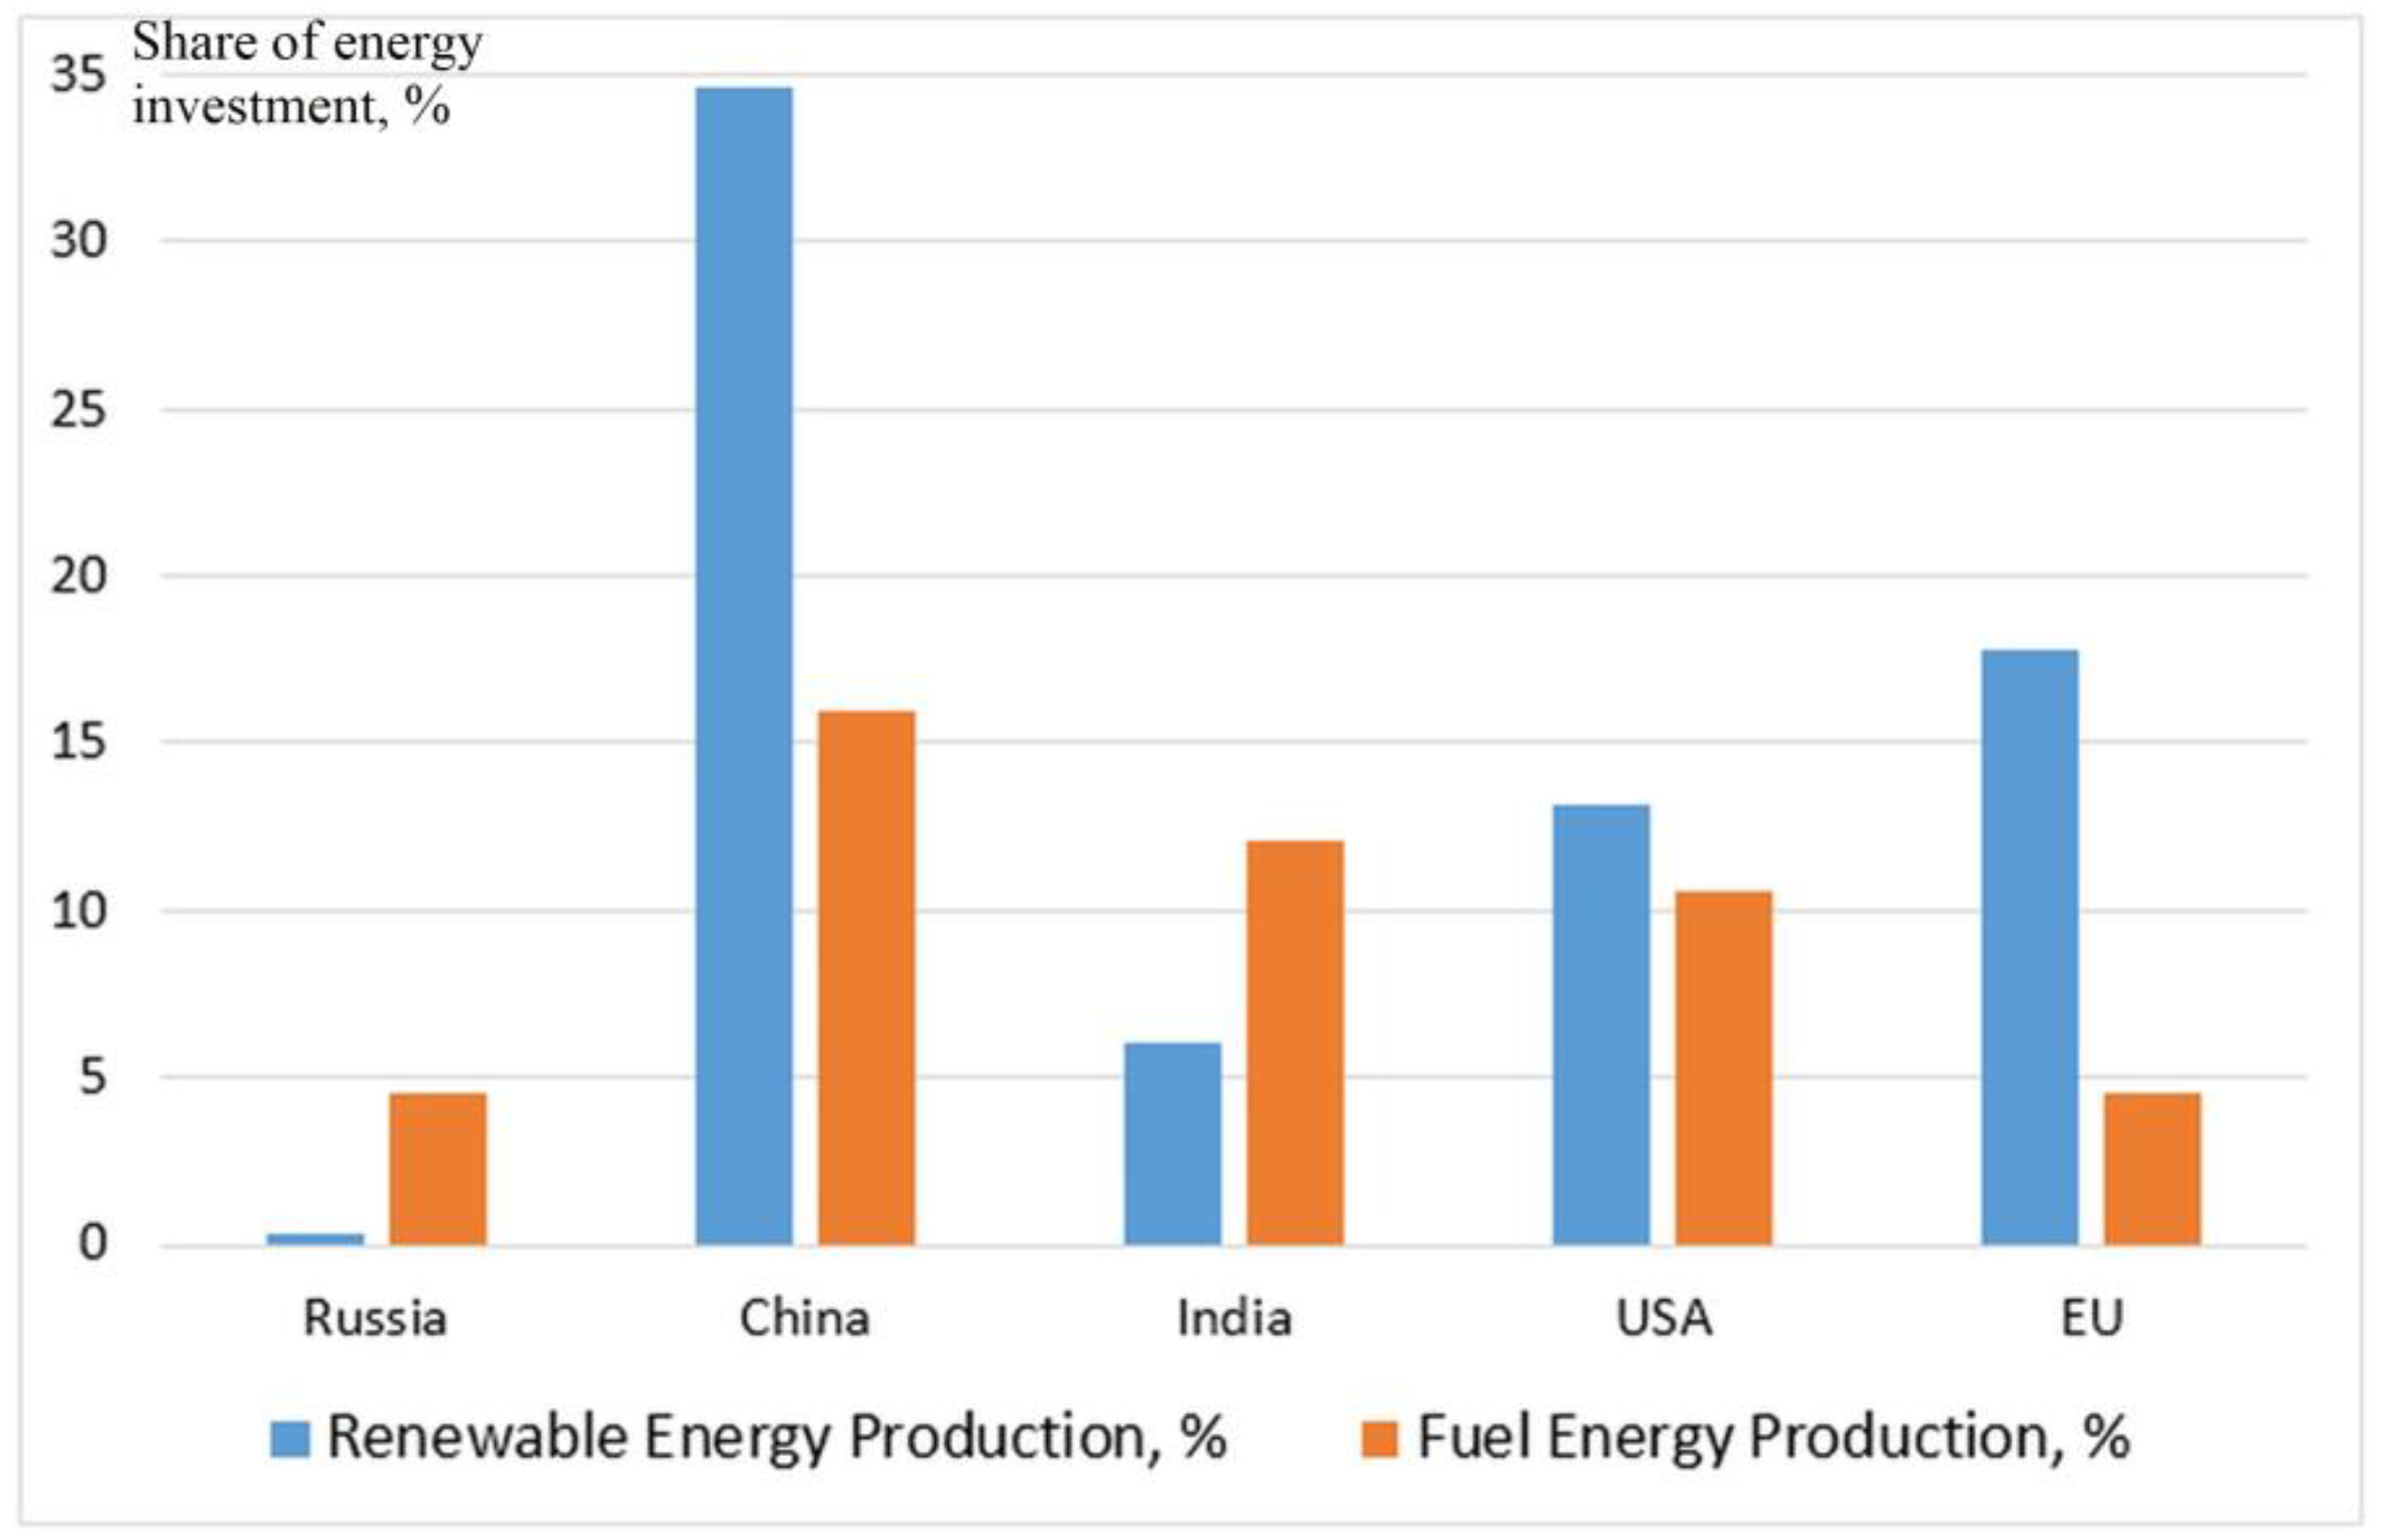
Using the example of investments in renewable energy, we can clearly observe the process of energy transition in different countries, correlating it with investments in traditional fuel energy (Figure 2).
From the data presented in Figure 2, the success of promoting the energy transition in the European Union is traced (the share of the macro-region in new global investments in renewable energy exceeded 17%, while in fuel it was less than 5%). The same is true for China’s investment leadership in renewable energy in the world (close to 35%, along with the maximum share in global investments in fuel energy with more than 15%). Against this background, Russia is catching up in global investment in renewable energy (less than 1%), while its share in fuel energy investment reaches 5%. A similar situation is observed in India, where the share in investments in renewable energy is 2 times lower than in renewable energy (6 and 12%, respectively).
At the same time, on a global scale, the largest specific investments (per 1 kW of installed capacity, on average in the world) are typical for such a segment of renewable energy such as solar power plants (USD 3500–5000), while for traditional hydroelectric power plants and wind power plants, this figure is 2500–3000 USD/kW. At the same time, for offshore wind and small hydroelectric power plants, investments in the generation of 1 kW of energy are higher—USD 5200–6200; for the production of energy from biomass and solid waste these are USD 8200–8800 per kW of installed capacity [69].
The positive externalities from investing in renewable energy in the form of a reduction in specific greenhouse gas emissions from different sources are obvious. So, if in general, during the life cycle of an energy facility (25–40 years), coal-fired power plants emit an average of 820 g of greenhouse gases per 1 kWh of energy (gas: 450 g), then solar power plants emit 48 g, hydroelectric power plants 24 g, and wind power plant 11 g per 1 kWh [70].
With regard to the dynamics of electricity generation in Russia, it is impossible not to note the 100-fold growth of the most advanced part of renewable energy—solar and wind (from 0.05 to 5.87 GW in total over the decade 2012–2021; see Table 2.
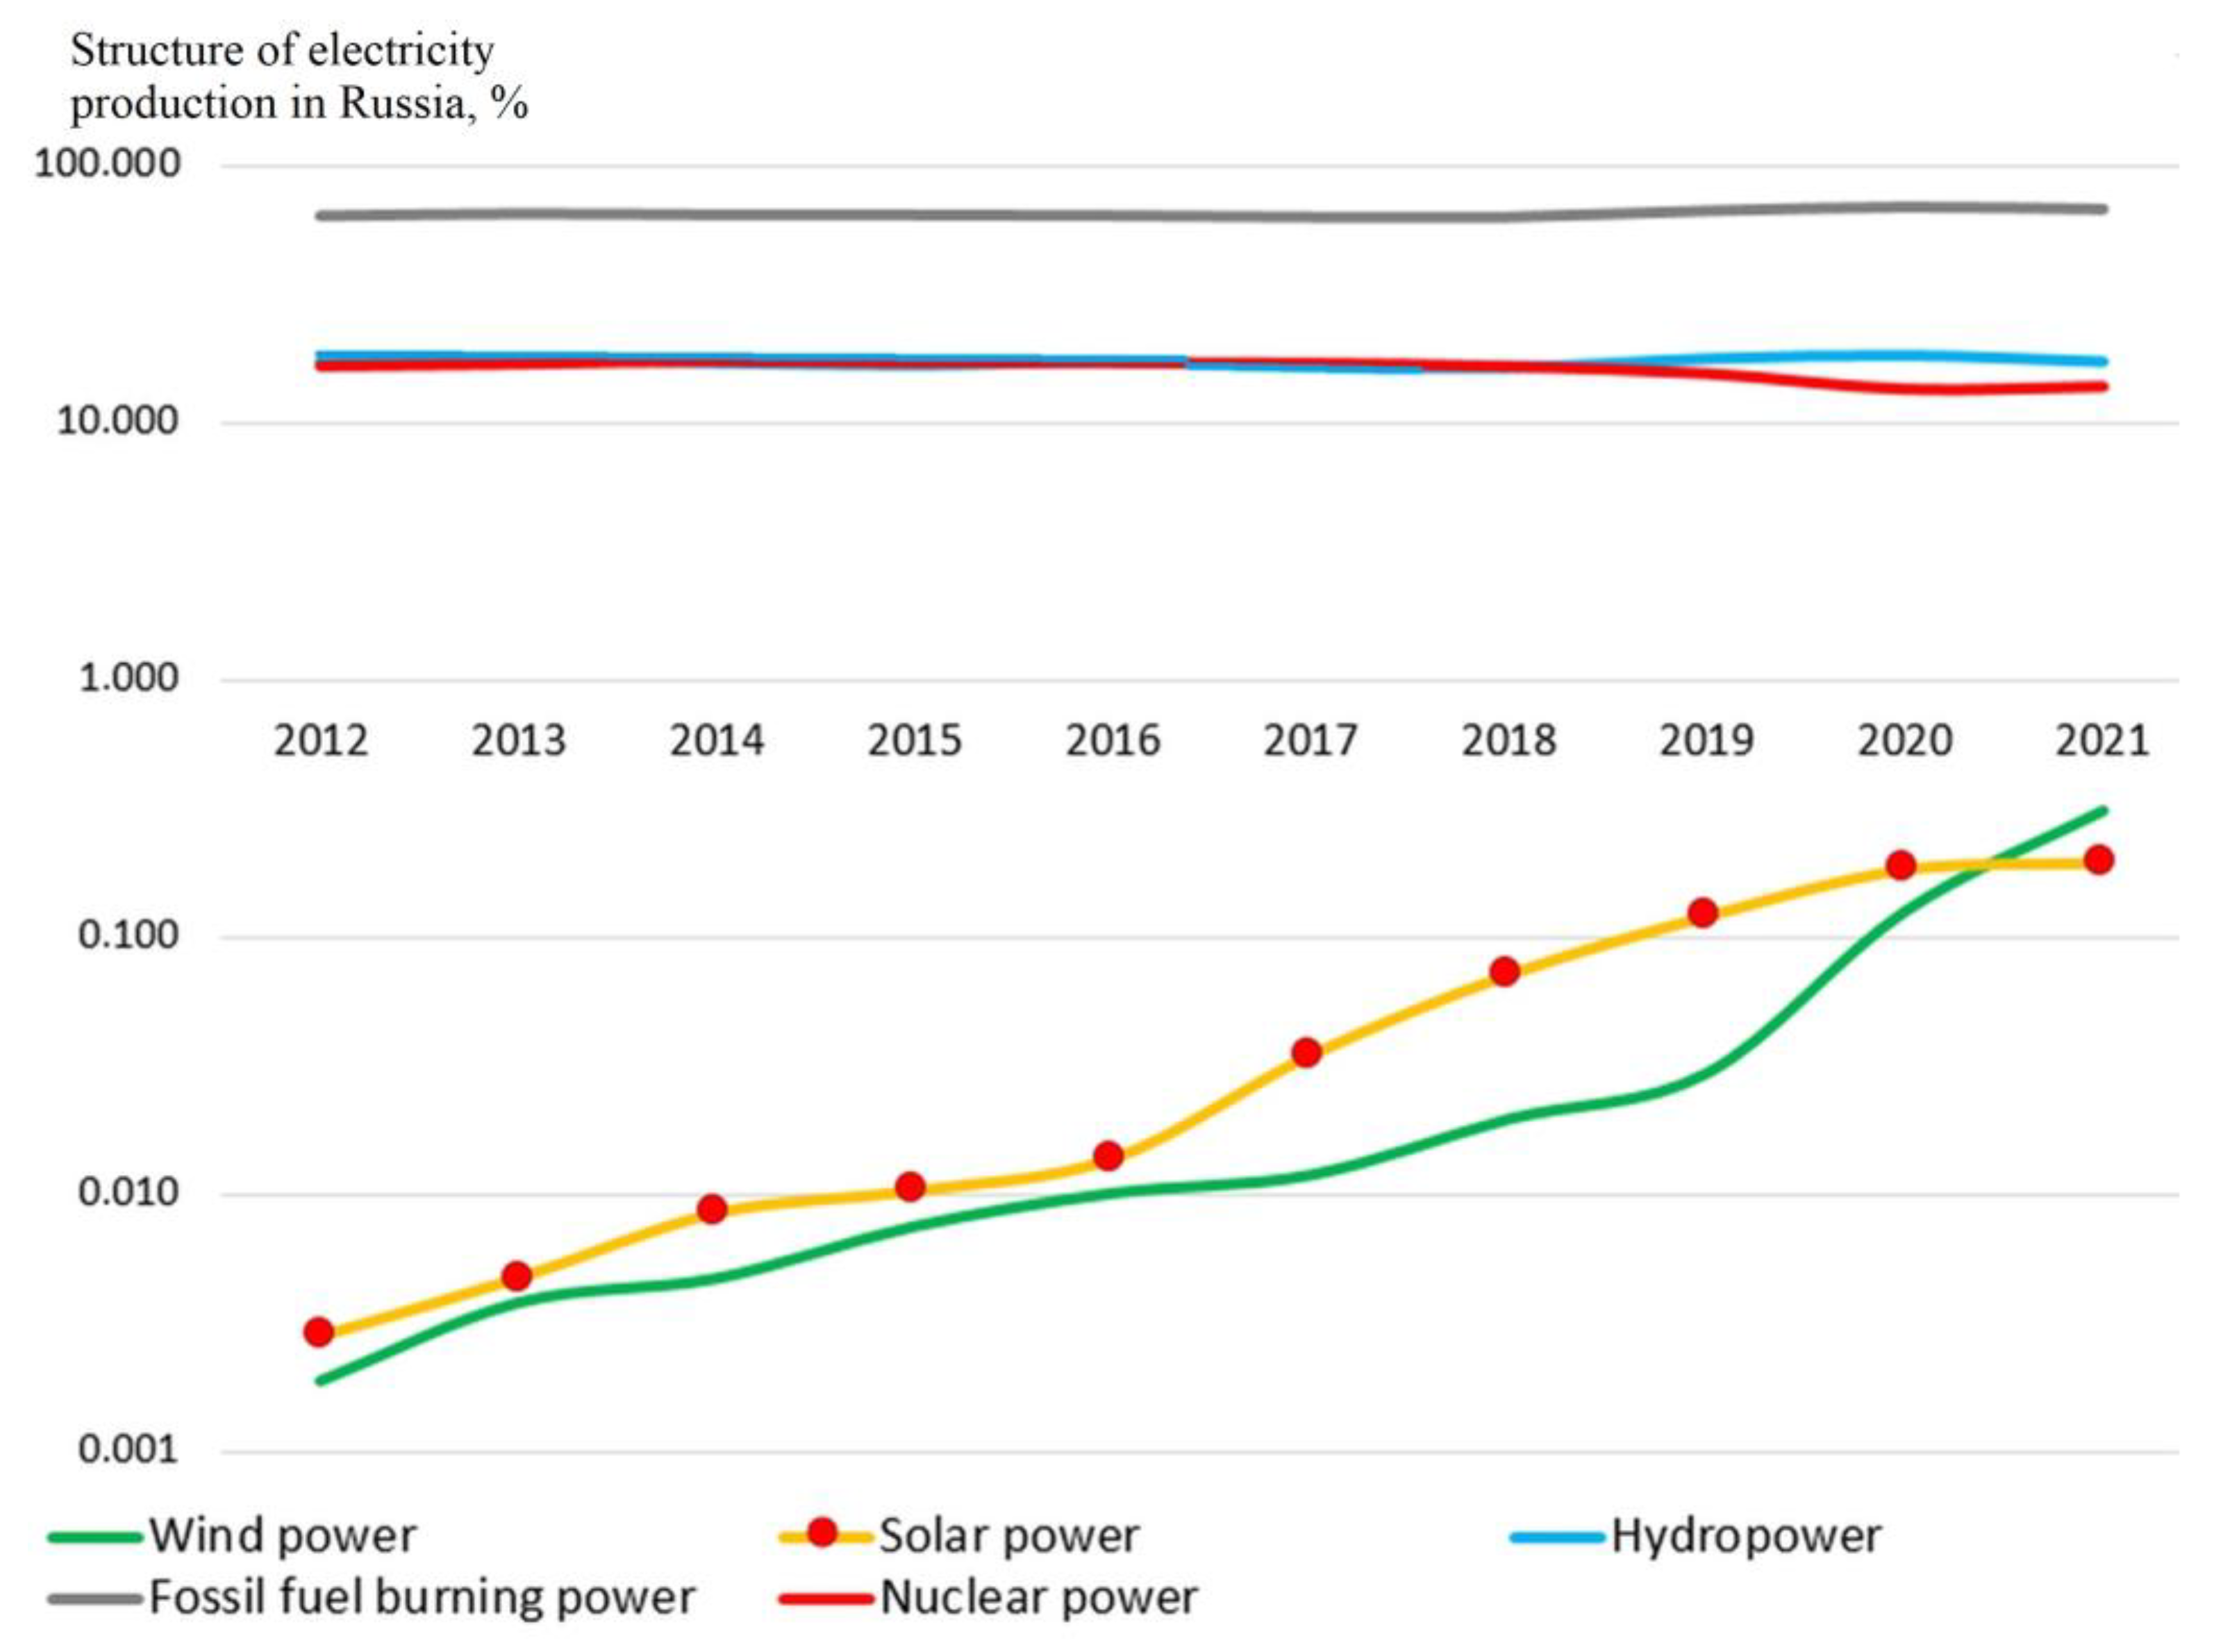
It follows from Table 2 that especially high positive dynamics are typical for wind energy—eighteen times for a decade. At the same time, the only explanation for such a “leap” can only be a start from a low level (before 2010, renewable energy projects in Russia were rare). In turn, the 8% growth in total electricity generation was driven by growth in fossil fuel burning and hydropower. On the contrary, the volumes of nuclear generation in Russia decreased by 11%, which, according to the standards of the European Commission, runs counter to the idea of an intermediate stage of the energy transition represented by nuclear and gas energy [72]. This is clearly illustrated in Figure 3, which reflects the shares of various sources of electricity in total generation in Russia.
Figure 3 clearly shows that the shares of renewable and non-renewable energy production in Russia differ by several orders of magnitude (in 2012 by four, in 2021 by two orders of magnitude). Therefore, it can be argued that renewable energy in Russia will not be able to become the predominant source in the near future (even if the linear trend of ultra-fast growth of solar and wind generation continues, it will take at least 50 years to achieve parity here). At the same time, the installed capacity of small hydropower plants in Russia is growing at a much slower pace than is the case for solar and wind farms (Table 3).
As can be seen in Table 3, in Russia, the total capacity of renewable energy in 2023 is 57.1 GW (21% of the total installed capacity), of which 51.7 GW is hydropower, 2.28 is wind power, and 2.15 GW is solar power. Although until 2019 the installed capacity of small hydropower plants (created since the 2010s) in Russia exceeded the capacity of solar and wind farms combined, from 2019 new capacities from the latter sources began to be rapidly commissioned, while the development of small hydropower in the country slowed down.
Thus, along with the ultra-fast growth of renewable energy, its place in the energy balance of Russia remains low, and does not correspond to its role in a modern economy and society. At the same time, there are significant prerequisites for the growth of renewable energy capacity in Russia, associated with environmental, pricing and territorial factors, which is clearly illustrated on the example of Siberia (the Siberian Federal District).

3. Results

3.1. The Role and Place of the Energy System of the Siberian Federal District in the Development of Russian Renewable Energy

The Siberian Federal District (also known as Western and Central Siberia, Figure 4) is the second largest macro-region of the Russian Federation (25.4%, 4.4 million km2) and unites the Republics of Altai, Khakassia and Tyva, Altai, Krasnoyarsk, Irkutsk, Omsk, Tomsk, the Novosibirsk regions, and the Kemerovo region-Kuzbass. Siberia is characterized by an extremely low population density (3.8 people per km2, with a total population of 16.6 million people—11.7% of the population of the Russian Federation). Siberia creates 11.4% of the GDP of the Russian Federation and 13.2% of industrial output [75].
The Siberian Federal District is demonstrating slow but steady growth in renewable energy, at a faster pace than other Russian macro-regions. This is confirmed by the expansion of the share of the Siberian sector of renewable energy in its total volume for Russia—from 15.2 to 18.3% in 2012–2021—as well as a decrease in the share in Russian fuel power production (from 25.7 to 22.3%); see Table 4.
Along with the positive trend in the development of renewable energy in Siberia, one cannot fail to note the overall importance of the macro-region in the power production in Russia—almost a fifth (19.9–18.6%) for 2012–2021—while the share of the Siberian fuel energy in that of all of Russia is one-fourth. Further, despite the share in Russia’s GDP of 11–12%, the Siberian Federal District produces up to a third of atmospheric emissions from stationary sources. Nevertheless, there is a close, conditionally linear relationship between the gradual shrinkage of Siberia’s share in fossil fuel burning power production and the reduction in emissions into the atmosphere, by 2%, while the share of the macro-region in the Russian renewable energy industry increased by 3%. In addition, it should be noted that there is a high potential for the development of hydropower in the Siberian Federal District (28.1–29.3%), which, at the same time, is represented by large hydroelectric power plants built in the former USSR (1960s–1970s).
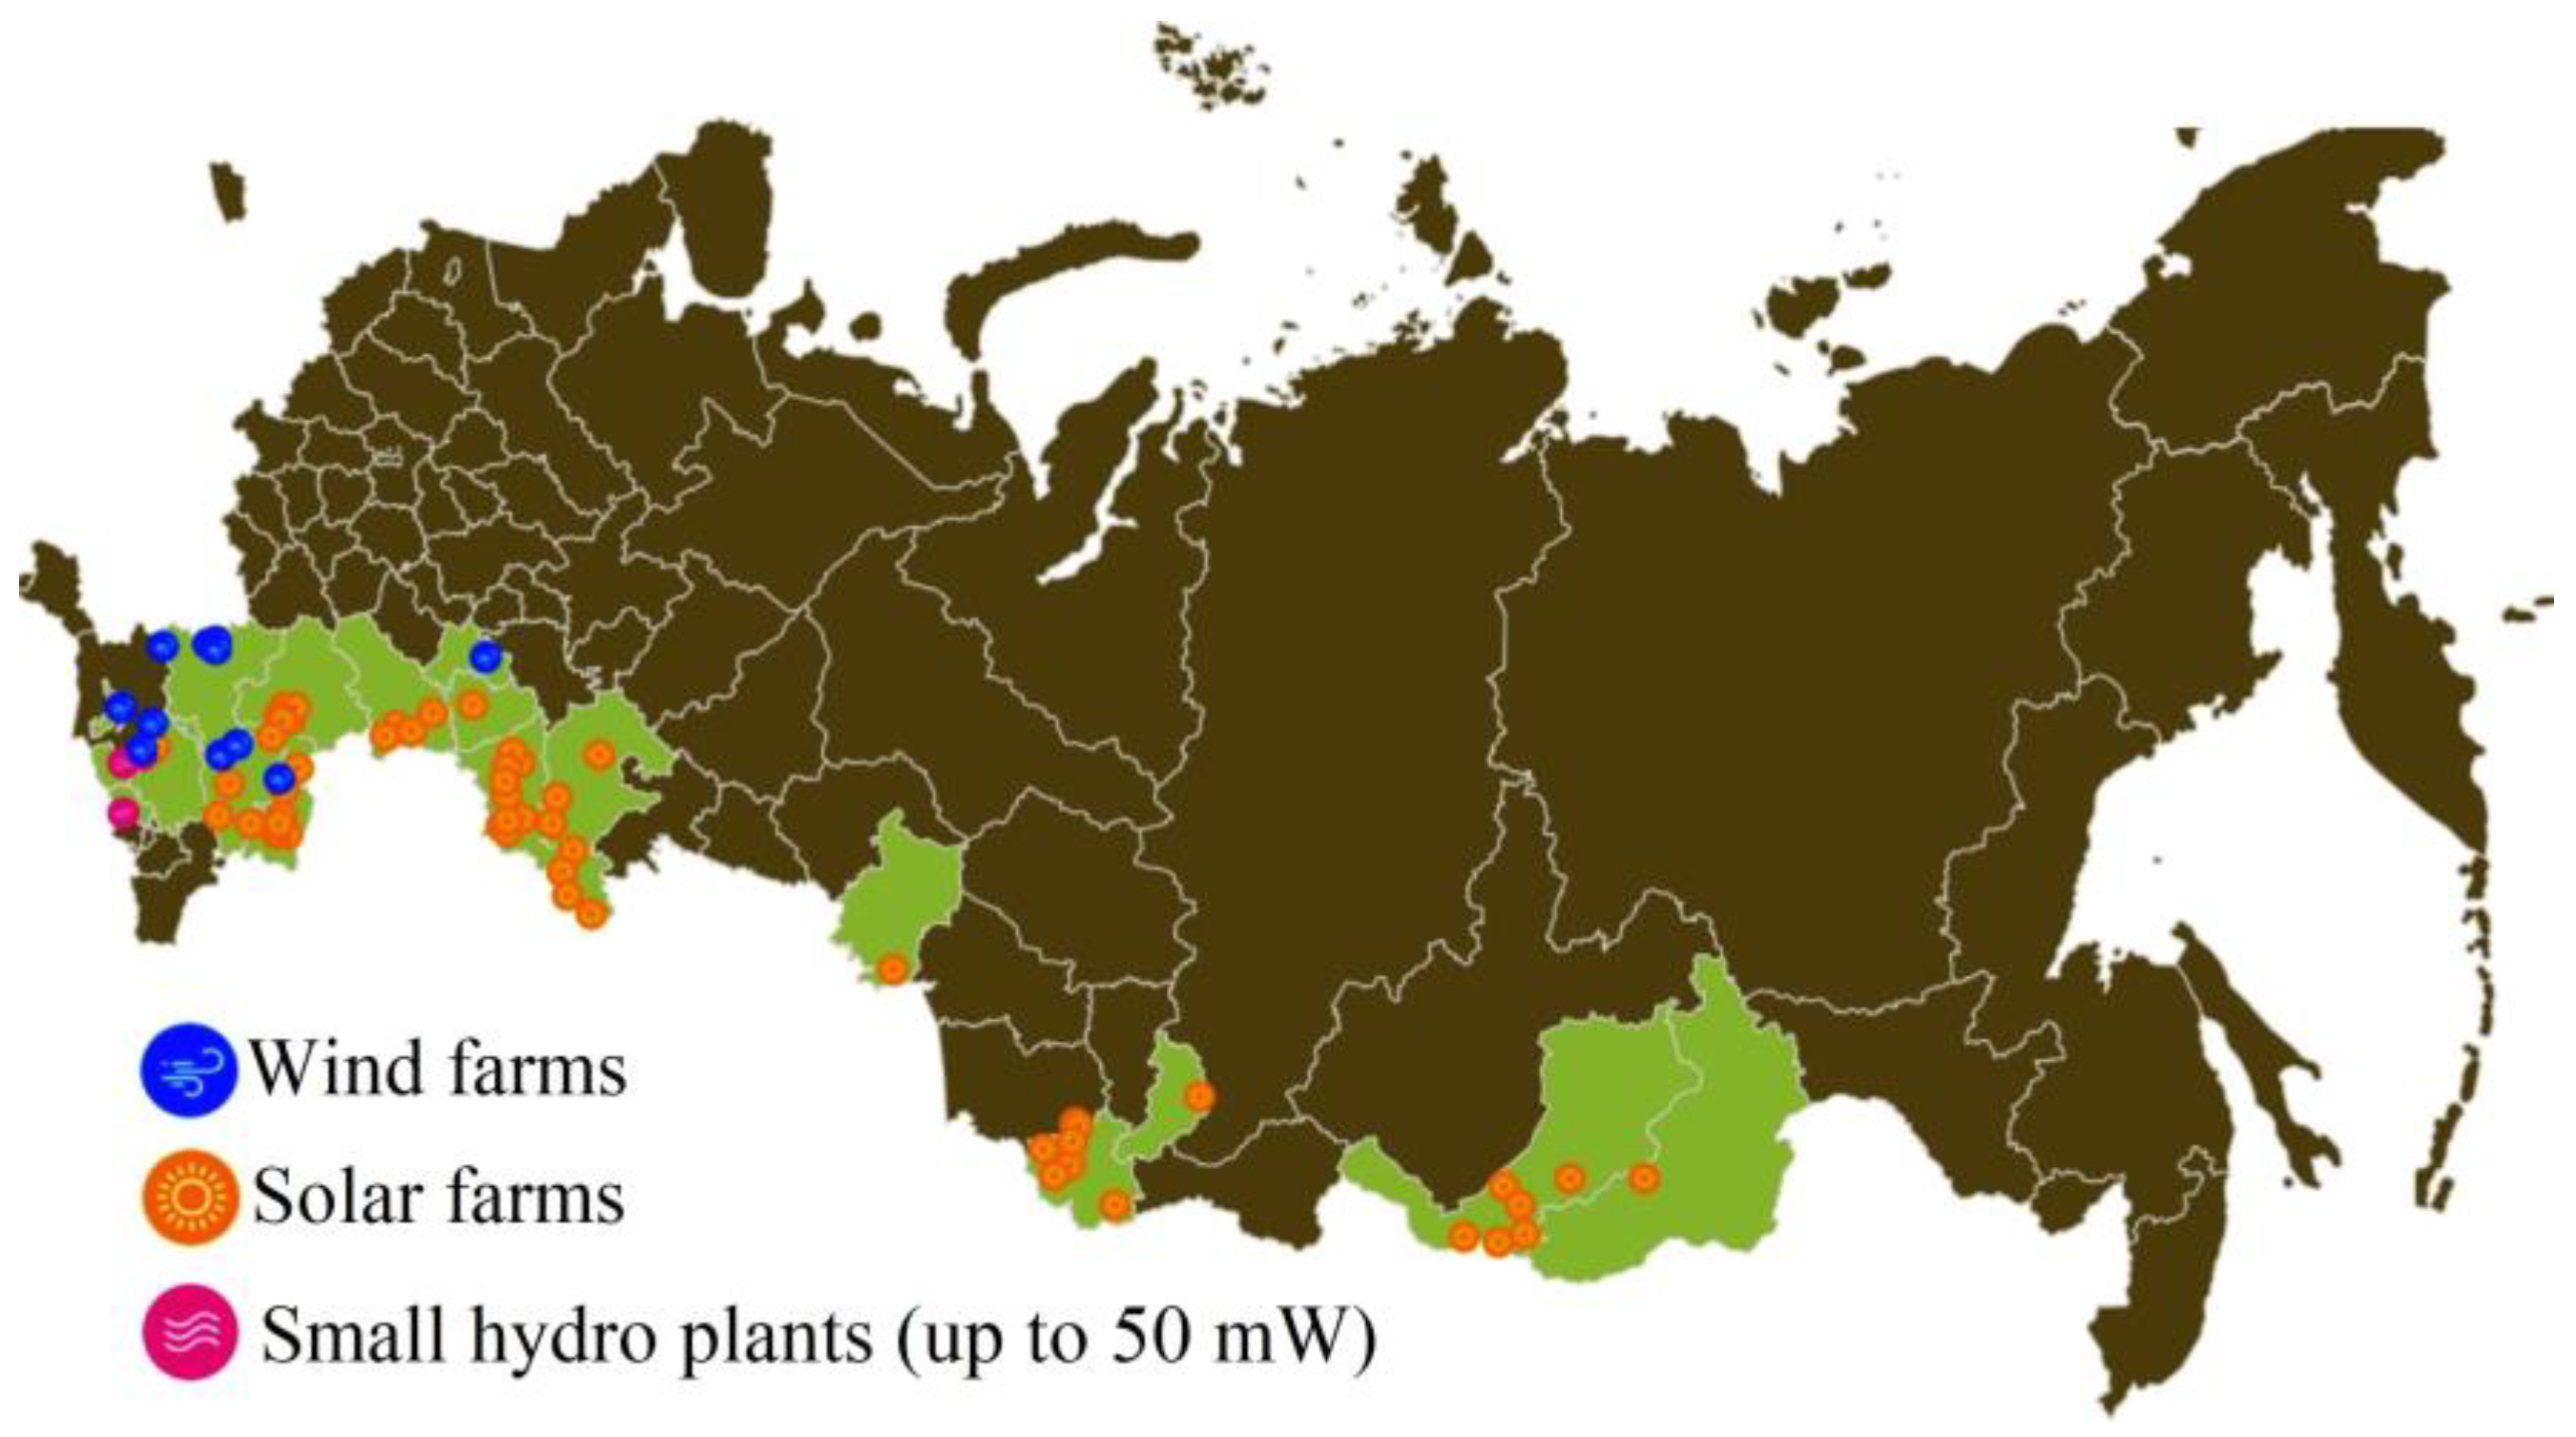
At the same time, the share of renewable energy sources in Siberia is not growing (wind power) or decreasing (solar power—from 2.0 to 0.9%, with a peak of 3% in 2014). This can be explained by the fact that the bulk of renewable energy projects in Russia are concentrated in the Southern Federal District (Republics of Adygea, Kalmykia, Krasnodar Territory, Volgograd, Rostov Regions, etc.); see Figure 5.
It should be mentioned that with an equal population and a tenfold smaller area, the Southern Federal District has important advantages in the development of renewable energy over Siberia—twice as many sunny days per year, and 20% higher average and maximum wind speeds (Table 5).
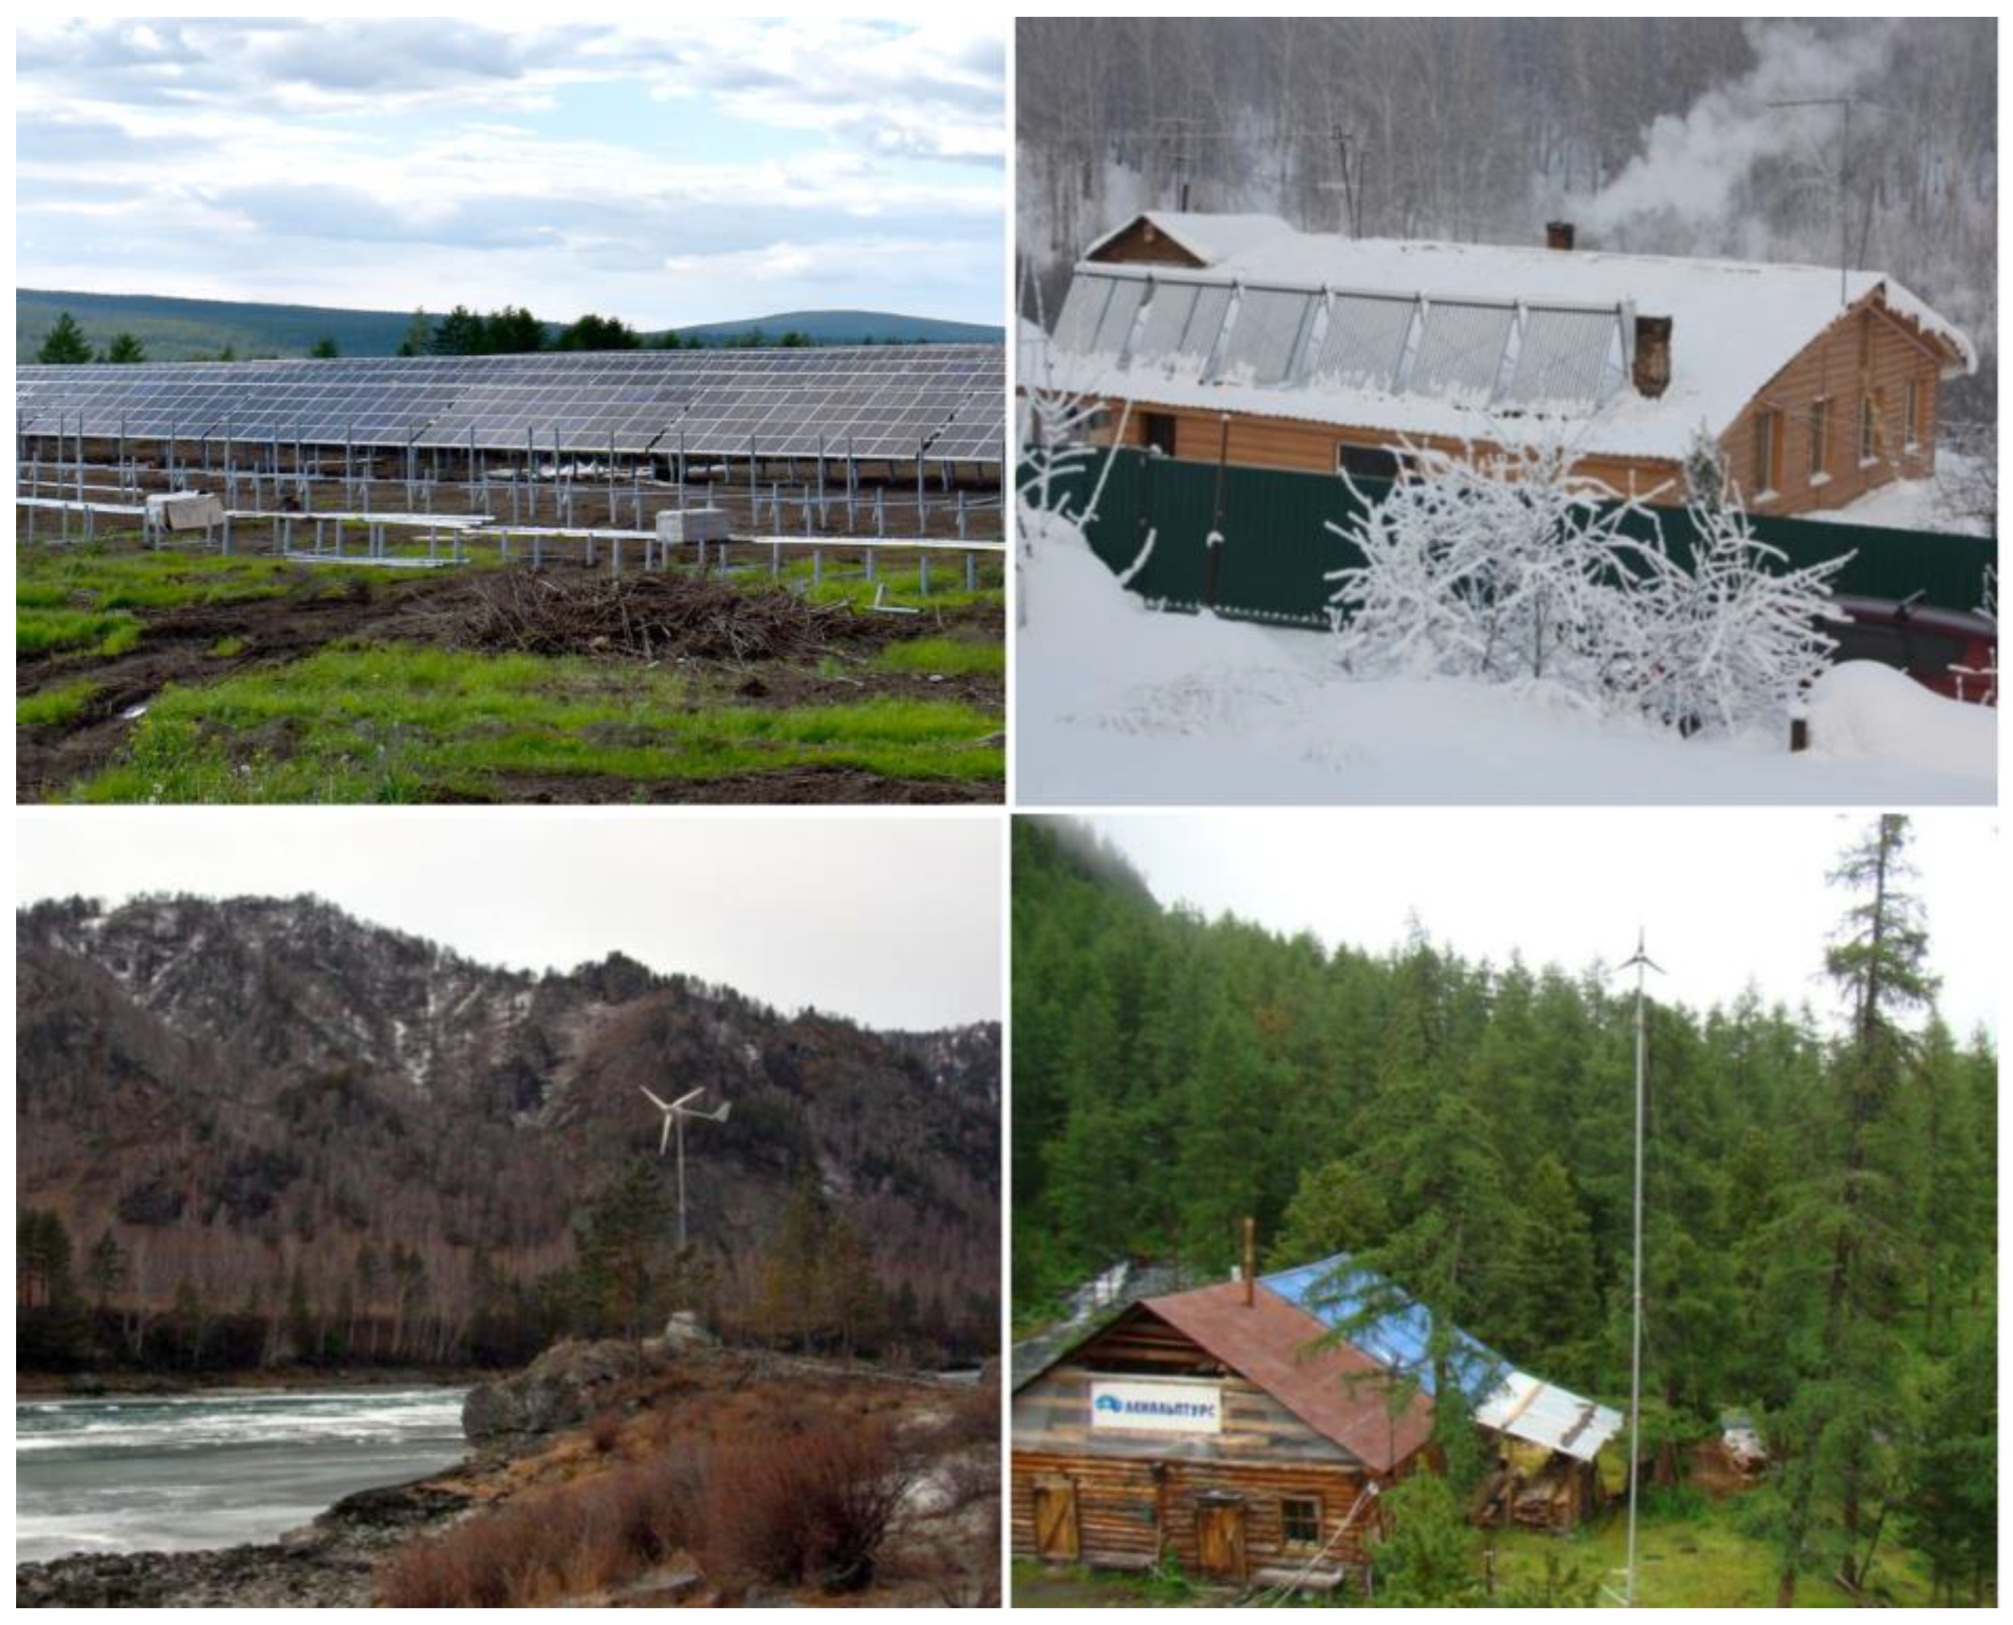
At the same time, climatic conditions in the Southern and Siberian Federal Districts also differ significantly. The average annual temperature in the first district is +7.5 °C, and in the second it is −10.5 °C. In winter, the temperature in the South of Russia rarely drops below −15 °C, while in Siberia it often falls below −50 °C, which negatively affects the functioning of solar and wind energy equipment, as well as small hydroelectric power plants. Therefore, in the Siberian Federal District, dispersed wind and solar energy systems, tied to specific consumers, prevail, while in the Southern Federal District, mainly large generation facilities are built, connected to the main electric grids (Figure 6 and Figure 7).
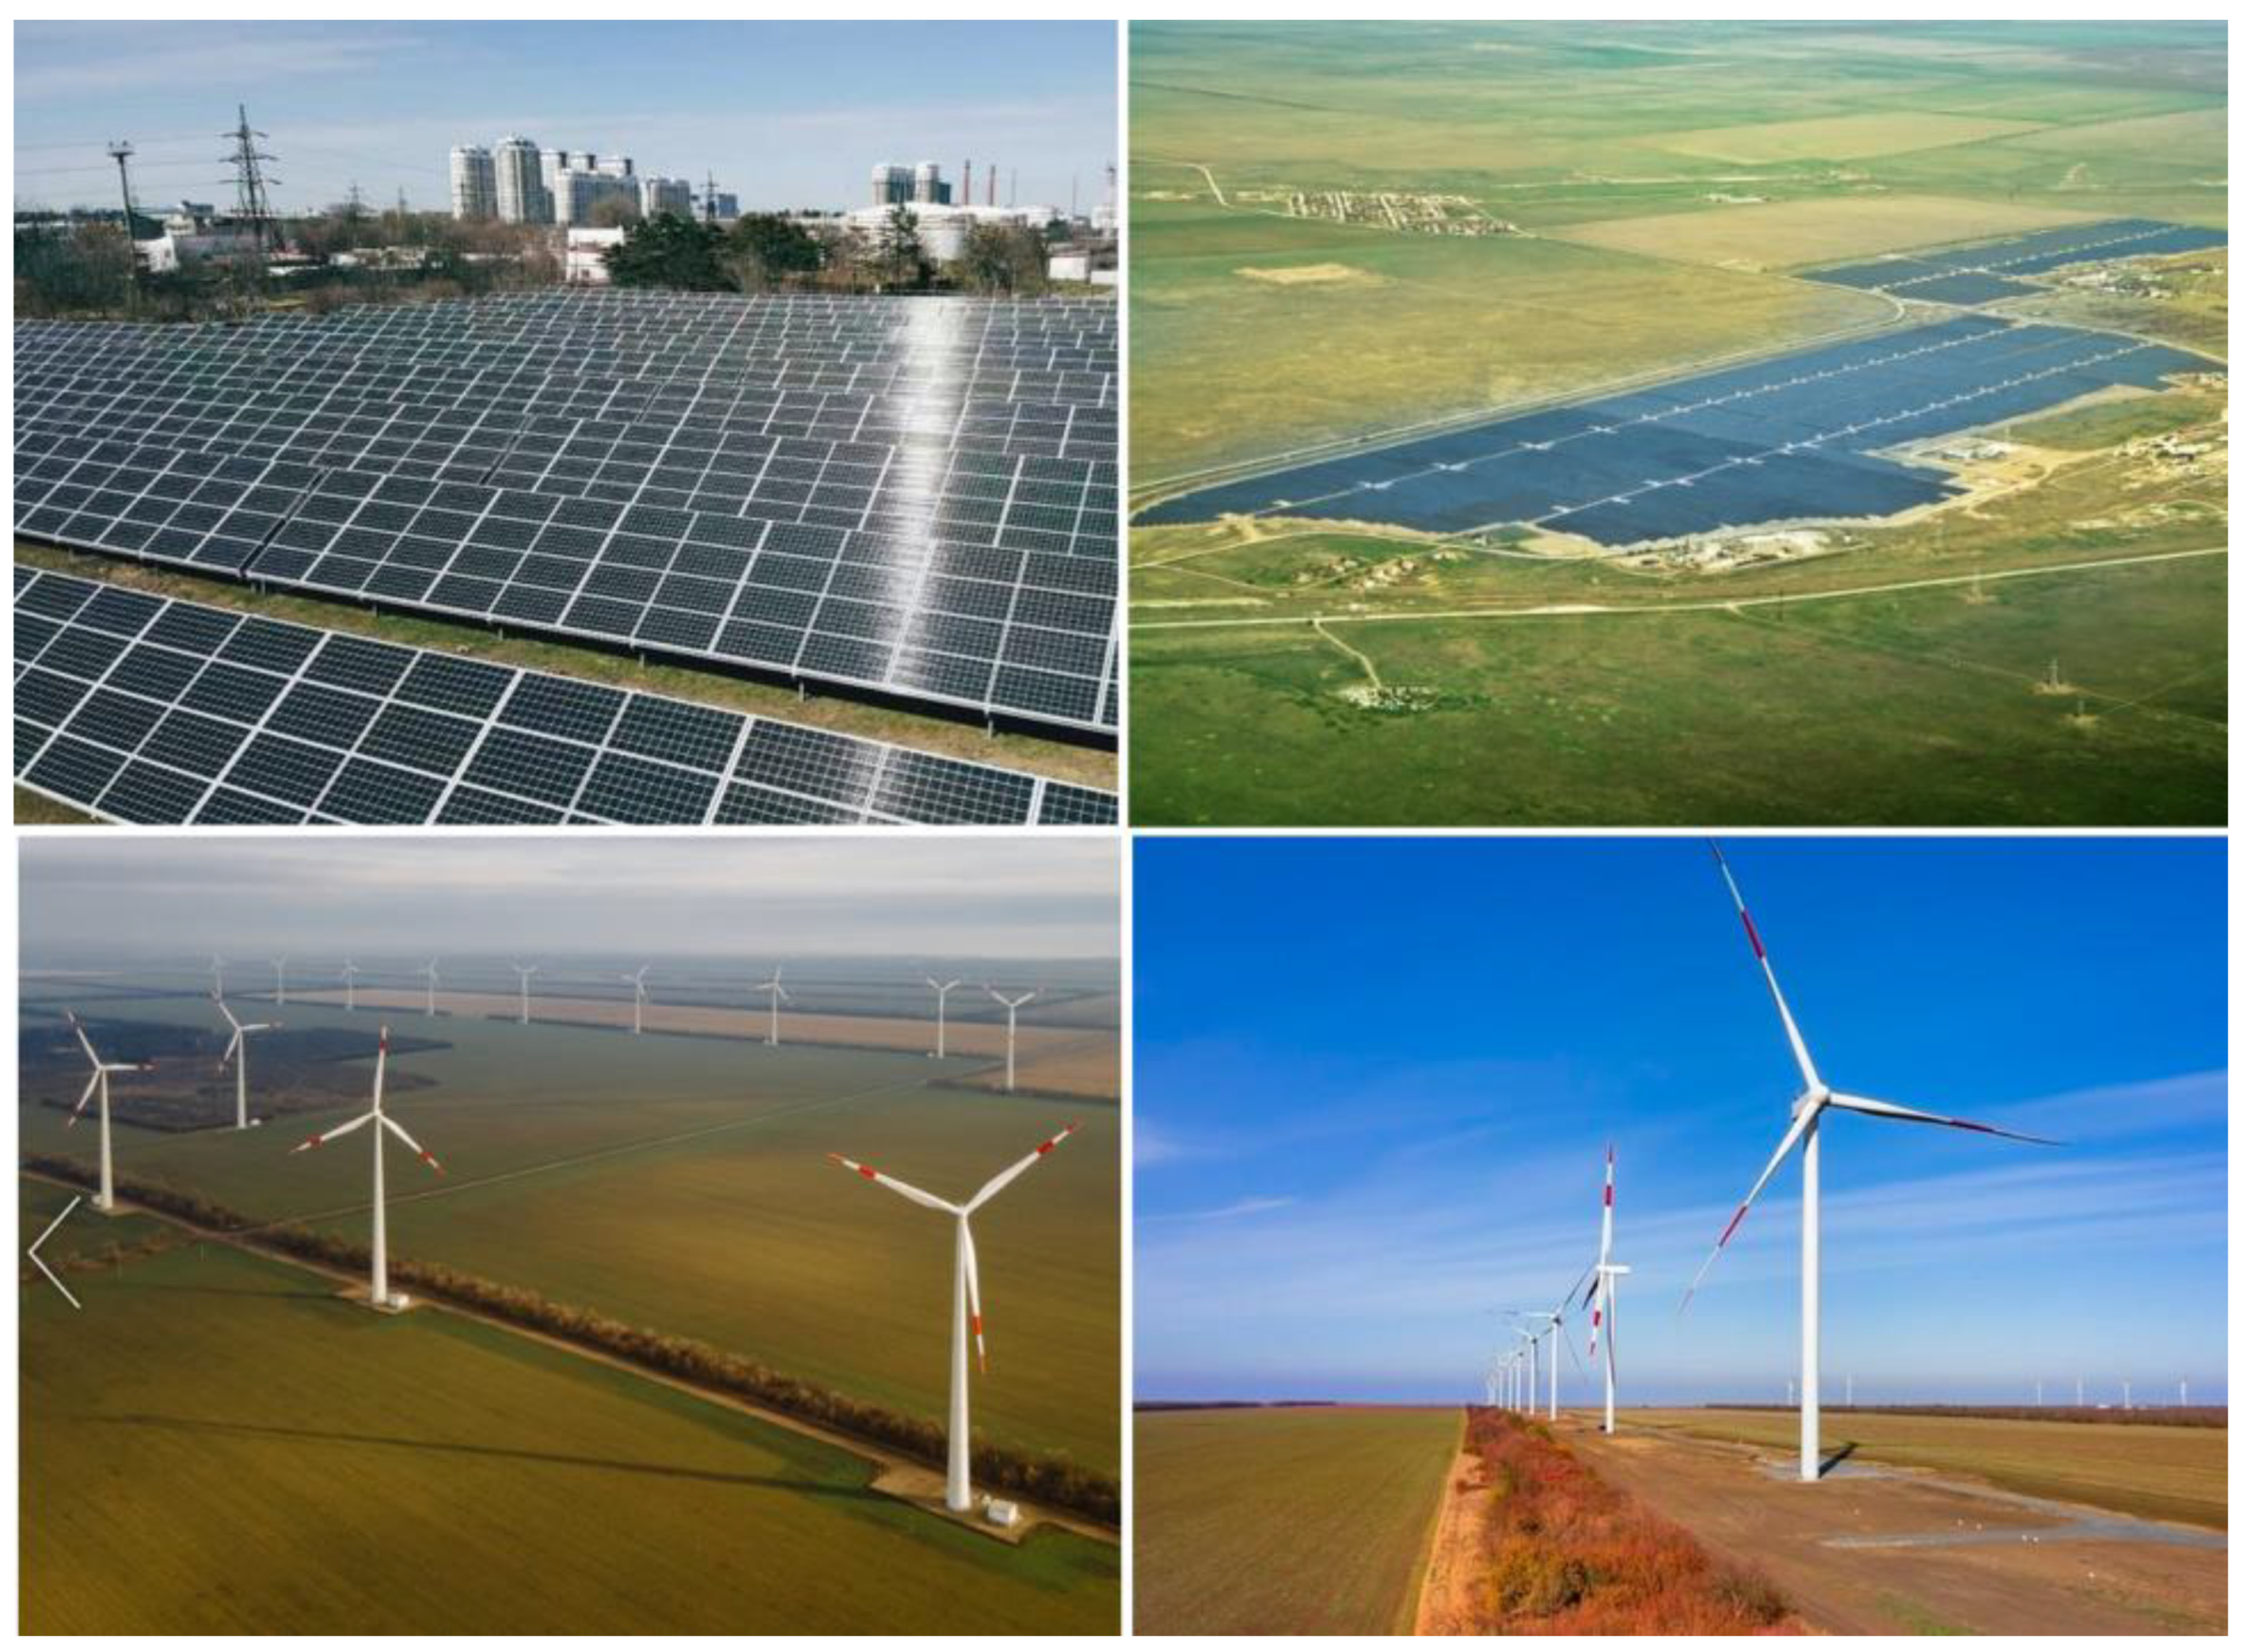
Figure 6 shows the most common renewable energy installations in Siberia, represented by individual solar and wind facilities that feed individual consumers in residential, commercial, industrial, agricultural, tourism, and social sector facilities.
In contrast to the Siberian, in the Southern Federal District, renewable energy is developing in the form of large facilities, due to the greater development of main grids (Figure 5). At the same time, due to the fact that the volume of renewable energy production in the Southern Federal District is 2.5 times greater than in the Siberian Federal District, the prospects for its development in the South are assessed as being worse than in Siberia. This is largely due to the fact that because of the relatively small share of industrial consumers of electricity in the Southern District, according to the Ministry of Energy of Russia, the construction of new wind and solar power plants is not profitable there, since the district’s energy system is overflowing with renewable energy [84].
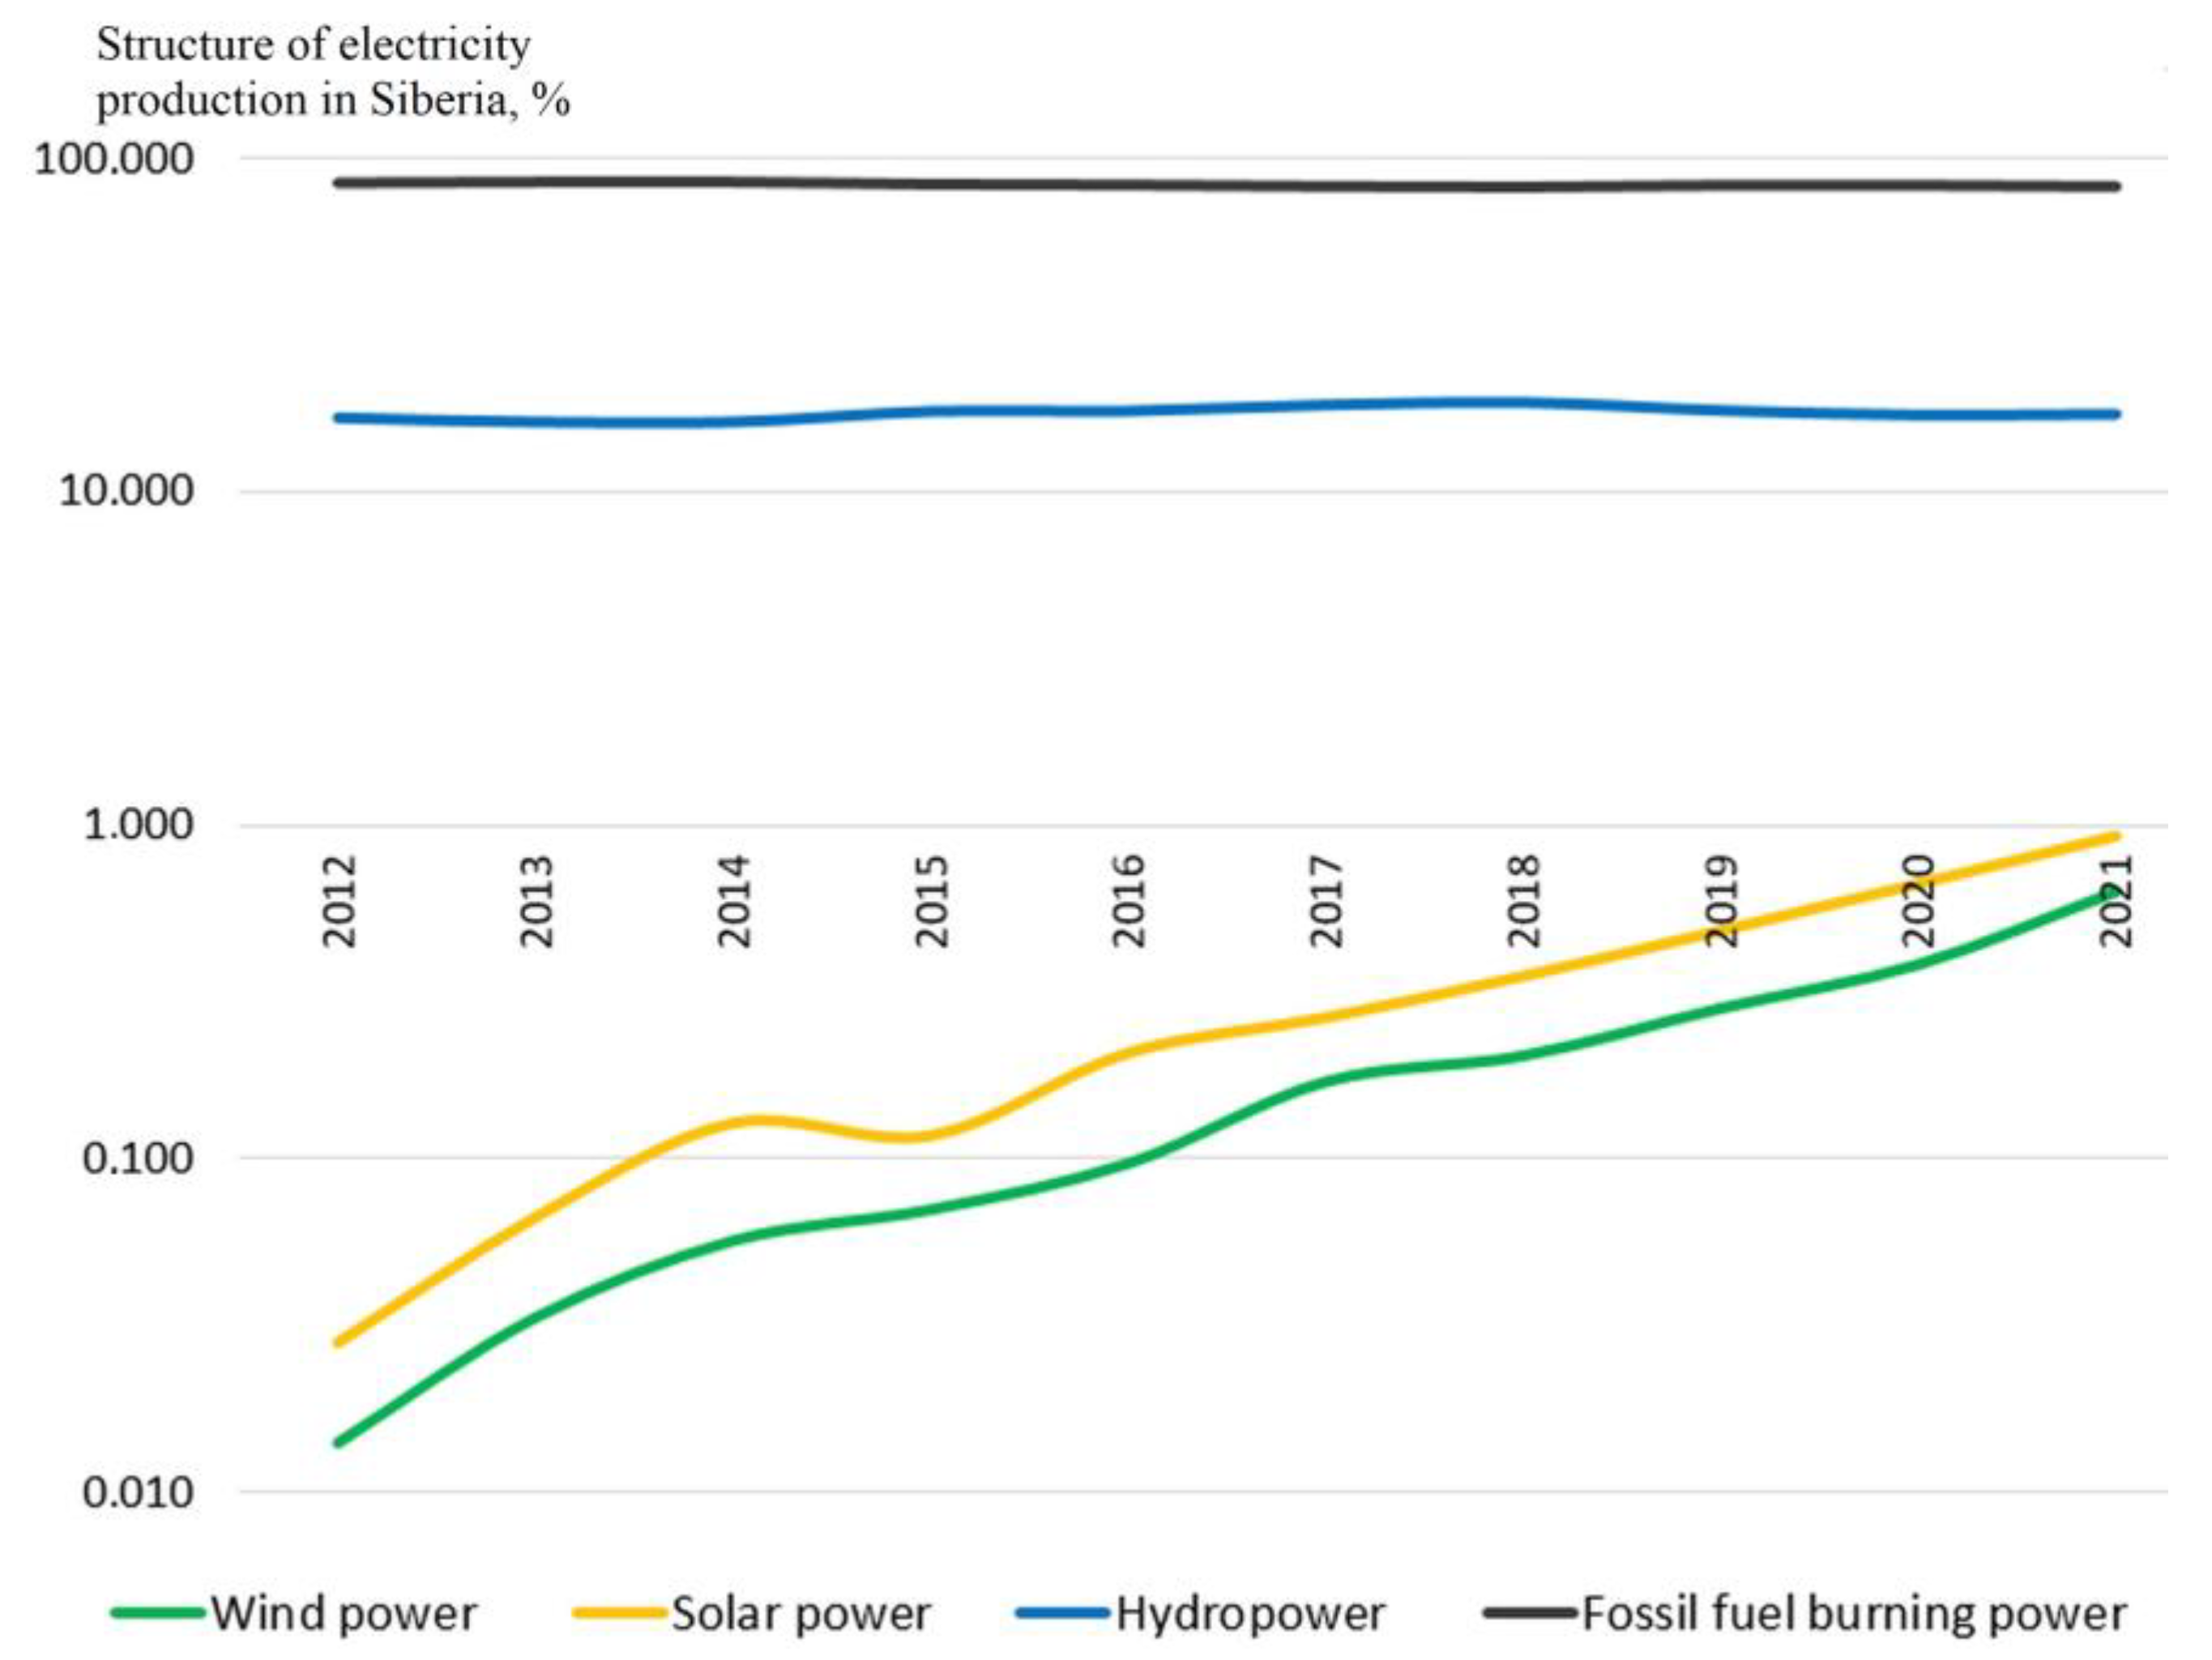
The share of renewable energy in the Siberian Federal District is 7 times higher than the same indicator for the Russian Federation (Figure 3), and amounted to 3.5% of the total generation in the macro-region in 2021 (excluding large hydroelectric power plants, whose share in the Siberian generation is close to 19%; see Figure 8). It should be noted that there are no nuclear power plants in Siberia.
The data in Figure 8 show an optimistic picture of the rapid growth in the share of renewable energy in the Siberian Federal District, in which solar and wind generation are the leading source, growing 110-fold in the period 2012–2021, with an increase from 0.047 to 0.55%. However, even by 2022, the share of new renewable energy in the Siberian Federal District did not exceed 1.5%, including small hydro plants (up to 50 mW), or 23 when taking into account the old Soviet large hydroelectric power plants. However, it is worth mentioning a growth in the share of fuel power generation in Siberia from 64% to 67% over the decade under review.
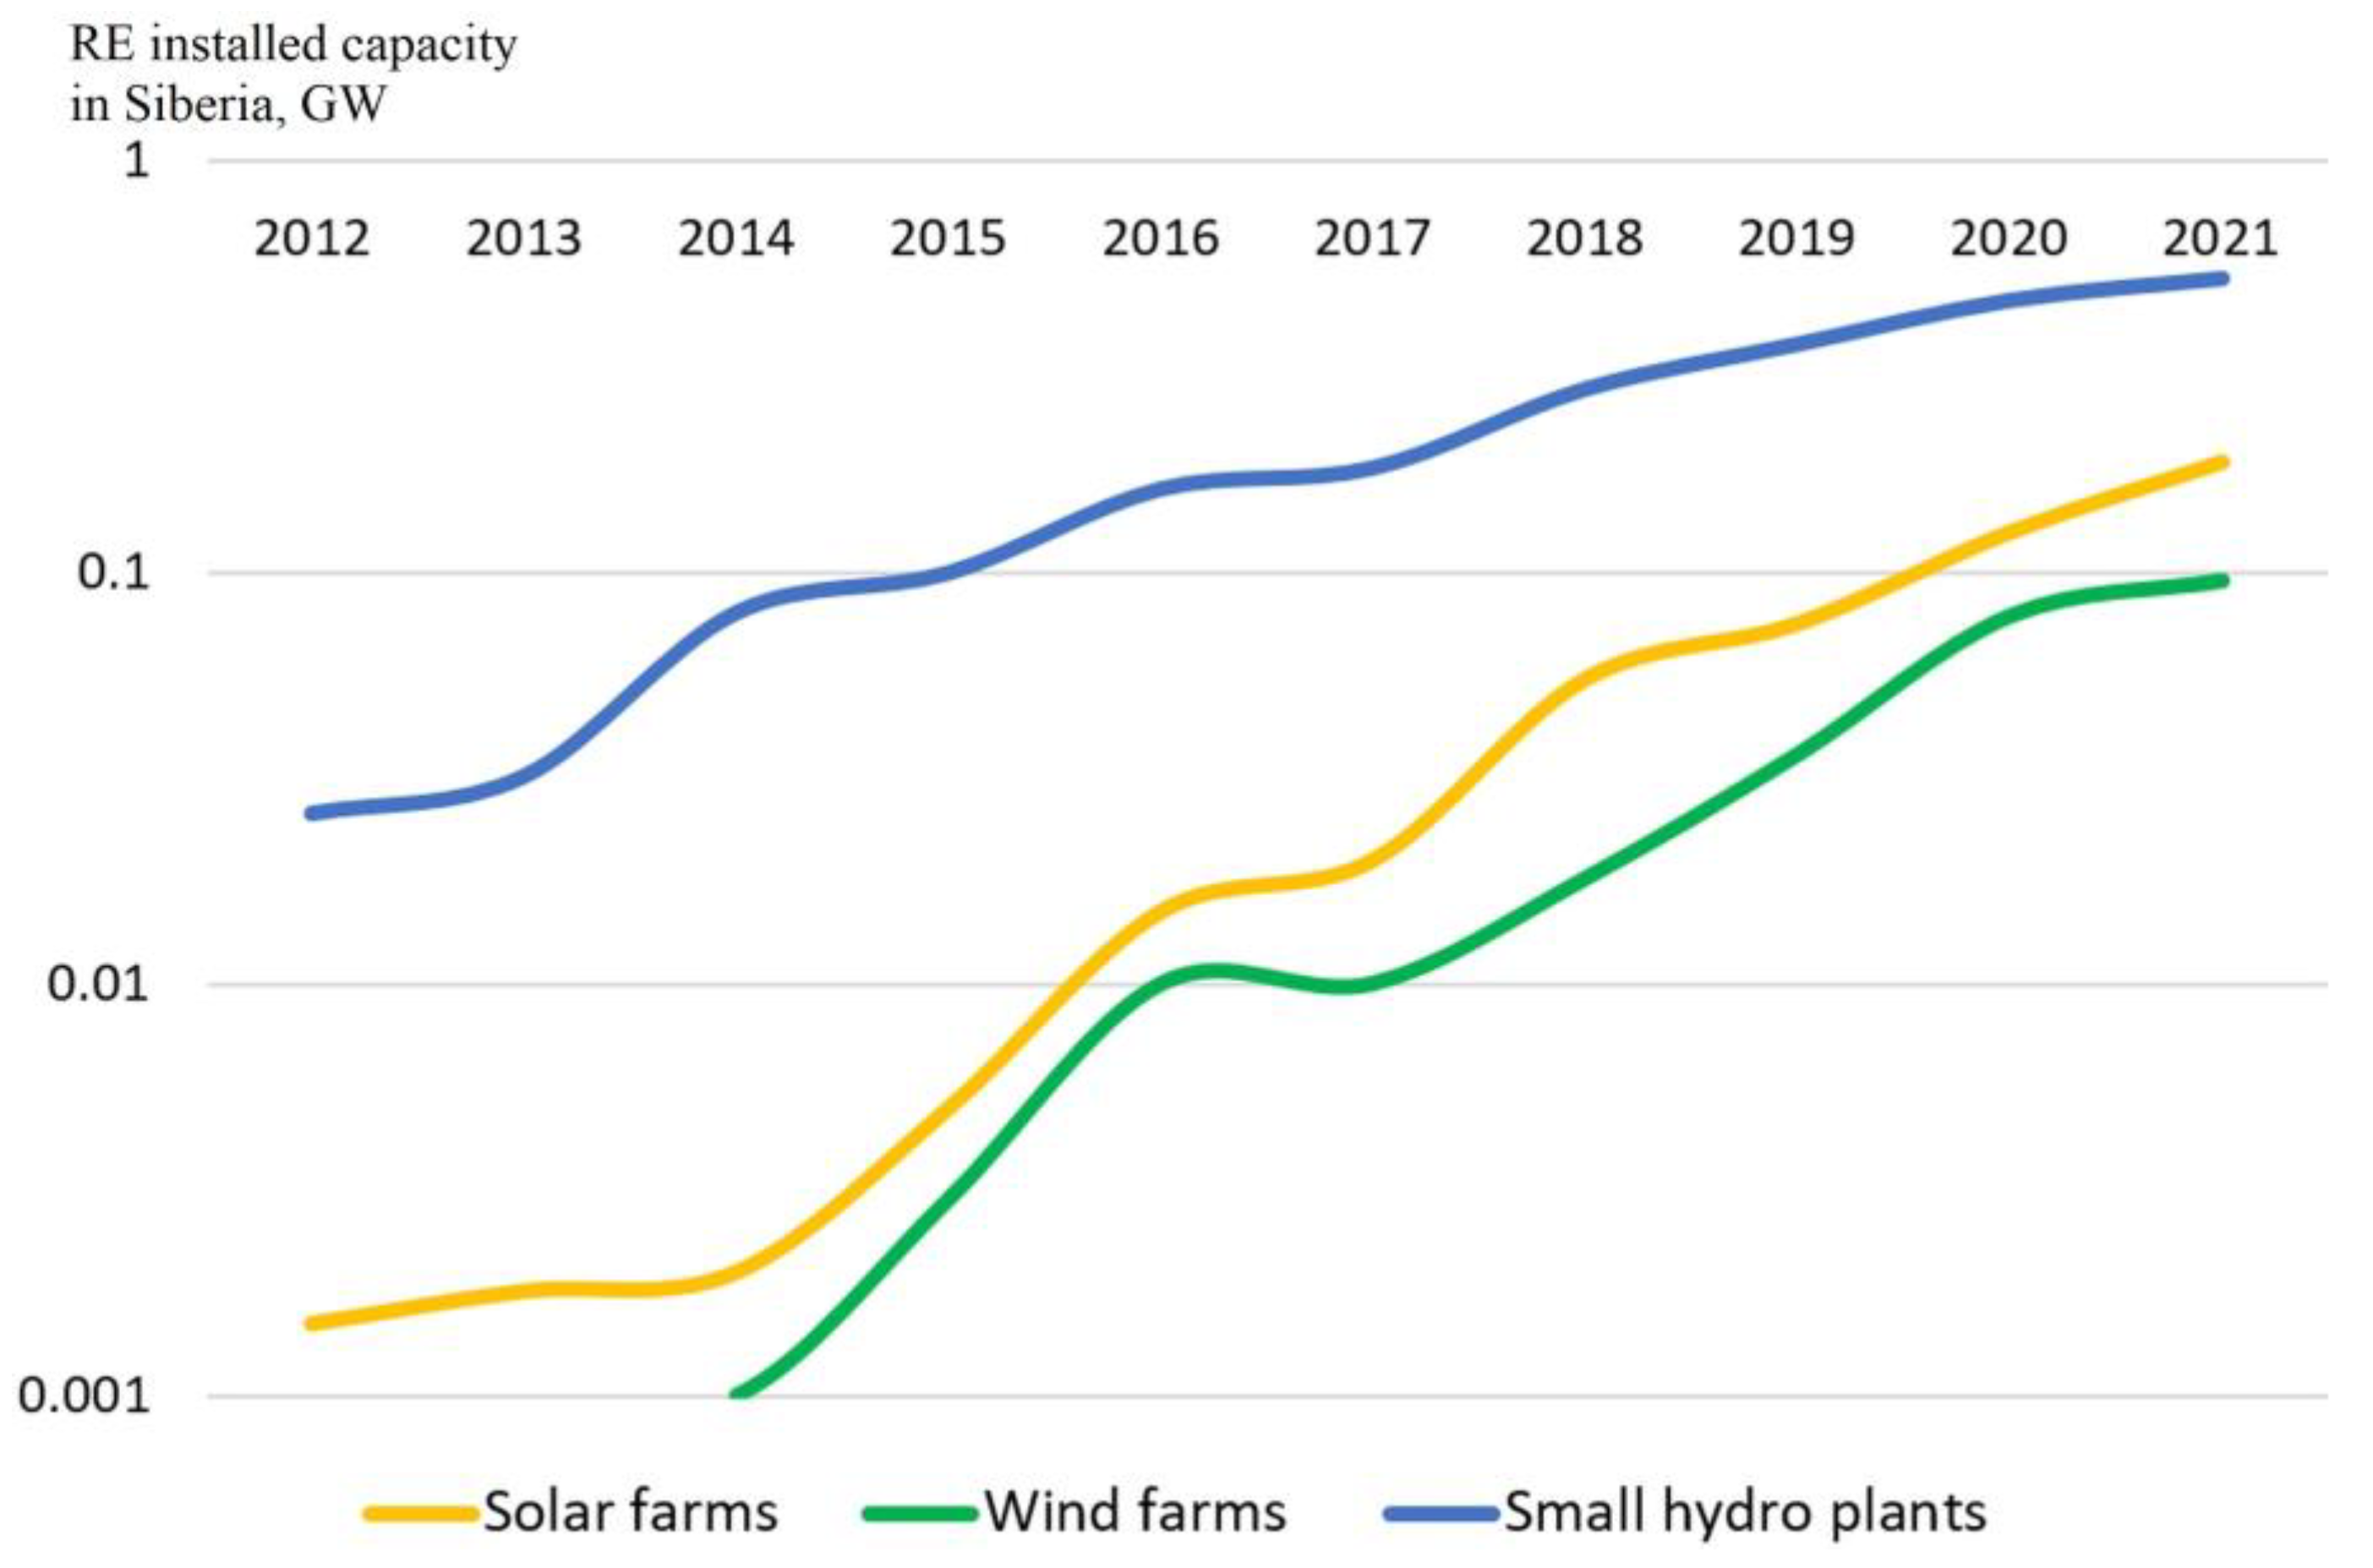
We attribute the growth of both fuel and renewable generation in Siberia to the insufficient volumes of commissioning of the new installed capacity of the latter (Figure 9).
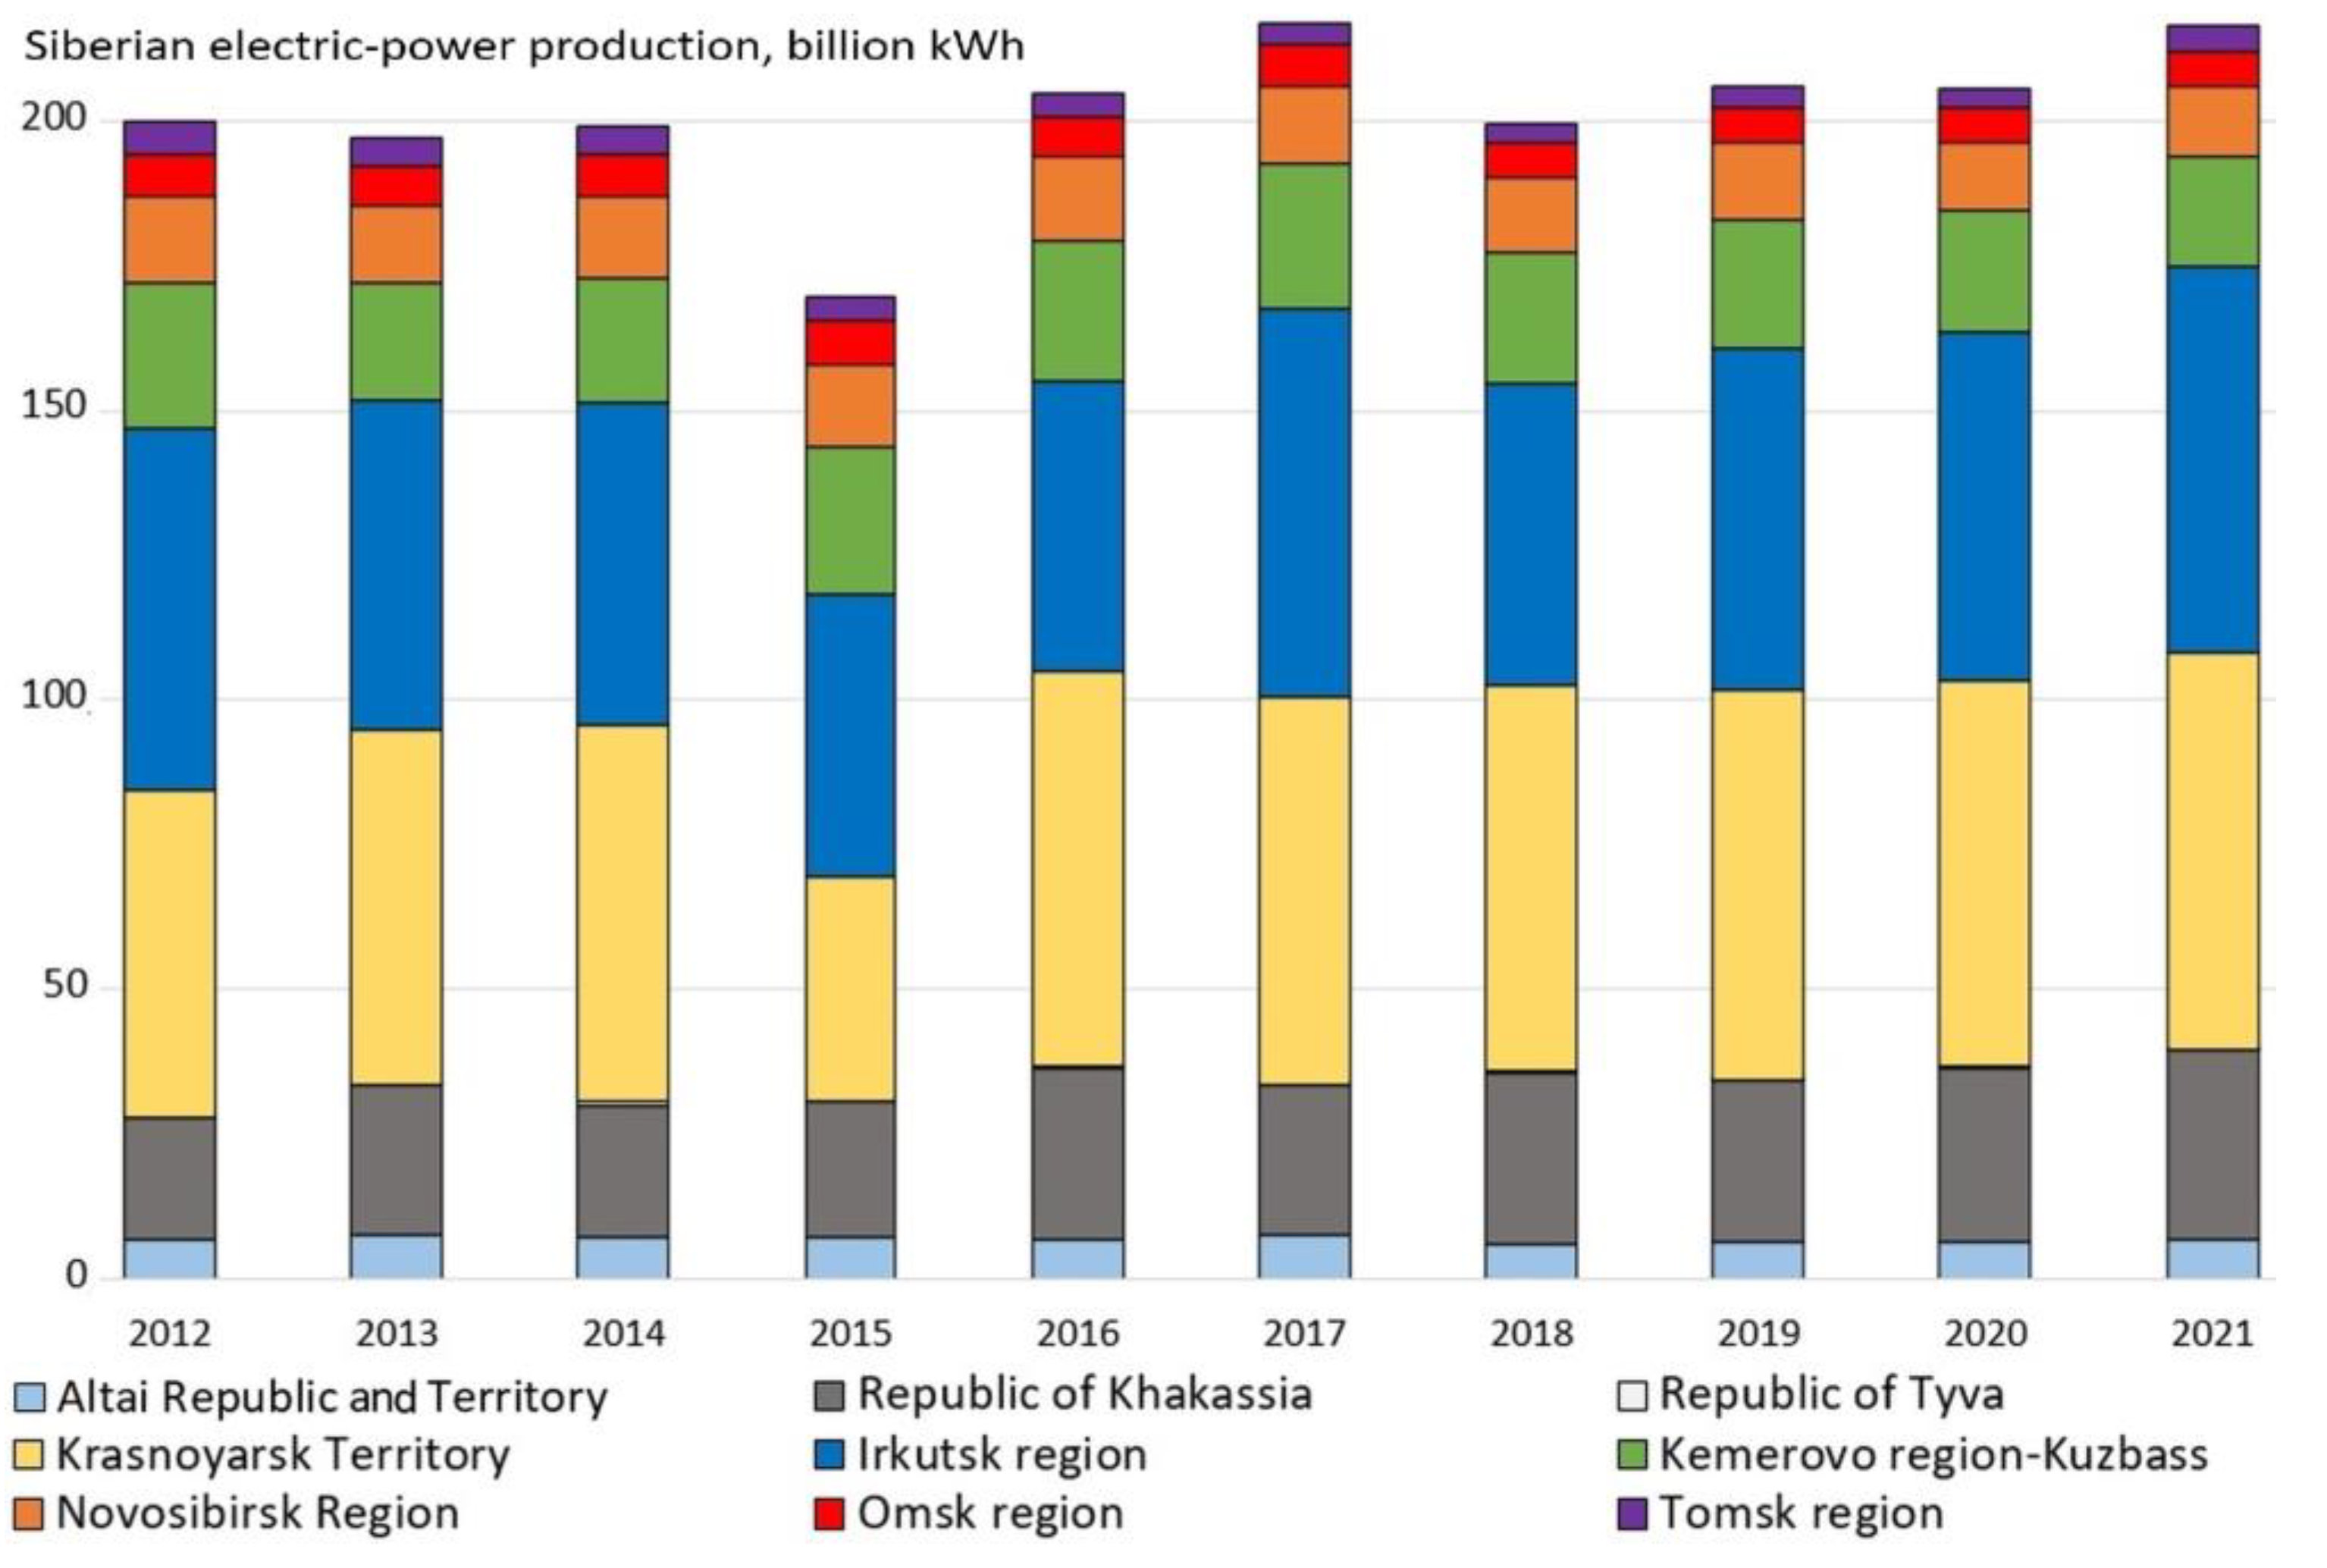
As follows from the data in Figure 9, the total installed capacity of new renewable energy facilities in Siberia did not exceed 1 GW, even if showing a 100-fold increase over the past decade. In general, the increase in the installed capacity of renewable energy takes place in the regions of Siberia, as leaders in electricity generation (Figure 10).
In total, 79% of the capacity of old large (Sayano-Shushenskaya, Bratskaya, Mainskaya, Krasnoyarskaya HPPs) and 31% of new small hydroelectric power plants are concentrated in three regions—the main producers of electricity in Siberia (more than 60%)—the Krasnoyarsk Territory, the Republic of Khakassia and the Irkutsk Regions. In turn, fuel power plants using natural gas and coal mostly cover the energy needs of the Kemerovo, Novosibirsk, Tomsk, and Omsk regions.
Therefore, the leaders in the development of renewable energy in Siberia are the regions that have smaller shares in total electricity generation—the Republic of Altai and the Altai Territory, and the Republics of Tyva and Khakassia. For a number of reasons presented below, the development of renewable energy for them is the main means of meeting the growing demand from businesses and the population for energy. Among the new energy sources in Siberia, solar is the most actively developing. The construction of one of the first large solar farms, the Kosh-Agach solar power plant in the Altai Republic, began in 2014 (for 2022, up to 25% of the total consumption of the republic is accounted for by solar generation).
Thus, there are difficult conditions for the development of renewable energy in Siberia, associated with a number of mutually intertwining factors, which are discussed below.

3.2. Factors of Development of Renewable Energy in the Siberian Federal District

3.2.1. Saturation with Main Powerlines

This factor has a dual effect on the development of renewable energy: on the one hand, large grids stimulate the supply of energy from wind and solar power plants to the wholesale market; on the other hand, due to the higher cost of renewable energy, it loses out compared to energy made with traditional fuel. Therefore, population density should be taken into account, along with grid saturation. Consideration of the influence of saturation with main powerlines on the development of renewable energy in the region should be preceded by a description of two models of their connection.
The first model is based on the decentralization of electricity generation and distribution, which makes it possible to provide electricity to areas with low population density that are difficult to access for the delivery of hydrocarbons. To do this, when introducing renewable energy systems, small distributed energy systems are used that are autonomous from main powerlines of a centralized energy system. The second model connects the development of renewable energy with the construction of high-voltage main powerlines covering vast territories [87].
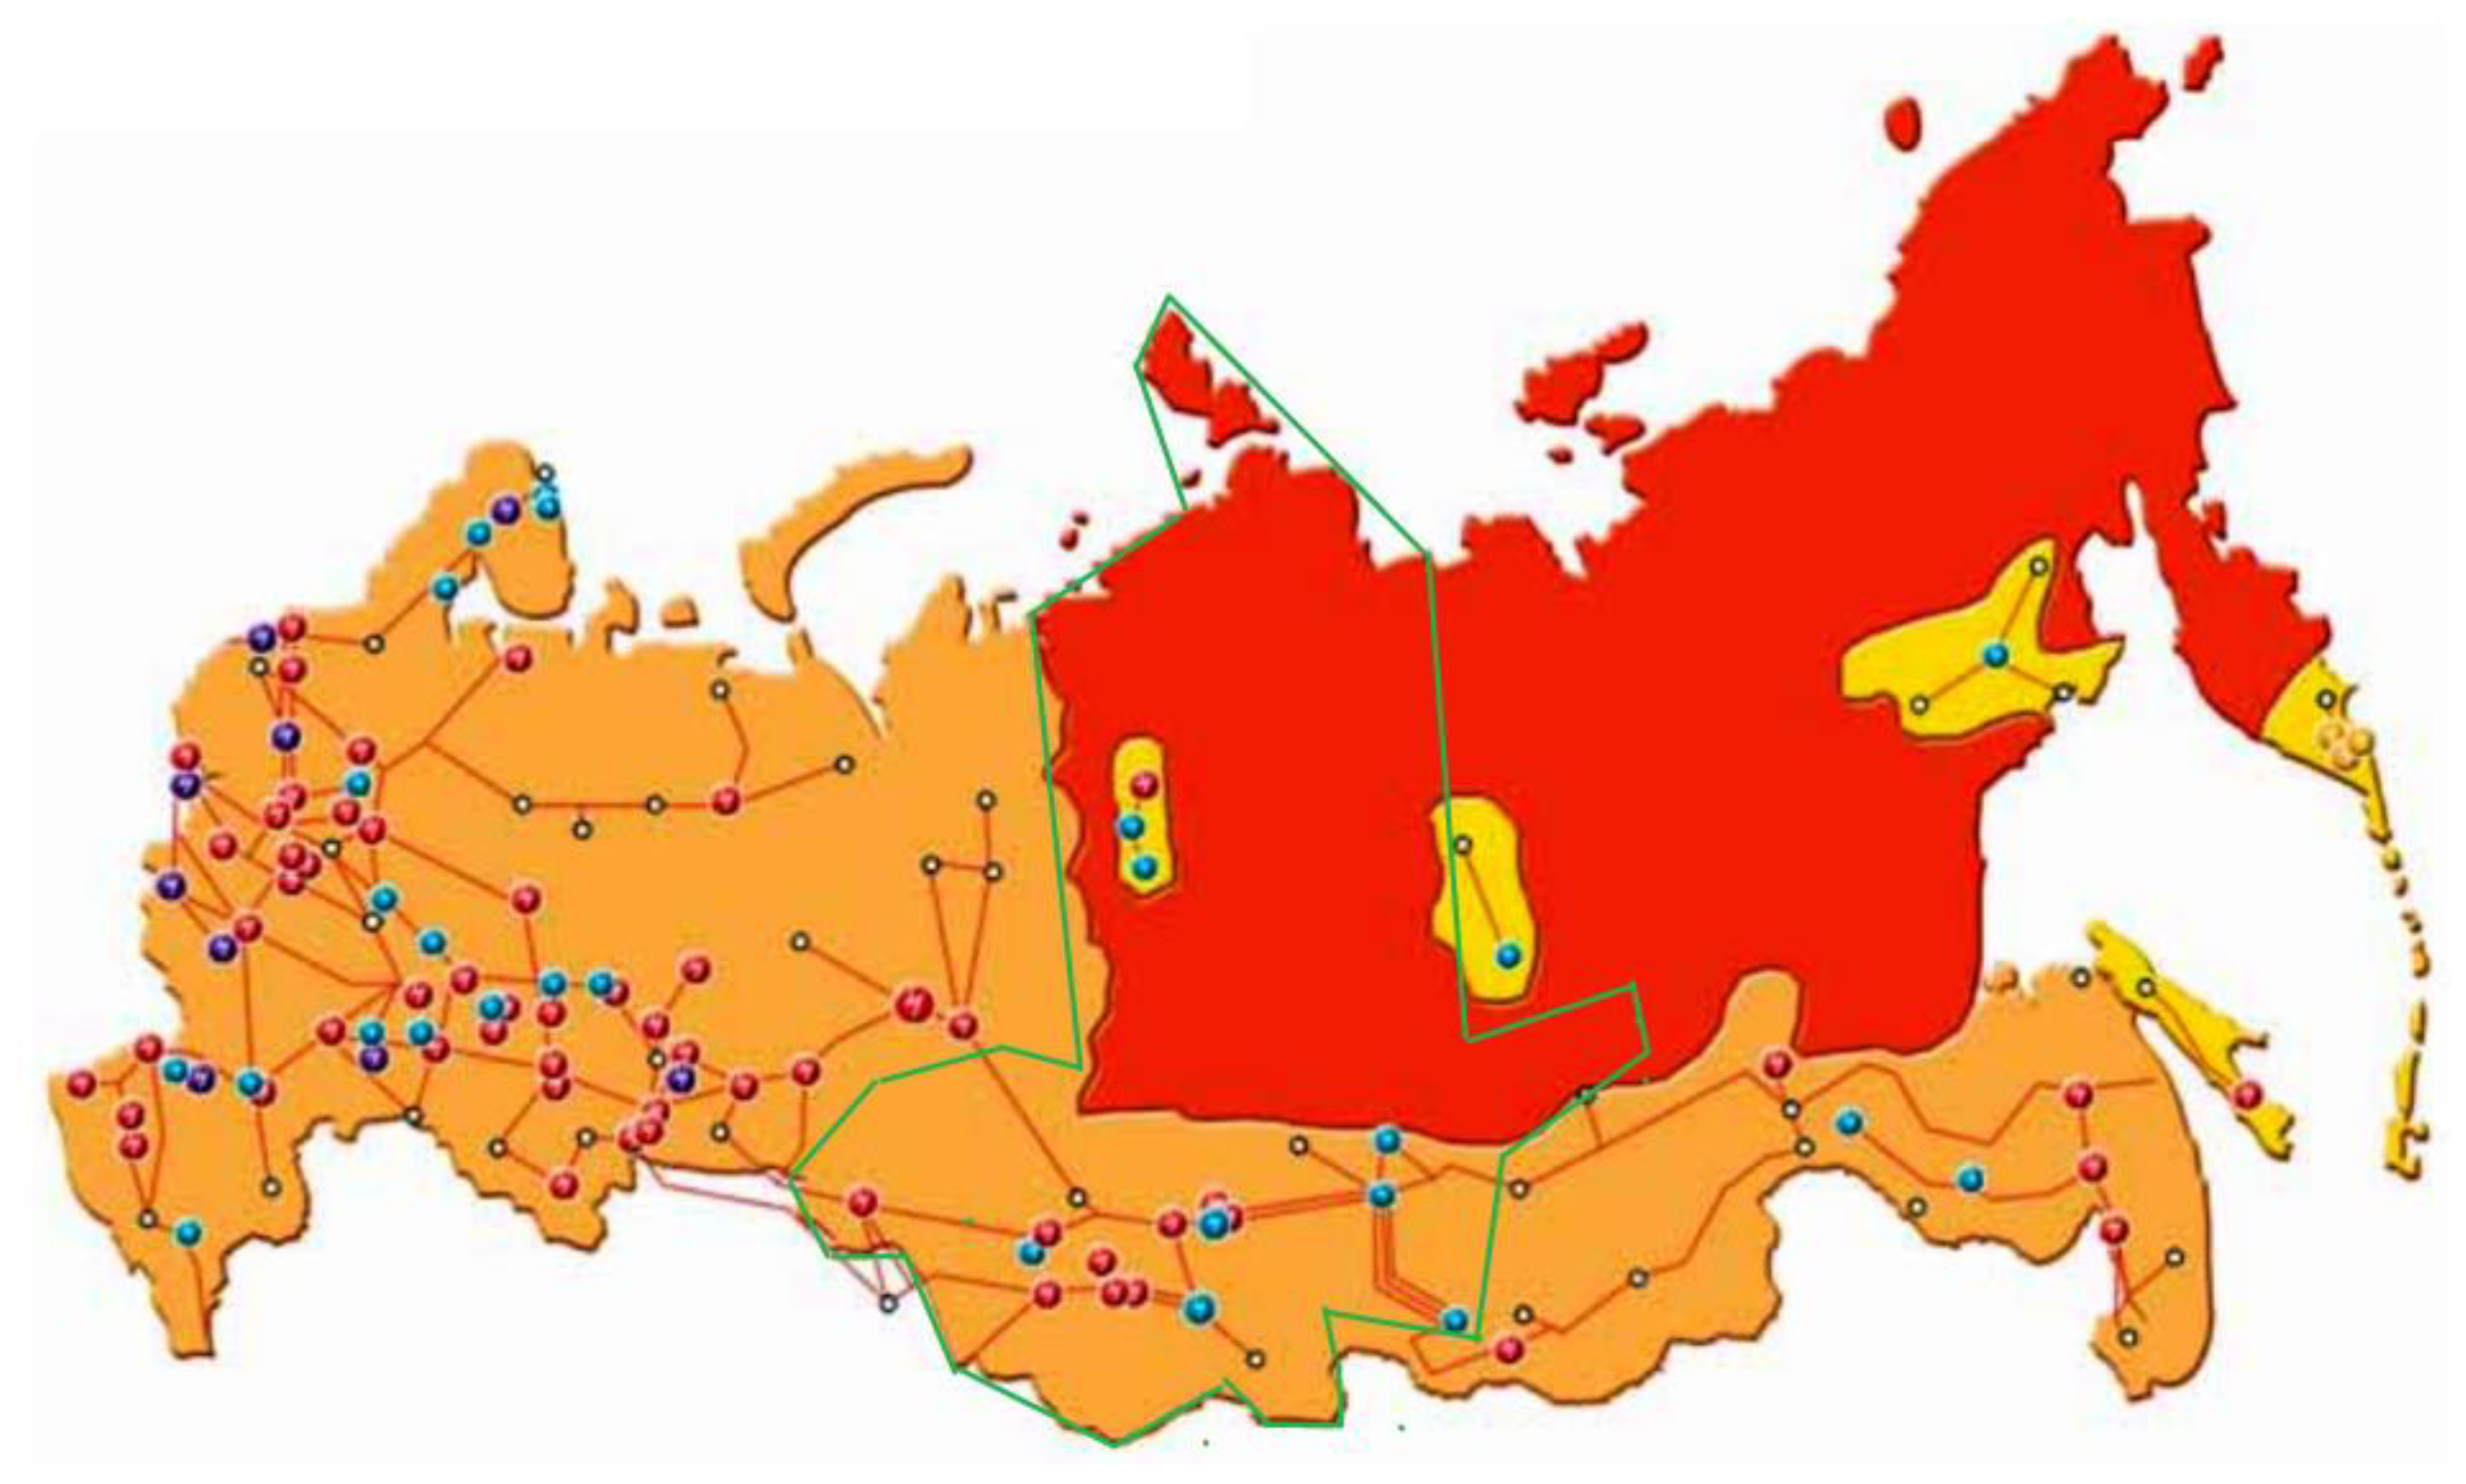
Ultimately, the development of main powerlines historically depends on population density, saturation with industrial (including mineral-mining) enterprises and infrastructure networks (primarily railways). The saturation of Russia with main powerlines is shown in Figure 11.
Figure 11 clearly shows the rarity of main powerlines in the Siberian Federal District, most of which are in the south of the macro-region (Kemerovo, Omsk, Novosibirsk Regions, the Republics of Altai and Khakassia, the south of the Krasnoyarsk Territory and the Tomsk Region). On the contrary, most of the Krasnoyarsk Territory, the Irkutsk Region, the North of Tomsk region and the Republic of Tyva are weakly saturated with main powerlines.
This reflects the population density in Siberia: in regions with a relatively high saturation with main powerlines, the population density is higher (persons per km2): Novosibirsk Region—15.6, Kemerovo Region—28.3, Omsk Region—14.2, Altai Territory—14.4, Republic of Khakassia—8.2.
On the contrary, in the regions with low saturation with main powerlines, the population density is extremely low: Irkutsk region—3.1 persons per km2, Republic of Altai—2.3, Republic of Tyva—1.9, Krasnoyarsk Territory—1.2 persons per km2.
Consequently, it is these regions of the Siberian Federal District where the development of renewable energy has the greatest prospects.

3.2.2. Renewable Energy Investment

Investments in renewable energy are certainly a positive factor in its development. The specificity of investing in Russia is that the main investors are Russian and foreign private companies and Russian state-owned corporations, mainly engaged in fuel and nuclear energy production, as well as mining. Investing in renewable energy for them is a form of energy portfolio diversification, as well as the development of industrial and housing infrastructure in hard-to-reach areas of their economic interests. The largest investors in renewable energy in Russia are the following [89,90]:
-
Wind Energy Development Fund, established in 2017 by RUSNANO JSC and Fortum PJSC. The renewable energy portfolio in 2021 amounted to 1.8 GW in 10 regions, including Siberia;
-
PJSC Fortum, which has been involved in the development of renewable energy since 2015, the founder is the Finnish energy concern Fortum (95% of the shares), the renewable energy portfolio is more than 2 GW, and is present in 12 regions, including Siberia;
-
JSC NovaWind, established in 2017 by the state-owned corporation ROSATOM, renewable energy portfolio: 2 GW, presence in the southern regions of Russia (not represented in Siberia);
-
PJSC Enel Russia, founded in 2004 by the Italian company Enel S.p.A. Renewable energy portfolio: 0.362 GW. Regions of presence: in the south and west of Russia (not represented in Siberia);
-
Hevel group of companies, established in 2009 by Renova Group of Companies (solar energy division). Renewable energy portfolio: more than 1.1 GW, 11 regions of presence, including Siberia;
-
PJSC RusHydro is a monopoly company in the hydropower market in Russia, with an installed capacity of 38 GW, of which 14 GW is in Siberia.
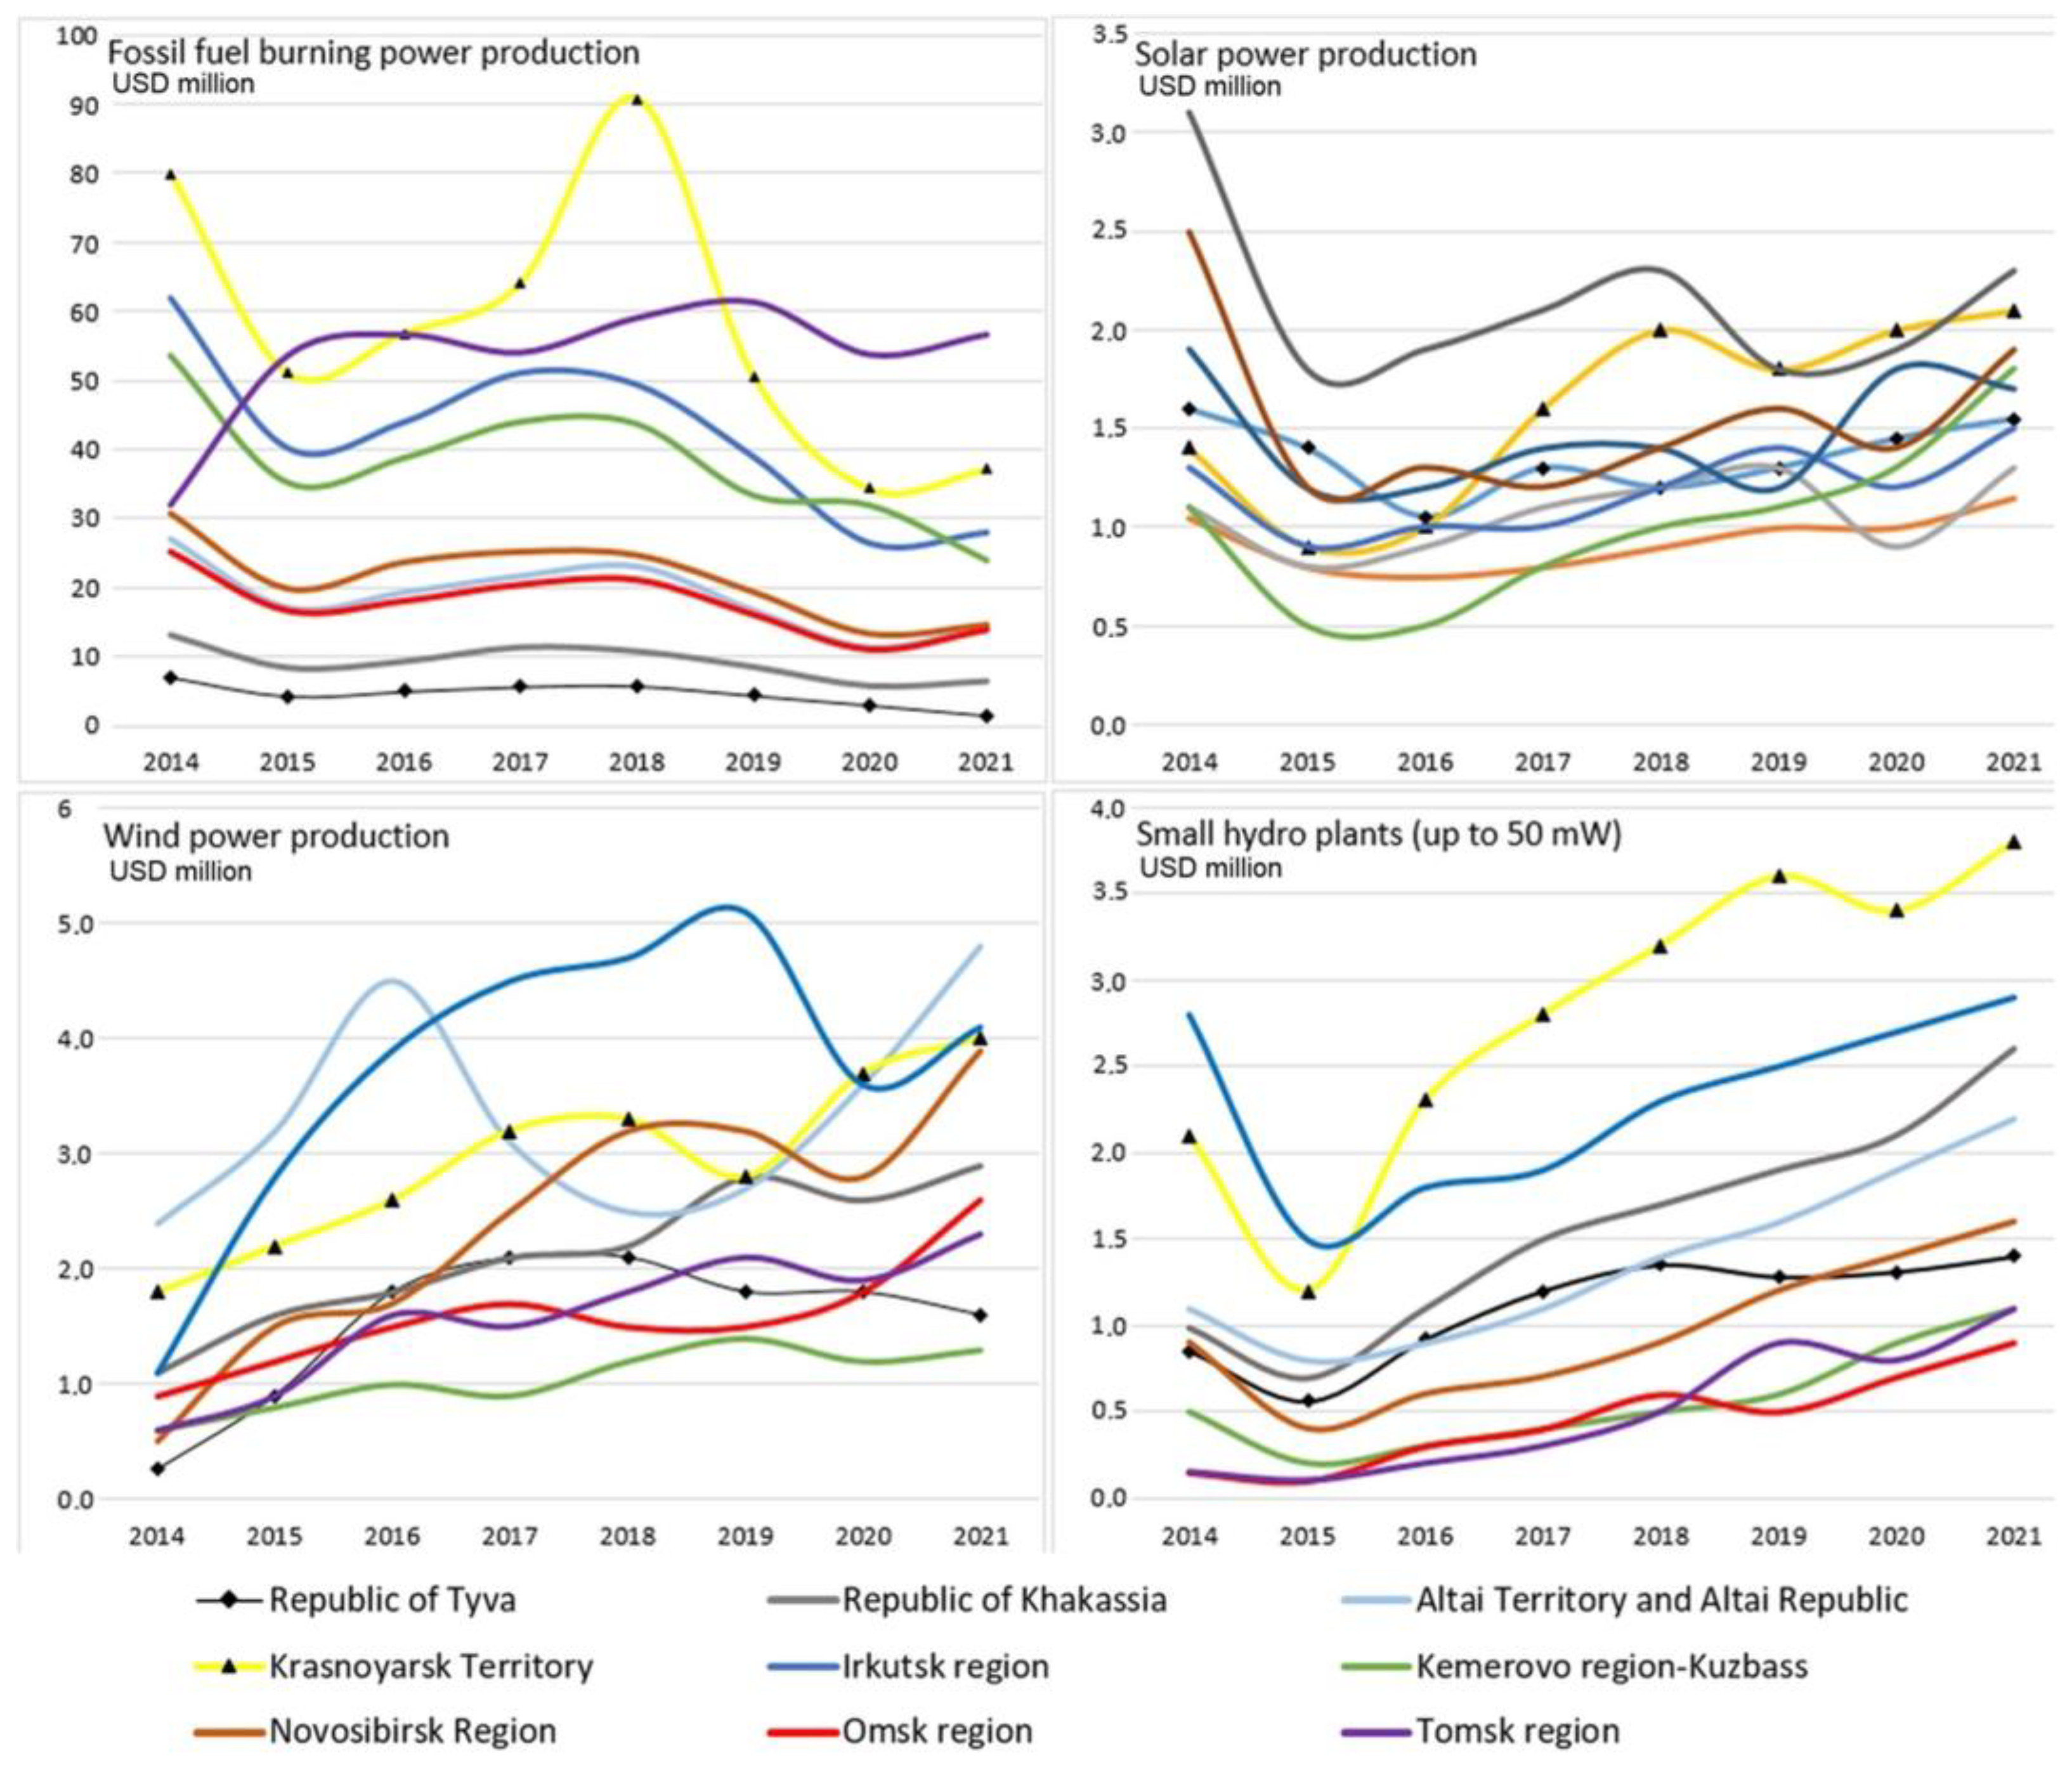
A comparison of investment in fuel and renewable energy in the Siberian Federal District is shown in Figure 12.
From the data presented in Figure 12, it follows that the volume of investment in fuel energy in Siberia exceeds renewable energy by a factor of 20–30, depending on the specific region. At the same time, it is impossible not to note the trend towards a decrease in such investments over the past decade in all regions of Siberia, which was two-fold on average. The exception was the Tomsk region—the center of natural gas production in Siberia as a non-renewable energy source.
The second trend is associated with the growth of investments in renewable energy in all regions of Siberia, especially in wind and small hydropower plants. The largest volumes of investment are in the Irkutsk Region, Altai Territory and the Republic of Altai, as well as the Republic of Khakassia.
This confirms our conclusion that in the macro-region, which, on the one hand, has highly concentrated clusters of basic industries, and on the other hand vast sparsely populated territories, renewable energy is developing mostly under the influence of a growing demand for electricity in the areas where there is an absence of main powerlines, rather than for reducing the negative impact on the environment.
An exception to both trends is the Krasnoyarsk Territory, the leader in attracting investments in fuel, wind, and solar energy. That is due to the unique combination of old large hydropower plants, large volumes of hard and brown coal mining, as well as the presence of vast territories not covered by main powerlines favorable for the development of autonomous wind and solar generation.

3.2.3. The Environmental Factor (Counteraction to Air Pollution by Fuel Energy Facilities)

The emission of pollutants into the atmosphere, including greenhouse gases, is a factor increasing public pressure on the authorities to intensify energy transition around the world. With a significant fuel energy capacity, Russia ranks fourth in the world in terms of greenhouse gas emissions (5%), of which up to 60% is from the combustion of fossil fuels at power plants [81]. In terms of greenhouse gas emissions per USD 1 million of electricity produced, Russia accounts for the highest value: 1600 tons of CO2-eq per USD 1 million of GDP.
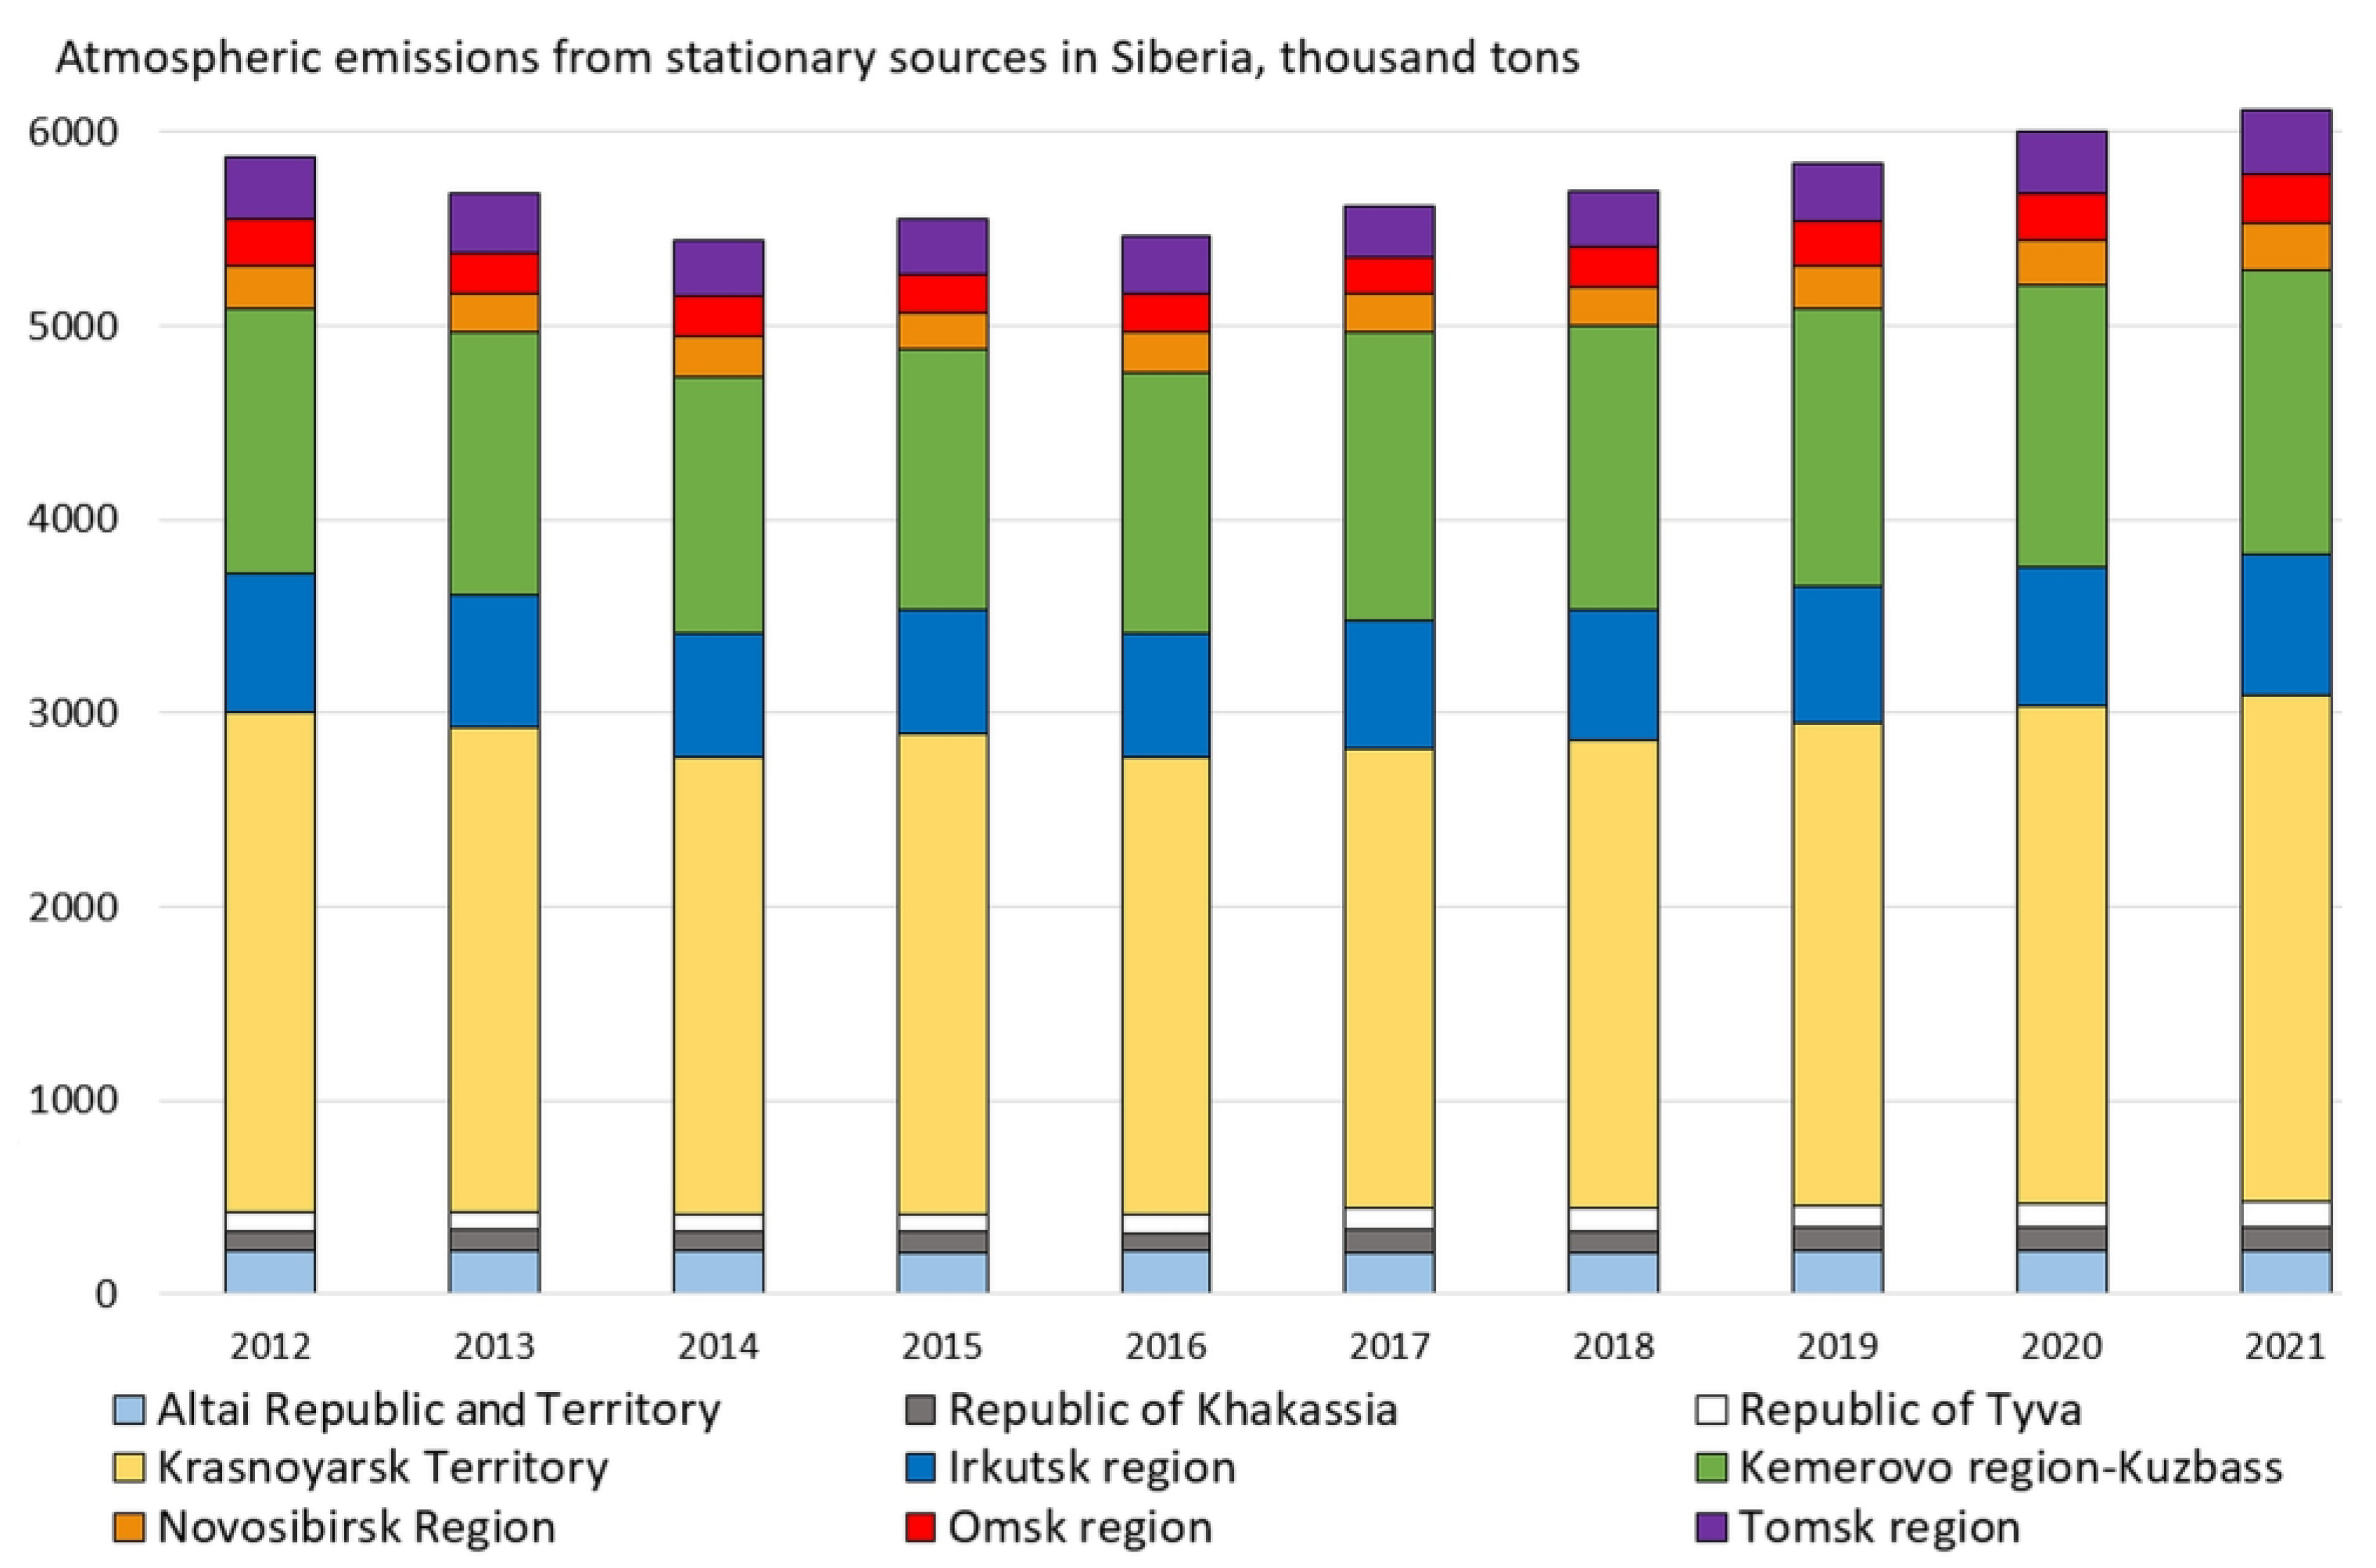
The Siberian Federal District, which produces 72% of Russian coal and 14% of natural gas, is a significant agent of global climate change. At the same time, the volume of emissions into the atmosphere from stationary sources, after a slight reduction in 2012–2016, has started to increase again (Figure 13).
As can be seen from the data in Figure 13, the total atmospheric emissions from stationary sources, reaching 6 million tons per year in the Siberian Federal District, are mainly associated with regions with developed coal-burning electricity generation, i.e., the Krasnoyarsk Territory and Kemerovo Region (two thirds of all emissions). Accordingly, in regions with a low share of fuel energy and a high share of renewable energy (Altai Territory and the Republic of Altai, the Republics of Khakassia and Tyva), emissions are minimal. Relatively low greenhouse gas emissions are observed in the Tomsk and Novosibirsk regions, where fuel energy is represented mainly by natural gas burning.

3.2.4. Morbidity of the Population Associated with Environmental Pollution by Fuel Energy Facilities

Reducing negative effects on the population and improving the quality of life and its extension through the development of renewable energy is the most important concern in the modern world. Significant volumes of emissions into the atmosphere from fuel energy facilities lead to an increase in the incidence of respiratory (including asthma) and oncological diseases.
The prevalence of asthma among residents in the Siberian Federal District clearly depends on the level of air pollution from fuel power plants, and the highest levels (per 100,000 inhabitants) were observed in Irkutsk (1830), Kemerovo (2015), and Krasnoyarsk Territory (2221) in 2018. Chronic respiratory diseases also occupy a high place among non-oncological pathologies in the Siberian Federal District, reaching 40% of the total number in 2018 (Table 6).
As follows from the data presented in Table 6, a significant increase in oncological and respiratory diseases was noted in all Siberian regions. At the same time, in the Altai Territory and the Altai Republic, where renewable energy is developing most rapidly, as well as in the Novosibirsk and Tomsk Regions with developed gas energy, the increase in the incidence is minimal. Abnormally high incidence rates in the Republics of Khakassia and Tuva are associated with an improvement in diagnostics quality in remote, sparsely populated areas.
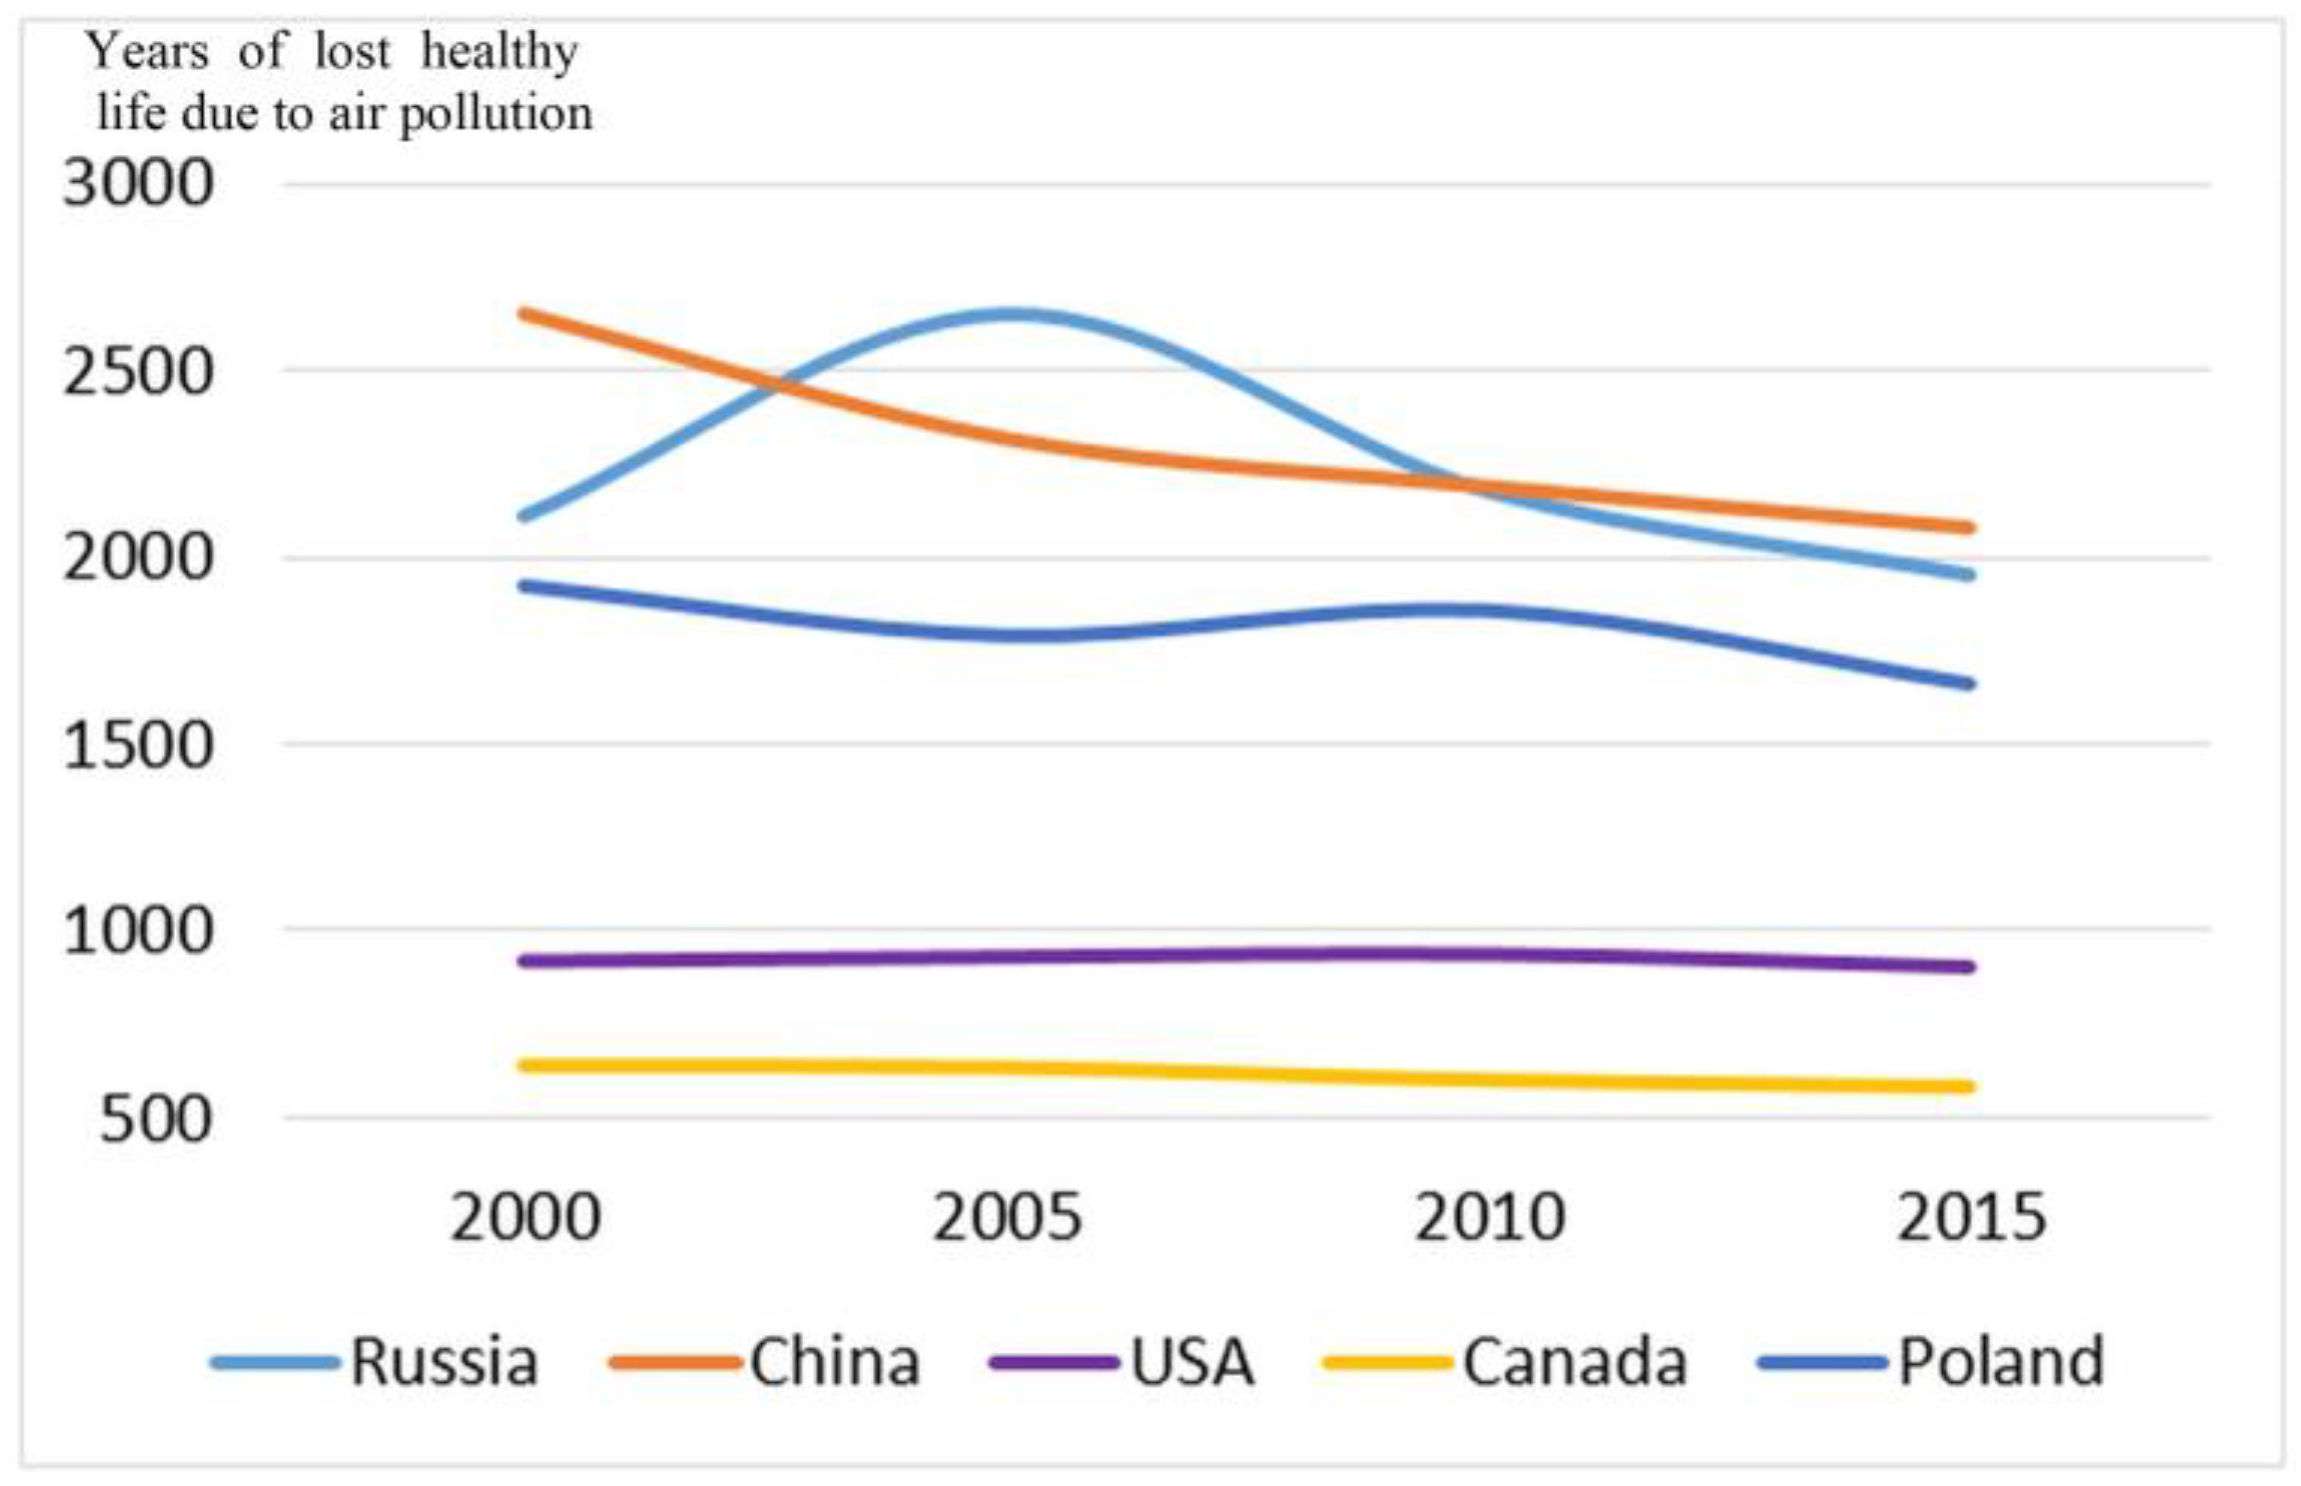
A confirmation of the urgent need to consider health factors in initiating the energy transition in the Siberian Federal District can be found in Russia having the highest numbers for years of healthy life lost due to diseases caused by air pollution (according to the Institute for Health Metrics and Evaluation for 2015)—Figure 14.
The data in Figure 14 testify that in countries actively implementing energy transition and investing in renewable energy (Canada, USA), the loss of healthy life years is 3–5 times lower than in countries with a high share of fuel energy (Russia, China, EU—Poland). At the same time, the implementation of European programs in the field of energy transition in Poland has led to a significant reduction in this indicator, as well as green investments in China. This clearly demonstrates the high positive impact of the development of renewable energy in ensuring the health and well-being of the nation.

3.2.5. Endowment with Fossil Fuels (Hard and Brown Coal, Natural Gas)

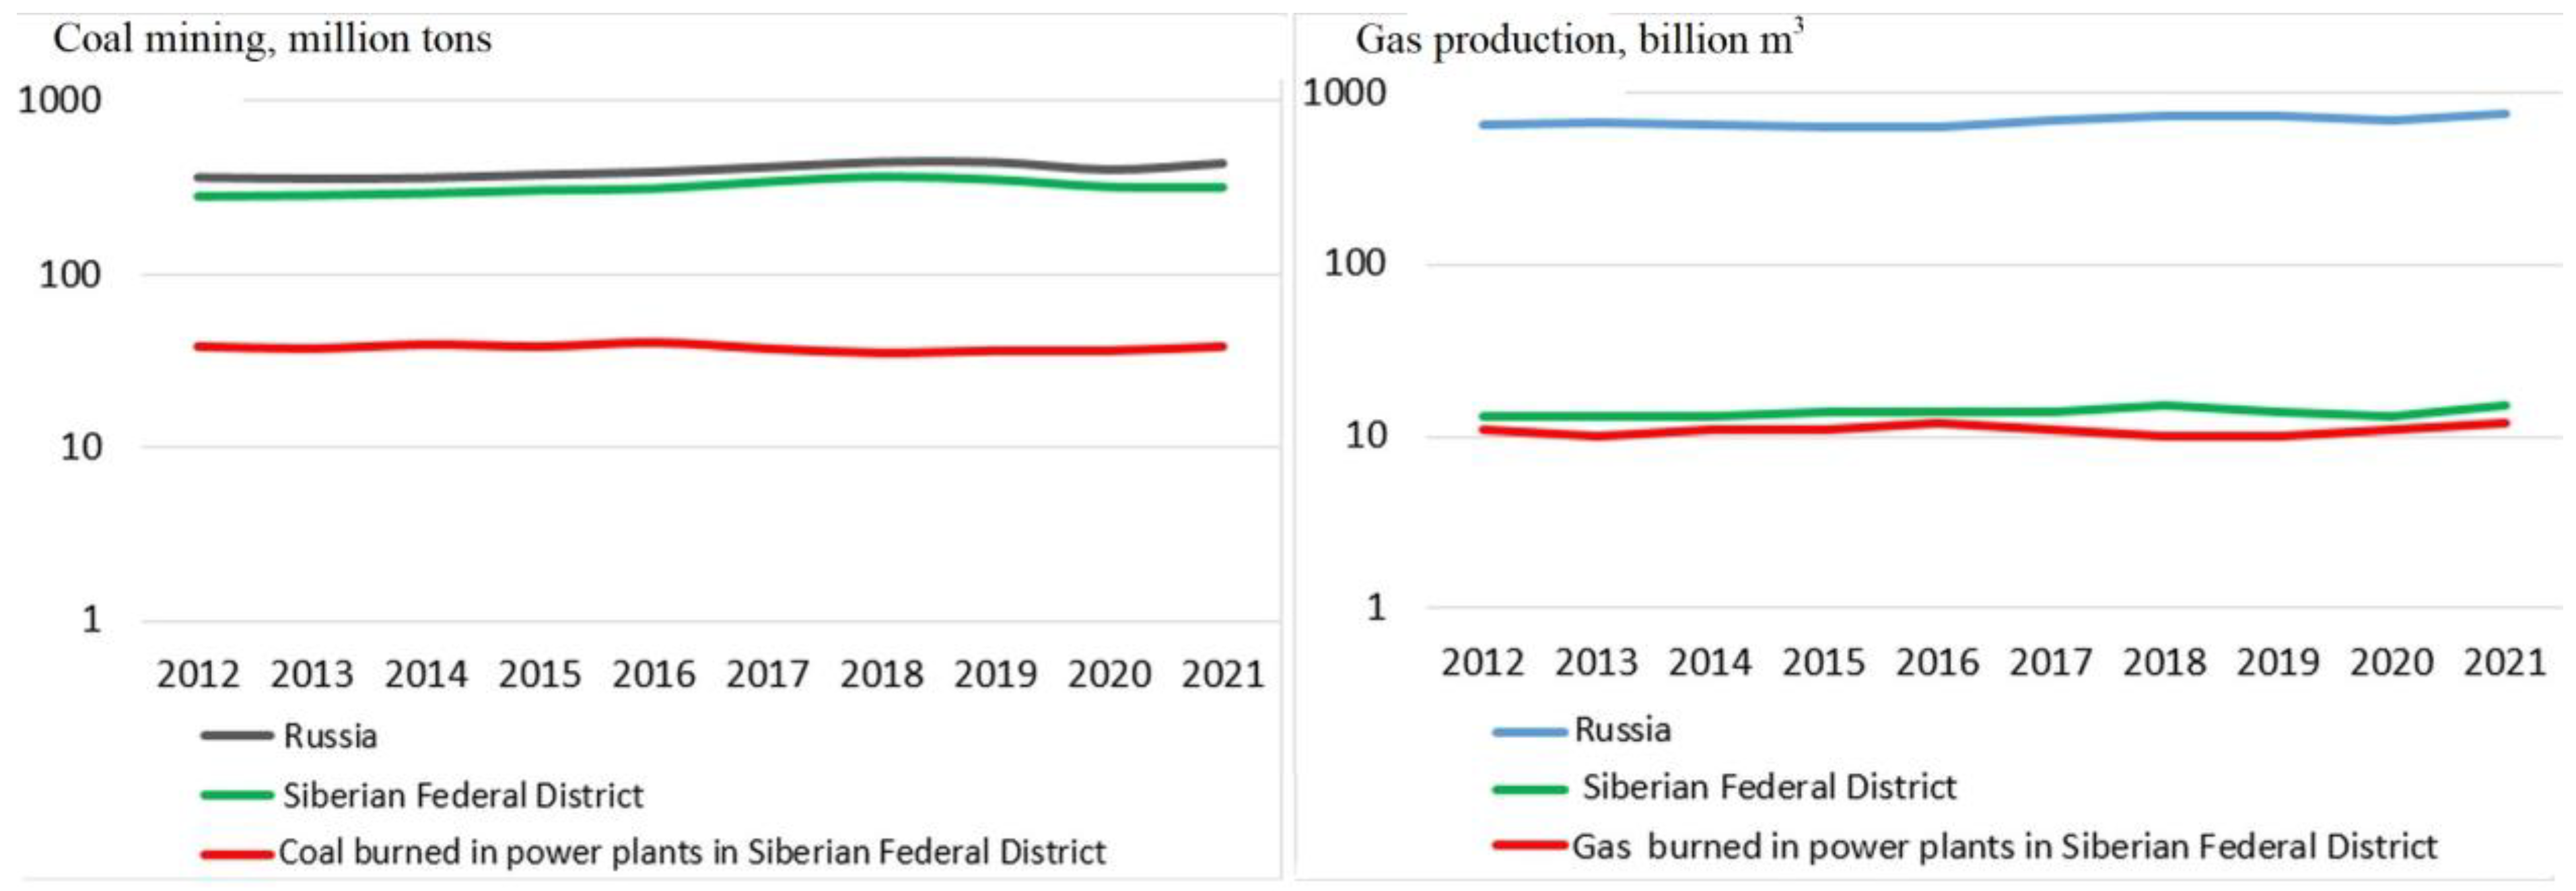
This factor plays a negative role in the transition to renewable energy, as it creates inertial conditions for the development of fuel energy in the form of high entry price barriers. The dominance of a number of Siberian regions (the Kemerovo Region-Kuzbass, Krasnoyarsk Territory, the Irkutsk Region) in the extraction of hard and brown coal in Russia, as well as a significant place occupied by the Tomsk Region in national gas production (Figure 15), create strong anti-incentives for the transition to renewable energy in the form of a high affordability of fuel energy production.
The data given in Figure 15 testify to the unprecedentedly high level of local energy resources in the Siberian Federal District. More than 70% of Russian coal is mined in Siberia, of which one eighth is burned at the power plants of the macro-region. More than 10% of Russian gas, which is almost all burned at the power plants of Siberia, is produced there. Considering this, it seems unrealistic to build a strategy for the transition to renewable energy by replacing fuel generation with it in the nearest future without systemic special incentives.

3.2.6. Demand for Energy from the Non-Industrial Sector (Tourism, Agriculture)

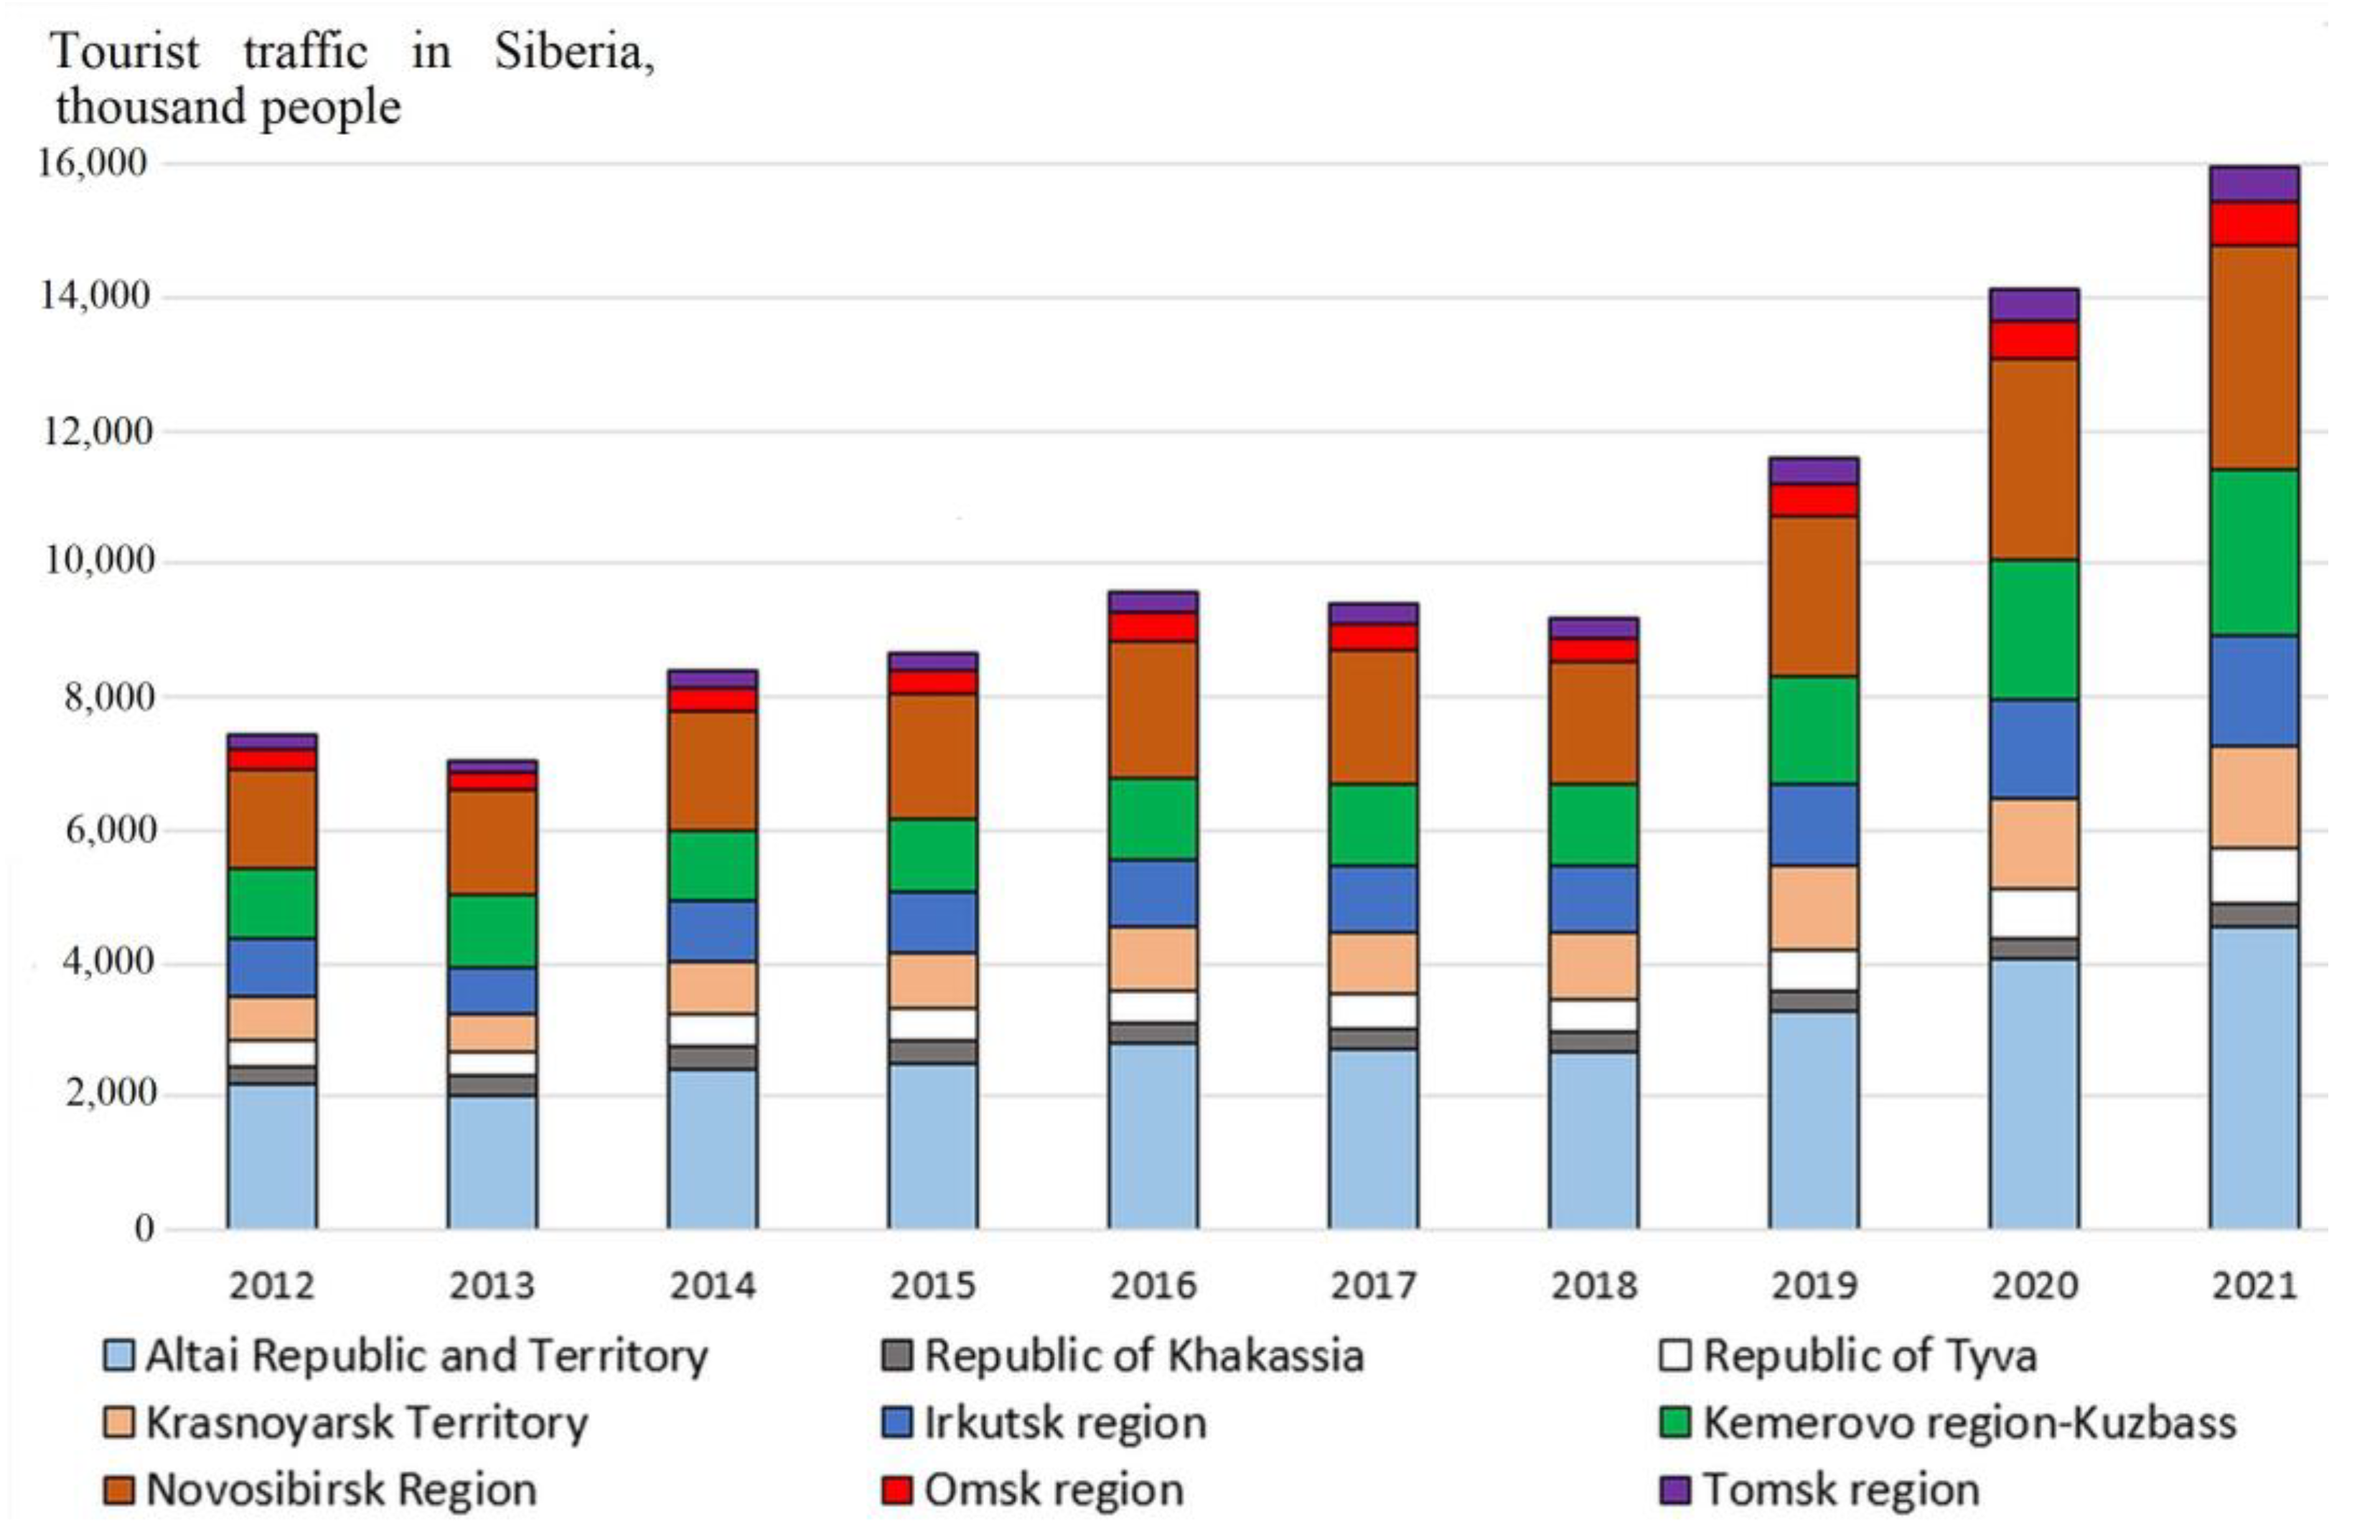
The sectors of economy with relatively low energy intensity (tourism, agriculture) are major consumers of renewable energy worldwide. The Siberian Federal District is an important center for attracting tourists in Russia (about a third of domestic tourist travel in the country), with a two-fold increase in the period 2012–2021 (Figure 16).
The factor of initiating the energy transition through the growth of domestic tourism is extremely important for Siberia, since, as follows from Figure 16, more than half of the traffic is in regions that are promising for the development of renewable energy—the Altai Territory and Gorny Altai, the Republic of Khakassia, and Tyva. These regions provided the main increase in tourist traffic in Siberia over the past decade. As well as the Novosibirsk region, which hosts the main transport hub of Siberia—the Transsib railway node and the international airport of Novosibirsk—and is the capital of the macro-region. The growth of traffic in the Irkutsk region is ensured by it being home to world-famous Lake Baikal, the largest freshwater lake in the world, with a unique ecosystem.
The development of tourism in Siberia (expected investments in 2023–2035 are up to USD 2.5 billion for 73 large projects), along with agriculture (75% increase in production over 2012–2021), is a key factor in expanding the capacity of renewable energy in the macro-region.

3.2.7. Forecasts and Challenges for Renewable Energy in Russia and Siberia

The development of renewable energy in the Siberian Federal District will take place within the framework set by the strategic documents of the leading countries of Eurasia (the European Union, China, India), and with a focus on their goals and forecasts, as a “gold standard”.
In particular, the strategic document of the European Union ”Renewable Energy Directive-2009” sets the target share of renewable energy in the European Union at the level of 20% by 2020; in fact, it was achieved by 2022 with a proportion of 22.1%. For 2030, the new Renewable Energy Directive-2018 sets the share of renewable energy at 32%, while Renewable Energy Directive II: Fit for 55 (2021) sets it at 40%, and REPowerEU Plan (2022) at 45% [101].
Under such conditions, the development of renewable energy in Siberia and Russia as a whole will be catching up, which, on the one hand, makes it possible to adopt best practices, and on the other hand, threatens fuel energy. The main challenges from the countries of Eurasia that compete with Russia in the energy market and are associated with the development of renewable energy are the following:
  • REPowerEU (the plan of the European Commission to phase out the consumption of Russian fossil fuels by 2030, with main actions in 2022–2023) aims at increasing the share of renewable energy by 45% by 2030 (under the package “Fit for 55”), as well as to reduce greenhouse gas emissions by 55% by 2030 compared to the levels of 1990 and to achieve zero emissions by 2050. The plan includes the provision of grants for 300 billion EUR [102].
  • Rooftop Solar (a pan-European initiative for the obligatory equipping of newly built residential and commercial buildings with solar panels) [103].
  • EU Solar Energy Strategy, aimed at an additional input of 600 GW of installed capacity of solar power plants in the European Union by 2030 (twice the level of 2021) [104].
  • Five-year energy technology development plan of the People Republic of China (a national initiative shifting the focus from fuel energy investment to renewable energy, with planned investments of more than USD 1 trillion) [105].
  • Pinnapuram IRESP (India’s national program to create a global hub for the accumulation and transportation of renewable energy with a capacity of more than 100 GW) [106].
For the Russian energy sector, the adoption of these international strategic documents means the reduction of revenue and the ability of Russian companies to invest in renewable energy (a “one-sided” energy transition by the EU).
In turn, in Russia, the main strategic document of the government in the field of renewable energy is the Energy Strategy of the Russian Federation for the period up to 2035, aimed at the entire fuel and power production sector [107]. In this document, the breakthrough projects that initiate the energy transition are insufficiently represented, despite its general goals being stated e.g., as: “Commissioning of new power generating capacity operating on the basis of renewable energy sources, subject to their economic efficiency. … As a result, by 2035 it is possible to increase the production of electricity by power plants based on renewable sources by more than 20 times (up to 29–46 billion kWh from 2.3 billion kWh in 2015)”.
In accordance with the Energy Strategy of the Russian Federation for the period up to 2035, the expected government support for renewable energy in the country may amount to USD 5 billion, USD 1 billion of which for Siberia.
However, according to Russian Greenpeace experts, a significant energy transition in Russia in the next decade is unlikely. Thus, the Energy Strategy-2035 states that by 2028 the launch of “green” power plants with a total capacity of 3.1 GW is planned (wind: 2.3 GW, solar: 0.7 GW). However, until the end of 2020, the annual commissioning of new capacities of thermal power plants (7.9 GW, including 6.3 GW on natural gas burning) is planned [4].
At the same time, it is important to take into account the technological restrictions and sanctions imposed on Russia since 2022, as well as the reduction in cooperation between large international companies in the energy sector. All these restrictions create significant obstacles to the development of renewable energy in the Siberian Federal District, and overcoming them requires a new energy transition strategy that takes into account the factors discussed above, specifically for the macro-region.

4. Discussion

The factor analysis conducted allows us to summarize results as follows. Firstly, the high concentration of main powerlines in the areas of developed fuel generation in the south of Siberia is a disincentive for the development of renewable energy, especially under conditions of a high availability of local fossil fuels. On the contrary, the low concentration of powerlines in the north of Siberia stimulates the development of distributed renewable energy. This is exacerbated by the presence of important renewable energy facilities in the macro-region—old Soviet high-capacity hydroelectric power plants, providing up to one fifth of all Siberian electricity generation. Secondly, for the Siberian Federal District, as for Russia as a whole, there are typically low volumes of investment in renewable energy, mainly due to the unbalanced interests and incentives of energy producers and consumers, factors related to the state and society, as well as the lack of necessary strategic documents. Thirdly, the environmental factor in the transition to renewable energy is strong in those areas where fuel energy is concentrated, which largely mutually weakens the previous factor. However, the increase in population morbidity, caused by large emissions into the atmosphere of fuel energy, is a strong social incentive for initiating the energy transition. Therefore, it is evident that the effect of the factors of the transition to renewable energy in Siberia is different compared to the EU countries, China, and India.
Dynamic analysis shows that the development of renewable energy in the Siberian Federal District is proceeding at an extremely high rate, typical of a “low start”, outstripping the all-Russian pace. The value of renewable energy for Russia and Siberia is emphasized by the ambitious targets in the National Energy Strategy-2035, but their achievement is constrained by the lack of detailed investments plans, as well as technological restrictions and sanctions.
In order to accelerate energy transition in Siberia, it is not necessary to develop the renewable energy industry everywhere in it, but in a clustered manner, which implies the following:
  • Stimulation of demand for renewable energy from distributed sources through the development of non-industrial businesses in the rural Siberian territories;
  • Parallel tightening of environmental requirements and incentives for energy companies to diversify energy packages in favor of renewable energy through taxes and subsidies. It is important to note that, in order to accelerate the introduction of new renewable energy capacity in Siberia (with a target of 15% by 2035, excluding existing large hydroelectric power plants), it is necessary to quadruple the speed of this process and at least triple investment;
  • Development of electrical powerlines in sparsely populated regions specifically for the transportation of energy from renewable sources, the creation of a wholesale market in the Siberian Federal District to radically reduce costs;
  • Revision of the Russian Energy Strategy-2015 in terms of organizational and financial support for the development of renewable energy in Siberia. To this end, it would be expedient to create a Siberian energy strategy linking federal and regional investments with private ones.
Limitations inherent in this study include the following. First, there was a fragmentation of data on investments in distributed renewable generation projects in Siberia, as well as on electricity generation. Additionally, the systematic progress in the implementation of renewable energy development projects in Russia was disrupted by the exogenous factor of technological sanctions and the curtailment of cooperation with international leaders in the field of green energy in 2022. In addition, we did not take into account the decommissioning of old and the modernization of existing fuel power plants in Siberia due to the non-systematic nature of the available data. This makes it difficult to predict the development of renewable energy in the Siberian Federal District in the long term (7–10 years).

5. Conclusions

The case of renewable energy development in the Siberian Federal District (Siberia), part of the Russian Federation, shows that this process is driven by such factors as energy supply for non-industrial activity (tourism, agriculture), preservation of public health and diversification of the energy portfolios of fuel energy producers. At the same time, a significant part of the electricity (up to 20%) in Siberia is generated at old large hydroelectric power plants built during the Soviet period and can be conventionally considered renewable. Therefore, the environmental market drivers of the energy transition, which are dominant in the EU and China (renewable energy leaders), are not of primary relevance in Siberia. Along with this, a specific factor for Siberia is the insufficient interest of the authorities in the implementation of international projects to reduce greenhouse emissions and solve environmental problems in the energy sector; however, energy companies are interested in expanding the share of renewable capacities.
The effect of these energy transition factors in Siberia means that the development of renewable energy should be guided not by stimulating its supply, but by increasing demand from businesses in the tourist and agricultural zones of Siberia, as well as the gradual infiltration of new energy technologies. This requires the implementation of such actions as synchronizing the tightening of environmental requirements for fuel energy and stimulating investment in renewable energy, thereby developing the Siberian market for electrical grids in sparsely populated regions through renewable energy growth points, revising existing energy strategies and saturating them with energy transition projects in Siberia. The ultimate benchmark here is to achieve new renewable power generation in the Siberian Federal District with a share of 15%, which, together with the existing share of old hydroelectric power plants with a total capacity of up to 20%, will allow reaching the world level of energy supply from renewable sources.
Further research in the field of renewable energy development in macro-regions that combine mineral resource clusters and rural areas in a way similar to Siberia may affect the acceleration of the global energy transition.

Author Contributions

Conceptualization, methodology, supervision, S.Z.; data curation, F.A.-A.; formal analysis, investigation, writing—review and editing, E.D. All authors have read and agreed to the published version of the manuscript.

Funding

This research received no external funding.

Institutional Review Board Statement

The study was conducted according to the guidelines of the Declaration.

Informed Consent Statement

Not applicable.

Data Availability Statement

Not applicable.

Conflicts of Interest

The authors declare no conflict of interest.

References

  1. International Renewable Energy Agency (IRENA) Renewable Capacity Statistics 2022. Power Generation. Available online: https://energystats.enerdata.net/electricity/world-electricity-production-statistics.html (accessed on 21 March 2023).
  2. International Energy Agency. Renewables 2022. In Analysis and Forecast to 2027; IEA Publications: Paris, France, 2022; p. 159. Available online: https://iea.blob.core.windows.net/assets/ada7af90-e280-46c4-a577-df2e4fb44254/Renewables2022.pdf (accessed on 21 March 2023).
  3. World Population Review. Renewable Energy by Country 2023. Available online: https://worldpopulationreview.com/country-rankings/renewable-energy-by-country (accessed on 21 March 2023).
  4. Asikritov, V. The Use of Fossil Fuels Needs to be Reduced, and the Transition to Low-Carbon Energy is the “New Reality”. Greenpeace. 22.02.2023. Available online: https://greenpeace.ru/expert-opinions/2023/02/22/kak-budet-razvivatsja-vozobnovljaemaja-jenergetika-rossii-v-blizhajshie-gody/ (accessed on 21 March 2023).
  5. Tsimisaraka, R.S.M.; Xiang, L.; Andrianarivo, A.R.N.A.; Josoa, E.Z.; Khan, N.; Hanif, M.S.; Khurshid, A.; Limongi, R. Impact of Financial Inclusion, Globalization, Renewable Energy, ICT, and Economic Growth on CO2 Emission in OBOR Countries. Sustainability 2023, 15, 6534. [Google Scholar] [CrossRef]
  6. Amuda, Y.J.; Hassan, S.; Subramaniam, U. Comparative Review of Energy, Crude Oil, and Natural Gas for Exchange Markets in Nigeria, India and Bangladesh. Energies 2023, 16, 3151. [Google Scholar] [CrossRef]
  7. Borowski, P.F. Mitigating Climate Change and the Development of Green Energy versus a Return to Fossil Fuels Due to the Energy Crisis in 2022. Energies 2022, 15, 9289. [Google Scholar] [CrossRef]
  8. Wang, P.; Wang, M.; Zhou, M.; He, J.; Feng, X.; Du, X.; Wang, Y.; Wang, Y. The Benefits of the Clean Heating Plan on Air Quality in the Beijing–Tianjin–Hebei Region. Atmosphere 2022, 13, 555. [Google Scholar] [CrossRef]
  9. Barceló, E.; Dimić-Mišić, K.; Imani, M.; Spasojević Brkić, V.; Hummel, M.; Gane, P. Regulatory Paradigm and Challenge for Blockchain Integration of Decentralized Systems: Example—Renewable Energy Grids. Sustainability 2023, 15, 2571. [Google Scholar] [CrossRef]
  10. Rabbi, M.F.; Popp, J.; Máté, D.; Kovács, S. Energy Security and Energy Transition to Achieve Carbon Neutrality. Energies 2022, 15, 8126. [Google Scholar] [CrossRef]
  11. Halser, C.; Paraschiv, F. Pathways to Overcoming Natural Gas Dependency on Russia—The German Case. Energies 2022, 15, 4939. [Google Scholar] [CrossRef]
  12. Nevzorova, T.; Kutcherov, V. The Role of Advocacy Coalitions in Shaping the Technological Innovation Systems: The Case of the Russian Renewable Energy Policy. Energies 2021, 14, 6941. [Google Scholar] [CrossRef]
  13. Magasheva, I.S.; Lomakina, O.B. Competitiveness of the Renewable Energy Sector in Russia and Prospects for a New Government Support Program Until 2035. In Current Problems of the Global Environmental Economy Under the Conditions of Climate Change and the Perspectives of Sustainable Development. Advances in Global Change Research; Popkova, E.G., Sergi, B.S., Eds.; Springer: Cham, Switzerland, 2023; Volume 73, pp. 281–288. [Google Scholar] [CrossRef]
  14. Wang, C.-N.; Tibo, H.; Duong, D.H. Renewable Energy Utilization Analysis of Highly and Newly Industrialized Countries Using an Undesirable Output Model. Energies 2020, 13, 2629. [Google Scholar] [CrossRef]
  15. Salimi, M.; Amidpour, M. The Impact of Energy Transition on the Geopolitical Importance of Oil-Exporting Countries. World 2022, 3, 607–618. [Google Scholar] [CrossRef]
  16. Bartela, Ł.; Gładysz, P.; Ochmann, J.; Qvist, S.; Sancho, L.M. Repowering a Coal Power Unit with Small Modular Reactors and Thermal Energy Storage. Energies 2022, 15, 5830. [Google Scholar] [CrossRef]
  17. Chebotareva, G.; Tvaronavičienė, M.; Gorina, L.; Strielkowski, W.; Shiryaeva, J.; Petrenko, Y. Revealing Renewable Energy Perspectives via the Analysis of the Wholesale Electricity Market. Energies 2022, 15, 838. [Google Scholar] [CrossRef]
  18. Lanko, A.; de la Flor, F.J.S.; Uvarova, S.; Solovyeva, E. Analysis of Current Situation with Renewable Energy in Russia. In Networked Control Systems for Connected and Automated Vehicles. NN 2022. Lecture Notes in Networks and Systems; Guda, A., Ed.; Springer: Cham, Switzerland, 2023; Volume 509, pp. 1695–1703. [Google Scholar] [CrossRef]
  19. Xu, X.; Wang, Y.; Ruan, Y.; Wang, J.; Ge, K.; Zhang, Y.; Jin, H. Integrated Energy Planning for Near-Zero Carbon Emission Demonstration District in Urban Areas: A Case Study of Meishan District in Ningbo, China. Energies 2022, 15, 874. [Google Scholar] [CrossRef]
  20. Vukovic, N.A.; Nekhorosheva, D.E. Renewable Energy in Smart Cities: Challenges and Opportunities by the Case Study of Russia. Smart Cities 2022, 5, 1208–1228. [Google Scholar] [CrossRef]
  21. Vukovic, N.; Koriugina, U.; Illarionova, D.; Pankratova, D.; Kiseleva, P.; Gontareva, A. Towards Smart Green Cities: Analysis of Integrated Renewable Energy Use in Smart Cities. Strateg. Plan. Energy Environ. 2023, 40, 75–94. [Google Scholar] [CrossRef]
  22. Bedi, P.; Goyal, S.B.; Rajawat, A.S.; Shaw, R.N.; Ghosh, A. Application of AI/IoT for Smart Renewable Energy Management in Smart Cities; Piuri, V., Shaw, R.N., Ghosh, A., Islam, R., Eds.; AI and IoT for Smart City Applications. Studies in Computational Intelligence; Springer: Singapore, 2002; Volume 1002, pp. 115–138. [Google Scholar] [CrossRef]
  23. Calzada, I. Democratising Smart Cities? Penta-Helix Multistakeholder Social Innovation Framework. Smart Cities 2020, 3, 1145–1172. [Google Scholar] [CrossRef]
  24. Ahlmeyer, F.; Volgmann, K. What Can We Expect for the Development of Rural Areas in Europe?–Trends of the Last Decade and Their Opportunities for Rural Regeneration. Sustainability 2023, 15, 5485. [Google Scholar] [CrossRef]
  25. Lisova, T.; Sharapova, S.; Bredikhina, V.; Leiba, L. Sustainable Development of Rural Areas in the Conditions of Globalization. J. Environ. Manag. Tour. 2023, 14, 217. [Google Scholar] [CrossRef]
  26. Shanxiang, W.; Wen, J.; Hummera, S. The impact of renewable energy transition, green growth, green trade and green innovation on environmental quality: Evidence from top 10 green future countries. Front. Environ. Sci. 2023, 10, 1076859. [Google Scholar] [CrossRef]
  27. Hafeez, M.; Rehman, S.U.; Faisal, C.M.N.; Yang, J.; Ullah, S.; Kaium, M.A.; Malik, M.Y. Financial Efficiency and Its Impact on Renewable Energy Demand and CO2 Emissions: Do Eco-Innovations Matter for Highly Polluted Asian Economies? Sustainability 2022, 14, 10950. [Google Scholar] [CrossRef]
  28. Zhou, S.; Rashid, M.H.U.; Mohd, Z.S.A.; Sobhani, F.A.; Siddik, A.B. Does ESG Impact Firms’ Sustainability Performance? The Mediating Effect of Innovation Performance. Sustainability 2023, 15, 5586. [Google Scholar] [CrossRef]
  29. Helfaya, A.; Morris, R.; Aboud, A. Investigating the Factors That Determine the ESG Disclosure Practices in Europe. Sustainability 2023, 15, 5508. [Google Scholar] [CrossRef]
  30. Bildirici, M.; Kayıkçı, F. Industry 4.0 and Renewable Energy Nexus. Res. Sq. 2022, Preprint. [Google Scholar] [CrossRef]
  31. Pakulska, T.; Poniatowska-Jaksch, M. Digitalization in the Renewable Energy Sector—New Market Players. Energies 2022, 15, 4714. [Google Scholar] [CrossRef]
  32. Chukwudi, E.; Emmanuel, A.; Agbaraji, C.; Udeani, H.U. Renewable Energy as a Cost Effective and Sustainable Power Source for Industry 4.0. In Proceedings of the National Conference on Biotechnological Research; University of Nigeria: Nsukka, Nigeria, 2022; pp. 1–9. [Google Scholar]
  33. Ukoba, K.; Kunene, T.J.; Harmse, P.; Lukong, V.T.; Chien Jen, T. The Role of Renewable Energy Sources and Industry 4.0 Focus for Africa: A Review. Appl. Sci. 2023, 13, 1074. [Google Scholar] [CrossRef]
  34. Liu, R.; Solangi, Y.A. An Analysis of Renewable Energy Sources for Developing a Sustainable and Low-Carbon Hydrogen Economy in China. Processes 2023, 11, 1225. [Google Scholar] [CrossRef]
  35. Xuan Phuong, N.; Ngoc Dung, L.; Van Viet, P.; Thanh Tung, H.; Van Huong, D.; Anh Tuan, H. Mission, challenges, and prospects of renewable energy development in Vietnam. In Energy Sources, Part A: Recovery, Utilization, and Environmental Effects; Taylor & Francis: London, UK, 2021; pp. 1–13. [Google Scholar] [CrossRef]
  36. Bastos, A.S.; Souza, T.R.C.d.; Ribeiro, D.S.; Melo, M.d.L.N.M.; Martinez, C.B. Wave Energy Generation in Brazil: A Georeferenced Oscillating Water Column Inventory. Energies 2023, 16, 3409. [Google Scholar] [CrossRef]
  37. Shadman, M.; Roldan-Carvajal, M.; Pierart, F.G.; Haim, P.A.; Alonso, R.; Silva, C.; Osorio, A.F.; Almonacid, N.; Carreras, G.; Maali Amiri, M.; et al. A Review of Offshore Renewable Energy in South America: Current Status and Future Perspectives. Sustainability 2023, 15, 1740. [Google Scholar] [CrossRef]
  38. European Committee. Fossil CO2 Emissions by Country. Report 2022. Available online: https://edgar.jrc.ec.europa.eu/report_2022?vis=pop#emissions_table (accessed on 21 March 2023).
  39. Mehmood, U.; Agyekum, E.B.; Tariq, S.; Ul Haq, Z.; Uhunamure, S.E.; Edokpayi, J.N.; Azhar, A. Socio-Economic Drivers of Renewable Energy: Empirical Evidence from BRICS. Int. J. Environ. Res. Public Health 2022, 19, 4614. [Google Scholar] [CrossRef]
  40. Qin, Z.; Ozturk, I. Renewable and Non-Renewable Energy Consumption in BRICS: Assessing the Dynamic Linkage between Foreign Capital Inflows and Energy Consumption. Energies 2021, 14, 2974. [Google Scholar] [CrossRef]
  41. Proskuryakova, L.; Ermolenko, G. Decarbonization Prospects in the Commonwealth of Independent States. Energies 2022, 15, 1987. [Google Scholar] [CrossRef]
  42. Marchenko, O.; Solomin, S.; Shamanskiy, V.; Donskoy, I. Evaluation of the Effectiveness of Joint Use of Wood and Other Renewable Energy Sources in the Baikal Region. Appl. Sci. 2022, 12, 1254. [Google Scholar] [CrossRef]
  43. Gavrikova, E.; Burda, Y.; Gavrikov, V.; Sharafutdinov, R.; Volkova, I.; Rubleva, M.; Polosukhina, D. Clean Energy Sources: Insights from Russia. Resources 2019, 8, 84. [Google Scholar] [CrossRef]
  44. Tishkov, S.; Tleppayev, A.; Karginova-Gubinova, V.; Volkov, A.; Shcherbak, A. Citizens’ Behavior as a Driver of Energy Transition and Greening of the Economy in the Russian Arctic: Findings of a Sociological Survey in the Murmansk Region and Karelia. Appl. Sci. 2022, 12, 1460. [Google Scholar] [CrossRef]
  45. Karaeva, A.; Magaril, E.; Torretta, V.; Viotti, P.; Rada, E.C. Public Attitude towards Nuclear and Renewable Energy as a Factor of Their Development in a Circular Economy Frame: Two Case Studies. Sustainability 2022, 14, 1283. [Google Scholar] [CrossRef]
  46. Yandle, B.; Bhattarai, M.; Vijayaraghavan, M. Environmental Kuznets Curves: A Review of Findings, Methods, and Policy Implications. PERC Res. Study 2004, 2, 1–39. [Google Scholar]
  47. Leitão, N.C.; Balsalobre-Lorente, D.; Cantos-Cantos, J.M. The Impact of Renewable Energy and Economic Complexity on Carbon Emissions in BRICS Countries under the EKC Scheme. Energies 2021, 14, 4908. [Google Scholar] [CrossRef]
  48. Huber, M.; Rusek, A.; Menshakova, M.; Zhigunova, G.; Chmiel, S.; Iakovleva, O. Possibilities of Sustainable Development including Improvement in Air Quality for the City of Murmansk-Examples of Best Practice from Scandinavia. Climate 2022, 10, 15. [Google Scholar] [CrossRef]
  49. Potashnikov, V.; Golub, A.; Brody, M.; Lugovoy, O. Decarbonizing Russia: Leapfrogging from Fossil Fuel to Hydrogen. Energies 2022, 15, 683. [Google Scholar] [CrossRef]
  50. Eyl-Mazzega, M.A.; Mathieu, C. The European Union and the Energy Transition. Lect. Notes Energy 2020, 73, 27–46. [Google Scholar] [CrossRef]
  51. Zhavoronok, A.V. Structural cycles and technological transitions in the modern economy. Econ. Innov. Manag. 2021, 3, 57–66. [Google Scholar] [CrossRef]
  52. Karacan, R.; Mukhtarov, S.; Barış, İ.; İşleyen, A.; Yardımcı, M.E. The Impact of Oil Price on Transition toward Renewable Energy Consumption? Evidence from Russia. Energies 2021, 14, 2947. [Google Scholar] [CrossRef]
  53. Watt-Logic. Addressing the High Real Cost of Renewable Generation; Watt-Logic: London, UK, 2022; Available online: https://watt-logic.com/2022/04/11/cost-of-renewables/ (accessed on 21 March 2023).
  54. International Renewable Energy Agency. Global Landscape of Renewable Energy Finance 2023; International Renewable Energy Agency: Abu Dhabi, United Arab Emirates, 2023; p. 132. [Google Scholar]
  55. Ram, M.; Child, M.; Aghahosseini, A.; Breyer, B. A comparative analysis of electricity generation costs from renewable, fossil fuel and nuclear sources in G20 countries for the period 2015–2030. J. Clean. Prod. 2018, 199, 687–704. [Google Scholar] [CrossRef]
  56. Lim, M.; Barnes, F. Energy storage sizing and placement on an islanded grid with high penetration of wind. In Proceedings of the Electrical Energy Storage Applications and Technologies (EESAT) Conference, San Diego, CA, USA, 21–23 October 2013; pp. 1–6. Available online: https://www.sandia.gov/ess-ssl/EESAT/2013_papers/Energy_Storage_Sizing_and_Placement_on_an_Islanded_Grid_with_High_Penetration_of_Wind.pdf (accessed on 21 March 2023).
  57. Chowdhury, N.; Pilo, F.; Pisano, G. Optimal Energy Storage System Positioning and Sizing with Robust Optimization. Energies 2020, 13, 512. [Google Scholar] [CrossRef]
  58. International Renewable Energy Agency. Electricity Storage and Renewables: Costs and Markets to 2030; International Renewable Energy Agency: Abu Dhabi, United Arab Emirates, 2017; p. 132. [Google Scholar]
  59. Faruhaan, A.; Go, Y.L. Energy storage sizing and enhanced dispatch strategy with temperature and safety considerations: A techno-economic analysis. Energy Storage 2021, 3, e260. [Google Scholar] [CrossRef]
  60. Gao, C.; Liu, X.; Chen, H. Research on the control strategy of distributed energy resources inverter based on improved virtual synchronous generator. Sci. Rep. 2017, 7, 9025. [Google Scholar] [CrossRef]
  61. Pu, Y.; Li, Q.; Li, L.; Chen, W. Chapter 11—Secondary Frequency Modulation Control and Stability Analysis of AC Microgrid Based on Virtual Synchronous Generator Characteristics; Renewable Energy Microgeneration Systems 2021; Elsevier: Amsterdam, The Netherlands, 2021; pp. 247–264. [Google Scholar] [CrossRef]
  62. Abuagreb, M.; Allehyani, M.F.; Johnson, B.K. Overview of Virtual Synchronous Generators: Existing Projects, Challenges, and Future Trends. Electronics 2022, 11, 2843. [Google Scholar] [CrossRef]
  63. Sidorov, D.; Panasetsky, D.; Tomin, N.; Karamov, D.; Zhukov, A.; Muftahov, I.; Dreglea, A.; Liu, F.; Li, Y. Toward Zero-Emission Hybrid AC/DC Power Systems with Renewable Energy Sources and Storages: A Case Study from Lake Baikal Region. Energies 2020, 13, 1226. [Google Scholar] [CrossRef]
  64. Pedersen, O.G. A Suggestion for SEEA Classifications of Energy Resources. London Group Meeting on Environmental and Economic Accounting, 29 September–3 October 2008. EUROSTAT, Brussels, 11p. Available online: https://unstats.un.org/UNSD/envaccounting/seearev/docs/LG13_10a.pdf (accessed on 21 March 2023).
  65. Gribkova, D.; Milshina, Y. Energy Transition as a Response to Energy Challenges in Post-Pandemic Reality. Energies 2022, 15, 812. [Google Scholar] [CrossRef]
  66. Renewable Energy Development Association. Russian Renewable Energy Market: Current Status and Development Prospects. News Bulletin. July 2022. Available online: https://www.bigpowernews.ru/photos/0/0_2jvO7UCEruqcpV7TiyyPSsSuTmxPXCA4.pdf (accessed on 21 March 2023).
  67. Bloomberg. Renewable Investment. 2023. Available online: https://www.bloomberg.com/graphics/climate-change-data-green/investment.html (accessed on 21 March 2023).
  68. International Energy Agency. World Energy Investment, OECD/IEA, 2018, 253p. Available online: https://www.connaissancedesenergies.org/sites/default/files/pdf-actualites/wei2018.pdf (accessed on 21 March 2023).
  69. EES EAEC. RE Installed Capacity. Available online: https://www.eeseaec.org/ustanovlennaa-mosnost-vie (accessed on 21 March 2023).
  70. The IPCC Special Report on Renewable Energy and Climate Change Mitigation. 2023. Available online: https://www.ipcc.ch/report/renewable-energy-sources-and-climate-change-mitigation/ (accessed on 21 March 2023).
  71. Federal State Statistics Service. Industrial Production.Electricity Balance and Electricity Consumption in the Russian Federation from 2005–2021. Available online: https://rosstat.gov.ru/storage/mediabank/elbalans_2021.xlsx (accessed on 21 March 2023).
  72. European Commission. Directorate-General for Financial Stability, Financial Services and Capital Markets Union. EU Taxonomy: Complementary Climate Delegated Act to Accelerate Decarbonisation. 2 February 2022. Available online: https://finance.ec.europa.eu/publications/eu-taxonomy-complementary-climate-delegated-act-accelerate-decarbonisation_en (accessed on 21 March 2023).
  73. Strielkowski, W.; Sherstobitova, A.; Rovny, P.; Evteeva, T. Increasing Energy Efficiency and Modernization of Energy Systems in Russia: A Review. Energies 2021, 14, 3164. [Google Scholar] [CrossRef]
  74. Russia Renewable Energy Development Association. 2023. Available online: https://rreda.ru/en/about_rreda (accessed on 21 March 2023).
  75. Project “Renewable Energy in Siberia”. 2023. Available online: https://projects.fedpress.ru/renewableenergysiberia (accessed on 21 March 2023).
  76. Regions of the Siberian Federal District. Available online: https://realtribune.ru/img/uploads/2021/01/623fee5ed1-scaled.jpg (accessed on 21 March 2023).
  77. Zhikharev, A.; Association for the Development of Renewable Energy. Russia’s Strategy in the Field of Renewable Energy. 27.10.2021. Available online: https://www.huawei.ru/upload/iblock/29d/29dd23f69897ac31159956d44d0fb4ec.pdf (accessed on 21 March 2023).
  78. Review of the Electric Power Industry of the Siberian Federal District.12 April 2021. Available online: https://marketelectro.ru/node/obzor-elektroenergetiki-sibirskogo-federalnogo-okruga (accessed on 21 March 2023).
  79. Portal “Alternative Energy”. Renewable Energy Sources in Siberia. 26 September 2015. Available online: https://altenergiya.ru/apologiya/vozobnovlyaemaya-energetika-v-sibiri.html (accessed on 21 March 2023).
  80. 11 Largest Solar Power Plants in Russia—2020. Available online: https://recyclemag.ru/article/top-krupneishih-solnechnih-elektrostantsii-rossii (accessed on 21 March 2023).
  81. The Sixth Wind Farm Was Put into Operation in the Rostov Region. Available online: https://sdelanounas.ru/blogs/144417/ (accessed on 21 March 2023).
  82. Berestovskaya Wind Farm-2022. Available online: https://novawind.ru/press/photo/gallery_item.php?page=565 (accessed on 21 March 2023).
  83. A Solar Power Plant for PJSC Lukoil Was Launched in Krasnodar. 12 August 2021. Available online: https://mashnews.ru/v-krasnodare-zapustili-solnechnuyu-elektrostancziyu-dlya-pao-lukojl.html (accessed on 21 March 2023).
  84. TASS. The Ministry of Energy Pointed to the Redundancy of the Energy System of the South of Russia for Renewable Sources. 15 October 2021. Available online: https://tass.ru/ekonomika/12671873 (accessed on 21 March 2023).
  85. Gorbacheva, N.V. Energy Choice of Siberia: Analysis of Benefits and Costs; IEOPP SO RAN: Novosibirsk, Russia, 2020; p. 320. [Google Scholar]
  86. Burda, E.; Gavrikova, E. Innovation ecosystems in developing markets: Empirical evidence from Russian electric power industry. Technol. Anal. Strateg. Manag. 2022, 8, 2099263. [Google Scholar] [CrossRef]
  87. Kartashova, E.E.; Paskar, I.N. Pestel analysis of introduction of distributed generation objects into the power system of Russia. Econ. Innov. Manag. 2021, 2, 91–98. [Google Scholar] [CrossRef]
  88. Interactive Map of the Electric Power System Based on Data from the OpenStreetMap Project. Available online: https://frexosm.ru/power/#4/55/40 (accessed on 21 March 2023).
  89. Forbes. Who Invests in Renewable Energy in Russia. And How Does It Make Money. 20 November 2021. Available online: https://plus-one.forbes.ru/pochemu-rossii-ne-svetit-zelenaya-energetika (accessed on 21 March 2023).
  90. Nevzorova, T. Biogas Production in the Russian Federation: Current Status, Potential, and Barriers. Energies 2020, 13, 3620. [Google Scholar] [CrossRef]
  91. Analytical Center under the Government of the Russian Federation. Investments in the Fuel and Energy Complex. Energy Bull. 2014, 14, 1–31. Available online: https://ac.gov.ru/files/publication/a/2992.pdf (accessed on 21 March 2023).
  92. Ministry of Natural Resources and Ecology of the Russian Federation. State report “On the State and Protection of the Environment of the Russian Federation”. 2017. Available online: https://gosdoklad-ecology.ru/2017/subjects/sfo/ (accessed on 21 March 2023).
  93. ROSSTAT. Environmental Protection in Russia. 2022: Statistical Compendium; ROSSTAT: Moscow, Russia, 2022; p. 115. Available online: https://rosstat.gov.ru/storage/mediabank/Ochrana_okruj_sredi_2022.pdf (accessed on 21 March 2023).
  94. Khanin, A.L.; Shabina, O.P.; Viktorova, I.B. Respiratory diseases in industrial region of Siberia: Morbidity analysis on the example of the Kemerovo region. Bull. Contemp. Clin. Med. 2019, 12, 47–53. [Google Scholar] [CrossRef]
  95. Zhuikova, L.D.; Choynzonov, E.L.; Ananina, O.A.; Odintsova, I.N. Cancer incidence in Siberia and Russian Far East. Sib. J. Oncol. 2019, 18, 5–11. [Google Scholar] [CrossRef]
  96. Institute for Health Metrics and Evaluation. State of Global Air 2019 Report. Available online: https://www.healthdata.org/news-release/state-global-air-2019-report (accessed on 21 March 2023).
  97. Høivik, S.; Lehmann-Grube, P.; Lochner, L.; Brandt, S. (Eds.) The Russian Coal Sector in a Lowcarbon World: Prospects for a Coal Transition? Insights Report September 2021; Climat Strategies; HSE: Moscow, Russia, 2022; p. 38. Available online: https://publications.hse.ru/mirror/pubs/share/direct/516503265.pdf (accessed on 21 March 2023).
  98. Dzyuba, A.P. Managing demand schedules for natural gas consumption in Russian industry based on LNG technologies. Econ. Innov. Manag. 2021, 1, 51–62. [Google Scholar] [CrossRef]
  99. Federal Agency of the Russian Federation for Tourism. Development of Tourism in the Siberian Federal District. 2022. Available online: https://tourism.gov.ru/tourists/regiony/sibirskiy-fo/ (accessed on 21 March 2023).
  100. Ilina, I.V.; Vishneva, A.D. Assessment of the current state of market for tourist services in the Siberian Federal region. Sci. Bull. South. Inst. Manag. 2020, 2, 88–92. [Google Scholar] [CrossRef]
  101. Directive (EU) 2018/2001 of the European Parliament and of the Council of 11 December 2018 on the Promotion of the Use of Energy from Renewable Sources. Official Journal of the European Union 2018, 21 December 2018, L328/28-209. Available online: https://eur-lex.europa.eu/legal-content/EN/TXT/PDF/?uri=CELEX:32018L2001&from=EN (accessed on 21 March 2023).
  102. European Commission. REPowerEU: Affordable, Secure and Sustainable Energy for Europe. Available online: https://commission.europa.eu/strategy-and-policy/priorities-2019-2024/european-green-deal/repowereu-affordable-secure-and-sustainable-energy-europe_en (accessed on 21 March 2023).
  103. Solar Energies Industries Association. Rooftop Solar. Available online: https://seia.org/initiatives/rooftop-solar (accessed on 21 March 2023).
  104. European Commission. EU Solar Energy Strategy. Available online: https://ec.europa.eu/info/law/better-regulation/have-your-say/initiatives/13338-EU-solar-energy-strategy_en (accessed on 21 March 2023).
  105. The State Council of People’s Republic of China. China Unveils 5-Year Plan on Energy Technology Innovation. 2 April 2022. Available online: http://english.www.gov.cn/statecouncil/ministries/202204/02/content_WS62484411c6d02e5335328aba.html (accessed on 21 March 2023).
  106. Apparasu, S.R. Jagan Lays Foundation Stone for Green Energy Storage Plant in Andhra Pradesh. Hindustan Times 18 May 2022. Available online: https://www.hindustantimes.com/india-news/jagan-lays-foundation-stone-for-green-energy-storage-plant-in-andhra-pradesh-101652815239831.html (accessed on 21 March 2023).
  107. Energy Strategy of the Russian Federation for the Period up to 2035. Approved by Order of the Government of the Russian Federation of 9 June 2020 No. 1523-r. Available online: https://minenergo.gov.ru/node/1026 (accessed on 21 March 2023).
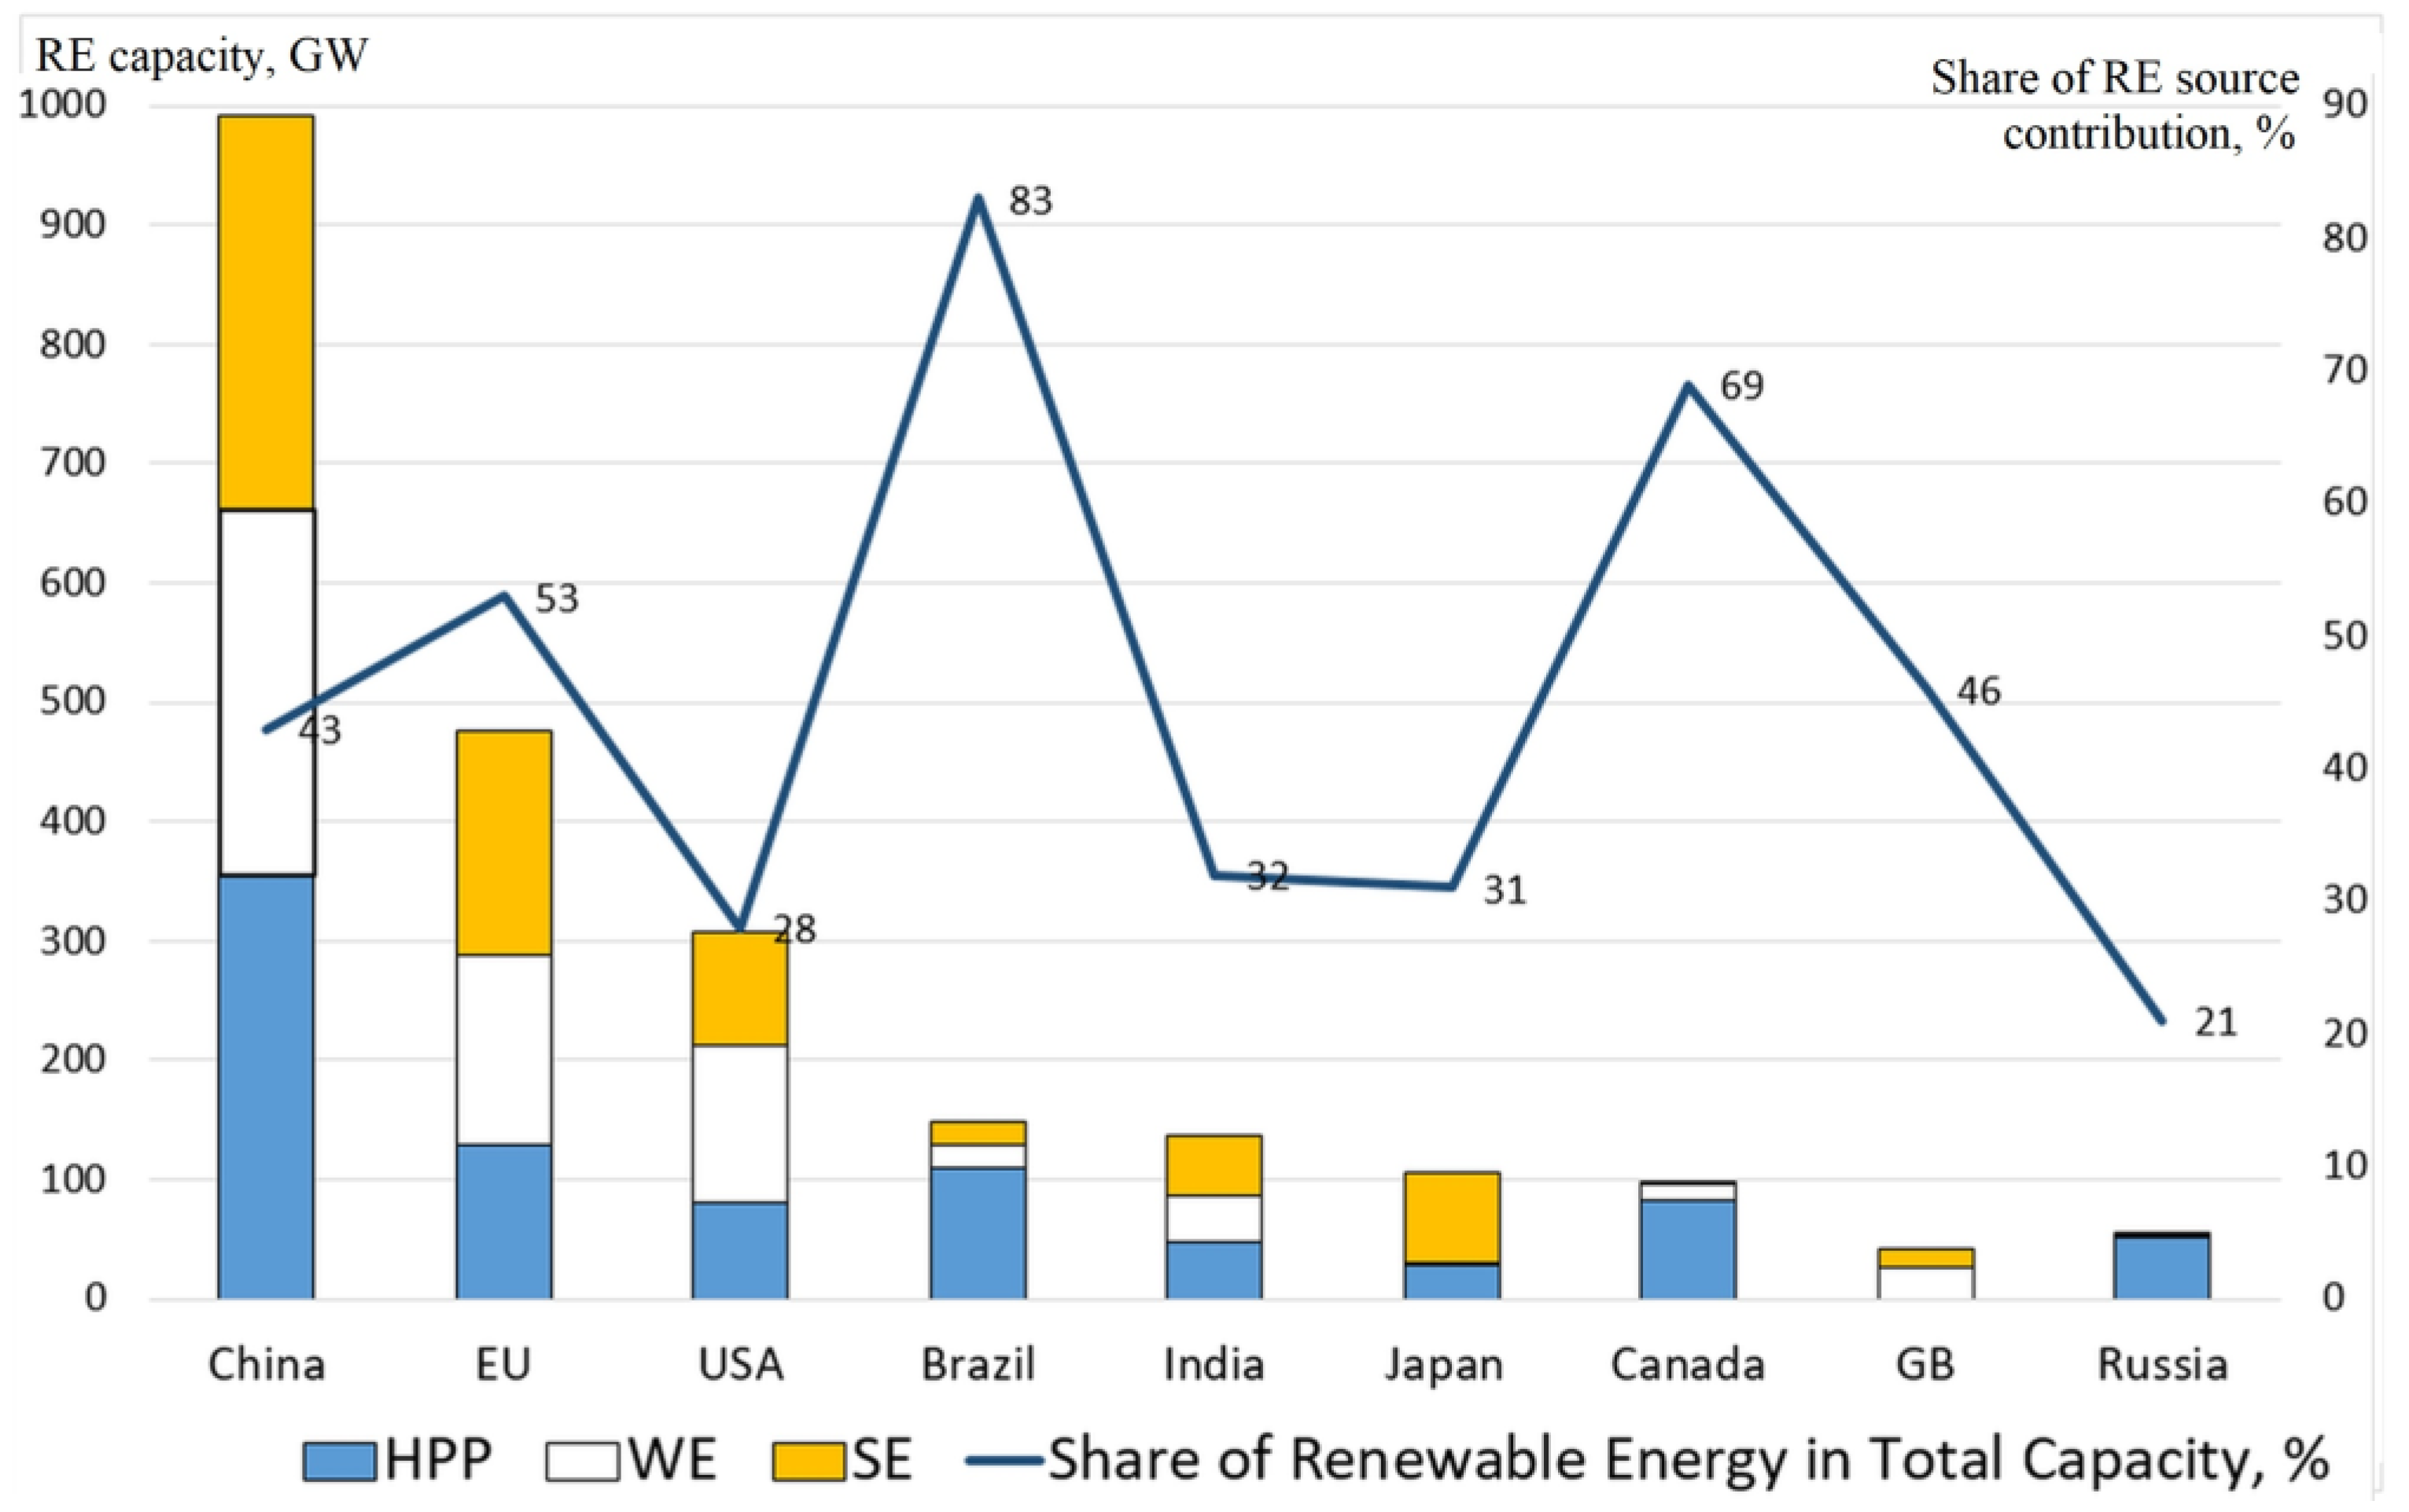
Figure 1. Capacity of renewable energy (RE) in 2022 (right scale); the share of renewable energy in total capacity (left scale): HPP—hydropower production, WE—wind energy, SE—solar energy (compiled by the authors according to the data from [66]).
Energies 16 03843 g001
Figure 2. Share of countries in global investment in energy production, 2018 (compiled by the authors according to the data from [68]).
Energies 16 03843 g002
Figure 3. The share of different sources in the total electricity production of Russia (logarithmic scale)—(compiled by the authors according to the data from [71,73]).
Energies 16 03843 g003
Figure 4. Siberian Federal District (Western and Central Siberia) [76].
Energies 16 03843 g004
Figure 5. Concentration of renewable energy facilities in Russia [77].
Energies 16 03843 g005
Figure 6. Solar and wind energy systems in Siberia (composed by the authors according to the data from [79]).
Energies 16 03843 g006
Figure 7. Solar and wind parks in the Rostov Region (left), Krasnodar Territory (right) (South of Russia)—composed by the authors according to the data from [80,81,82,83].
Energies 16 03843 g007
Figure 8. The share of different sources in the total electricity production in the Siberian Federal District (by sources, logarithmic scale), %—compiled by the authors according to the data from [71].
Energies 16 03843 g008
Figure 9. Installed capacity of renewable power sources in the Siberian Federal District, GW (logarithmic scale)—compiled by the authors according to the data from [71]).
Energies 16 03843 g009
Figure 10. Electric-power production in the Siberian Federal District (by regions), billion kWh (compiled by the authors according to the data from [85,86]).
Energies 16 03843 g010
Figure 11. Saturation with main powerlines in Russia (the zone of energy grids of Siberia is marked in green) [88].
Energies 16 03843 g011
Figure 12. Energy investment in the Siberian Federal District, million USD (compiled by the authors according to the data from [81,91]).
Energies 16 03843 g012
Figure 13. Atmospheric emissions from stationary sources in the Siberian Federal District, in thousand tons (compiled by the authors according to the data from [92,93]).
Energies 16 03843 g013
Figure 14. Years of lost healthy full-fledged life due to diseases caused by air pollution in selected countries (DALYs per 100,000 population)—compiled by the authors according to the data from [96].
Energies 16 03843 g014
Figure 15. Coal and natural gas production in Russia and Siberia, their use in thermal power plants of the Siberian Federal District (logarithmic scale)—compiled by the authors according to the data from [97,98].
Energies 16 03843 g015
Figure 16. Tourist traffic in the Siberian Federal District, per one thousand people (compiled by the authors according to the data from [99,100]).
Energies 16 03843 g016
Table 1. Classification of energy resources.
Type of Energy ResourceTraditionalNontraditional
Non-renewable
  • traditional hydrocarbon deposits on continents and shelves
  • high-quality hard coals, including coking
  • deposits of high-quality uranium ores
  • unconventional oil and gas in low permeability reservoirs
  • heavy high-viscosity oils, natural bitumens
  • gas from coal deposits
  • dissolved gases
  • highly gas-saturated fluids of ultra-great depths
  • methane hydrates in the subsoil
  • low-calorie high-ash coals
  • dispersed poor uranium ores
Renewable
  • hydropower of large HPPs
  • biomass (conventional combustion)
  • hydropower from small HPPs
  • solar energy
  • wind energy
  • wave energy
  • thermal (low-potential heat) energy
  • hydrogen
Table 2. Electric power production in Russia (by sources), billion kWh (compiled by the authors according to the data from [71]).
2012201320142015201620172018201920202021
Wind power0.020.040.050.080.110.130.220.321.383.62
Solar power0.030.050.090.110.150.380.81.31.992.25
Hydropower184186181178187180183190197199
Nuclear power176178184182186185184166145158
Fossil fuel burning power685691688690701695712722751786
Total1069105910641068109110941121108010891159
Table 3. Installed capacity of renewable power in Russia, GW (compiled by the authors according to the data from [74]).
2012201320142015201620172018201920202021
Wind farms0.050.080.110.120.150.160.180.21.012.05
Solar farms0.060.090.120.140.250.530.821.421.671.98
Small hydro plants (up to 50 mW) 0.70.91.141.151.171.171.171.181.21.3
Table 4. The share of the Siberian Federal Sector in results of the Russian Federation, % (compiled by the authors according to the data from [71]).
2012201320142015201620172018201920202021
Share in GDP12.212.112.212.011.911.711.711.611.611.5
Share in power generation (total)19.919.819.920.019.919.418.119.118.918.6
Share of fossil fuel burning power generation25.725.325.725.525.424.923.023.422.422.3
Share in electricity generation from renewable sources15.217.524.118.719.218.918.618.119.618.2
Wind power11.611.912.511.610.810.610.810.711.211.6
Solar power2.02.83.02.33.01.50.90.80.70.9
Hydropower (including large hydro plants)28.128.327.528.128.528.228.428.829.129.3
The share of atmospheric emissions from stationary sources34.031.830.031.131.032.333.333.832.432.7
Table 5. Comparison of the Siberian and Southern Federal Districts of the Russian Federation (compiled by the authors according to the data from [78]).
Area, Thousand km2Population, Million PeopleNumber of Sunny Days per YearAverage Annual Wind Speed at a Height of 10 m, m/sAverage Maximum Wind Speed, m/s
Southern Federal District420.816.6150–3002.321
Siberian Federal District4361.716.680–1202.824
Table 6. Standardized rate per 100,000 people (compiled by the authors according to the data from [94,95]).
Oncological PathologiesRespiratory Pathologies
20052018Growth, %20052018Growth, %
Siberian Federal District231.3283.522.674,48876,8153.1
Republic of Tyva199.6266.633.624,42856,111129.7
Republic of Khakassia169.1269.859.654,96963,42615.4
Altai Republic and Territory251.8300.718.565,92764,237−2.6
Krasnoyarsk Territory194.5297.833.263,41368,5418.1
Irkutsk region260.8323.524.175,90483,47710.0
Kemerovo region-Kuzbass204.6253.324.662,83870,91512.9
Novosibirsk Region252.9277.59.890,86694,8474.4
Omsk region252.1294.316.778,85563,317−19.7
Tomsk region270.2296.29.875,84860,998−19.6
Disclaimer/Publisher’s Note: The statements, opinions and data contained in all publications are solely those of the individual author(s) and contributor(s) and not of MDPI and/or the editor(s). MDPI and/or the editor(s) disclaim responsibility for any injury to people or property resulting from any ideas, methods, instructions or products referred to in the content.