Article

An Improved Artificial Ecosystem-Based Optimization Algorithm for Optimal Design of a Hybrid Photovoltaic/Fuel Cell Energy System to Supply A Residential Complex Demand: A Case Study for Kuala Lumpur

1
Department of Computer System and Technology, Faculty of Computer Science and Information Technology, Universiti Malaya, Kuala Lumpur 50603, Malaysia
2
Department of Computer Science and Information Engineering, National Taipei University of Technology, Taipei 106344, Taiwan
3
Department of Computer Science, Universiti Tunku Abdul Rahman, Kampar 31900, Malaysia
4
Department of Statistics, Faculty of Sciences, Golestan University, Gorgan 49138-15759, Iran
*
Authors to whom correspondence should be addressed.
Energies 2023, 16(6), 2867; https://doi.org/10.3390/en16062867
Submission received: 14 February 2023 / Revised: 17 March 2023 / Accepted: 18 March 2023 / Published: 20 March 2023
(This article belongs to the Special Issue Hybrid-Renewable Energy Systems in Microgrids)

Abstract

:
In this paper, the optimal design of a hybrid energy system (HES), consisting of photovoltaic technology integrated with fuel cells (HPV/FC) and relying on hydrogen storage, is performed to meet the annual demand of a residential complex to find the minimum total net present cost (TNPC), while observing the reliability constraint as the energy-not-supplied probability (ENSP) and considering real meteorological data of the Kuala Lumpur city in Malaysia. The decision variables include the size of system components, which are optimally determined by an improved artificial ecosystem-based optimization algorithm (IAEO). The conventional AEO is improved using the dynamic lens-imaging learning strategy (DLILS) to prevent premature convergence. The results demonstrated that the decrease (increase) of the reliability constraint leads to an increase (decrease) in the TNPC, as well as the cost of electricity (COE). For a maximum reliability constraint of 5%, the results show that the TNPC and COE obtained USD 2.247 million and USD 0.4046 million, respectively. The superior performance of the IAEO has been confirmed with the AEO, particle swarm optimization (PSO), and manta ray foraging optimization (MRFO), with the lowest TNPC and higher reliability. In addition, the effectiveness of the hydrogen tank efficiency and load changes is confirmed in the hybrid system design.

1. Introduction

The reduction of fossil resources in the world has caused the need for alternative energy sources to become very important [1]. Photovoltaic (PV) energy is a promising source of energy due to its abundance and availability. Nevertheless, the dependence of photovoltaic energy sources on weather conditions and their unpredictability, as well as the lack of proportion between energy demand and supply, are three of the important challenges of using this type of source [2,3]. The storage devices can compensate for the power fluctuations of photovoltaic sources and lead to the creation of programmable power [4,5]. On the other hand, another important storage source that is welcome in a hybrid system is the hydrogen-based fuel cell [6,7,8]. For effective and economical use of a hybrid renewable energy system, the use of an optimization method is required to solve the design problem, i.e., determine the optimal size of the equipment [9,10,11]. It should also be noted that the climate and weather significantly impact the design costs and reliability level of the load.
The optimal design of the hybrid system has been widely discussed in previous literature. Ref. [12] presents the optimal structure of a hybrid photovoltaic/wind/battery energy system to minimise electricity costs by satisfying the reliability constraint with the help of the Firefly algorithm. In [13], a hybrid photovoltaic, wind, and battery energy system is optimally designed via combined genetic–particle swarm optimization to minimise the power generation cost and satisfy the reliability constraint. In [14], the design of the energy system, including photovoltaic, diesel, and battery banks, is developed in Algeria to meet an annual demand and minimise the energy cost and load reliability. Ref. [15] optimally designs a photovoltaic, wind, and hydrogen energy system in Iran to supply a residential load by minimising the cost of the useful life of the project using the grey wolf-sine cosine optimization algorithm. In another study, photovoltaic, wind, battery, and diesel energy systems for different regions of Bangladesh were optimally designed using the Homer software, considering energy cost minimization [16]. In [17], a similar approach is adopted for a hybrid photovoltaic/biomass energy system with hydrogen storage to meet a grid-disconnected load in terms of minimising the cost of electricity in Iran via a whale optimization algorithm. In [18], the optimal structure of a photovoltaic, battery, or diesel energy system to minimise the energy production costs and consider the reliability constraint is determined based on the particle swarm optimization in Saudi Arabia. In [19], a PV, wind, battery, and diesel energy system is optimally established to minimise the useful life cost of the project and is investigated to supply off-grid loads using the nomadic people optimization algorithm in Iraq. In [20], a photovoltaic/fuel cell design to minimise the energy cost is evaluated for China using the fractional-order neural network algorithm. In [21], a photovoltaic, wind, and battery system equipped with a diesel backup source is studied to minimise the energy cost and satisfy reliability by adopting an improved grey wolf optimizer in Egypt. In [22], the design of a photovoltaic, wind, and battery energy system to minimise the total net present cost was implemented in Iran using the grasshopper optimization algorithm. In [23], the design of a photovoltaic, fuel cell, or diesel energy system was performed to find the minimum total net present cost and consider the probability of not supplying the load using the crow search algorithm for Iran. In [24], the implementation of a wind/fuel cell energy system with the aim of cost minimization was implemented in China using the elephant herding optimization algorithm. In [25], the design of a photovoltaic/fuel cell energy system is implemented to find the minimum energy cost using a hybrid particle swarm–artificial bee algorithm in India. In [26], a photovoltaic, fuel cell, and diesel generator system is proposed to minimise the TNPC using the search algorithm used in Iran. In [27], the design of a photovoltaic, wind, or battery energy system is discussed to find the minimum levelized energy cost using a genetic algorithm in Morocco. In [28], the design of a photovoltaic, wind, and fuel cell energy system to minimise the total annual cost and consider reliability is implemented in Pakistan using the Jaya algorithm. In [29], a photovoltaic/diesel design with a fuel cell is presented with energy cost minimization via the Mayfly optimization algorithm in Egypt.
A literature review has shown that in many studies, the battery, which is short-term storage, has been used as a storage system. Therefore, the use of long-term fuel cell storage based on hydrogen, which has higher reliability than battery storage, is proposed in the design of the hybrid system in this study. The studies presented in the literature have shown that the use of meta-heuristic algorithms in solving energy system design problems is very important when calculating the optimal scale and capacity of the components.
The present research designs an HPV/FC energy system to supply the annual electrical demand of a residential complex and is performed to minimise the total net present cost based on the meteorological data of the city of Kuala Lumpur in Malaysia using an improved artificial ecosystem-based optimization algorithm (IAEO) to determine the optimal size of the system components. The proposed algorithm is an improved version of the conventional AEO algorithm [30] and is strengthened by using a dynamic lens-imaging learning strategy [31] against premature convergence. The most acceptable arrangement of the hybrid system for different values of the reliability constraint in the city of Kuala Lumpur has been determined, and the values of the cost of supplying each kWh of energy for the residential complex, along with the reliability indices, have also been calculated.
The rest of the structure of the paper is presented as follows: In Section 2, the HES components are modelled. The design problem includes cost and reliability models, which are presented in Section 3. In Section 4, the suggested method and its procedure are described. In Section 5, the steps of IEOA implementation are presented. Section 6 provides the simulation results, and the paper findings are summarised in Section 7.

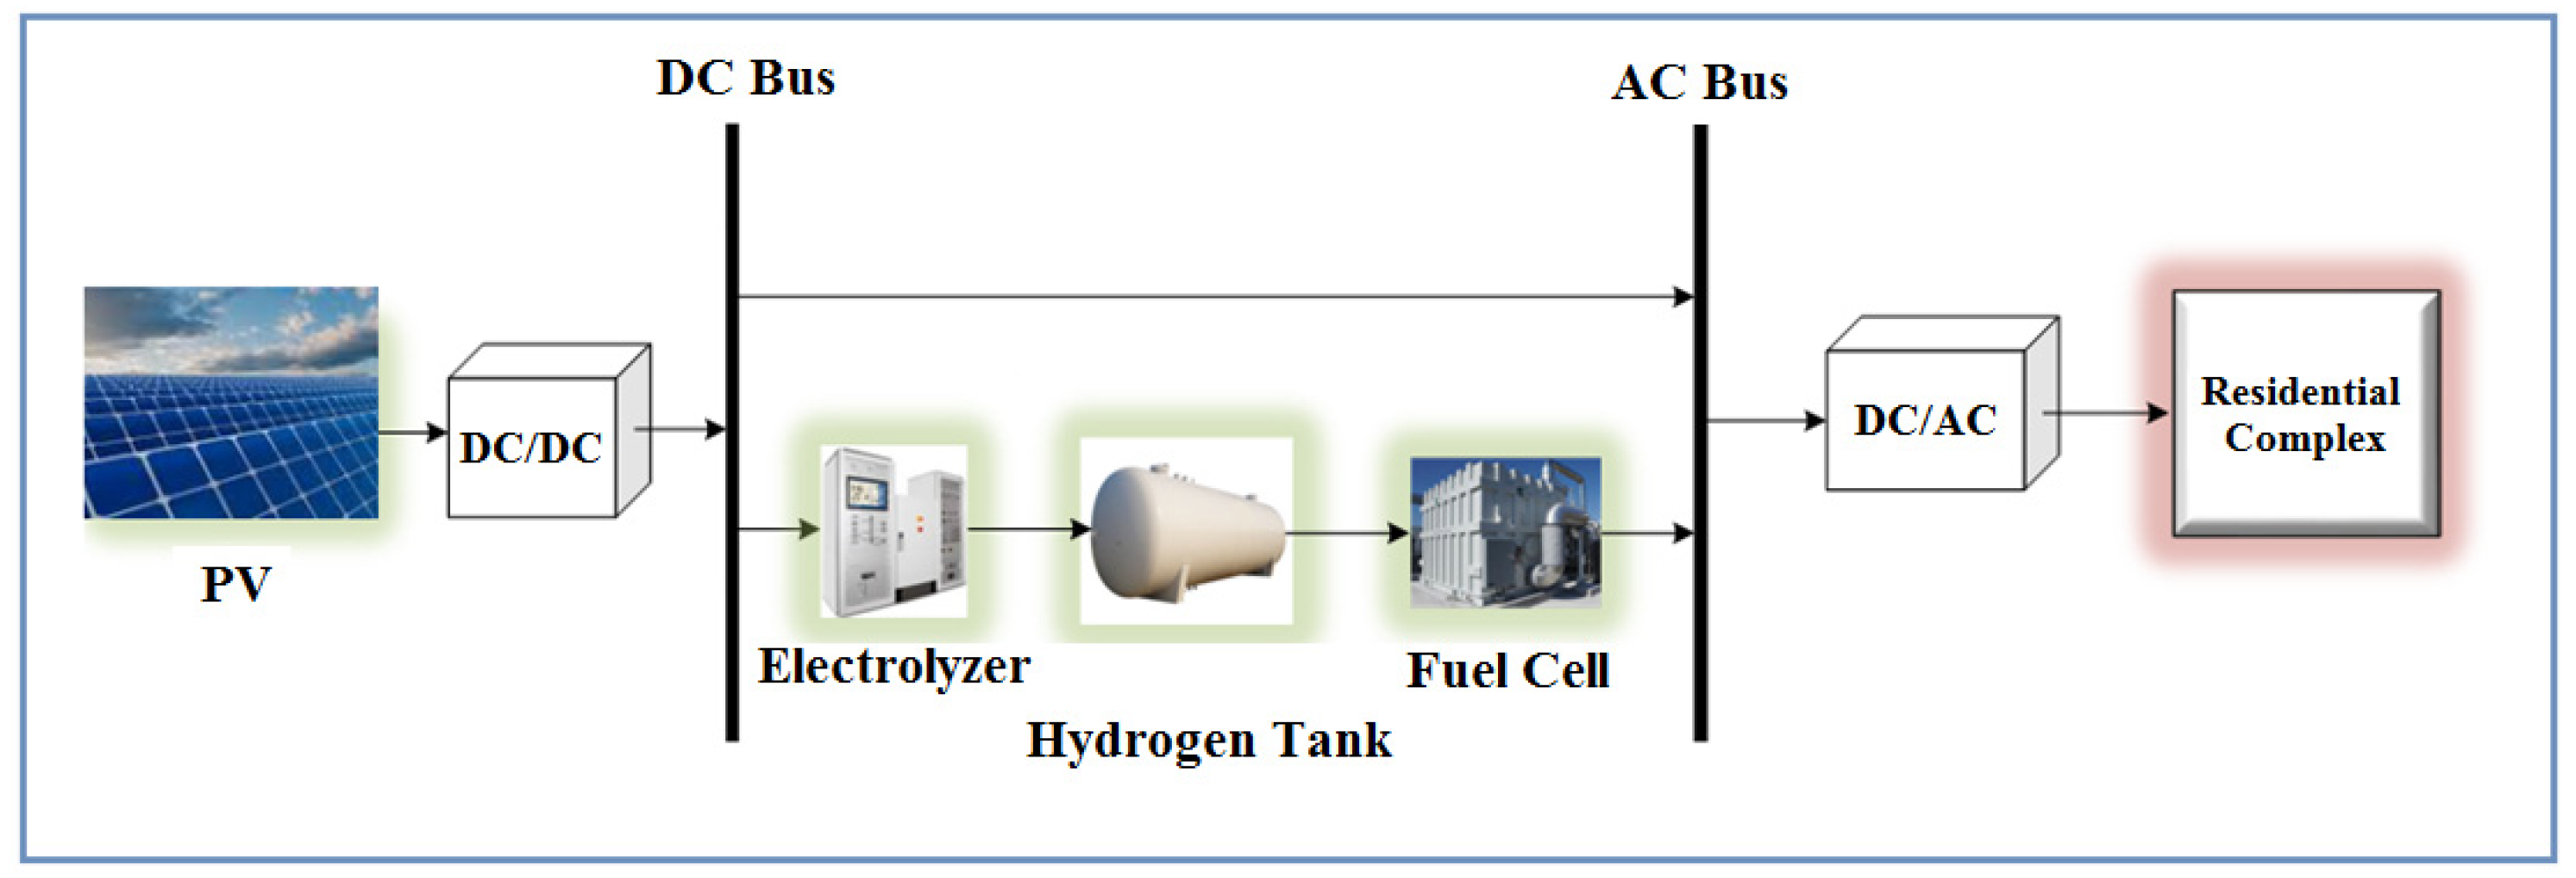
2. Hybrid Energy System Modelling

In this study, the design of a hybrid photovoltaic/fuel cell (HPV/FC) energy system is presented to supply the annual demand of a residential complex based on the meteorological data of the city of Kuala Lumpur in Malaysia. The schematic of the HPV/FC system is depicted in Figure 1.

2.1. HPV/FC Energy System Modeling

2.1.1. PV Model

The production power of a PV panel depends on factors such as the solar radiation irradiated on the panel surface and the ambient temperature. Equation (1) expresses the power generation by a PV [14]:
P P V = P P V , n o m × I r I r r e f × [ 1 + N T C ( T e m c T e m S t c ) ]
T c = T A + [ ( N O C T 20 ) 800 × I r ]
where P P V , r a t e d indicates the nominal power of the PV unit; I r and I r r e f refer to instantaneous radiation and radiation in the standard condition, respectively; N T C is the PV temperature coefficient (−3.7 × 10⁻³ (1/°C)); T e m c , T e m S t c and T A refer to the cell, standard condition, and ambient temperature, respectively. NOCT is the temperature of the rated operating cell (°C).
Therefore, taking into account the number of panels (NPV) and the converter efficiency (ηDC/DC), the PV output power in the HES at time t ( P P V T ( t ) ) is obtained as follows:
P P V T ( t ) = η D C / D C × n P V = 1 N P V P P V ( t )

2.1.2. Electrolyser

The electrolyser produces hydrogen by delivering power based on the water electrolysis process, whose equation is presented below.
P E l H S T ( t ) = P P V E l T ( t ) × η E l
where P E l H S T ( t ) is the electrolyzer output power at time t, P P V E l T ( t ) is the injected power of PV to the electrolyser, and η E l is the electrolyser efficiency.

2.1.3. Hydrogen Storage Tank

The energy of the tank at time t is obtained as follows [15]:
E H S T ( t ) = E H S T ( t 1 ) + P E l H S T ( t ) . Δ t P H S T F C ( t ) . Δ t × η H S T
M H S T ( t ) = E H S T ( t ) / H H V H 2
where E H S T ( t 1 ) indicates the energy of the HST at time ( t 1 ) , P E l H S T ( t ) clears the electrolyser output power at time t, P H S T F C ( t ) is the equivalent power to the hydrogen transferred to the fuel cell, Δ t are time steps (1 h intervals), η HST is the efficiency of the HST,  E H S T ( t ) / H H V H 2 denotes the stored hydrogen mass in the HST [15].

2.1.4. Fuel Cell

The fuel cell is used to compensate for the lack of power required by the load in the hybrid system [15].
P F C I n v ( t ) = P H S T F C ( t ) × η F C
where η F C refers to fuel cell efficiency.

2.1.5. Inverter

The transferred power to the residential complex by the inverter is defined by [15].
P I n v C B ( t ) = ( P F C I n v ( t ) + P P V I n v T ( t ) ) × η I n v
where P I n v C B ( t ) is the power transferred by the inverter to the residential complex at time t, and P P V I n v T ( t ) indicates the injected PV power to the inverter.

3. Designing Problem

3.1. Cost Model

The total present value cost includes the initial investment costs ( C C A P ), maintenance and operation costs ( C M A I N ), and replacement costs ( C R E P ) of the equipment, which are defined as follows [15,32].
M i n . T N P C = N P C P V + N P C E l + N P C H S T + N P C F C + N P C I n v
For each PV source equipment, electrolyser, HST, FC, and NPC inverter, it is defined as follows:
N P C c o m = N c o m × ( C C c o m + R C n p v c o m + O M n p v c o m )
where com is the type of equipment, N c o m is the amount of com equipment, C C c o m is the investment cost of the com equipment, R C c o m is the replacement cost of the com equipment, and O M c o m is the net present cost of the operation and maintenance costs of the com equipment.
For com equipment, if O M c o m y is the cost of operation and maintenance, the O M n p v c o m value is defined as follows [15]:
O M n p v c o m = O M c o m y × n = 1 N 1 ( 1 + r ) n
where r represents the interest rate.
Therefore, the replacement cost of the equipment only for the fuel cell and inverter is presented as follows [15,32]:
R C n p v F C = R C F C × n = 5 , 10 , 15 , 20 1 ( 1 + r ) n
R C n p v I n v = R C I n v × n = 10 , 20 1 ( 1 + r ) n
where R C F C and R C I n v are the cost of replacing the fuel cell and inverter, respectively.

3.2. Reliability Model

In this paper, reliability is defined as the energy-not-supplied probability (ENSP). Along with this condition, two loss of energy expectation (LOEE) and loss of load expectation (LOLE) indices have been evaluated. In the following, each of these indices is formulated [3,4,6,33].
L O E E = t = 1 T [ P L C B ( t ) P I n v C B ( t ) ]
E N S P = L O E E t = 1 T P L C B ( t )
L O L E = t = 1 T L O L T
where P L C B ( t ) is the load demand of the residential complex at time t.

3.3. Constraints

In this study, the reliability criterion is presented as the maximum value of ENSP (ENSPmax) as follows:
E N S P E N S P max
Also, the constraints of the system equipment are presented as follows:
N P V min N p v N P V max
P E l min P E l P E l max
E H S T min E H S T E H S T max
P F C min P F C P F C max
P I n v min P I n v P I n v max
where N P V min , P E l min , E H S T min , P F C min , and P I n v min are the minimum number of PVs, the minimum inverter power, the minimum energy of the hydrogen tank, the minimum fuel cell power, and the minimum transferred inverter power to the load, respectively. Also, N P V max , P E l max , E H S T max , P F C max , and P I n v max are, respectively, the maximum number of PVs, the maximum inverter power, the maximum energy of the hydrogen tank, the maximum fuel cell power, and the maximum inverter-transferred power to the load.

4. Optimization Method

4.1. Overview of AEO

The AEO [30] includes three operators: production, consumption, and decomposition.

4.1.1. Production

In a productive ecosystem, food provides energy, along with carbon dioxide, water, sunlight, and nutrients created by decomposers. The generation operator assists the AEO [30] to randomly replace the previous one (xn) with a new individual (xrand). Production behaviour is defined below [30]:
x 1 ( t + 1 ) = ( 1 a ) x N P ( t ) + a x r a n d ( t )
a = ( 1 t / T ) r 1
x r a n d = r ( U L ) + L
where N P represents the population size, T is the maximum number of iterations of the algorithm, L and U refer to the upper and lower boundaries of the search space.

4.1.2. Consumption

In the AEO [30], a simple and parameter-free random walk at a point based on the Levy flight, named the consumption factor, will be [30]:
C = 1 2 v 1 | v 2 |
v 1 N ( 0 , 1 ) , v 2 N ( 0 , 1 )
where N (0, 1) refers to the normal distribution with a zero mean and standard deviation.
Herbivore: The consumption pattern of vegetarians will be [30]:
x i ( t + 1 ) = x i ( t ) + C . ( x i ( t ) x 1 ( t ) ) , i [ 2 , , n ]
Carnivore: The consumption pattern of a carnivore can be modelled by Equation (29) [30]:
{ x i ( t + 1 ) = x i ( t ) + C . ( x i ( t ) x 1 ( t ) ) , i [ 2 , , N P ] j = r a n d i ( [ 2 i 1 ] )
Omnivore: If a consumer happens to be considered a consumer, it can consume both a consumer that has greater energy and a producer. This behaviour is defined here [30]:
{ x i ( t + 1 ) = x i ( t ) + C . ( x i ( t ) x 1 ( t ) ) + ( 1 r 2 ) ( x i ( t ) x j ( t ) ) , i = 3 , , N P j = r a n d i ( [ 2 i 1 ] )
r2 represents a random number in the interval [0, 1].

4.1.3. Decomposition

In the decomposition process, if an individual dies, the decomposer decomposes itself. The decomposition process is defined as follows [30]:
x i ( t + 1 ) = x n ( t ) + D . ( e . x n ( t ) h . x i ( t ) ) , i = 1 , , N P
D = 3 u , u N ( 0 , 1 )
e = r 3 . r a n d i ( [ 1 2 ] ) 1
h = 2 . r 3 1

4.2. Overview of IAEO

The lens imaging dynamic learning approach [31] is considered to prevent the AEO algorithm from getting trapped in the local optimum according to Figure 2. As you can see, on the left side of the y-axis, the person marked with F, its projection on the x-axis is shown with X, and its distance from the x-axis is marked with ξ . When passed through a convex lens, F forms an inverse F′ whose image on the x-axis is denoted by X′ and its distance from the x-axis is defined as ξ . Person X and person opposite X′ are selected.
X′ is obtained as follows [31]:
X = ψ u + ψ l 2 + ψ u + ψ l 2 × μ X μ
Scaling based on nonlinear dynamic reduction μ is defined as follows [31]:
μ = λ min ( λ max λ min ) × ( t T ) 2
where λ max and λ min represent the upper and lower scaling factors (100 and 10, respectively) [31]. Equation (35) is defined for n-dimensional space by [31]
X j = ψ u j + ψ l j 2 + ψ u j + ψ l j 2 × α X j α
where Xj and X’j refer to the X0 and X components in dimension j; and ψ l j and ψ u j , respectively, indicate the upper and lower limits of dimension j.

5. Implementation of the IAEO

The implementation steps of the IAEO in solving the HPV/FC energy system design problem are described below.
Step (1) Application of HES data and algorithm. In this step, the data set, such as weather data, technical and economical specifications, and algorithm data, are initiated.
Step (2) Determining random variables per algorithm population. In this stage, optimization parameters are found within the specified range for all populations randomly.
Step (3) Calculate the objective function. The objective function of TNPC (Equation (9)) is calculated considering the design constraints (Equations (17)–(22)) for each set of randomly chosen variables in step 2. After sorting, the set with the lowest TNPC (Equation (9)) will be assumed to be the best solution for this step.
Step (4) Update the population of the algorithm. At this stage, the population is updated.
Step (5) Find the value of the objective function of the updated population. The value of the TNPC cost function (Equation (9)) of the new set of variables from step 4 is calculated, and if it is better, it replaces the previous solution obtained in step 3.
Step (6) Population update based on dynamic imaging-lens learning strategy. In this step, the learning strategy of lens-dynamic imaging is implemented, the population is updated, and a set of new variables is selected.
Step (7) Compute the objective function for the updated population based on the dynamic imaging-lens learning strategy. At this stage, the TNPC is calculated for the set of new variables, and if the obtained solution is better than the solution from step 5, it will be replaced.
Step (8) Checking the convergence conditions. In this step, the above steps are repeated until the convergence conditions are met. If there is convergence, jump to step 9; otherwise, return to step 4.
Step (9) Stop the algorithm and save the best solution. At this stage, when the algorithm reaches the convergence criterion, the algorithm is stopped, and the best variable set is saved.

6. Results and Discussion

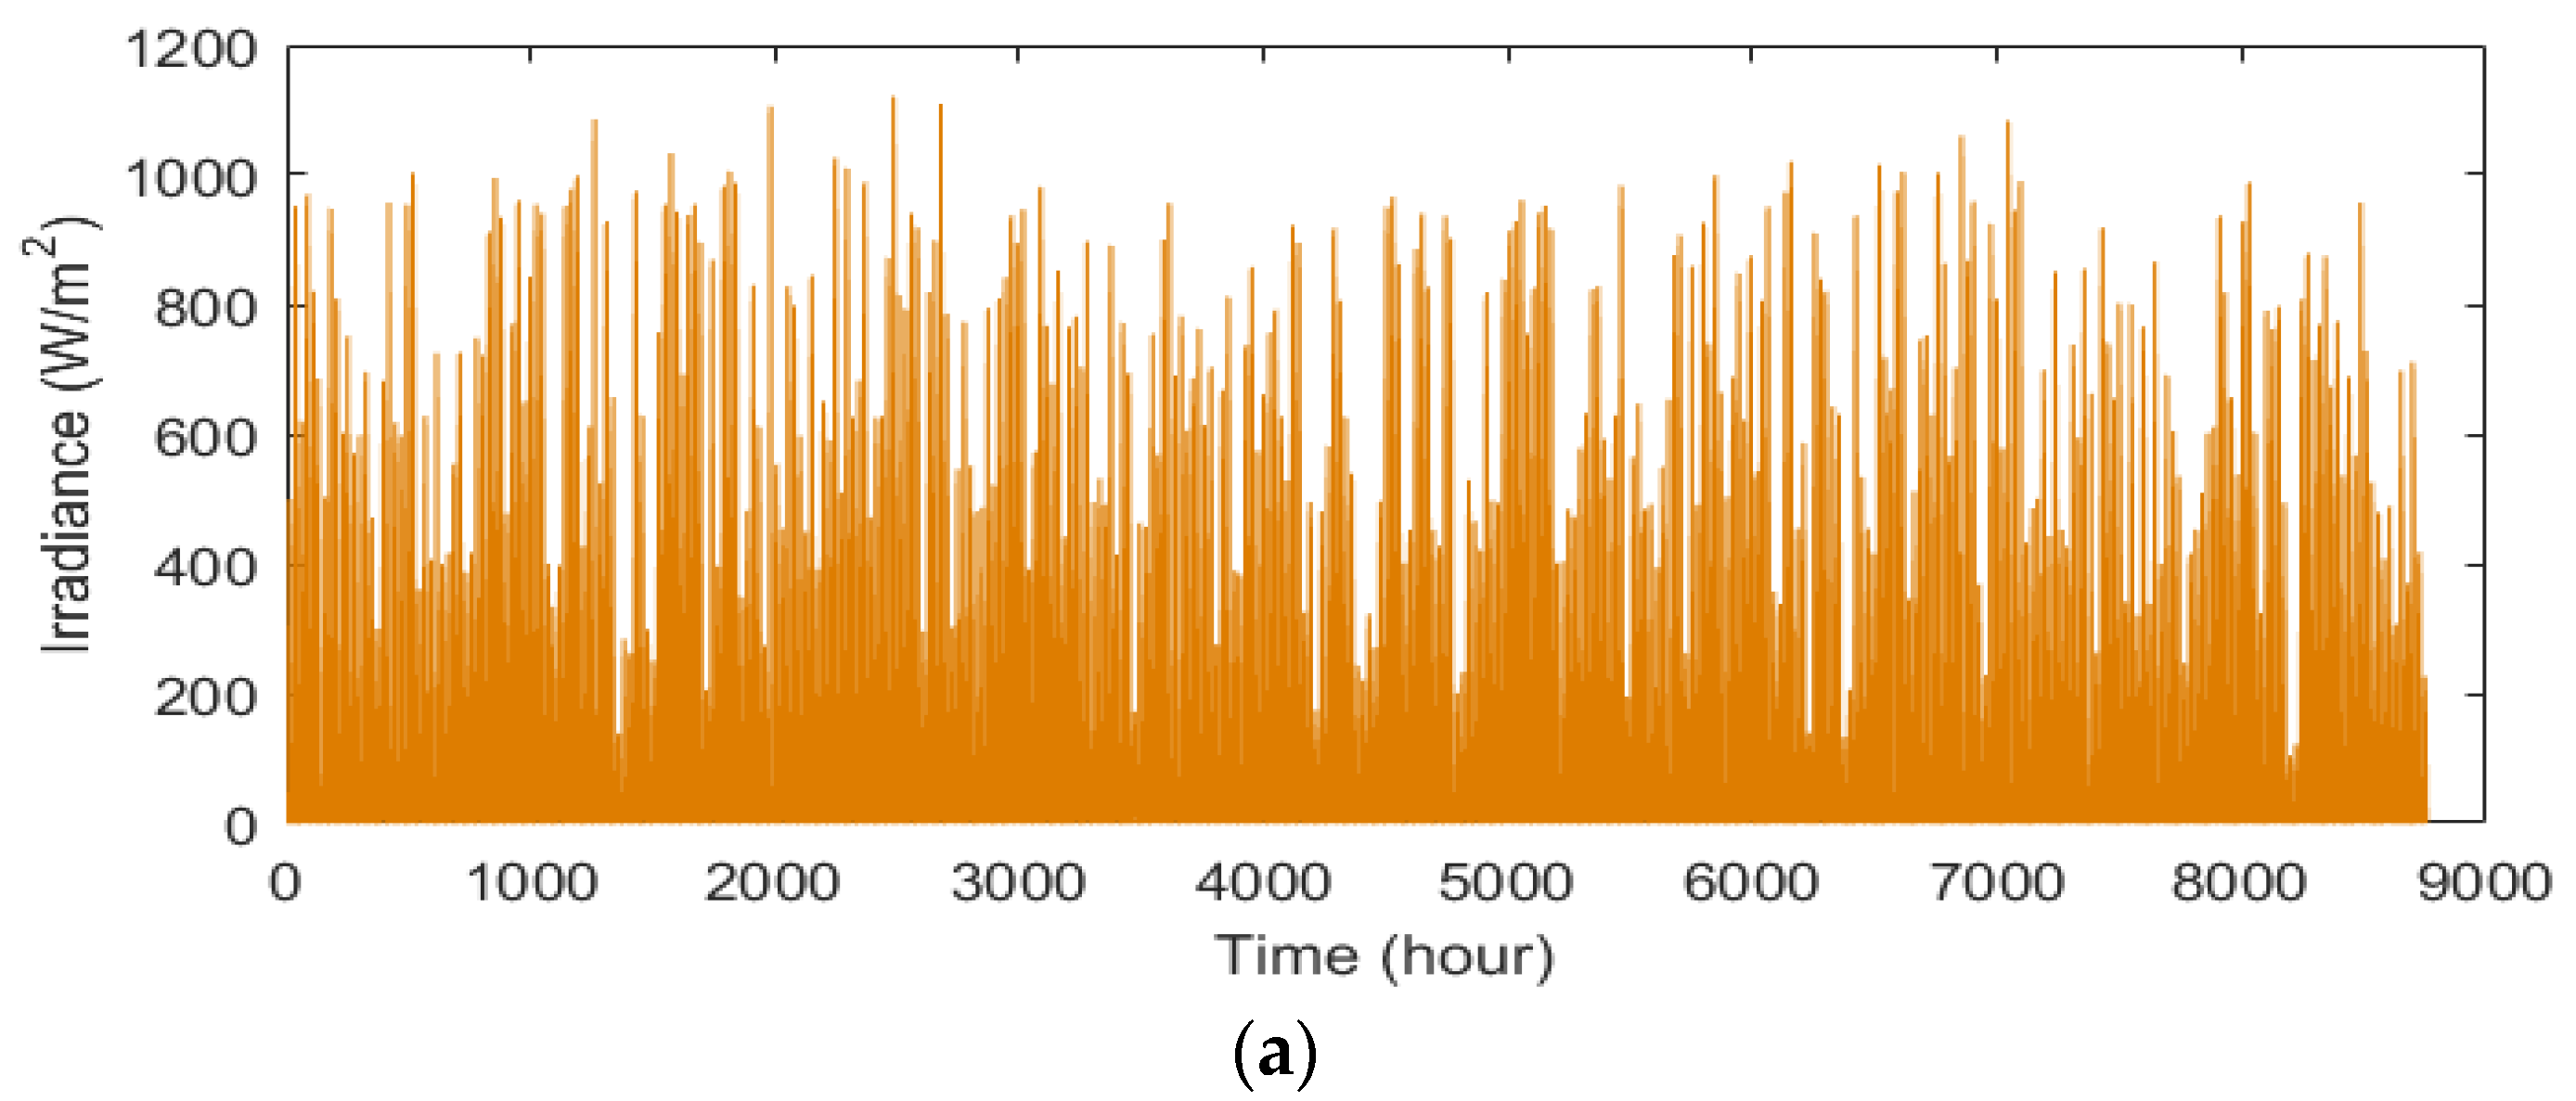
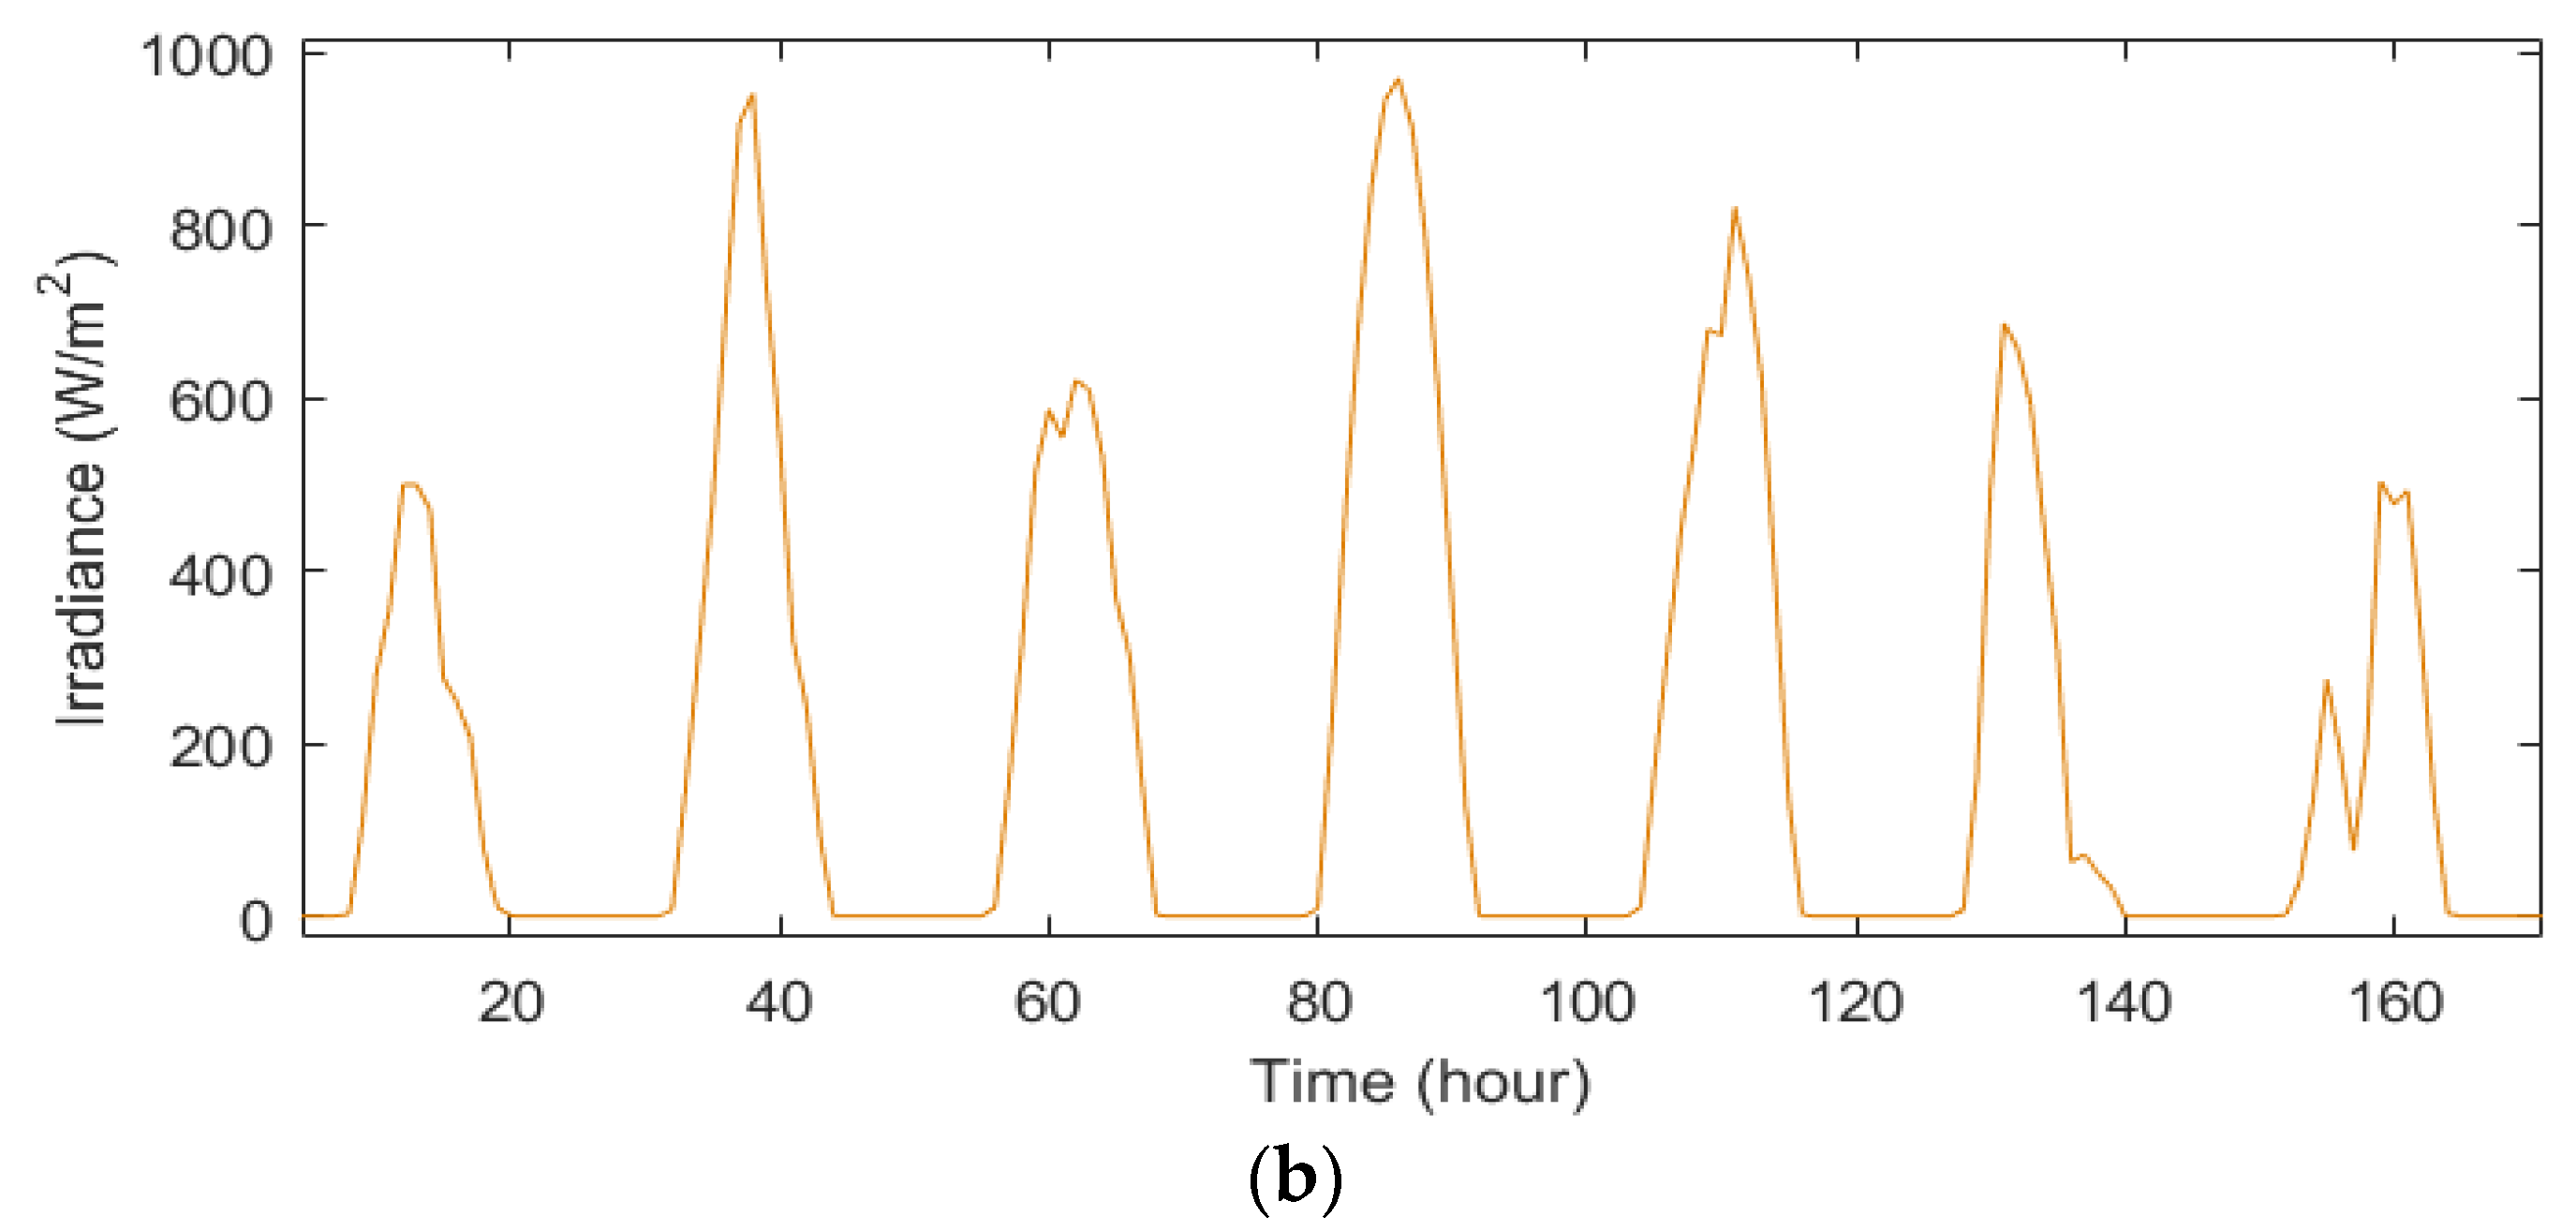
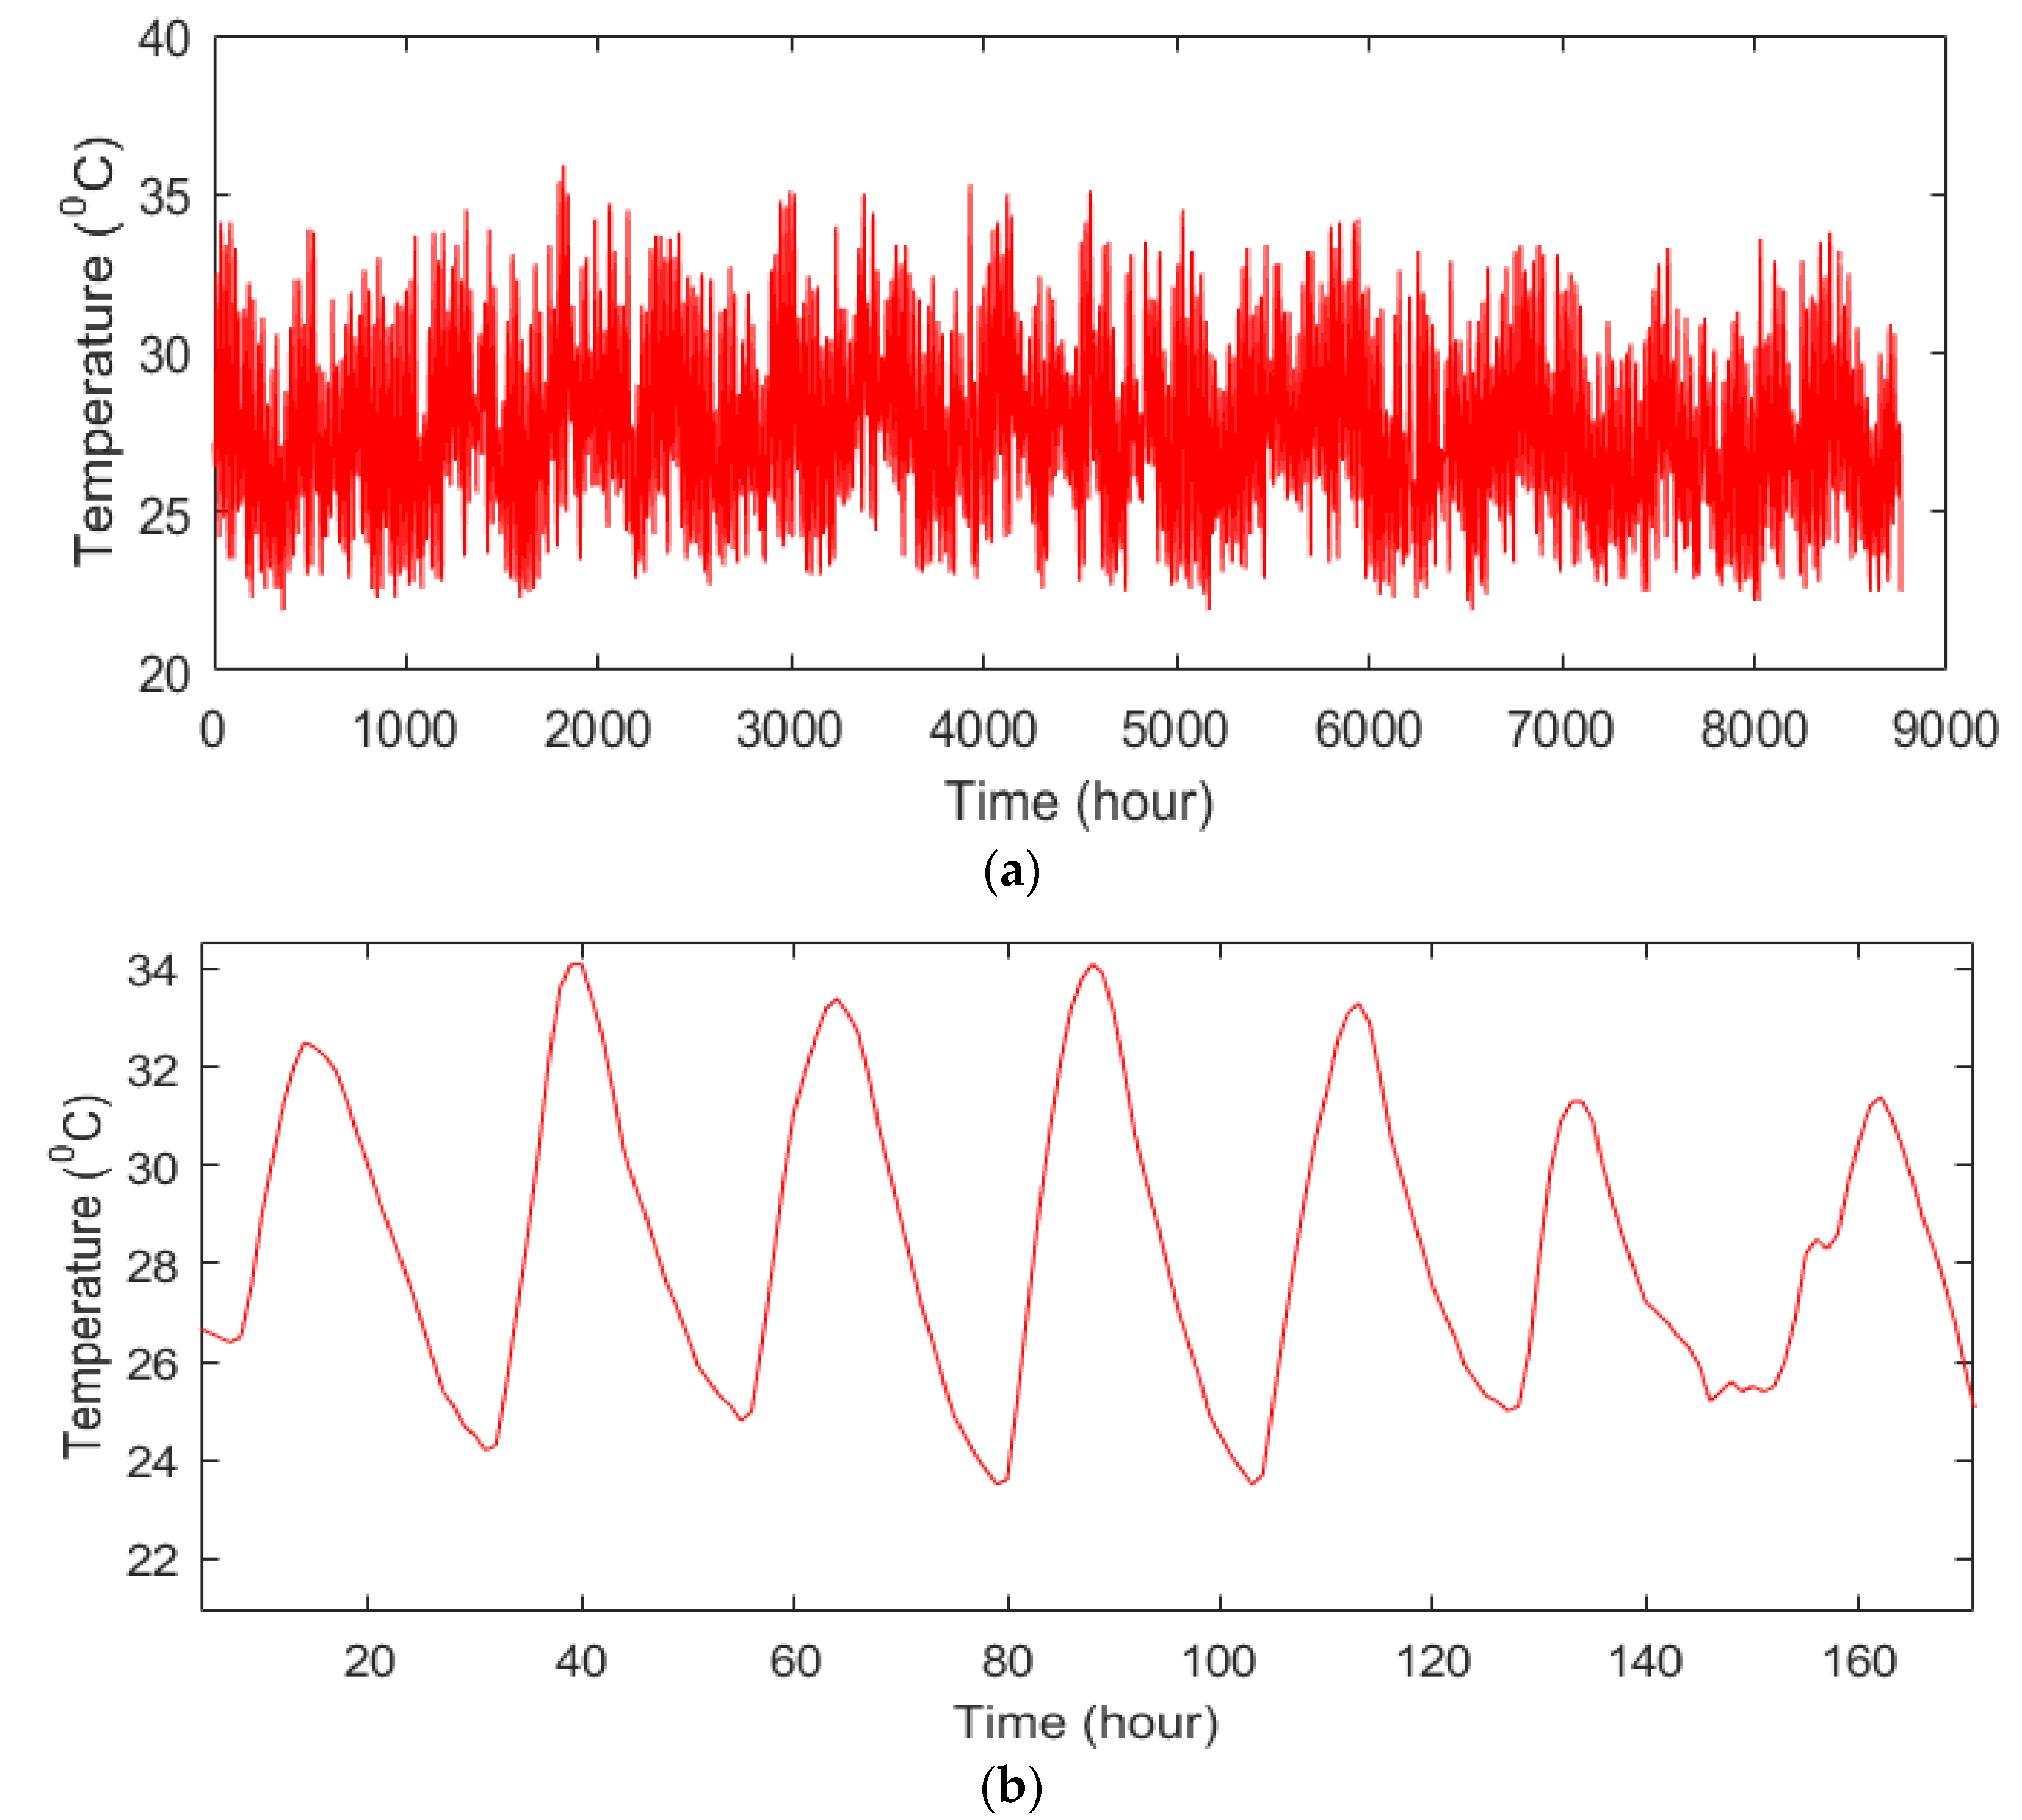
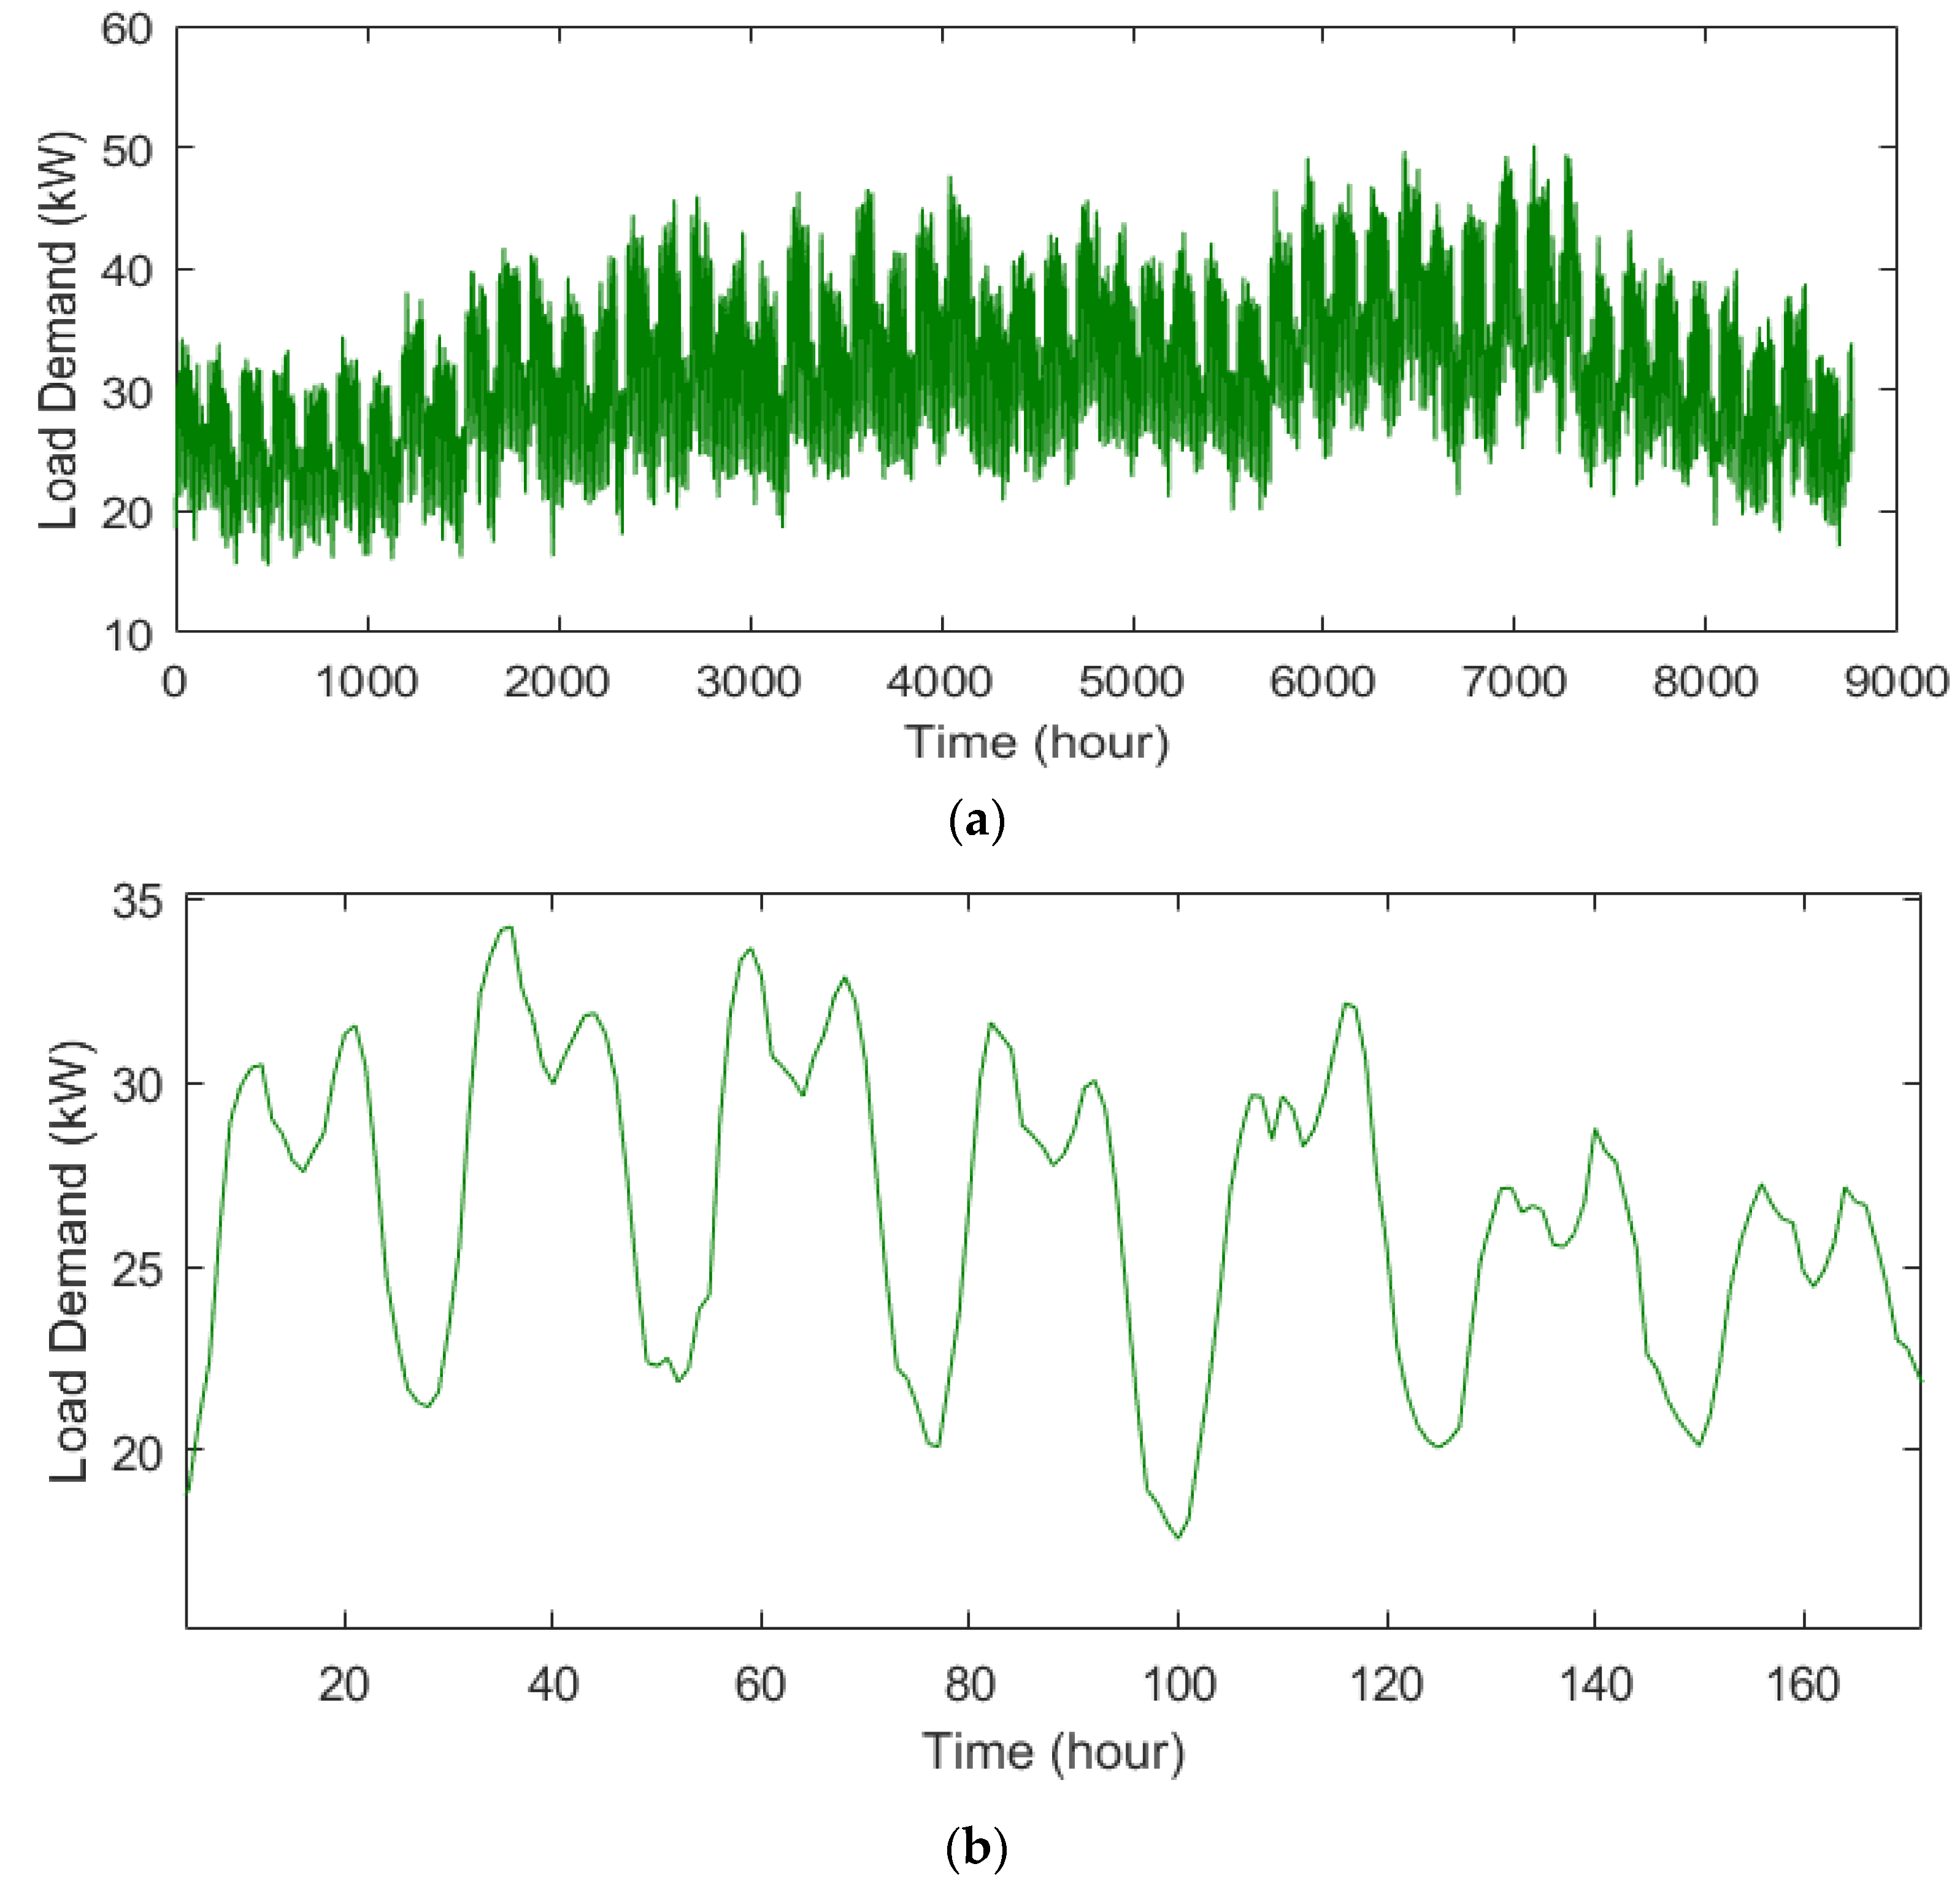
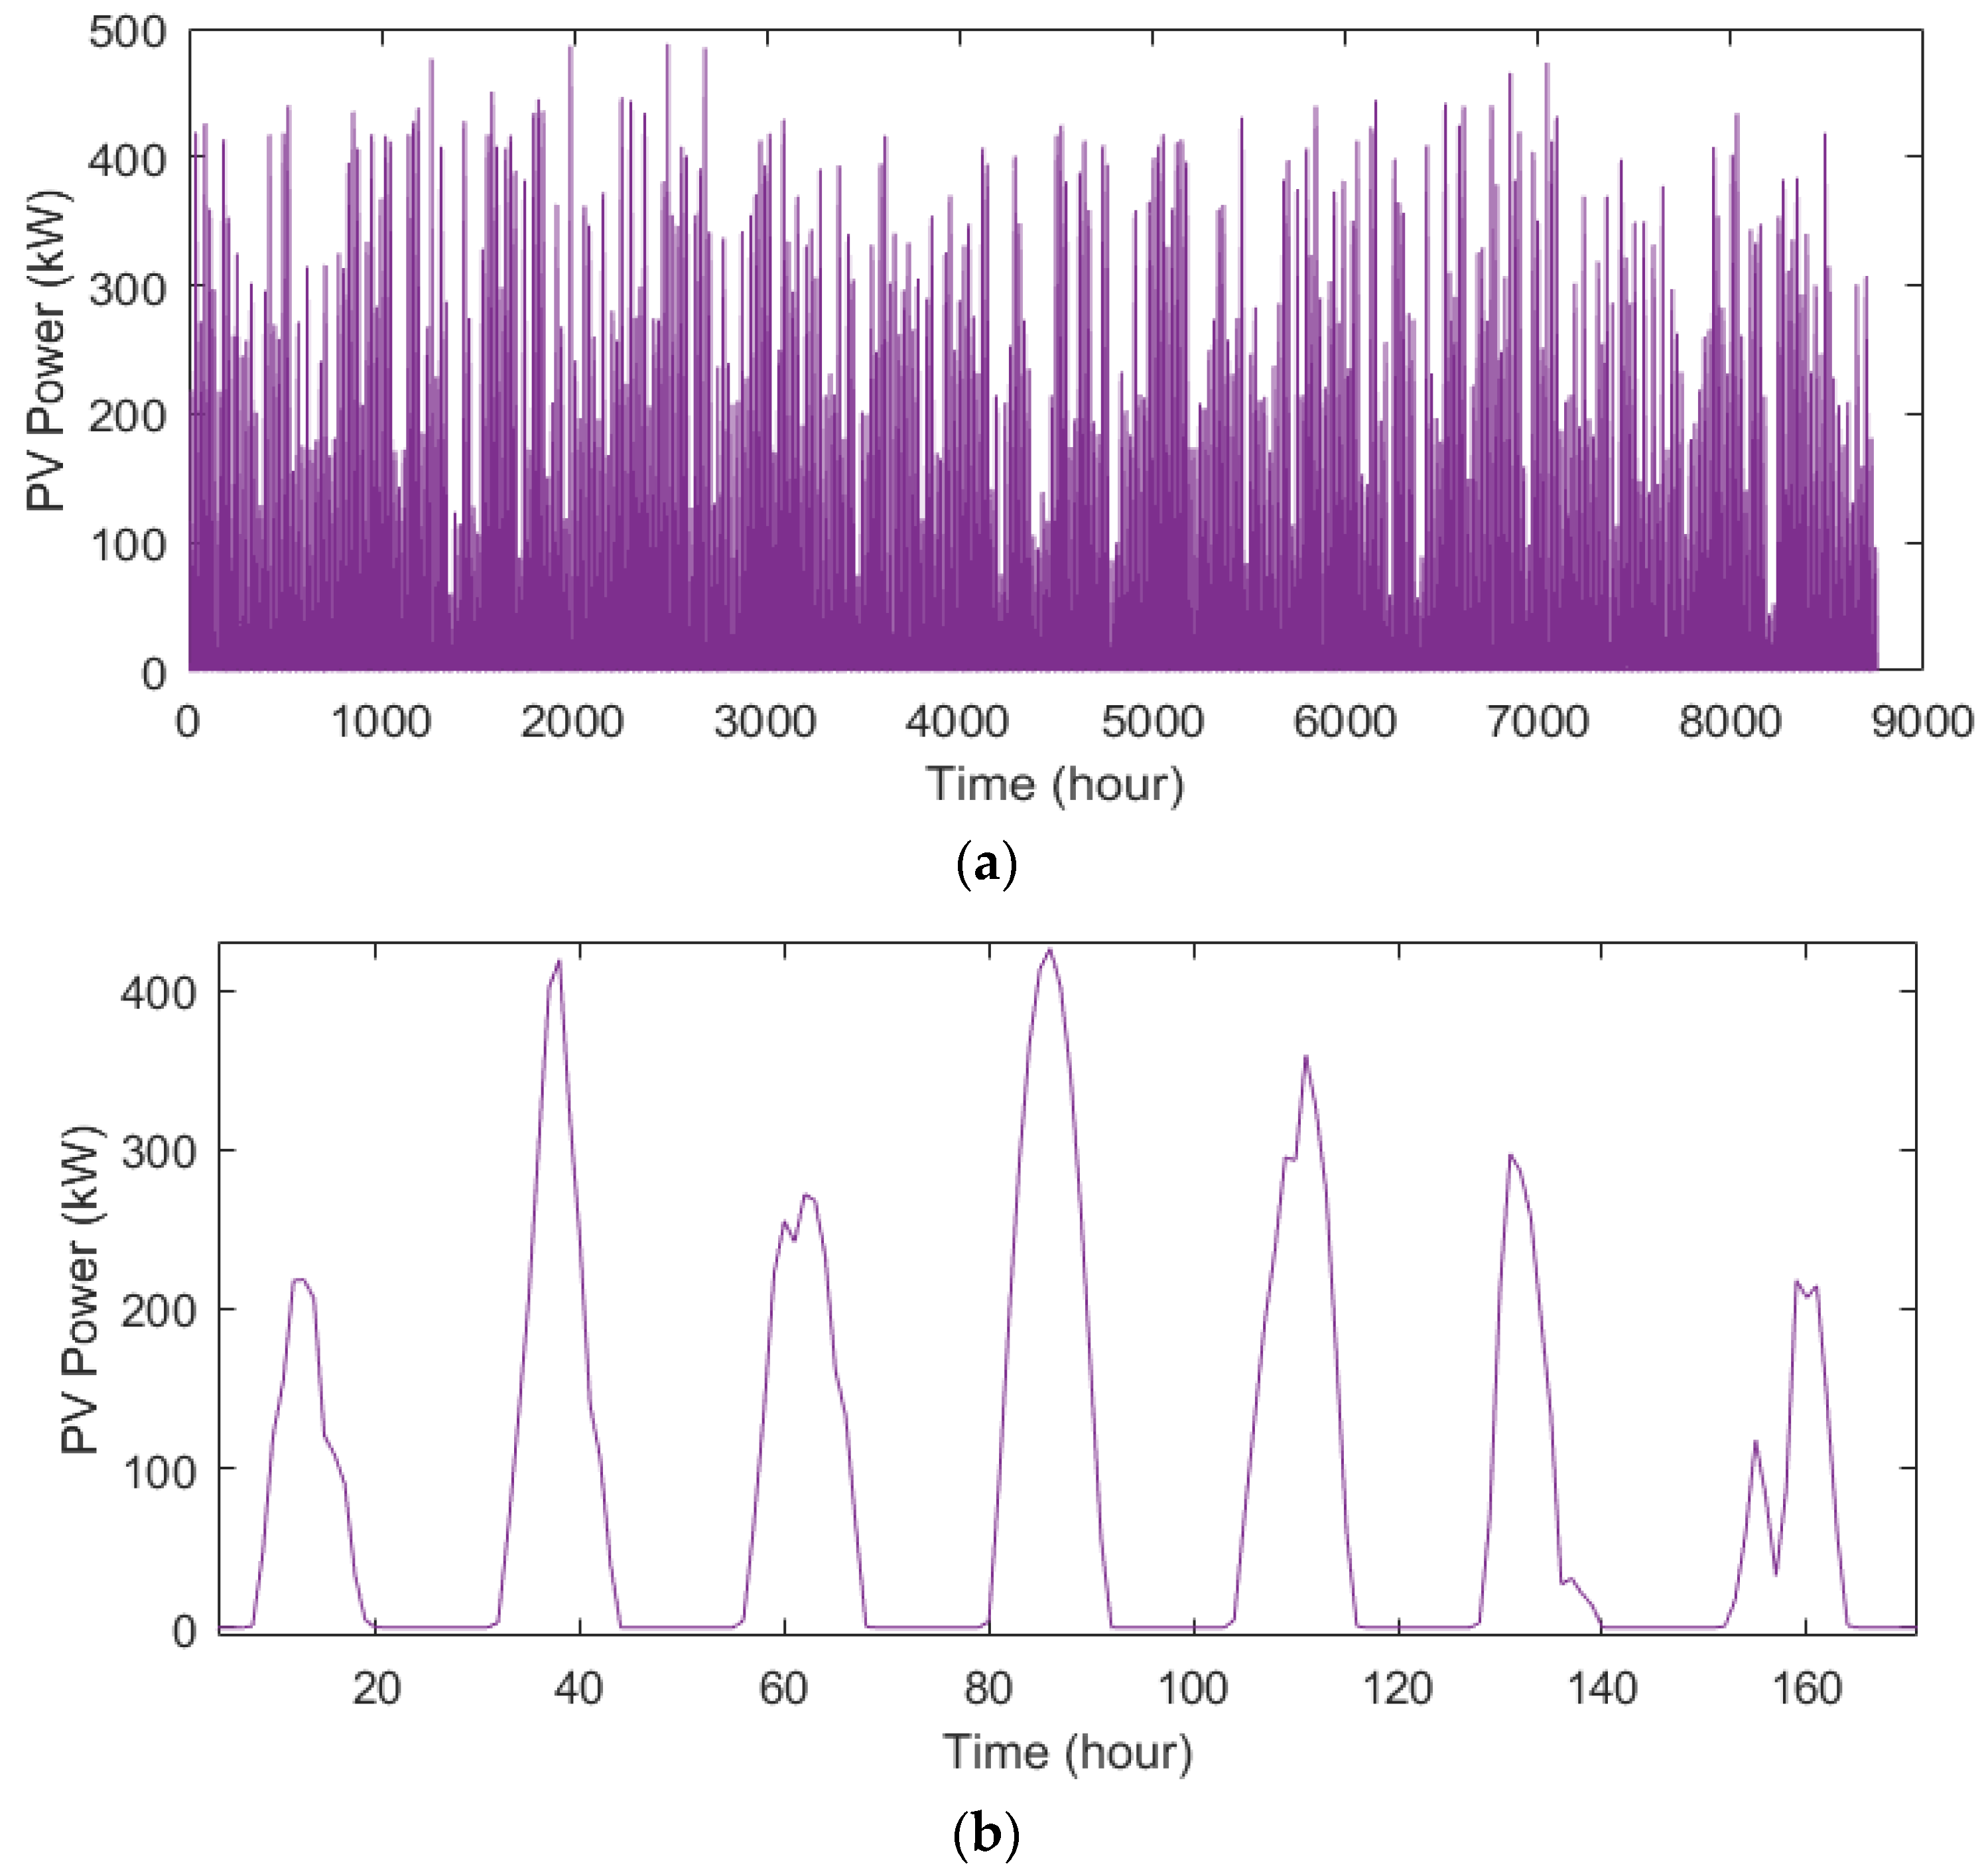
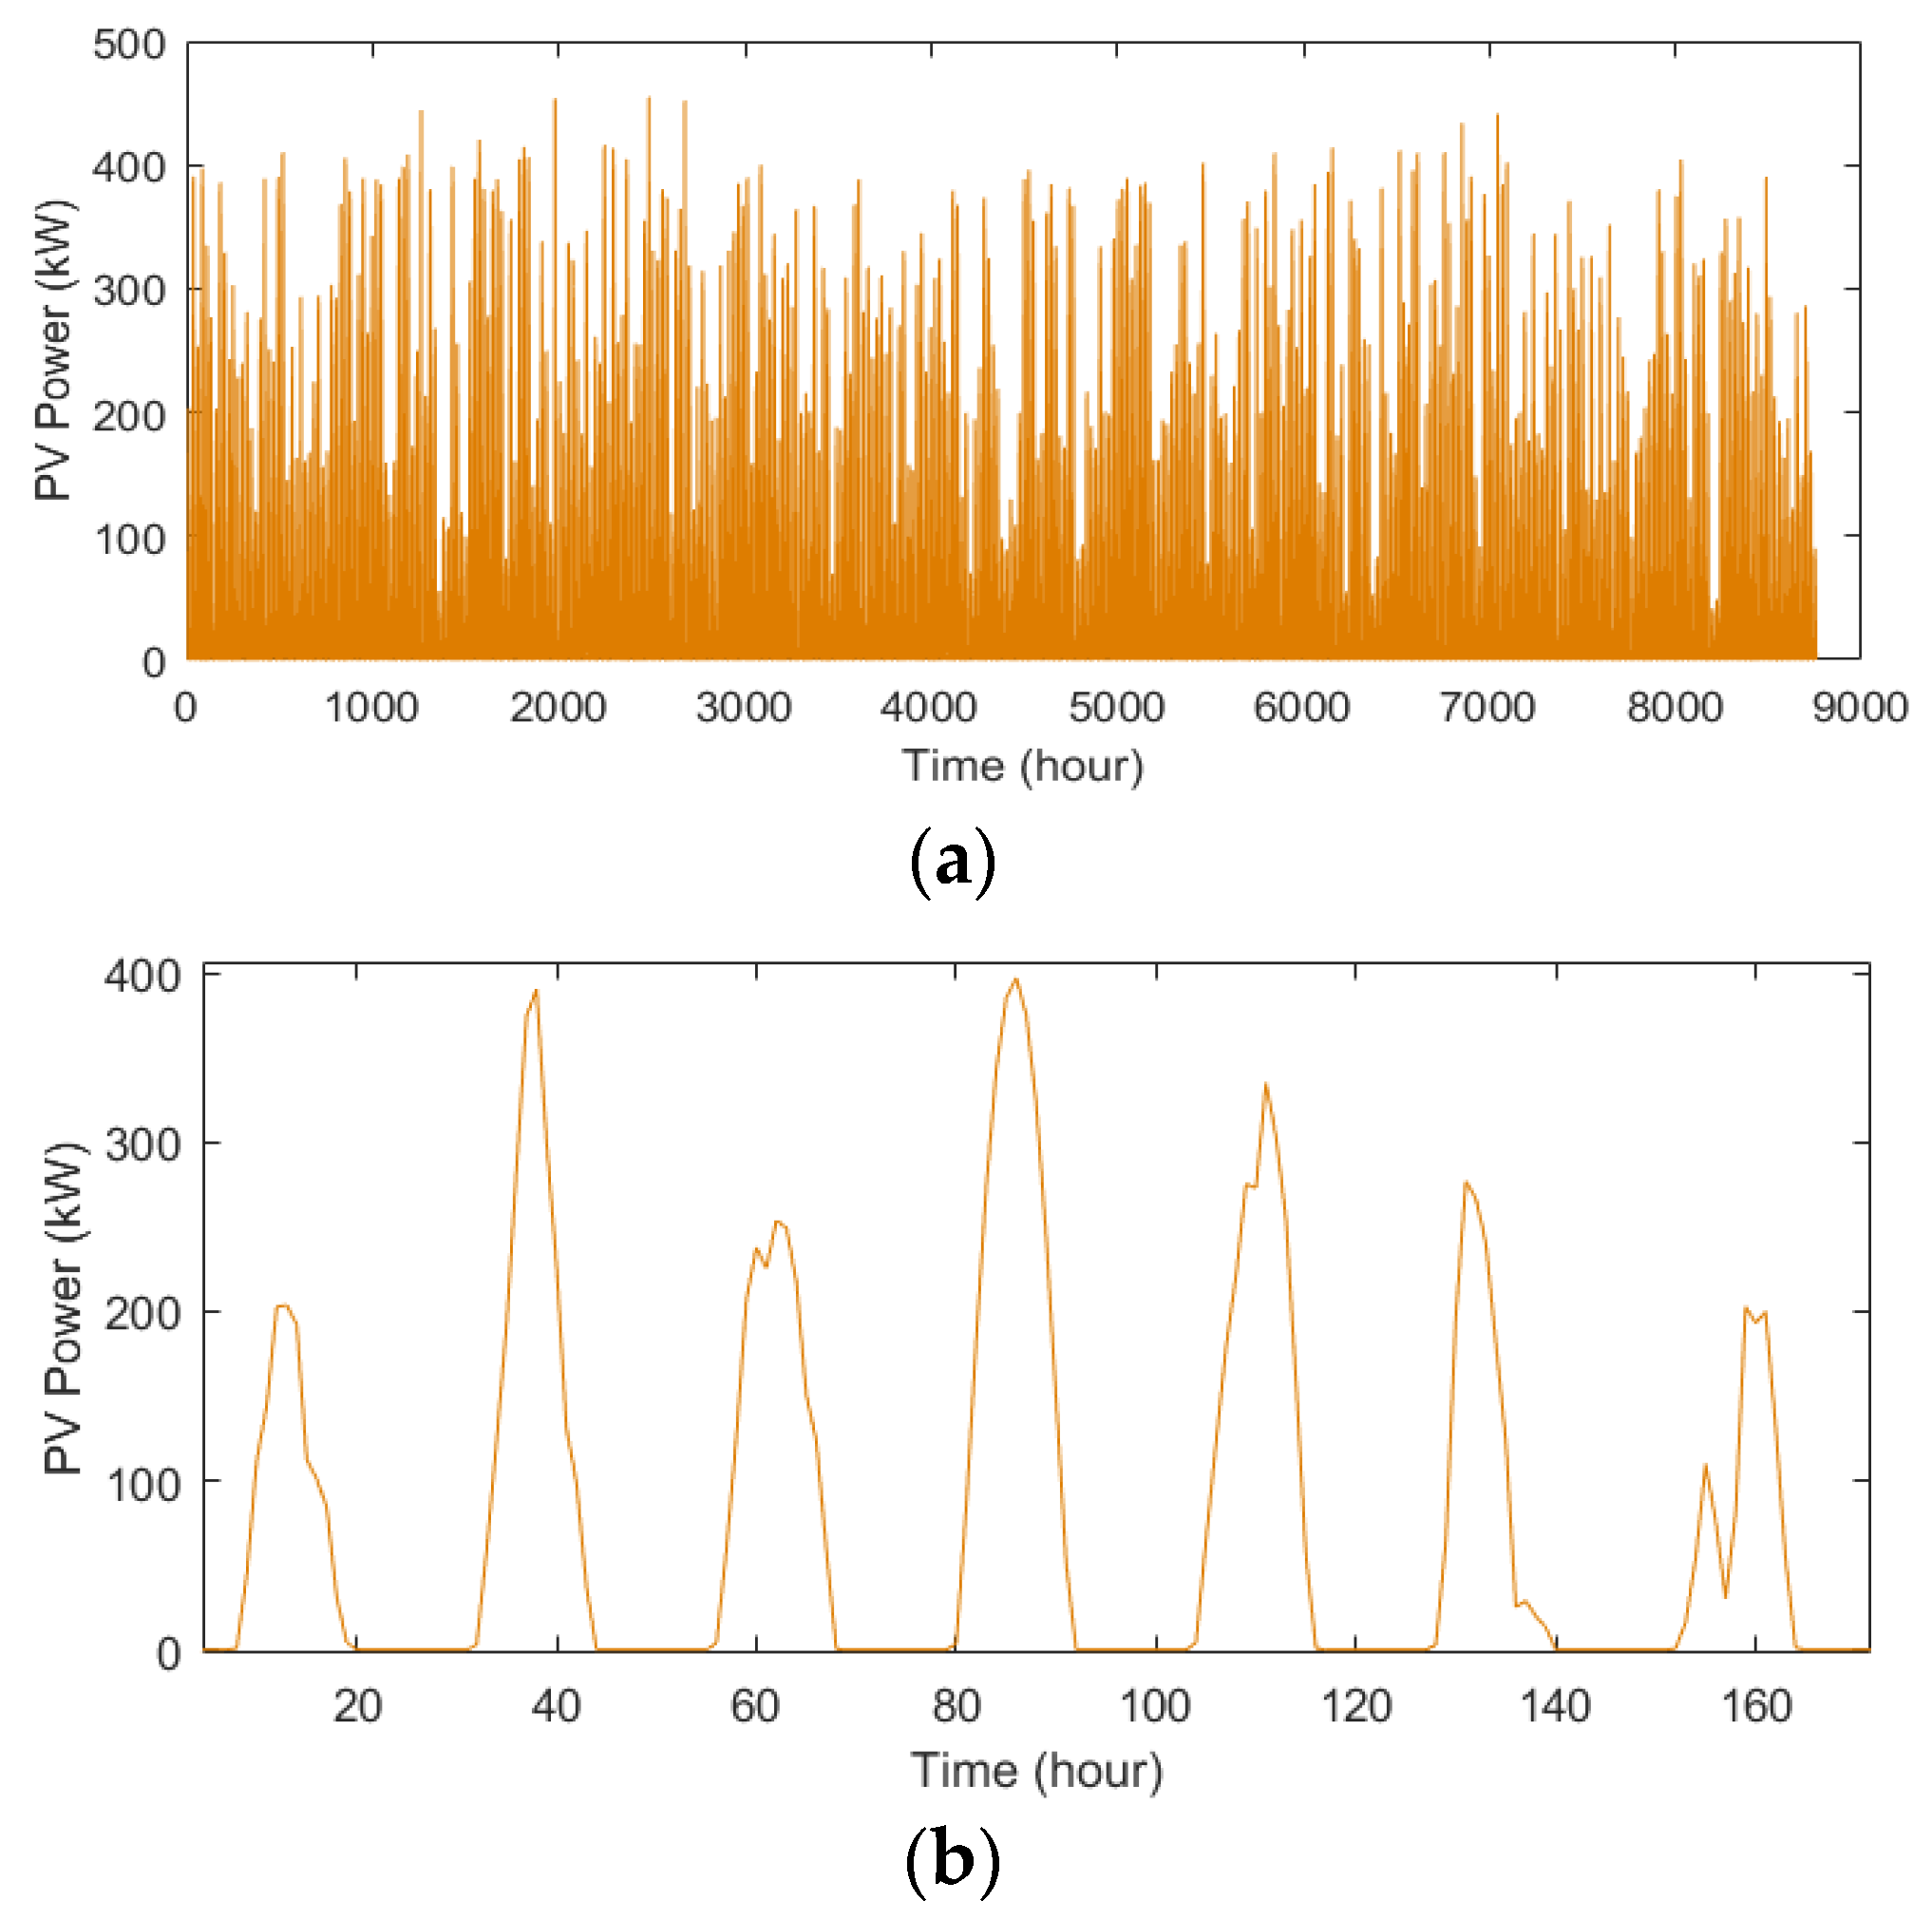
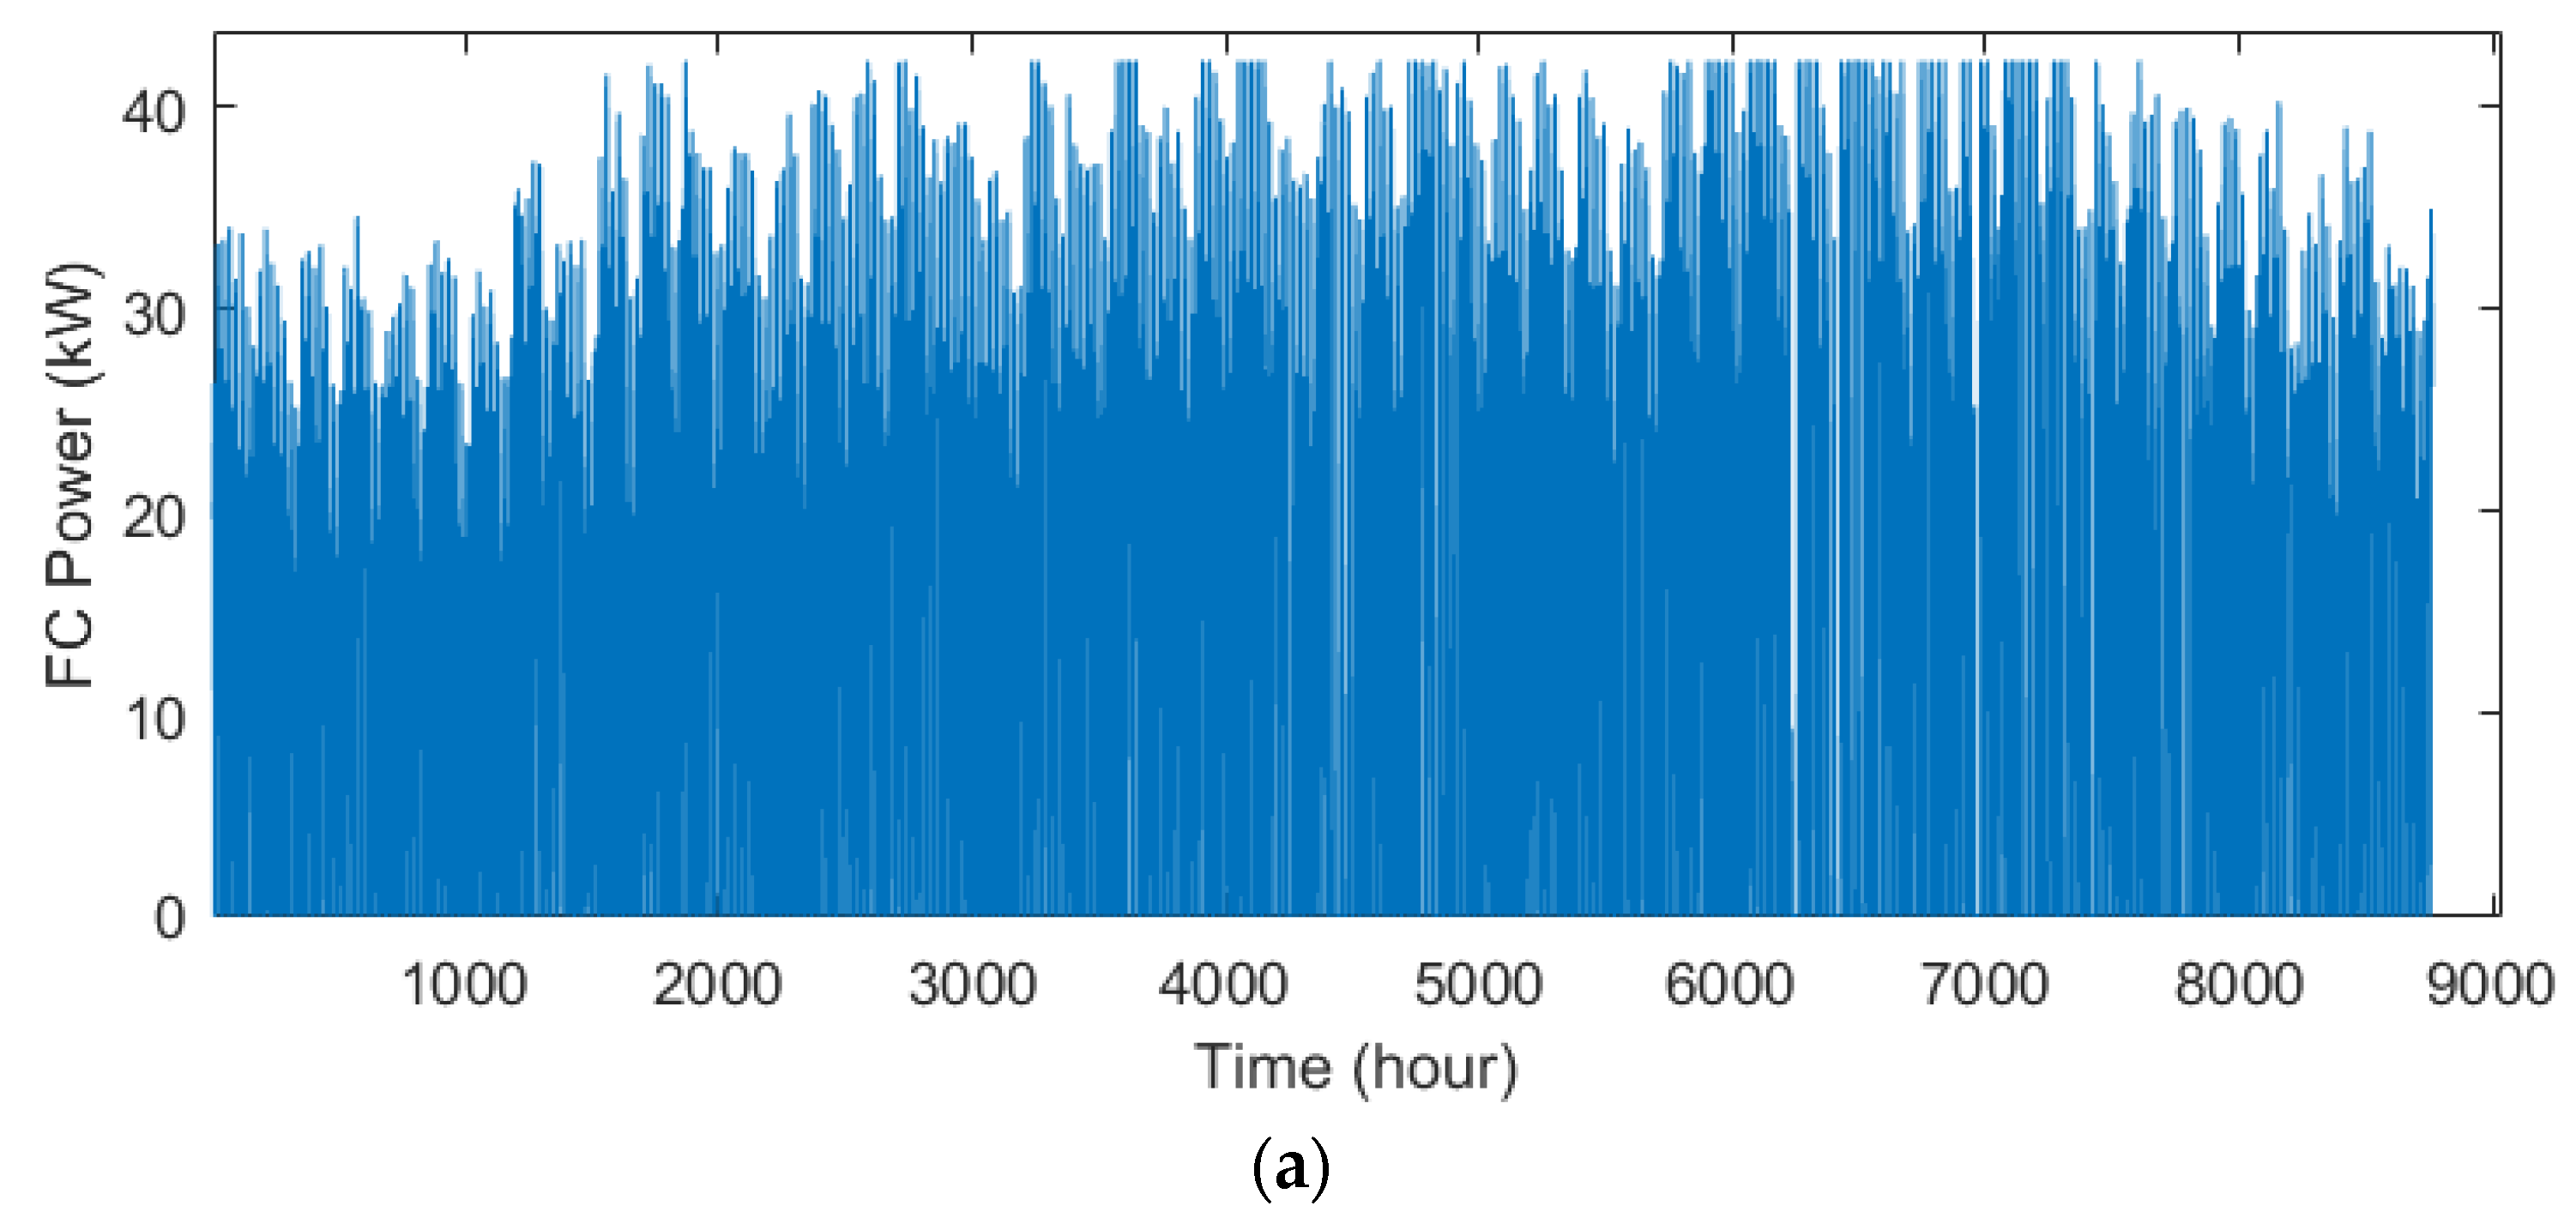
6.1. Hybrid System Data

In this study, the design problem relies on practical data on the irradiance and ambient temperature for Kuala Lumpur (3.1569° N, 101.7123° E) in Malaysia [34,35]. The average monthly minimum and maximum radiation are reported in November and April, with values of 3.99 kW and 4.92 kW, respectively. The annual and hourly profiles of the irradiance and ambient temperature for Kuala Lumpur are shown in Figure 3 and Figure 4, respectively [34,35]. In Figure 5, the load demand curve of the residential complex is presented with a peak load of 50 kW. In this study, the design of a hybrid system based on a fuel cell has been implemented based on Ref. [15].
Table 1 reports the technical and economic specifications of the HES equipment.

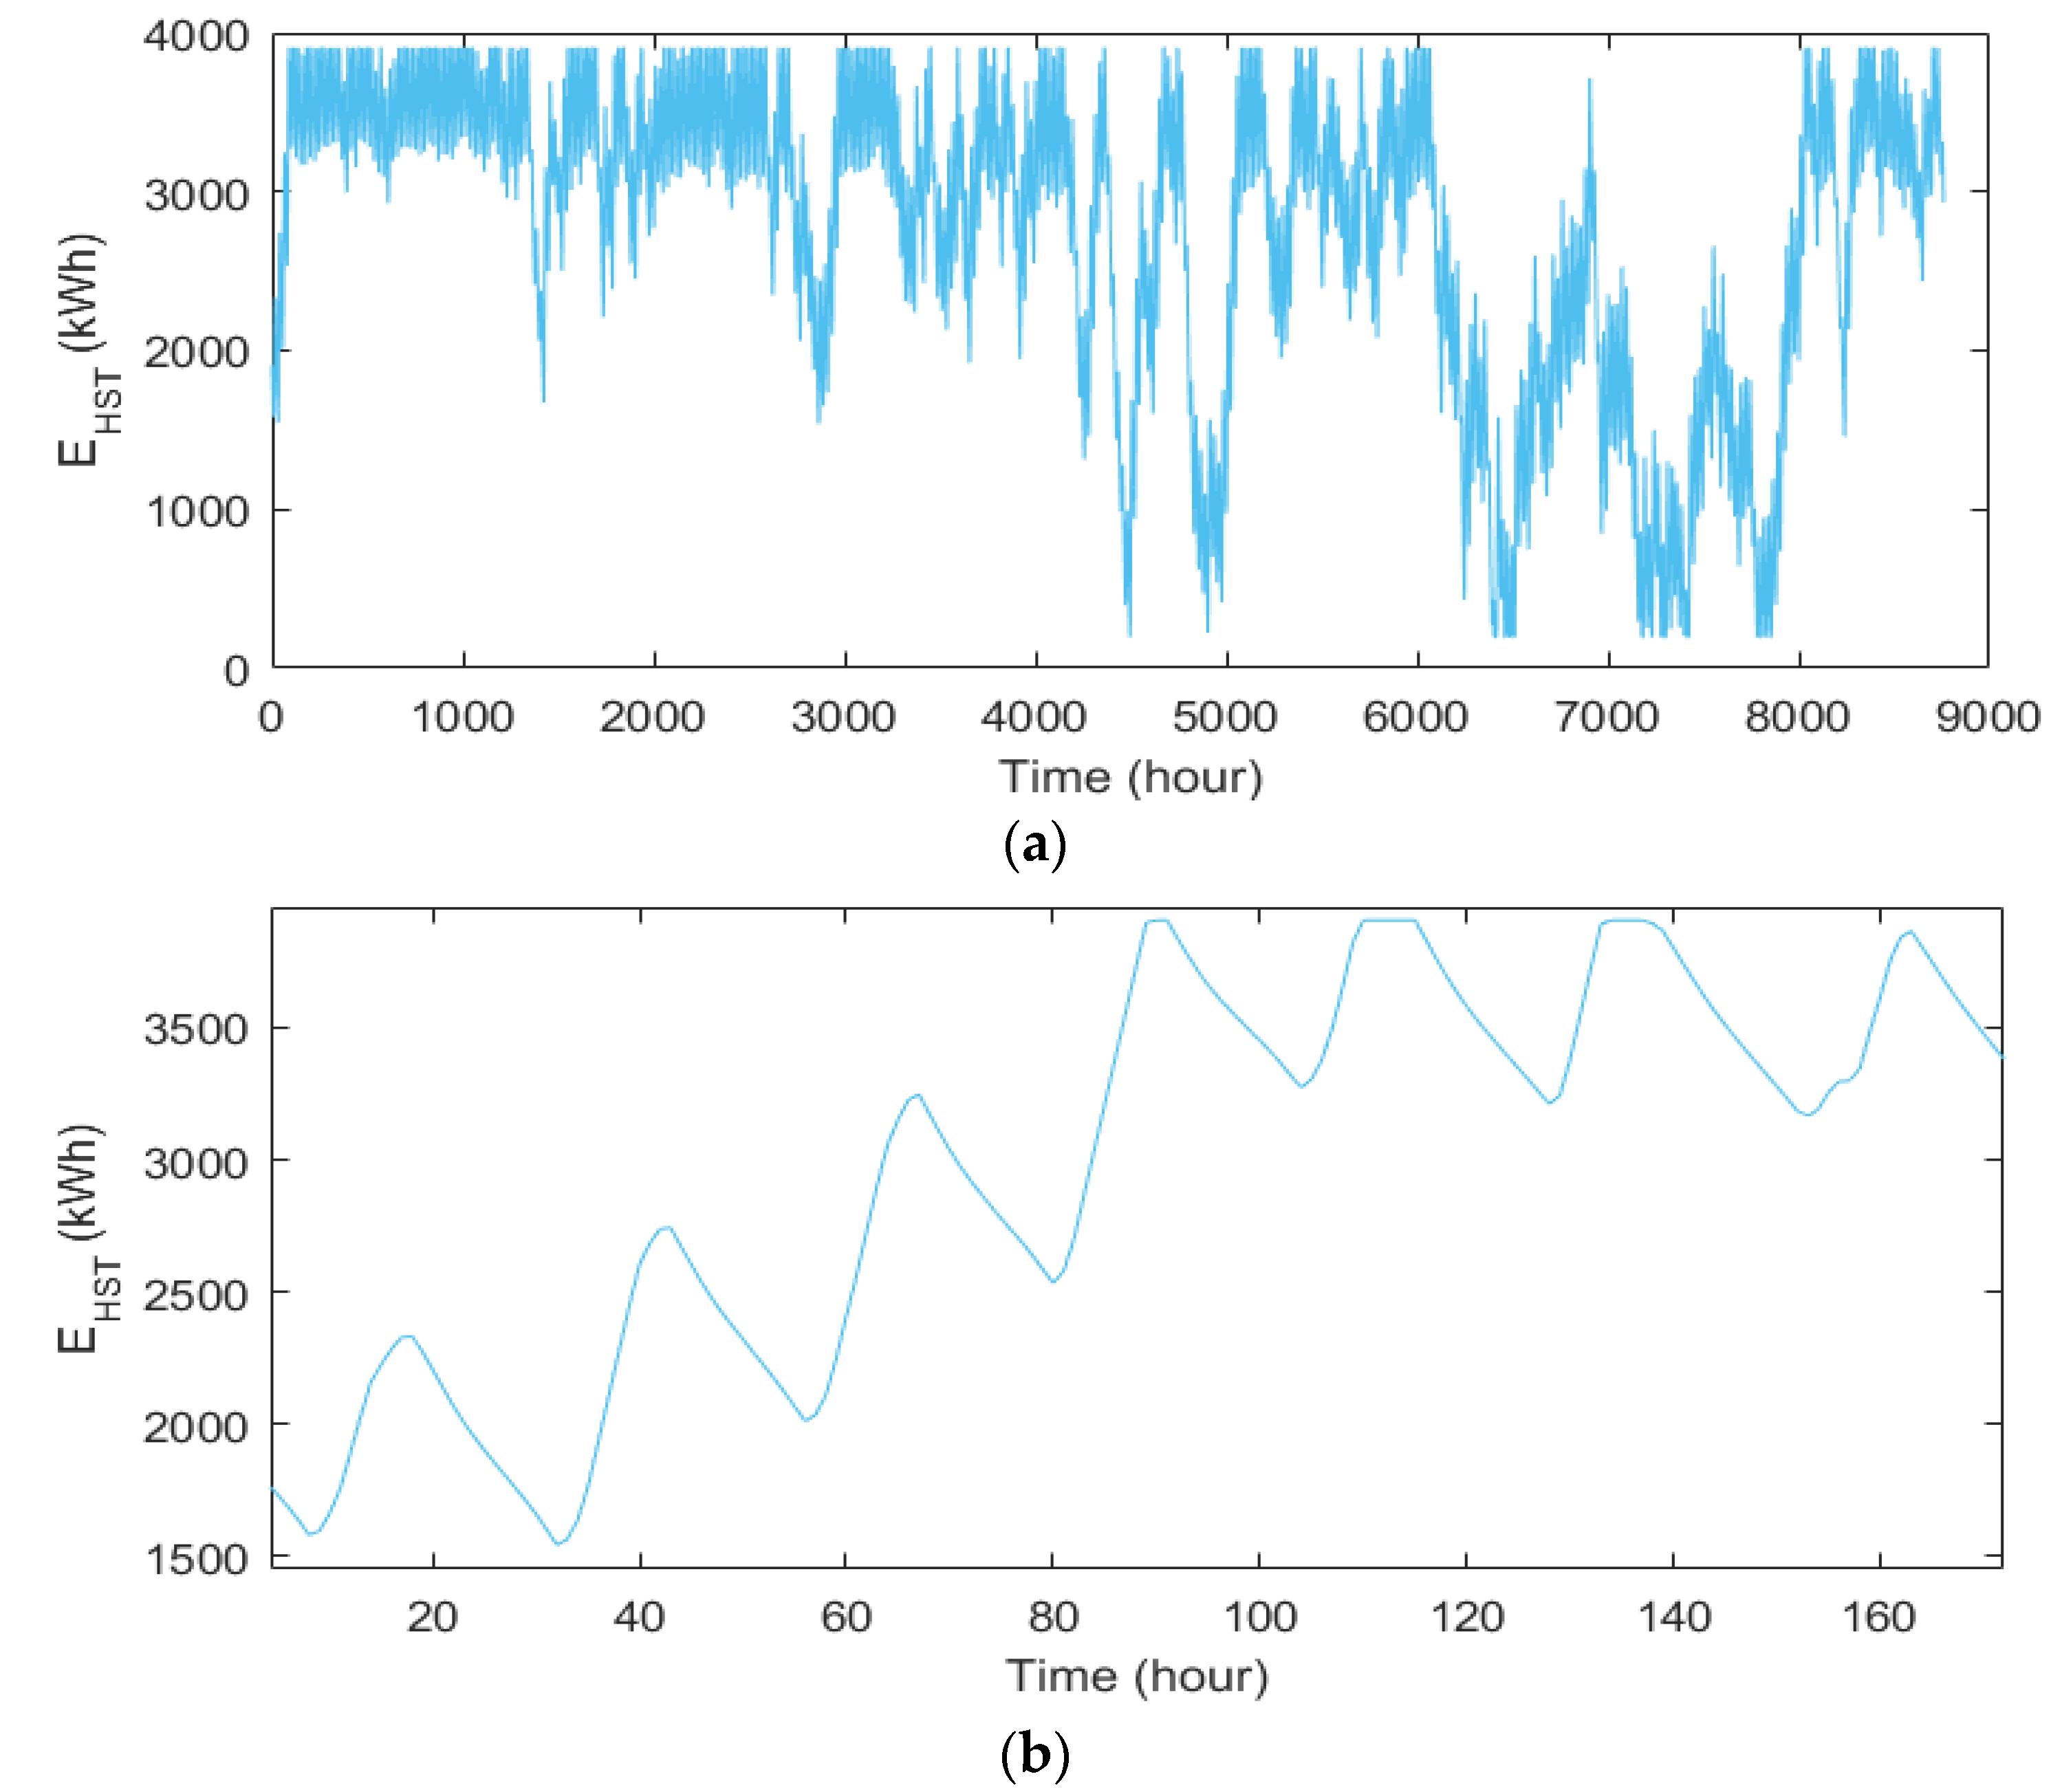
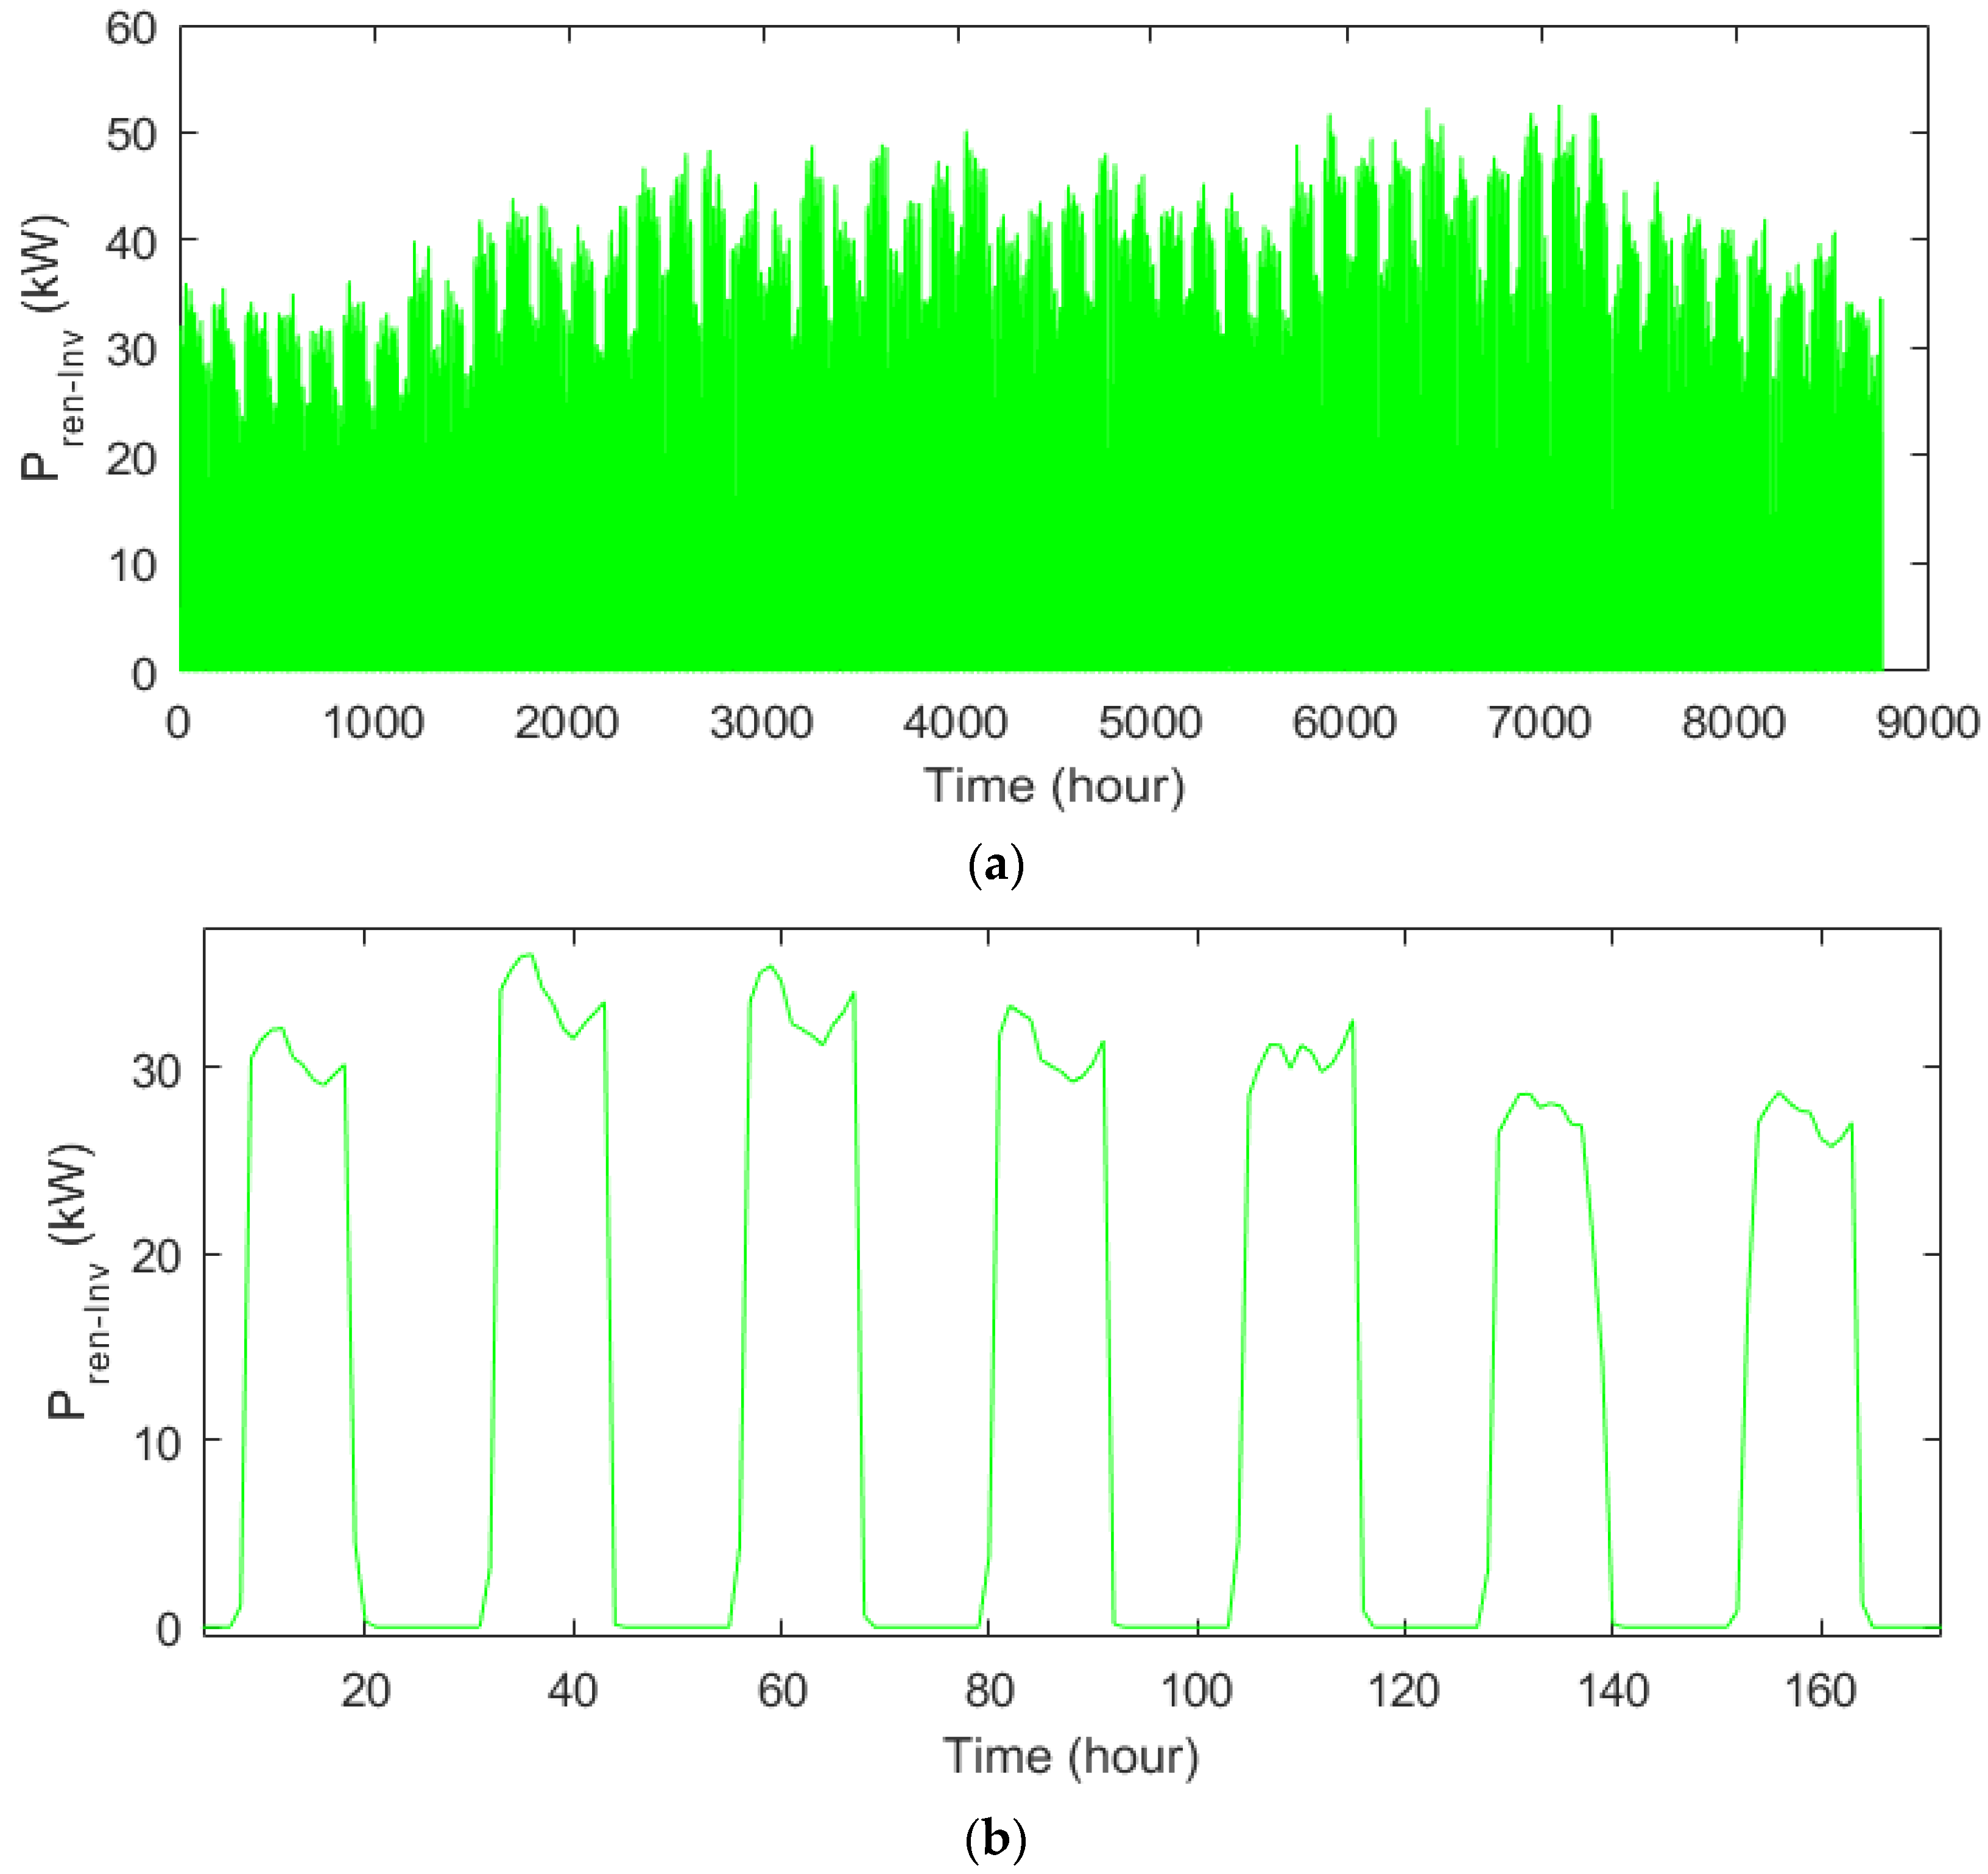
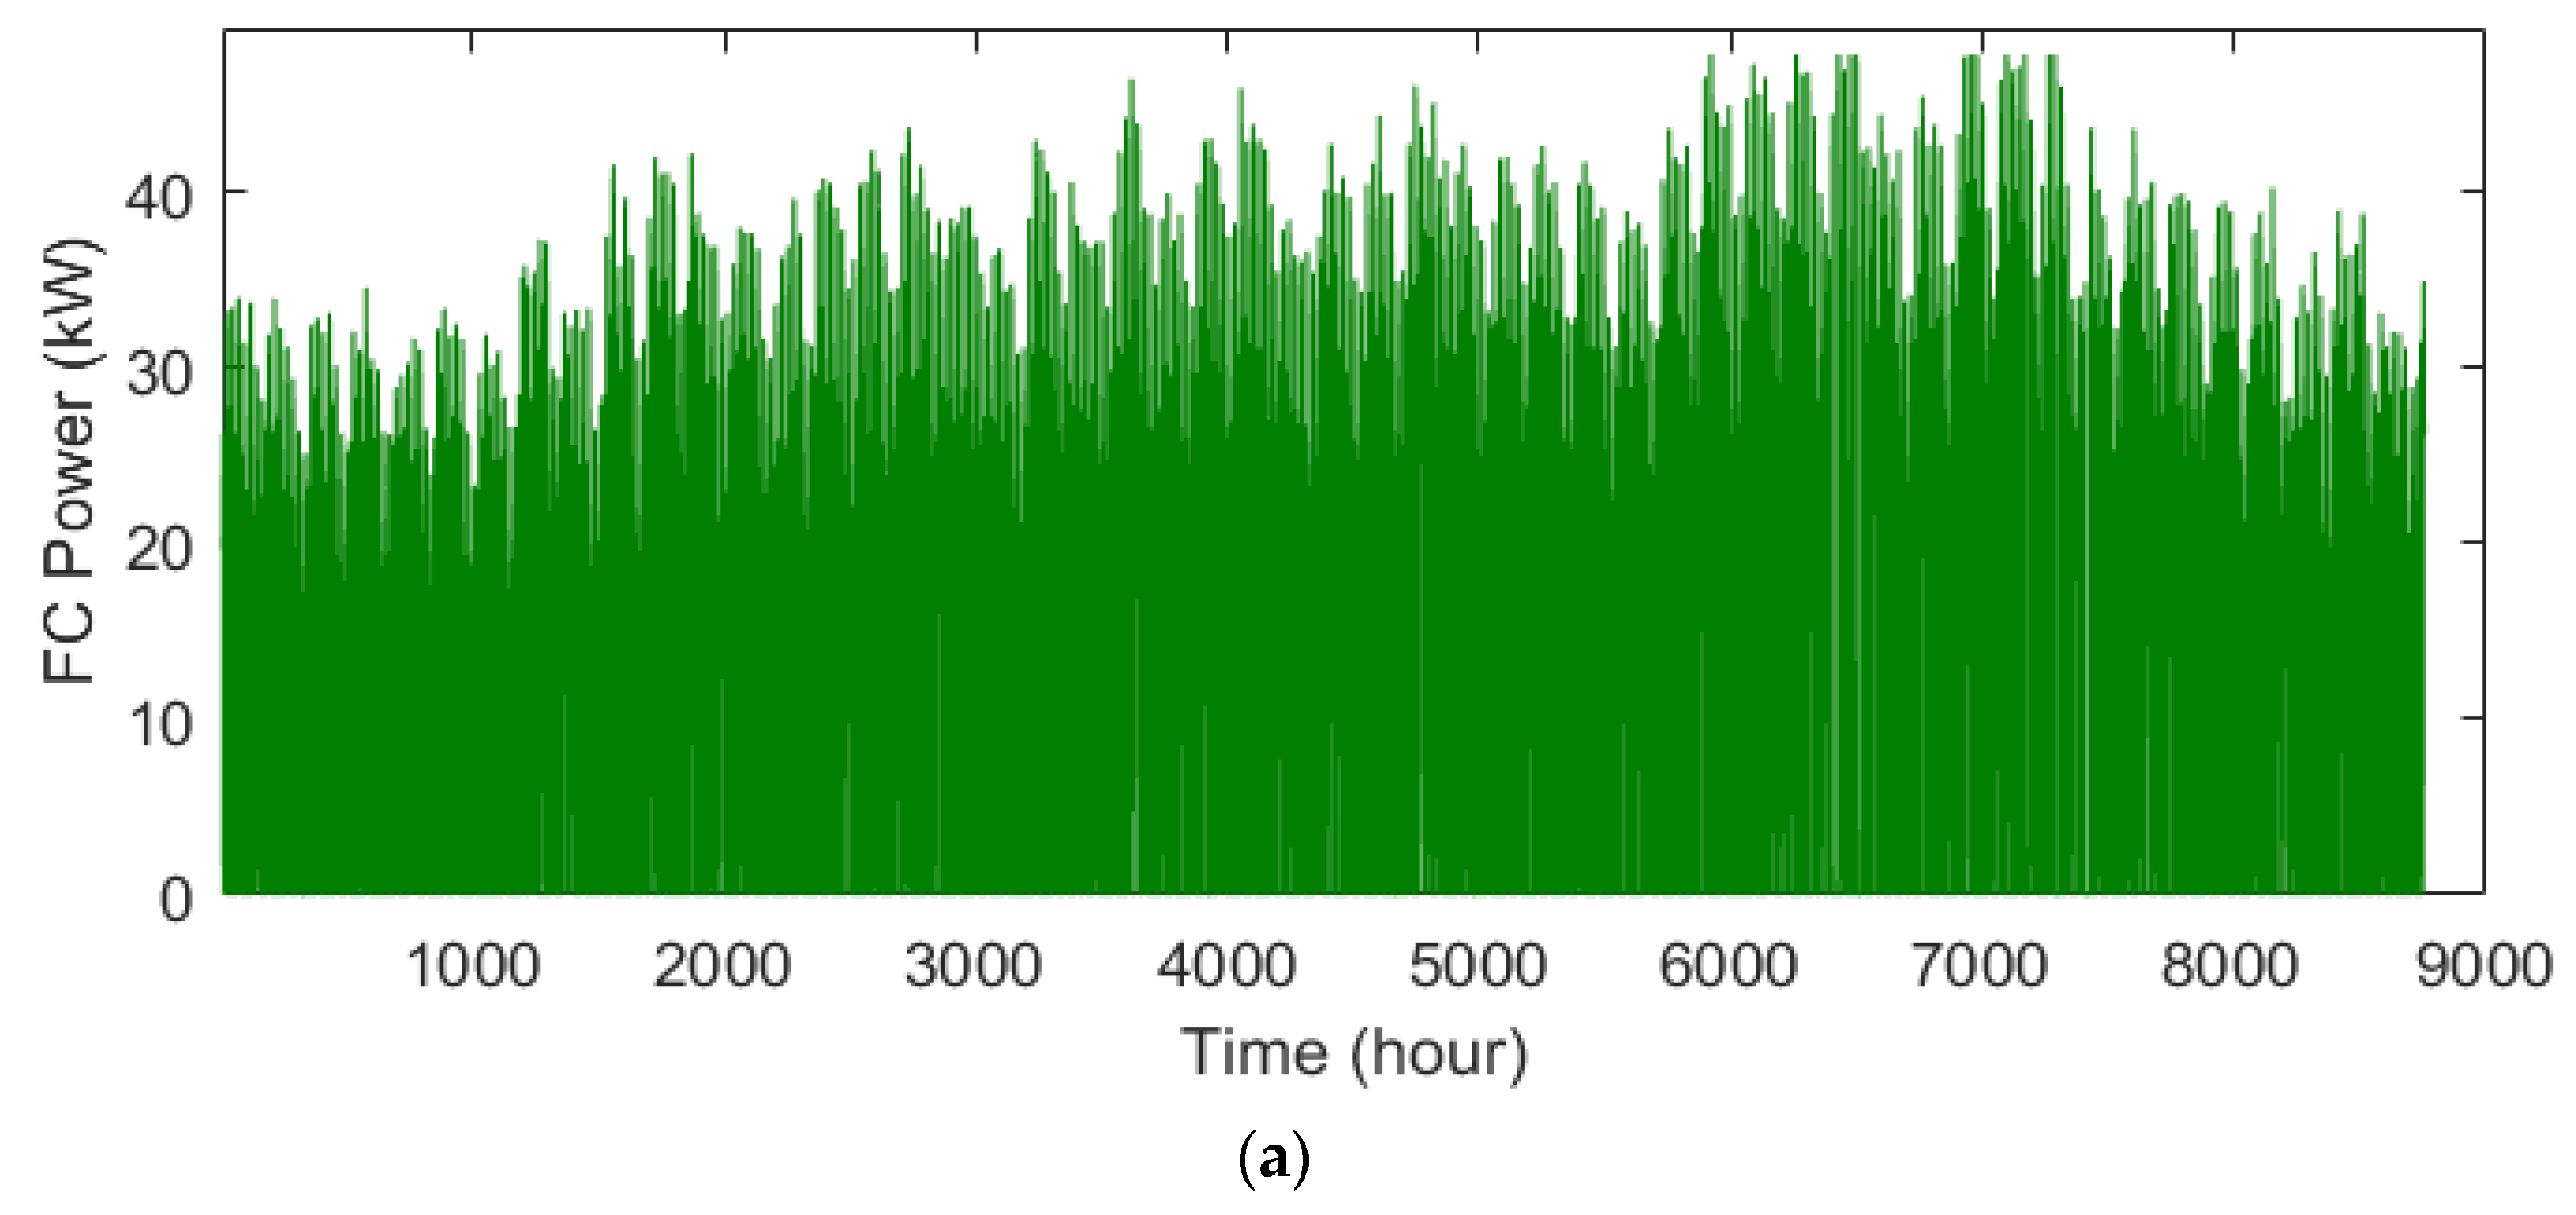
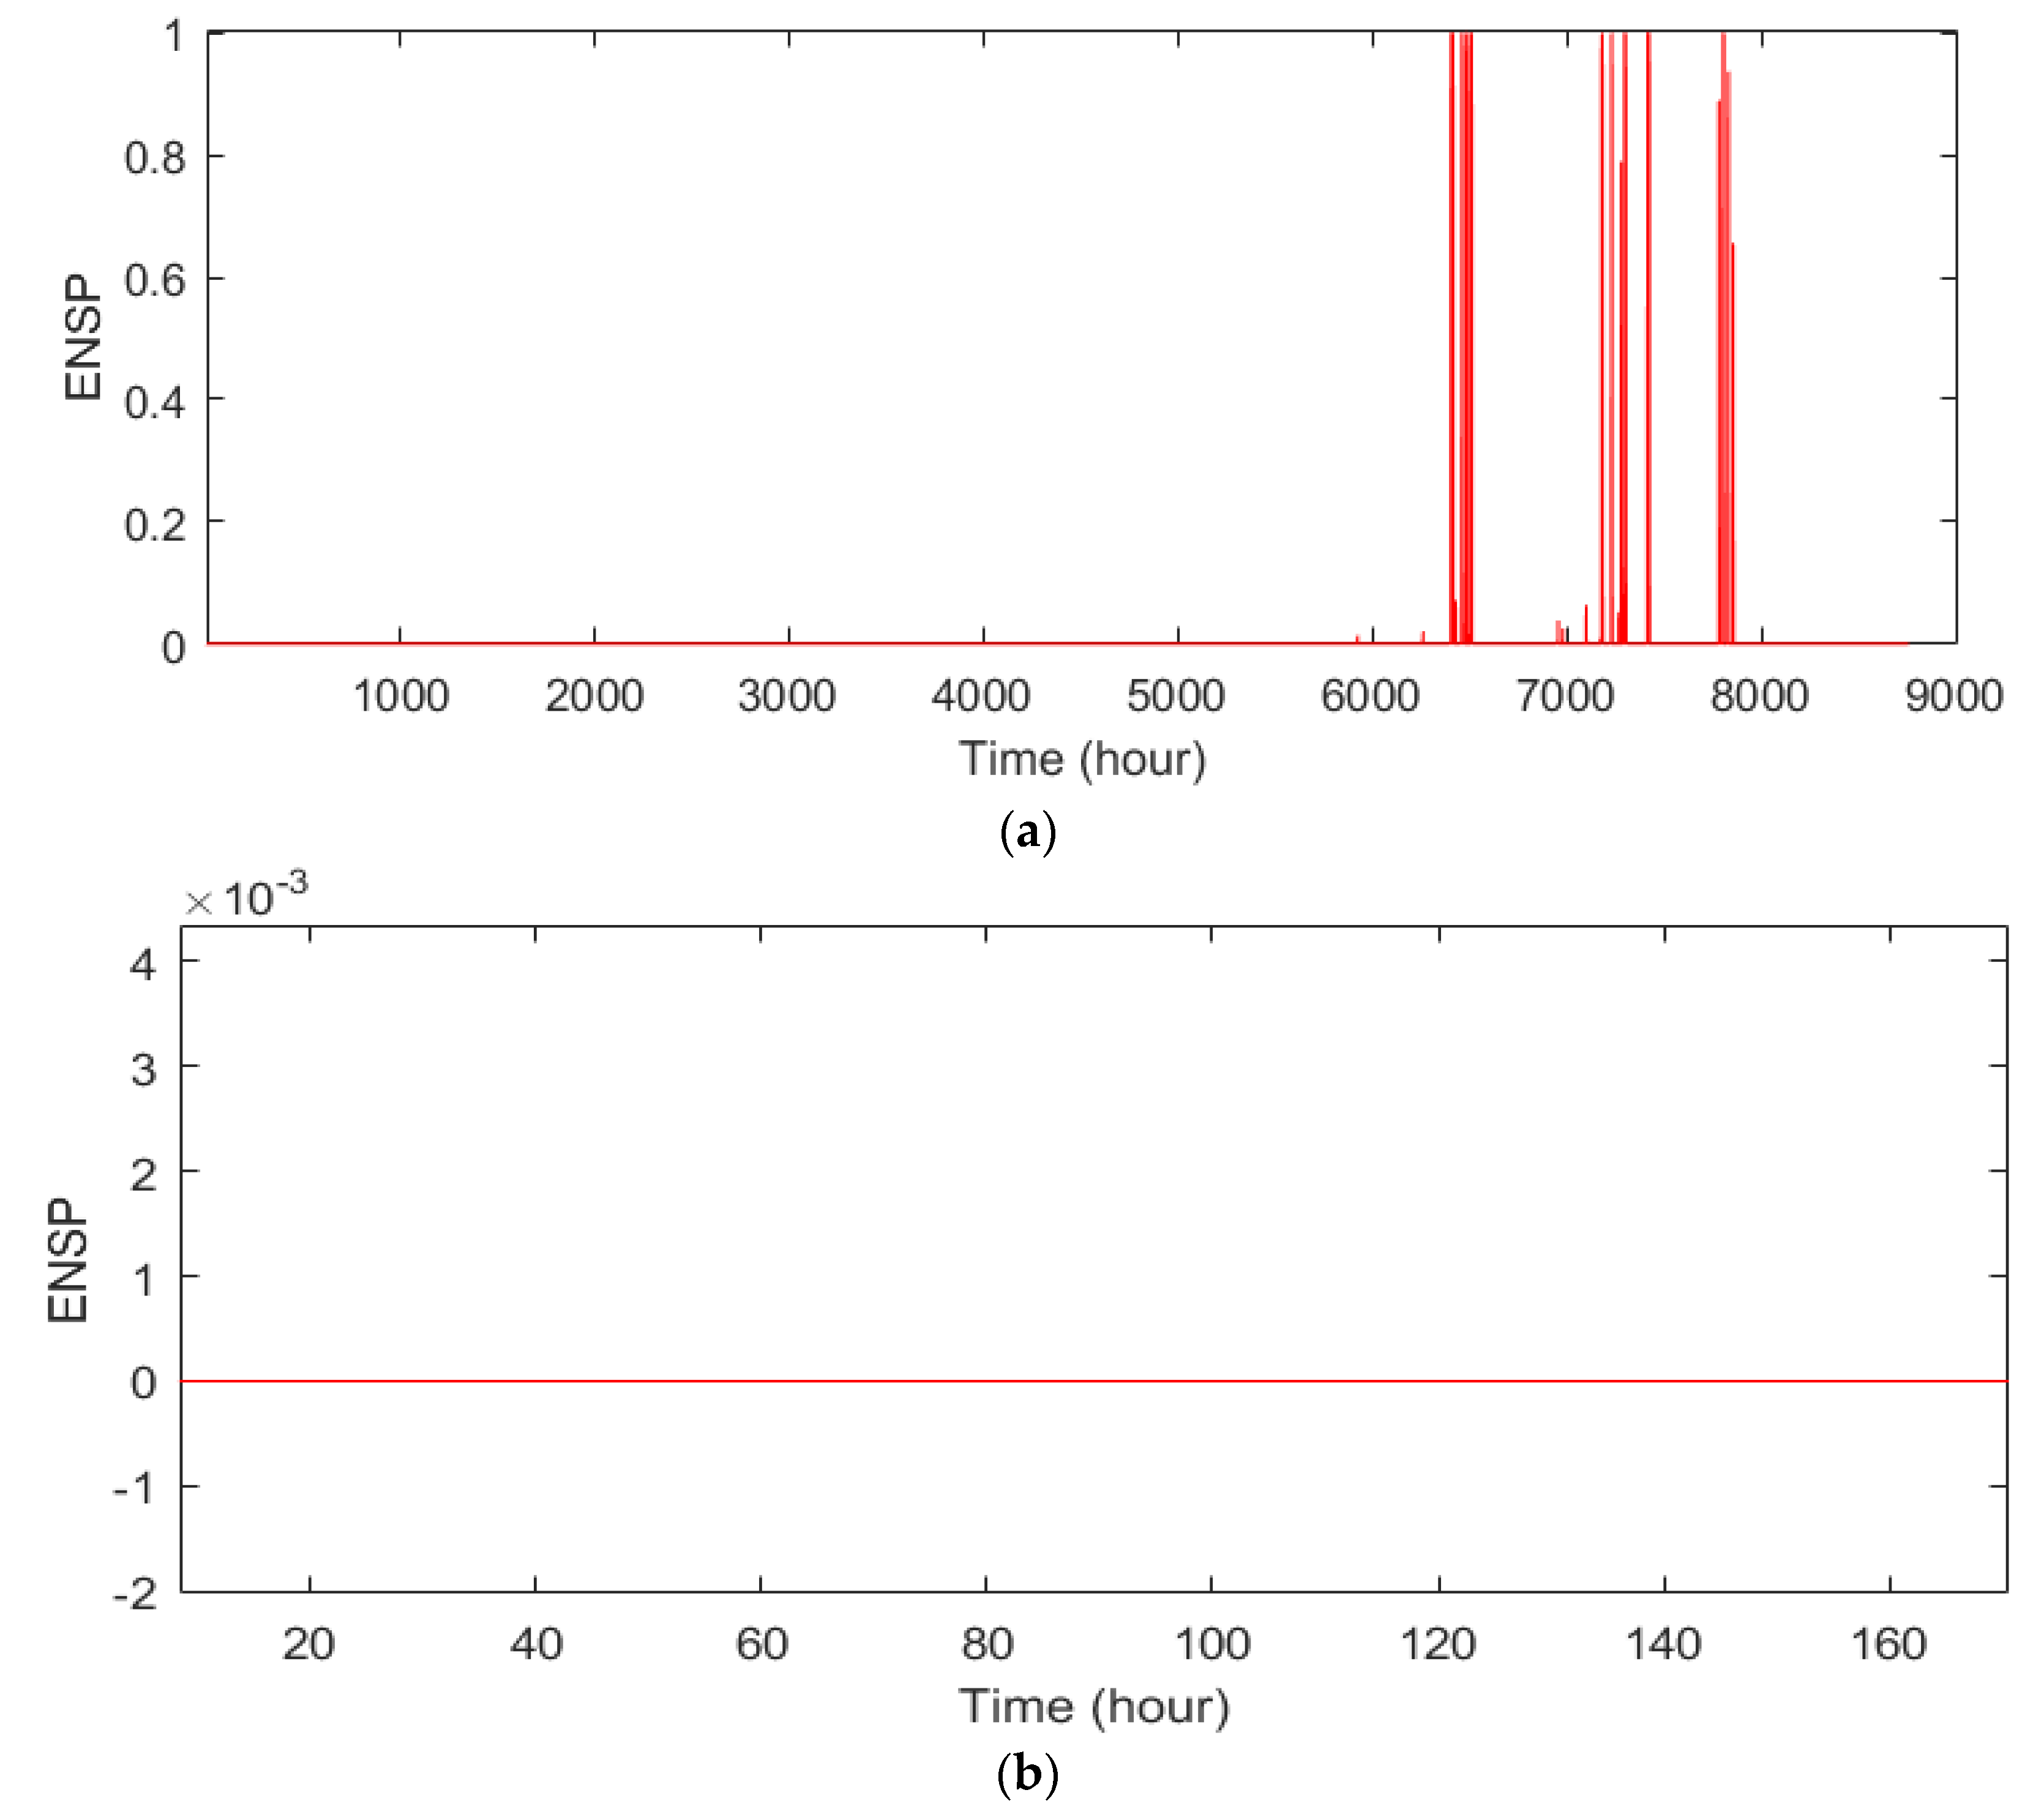
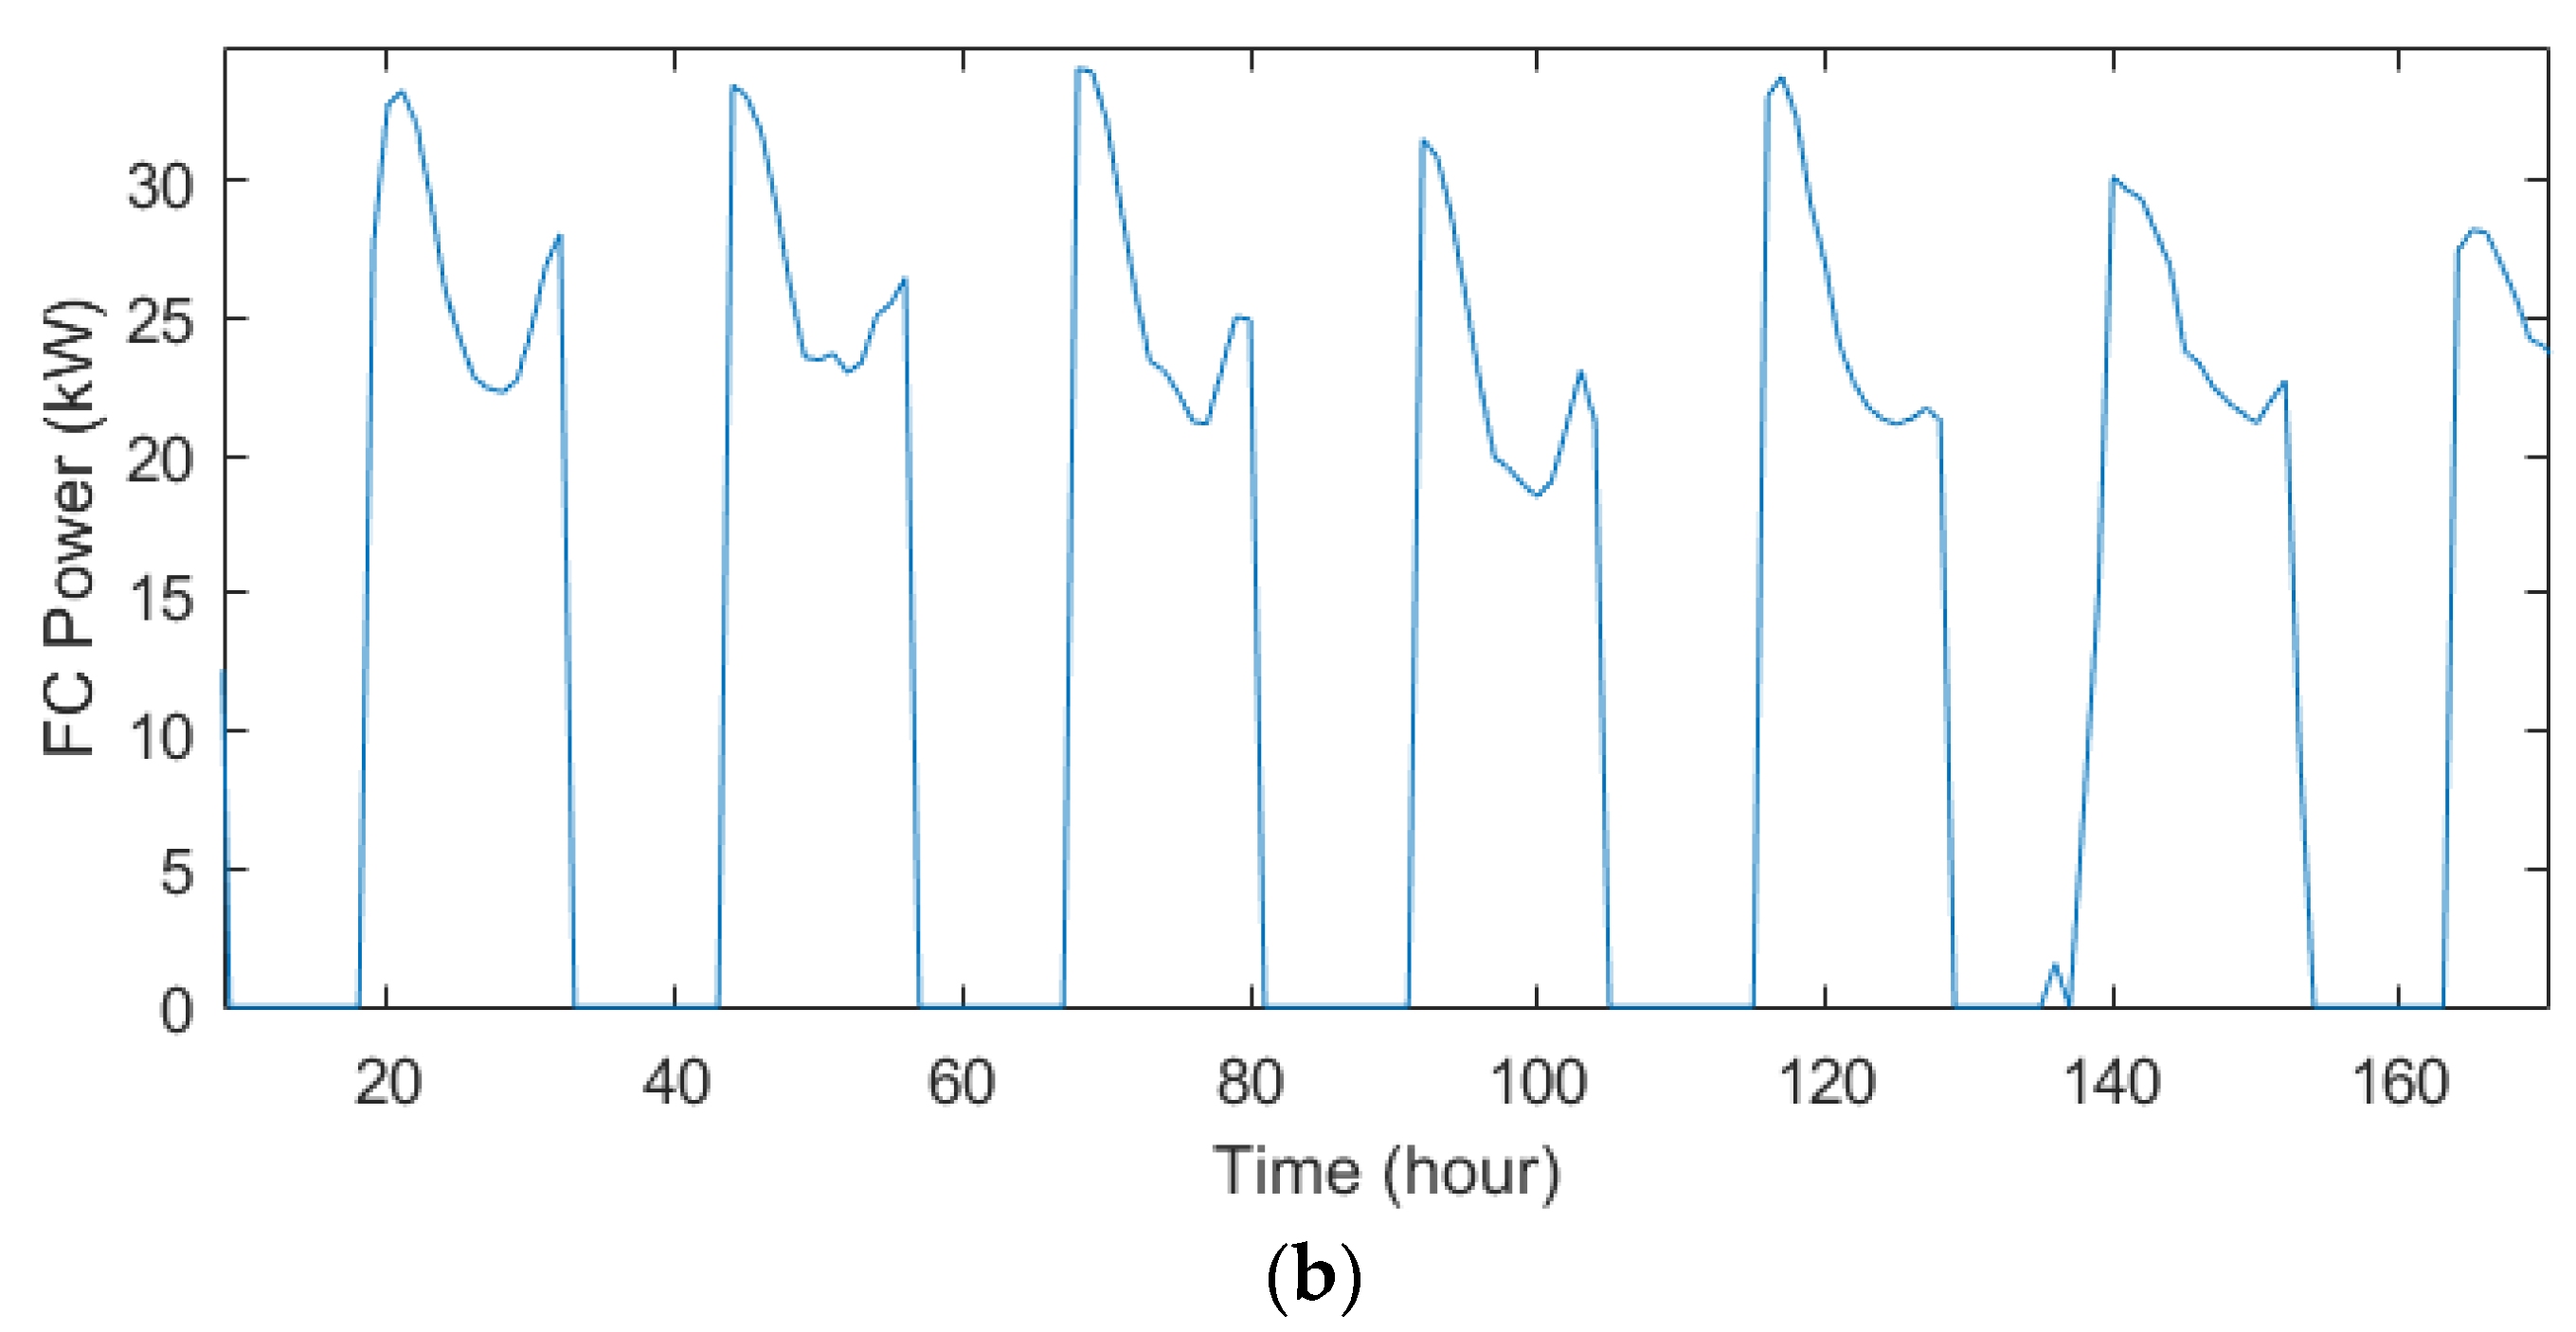
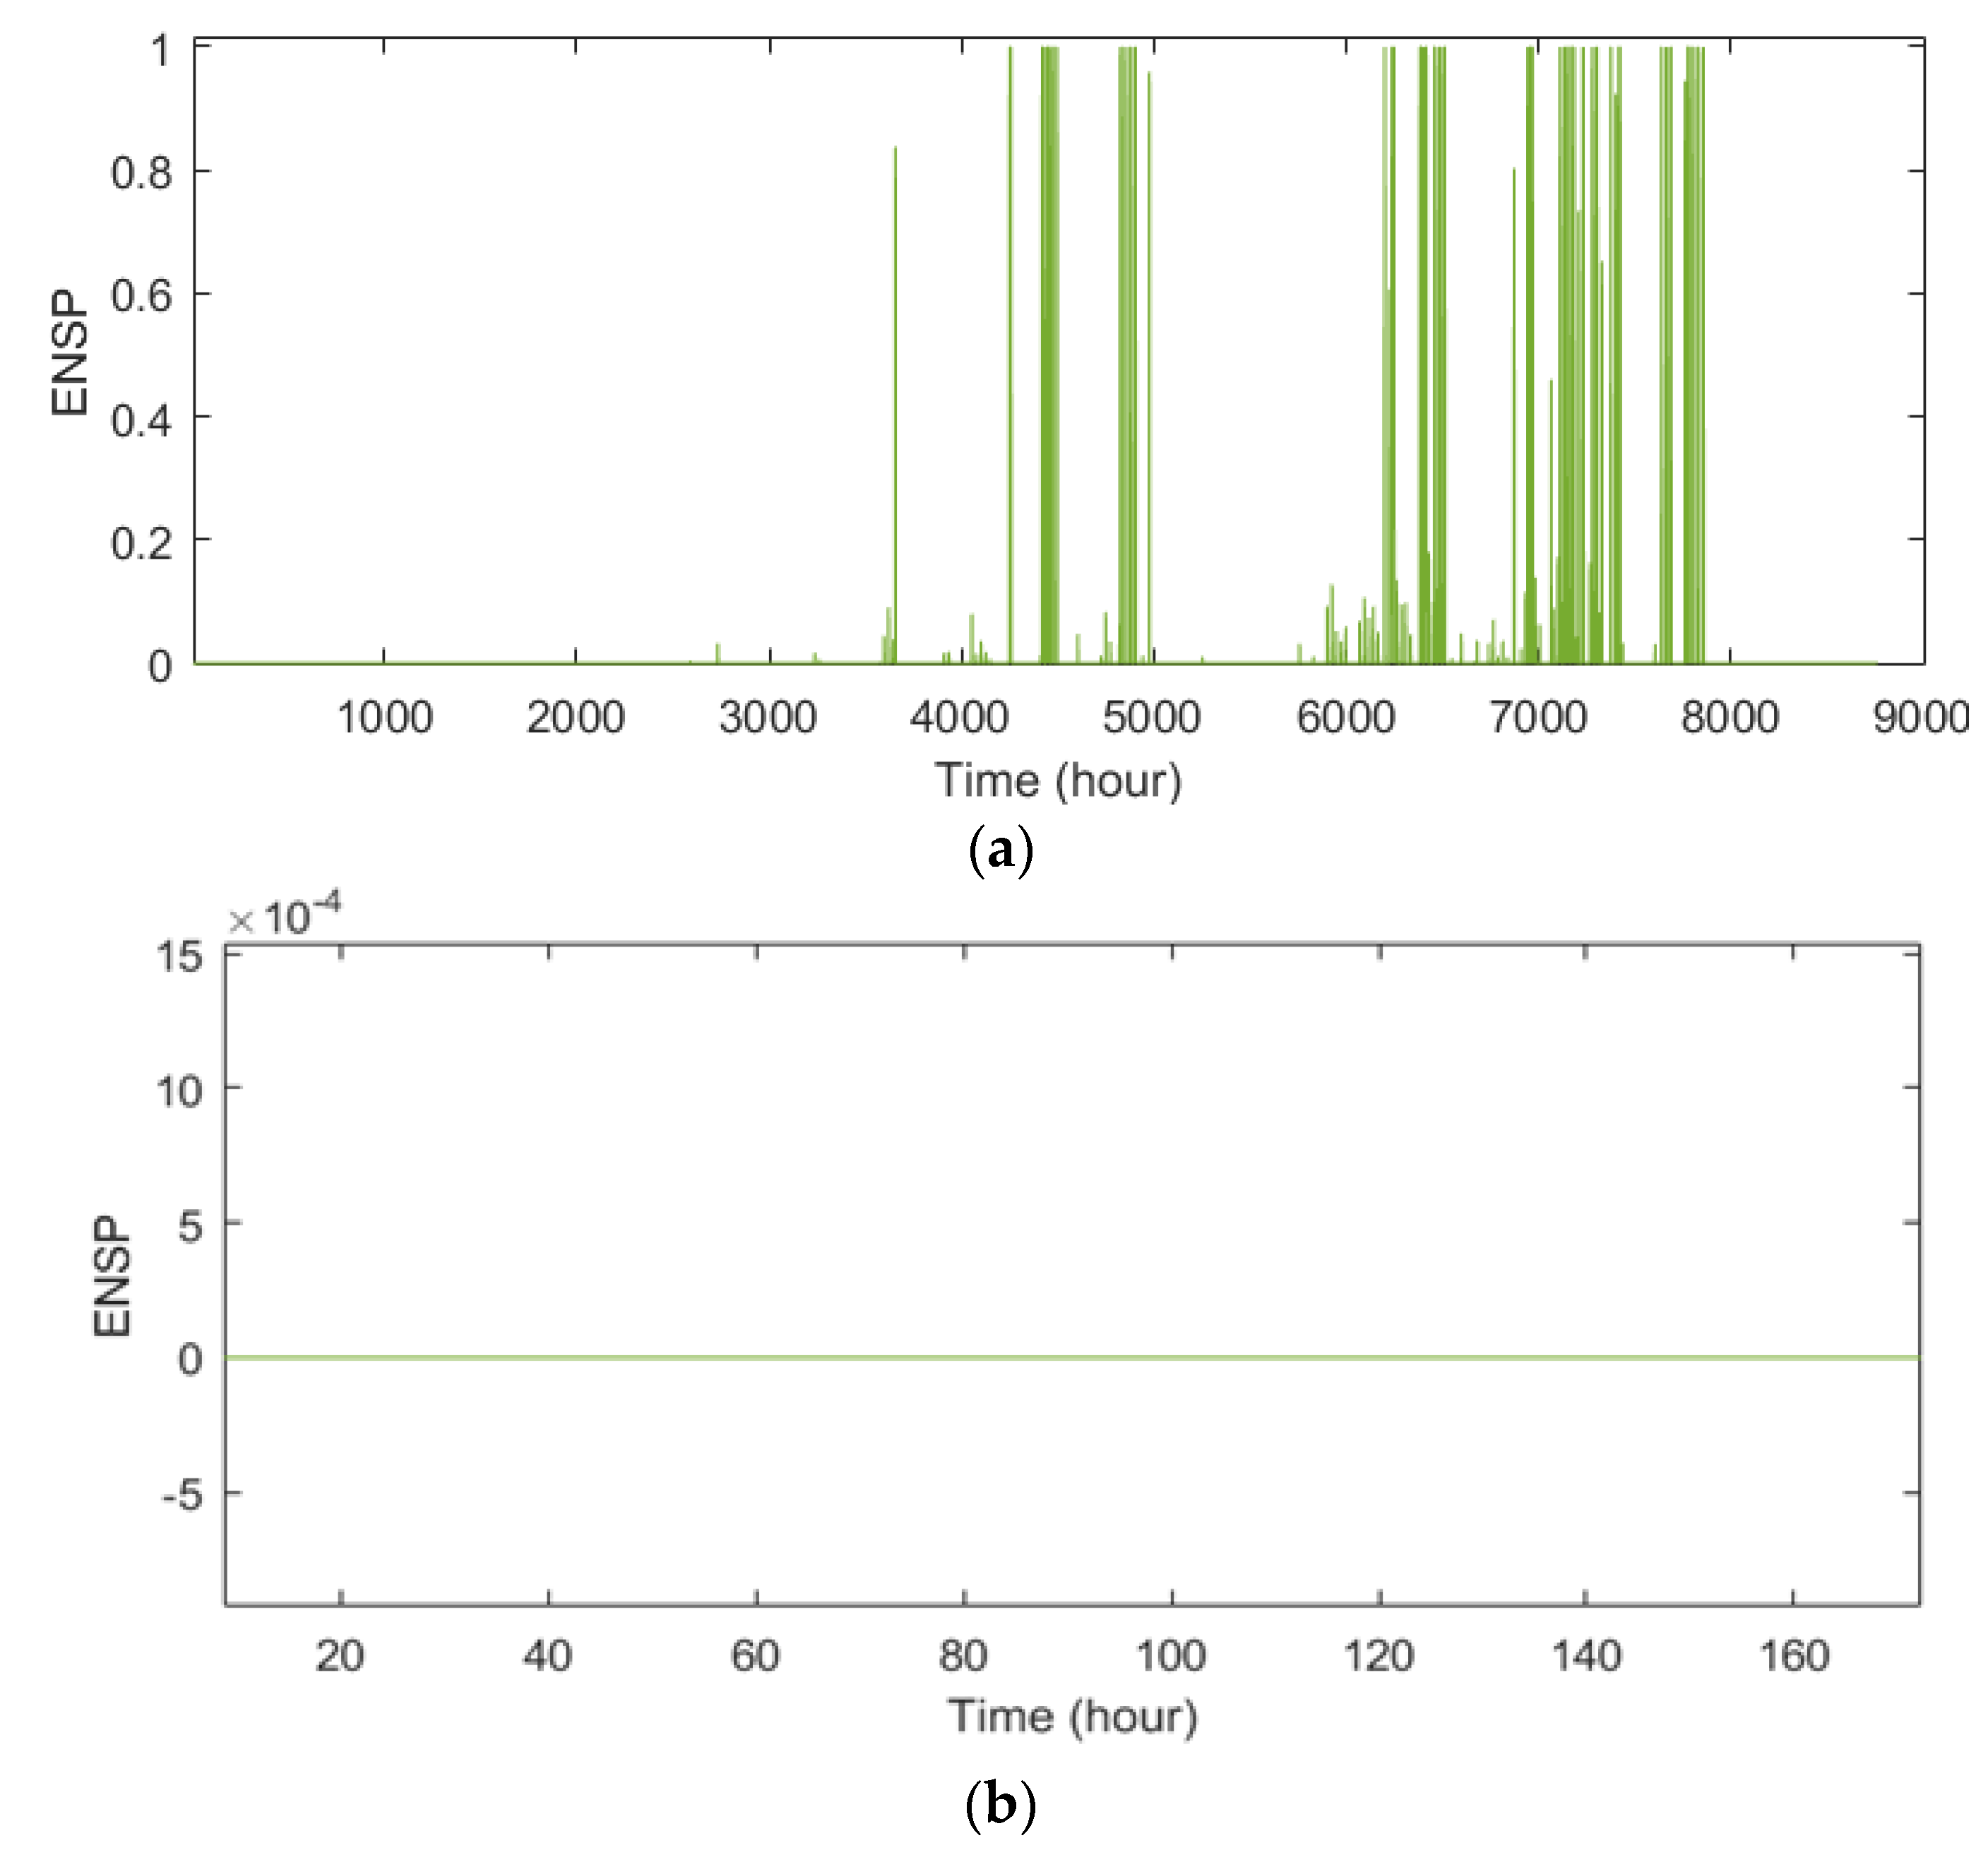
6.2. Sizing Results for ENSPmax = 1%

In this section, the optimal design of the HPV/FC system to minimise the TNPC and meet the demand of a residential complex is presented using the IAEO, considering ENSPmax = 1%. Figure 6 shows the convergence process of each meta-heuristic algorithm in solving the design problem. The numerical results of the optimal design of an HPV/FC system considering ENSPmax = 1%, are given in Table 2, Table 3 and Table 4. According to the obtained results, it is clear that the IAEO, by determining the optimal capacity of the equipment, has obtained a lower value of TNPC and COE compared to other methods.
In Figure 7, Figure 8, Figure 9 and Figure 10, the annual curve of the PV power production, energy stored in the hydrogen tank, transmission power of PV sources to the inverter, and FC production power are shown, respectively. In Figure 11, the ENSP curve is also shown during one year, which shows that most of the unsupplied energy of the system is related to the hours of 6500 to 7800.

6.3. Sizing Results for ENSPmax = 5%

The results related to the optimal design of the HPV/FC energy system are presented using the IAEO for ENSPmax = 5%. The convergence trend for various algorithms in achieving the optimal design solution is drawn in Figure 12, where the comparison of the convergence process of the algorithms shows the superiority of the IAEO method in finding the best solution.
The results of the HPV/FC energy system design for ENSPmax = 5% are presented in Table 5, Table 6 and Table 7. The TNPC values obtained by the IAEO, AEO, PSO, and MRFO algorithms are USD 2.247 M, USD 2.358 M, USD 2.249 M, and USD 2.251 M, respectively, and the COE values for each kWh supply are USD 0.4046, USD 0.4242, USD 0.4049, and USD 0.4053, respectively. According to the obtained results, the IAEO obtained a lower value for TNPC and COE compared to other methods.
In Figure 13, Figure 14, Figure 15 and Figure 16, PV power generation, hydrogen tank energy, PV power transmission to the inverter, and FC power are depicted. In Figure 17, the annual changes of the ENSP presented indicate that the most not-supplied energy is related to the hours 7800 to 4500.

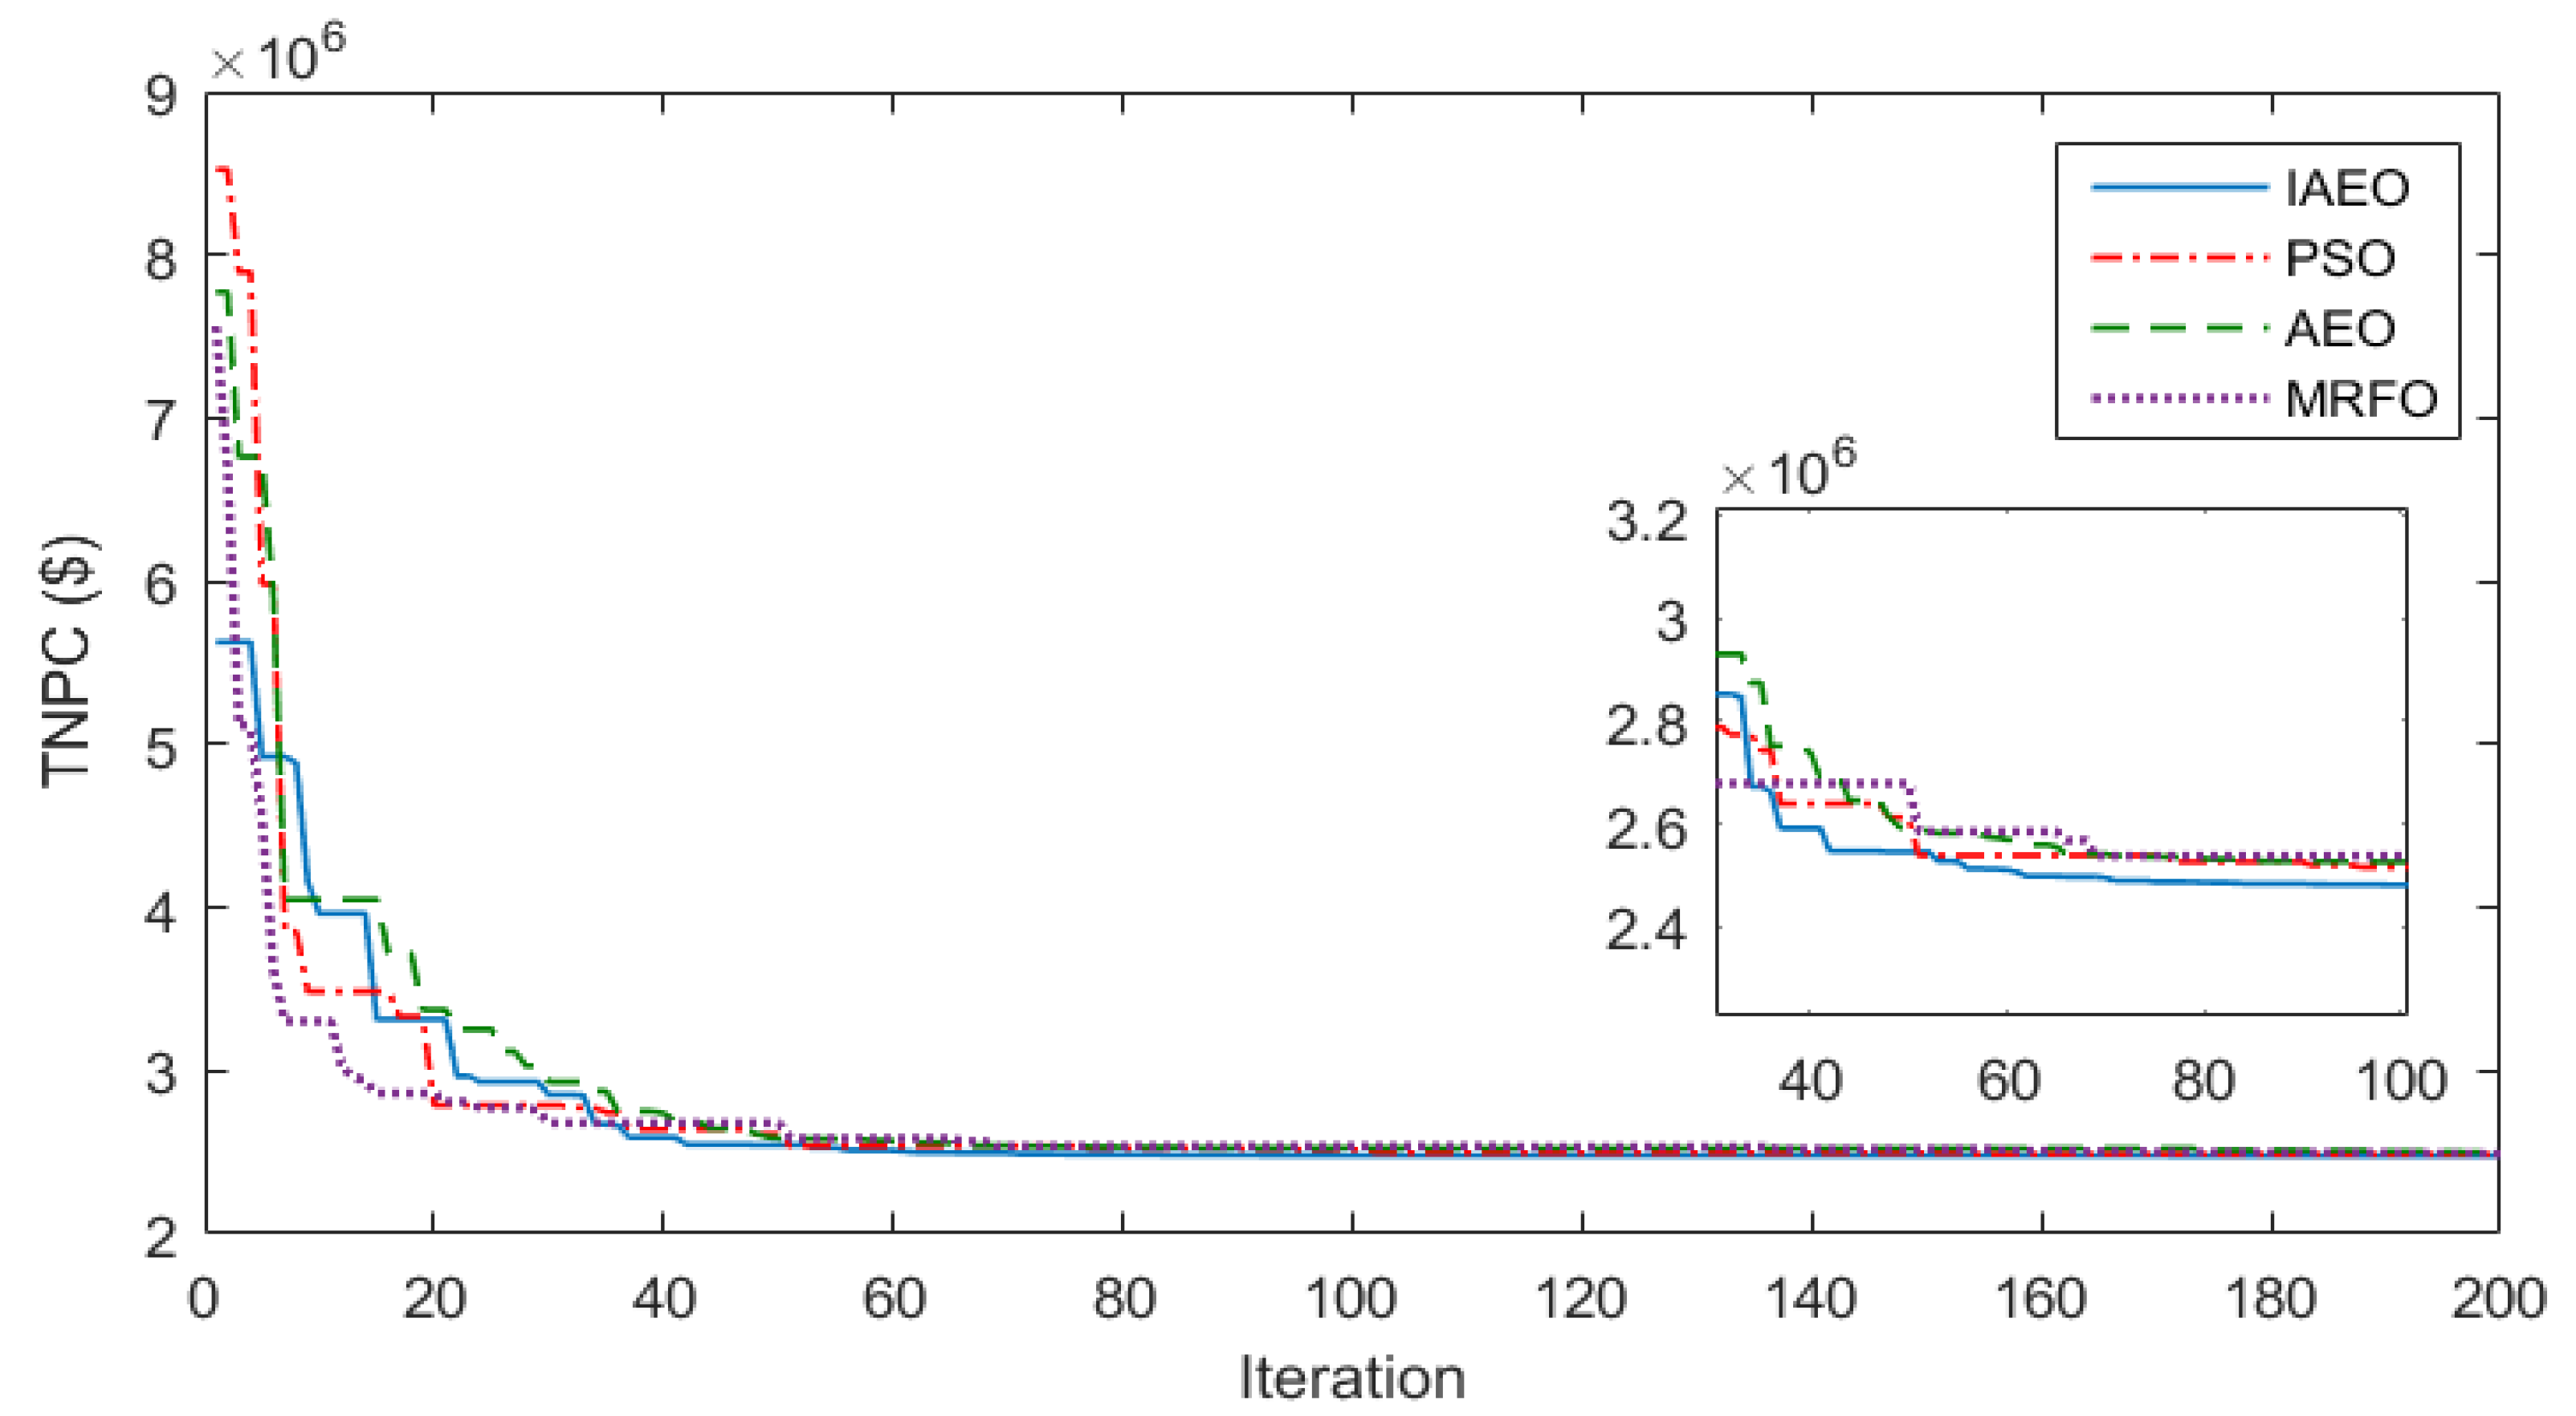
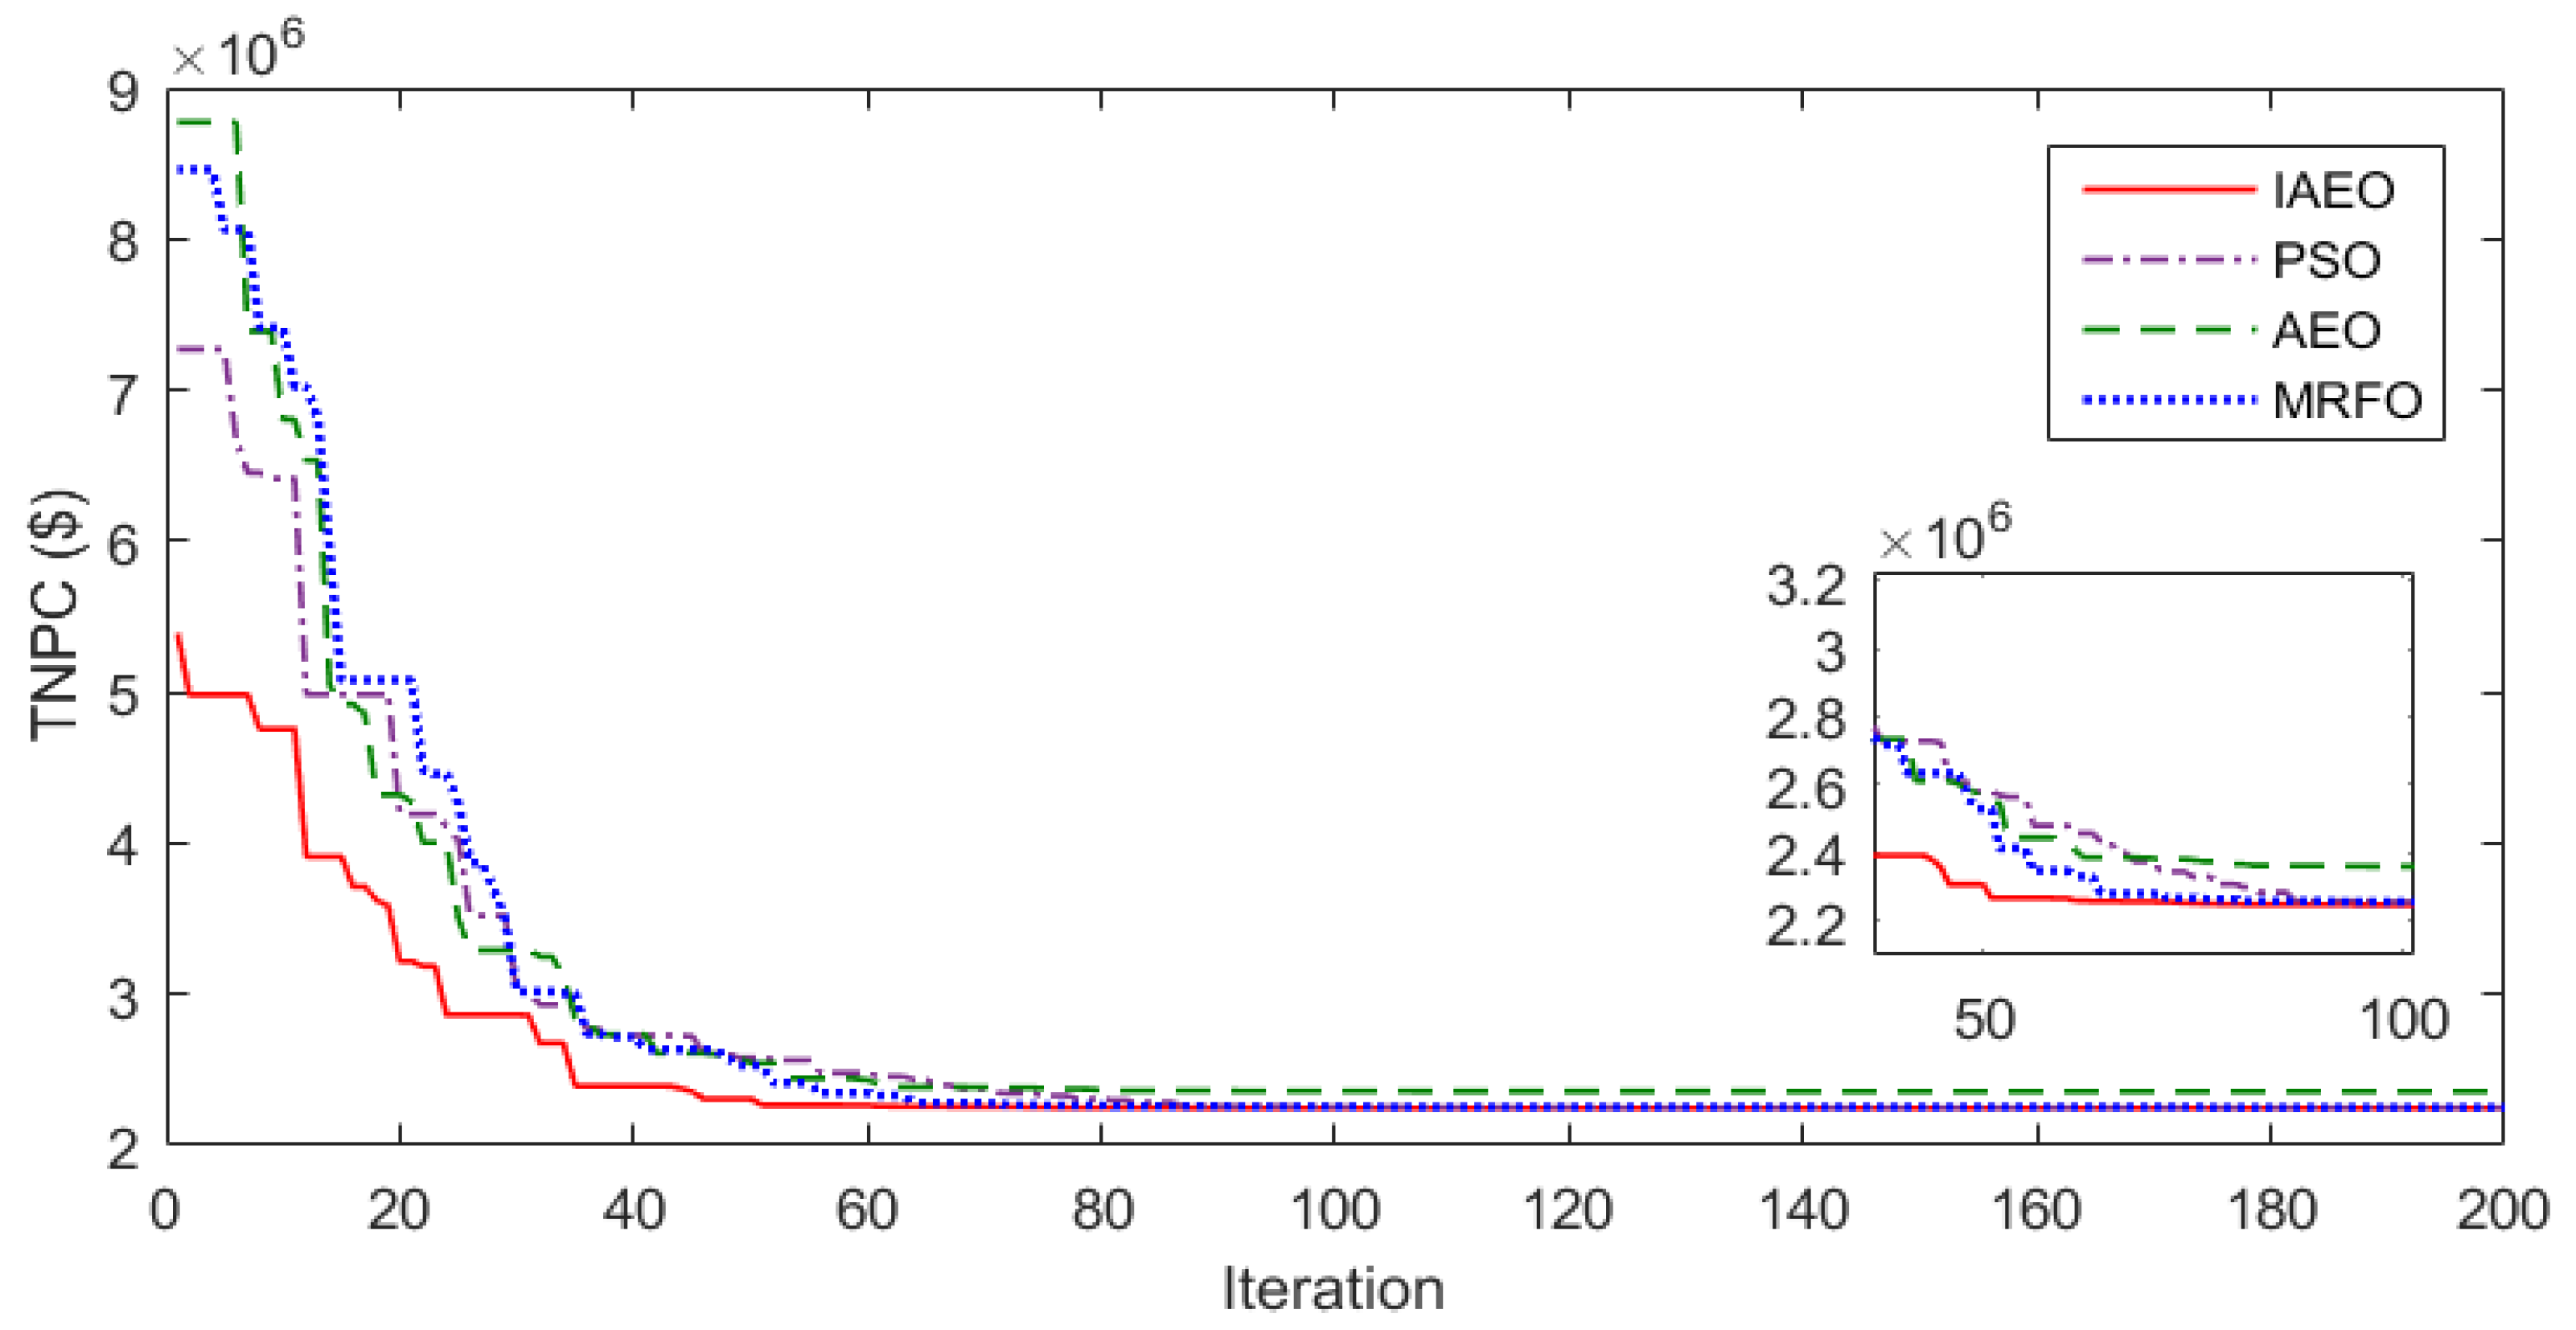
6.4. Results Comparison

In Section 6.2 and Section 6.3, the results of the HPV/FC energy system design for ENSPmax = 1% and 5% are presented using the IAEO. The convergence curve obtained from the implementation of the design problem for ENSPmax values equal to 1%, 5%, 10%, 15%, 20%, 25%, and 30% is presented in Figure 18, which shows the convergence process of the IAEO in reaching the best solution for different ENSPmax values. According to Table 8 and Table 9, with the increase of the ENSPmax value, the values of the ENSP and LOEE increased, and vice versa. Also, with the increase in ENSPmax, the TNPC and COE decreased, and vice versa.

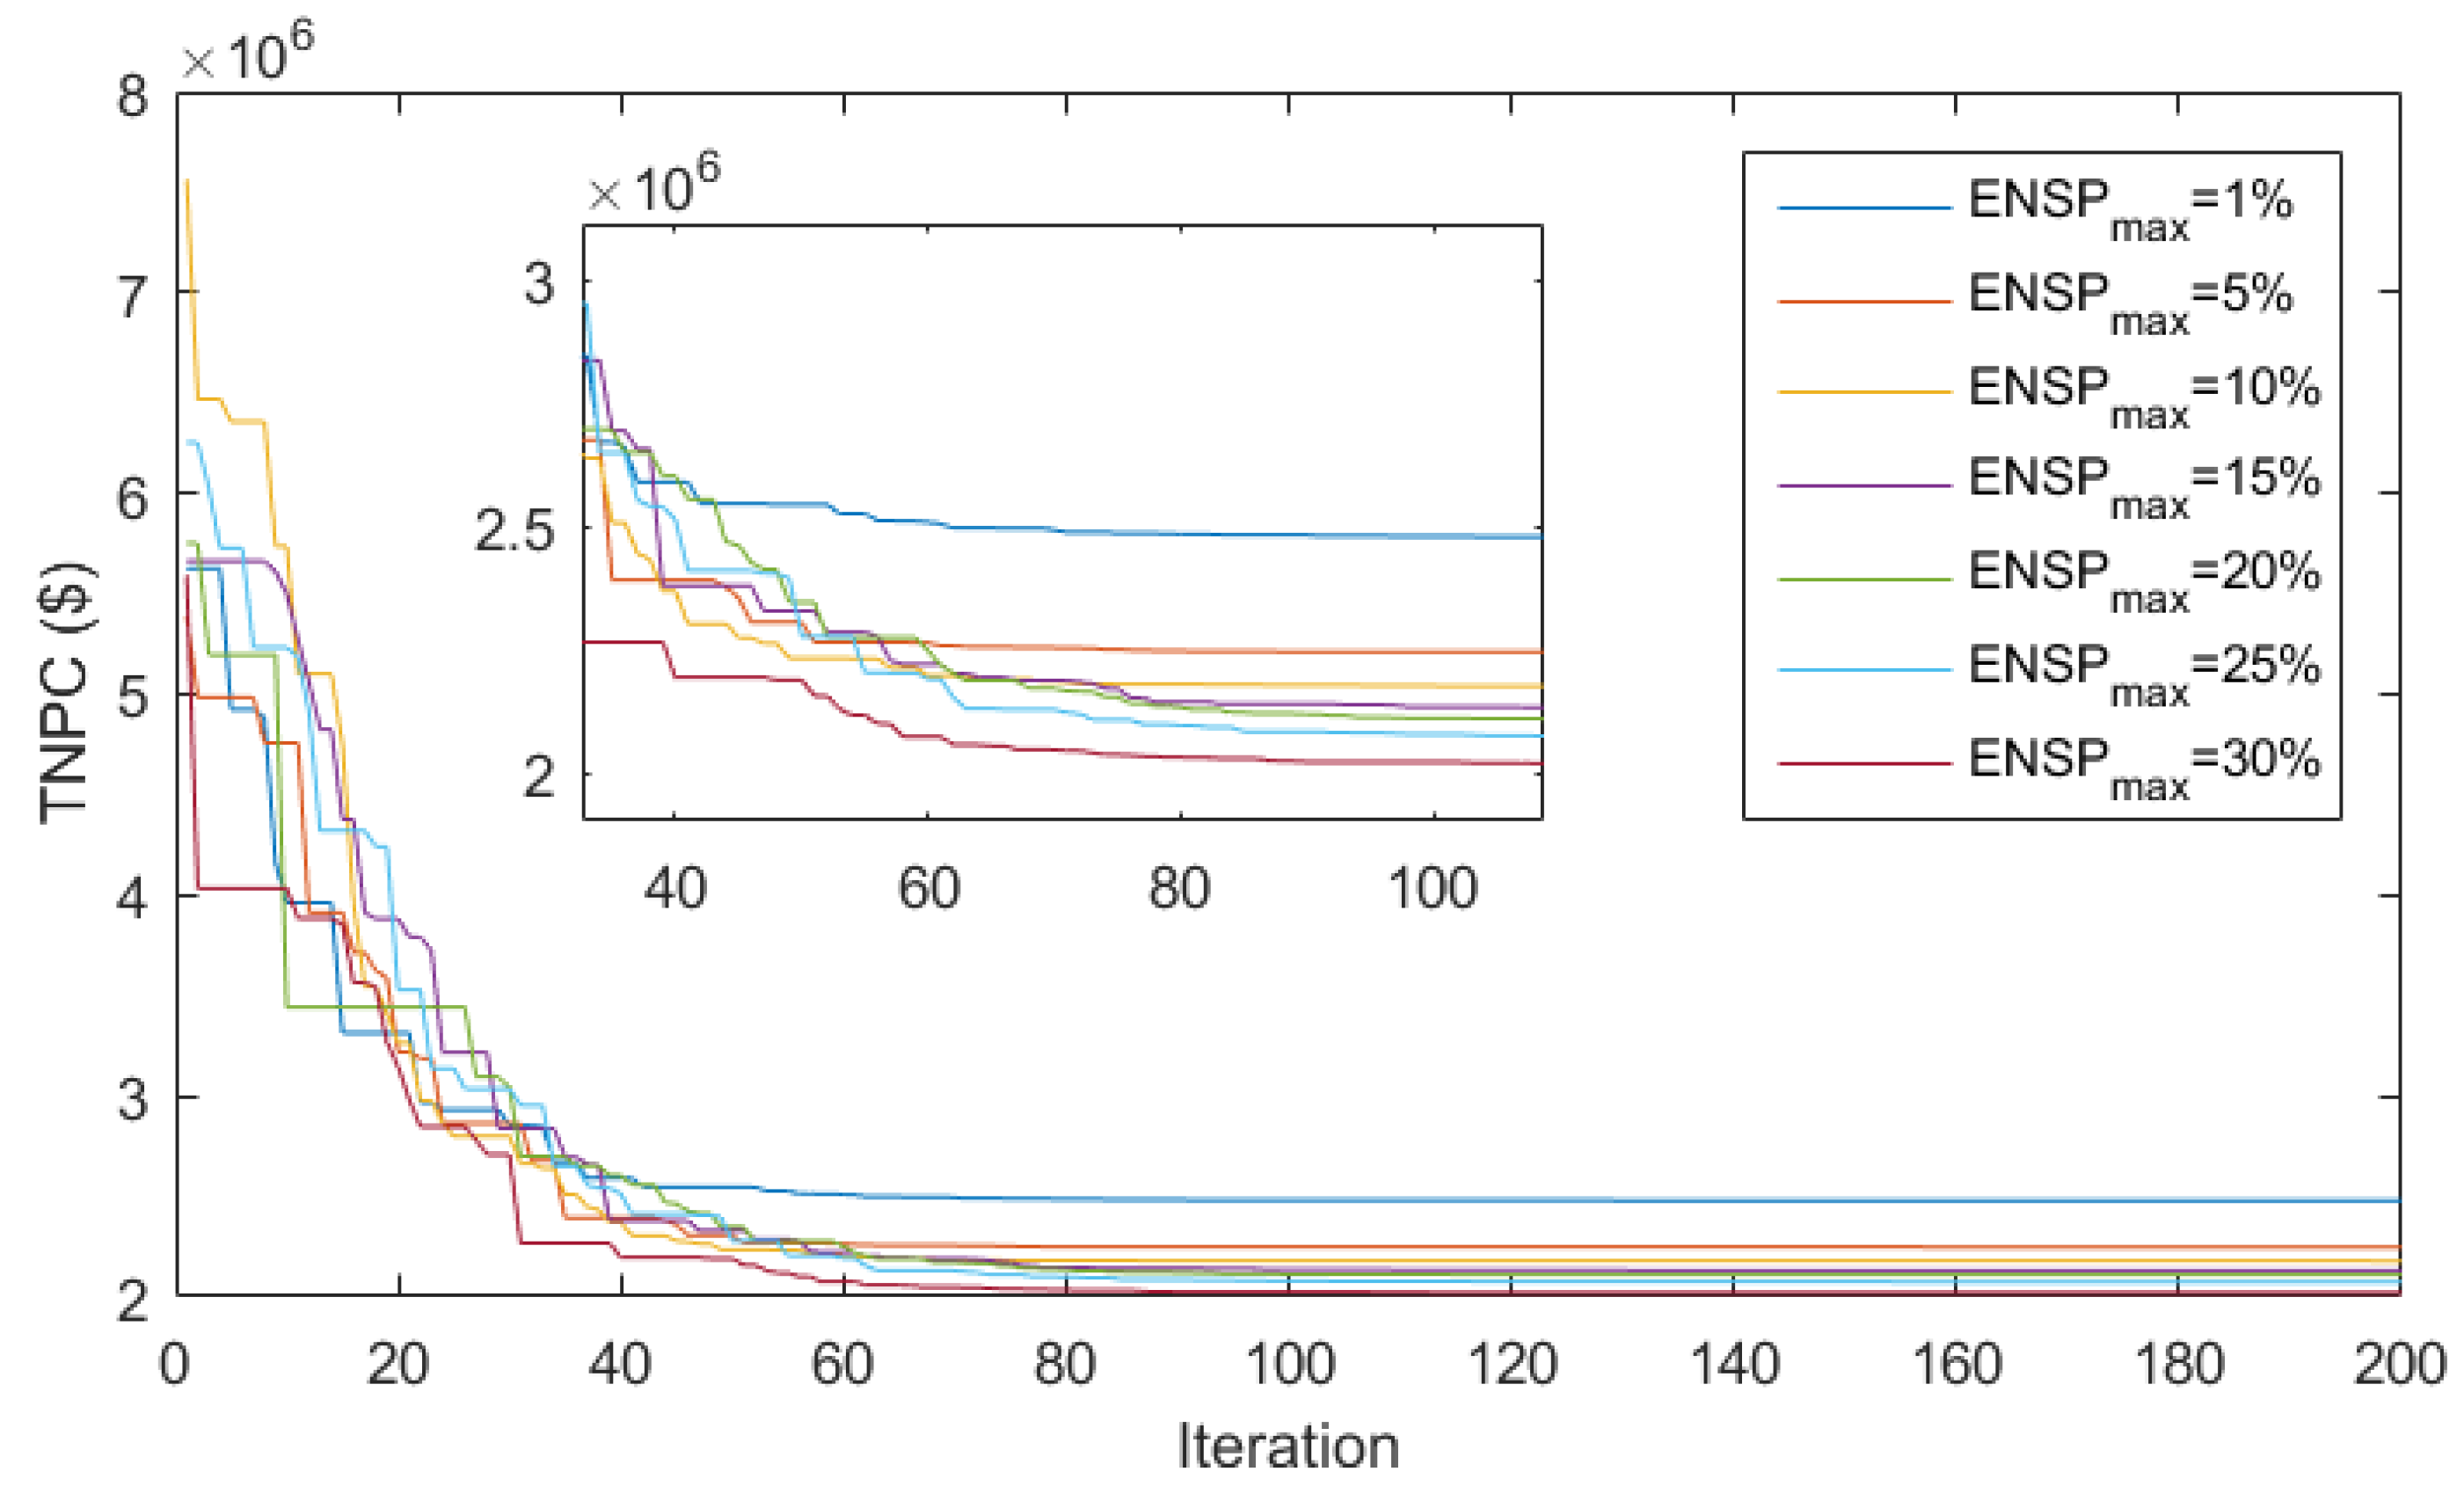
6.5. Sensitivity Analysis

6.5.1. Effect of HST Efficiency

The results of the hydrogen tank efficiency changes effect on the design problem using the IAEO, considering ENSPmax = 5%, are presented in Table 1. Based on Table 10 and Table 11, it has been observed that by increasing the efficiency of the hydrogen tank, the amount of ENSP has decreased; in other words, the load reliability has increased, and the costs of the system, including TNPC and COE, have decreased, and vice versa.

6.5.2. Effect of Load Variation

The results of the residential complex load demand changes are given in the design problem using the IAEO, considering ENSPmax = 5%, in Table 1. Based on Table 12 and Table 13, it is clear that with the increase in the load of the residential complex, the level of hydrogen production and storage, besides the production of fuel cell power, increases, and thus, TNPC and COE rise, and vice versa.

6.6. Comparisons

The results obtained from the optimal configuration of the HPV/FC energy system using IAEO for ENSPmax = 5% are compared with previous studies, and the report is listed in Table 14. Ref. [37] presents a comparative design study for the HPV/FC system using the whale optimization algorithm to minimise the energy cost, while meeting the reliability limits. Accordingly, the energy cost for supplying 1 kW of load demand in Kuala Lumpur is much lower than supplying it in Ref. [37].

7. Conclusions

In this study, an HPV/FC system based on hydrogen storage was designed to cover the annual complex load considering the meteorological data of Kuala Lumpur, Malaysia, using the IAEO. The results showed that the proposed design methodology based on the IAEO was able to obtain the optimal combination of the system, with a lower cost and a higher level of reliability compared to the conventional AEO, PSO, and MRFO algorithms, which shows the effectiveness of the dynamic lens-imaging learning strategy in the improved algorithm. Also, the results showed that the increase (decrease) of the reliability constraint by reducing (increasing) the level of production and storage has reduced (increased) the design costs. In addition, the results show that the use of inverters and hydrogen tanks with higher efficiency has reduced design costs due to better power transmission by the inverter and increased storage capacity by the tank. The design of a hybrid photovoltaic/fuel cell system considering the uncertainty of production and load consumption is proposed for future work.

Author Contributions

J.Y. and Y.-L.C. carried out the exploration of ideas and conducted a review of systems and methods. They contributed to the survey studies and methods and came up with the presented ideas, while also writing the manuscript with the support of P.L.Y., C.S.K. and Y.-L.C. These individuals provided suggestions on the experimental setup and analytical results. Y.-L.C. and P.L.Y. also offered their insights on the research ideas and analytical results and assisted in the writing of the manuscript. Funding support was provided by Y.-L.C., who also co-wrote the manuscript. M.B. contributed to the implementation of the mathematical optimization algorithm and to the statistical analysis. All authors have read and agreed to the published version of the manuscript.

Funding

This work was also funded by the National Science and Technology Council in Taiwan, under grant numbers NSTC-109-2628-E-027-004–MY3, NSTC-111-2218-E-027-003, and NSTC-111-2622-8-027-009, and was also supported by the Ministry of Education of Taiwan under Official Document No. 1112303249, entitled “The study of artificial intelligence and advanced semi-conductor manufacturing for female STEM talent education and industry–university value-added cooperation promotion”.

Institutional Review Board Statement

Not applicable.

Informed Consent Statement

Not applicable.

Data Availability Statement

Not applicable.

Conflicts of Interest

The authors declare no conflict of interest.

References

  1. Alanazi, A.; Alanazi, M.; Nowdeh, S.A.; Abdelaziz, A.Y.; Abu-Siada, A. Stochastic-Metaheuristic Model for Multi-Criteria Allocation of Wind Energy Resources in Distribution Network Using Improved Equilibrium Optimization Algorithm. Electronics 2022, 11, 3285. [Google Scholar] [CrossRef]
  2. Alanazi, A.; Alanazi, M.; Nowdeh, S.A.; Abdelaziz, A.Y.; El-Shahat, A. An optimal sizing framework for autonomous photovoltaic/hydrokinetic/hydrogen energy system considering cost, reliability and forced outage rate using horse herd optimization. Energy Rep. 2022, 8, 7154–7175. [Google Scholar] [CrossRef]
  3. Naderipour, A.; Kamyab, H.; Klemeš, J.J.; Ebrahimi, R.; Chelliapan, S.; Nowdeh, S.A.; Abdullah, A.; Marzbali, M.H. Optimal design of hybrid grid-connected photovoltaic/wind/battery sustainable energy system improving reliability, cost and emission. Energy 2022, 257, 124679. [Google Scholar] [CrossRef]
  4. Naderipour, A.; Abdul-Malek, Z.; Vahid, M.Z.; Seifabad, Z.M.; Hajivand, M.; Arabi-Nowdeh, S. Optimal, Reliable and Cost-Effective Framework of Photovoltaic-Wind-Battery Energy System Design Considering Outage Concept Using Grey Wolf Optimizer Algorithm—Case Study for Iran. IEEE Access 2019, 7, 182611–182623. [Google Scholar] [CrossRef]
  5. Qi, X.; Wang, J.; Królczyk, G.; Gardoni, P.; Li, Z. Sustainability analysis of a hybrid renewable power system with battery storage for islands application. J. Energy Storage 2022, 50, 104682. [Google Scholar] [CrossRef]
  6. Moghaddam, M.J.H.; Kalam, A.; Nowdeh, S.A.; Ahmadi, A.; Babanezhad, M.; Saha, S. Optimal sizing and energy management of stand-alone hybrid photovoltaic/wind system based on hydrogen storage considering LOEE and LOLE reliability indices using flower pollination algorithm. Renew. Energy 2018, 135, 1412–1434. [Google Scholar] [CrossRef]
  7. Kaviani, A.K.; Riahy, G.H.; Kouhsari, S.H.M. Optimal design of a reliable hydrogen-based stand-alone wind/PV generating system, considering component outages. Renew. Energy 2009, 34, 2380–2390. [Google Scholar] [CrossRef]
  8. Hoseinzadeh, S.; Garcia, D.A. Techno-economic assessment of hybrid energy flexibility systems for islands’ decarbonization: A case study in Italy. Sustain. Energy Technol. Assess. 2021, 51, 101929. [Google Scholar] [CrossRef]
  9. Hassan, Q.; Jaszczur, M.; Hafedh, S.A.; Abbas, M.K.; Abdulateef, A.M.; Hasan, A.; Abdulateef, J.; Mohamad, A. Optimizing a microgrid photovoltaic-fuel cell energy system at the highest renewable fraction. Int. J. Hydrog. Energy 2022, 47, 13710–13731. [Google Scholar] [CrossRef]
  10. Bouaouda, A.; Sayouti, Y. Hybrid Meta-Heuristic Algorithms for Optimal Sizing of Hybrid Renewable Energy System: A Review of the State-of-the-Art. Arch. Comput. Methods Eng. 2022, 29, 4049–4083. [Google Scholar] [CrossRef]
  11. Al-Othman, A.; Tawalbeh, M.; Martis, R.; Dhou, S.; Orhan, M.; Qasim, M.; Olabi, A.G. Artificial intelligence and numerical models in hybrid renewable energy systems with fuel cells: Advances and prospects. Energy Convers. Manag. 2022, 253, 115154. [Google Scholar] [CrossRef]
  12. Sanajaoba, S. Optimal sizing of off-grid hybrid energy system based on minimum cost of energy and reliability criteria using firefly algorithm. Sol. Energy 2019, 188, 655–666. [Google Scholar] [CrossRef]
  13. Ghorbani, N.; Kasaeian, A.; Toopshekan, A.; Bahrami, L.; Maghami, A. Optimizing a hybrid wind-PV-battery system using GA-PSO and MOPSO for reducing cost and increasing reliability. Energy 2018, 154, 581–591. [Google Scholar] [CrossRef]
  14. Fodhil, F.; Hamidat, A.; Nadjemi, O. Potential, optimization and sensitivity analysis of photovoltaic-diesel-battery hybrid energy system for rural electrification in Algeria. Energy 2019, 169, 613–624. [Google Scholar] [CrossRef]
  15. Jahannoosh, M.; Nowdeh, S.A.; Naderipour, A.; Kamyab, H.; Davoodkhani, I.F.; Klemeš, J.J. New Hybrid Meta-Heuristic Algorithm for Reliable and Cost-Effective Designing of Photovoltaic/Wind/Fuel Cell Energy System Considering Load Interruption Probability. J. Clean. Prod. 2020, 278, 123406. [Google Scholar] [CrossRef]
  16. Das, B.K.; Alotaibi, M.A.; Das, P.; Islam, M.; Das, S.K.; Hossain, A. Feasibility and techno-economic analysis of stand-alone and grid-connected PV/Wind/Diesel/Batt hybrid energy system: A case study. Energy Strat. Rev. 2021, 37, 100673. [Google Scholar] [CrossRef]
  17. Sun, H.; Ebadi, A.G.; Toughani, M.; Nowdeh, S.A.; Naderipour, A.; Abdullah, A. Designing framework of hybrid photovoltaic-biowaste energy system with hydrogen storage considering economic and technical indices using whale optimization algorithm. Energy 2021, 238, 121555. [Google Scholar] [CrossRef]
  18. Bouchekara, H.R.; Shahriar, M.; Irshad, U.; Aban, Y.S.; Mahmud, M.P.; Javaid, M.; Ramli, M.A.; Farjana, S.H. Optimal sizing of hybrid photovoltaic/diesel/battery nanogrid using a parallel multiobjective PSO-based approach: Application to desert camping in Hafr Al-Batin city in Saudi Arabia. Energy Rep. 2021, 7, 4360–4375. [Google Scholar] [CrossRef]
  19. Mohammed, A.Q.; Al-Anbarri, K.A.; Hannun, R.M. Optimal Combination and Sizing of a Stand–Alone Hybrid Energy System Using a Nomadic People Optimizer. IEEE Access 2020, 8, 200518–200540. [Google Scholar] [CrossRef]
  20. Guo, X.; Zhou, L.; Guo, Q.; Rouyendegh, B.D. An optimal size selection of hybrid renewable energy system based on Fractional-Order Neural Network Algorithm: A case study. Energy Rep. 2021, 7, 7261–7272. [Google Scholar] [CrossRef]
  21. Mahmoud, F.S.; Diab, A.A.Z.; Ali, Z.M.; El-Sayed, A.-H.M.; Alquthami, T.; Ahmed, M.; Ramadan, H.A. Optimal sizing of smart hybrid renewable energy system using different optimization algorithms. Energy Rep. 2022, 8, 4935–4956. [Google Scholar] [CrossRef]
  22. Naderipour, A.; Ramtin, A.R.; Abdullah, A.; Marzbali, M.H.; Nowdeh, S.A.; Kamyab, H. Hybrid energy system optimization with battery storage for remote area application considering loss of energy probability and economic analysis. Energy 2021, 239, 122303. [Google Scholar] [CrossRef]
  23. Ghaffari, A.; Askarzadeh, A. Design optimization of a hybrid system subject to reliability level and renewable energy penetration. Energy 2020, 193, 116754. [Google Scholar] [CrossRef]
  24. Cao, Y.; Yao, H.; Wang, Z.; Jermsittiparsert, K.; Yousefi, N. Optimal Designing and Synthesis of a Hybrid PV/Fuel cell/Wind System using Meta-heuristics. Energy Rep. 2020, 6, 1353–1362. [Google Scholar] [CrossRef]
  25. Singh, S.; Chauhan, P.; Singh, N. Capacity optimization of grid connected solar/fuel cell energy system using hybrid ABC-PSO algorithm. Int. J. Hydrog. Energy 2020, 45, 10070–10088. [Google Scholar] [CrossRef]
  26. Jamshidi, M.; Askarzadeh, A. Techno-economic analysis and size optimization of an off-grid hybrid photovoltaic, fuel cell and diesel generator system. Sustain. Cities Soc. 2018, 44, 310–320. [Google Scholar] [CrossRef]
  27. Anoune, K.; Ghazi, M.; Bouya, M.; Laknizi, A.; Ghazouani, M.; Ben Abdellah, A.; Astito, A. Optimization and techno-economic analysis of photovoltaic-wind-battery based hybrid system. J. Energy Storage 2020, 32, 101878. [Google Scholar] [CrossRef]
  28. Khan, A.; Javaid, N. Optimal sizing of a stand-alone photovoltaic, wind turbine and fuel cell systems. Comput. Electr. Eng. 2020, 85, 106682. [Google Scholar] [CrossRef]
  29. El-Sattar, H.A.; Kamel, S.; Sultan, H.M.; Zawbaa, H.M.; Jurado, F. Optimal design of Photovoltaic, Biomass, Fuel Cell, Hydrogen Tank units and Electrolyzer hybrid system for a remote area in Egypt. Energy Rep. 2022, 8, 9506–9527. [Google Scholar] [CrossRef]
  30. Zhao, W.; Wang, L.; Zhang, Z. Artificial ecosystem-based optimization: A novel nature-inspired meta-heuristic algorithm. Neural Comput. Appl. 2019, 32, 9383–9425. [Google Scholar] [CrossRef]
  31. Long, W.; Jiao, J.; Xu, M.; Tang, M.; Wu, T.; Cai, S. Lens-imaging learning Harris hawks optimizer for global optimization and its application to feature selection. Expert Syst. Appl. 2022, 202, 117255. [Google Scholar] [CrossRef]
  32. Askarzadeh, A. Electrical power generation by an optimised autonomous PV/wind/tidal/battery system. IET Renew. Power Gener. 2016, 11, 152–164. [Google Scholar] [CrossRef]
  33. Hosseinalizadeh, R.; Shakouri, G.H.; Amalnick, M.S.; Taghipour, P. Economic sizing of a hybrid (PV–WT–FC) renewable energy system (HRES) for stand-alone usages by an optimization-simulation model: Case study of Iran. Renew. Sustain. Energy Rev. 2016, 54, 139–150. [Google Scholar] [CrossRef] [Green Version]
  34. Available online: https://solargis.com/maps-and-gis-data/download/malaysia (accessed on 8 January 2023).
  35. Hossain, M.Z.; Illias, H.A. Binary power generation system by utilizing solar energy in Malaysia. Ain Shams Eng. J. 2022, 13, 101650. [Google Scholar] [CrossRef]
  36. Ramli, M.A.; Bouchekara, H.; Alghamdi, A.S. Optimal sizing of PV/wind/diesel hybrid microgrid system using multi-objective self-adaptive differential evolution algorithm. Renew. Energy 2018, 121, 400–411. [Google Scholar] [CrossRef]
  37. Naderipour, A.; Abdul-Malek, Z.; Nowdeh, S.A.; Kamyab, H.; Ramtin, A.R.; Shahrokhi, S.; Klemeš, J.J. Comparative evaluation of hybrid photovoltaic, wind, tidal and fuel cell clean system design for different regions with remote application considering cost. J. Clean. Prod. 2021, 283, 124207. [Google Scholar] [CrossRef]
Figure 1. Schematic of HPV/FC energy system.
Energies 16 02867 g001
Figure 2. Strategy of dynamic lens-imaging learning.
Energies 16 02867 g002
Figure 3. Irradiance of Kuala Lumpur during (a) a year and (b) a week.
Energies 16 02867 g003aEnergies 16 02867 g003b
Figure 4. Temperature of Kuala Lumpur during (a) a year and (b) a week.
Energies 16 02867 g004
Figure 5. Annual load demand curve of the residential complex during (a) a year and (b) a week.
Energies 16 02867 g005
Figure 6. Convergence process of different algorithms in the sizing of HPV/FC energy systems considering ENSPmax = 1%.
Energies 16 02867 g006
Figure 7. Generated power from PV resources considered in the sizing of the HPV/FC energy system via the IAEO, considering ENSPmax = 1% during (a) a year and (b) a week.
Energies 16 02867 g007
Figure 8. Hydrogen storage tank energy considered in the sizing of the HPV/FC energy system via the IAEO, considering ENSPmax = 1% during (a) a year and (b) a week.
Energies 16 02867 g008
Figure 9. Delivered power to the inverter by the PV resources considered in the sizing of the HPV/FC energy system via the IAEO, considering ENSPmax = 1% during (a) a year and (b) a week.
Energies 16 02867 g009
Figure 10. FC power in the sizing of the HPV/FC energy system via the IAEO, considering ENSPmax = 1% during (a) a year and (b) a week.
Energies 16 02867 g010aEnergies 16 02867 g010b
Figure 11. ENSP in the sizing of the HPV/FC energy system via the IAEO, considering ENSPmax = 1% during (a) a year and (b) a week.
Energies 16 02867 g011
Figure 12. Convergence process of different algorithms in the sizing of the HPV/FC energy system considering an ENSPmax of 5%.
Energies 16 02867 g012
Figure 13. Generated power by PV resources in the sizing of the HPV/FC energy system via the IAEO, considering ENSPmax = 5% during (a) a year and (b) a week.
Energies 16 02867 g013
Figure 14. Hydrogen storage tank energy considered in the sizing of the HPV/FC energy system via the IAEO, considering ENSPmax = 5% during (a) a year and (b) a week.
Energies 16 02867 g014
Figure 15. Delivered power to the inverter by the PV resources in the sizing of the HPV/FC energy system via the IAEO, considering ENSPmax = 5% during (a) a year and (b) a week.
Energies 16 02867 g015
Figure 16. FC power in the sizing of the HPV/FC energy system via the IAEO, considering ENSPmax = 5% during (a) a year and (b) a week.
Energies 16 02867 g016aEnergies 16 02867 g016b
Figure 17. ENSP in the sizing of the HPV/FC energy system via the IAEO, considering ENSPmax = 5% during (a) a year and (b) a week.
Energies 16 02867 g017
Figure 18. Convergence process of the IAEO in the sizing of HPV/FC energy systems, considering different ENSPmax.
Energies 16 02867 g018
Table 1. Techno-economic data of the PV/FC energy system [15,36].
Component C C (US$/Unit) R C (US$/Unit) O M (US$/Unit-yrs.)Rated SizeEfficiency
(%)
Lifetime
(yr)
PV200017001001 kW-20
EL20001500251 kW7520
HST13001200151 kg9520
FC400035002001 kW505
Inverter80075071 kW9510
Table 2. Sizing results of the HPV/FC energy system considering ENSPmax = 1%.
Algorithm/ItemNPV (kW)PEL (kW)MHST (kg)PFC (kW)PInv (kW)
IAEO471.44171.3398.3847.8850.18
AEO480.59168.1296.8847.1650.02
PSO474.02169.60100.0447.8950.15
MRFO475.94168.0999.9447.8650.11
Table 3. Statistical analysis for different algorithms in the sizing of the HPV/FC energy system considering ENSPmax = 1%.
Algorithm/ItemBest (M$)Mean (M$)Worst (M$)Std (M$)
IAEO2.4802.4912.4980.0067
AEO2.5002.5122.5240.0104
PSO2.4872.4962.5030.0069
MRFO2.4902.5052.5140.0078
Table 4. Reliability and cost results of HPV/FC energy systems considering ENSPmax = 1%.
Algorithm/ItemENSP (%)LOLE (h/yr)LOEE (MWh/yr)TNPC (M$)COE ($/kWh)
IAEO0.0058820.16122.4800.4465
AEO0.0072890.19992.5000.4501
PSO0.0060860.16662.4870.4478
MRFO0.0071870.19712.4900.4483
Table 5. Results related to scaling the HPV/FC energy system considering ENSPmax = 5%.
Algorithm/ItemNPV (kW)PEL (kW)MHST (kg)PFC (kW)PInv (kW)
IAEO439.58147.9981.7442.2649.44
AEO419.31153.54108.6152.8648.93
PSO430.16154.7491.1142.2049.40
MRFO443.67148.9875.3041.9249.35
Table 6. Statistical analysis for different algorithms in the sizing of the HPV/FC energy system considering ENSPmax = 5%.
Algorithm/ItemBest (M$)Mean (M$)Worst (M$)Std (M$)
IAEO2.2472.2522.2570.0048
AEO2.2582.2662.2740.0077
PSO2.2492.2572.2630.0054
MRFO2.2512.2632.2700.0065
Table 7. Reliability and cost results of the HPV/FC energy system considering ENSPmax = 5%.
Algorithm/ItemENSP (%)LOLE (h/yr)LOEE (MWh/yr)TNPC (M$)COE ($/kWh)
IAEO0.02894080.79252.2470.4046
AEO0.03364380.93252.2580.4242
PSO0.02914260.79282.2490.4049
MRFO0.02944290.74352.2510.4053
Table 8. Sizing results of HPV/FC energy systems using the IAEO, considering different ENSPmax.
ENSPmax/ItemNPV (kW)PEL (kW)MHST (kg)PFC (kW)PInv (kW)
1%471.44171.3398.3847.8850.18
5%439.58147.9981.7442.2649.44
10%431.85140.7897.8437.5649.41
15%429.90144.1594.6633.7748.65
20%423.64155.3392.0831.4548.29
25%413.88131.8288.5429.9947.68
30%418.65136.1693.5228.3647.34
Table 9. Reliability and cost results in sizing HPV/FC energy systems using the IAEO, considering different ENSPmax.
ENSPmax/ItemENSP (%)LOLE (h/yr)LOEE (MWh/yr)TNPC (M$)COE ($/kWh)
1%0.0074870.205992.4800.4465
5%0.02894080.79252.2470.4046
10%0.03638761.00912.1780.3921
15%0.038413141.06542.1320.3838
20%0.041717521.15782.1090.3797
25%0.052021171.44502.0730.3732
30%0.061428281.70622.0180.3633
Table 10. Sizing results of an HPV/FC energy system using the IAEO and ENSPmax = 5% considering different HST efficiency values.
HST Efficiency/ItemNPV (kW)PEL (kW)MHST (kg)PFC (kW)PInv (kW)
80%445.76139.5879.2837.0149.16
85%477.62160.1288.9142.2250.20
90%461.59151.1681.2142.3049.61
95%439.58147.9981.7442.2649.44
100%423.64155.3392.0831.4548.29
Table 11. Reliability and cost results in the sizing of HPV/FC energy systems using the IAEO and ENSPmax = 5% considering different HST efficiency values.
HST Efficiency/ItemENSP (%)LOLE (h/yr)LOEE (MWh/yr)TNPC (M$)COE ($/kWh)
80%0.03244380.89972.4830.4470
85%0.03124260.86632.3950.4312
90%0.02994140.83022.3180.4173
95%0.02894080.79252.2470.4046
100%0.02783950.77192.1850.3934
Table 12. Sizing results of an HPV/FC energy system using the IAEO and ENSPmax = 5% considering load variations.
ENSPmax/ItemNPV (kW)PEL (kW)MHST (kg)PFC (kW)PInv (kW)
60%*PLoad258.3691.0055.7025.5530.13
80%*PLoad341.62119.9179.4634.4240.15
100%*PLoad439.58147.9981.7442.2649.44
120%*PLoad546.75164.9282.3550.9960.34
140%*PLoad610.44204.36122.9259.8570.25
Table 13. Reliability and cost results in sizing the HPV/FC energy system using the IAEO and ENSPmax = 5% considering load variations.
ENSPmax/ItemENSP (%)LOLE (h/yr)LOEE (MWh/yr)TNPC (M$)COE ($/kWh)
60%*PLoad0.02003020.33401.3490.2428
80%*PLoad0.02243750.49791.7990.3239
100%*PLoad0.02894080.79252.2470.4046
120%*PLoad0.02955230.98382.7050.4870
140%*PLoad0.03096191.20223.1470.5666
Table 14. Results of comparisons.
Ref.Hybrid SystemRegionReliability ConstraintCOE ($/kWh)
This paperPV/FCKuala Lumpur/Malaysia1%0.4465
This paperPV/FCKuala Lumpur/Malaysia5%0.4046
[37]PV/FCGorgan/Iran1%1.7924
[37]PV/FCUrmia/Iran1%2.0893
[37]PV/FCYazd/Iran1%0.8968
Disclaimer/Publisher’s Note: The statements, opinions and data contained in all publications are solely those of the individual author(s) and contributor(s) and not of MDPI and/or the editor(s). MDPI and/or the editor(s) disclaim responsibility for any injury to people or property resulting from any ideas, methods, instructions or products referred to in the content.

