Abstract
Considering the integration of distributed energy resources (DER) such as distributed generation, demand response, and electric vehicles, day-ahead scheduling plays a significant role in the operation of active distribution systems. Therefore, this article proposes a comprehensive methodology for the short-term operational planning of a distribution company (DisCo), aiming to minimize the total daily operational cost. The proposed methodology integrates on-load tap changers, capacitor banks, and flexible loads participating in demand response (DR) to reduce losses and manage congestion and voltage violations, while considering the costs associated with the operation and use of controllable resources. Furthermore, to forecast PV output and load demand behind the meter at the MV/LV distribution transformer level, a short-term net load forecasting model using deep learning techniques has been incorporated. The proposed scheme is solved through an efficient two-stage strategy based on genetic algorithms and dynamic programming. Numerical results based on the modified IEEE 13-node distribution system and a typical 37-node Latin American system validate the effectiveness of the proposed methodology. The obtained results verify that, through the proposed methodology, the DisCo can effectively schedule its installations and DR to minimize the total operational cost while reducing losses and robustly managing voltage and congestion issues.
1. Introduction
1.1. Background and Motivation
In recent years, the electric system has been undergoing significant transformations due to political–environmental concerns, such as the decarbonization of the electrical sector, combined with the liberalization of the electricity market, technological advancements, and the permanent increase in electricity demand. These changes present new challenges for energy supply, striving for an optimal trade-off among technical, economic, and environmental aspects [1]. Such shifts have led to the rapid exploitation of distributed energy resources (DER), which primarily impact the distribution system and end-users. This innovation implies a completely different environment from conventional distribution systems, encouraging the transition towards active distribution systems (ADS). ADS development is founded on comprehensive operational planning and active system management, taking into consideration all network elements to achieve the best balance between technical and economic factors. In this sense, Volt/Var control and demand response are two critical functions for managing electric systems. However, coordinating and integrating multiple resources causes important challenges that must be considered in distribution operational planning (DOP) tools. Therefore, the use of computationally robust and efficient algorithms that also provide modularity and scalability to the DOP problem is required. In addition, given that load forecasting is the basic data for the DOP, having an accurate forecasting model is completely necessary [2]. Nevertheless, the large-scale integration of renewable energy sources behind the meter (mainly photovoltaic solar energy), together with electricity demand behavior, present inherent variability that can affect the load forecasting performance.
Therefore, this work aims to propose a comprehensive short-term DOP framework, specifically for the day-ahead, that jointly considers Volt/Var control and demand response. The overall objective is to minimize the total operational cost through hourly scheduling of distribution company (DisCo) installations and demand response flexibility. Additionally, an efficient optimization strategy is incorporated for the multi-period DOP problem, along with a data-driven deep load forecasting solution.
1.2. Literature Review
1.2.1. Traditional Distribution Operational Planning
The DOP has been studied and modeled from various perspectives, focusing on different network functionalities, such as Volt/Var control (VVC) [3] and network reconfiguration. VVC aims to optimize voltage (to reduce power consumption via conservation voltage reduction (CVR)) and/or reactive power flow (to minimize power losses and voltage deviations) [4]. As a set of control variables, DisCo’s installations are generally considered, including on-load tap changers (OLTC), capacitor banks (CBs), and voltage regulators, collectively referred to as “VVC devices”. In this context, in [5] a VVC is formulated as a mixed-integer quadratic constrained programming problem for a distribution system (DS) in Vancouver, Canada. This problem considers the optimal scheduling of voltage regulators, CBs, and OLTC for daily operational planning. This framework minimizes DS losses and achieves total demand reduction with CVR, considering a limited number of switching operations of VVC devices. However, during the peak load period, CVR performance is affected, as any further reduction in voltage magnitudes could lead to violations of the established lower limits. Conversely, hourly scheduling of VVC with a day-ahead for a medium voltage DS is conducted in [6]. The optimal control considers CBs located on the feeders and the OLTC of the substation, aiming to minimize active power losses and improve voltage deviations in the network. This multi-period approach is solved using a simplified dynamic programming (DP) based on rules defined by the authors. While this rule-based approach addresses the curse of dimensionality of exhaustive exploration, it is important to bear in mind that it cannot guarantee effectiveness in the face of any change in system operating conditions.
These traditional techniques, with the development of ADS and the operational consequences it entails (branch overloads, voltage fluctuations, bidirectional power flows, to name a few), will impact their performance and will not be enough for ADS [3,7]. This has led to the emergence of other network functionalities and new actors, such as energy storage systems [8] and demand response (DR) programs, as sources of flexibility for managing electric systems. Even with the integration of fast-response resources, such as energy storage, control strategies with higher temporal resolution (i.e., a few minutes) could be implemented, as discussed in [8,9].
Hence, DisCos can utilize their assets, i.e., “VVC devices”, and DER flexibility to reduce losses, optimize their system’s voltage, minimize local congestions, and generally optimize network operation via DOP.
1.2.2. Demand Response as a Resource for DOP
Considering that DR is regarded as a cost-effective solution for modifying the load curve when the system is under stress, recent research works propose approaches considering this resource. Various DR studies aimed at different types of customers (industrial, commercial, and residential) have been developed to attain the benefits of peak load reduction and energy efficiency [10]. Depending on the response mechanism, DR can be categorized into two schemes. The first scheme is incentive-based and is typically offered as a contract through direct load control [11], whereas the second, a price-based scheme, aims to motivate users to modify their energy consumption patterns in response to time-varying electricity prices [1]. Both categories have their own benefits and leverage different aspects of flexible demand potential. A detailed review of DR schemes and programs in ADS can be found in [12]. This work focuses on a price-based DR scheme as a flexibility resource for ADS operation.
In this regard, [13] proposes dynamic pricing to prevent distribution network congestions and manage the charge/discharge of electric vehicles connected to the grid. A daily scheduling for an ADS perceived as an AC optimal power flow problem is conducted in [14]. The authors consider DR and distributed solar generation located at MV as control variables to minimize predicted voltage violations. Similarly, dynamic prices to incorporate DER into the ADS operation and manage overloads while reducing network losses are developed in [15]. Despite this, these formulations consider DR as an independent strategy and ignore “VVC devices” as control variables. Hence, recent works integrate VVC schemes together with DR programs, managing to minimize operational costs, handle congestion, resolve voltage issues, and improve the efficiency of the day-ahead distribution network [16,17,18,19,20].
1.2.3. Metaheuristic Optimization and Two-Stage Approaches in DOP
Due to the non-linear and non-convex nature of the DOP problem, involving both continuous and discrete variables, various approaches consider linear approximations to address the original large-scale complex problem and improve computation times [5,17,18]. These approximation techniques can lead to losses in calculation accuracy and result in suboptimal control strategies. Furthermore, these methods, based on classic optimization algorithms, often heavily rely on a specific mathematical formulation, limiting their ability to easily adapt to new operating conditions in ADS.
Hence, heuristic and metaheuristic techniques have been applied to address the DOP problem. The primary advantage of these approaches is their capacity to tackle non-convex optimization problems, without needing an objective function or constraint differentiability, thereby surpassing the drawbacks of traditional optimization algorithms [21]. These metaheuristic algorithms are generally inspired by natural or social phenomena. Various optimization techniques, such as genetic algorithms (GA) [22], artificial hummingbird algorithm [23], sine cosine [24], particle swarm optimization (PSO) [20], mean variance mapping optimization [25], and artificial bee colony [26], among others, have been implemented to solve the DOP problem. In [20], the authors integrate flexible load, CBs, and OLTC to minimize system losses and reduce load peaks, considering a maximum number of daily operations for CBs and OLTC in the problem constraints. Then, a day-ahead DOP is proposed in [27], which is formulated as a cost minimization problem that integrates OLTC operations and DR to solve voltage violations and minimize costs due to energy losses and DR usage. A comprehensive proposal for cost minimization in an ADS is presented in [28], taking into account technical, operational, and reliability aspects. However, the focus of this study is confined to a maximum interval of 1 h, leaving the daily coordination of control variables beyond the study’s scope. Despite this, it is crucial to note that the authors consider VVC device degradation by including a cost associated with each switching operation, rather than setting a maximum limit of daily operations. This strategy has proven to be more effective, considering that daily operation limits are often based on the planner’s experience.
Conversely, in [29], a Python-DIgSILENT interface is introduced with the aim of minimizing total energy losses in a power system through the management of CBs, OLTC, and conventional generators. The main contribution of this model-based approach is the combination of DIgSILENT’s system modeling capabilities and power flow calculation, as well as the implementation of the GA-based optimization algorithm, through the Python programming environment. Similarly, several approaches [20,30,31] have extended this concept towards ADS, using the EPRI distribution system simulator, OpenDSS [32], along with intelligent search algorithms to effectively solve the optimization problem.
However, most of the prior studies in the literature do not efficiently address the dimensionality of the multi-period DOP problem, considering the complexity and computational cost inherent in such problems [33,34]. In this sense, recent works have proposed two-stage approaches to address this combinatorial challenge [35,36]. In [35], a multi-period problem that minimizes losses and enhances reliability is solved through network reconfiguration. In the first stage, the harmony search algorithm is employed to determine an effective set of configurations that minimize both loss cost and interruption cost for each period. In the second stage, from those configurations found and the switching cost between periods, the optimal reconfiguration scheme for the entire horizon is determined using the DP algorithm. However, this approach does not consider DR and VVC devices as control variables.
1.3. Contribution of This Paper
In summary, it is evident that distribution operational planning (DOP) has evolved over the years. However, in most preceding literature, DR and VVC are treated as independent problems. Formulations that consider the collective impact of load flexibility and VVC devices are based on classical optimization algorithms and solve them through transformations and linearization. Additionally, numerous studies formulate the multi-period optimization problem as a single-stage problem, which incurs significantly greater challenges compared to the static version. On the other hand, a short-term forecasting model based on AI (deep learning) capable of accurately estimating the load or net load (i.e., the sum of consumption and photovoltaic generation behind-the-meter) used as input data for DOP is not systematically integrated. The literature lacks a comprehensive framework that considers price-based DR and VVC devices together to minimize the total day-ahead operational cost. Also, data-driven forecasting solutions and efficient optimization strategies for the multi-period DOP problem are missing. Therefore, the main contributions of this work are:
- A comprehensive methodology that addresses the day-ahead DOP problem and minimizes the total operational cost of the distribution company (DisCo) through the coordination of DR and VVC devices, such as CBs and OLTC. It considers costs associated with energy losses, congestion, voltage violations, and costs due to the switching operations of VVC devices and use of DR. Furthermore, this methodology is based on an open-source Python-OpenDSS interface and aims to exploit the functionalities of both types of software. To the best of the authors’ knowledge, this approach has not been proposed in existing DOP formulations for ADS.
- A robust and computationally efficient two-stage solution strategy, combining GA and DP to solve the multi-period DOP problem. In the first stage, the GA identifies the n best solutions for each hour that minimize loss costs, congestion costs, voltage violation costs, and costs for using DR. In the second stage, from these sets of n best solutions per hour and the costs associated with the operation of CBs and OLTC between periods, the optimal scheduling for the next 24 h is identified using the DP algorithm.
- To reduce the effects of photovoltaic generation and demand variability, a novel end-to-end net load forecasting model based on an effective combination of deep learning techniques has been incorporated. In this work, nodal injection powers, which can be only load or a blend of load and small-scale generation behind-the-meter, are considered as input data for DOP.
To validate the proposed methodology, numerical simulations are performed on the modified IEEE 13-node distribution system and a typical 37-node Latin American system. The results demonstrate the efficiency and robustness of the methodology. The rest of the paper is organized as follows: the problem formulation and the description of the proposed methodology are included in Section 2 and Section 3, respectively. The results obtained with the test systems are presented in Section 4, and finally the conclusions derived from this work are given in Section 5.
2. Problem Formulation
This work introduces a short-term (24-h ahead) DOP methodology for a DisCo. For this, the states of CBs, the tap positions of OLTCs, and the electricity prices (by DR) are considered as control variables in each hour. The detailed formulation of each component is described in the following subsections.
2.1. Optimization of the Operational Cost Function
The optimization problem is formulated by minimizing the operational cost function over the entire scheduling horizon as follows:
where reflects the cost of active power losses in the entire system. is the cost associated with voltage violations at the nodes. is the cost associated with congestion on system branches. indicates the cost incurred due to the demand response program. Meanwhile, and are the costs of CBs and OLTC switching operations, respectively. Furthermore, the formulation is subject to active and reactive power balance constraints at each system node and for each optimization period .
The cost of losses, voltage violation cost, and congestion cost are obtained after the power flow analysis. In Equation (2), the cost of losses is calculated using all branch losses for each hour obtained directly after running the power flow.
where represents the energy cost ($/kWh) and are total system losses in each period .
Likewise, the mathematical expression of the cost associated with voltage violations is given by Equations (3) and (4). In this case, is the cost of supplied energy with poor quality ($/kWh) [37]. is the number of load nodes. represents the load at node in period . is a penalty constant for voltage violations. and are the minimum and maximum voltage limits at node , respectively. is the voltage at node in period .
On the other hand, the calculation of the cost associated with the system branch congestion is given by Equations (5) and (6). In this case, is the cost of branch capacity violation ($/kWh) [37]. is the number of branches. represents the power flow exceeding the branch capacity limit in period . is a penalty factor for branch capacity violation in period . is the maximum capacity limit of branch .
The operational cost due to the demand response program is given by Equation (7). Here, is the cost of modifying the demand through DR in period ($/kWh). is the number of load nodes participating in DR (flexible nodes). is the load variation due to the new electricity price of node in period .
Finally, cost functions associated with the daily operations of the OLTCs of the substation transformers and capacitor banks are defined in Equations (8) and (10), respectively. These expressions are formulated with the goal of preserving the lifespan of the equipment and averting maintenance over costs. On one hand, denotes the cost per maneuver of the transformer’s tap changer ($/per maneuver), and is the number of transformers. means the OLTC tap position of transformer at time period . Additionally, the minimum and maximum limits that the tap position of transformer can assume for each period is established in Equation (9). On the other hand, stands for the switching cost of the capacitor bank ($/per maneuver), represents the number of installed capacitor banks, and is the state of the capacitor bank at time period .
2.2. Demand Response Management
Recognizing the potential of DR programs, DisCos are increasingly taking initiatives to implement these programs. In this regard, time-variant or dynamic pricing schemes encourage customers to reduce their consumption during peak periods, when the pool prices, as well as the network operational costs, are higher. An appealing and modest method to evaluate the potential of flexible demand in response to these variable or dynamic prices is through price elasticity. Other approaches, including detailed consumption behavior, utility function, and data-driven methods, have been applied to model this resource. For instance, in [38], actual DR data was used to map the relationship between dynamic prices and flexible demand by using machine learning techniques such as XGBoost.
In economics, elasticity rate is a measure used to evaluate a good or service demand response to a change in its price. Specifically, for ADS, the price elasticity of demand measures the customer’s demand sensitivity with respect to changes in prices. Typically, elasticity is negative, indicating an inverse relationship between electricity demand and electricity prices [39]. Several studies have investigated the price elasticity of demand for ADS [40,41,42]. In [43], the authors determined that price elasticities of demand can vary between −0.2 and −0.8, based on data and surveys conducted in the U.S. Furthermore, in [40,42], it was concluded that electricity demand is more elastic during peak hours compared to off-peak hours, making DR an efficient resource for enhancing system safety and quality during times of high stress.
Consequently, the resultant demand during time period t under dynamic price-based DR is defined as:
where is the new demand of node in time period under the electricity selling price . is the base nodal injection power predicted by DisCo of node in time period , according to the selling price under a flat rate . is the elasticity coefficient for node in time period . Moreover, given that DisCos have a natural monopoly regarding electricity supply, service prices are regulated and subject to certain constraints to ensure fairness to customers. These restrictions are known as regulatory constraints [44]. In this scenario, in Equation (13), and are predetermined coefficients of electricity selling price limits. As the purpose of this study is to explore the potential of time-variant prices to provide flexibility to system operation, the determination of elasticity values is beyond the scope of this work. Thus, the elasticity values are directly obtained from existing literature. Note that in Equation (7), is employed, which is the difference between and in each hour.
2.3. Nodal Injection Power Forecasts
The unpredictability of renewable energy sources, as well as the random behavior of electrical demand, have a significant impact on the safety, quality, and therefore the operational costs of the system. Thus, obtaining accurate load forecasts is crucial to the decision-making process related to operational planning and ADS management. In this sense, since small-scale renewable energy sources, primarily solar type (PV-DG), are rapidly growing and becoming an essential component of ADS, a shift from load forecasting to net load forecasting is necessary. Hence, the forecast outcome is the blend of rooftop PV-DG behind-the-meter and load demand. However, including PV-DG behind-the-meter makes net load forecasting more complex, particularly at higher levels of spatial granularity (e.g., distribution transformers), as seen in previous studies [45,46]. To overcome the aforementioned complexity, in this work, we use a short-term net load forecasting model developed in [47] to estimate the input data for the DOP, i.e., the hourly nodal injection powers observed behind-the-meter of the MV/LV distribution transformers. It is essential to note that each node in the system can have only load or net load; however, the data-driven model can provide accurate results for either case. More detailed information on model aspects, including the utilized data, implementation specifics, and hyperparameter fitting process, is available in [47,48]. We refer readers to [47] for a comprehensive review of this innovative model.
In general, the aim is to model the conditional distribution of the future time series, in this case, the nodal injection power, based on the historical power data as well as influential variables (also known as exogenous variables). For this purpose, we used an Encoder–Decoder architecture that was initially implemented for natural language processing. In the encoder part, a deep neural network that combines dilated causal convolutions, residual blocks, and skip connections is constructed to model the stochastic process of historical observations and build a fixed-dimensional latent or state representation. After this, in the decoder part, the N-timestamps ahead are predicted based on this latent representation. Note that the decoder incorporates a double-input residual network to consider both past observations and future exogenous variables, with the aim of achieving greater accuracy in the prediction. The joint distribution of estimations is defined as follows:
where represent the past observations, stands for each future observation, is the prediction horizon, and is the number of considered exogenous variables. Upon constructing the model, a training process and parameter tuning are performed in accordance with the general machine learning process [49]. After this training phase, the model becomes capable of executing short-term deterministic forecasts (for the subsequent 24 h) with a high level of accuracy. These results are evaluated using standard error metrics employed in load forecasting tasks, such as root mean square error (RMSE) and mean arctangent absolute percentage error (MAAPE), to ensure the reliability of input data for DOP.
3. Proposed Methodology
In this work, due to the non-convexity and non-linearity of the multi-period DOP problem, we propose a two-stage solution strategy based on metaheuristic optimization and DP. With this combined approach, the methodology can efficiently manage high computational efforts in a reasonable time as the size of the problem increases. As discussed earlier, CBs, OLTCs, and DR-based dynamic prices are considered as control variables to minimize the daily operational cost given by Equation (1). Due to the discrete operation of the VVC devices, the DR price, which is originally a continuous control variable, is transformed into a discrete variable with a predetermined resolution.
As a result, the DOP problem is formulated as a combinatorial problem. If a full search algorithm is employed, considering periods, control variables, and each variable having discrete options, there will be possible daily DOP scheduling schemes. One of these schemes will achieve the lowest daily operational cost. This illustrates that finding an optimal daily DOP schedule is a complex task, especially in large distribution networks. Moreover, even if the combinatorial problem is solved solely through DP, the resulting computational complexity can be expressed as [50]. Therefore, to address this problem, we propose a novel two-stage strategy that combines DP with a GA.
The general framework of the proposed methodology for DOP is depicted in Figure 1. Using the deep forecasting model described in Section 2.3, the nodal injection powers for each period (hour) are generated. From this data, the DP+GA strategy is applied to determine the day-ahead scheduling of CBs states, OLTC tap positions, and electricity prices that minimize the operational cost function. The details of the aforementioned parts of the proposed methodology are investigated in the following sections. It is important to note that the distribution systems under analysis have been modeled in the OpenDSS tool. Through this tool, power flow calculation is performed to evaluate the objective function, based on updating the considered control variables. Moreover, Python is used to access all OpenDSS functionalities [51] and to code the remaining components of the proposed methodology, such as load forecasting, optimization strategy, and data analysis.
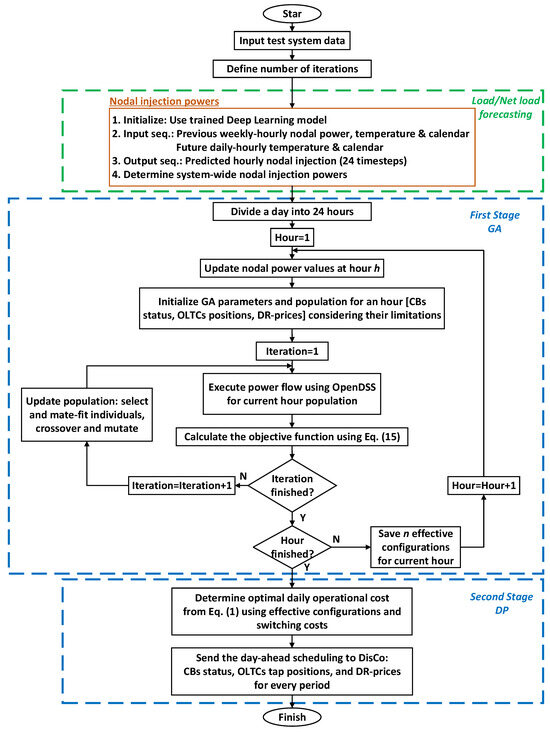
Figure 1.
The proposed methodology flowchart.
3.1. Finding Effective Configurations Using the Genetic Algorithm
In this initial stage, the day is divided into 24 h time periods, and the best candidate states for each hour are obtained through the GA, necessary to execute the DP algorithm. It is worth noting that each state represents a specific configuration of control variables. In this way, the search space of all possible CB, OLTC, and price configurations at each hour is significantly reduced to a set of best solutions that minimize loss costs , congestion costs , voltage violation costs , and DR utilization costs . The GA is an intelligent algorithm inspired by genetic evolution and natural selection to find the best possible solution to a given problem. To accomplish this, an initial set of individuals (candidate solutions) undergo stages of selection, crossover, and mutation with the aim of improving a given fitness function. This cycle is repeated for a predefined number of generations, allowing the solutions to evolve and increasingly approximate the optimal solution. Detailed descriptions of GA can be found in [52,53,54]. For this initial stage, in accordance with Equation (1), the optimization problem is specified as follows:
where denotes the objective function for each hour, which does not consider the interaction between periods, i.e., the switching costs of CBs and OLTCs. Once the GA search process is completed, the best solutions ( states with the smallest ) are stored for later consideration by the DP to find the daily schedule.
3.2. Dynamic Programming Algorithm
After obtaining the effective configurations for each hour, DP is employed to find the daily schedule considering the operation costs of CBs and OLTCs. These operation costs are considered as the transition cost to go from state in period to state in period . In this sense, the recursive DP algorithm is displayed as follows [35,55]:
where is the optimal (minimal) total cost value up to state at stage . It is clear that, to find , one needs the values of for each state of the preceding stage . Similarly, to determine the values at , one needs to know the values at , and so forth. To start the process, the calculation of the values in the initial period is carried out and calculations for subsequent stages continue until the period , where the minimum value of the daily operational cost will be obtained. Following this, the path is reconstructed backwards to determine the sequence of states at each period that leads to the optimal solution. The flowchart of the proposed DP + GA strategy (based on effective configurations for each hour) is illustrated in Figure 2.
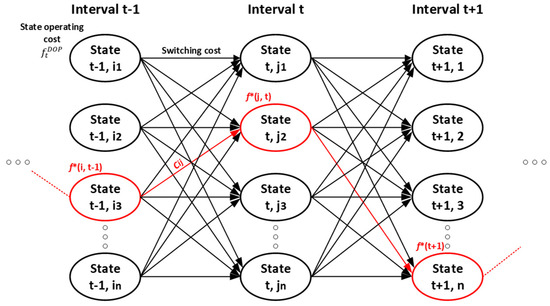
Figure 2.
Dynamic programming algorithm based on n effective configurations.
4. Numeric Results and Discussions
In this work, two distribution systems are used: Test System I—a modified IEEE 13-node system and Test System II—a typical Latin American 37-node system. Both systems are balanced, three-phase 13.2 kV networks featuring three main sectors: industrial (Ind), commercial (Com), and predominantly residential (Res). Note that the distribution systems are assumed to be balanced. This hypothesis is because, in Latin America, DisCos generally locate their LV loads in a way that achieves a balanced network at the MV level.
Additionally, PV-DG for self-consumption is considered, with the capability to deliver surplus power to the grid. Since its installation is based on a “Net Metering” scheme, it is not included as a control variable for the DOP, as users seek to fully harness this energy resource. Nonetheless, these PV-DG injections are taken into account in the nodal power forecasts. The planning of the systems (i.e., network design, components and their specifications, capacity, and location, among others) is not the focus of this work. Instead, the objective is the optimal management of operation, i.e., the scheduling of VVC devices and DR to minimize the day-ahead operational cost function. To verify the accuracy of the results obtained via the DP + GA approach, all analyzed cases are initially run using the DP algorithm (exhaustive search). This allows theoretically optimal results to be obtained, thus adjusting the GA parameters, and determining the appropriate number of effective configurations. The main data from both systems are available online at [56]. Lastly, the adopted technical and economic specifications for the DOP [25,37,41] are displayed:
- Energy cost to evaluate energy losses: $0.1/kWh.
- Energy cost supplied in poor quality for voltage violations ±5%: $0.35/kWh.
- Energy cost for not supplied energy due to capacity violations >80%: $1.00/kWh.
- Energy price, under flat rate: $0.1/kWh.
- Cost per CBs’ switching operation: $4/per maneuver.
- CBs are fixed, i.e., connected state (1) or disconnected state (0).
- Cost per OLTC switching operation: $6/per maneuver.
- OLTC tap positions range between [0.9, 1.1] p.u. of nominal voltages with a step size of 0.0125.
- It is assumed that three load nodes in Test System I and four load nodes in Test System II participate in DR. Elasticity details are given in Table 1.
 Table 1. Elasticity values.
 - Coefficients and , which limit the selling prices of electricity, are set at 0.5 and 1.5, respectively. These values are considered acceptable as they take into account the interests of both the DisCo and users. Thus, prices can vary between (0.05, 0.15) $/kWh and they have been discretized with a resolution of 0.025.
4.1. Test System I—IEEE 13-Node System
The one-line diagram of Test System I is illustrated in Figure 3, which includes the following control variables: the OLTC of the substation transformer, two CBs connected at nodes 675 and 611, and three nodes with flexible loads participating in DR (645, 675, and 652). The peak load demand is 6 MW during the 16:00 h. For this test system, real measurements from the relational database of the “Caucete Smart Grid” project, located in the Province of San Juan, Argentina [37,47,56], are used. This dataset has smart meter records of load consumption and PV-DG aggregated at the 13.2 kV/380 V distribution transformers. The resulting forecasts are examined in the following subsection.
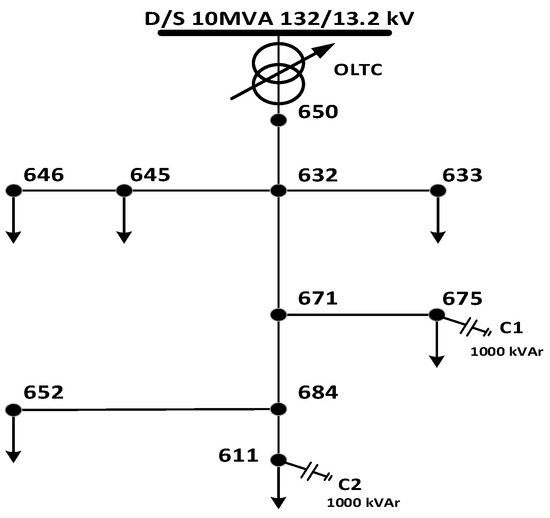
Figure 3.
Test system I: One-line diagram.
4.1.1. Day-Ahead Input Data
In line with the general methodology of machine learning, the training of the forecast models for each system node is conducted, as described in Section 2.3. To accomplish this, around 80% of the dataset is used as training data, about 10% is chosen for validation, and the remaining 10% is considered for testing. The data recording period used for this purpose spans from 1 January 2019 to 31 December 2020. Likewise, exogenous variables, such as temperature and calendar information (hour of the day, day of the week, and season of the year), are included to improve forecasting accuracy. The results of the nodal power forecast for the next 24 h are shown in Figure 4, along with their actual values (measurements) for a typical summer weekday for nodes 652 and 646. Here, two forecast cases were considered. For the first case (node 646—industrial user), the recorded measurements are only load consumption, i.e., load forecast. In the second one, the measurements include PV-DG behind the meter, converting it into a net load forecast (node 652—predominantly residential with 28% PV-DG). Additionally, the load profiles for the entire system are illustrated in Figure 5.
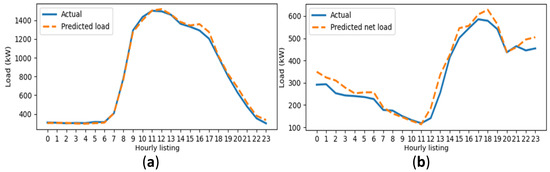
Figure 4.
Day-ahead nodal injection powers: (a) Predicted load—node 646; (b) Predicted net load—node 652.
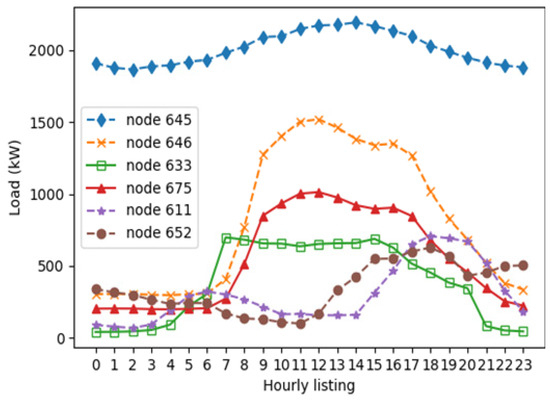
Figure 5.
Test system I: Predicted load profiles.
From these results, it can be seen in Figure 4 that all the predicted values are close to the actual values. Thus, for node 646 (load forecast), the model produces an MAAPE of 0.03 and an RMSE of 28.5, while for node 652 (net load forecast), the resulting MAAPE and RMSE are 0.09 and 35.3, respectively. From the results, it can be said that the proposed model performs well in both short-term load and net load forecasting. It is evident that adding PV-DG increases forecasting variability, but in this case its effect on the analyzed metrics is small. Therefore, this information is suitable for performing the proposed DOP.
4.1.2. Results
This section presents the results justifying the need of the proposed formulation, followed by the analysis regarding the reduction of losses and minimization of existing voltage and capacity violations. For an in-depth analysis of the impact of renewable energies on the DOP, several cases are proposed considering different levels of PV-DG penetration in the system. The considerations for each case are shown in Table 2. Moreover, to simulate non-optimized cases, the OLTC settings are in their nominal ratio, the CBs are connected, and the electricity price is $0.1/kWh. In Case I, all system nodes solely have energy consumption, except node 652 which has 28% PV-DG in relation to peak demand (original dataset). After applying the proposed methodology, the day-ahead scheduling and its corresponding daily operational cost are obtained. The obtained results are displayed in Figure 6.
Table 2.
Comparison of results with various cases analyzed for Test system I.
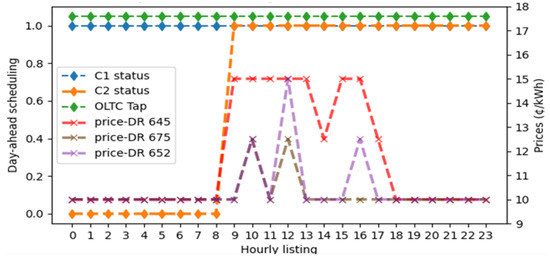
Figure 6.
Case I—DOP (Test system I): Day-ahead scheduling.
It is demonstrated in Figure 6 that the OLTC tap position remains constant over the course of 24 h. Moreover, the connection states of CBs C1 and C2 are similar, with the difference that C2 is proposed to be connected at 08:00 h and C1 at 00:00 h. The sale prices in some hours exhibit similar behaviors, with the noteworthy point that node 645 (industrial) has a higher participation of DR for DOP. In summary, the daily operational cost of the DisCo is $944.6.
The reductions in losses and the management of voltage and capacity violations for each hour are displayed in Figure 7. On one hand, the proposed methodology reduces the cost due to energy losses by over 19.8% (from $395.1 to $316.1), as indicated in Table 2. On the other hand, the minimum and maximum values of system-wide voltages are illustrated in Figure 7c. From this, violations of the minimum magnitude limit are particularly identified during peak load periods (12:00 h–19:00 h). With the proposed methodology, voltages converge within permitted limits, and costs due to voltage violations are reduced to $0. Regarding capacity violations, branches 650–632 and 632–645 exceed the established maximum operation limit of 0.8 p.u., which are shown in Figure 7d. After performing the DOP, congestion in 650–632 (main feeder) is completely solved due to the coordinated participation of DR and VVC. However, in branch 632–645, congestion is eliminated in most periods, except at 12:00 where it is only minimized. This results in an increase of $424.4 in operational cost due to congestion. It is important to note that congestion persists due to a lack of DR resource availability in that area. This is evident in Figure 7b, where the price at node 645 reaches its upper limit, thus resulting in the maximum reduction of available load during these high congestion periods. In this regard, the DisCo could promote a greater participation of DR or encourage the incorporation of distributed energy resources in that area, providing more flexibility in the system operation.
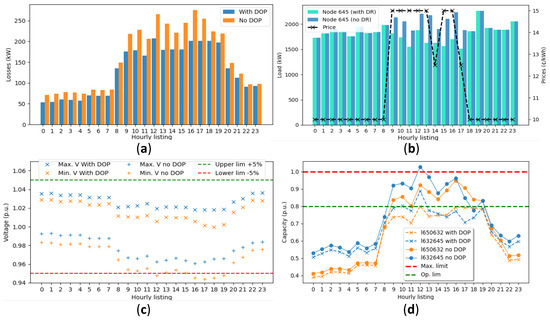
Figure 7.
Case I—DOP: (a) Loss reduction; (b) DR participation—node 645; (c) minimum and maximum nodal voltages; (d) Branch congestion minimization.
To analyze the impact of operational costs associated with VVC devices and DR on the DOP, Case II is conducted. In this case, the results are obtained considering an exclusively technical analysis aimed at reducing losses and minimizing existing voltage and capacity violations. Thus, the daily operational cost decreases to $445.7, which is approximately 52.7% less than the cost obtained in Case I. The scheduling of control variables for the following 24 h is displayed in Figure 8, revealing an increase in the operations of OLTC, CBs, and DR. It is important to consider that in this case the costs associated with the operation of resources are not taken into account, which leads to higher variability in the configurations. This could potentially negatively impact the lifespan of the devices and affect user satisfaction levels. Clearly, a detailed cost analysis associated with resource management is vital for achieving an effective DOP from both a technical and economic standpoint.
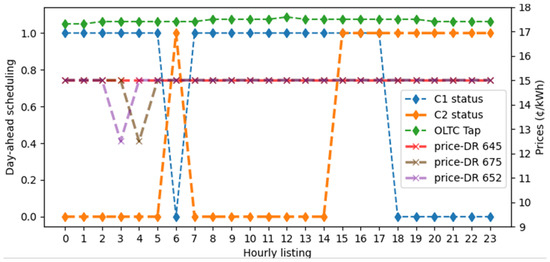
Figure 8.
Case II—DOP: Day-ahead scheduling without operational cost.
On the other hand, to analyze the impact of renewable energy on the DOP, PV-DG is incorporated at nodes 611 and 646 at 50%, relative to their daily peak demand (Case III and IV, respectively). The obtained results are summarized in Table 2. In Case IV, the inclusion of PV-DG at both nodes directly affects the reduction of energy loss costs and the minimization of voltage and capacity violations compared to Case I. With the proposed methodology, an additional reduction of 9.8% in loss costs is achieved, and voltage and capacity violations are completely resolved for all hours of the next day. It is essential to highlight that minimal management of VVC devices is required in this case to achieve efficient system operation. Additionally, thanks to the reduction of reactive power flow throughout the system due to VVC, minor existing congestion issues are solved, and load reduction by DR is avoided. As a result, the operational cost faced by the DisCo is reduced to $295.0.
4.2. Test System II—LA 37-Node System
To validate and test the effectiveness of the proposed methodology, the DOP is implemented on a typical Latin American medium-scale distribution system with 37 nodes. The one-line diagram of Test System II is presented in Figure 9, along with the load profiles of nodal injection powers. The peak load demand is 18 MW during the 21:00 h.
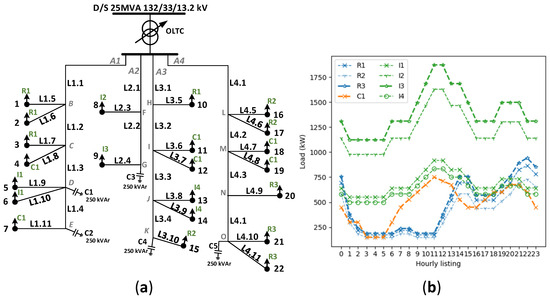
Figure 9.
Test system II: (a) One-line diagram; (b) Load profiles.
This system includes I1, I2, I3, and I4 type industrial users, C1 commercial users, and R1, R2, and R3 residential users. As control variables, there is an OLTC, five CBs, and four nodes with flexible loads managed to achieve the minimum daily operational cost. The OLTC is located at the substation transformer, the CBs are connected at nodes D, E, G, K, and O, and the loads participating in DR are located at nodes 5, 9, 11, and 22. In the base case (Case I), all load nodes have only energy consumption, similar to that implemented in [37]. For Case II, PV-DG is incorporated at nodes 4, 20, and 21 at 50% of their daily peak demand. Finally, in Case III, solar generation is added at node 2. Likewise, the initial settings of OLTC, CBs, and electricity prices are kept at their original values throughout the horizon to simulate cases without optimization.
The analyzed cases are summarized in Table 3 and the effectiveness of the proposed methodology is demonstrated in reducing losses and minimizing voltage and capacity violations. The scheduling of the control variables for the base case after applying the proposed methodology is illustrated in Figure 10. In this case (Case I), a significant reduction in the daily operational cost is achieved, moving from $25,476.4 to $10,660.9. This is due to a 14.6% decrease in loss costs, a 100% elimination of voltage violation costs, and a 55.1% reduction in capacity violation costs. The reduction of total losses for each hour, as well as the maximum and minimum values of system-wide voltages and the load reduction at node 5 due to DR, are depicted in Figure 11.
Table 3.
Comparison of results with various cases analyzed for Test system II.
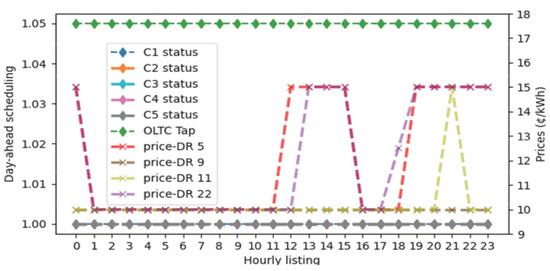
Figure 10.
Case I—DOP (Test system II): Day-ahead scheduling.
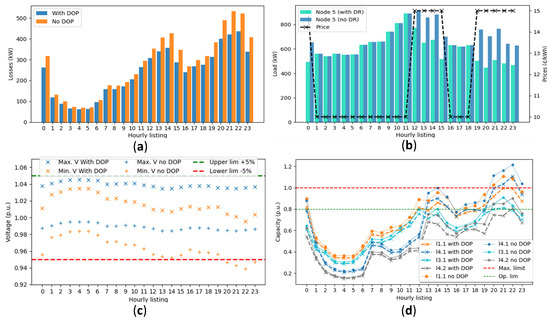
Figure 11.
Case I—DOP: (a) Loss reduction; (b) DR participation—node 5; (c) minimum and maximum nodal voltages; (d) Branch congestion minimization.
In addition, it is revealed in Figure 11d that congestion persists in the branches after the DOP during the 12:00 h–15:00 h and 19:00 h–23:00 h periods due to the lack of DR resources, similarly to what occurred in Test system I. To deal with this situation, PV-DG is incorporated according to Cases II and III, thereby solving congestion during the midday peak (12:00 h–15:00 h) when solar power injection is at its maximum. However, in the 19:00 h–23:00 h period, none of the analyzed cases manage to solve the congestion, implying that the DisCo may face considerably high operational costs. Despite this, the obtained numerical results support the effectiveness of the proposed methodology by demonstrating its ability to achieve satisfactory results related to the various objectives and cases analyzed.
Furthermore, it is important to highlight that one of the main challenges when incorporating PV-DG is the risk of localized over-voltages. Nonetheless, the proposed methodology effectively handles voltage management and even leverages this resource to solve congestion. This enhances the hosting capacity of renewable energy sources and promotes their widespread use within the network, in line with the concept of active distribution systems. Finally, although this work primarily focuses on day-ahead scheduling with hourly periods, our proposed methodology can readily adapt to different optimization horizons and intervals.
5. Conclusions and Future Works
This work proposes a new comprehensive methodology for day-ahead operational planning in active distribution systems. In this methodology, we mainly consider the active management of VVC devices and price-based DR to reduce energy losses and manage the congestion and voltage violation issues existing in the network. In this research, the objectives are achieved using flexible loads, capacitor banks, and OLTC formulated as a cost minimization problem. This enables the finding of efficient schedules while avoiding excessive VVC device operations and load reductions due to DR. Furthermore, the proposed methodology incorporates a short-term net load forecasting model based on deep learning to accurately estimate the nodal injection powers observed behind-the-meter at the MV/LV distribution transformer level. The optimization problem is solved using genetic algorithms and dynamic programming for each hour of the day-ahead. In this way, it maintains the accuracy of dynamic programming (based on exhaustive search) while significantly reducing computation times. Different case studies are conducted on two test distribution systems to analyze, on the one hand, the impact of renewable energies on DOP and, on the other hand, to validate the scalability and computational efficiency of the established formulation. For the base case, the total operational cost is reduced from $17,150.0 to $944.6 in the modified IEEE 13-node system and from $25,476.4 to $10,660.9 in the Latin American LA 37-node system (94.5% and 58.2% lower, respectively). In addition, Cases III and IV of the IEEE 13-node system yielded reductions in total daily costs of 92.3% and 81.2%, respectively. Cases II and III of the LA 37-node system achieved respective cost reductions of 58.2% and 56.4%. Furthermore, in the IEEE 13-node system, the integration of PV generation helps to completely eliminate congestion that is not solved with DOP due to the lack of DR resources. On the other hand, in the LA 37-node system, the situation is different, as the peak load demand of the day does not coincide with the hours of the highest PV generation, leading to sustained congestion and higher operational costs for the distribution company.
In a future work, an analysis will be conducted of the integration of renewable generation and energy storage systems as control variables to provide greater flexibility within the operational planning. On the other hand, the proposed methodology follows a deterministic approach, in which it is assumed that the information related to load demand and small-scale PV generation is accurately available. However, power output from PV sources and consumption are not firm but uncertain. These uncertainties can also impact the configurations of the VVC devices and DR. In [57], the authors propose a scenario-based stochastic VVC model for a distribution system that minimizes losses and voltage deviations, considering the probabilistic nature of solar generation and demand. Also, in [58], a stochastic daily scheduling is conducted for voltage regulation and peak reduction, using DER. However, in previous studies, generation and demand uncertainties are modeled independently through common (parametric) probability density functions. Note that it is no longer appropriate to continue assuming known distributions to model the uncertainty of blended generation and demand behind-the-meter. To address this, an extension of the proposed methodology with uncertainty considerations through appropriate non-parametric estimation and stochastic optimization methods is under development.
Author Contributions
Conceptualization, M.J., M.S. and R.R.; Data curation, M.J.; Formal analysis, M.J., M.S. and R.R.; Investigation, M.J., M.S. and R.R.; Methodology, M.J., M.S., R.R. and D.O.E.; Project administration, M.S.; Resources, M.S.; Software, M.J.; Supervision, M.S. and R.R.; Validation, M.J., M.S., R.R. and D.O.E.; Writing—original draft, M.J., M.S. and R.R.; Writing—review & editing, M.J., E.S., M.S., R.R. and D.O.E. All authors have read and agreed to the published version of the manuscript.
Funding
This research received no external funding.
Data Availability Statement
Not applicable.
Acknowledgments
We thank Sonia Daverio, who collaborated in the revision of English grammar. The Argentinean National Scientific and Technical Research Council (CONICET) supported this work with a scholarship for a Ph.D.
Conflicts of Interest
The authors declare no conflict of interest.
Nomenclature
| DER | distributed energy resources |
| ADS | active distribution systems |
| DOP | distribution operational planning |
| DisCo | distribution company |
| VVC | Volt/Var control |
| CVR | conservation voltage reduction |
| OLTC | on-load tap changer |
| CBs | capacitor banks |
| DS | distribution system |
| DP | dynamic programming |
| DR | demand response |
| GA | genetic algorithm |
| PV-DG | photovoltaic distributed generation |
| RMSE | root mean square error |
| MAAPE | mean arctangent absolute percentage error |
References
- Khan, A.R.; Mahmood, A.; Safdar, A.; Khan, Z.A.; Khan, N.A. Load forecasting, dynamic pricing and DSM in smart grid: A review. Renew. Sustain. Energy Rev. 2016, 54, 1311–1322. [Google Scholar] [CrossRef]
- Tsai, W.-C.; Tu, C.-S.; Hong, C.-M.; Lin, W.-M. A Review of State-of-the-Art and Short-Term Forecasting Models for Solar PV Power Generation. Energies 2023, 16, 5436. [Google Scholar] [CrossRef]
- Satsangi, S.; Kumbhar, G.B. Review on Volt/VAr Optimization and Control in Electric Distribution System. In Proceedings of the 2016 IEEE 1st International Conference on Power Electronics, Intelligent Control and Energy Systems (ICPEICES), Delhi, India, 4–6 July 2016; pp. 1–6. [Google Scholar] [CrossRef]
- Igiligi, A.; Vielhauer, A.; Ehrenwirth, M.; Hurm, C.; Summ, T.; Trinkl, C.; Navarro Gevers, D. Assessment of Conservation Voltage Reduction in Distribution Networks with Voltage Regulating Distribution Transformers. Energies 2023, 16, 3155. [Google Scholar] [CrossRef]
- Ahmadi, H.; Marti, J.R.; Dommel, H.W. A Framework for Volt-VAR Optimization in Distribution Systems. IEEE Trans. Smart Grid 2015, 6, 1473–1483. [Google Scholar] [CrossRef]
- Liu, Y.; Zhang, P.; Qiu, X. Optimal volt/var control in distribution systems. Int. J. Electr. Power Energy Syst. 2002, 24, 271–276. [Google Scholar] [CrossRef]
- Jurado, M.F.; Samper, M.E.; Rosés, R. Analysis and a Conceptual Framework of Short-Term Planning Operation of South American Active Distribution Systems. CIGRÉ Session Materials. París, 2022; C6-10508_2022. Available online: https://e-cigre.org/publication/c6-10508_2022 (accessed on 8 May 2023).
- Huo, Y.; Li, P.; Ji, H.; Yu, H.; Zhao, J.; Xi, W.; Wu, J.; Wang, C. Data-driven Predictive Voltage Control for Distributed Energy Storage in Active Distribution Networks. CSEE J. Power Energy Syst. 2022, 1–11. [Google Scholar]
- Evangelopoulos, V.A.; Avramidis, I.I.; Georgilakis, P.S. Flexibility Services Management Under Uncertainties for Power Distribution Systems: Stochastic Scheduling and Predictive Real-Time Dispatch. IEEE Access 2020, 8, 38855–38871. [Google Scholar] [CrossRef]
- McKenna, K.; Keane, A. Residential Load Modeling of Price-Based Demand Response for Network Impact Studies. IEEE Trans. Smart Grid 2016, 7, 2285–2294. [Google Scholar] [CrossRef]
- Bostan, A.; Nazar, M.S.; Shafie-khah, M.; Catalão, J.P.S. Optimal scheduling of distribution systems considering multiple downward energy hubs and demand response programs. Energy 2020, 190, 116349. [Google Scholar] [CrossRef]
- Siano, P. Demand response and smart grids—A survey. Renew. Sustain. Energy Rev. 2014, 30, 461–478. [Google Scholar] [CrossRef]
- Liu, Z.; Wu, Q.; Oren, S.S.; Huang, S.; Li, R.; Cheng, L. Distribution Locational Marginal Pricing for Optimal Electric Vehicle Charging Through Chance Constrained Mixed-Integer Programming. IEEE Trans. Smart Grid 2018, 9, 644–654. [Google Scholar] [CrossRef]
- Yang, R.; Jiang, H.; Zhang, Y. Short-term state forecasting-based optimal voltage regulation in distribution systems. In Proceedings of the 2017 IEEE Power & Energy Society Innovative Smart Grid Technologies Conference (ISGT), Washington, DC, USA, 23–26 April 2017; pp. 1–5. [Google Scholar] [CrossRef]
- Meng, F.; Chowdhury, B.H. Distribution LMP-based economic operation for future Smart Grid. In Proceedings of the 2011 IEEE Power and Energy Conference at Illinois, Urbana, IL, USA, 25–26 February 2011; pp. 1–5. [Google Scholar] [CrossRef]
- Vijayan, V.; Mohapatra, A.; Singh, S.N.; Tiwari, A. A Blended Approach to Improve Reliability and Efficiency of Active EDN via Dynamic Feeder Reconfiguration, Demand Response, and VVO. IEEE Trans. Autom. Sci. Eng. 2022, 1–12. [Google Scholar] [CrossRef]
- Bai, L.; Wang, J.; Wang, C.; Chen, C.; Li, F. Distribution Locational Marginal Pricing (DLMP) for Congestion Management and Voltage Support. IEEE Trans. Power Syst. 2018, 33, 4061–4073. [Google Scholar] [CrossRef]
- Spanias, C. Demand-side Volt/Var/Watt regulation for effective voltage control in distribution grids. In Proceedings of the 2019 IEEE PES Innovative Smart Grid Technologies Europe (ISGT-Europe), Bucharest, Romania, 29 September–2 October 2019; pp. 1–5. [Google Scholar]
- Tushar, M.H.K.; Assi, C. Volt-VAR Control Through Joint Optimization of Capacitor Bank Switching, Renewable Energy, and Home Appliances. IEEE Trans. Smart Grid 2018, 9, 4077–4086. [Google Scholar] [CrossRef]
- Vijayan, V.; Mohapatra, A.; Singh, S.N. Demand Response with Volt/Var Optimization for unbalanced active distribution systems. Appl. Energy 2021, 300, 117361. [Google Scholar] [CrossRef]
- Papadimitrakis, M.; Giamarelos, N.; Stogiannos, M.; Zois, E.N.; Livanos, N.A.-I.; Alexandridis, A. Metaheuristic search in smart grid: A review with emphasis on planning, scheduling and power flow optimization applications. Renew. Sustain. Energy Rev. 2021, 145, 111072. [Google Scholar] [CrossRef]
- Aryanezhad, M. Management and coordination of LTC, SVR, shunt capacitor and energy storage with high PV penetration in power distribution system for voltage regulation and power loss minimization. Int. J. Electr. Power Energy Syst. 2018, 100, 178–192. [Google Scholar] [CrossRef]
- Waleed, U.; Haseeb, A.; Ashraf, M.M.; Siddiq, F.; Rafiq, M.; Shafique, M. A Multiobjective Artificial-Hummingbird-Algorithm-Based Framework for Optimal Reactive Power Dispatch Considering Renewable Energy Sources. Energies 2022, 15, 9250. [Google Scholar] [CrossRef]
- Saddique, M.S.; Bhatti, A.R.; Haroon, S.S.; Sattar, M.K.; Amin, S.; Sajjad, I.A.; Sadam ul Haq, S.; Awan, A.B.; Rasheed, N. Solution to optimal reactive power dispatch in transmission system using meta-heuristic techniques―Status and technological review. Electr. Power Syst. Res. 2020, 178, 106031. [Google Scholar] [CrossRef]
- Tamayo, D.C.L.; Villa-Acevedo, W.M.; López-Lezama, J.M. Multi-Period Optimal Reactive Power Dispatch Using a Mean-Variance Mapping Optimization Algorithm. Computers 2022, 11, 48. [Google Scholar] [CrossRef]
- Marzband, M.; Azarinejadian, F.; Savaghebi, M.; Guerrero, J.M. An Optimal Energy Management System for Islanded Microgrids Based on Multiperiod Artificial Bee Colony Combined With Markov Chain. IEEE Syst. J. 2017, 11, 1712–1722. [Google Scholar] [CrossRef]
- Rahman, M.M.; Arefi, A.; Shafiullah, G.M.; Hettiwatte, S. A new approach to voltage management in unbalanced low voltage networks using demand response and OLTC considering consumer preference. Int. J. Electr. Power Energy Syst. 2018, 99, 11–27. [Google Scholar] [CrossRef]
- Shoeb, M.A.; Shahnia, F.; Shafiullah, G.M. A Multilayer and Event-Triggered Voltage and Frequency Management Technique for Microgrid’s Central Controller Considering Operational and Sustainability Aspects. IEEE Trans. Smart Grid 2019, 10, 5136–5151. [Google Scholar] [CrossRef]
- Sánchez-Mora, M.M.; Bernal-Romero, D.L.; Montoya, O.D.; Villa-Acevedo, W.M.; López-Lezama, J.M. Solving the Optimal Reactive Power Dispatch Problem through a Python-DIgSILENT Interface. Computation 2022, 10, 128. [Google Scholar] [CrossRef]
- Procopiou, A.T.; Ochoa, L.F. Asset congestion and voltage management in large-scale MV-LV networks with solar PV. IEEE Trans. Power Syst. 2021, 36, 4018–4027. [Google Scholar] [CrossRef]
- Subramanya, S.A.; Parathodiyil, M.; Nagashree, A.N. Implementation of Peak Demand Reduction on a Distribution Feeder using Python-OpenDSS co-simulation. In Proceedings of the 2021 IEEE International Conference on Electronics, Computing and Communication Technologies (CONECCT), Bangalore, India, 9–11 July 2021; pp. 1–6. [Google Scholar] [CrossRef]
- Dugan, R.C.; McDermott, T.E. An open source platform for collaborating on smart grid research. In Proceedings of the 2011 IEEE Power and Energy Society General Meeting, Detroit, MI, USA, 24–28 July 2011; pp. 1–7. [Google Scholar] [CrossRef]
- Vitor, T.S.; Vieira, J.C.M. Operation planning and decision-making approaches for Volt/Var multi-objective optimization in power distribution systems. Electr. Power Syst. Res. 2021, 191, 106874. [Google Scholar] [CrossRef]
- Morán-Burgos, J.A.; Sierra-Aguilar, J.E.; Villa-Acevedo, W.M.; López-Lezama, J.M. A Multi-Period Optimal Reactive Power Dispatch Approach Considering Multiple Operative Goals. Appl. Sci. 2021, 11, 8535. [Google Scholar] [CrossRef]
- Shariatkhah, M.H.; Haghifam, M.R.; Salehi, J.; Moser, A. Duration based reconfiguration of electric distribution networks using dynamic programming and harmony search algorithm. Int. J. Electr. Power Energy Syst. 2012, 41, 1–10. [Google Scholar] [CrossRef]
- Gutiérrez-Alcaraz, G.; Tovar-Hernández, J.H. Two-stage heuristic methodology for optimal reconfiguration and Volt/VAr control in the operation of electrical distribution systems. IET Gener. Transm. Distrib. 2017, 11, 3946–3954. [Google Scholar] [CrossRef]
- Samper, M.E.; Eldali, F.A.; Suryanarayanan, S. Risk assessment in planning high penetrations of solar photovoltaic installations in distribution systems. Int. J. Electr. Power Energy Syst. 2019, 104, 724–733. [Google Scholar] [CrossRef]
- Han, J.; Liu, N.; Shi, J. Optimal Scheduling of Distribution System with Edge Computing and Data-driven Modeling of Demand Response. J. Mod. Power Syst. Clean Energy 2022, 10, 989–999. [Google Scholar] [CrossRef]
- Jin, M.; Feng, W.; Marnay, C.; Spanos, C. Microgrid to enable optimal distributed energy retail and end-user demand response. Appl. Energy 2018, 210, 1321–1335. [Google Scholar] [CrossRef]
- Salazar, E.J.; Jurado, M.; Samper, M.E. Reinforcement Learning-Based Pricing and Incentive Strategy for Demand Response in Smart Grids. Energies 2023, 16, 1466. [Google Scholar] [CrossRef]
- Lu, R.; Hong, S.H.; Zhang, X. A Dynamic pricing demand response algorithm for smart grid: Reinforcement learning approach. Appl. Energy 2018, 220, 220–230. [Google Scholar] [CrossRef]
- Albert, A.; Rajagopal, R. Finding the right consumers for thermal demand-response: An experimental evaluation. IEEE Trans. Smart Grid 2018, 9, 564–572. [Google Scholar] [CrossRef]
- Miller, M.; Alberini, A. Sensitivity of price elasticity of demand to aggregation, unobserved heterogeneity, price trends, and price endogeneity: Evidence from U.S. Data. Energy Policy 2016, 97, 235–249. [Google Scholar] [CrossRef]
- Safdarian, A.; Fotuhi-Firuzabad, M.; Lehtonen, M. A Medium-Term Decision Model for DisCos: Forward Contracting and TOU Pricing. IEEE Trans. Power Syst. 2015, 30, 1143–1154. [Google Scholar] [CrossRef]
- Hong, T.; Pinson, P.; Fan, S.; Zareipour, H.; Troccoli, A.; Hyndman, R.J. Probabilistic energy forecasting: Global Energy Forecasting Competition 2014 and beyond. Int. J. Forecast. 2016, 32, 896–913. [Google Scholar] [CrossRef]
- Zhao, J.; Ding, F.; Zhu, H.; Lei, S. Behind-The-Meter Distributed Energy Resources: Estimation, Uncertainty Quantification, and Control. Tech. Report. PES-TR111. June 2023. Available online: https://resourcecenter.ieee-pes.org/publications/technical-reports/pes_tp_tr111_sblcs_60623# (accessed on 8 May 2023).
- Jurado, M.; Samper, M.; Rosés, R. An improved encoder-decoder-based CNN model for probabilistic short-term load and PV forecasting. Electr. Power Syst. Res. 2023, 217, 109153. [Google Scholar] [CrossRef]
- Open-Source Projects and the Research Data Repository of the Institute of Electrical Energy (IEE-UNSJ). [Online-OpenPy-DELF]. Available online: https://sourceforge.net/projects/openpy-delf/ (accessed on 8 May 2023).
- Gasparin, A.; Lukovic, S.; Alippi, C. Deep learning for time series forecasting: The electric load case. CAAI Trans. Intell. Technol. 2022, 7, 1–25. [Google Scholar] [CrossRef]
- Ikeda, S.; Ooka, R. Application of differential evolution-based constrained optimization methods to district energy optimization and comparison with dynamic programming. Appl. Energy 2019, 254, 113670. [Google Scholar] [CrossRef]
- Python Package Index py-dss-Interface September 2021. Available online: https://pypi.org/project/py-dss-interface/ (accessed on 14 November 2022).
- Haupt, R.L.; Haupt, S.E. Practical Genetic Algorithms, 2nd ed; John Wiley & Sons: Hoboken, NJ, USA, 2004. [Google Scholar]
- Deb, K. An efficient constraint handling method for genetic algorithms. Comput. Methods Appl. Mech. Eng. 2000, 186, 311–338. [Google Scholar] [CrossRef]
- Risi, B.-G.; Riganti-Fulginei, F.; Laudani, A. Modern Techniques for the Optimal Power Flow Problem: State of the Art. Energies 2022, 15, 6387. [Google Scholar] [CrossRef]
- Dreyfus, S.; Law, A. The Art and Theory of Dynamic Programming; Academic Press: Cambridge, MA, USA, 1977. [Google Scholar]
- Open-Source Projects and the Research Data Repository of the Institute of Electrical Energy (IEE-UNSJ). [Online-DOP Data]. Available online: https://sourceforge.net/p/operational-planning/ (accessed on 15 May 2023).
- Zhang, C.; Xu, Y. Hierarchically-Coordinated Voltage/VAR Control of Distribution Networks Using PV Inverters. IEEE Trans. Smart Grid 2020, 11, 2942–2953. [Google Scholar] [CrossRef]
- Guo, Y.; Zhang, Q.; Wang, Z. Cooperative Peak Shaving and Voltage Regulation in Unbalanced Distribution Feeders. IEEE Trans. Power Syst. 2021, 36, 5235–5244. [Google Scholar] [CrossRef]
Disclaimer/Publisher’s Note: The statements, opinions and data contained in all publications are solely those of the individual author(s) and contributor(s) and not of MDPI and/or the editor(s). MDPI and/or the editor(s) disclaim responsibility for any injury to people or property resulting from any ideas, methods, instructions or products referred to in the content. |
© 2023 by the authors. Licensee MDPI, Basel, Switzerland. This article is an open access article distributed under the terms and conditions of the Creative Commons Attribution (CC BY) license (https://creativecommons.org/licenses/by/4.0/).