Article

A New Bearing Fault Detection Strategy Based on Combined Modes Ensemble Empirical Mode Decomposition, KMAD, and an Enhanced Deconvolution Process

1
Laboratory of Identification, Command, Control and Communication (LI3C), Department of Electrical Engineering, University of Mohamed khider, Biskra 07000, Algeria
2
Laboratoire de Genie Electrique et des Energies Renouvelables (LGEERE), Department of Electrical Engineering, Faculty of Technology, University of El Oued, El Oued 39000, Algeria
3
Univ. Artois, UR 4025, Laboratoire Systèmes Electrotechniques et Environnement (LSEE), F-62400 Béthune, France
4
Department of Electrical Engineering, Faculty of Technology, University of Mohamed Khider, Biskra 07000, Algeria
*
Author to whom correspondence should be addressed.
Energies 2023, 16(6), 2604; https://doi.org/10.3390/en16062604
Submission received: 6 February 2023 / Revised: 2 March 2023 / Accepted: 4 March 2023 / Published: 9 March 2023
(This article belongs to the Special Issue Modeling, Control and Diagnosis of Electrical Machines and Devices)

Abstract

:
In bearing fault diagnosis, ensemble empirical mode decomposition (EEMD) is a reliable technique for treating rolling bearing vibration signals by dividing them into intrinsic mode functions (IMFs). Traditional methods used in EEMD consist of identifying IMFs containing the fault information and reconstructing them. However, an incorrect selection can result in the loss of useful IMFs or the addition of unnecessary ones. To overcome this drawback, this paper presents a novel method called combined modes ensemble empirical mode decomposition (CMEEMD) to directly obtain a combination of useful IMFs containing fault information. This is without needing to pass through the processes of IMF selection and reconstruction, as well as guaranteeing that no defect information is lost. Owing to the small signal-to-noise ratio, this makes it difficult to determine the fault information of a rolling bearing at the early stage. Therefore, improving noise reduction is an essential procedure for detecting defects. The paper introduces a robust process for extracting rolling bearings defect information based on CMEEMD and an enhanced deconvolution technique. Firstly, the proposed CMEEMD extracts all combined modes (CMs) from adjoining IMFs decomposed from the raw fault signal by EEMD. Then, a selection indicator known as kurtosis median absolute deviation (KMAD) is created in this research to identify the combination of the appropriate IMFs. Finally, the enhanced deconvolution process minimizes noise and improves defect identification in the identified CM. Analyzing real and simulated bearing signals demonstrates that the developed method shows excellent performance in extracting defect information. Compared results between selecting the sensitive IMF using kurtosis and selecting the sensitive CM using the proposed KMAD show that the identified CM contains rich fault information in many cases. Furthermore, our comparisons revealed that the enhanced deconvolution approach proposed here outperformed the minimum entropy deconvolution (MED) approach for improving fault pulses and the wavelet de-noising method for noise suppression.

1. Introduction

The large-scale use of induction machines accounts for 90% of the industry’s total energy consumption. Several defects often lead to unexpected failures. These defects can lead to severe damage to the machine if they are overlooked initially. According to previous studies, the high percentage of failures in induction machines is caused by bearing faults. As a result, it is highly recommended to monitor small and medium voltage machines continuously for bearing faults [1,2]. Bearing health condition is commonly monitored by vibration monitoring. The vibration signals provide a wealth of information regarding machine health conditions [3]. Many approaches aim to pick up the characteristic defect information from the rolling bearing’s non-stationary and nonlinear vibration signal by employing appropriate signal processing techniques. Huang et al. [4] created a time-frequency analysis approach known as empirical mode decomposition (EMD). EMD differs from short-time Fourier transform and wavelet transform as it is not dependent on the basis function. It is based on adaptive decomposition characteristics and decomposes signals into intrinsic mode functions (IMFs). EMD is suitable for non-stationary and non-linear vibration signals analysis [5], such as bearing faults, and has been widely used for this purpose. However, a significant problem with EMD is the mixing of modes. As a solution to this challenge, an improved version of EMD called ensemble empirical mode decomposition (EEMD) is proposed in [6]. An IMF in the EEMD consists of the average of a set of trials. The results of the EMD decomposition are used for each trial and a finite-amplitude white noise [7]. Compared to the EMD, IMFs produced by the EEMD can better highlight the signal’s significant features. The focus of researchers has always been on how to identify EEMD’s important IMFs and how to improve the level of noise minimization. These two main issues will be briefly discussed below.
Considering that the decomposed bearing vibration signal contains some IMFs representing defect features, as well as other IMFs containing unused information, researchers have focused on identifying suitable IMFs. Wang et al. [8] suggested the use of the highest value of kurtosis to pick the relevant IMF. Yang et al. [9] selected the effective IMF using mutual information. Li J et al. [10] calculated each IMF’s similarity to the input signal based on Spearman’s rho to identify the required IMF. A merit index for determining the relevant IMF has been proposed in [11]. However, if only the most suitable IMF is considered, fault information contained in other IMFs may be lost. In contrast, Li Z et al. [12] developed a weighted kurtosis index difference spectrum (WKIDS) to choose the important IMFs. Ma et al. [13] used the correlation coefficient to select the effective IMFs. Luo et al. [14] identified the effective IMFs by using high kurtosis values. However, Damine et al. [15] demonstrated that choosing the most suitable IMF can result in the loss of other important IMFs, and that selecting multiple IMFs can result in the inclusion of unnecessary ones. To address the abovementioned issues, this paper offers a novel approach called combined modes ensemble empirical mode decomposition (CMEEMD). This method is based on the extraction of combined modes (CMs) from the measured vibration signal. After that, a selection indicator is created to identify the combination of suitable IMFs. The purpose of this step is to obtain the most information about the defect directly from the input signal, without having to pass through the IMFs selection and reconstruction processes. It also ensures that no information about the defect is wasted or irrelevant data are included.
Owing to the effect of surrounding noise, extracting bearing fault information at the early stage of damage is challenging. Therefore, it is essential to reveal the defect pulses in the vibration signal. The most commonly used deconvolution process is the minimum entropy deconvolution (MED). The MED is designed to retrieve the bearing defect pulses in the input signal. Pennacchi et al. [16] examined the efficiency of the MED on experimental signals and found that it can detect bearing defects. However, when the original signal contains noise, the efficiency of MED is reduced. In addition, the output of MED will also be affected by noise interference. Therefore, researchers were concentrated on increasing the efficiency of the MED. Chatterton et al. [17] combined EMD with MED to improve bearing defect detection. Ding et al. [18] introduced a deconvolution process using autoregressive MED for extracting bearing features.
In view of the above considerations, this paper presents an enhanced deconvolution approach, which focuses on eliminating the noise interference in the MED output by introducing a de-noising method derived from the three-sigma rule [19]. A new procedure for extracting bearing defect features based on CMEEMD and an enhanced deconvolution process is discussed in this research work. The following describes the originality of these procedures. Firstly, the proposed CMEEMD decomposes the original signal into CMs. An indicator is created to identify the appropriate combination that combines the effective IMFs instead of selecting and reconstructing them. Secondly, an enhanced deconvolution process based on MED and a noise suppression technique using the three-sigma rule is performed on the selected CM. Finally, the envelope spectrum is applied, and the characteristic fault frequency is extracted to diagnose the bearing fault.
The remaining sections of this paper are organised as following: Section 2 is dedicated to the basic theories of EEMD, MED, and the rule of three-sigma de-noising method. Section 3 details the proposed methods of this research. Section 3.1 gives the steps of the CMEEMD. In Section 3.2, the process of selecting an appropriate combination is introduced. In Section 3.3, the enhanced deconvolution strategy is presented. Section 3.4 describes the new bearing fault diagnosis procedure. Section 4 presents the results of applying the proposed method to the simulated signal. In Section 5, the suggested process is performed on the experimental data, and the results are verified. In Section 6, the conclusion of this paper is presented.

2. Theoretical Analysis
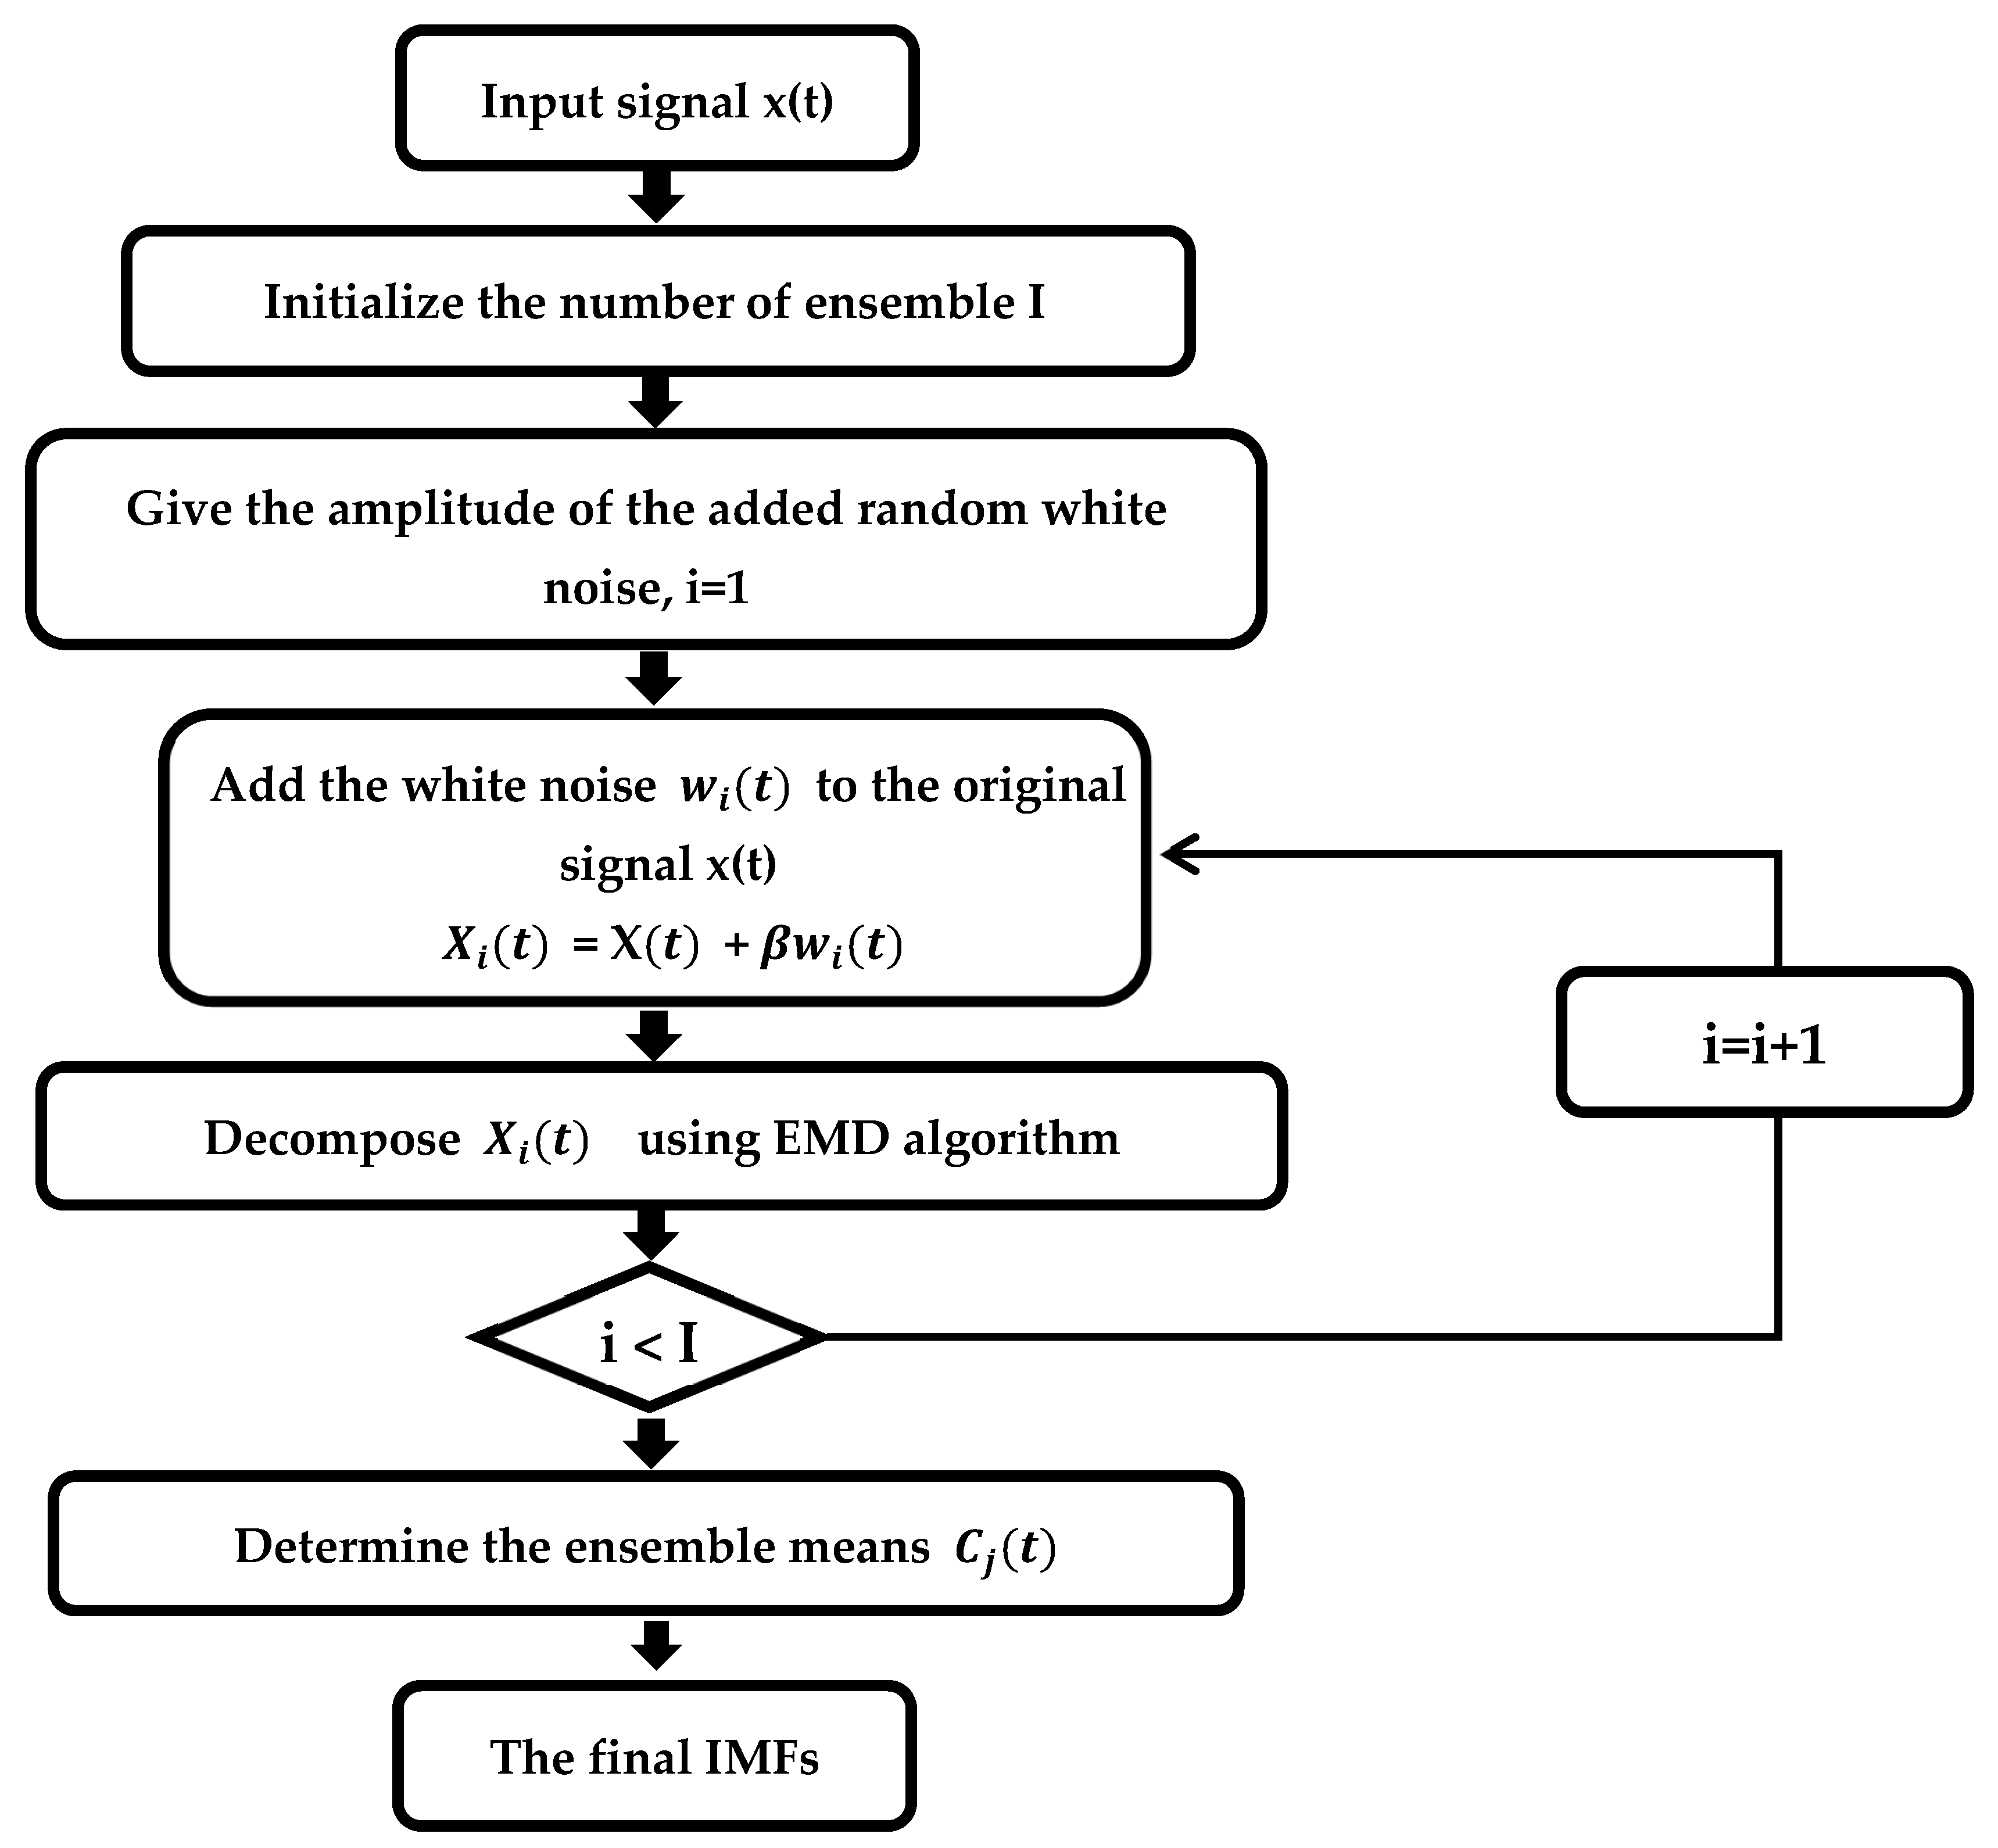
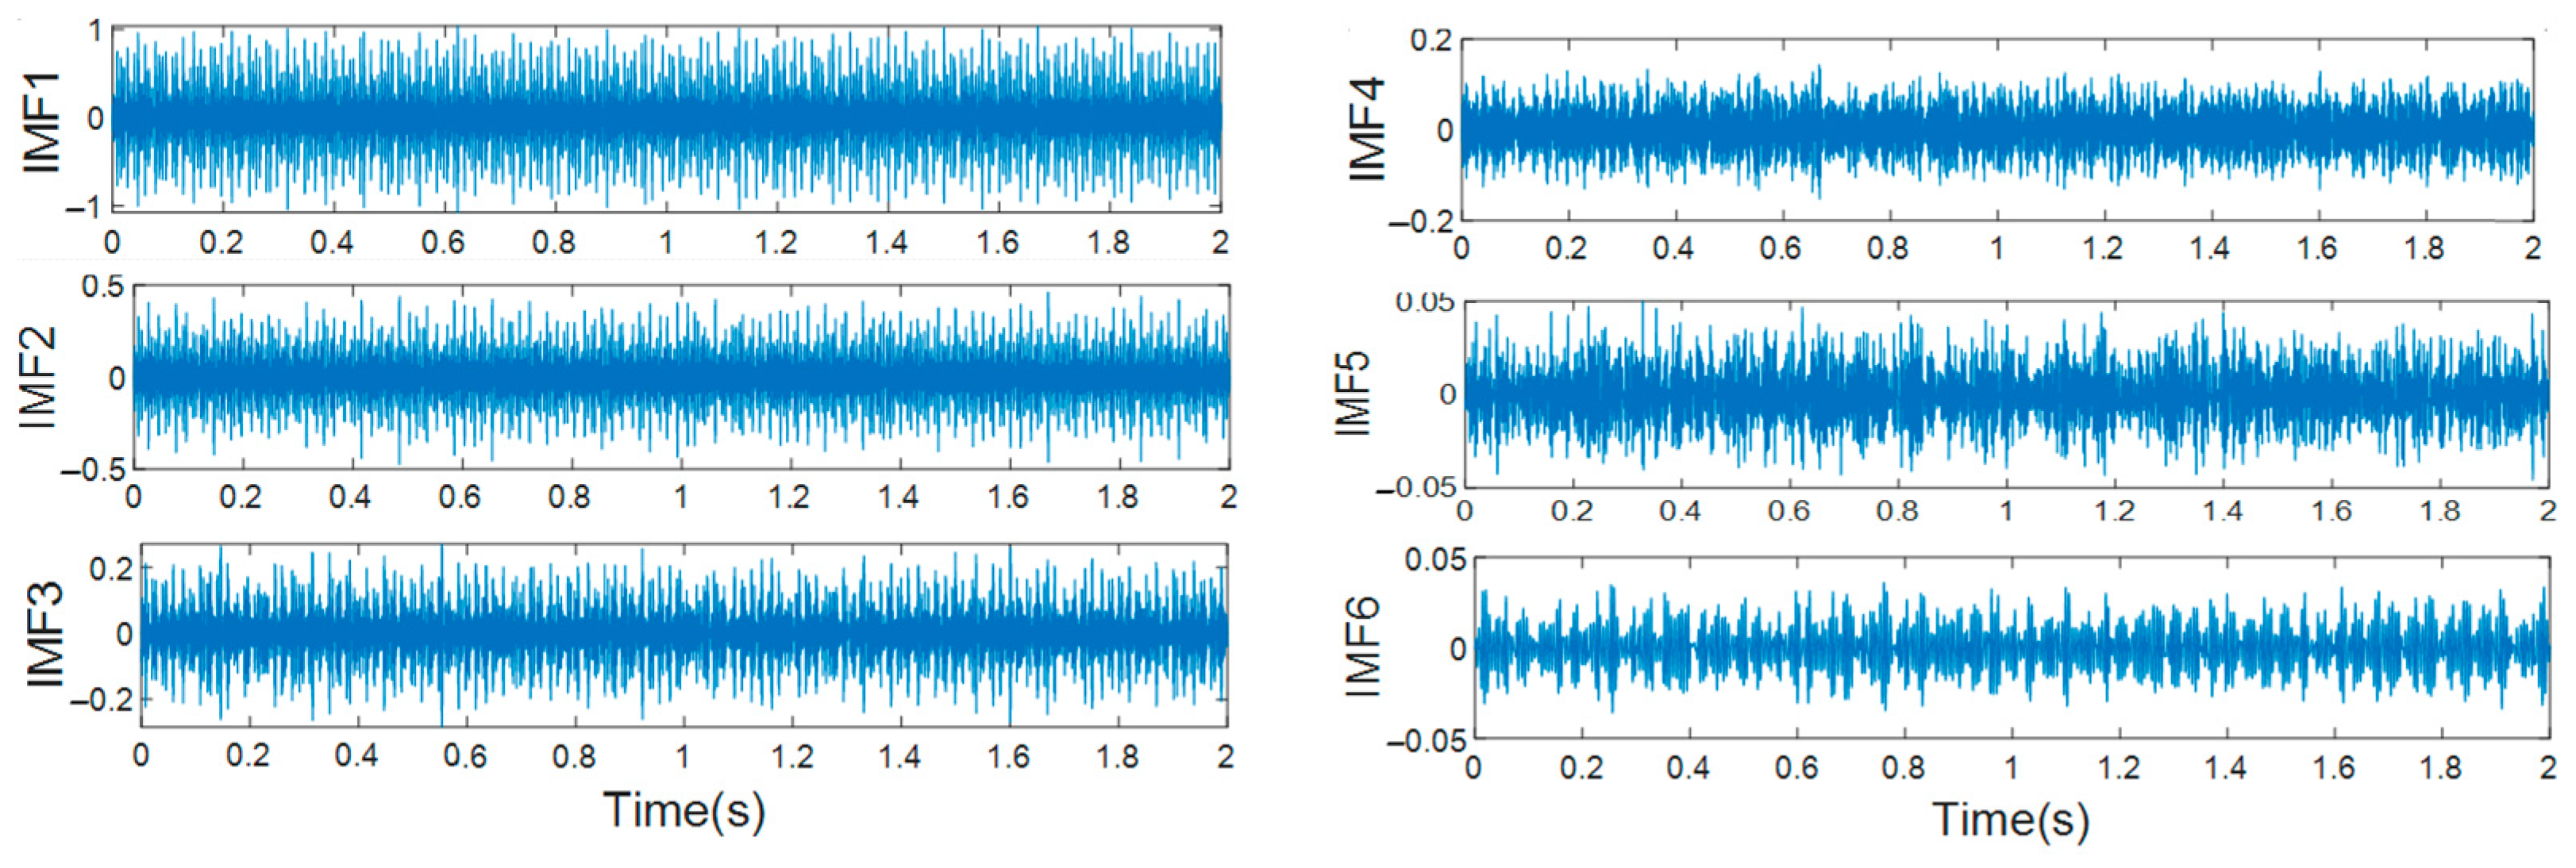
2.1. EEMD Method

By comparing EEMD and EMD, it has been concluded that EEMD may be more effective at revealing the characteristic fault information of rolling element bearings [20]. EEMD solves the problem of mode mixing in EMD by adding Gaussian white noise to the original signal. Thus, we can better highlight the signal’s intrinsic characteristics. The algorithm of EEMD [7] is given below, and Figure 1 shows the process flow diagram.
(1)
Add a random white Gaussian noise β w i t to the existing signal:
x i t = x   ( t ) + β   w i t
where β w i (t) is the i-th added white noise series, and x i t represents the noise-added signal (i = 1, 2,…, i).
(2)
Divide by EMD the novel signal and obtain N sets of IMFs:
x i t = j = 1 N c ij t + r i
where c ij (t) is the IMFs and r i . is the residue.
(3)
Using the formula below, determine the ensemble means c j t   of the I trials:
c j t = i = 1 I c ij t
where c j t   ( c 1 , c 2 ,..., c N ) is the IMFs divided by EEMD.

2.2. Minimum Entropy Deconvolution Technique

MED was originally introduced by Ralph [21]. The MED highlights the transient components of the signal with a finite impulse response (FIR) filter. It decreases a signal’s randomness by minimizing its entropy. Two terms can represent a general signal x(n):
x(n) = z(n) * w(n) + η(n)
There is a convolution between the defect impulse z and its excitation w, which is the first term in the equation. The second term takes a random noise into account. FIR filter h(n) can be used in minimum entropy deconvolution (MED) to process the original signal. From [22,23], it is possible to obtain:
u n = x n * h n = i = 0 M 1 h i x n i
where n = 0 , 1 , ,   N , N= T + M 2 . The deconvolution filter length is M , and the input sequence x n length is T . In MED, a signal’s entropy is minimized by maximizing the Varimax function. The Varimax function for u n is:
V u = n = 0 N u 4 n n = 0 N u 2 n 2
The filtering parameters that maximize V u are such that:
V u h n = 0
As a result of substituting Equations (6) in (7) and solving the derivative, we obtain:
i = 0 M 1 h i n = 0 N x n i x n k = n = 0 N u 3 n x n k V u u 2
where   k = 0 , 1 , ,   M 1 .
Equation (8) can be written as:
R XX h   =   b
where R XX corresponds to a matrix of autocorrelation, h is the filter coefficients vector, and b includes the input of the filter x(n) cross-correlated with the cube of its output u(n). The following steps summarize the optimal inverse filter solution:
  • Assume that h(0) is a set of initial filter coefficients;
  • Calculate u(0) and V(u);
  • Calculate R xx
  • Determine b(1) and h(1);
  • Repeat the procedure until an optimal filter is obtained.

2.3. The Three-Sigma Rule for Noise Minimization

In probability and statistics, the three-sigma rule states that approximately 99.73% of data following a normal distribution are located inside a range of three standard deviations from the mean [24].
P { μ 3 σ < Y < μ + 3 σ } 99.73 %
The mean and standard deviation are represented by μ and σ , respectively. The normal distribution appears with:
E Y = μ   =   0
D Y = E Y 2 E Y 2 =   E Y 2 = σ 2
The variance and the expectation are represented by D Y and E Y , respectively.
Based on Equation (12), the root mean square (RMS) value of Y is:
Y rms   =   1 n i = 1 n X i E Y 2 = 1 n i = 1 n y i 2 = E Y = σ
where y i stands for the sample data of Y and n for the number of samples.
Using Equations (11) and (13), Equation (10) can be written as:
  P { 3 σ < Y < 3 σ = P 3 Y rms < Y < 3 Y rms 99 . 73 %
Based on the assumption that a fault-free rolling bearing follows the normal distribution [25], Equation (14) shows that nearly all the noise in the bearing vibration signal Y is distributed within ±3 Y rms . Due to this, it is necessary to remove the components within ±3 Y rms . The steps of the de-noising process are as follows [26]:
  • y (t) is normalized by using zero-mean normalization:
    Z t = y μ σ
    where Z(t) is the normalized signal.
  • Determine Z rms of Z(t);
  • Replace the sampling data z i of Z(t) falling between ±3 Z rms with zero while leaving z i outside of ±3 Z rms unchanged.
    w t = 0 ,   if   z   i 3 Z rms z i t ,   otherwise  
    where w(t) represents y(t) after removing the unnecessary components.

3. Proposed Methods

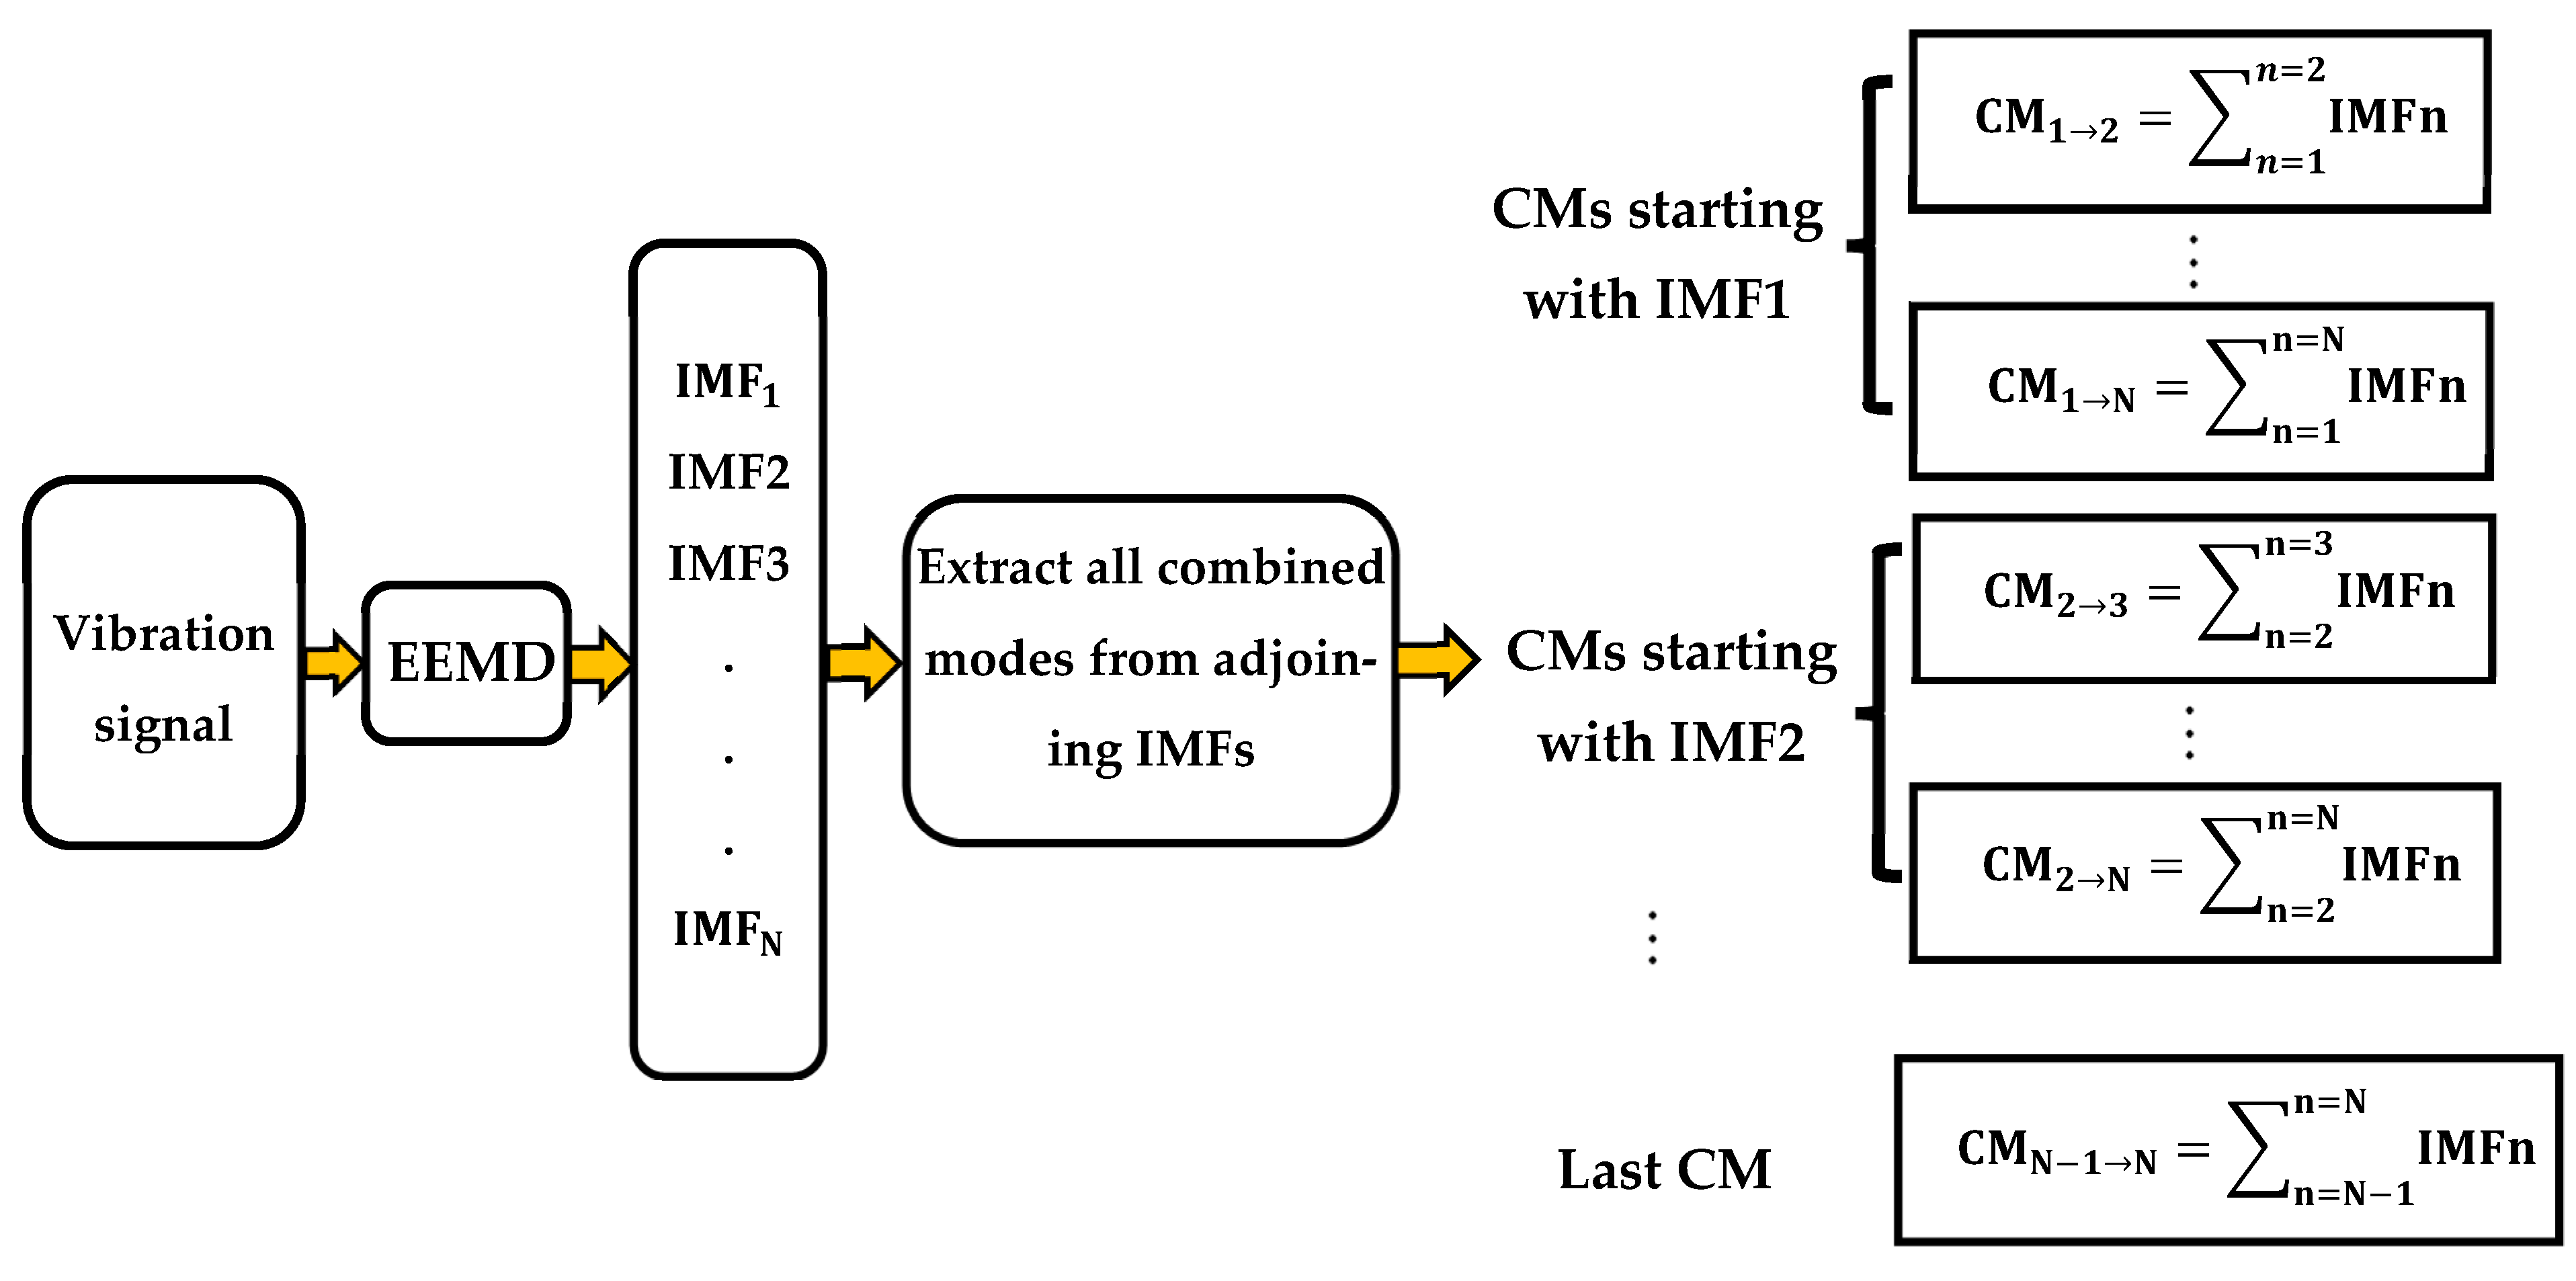
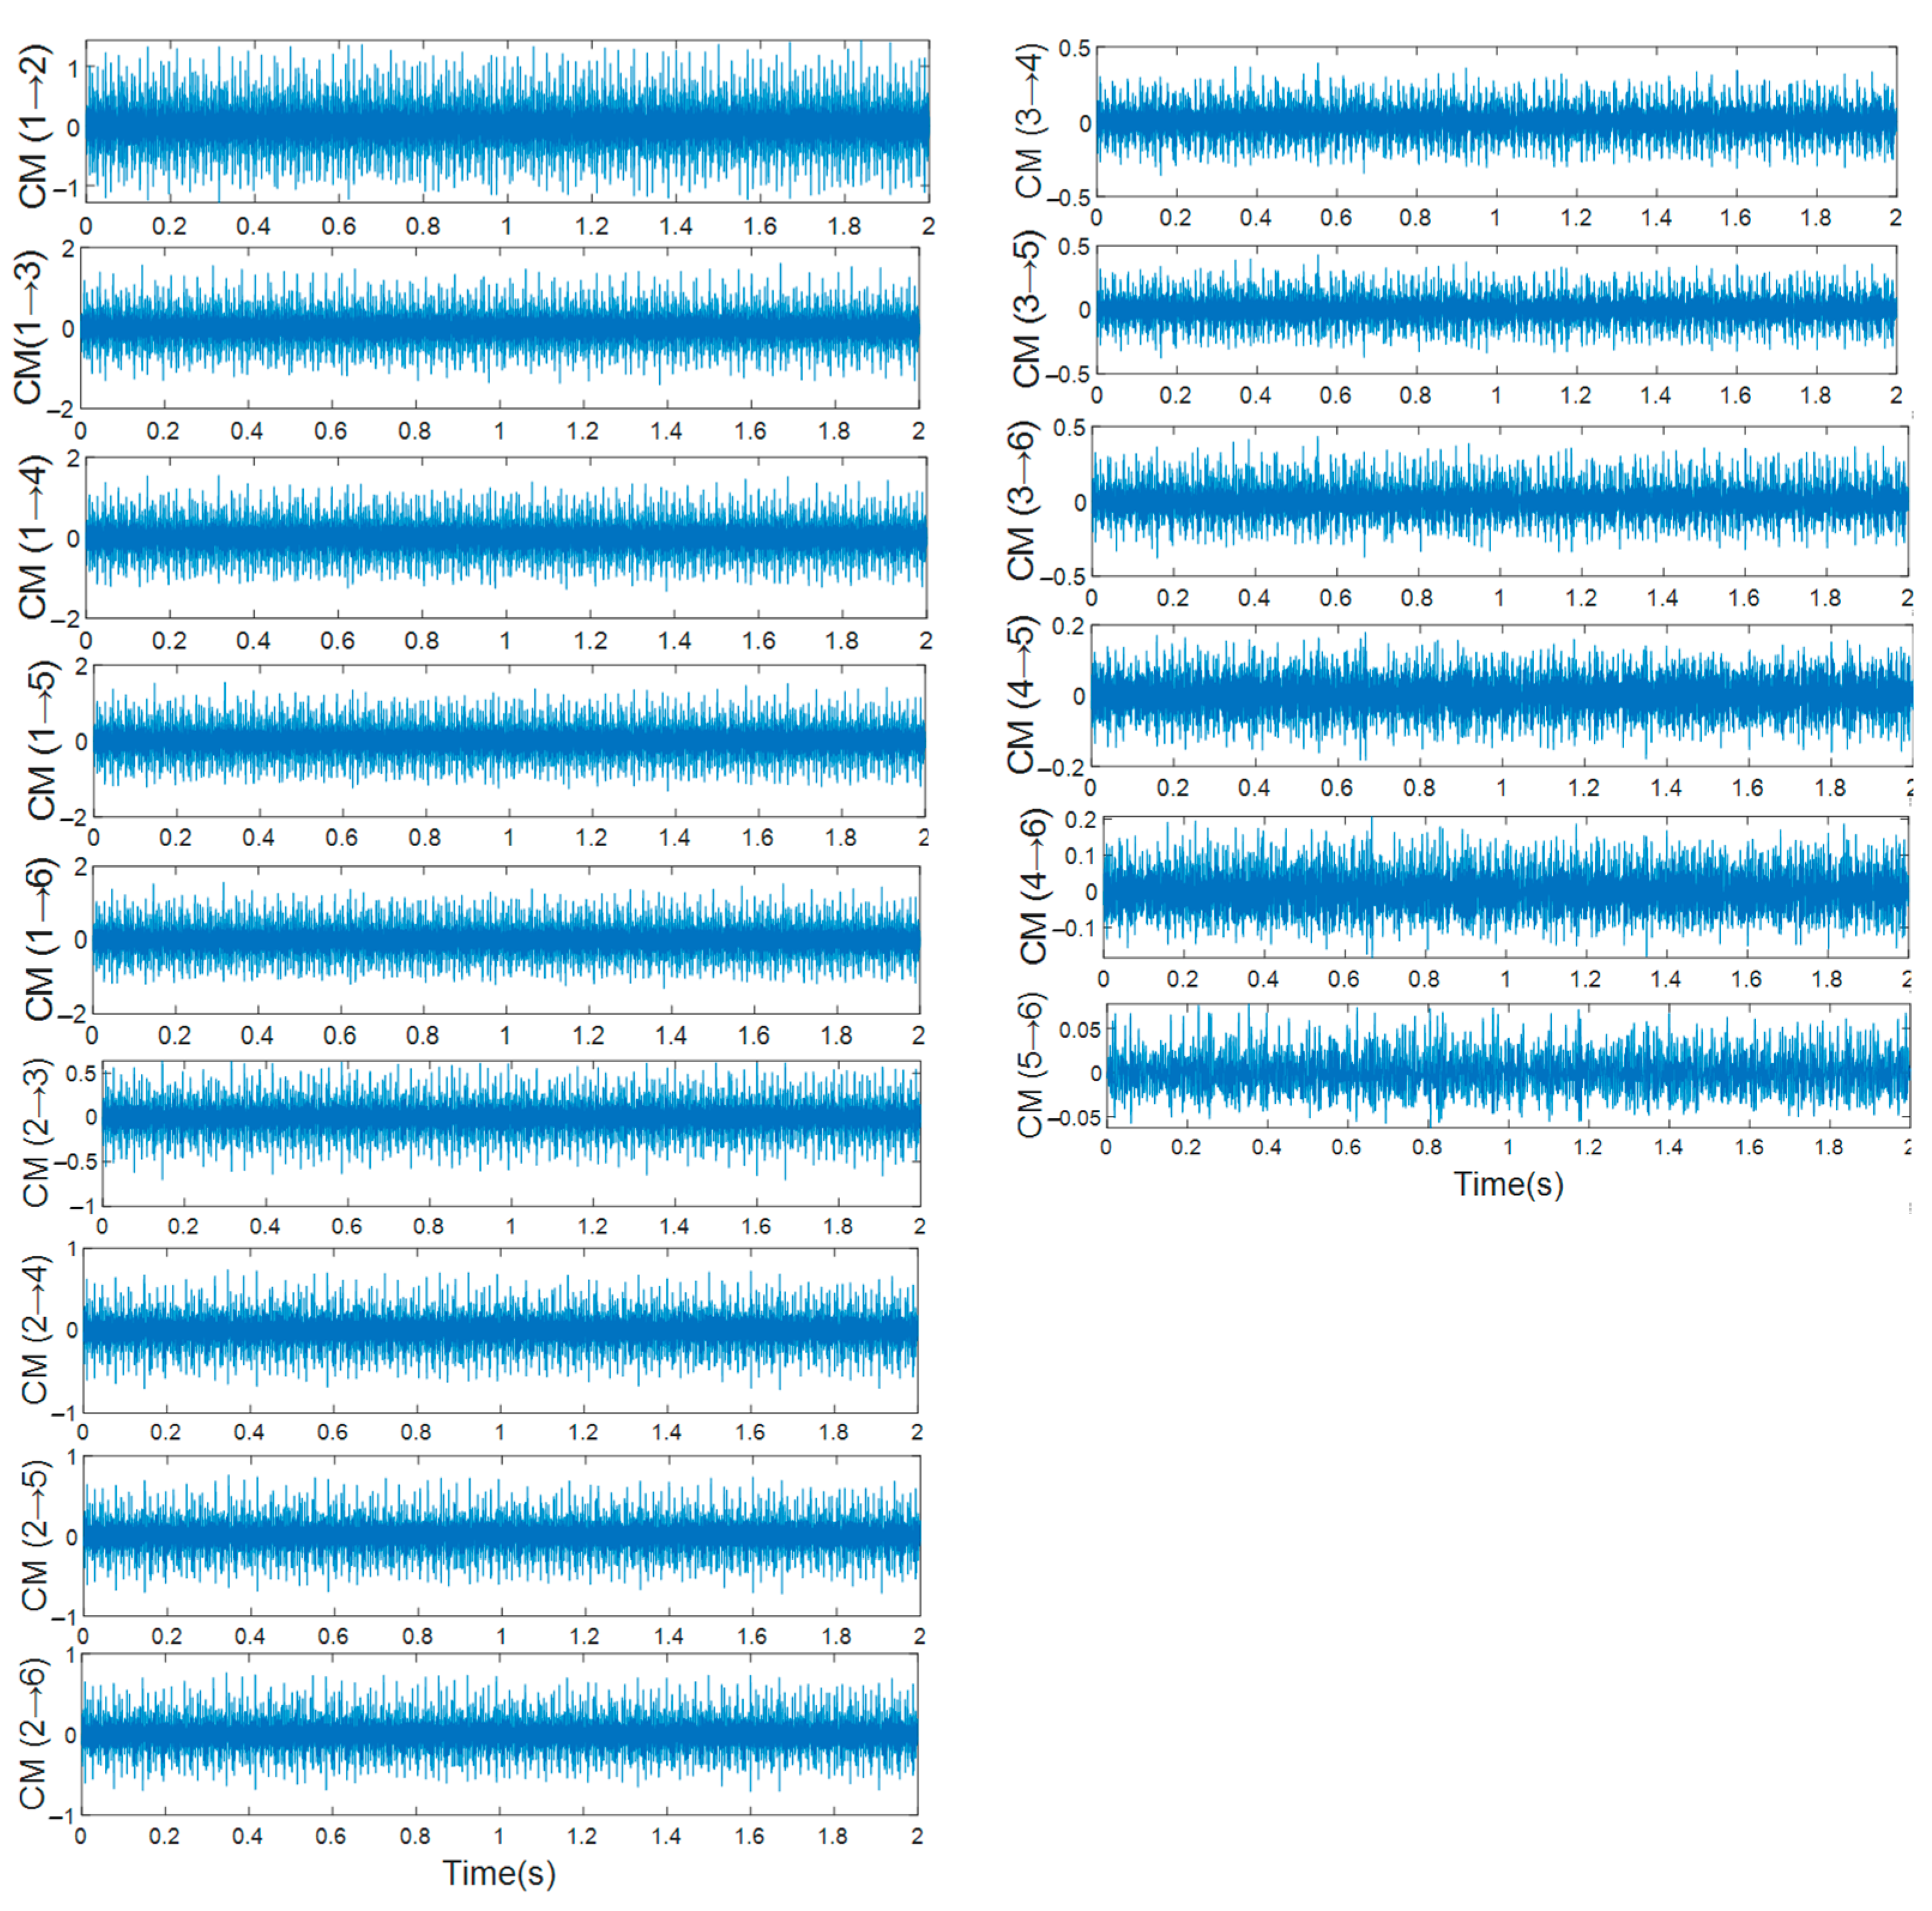
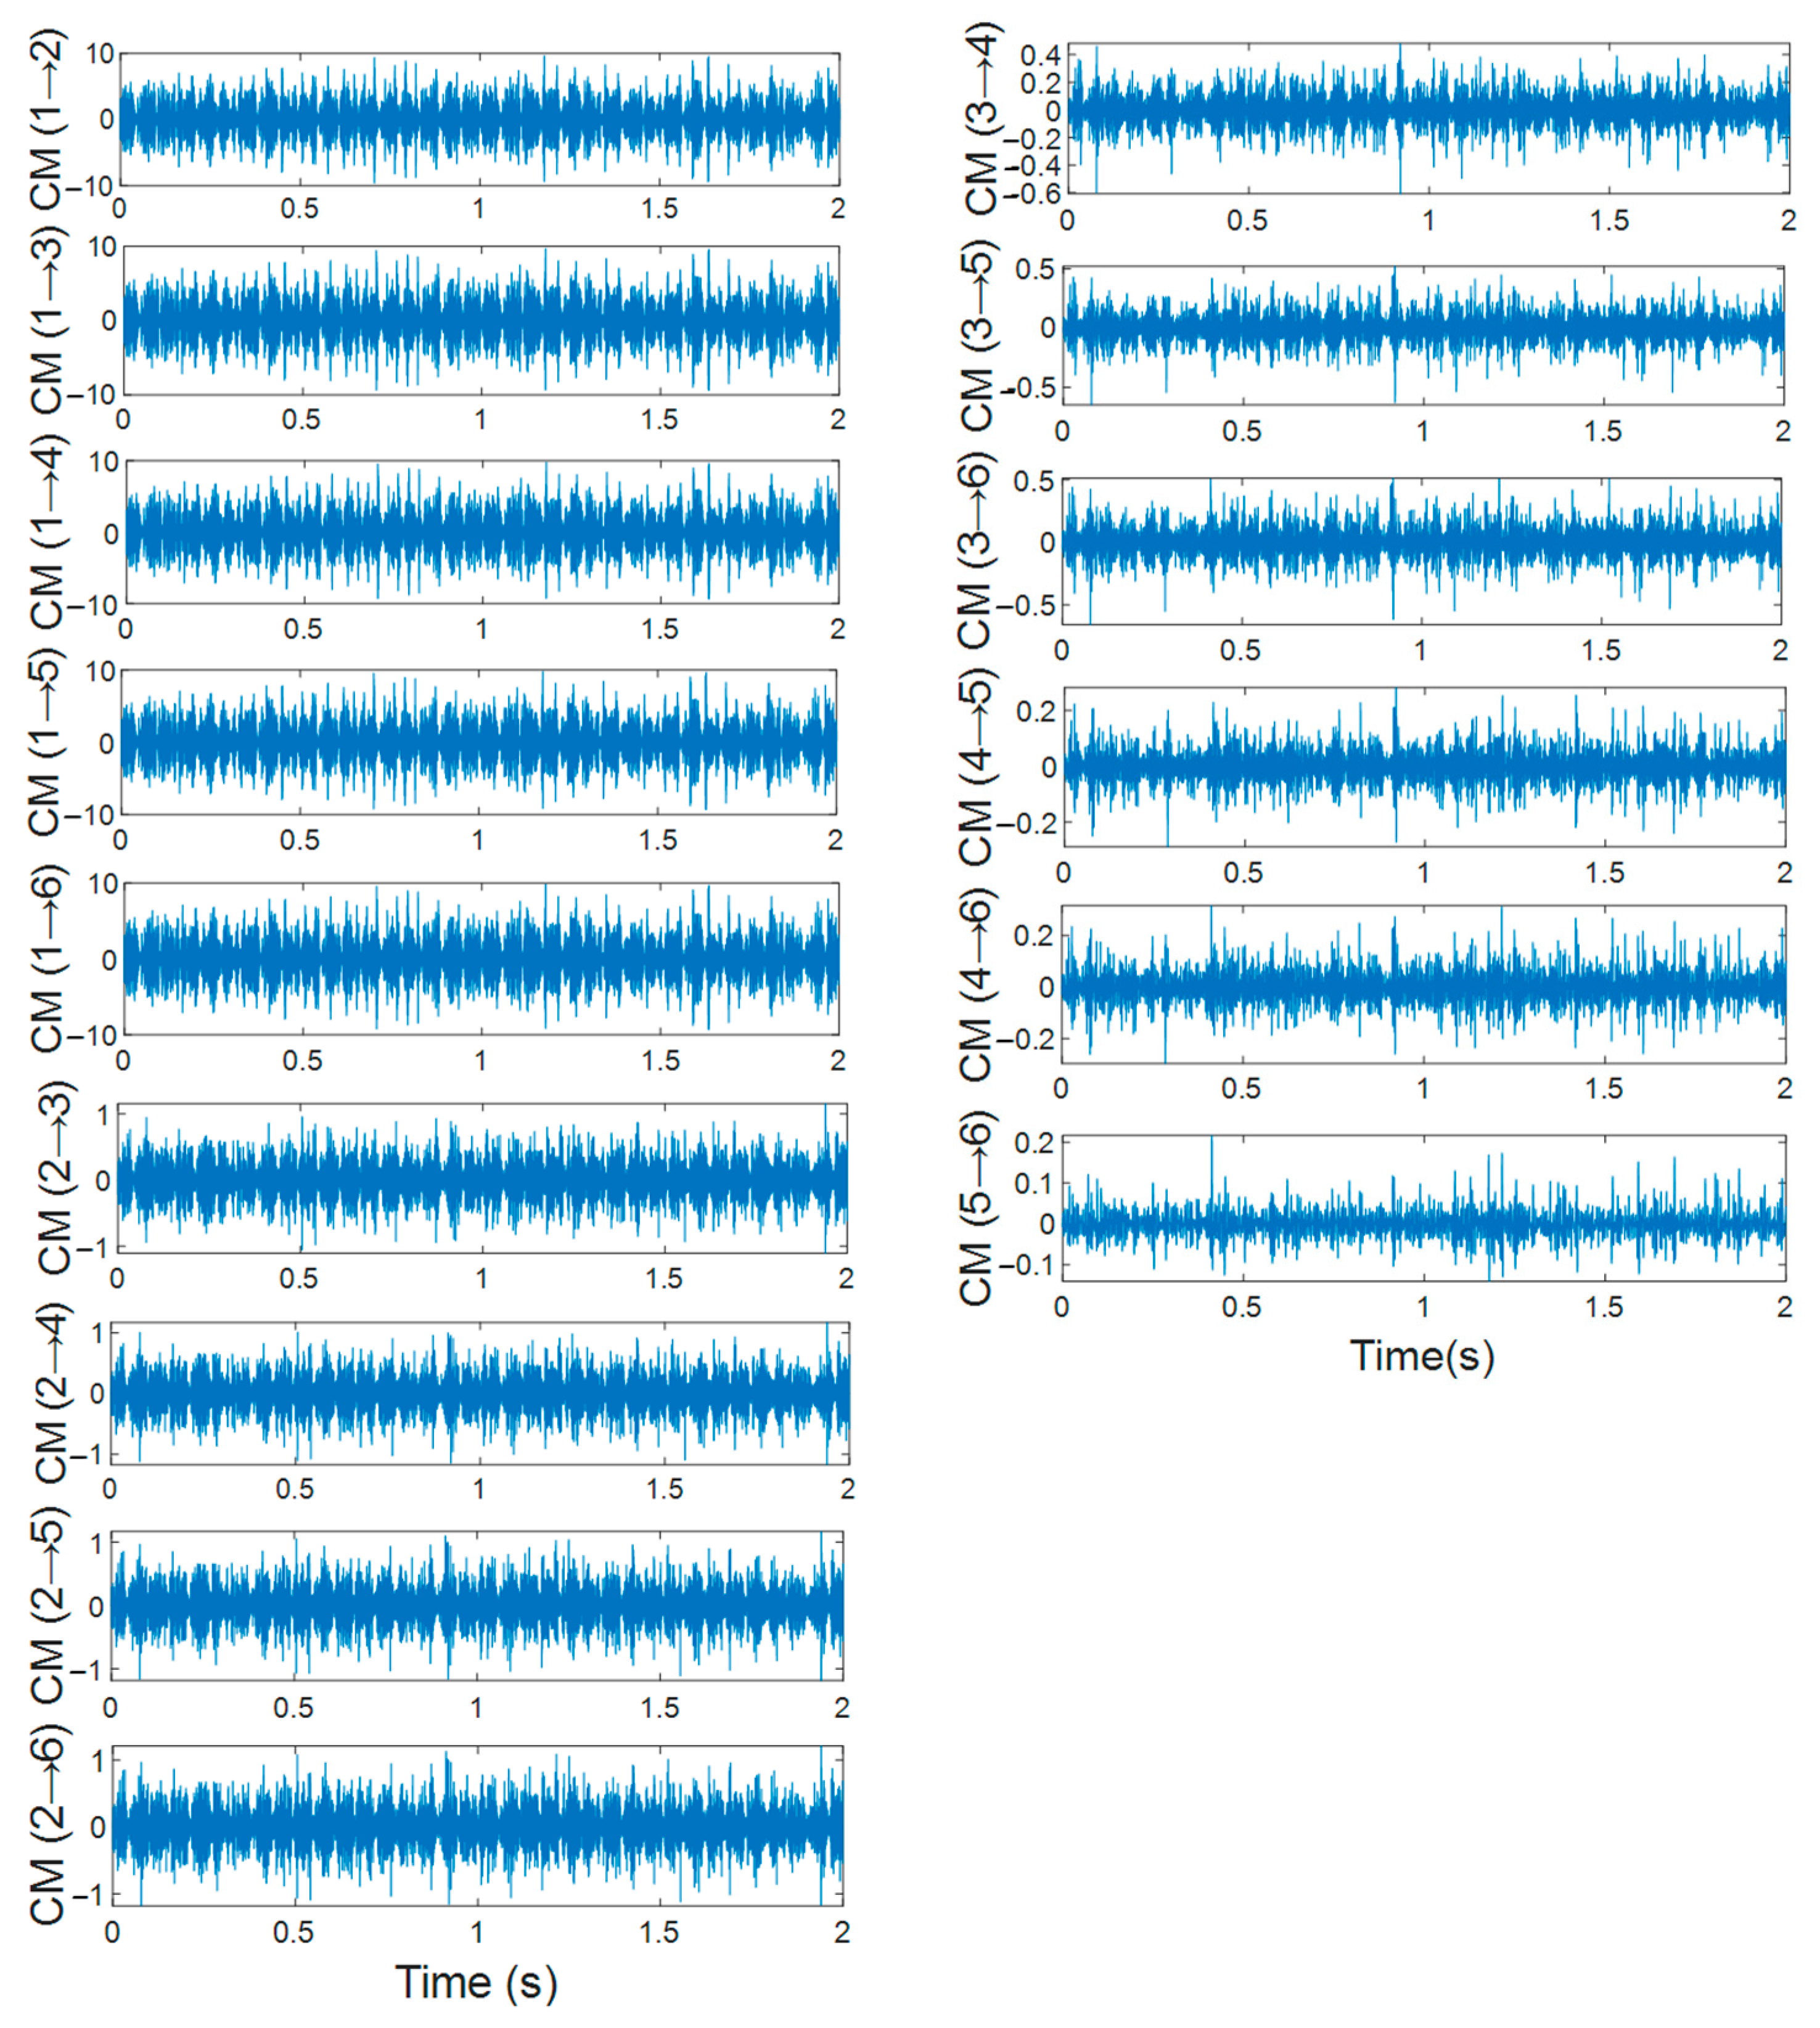
3.1. Combined Modes Ensemble Empirical Mode Decomposition (CMEEMD)

The proposed CMEEMD aims to extract all the CMs from the adjoining IMFs decomposed from the bearing fault vibration signal using EEMD. This process is described in detail below with a flowchart shown in Figure 2. In this paper, adjoining IMFs are combined using the following expression:
CM i j = IMF i + + IMF j
where CM i j is the combined modes of adjoining IMFs from the i-th mode to the j-th mode, IMF i is the IMF that starts the combination, and IMF j is the IMF that finishes it. Extraction of CMs is done as follows:
  • Divide these CMs into groups. The first group consists of CMs starting with IMF 1 . By using Equation (17), we obtain:
    CM 1 j   = IMF 1 + + IMF j 2   j     N
    where CM 1 j is the combination of adjoining IMFs from IMF 1 to the j-th IMF for j = 2, … N, N   is the number of IMFs.
  • Using Equation (18), extract all CMs starting with IMF 1 :
    CM 1 2 = IMF 1 + IMF 2 CM 1 3 = IMF 1 + IMF 2 + IMF 3 CM 1 N = IMF 1 + IMF 2 + IMF 3 + + IMF N
  • The second group is constituted by CMs starting with the second mode. In this case, Equation (17) can be expressed as:
    CM 2 j   = IMF 2 + + IMF j         3 j N
    where CM 2 j is the combination of adjoining IMFs from IMF 2 to the j-th IMF for j = 3, … N.
  • Using Equation (20), extract all CMs starting with IMF 2 :
    CM 2 3 = IMF 2 + IMF 3 CM 2 4 = IMF 2 + IMF 3 + IMF 4 CM 2 N = IMF 2 + IMF 3 + IMF 4 + + IMF N
  • The process continues until we reach the N − 1 group. In this case, the last combination can be represented by the following equation:
    CM N 1 N   =   IMF N 1 + IMF N

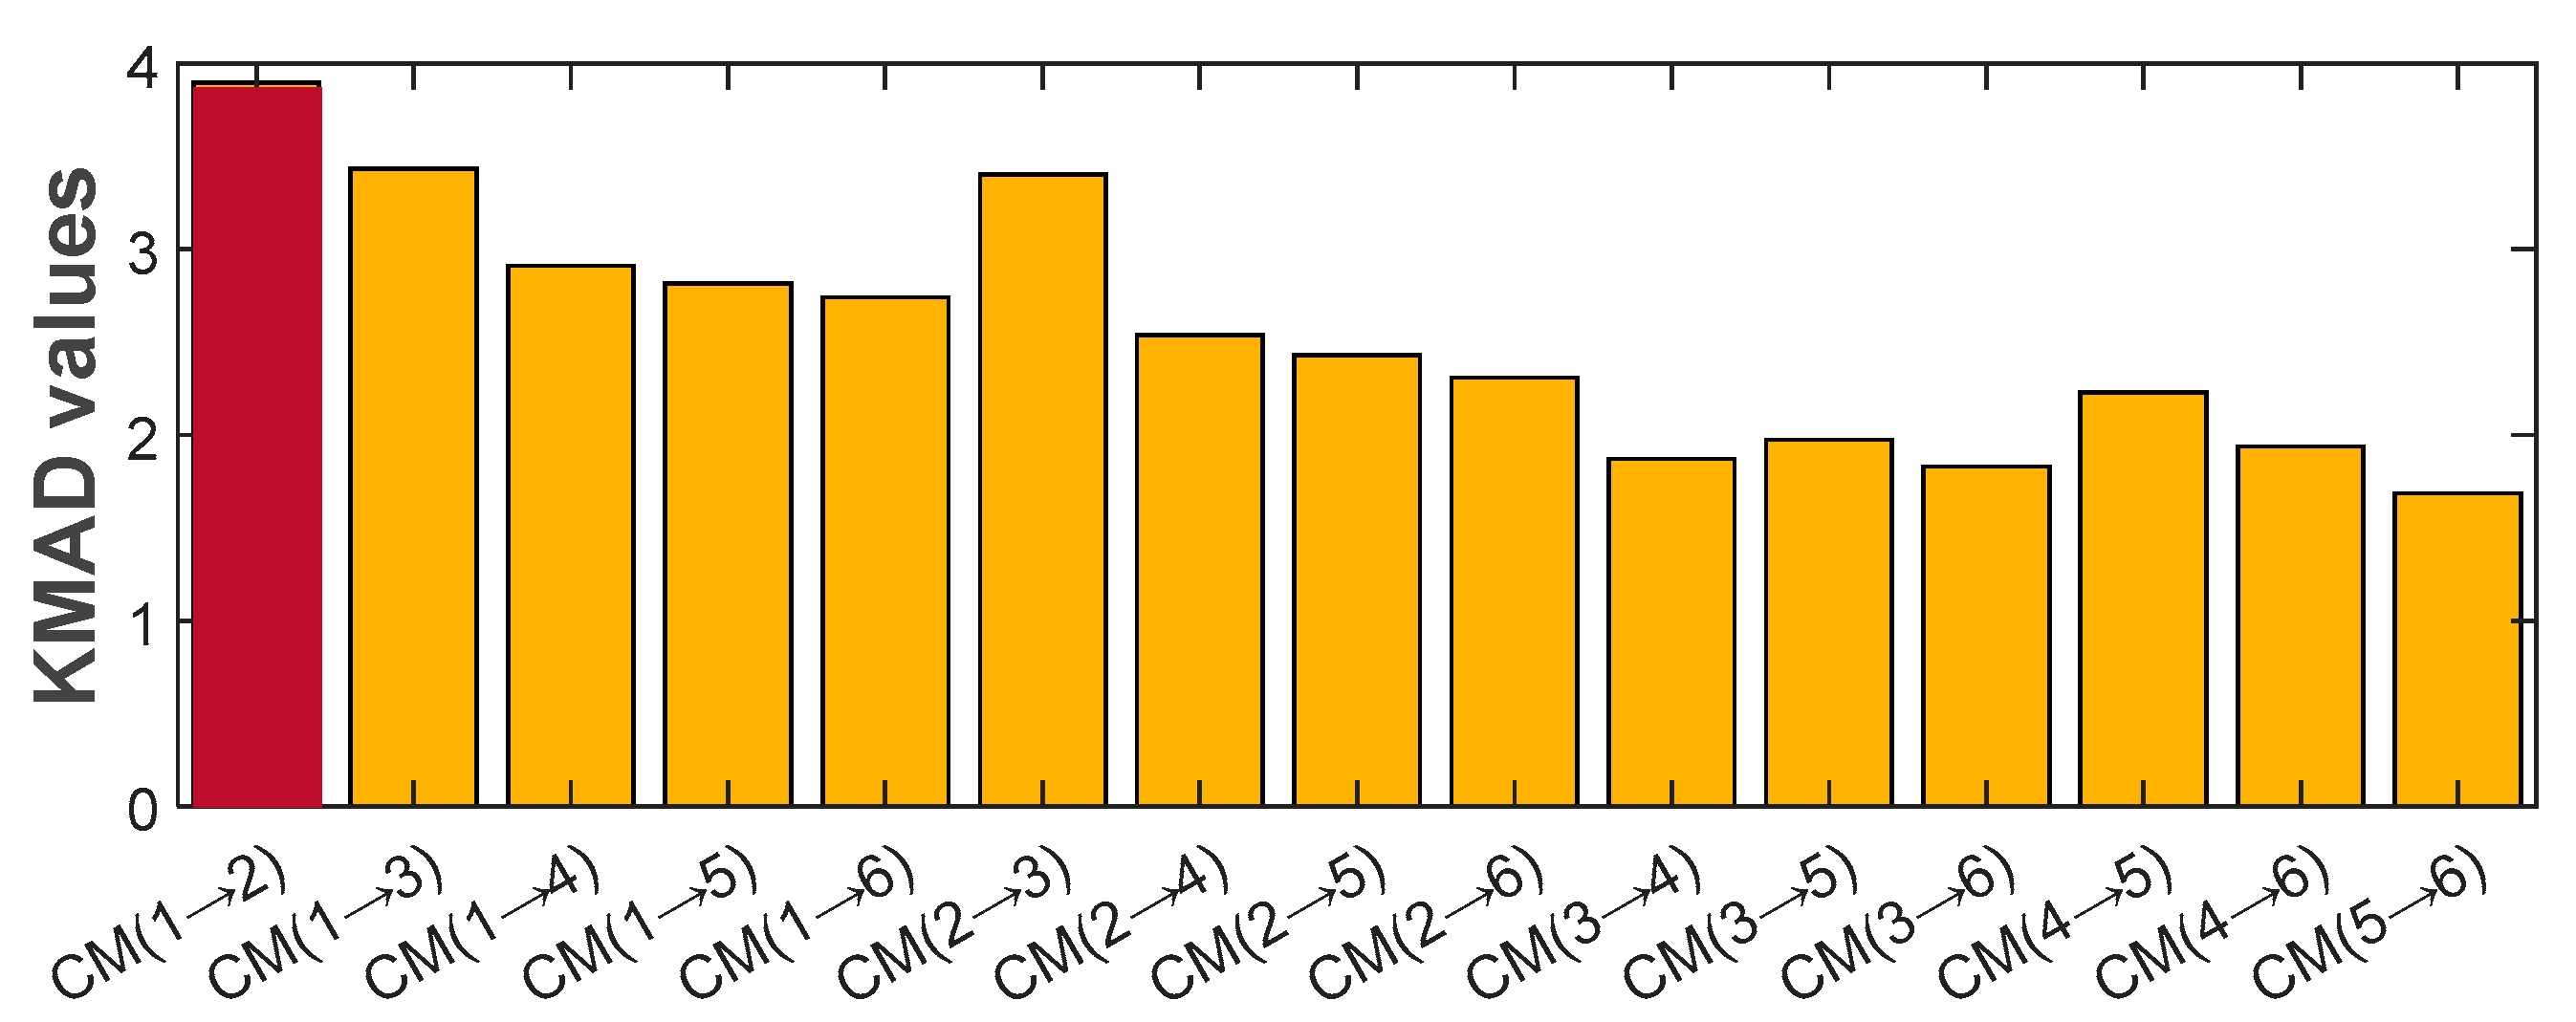
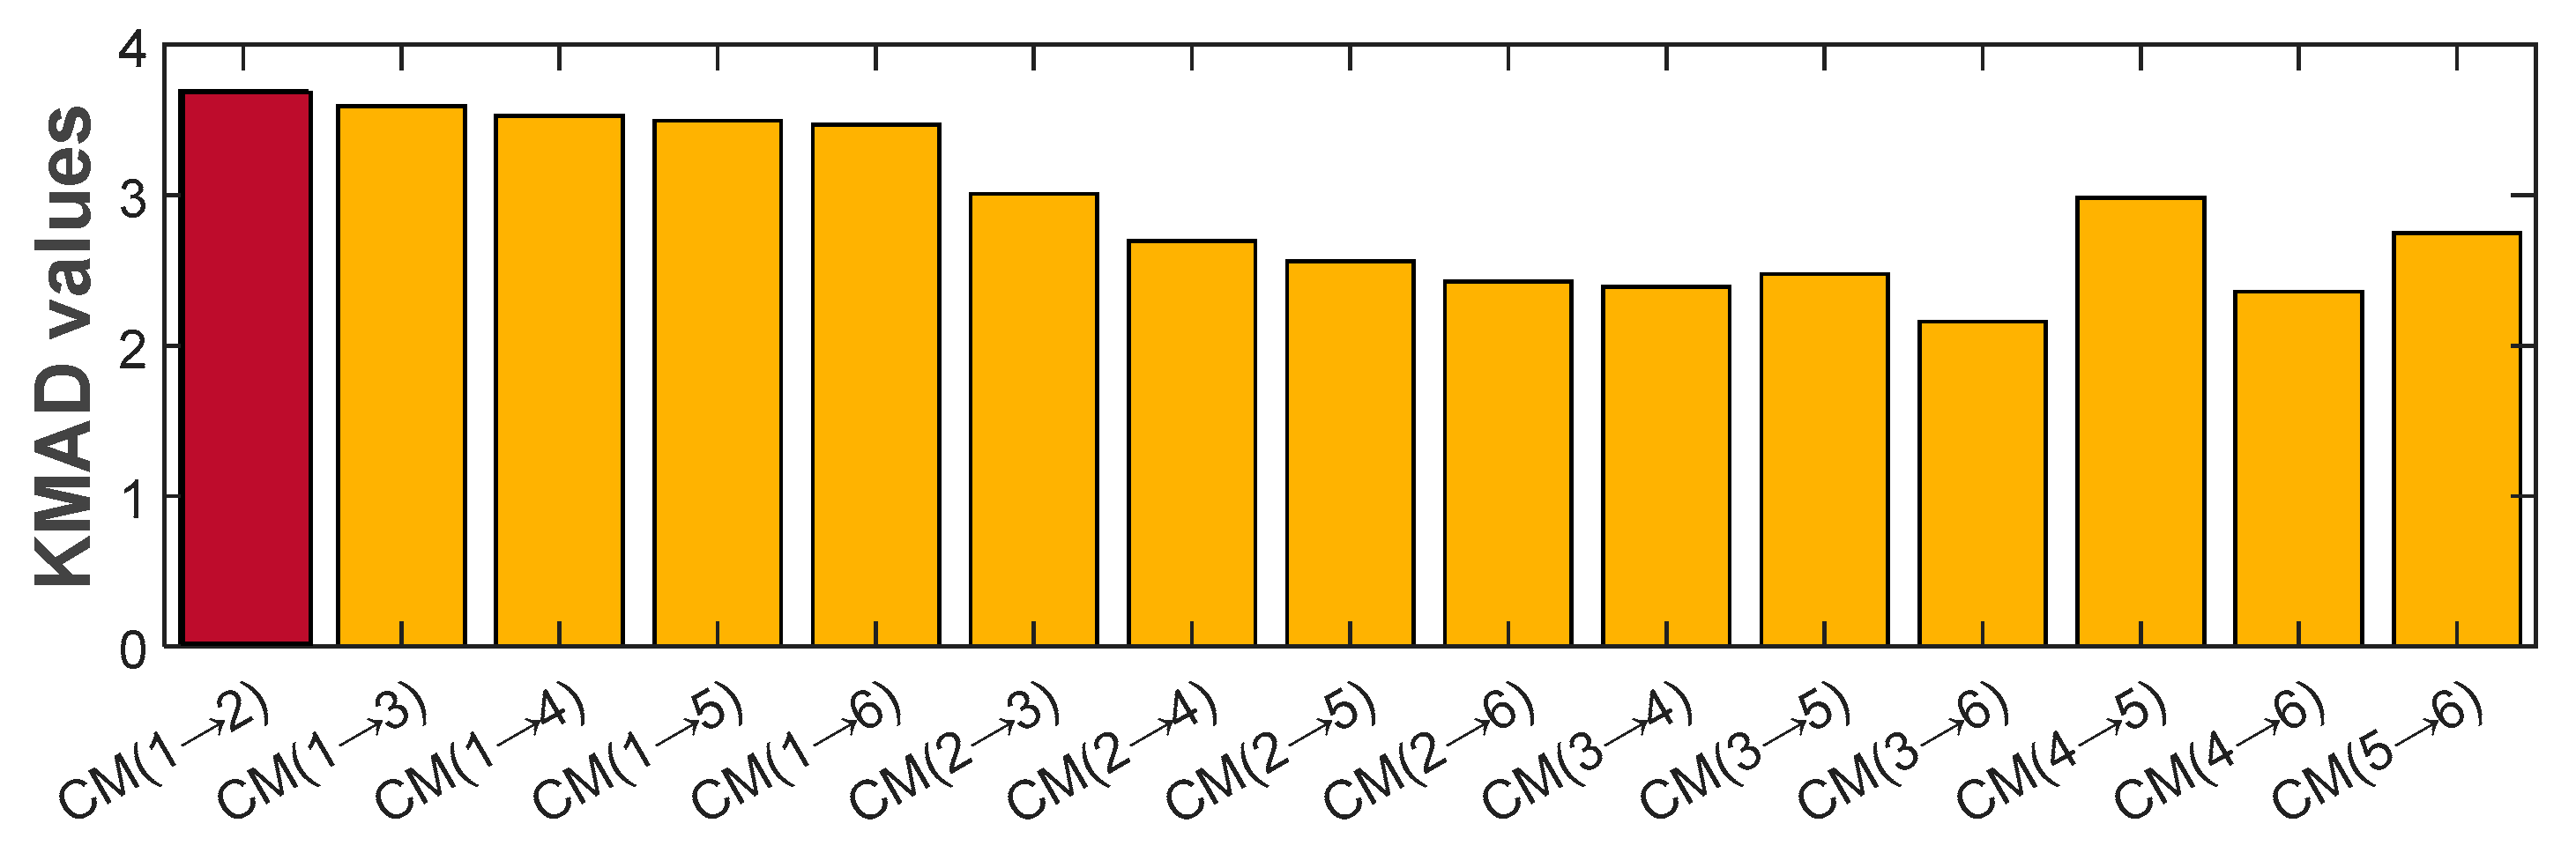
3.2. Sensitive CM Selection Using KMAD Indicator

Once all the CMs have been extracted, we need to identify the appropriate combination of sensitive IMFs. An indicator was required to select this combination among all the other CMs. In many studies, maximum kurtosis was used to identify the most sensitive IMF. However, if we consider only the best IMF, we may lose information about faults contained in other IMFs [27]. Therefore, this paper uses the kurtosis of the combined IMFs. The probability of identifying the appropriate combination is higher when the kurtosis value of the corresponding combination is high. The expression of kurtosis is defined as follows [28]:
K = 1 N i = 1 N ( x i µ ) 4 σ 4
where the amplitude of the vibration waveform is indicated by x i , the mean of the signal by µ , the standard deviation by σ , and the length of the samples by N. According to [29,30,31], IMFs with high-frequency bands of the vibration signal contain the main fault information about the rolling bearings. It is known that the higher the frequency band, the larger the median absolute deviation (MAD). Therefore, the MAD can be used to identify IMFs with high-frequency bands. The expression of MAD is defined as follows [32]:
MAD   ( y ) = median   ( y n median y )
where y n represents the n-th sampling of the signal y. To ensure that only sensitive IMFs are combined in the effective combination, the proposed selection indicator aims to prevent unwanted IMFs from being added. Accordingly, as the number of IMFs in the combination decreases, the probability of obtaining the required combination increases. Based on all the above, the paper proposes an indicator (KMAD), which combines kurtosis and MAD to select the appropriate combination of sensitive IMFs.
KMAD i j   = K i j     .   MAD i i j MAD n
In this equation, K i j is the kurtosis value of CM i j , where CM i j is the combined modes of adjoining IMFs from the i-th IMF to the j-th IMF, MAD i is the mean absolute deviation of the i-th IMF that starts the combination, and i j MAD n means the sum of MADs of IMFs from the i-th IMF to the j-th IMF. A combination with fewer IMFs has a lower value of i j MAD n , which increases the probability of obtaining the combination of useful IMFs. For each CM i j , KMAD i j is calculated, where the highest value corresponds to the required combination.

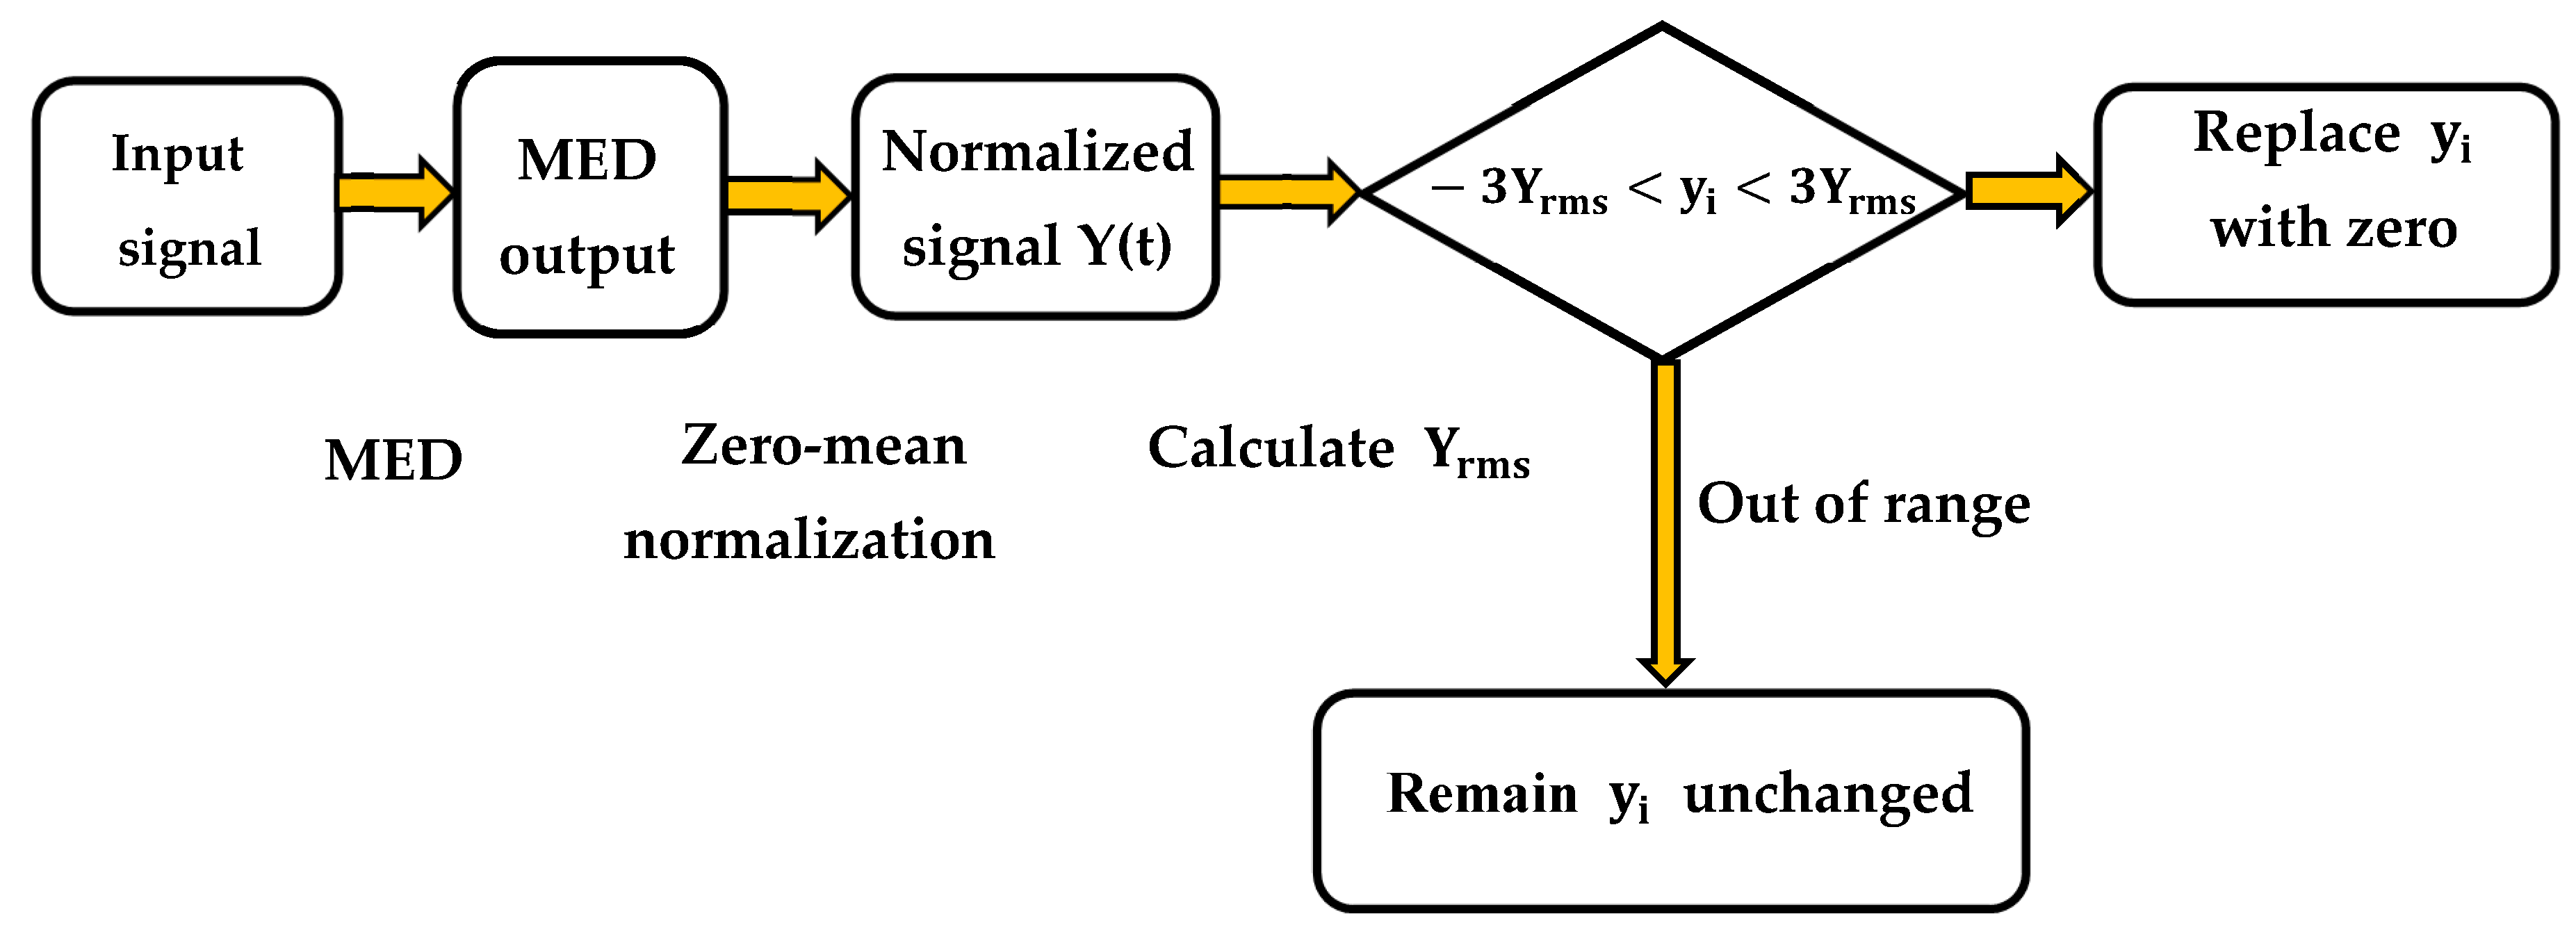
3.3. The Enhanced Deconvolution Process

One of the most commonly used methods for this is MED. However, when the input signal contains noise, the effectiveness of the MED will be reduced. For this reason, noise will affect the MED output. Therefore, an enhanced deconvolution approach is presented in this paper, which aims to minimize noise interference in the MED output by integrating the three-sigma rule (see Section 2.3). Figure 3 is a flow chart illustrating the enhanced MED strategy, and the steps are as follows:
  • Apply the MED technique to the input signal;
  • Perform the de-noising method derived from the three-sigma rule on the MED output. It consists of the following steps:
  • Normalize the MED output using zero-mean normalization;
  • Calculate the root mean square value Y rms of the normalized signal Y(t);
  • Replace the sampling data y i of Y(t) falling between ±3Yrms with zero while keeping y i outside of ±3Yrms unmodified.

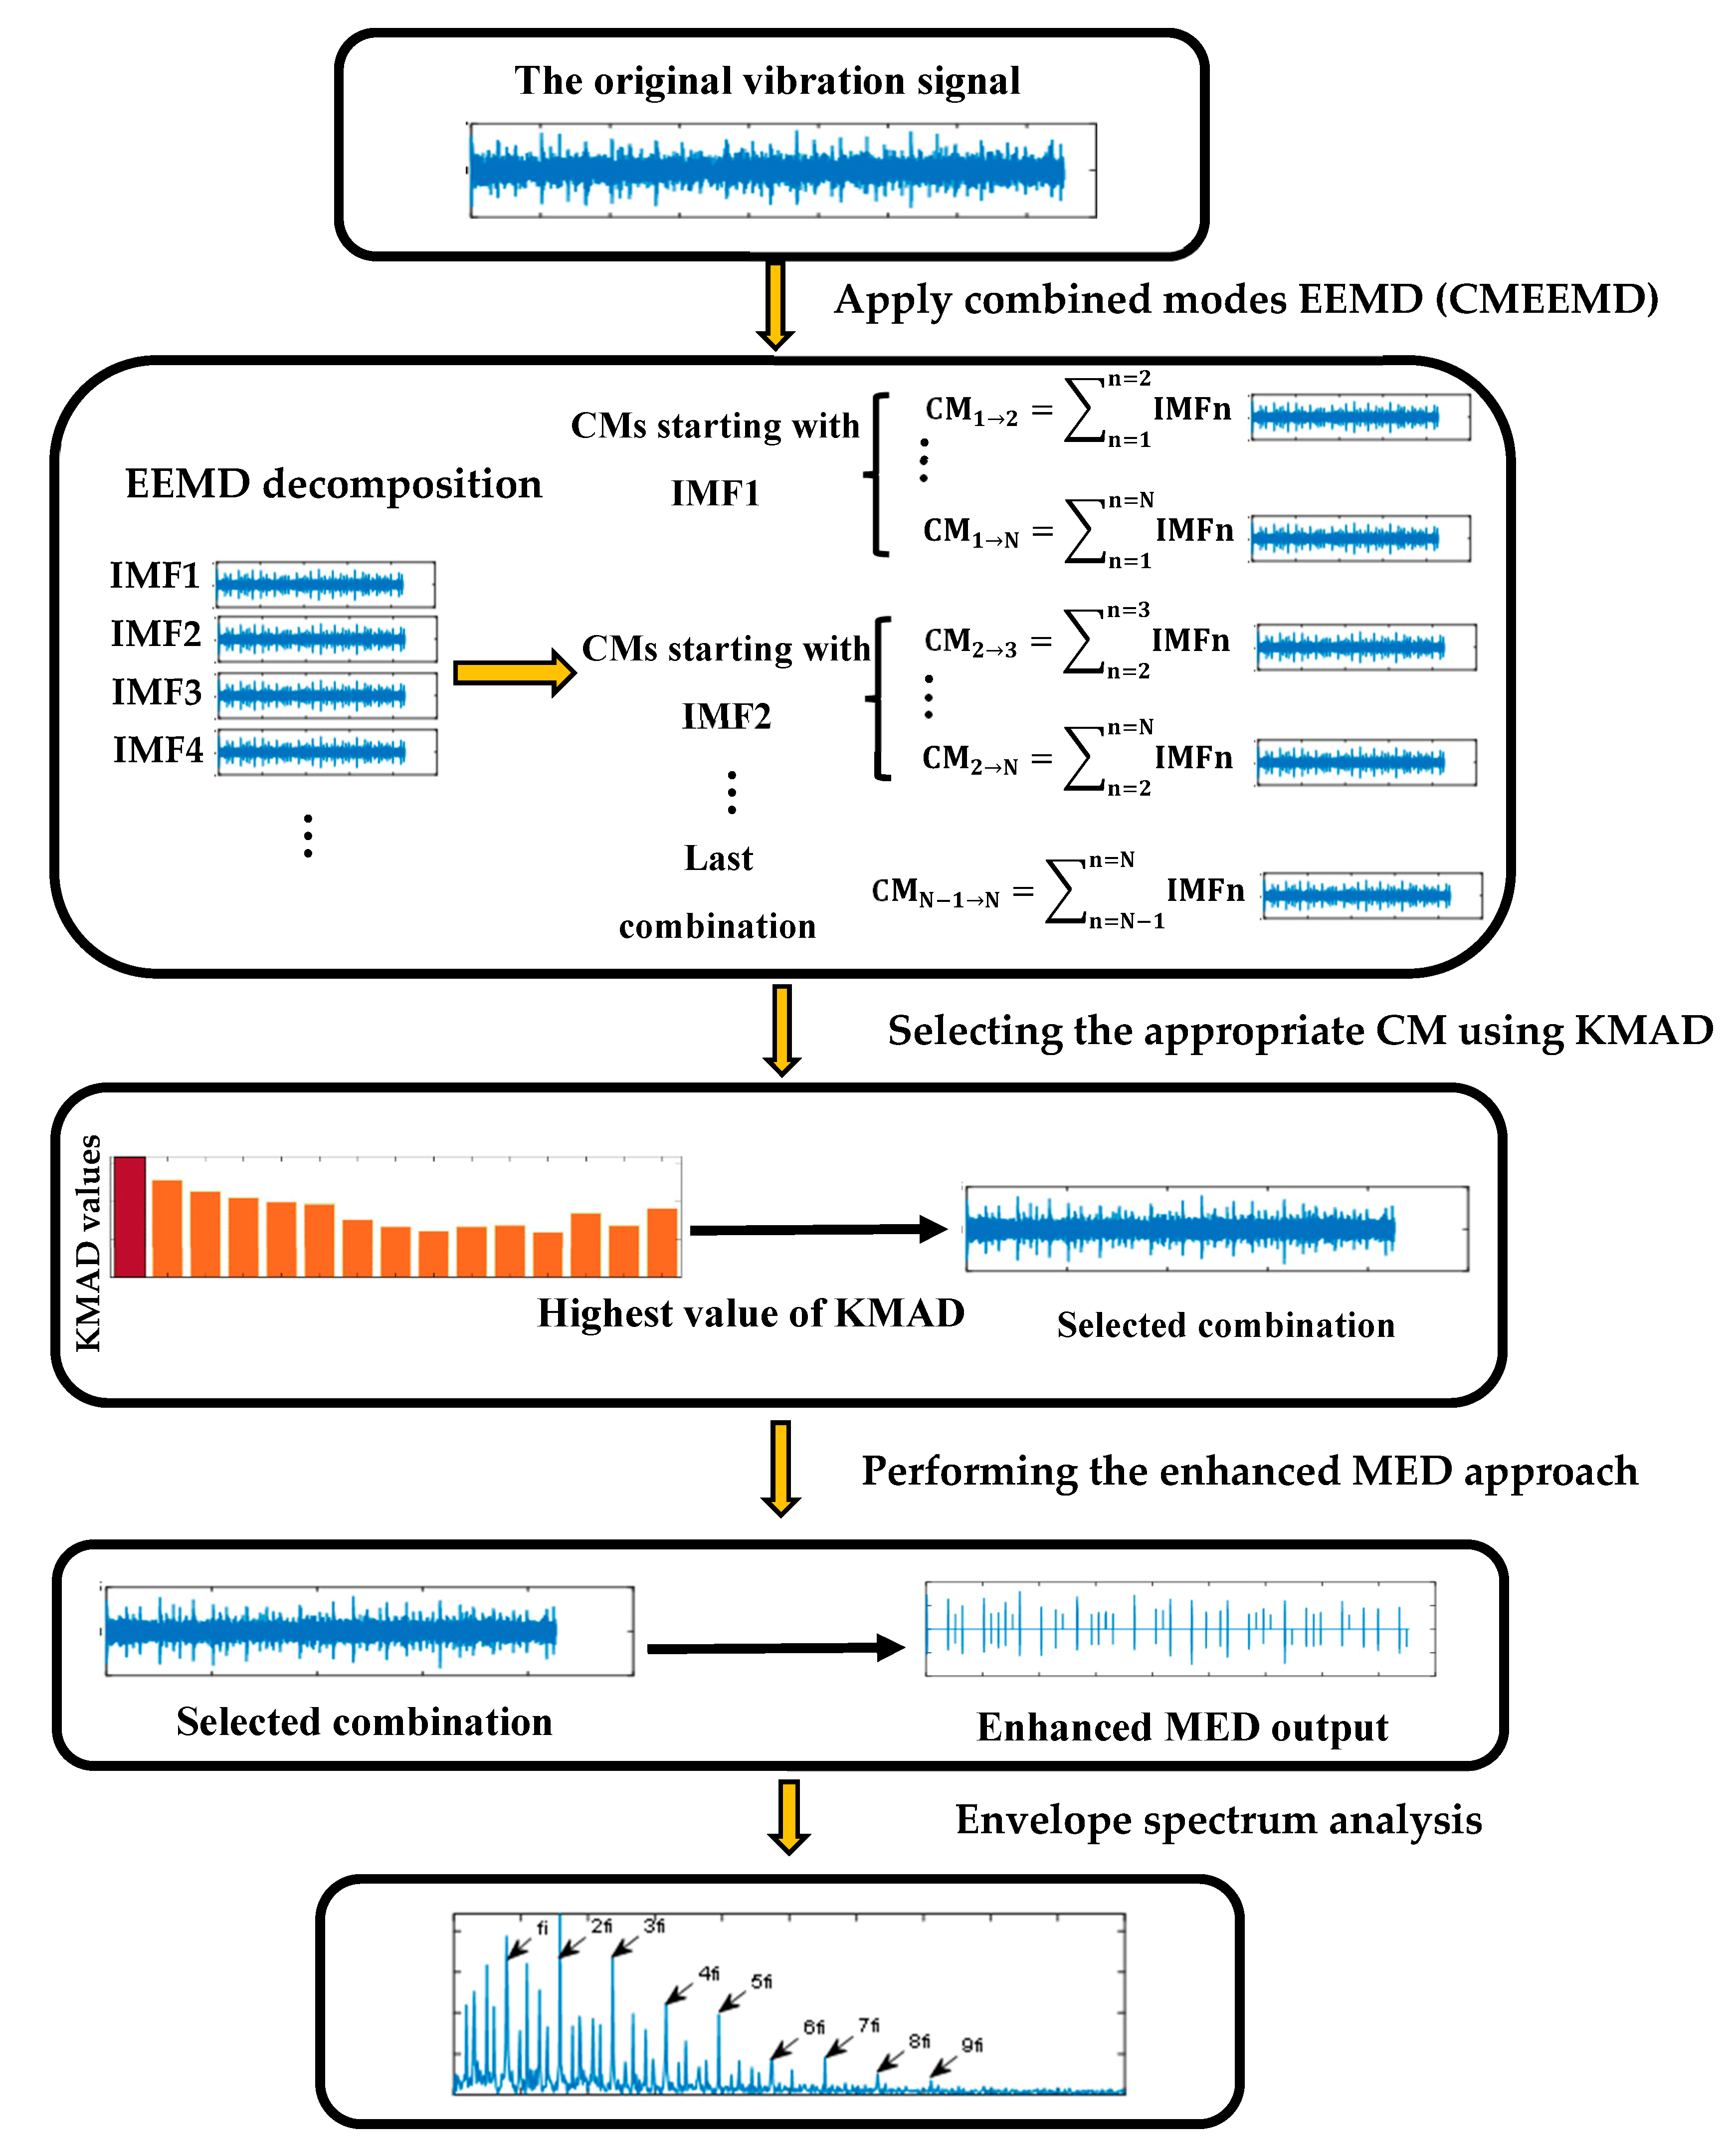
3.4. The Proposed Strategy for Bearing Fault Detection

This paper describes a novel feature extraction method based on CMEEMD and proposes a deconvolution process to diagnose the bearing fault from the vibration signals. Figure 4 illustrates the flowchart of the proposed method for detecting bearing defects. The detailed process of the feature extraction method proposed is as follows:
1.
Perform CMEEMD on the fault vibration signal as follows:
  • Decompose the fault vibration signal with the defect into IMFs by EEMD;
  • Extract all combined modes (CMs) from adjoining IMFs (see Section 3.1).
2.
Select the appropriate combination using the KMAD indicator (see Section 3.2):
  • Calculate the KMAD value of each CM;
  • Select the required combination based on the highest value of KMAD.
3.
Perform the enhanced deconvolution process on the selected CM (see Section 3.3).

4. The Simulation Validation

A simulation of an inner ring defect bearing is presented in this section to illustrate the effectiveness and usefulness of the suggested method for extracting fault characteristics. The periodic impulses represent the vibration waveform caused by a local failure in the bearing. However, these impulses are usually buried in white noise. As a result, we can obtain the simulated signal of the rolling bearing from [33]. In this paper, the sampling frequency is 12,000 Hz, the resonant frequency is 3000 Hz, the inner-race fault frequency is 79 Hz, the time lag is zero, the rotational frequency is 28 Hz, and the damping ratio B = 500. The random noise has a zero mean and variance of σ 2   = 0.7 2 . The data length of the signal is 10,240. The simulated signal y(t) is plotted in Figure 5a. It can be seen that the noise effect prevents the extraction of periodic impulses. From the envelope spectrum in Figure 5b, although the fault characteristic fi and the first harmonic 2fi can be extracted, the remaining harmonics are covered by noise interference. To improve fault detection, this signal needs to be pre-processed.

4.1. Analysis of the Proposed Method

Based on the detailed flowchart of the proposed feature extraction method described in Figure 4, the following processes are followed.

4.1.1. CMEEMD Analysis

According to [29,30,31], the significant defect information about rolling bearings is included in IMFs with high-frequency bands. Therefore, the proposed CMEEMD uses the EEMD to decompose this simulated signal into six IMFs. Then, one extracts all the CMs from the adjoining IMFs. Based on the recommended method for extracting combined modes CMs detailed in Section 3.1, fifteen CMs are generated from the six IMFs. The obtained IMFs are plotted in Figure 6, and the extracted CMs are illustrated in Figure 7. The next step identifies the most sensitive combination.

4.1.2. Selecting the Appropriate CM

Based on the time-domain waveforms given in Figure 7, the differences between the CMs are insignificant. Therefore, the most effective combination is selected using the proposed KMAD indicator. Based on Equation (25), the KMAD values of each combination are illustrated in Figure 8. It is observed that the combination CM 1 2 has the highest value among all the other combinations. This indicates that it is the appropriate combination of the sensitive IMFs, i.e., IMF1 and IMF2.

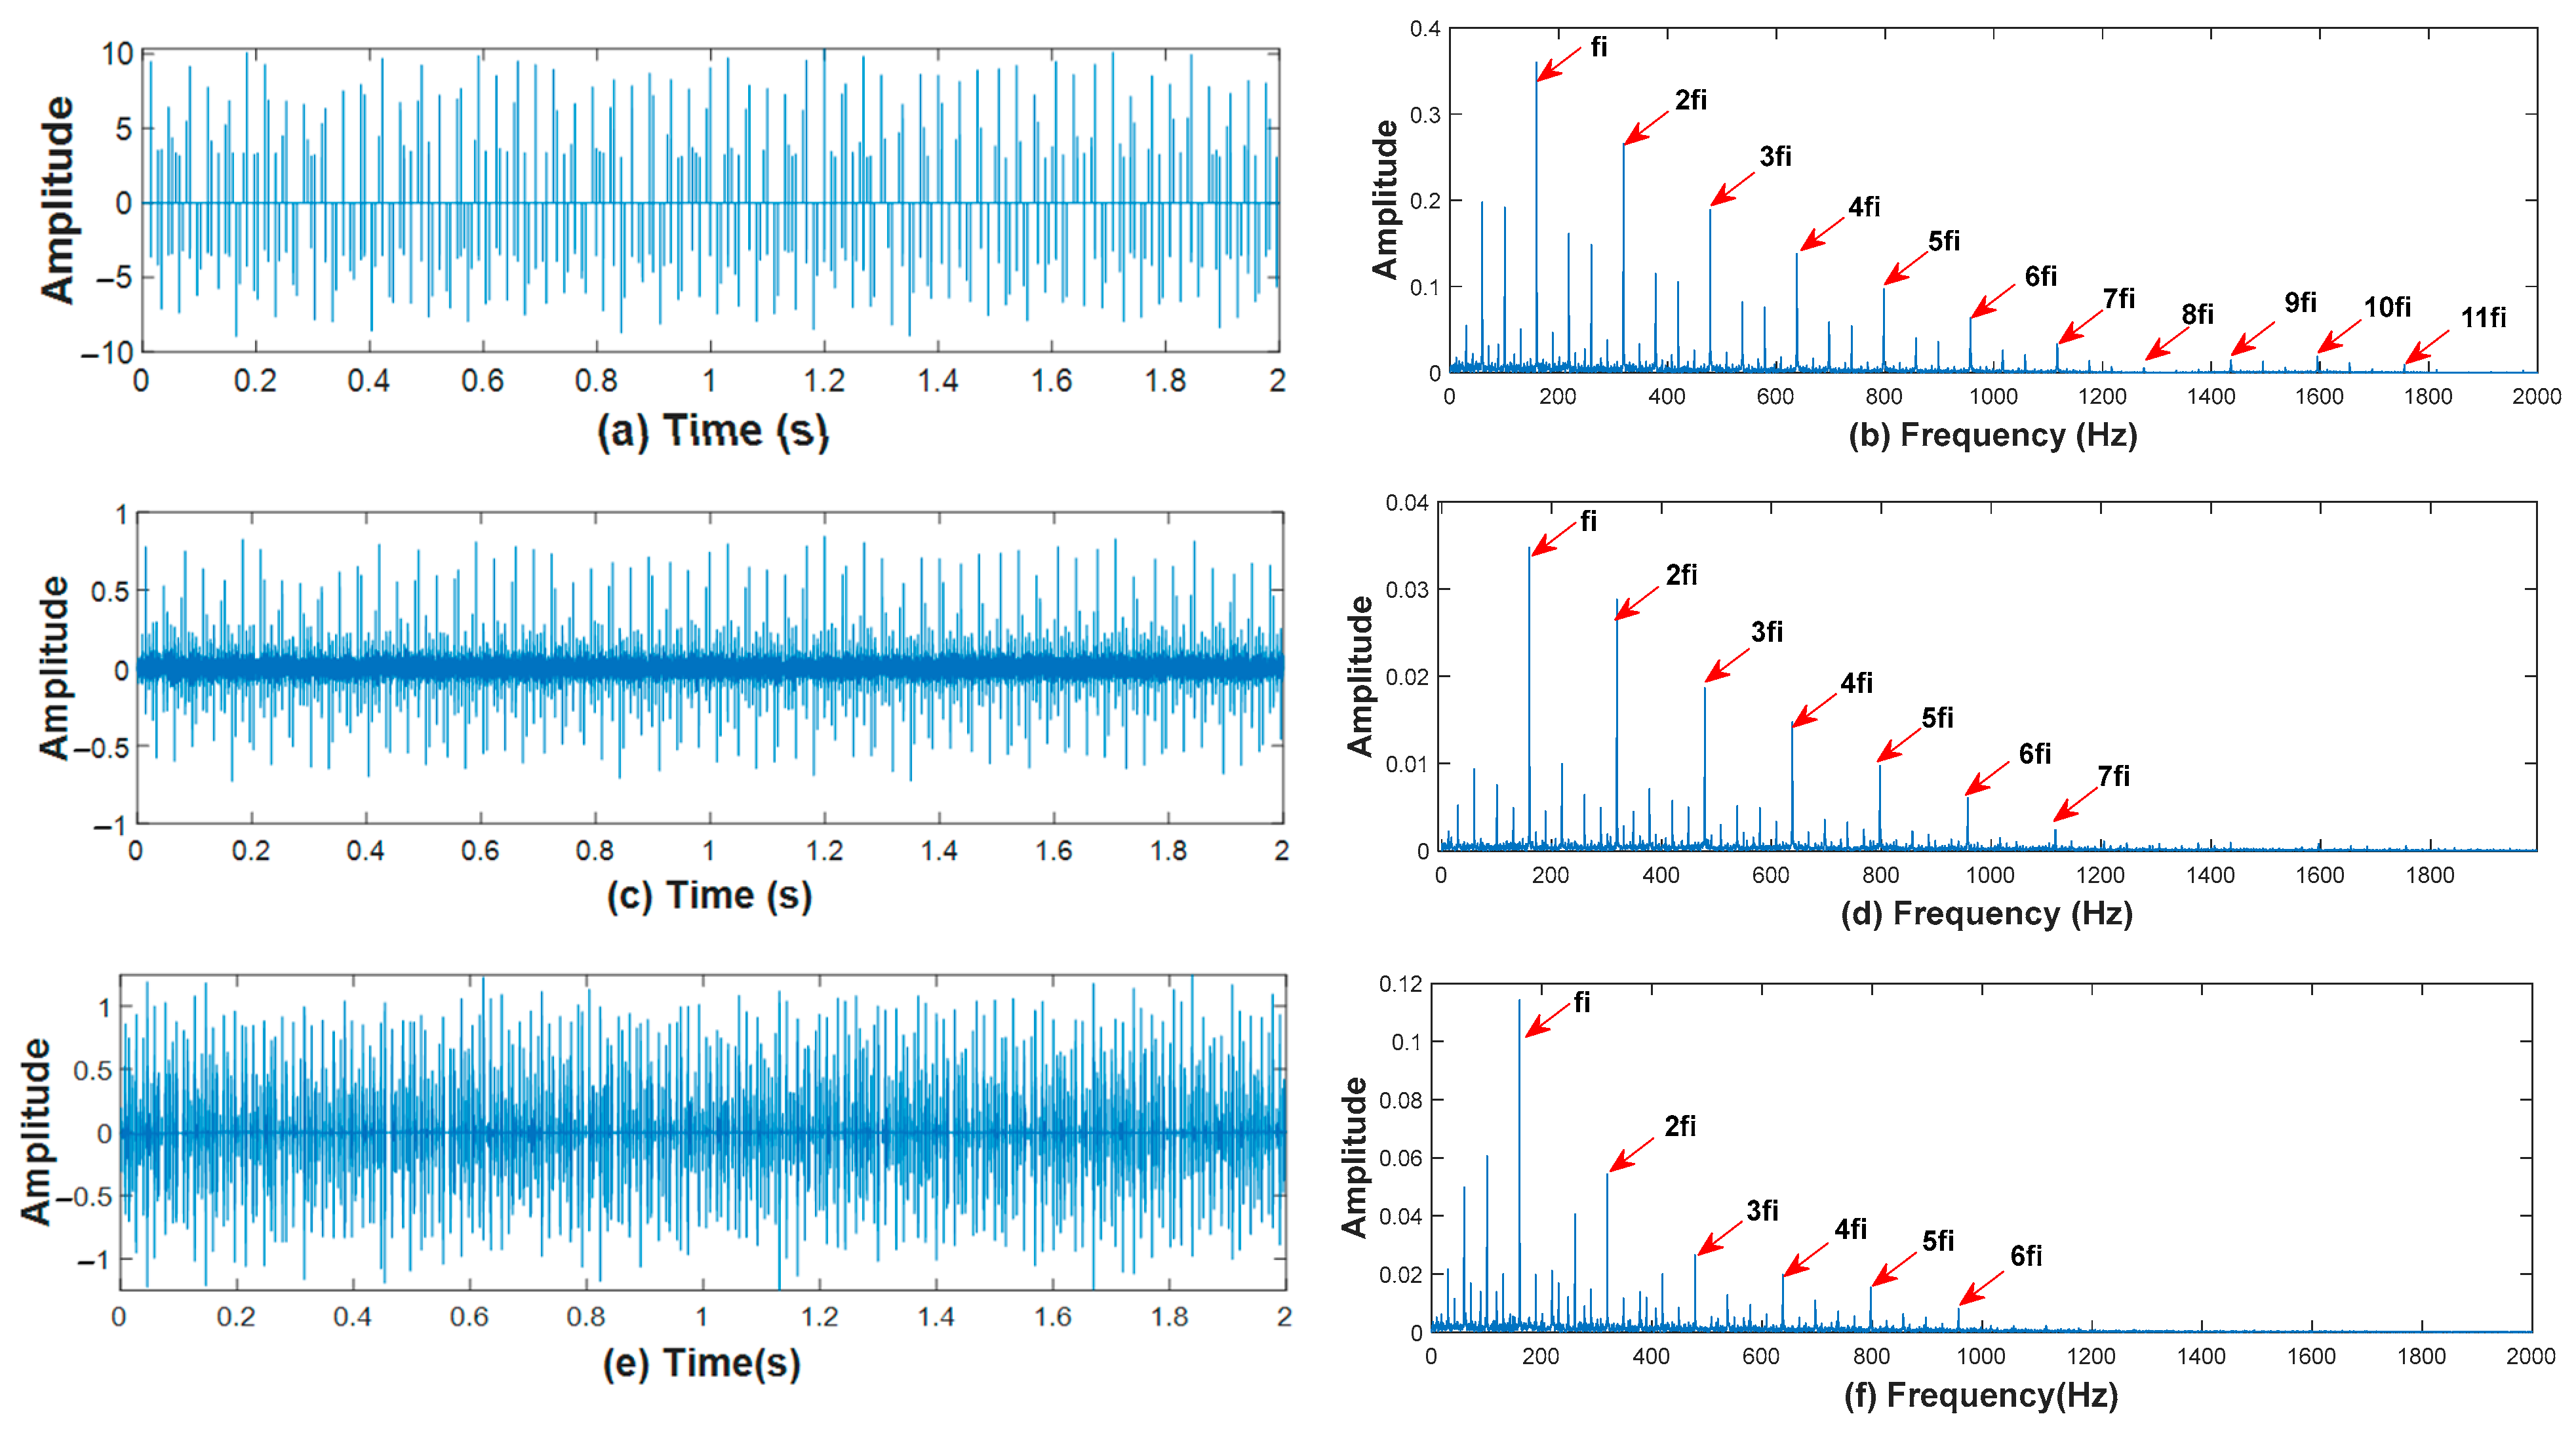
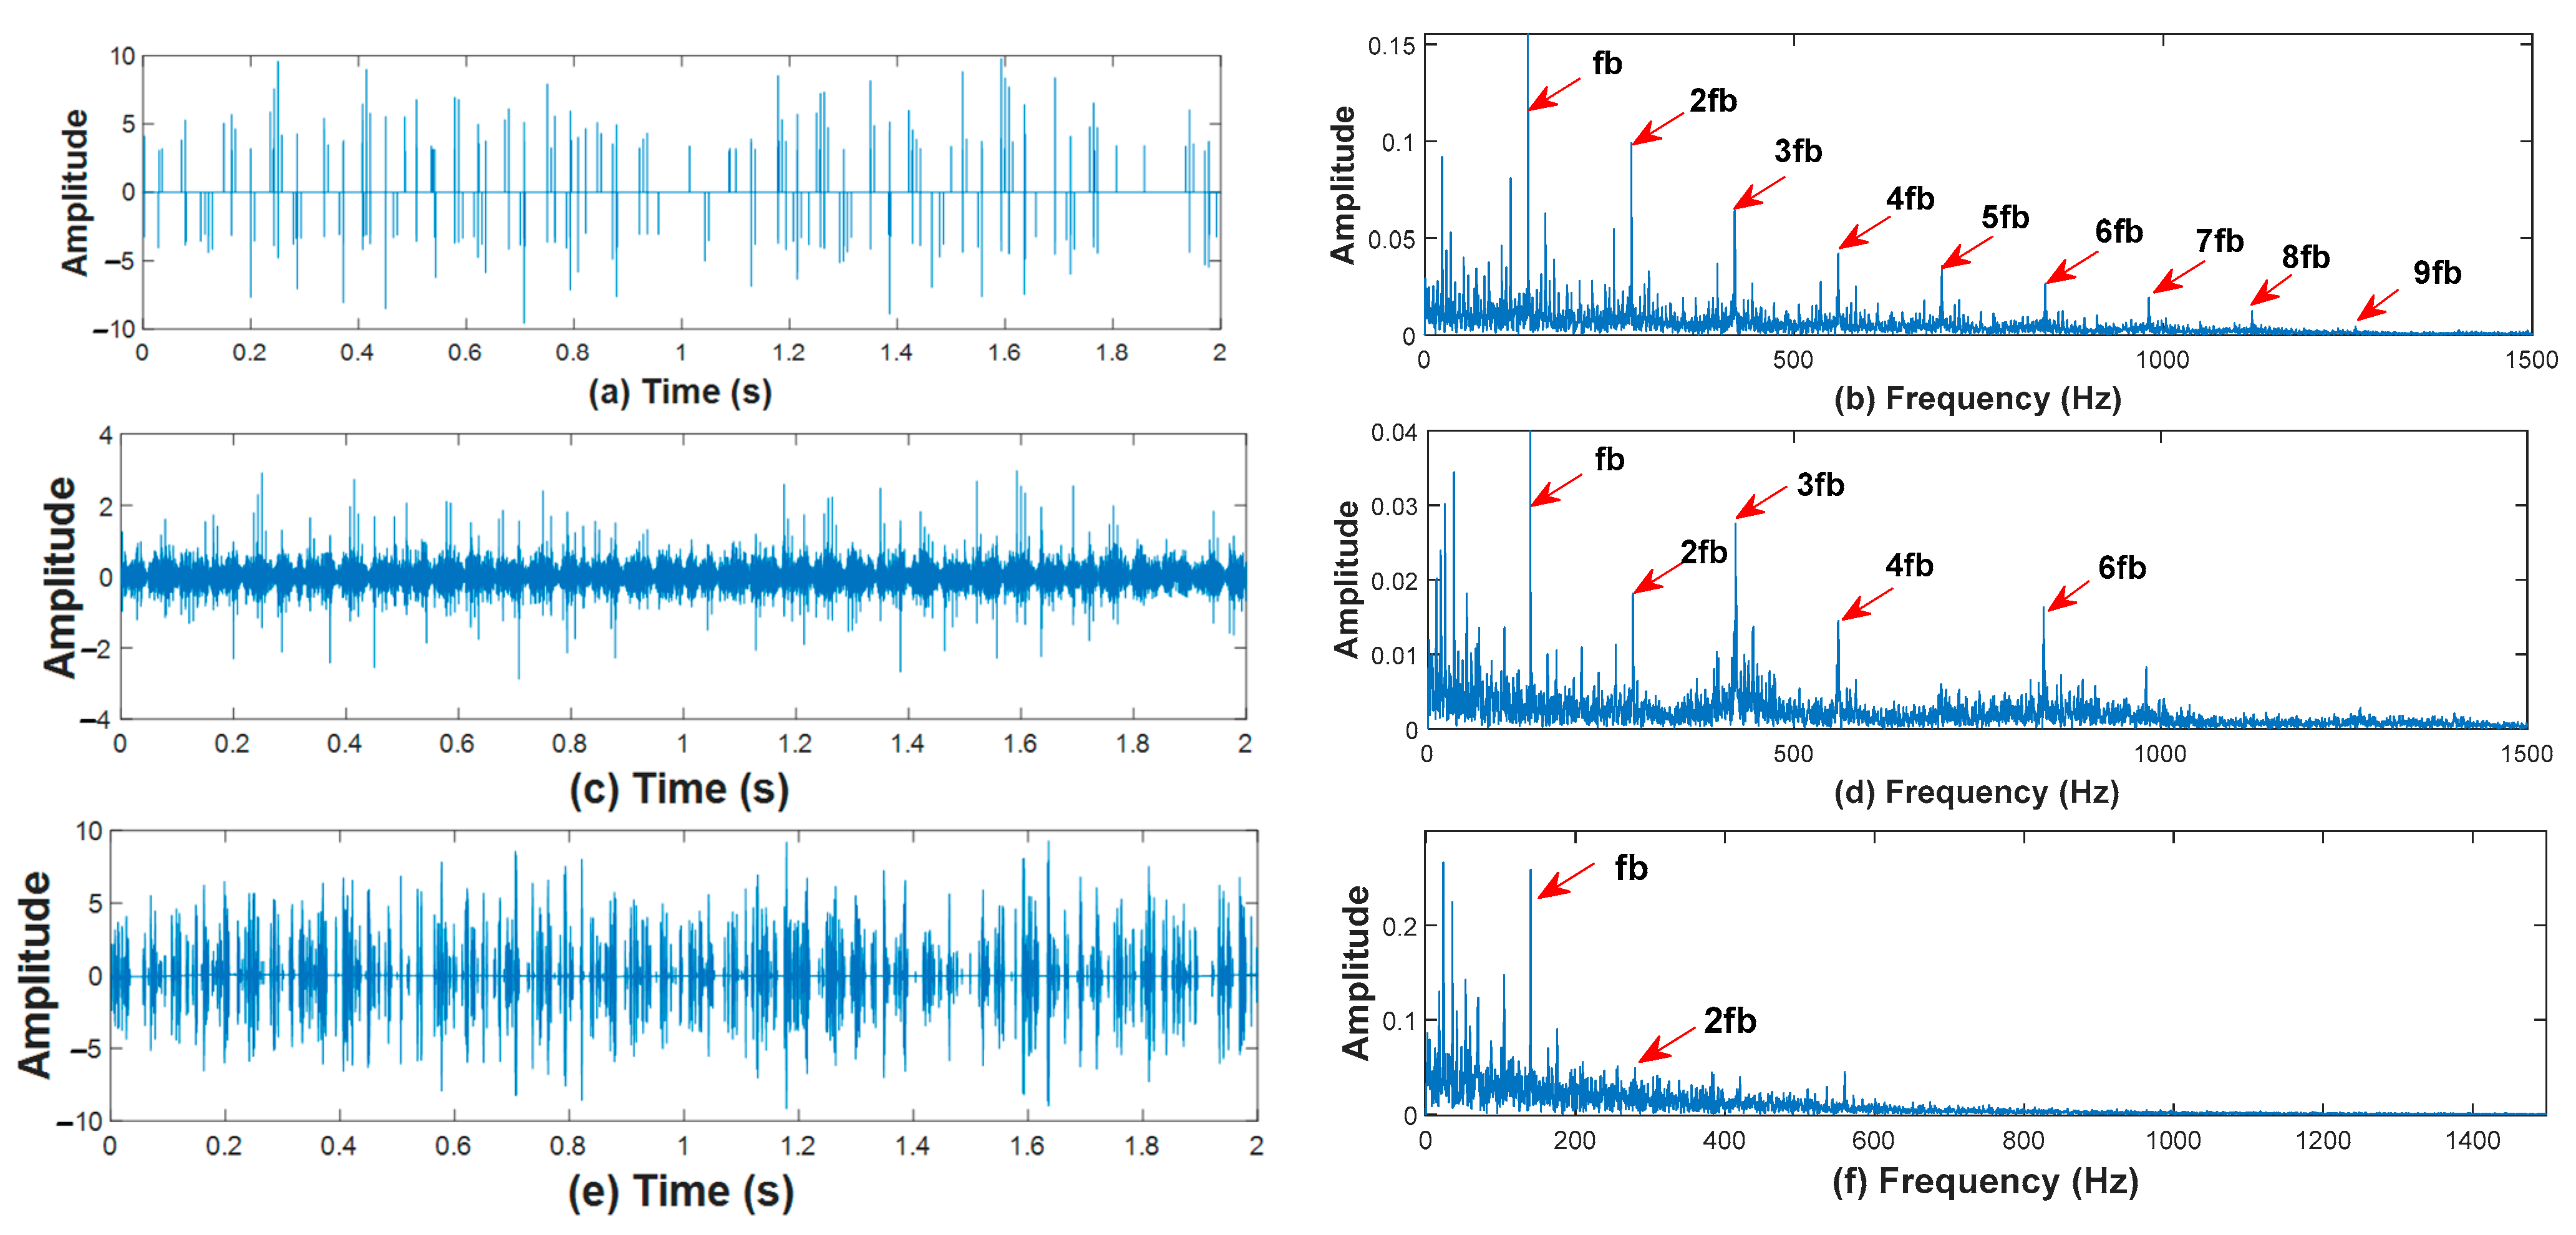
4.1.3. Performing the Proposed Deconvolution Process

This method focuses on minimizing noise interference in the MED output. The first step is to highlight the fault impulses in selected combination CM 1 2 using MED. Following that, we minimize the noise using the rule of three-sigma. As illustrated in Figure 9a, the noise is minimized, and the fault impulses are emphasized. From the envelope spectrum in Figure 9b, we can efficiently and accurately extract the inner race fault characteristic frequency f i and nine harmonics (2 f i , 3 f i , 4 f i , 5 f i , 6 f i , 7 f i , 8 f i , 9 f i , and 10 f i ). This indicates that the rolling bearing fault feature extraction method proposed in this paper can extract fault information excellently.

4.2. Advantages of the Proposed Methods for the Diagnosis of the Simulated Signal

To demonstrate the superiority of the proposed enhanced deconvolution process, the conventional MED is performed on the selected combination   CM 1 2 . Figure 9c,d shows the results of processing the selected combination CM 1 2 . by the MED. As shown in Figure 9c, the fault impulses are highlighted, and the noise level is decreased. However, some noise interference can still be seen. By comparing it with Figure 9a, it is clear that noise interference has been reduced significantly. From the envelope spectrum in Figure 9d, we can extract only the inner race fault characteristic frequency f i and five harmonics (2 f i , 3 f i , 4 f i , 5 f i , and 6 f i ). In comparison with Figure 9b, it is apparent that we can get more fault information. The comparison results demonstrate that the proposed enhanced MED outperformed the MED for improving fault detection. To demonstrate the superiority of the enhanced MED approach in minimizing noise, the wavelet de-noised method is performed on the selected combination CM 1 2 . Figure 9e shows that the noise interference is reduced to some extent; however, the extracted fault frequency and its harmonics in Figure 9f are not as good as in Figure 9b. In this case, the wavelet de-noising method is less efficient in suppressing noise, making it difficult to extract fault information from the combination CM 1 2 . The results demonstrate that the proposed enhanced MED outperformed the wavelet de-noising method in suppressing noise. The inter-harmonics (inter-characteristic frequencies of the faults) present the harmonics of the rotational frequency which are considered as extracted information. In Figure 9b, one can see that the harmonics multiple of the rotational frequency are obvious, while they are hidden in Figure 9d. This is due to the fact that the noise has been minimised in Figure 9a. In addition, a comparison of the conventional IMF selection method using maximum kurtosis with the proposed KMAD selection indicator is presented to illustrate its advantages. Table 1 shows the kurtosis values of the first six IMFs. It can be seen that IMF1 has the highest value of all the decomposition results, so it is selected as a sensitive IMF. IMF1 was treated using the enhanced deconvolution approach. As shown in the envelope spectrum of Figure 10a, the extracted fault information is weaker than the extracted fault information in Figure 10b. This indicates that the combination CM 1 2 contains rich fault feature information. The KMAD indicator identified CM 1 2 as a combination of suitable IMFs, i.e., IMF1 and IMF2. Consequently, if we choose only IMF1, the information contained in IMF2 will be lost. This proves that selecting the appropriate combination using the KMAD selection indicator overcomes the drawback of the IMF selection method using kurtosis to ensure that no information about the defect is lost.

5. Experimental Validation

Experimental data from the Case Western Reserve University [34] was used to validate the proposed method’s effectiveness for detecting rolling bearing faults. As shown in Figure 11, the experimental set is composed of a 2 hp motor, a torque sensor/encoder, a dynamometer, and control electronics. Single point faults were introduced using electro-discharge machining, providing defects in the outer ring, the ball, and the inner ring. The rotating speed of the shaft varied from 1730 to 1797 RPM. We used the time signal of the drive end bearing in this study, recorded for the inner race, outer race, and ball fault. The data were gathered with 12,000 Hz. The deep groove ball bearing 6205-2RS JEM SKF was used in this experimental test. The bearing parameters are detailed in [34]. The bearing defect is localized in the early stages: a crack or spall. Rolling elements generate shock impulses every time they hit a local fault in the inner or outer ring. These repeated shock pulses produce a vibration at the frequency associated with the faulty element. This frequency is usually called the fault characteristics frequency, for example, BPFI (ball passing frequency inner race), BPFO (ball passing frequency outer race), and BFF (ball fault frequency), which are related to the inner race, the outer race, and the ball, respectively. The following are their mathematical equations [35]:
BPFI = f r 2 N b   ( 1 + D b COS β   D c )
BPFO = f r 2 N b   ( 1 D b COS β   D c )
BFF = f r 2 D c D b   [ 1   D b COS β D c 2 ]
F r , N b , D c , D b , and β correspond to the frequency of rotation, rolling element number, pitch diameter, ball diameter, and angle of contact, respectively.

5.1. Case 1: Diagnosis of the Inner Race Fault

In this case, the vibration signal emanates from the inner race fault. The shaft speed is 1772 rpm, the load is 1hp, and the fault size is 0.007 inches. According to Equation (26), the calculated fault characteristic frequency for the inner race is 159.9 Hz. Taking 24,000 data points for analysis, I measured original bearing signal with an inner race fault signal is plotted in Figure 12a. The periodic impulses cannot be extracted due to the noise effect. From the envelope spectrum in Figure 12b, the fault characteristic fi and the first harmonic can be extracted. However, the other harmonics are surrounded by noise interference. Therefore, this signal requires pre-processing to improve fault detection.

5.1.1. Analysis of the Proposed Method

First, the proposed CMEEMD is used to extract the CMs from the experimental inner race fault signal. From the first six IMFs, fifteen combined modes (CMs) are generated using the method detailed in Section 3.1. The obtained IMFs are plotted in Figure 13, and the extracted CMs are illustrated in Figure 14. The next step is determining the most appropriate combination. By looking at the time domain waveform of each combination in Figure 14, it can be seen that the difference between the CMs is not significant. It is impossible to recognize directly which combination contains the most information about the fault. Therefore, the appropriate combination is selected using the proposed KMAD indicator. Based on Equation (25), Figure 15 illustrates the KMAD values of each combination. The combination CM 1 2 has the highest value among all the other combinations, indicating that it is the best combination of the sensitive IMFs, including IMF1 and IMF2. Following this, the enhanced MED approach is executed on the selected combination. First, MED is used to minimize the entropy of CM 1 2 . After that, the output MED noise is minimized using the three-sigma rule. As illustrated in Figure 16a, the noise is restricted, and the fault impulses are highlighted. From the envelope spectrum in Figure 16b, we can extract the inner race fault characteristic frequency f i and ten harmonics (2 f i , 3 f i , 4 f i , 5 f i , 6 f i , 7 f i , 8 f i , 9 f i , 10 f i , and 11 f i ). This suggests that the rolling bearing fault feature extraction method proposed in this paper is able to extract rich fault information.

5.1.2. Advantages of the Proposed Techniques for Inner Race Fault Diagnosis

Figure 16c,d shows the results of processing CM 1 2 by the conventional MED. As shown in Figure 16c, the fault impulses are emphasized, and the noise level is reduced. However, it can be seen that some noise interference still exists. According to Figure 16a, noise interference has been reduced effectively. From the envelope spectrum in Figure 16d, we can distinguish only the inner race fault characteristic frequency f i and six harmonics (2 f i , 3 f i , 4 f i , 5 f i , 6 f i , and 7 f i ). By comparing it with Figure 16b, it is clear that we can get more fault information. The comparison results show that the enhanced MED performs better than the MED in improving defect detection. To show the enhanced MED approach’s superiority in eliminating noise, the wavelet de-noised method is performed on the selected combination CM 1 2 . As shown in Figure 16e, although the noise is reduced, the fault impulses are not highlighted as in Figure 16a. In addition, the extracted fault frequency and its harmonics in Figure 16f are not as excellent as those in Figure 16b. In this case, it can be said that the inability of the wavelet de-noising method to reduce noise effectively makes it difficult to extract rich fault information from the combination CM 1 2 . The comparison results demonstrate that the enhanced MED performs better than the wavelet de-noising method in eliminating noise. The amplitudes of the inter-harmonics shown in Figure 16b,d,f are much smaller than those shown in Figure 9b,d,f, respectively. This is due to the fact that a signal with high noise ( σ 2   = 0.7 2 ) is created in the simulation. This makes it more difficult to eliminate noise interference in the simulated signal than in the experimental signal. As a result, the amplitude of the noise interference will mix with the inter-harmonics. To illustrate the advantages of the KMAD selection indicator, this paper conducted a comparison with the IMF selection method using kurtosis. Table 2 shows the kurtosis values of the first six IMFs. It is evident that IMF2 has the highest value among all the decomposition results, so it is selected as the sensitive IMF. IMF2 was processed using the enhanced MED approach. From the envelope spectrum of Figure 17a, it is clear that the extracted fault information is less than the extracted fault information in Figure 17b. This shows that the combination CM 1 2 holds rich fault feature information. The KMAD indicator selected CM 1 2 as an appropriate combination of suitable IMFs, namely IMF1 and IMF2. As a result, if we take only IMF2, the information in IMF1 will be lost. This demonstrates that utilizing the KMAD selection indicator to select the appropriate combination overcomes the disadvantage of using kurtosis to choose the sensitive IMF and guarantees no information about the fault is lost.

5.2. Case 2: Diagnosis of the Outer Race Fault

The vibration signal in this case is caused by an outer race fault, with the shaft rotating at 1797 rpm and no load applied. The size of the fault is 0.021 inches, and the calculated fault characteristic frequency is 107.01 Hz. Taking 24,000 data points for analysis, Figure 18a shows the measured bearing signal with an outer race fault. It can be seen that the noise prevents the periodic impulses from being extracted. From the envelope spectrum in Figure 18b, although the fault characteristic frequency f o and the first harmonic 2 f o can be extracted, the remaining harmonics are shrouded in noise interference. Therefore, this fault signal necessitates pre-processing to improve fault detection.

5.2.1. Analysis of the Proposed Method

In the first step, CMEEMD extracts the CMs from the experimental outer race fault signal. Using the CMs extraction technique described in Section 3.1, fifteen CMs are created from the first six IMFs. Figure 19 shows the resulting IMFs, and Figure 20 shows the extracted CMs. The next step is to determine which combination is the most sensitive. The time-domain waveforms of each combination in Figure 20 show that there is no noticeable difference between the CMs. It is impossible to directly recognize the combination that combines only the useful IMFs. As a result, the suggested KMAD indicator is used to identify the appropriate combination. Figure 21 shows the KMAD values for each combination. The combination CM 1 2 has the highest value. This indicates that it is a combination of sensitive IMFs, i.e., IMF1 and IMF2. Following that, the combination CM 1 2 was processed using the enhanced MED approach. First, MED highlights the fault impulses of CM 1 2 . Then, the MED output is treated to the de-noised method derived from the three-sigma rule. As shown in Figure 22a, the noise is minimized, and the fault impulses are prominent. From the envelope spectrum in Figure 22b, we can accurately extract the outer race fault characteristic frequency f o and nine harmonics (2 f o , 3 f o , 4 f o , 5 f o , 6 f o , 7 f o , 8 f o , 9 f o , and 10 f o ). This implies that the proposed method for bearing fault feature extraction can effectively extract rich fault information.

5.2.2. Advantages of the Proposed Techniques for Outer Race Fault Diagnosis

The results of processing CM 1 2 by MED are shown in Figure 22c,d. As seen in Figure 22c, the noise level is decreased, and the fault impulses are accentuated. However, there still exists noise interference. Compared to Figure 22a, noise interference has been significantly reduced. Analyzing the envelope spectrum in Figure 22d, it can be seen that we can extract less fault information than we can in Figure 22b. It is evident from the comparison results that the enhanced MED is more effective in improving fault detection compared to the MED. The wavelet de-noising method is performed on the selected combination, and the results are shown in Figure 22e,f. Although the noise has been reduced to a certain extent in Figure 22e, the extracted fault frequency and its harmonics in Figure 22f are less accurate than those extracted in Figure 22b. In this case, the inability of the wavelet de-noising to successfully decrease noise prevents the extraction of rich fault information from the combination CM 1 2 . The results of the comparison confirm that the proposed enhanced MED eliminates noise better than the wavelet de-noising method. To show the advantages of the CM selection method using KMAD, this paper performs a comparison with the IMF selection method using kurtosis. The kurtosis values for the first six IMFs are presented in Table 3. It appears that IMF2 has the highest value, so it is selected as a sensitive IMF. Next, IMF2 was treated using the enhanced MED approach. Based on the envelope spectrum of Figure 23a, we can extract only the outer race fault characteristic frequency f o and three harmonics (2 f o , 3 f o , 4 f o ). By comparing it with Figure 23b, it is clear that we can extract more fault information ( f o , 2 f o , 3 f o , 4 f o , 5 f o , 6 f o , 7 f o , 8 f o , 9 f o , and 10 f o ). This indicates that the selected combination contains rich defect information. The KMAD indicator identified CM 1 2 as an appropriate combination of suitable IMFs, i.e., IMF1 and IMF2. Therefore, if we only select IMF2, the fault information in IMF1 will be wasted. This demonstrates that selecting the appropriate combination using the proposed indicator overcomes the disadvantage of the IMF selection using kurtosis to assure that no defect information is wasted.

5.3. Case 3: Diagnosis of the Ball Bearing Fault

The ball race fault in this case generates the vibration signal. The shaft speed is 1772 rpm, the load is 1 hp, and the fault size is 0.028 inches. The calculated fault characteristic frequency for the ball race is 139.18 Hz based on Equation (28). Analyzing 24,000 data points, the bearing signal with a ball race fault is shown in Figure 24a. Due to the noise, it is difficult to distinguish the impact characteristics. From the envelope spectrum in Figure 24b, although the fault characteristic frequency f b can be distinguished, its harmonics are masked by noise interference. To improve fault detection, this fault signal requires a pre-processing step.

5.3.1. Analysis of the Proposed Method

First, CMEEMD extracts the CMs of adjoining modes resulting from the decomposition of the ball defect vibration signal. The first six IMFs produce fifteen CMs using the CMs extraction technique described in Section 3.1. The obtained IMFs are shown in Figure 25, and the extracted CMs are shown in Figure 26. Identifying the most sensitive combination is the next step. According to Figure 26, there is no noticeable difference between the CMs based on their time-domain waveforms. Directly identifying the combination of useful IMFs is impossible. Therefore, the suggested KMAD indicator is used to identify the appropriate combination. According to Figure 27, the combination CM 1 2 has the highest KMAD value. Accordingly, it indicates that it combines sensitive IMFs, i.e., IMF1 and IMF2. The combination CM 1 2 was then performed using the enhanced deconvolution approach presented here. The noise is reduced considerably as shown in Figure 28a, and rich fault information ( f b , 2 f b , 3 f b , 4 f b , 5 f b , 6 f b , 7 f b , 8 f b , and 9 f b ) can be extracted from the envelope spectrum presented in Figure 28b. This suggests that the proposed strategy can greatly enhance fault identification. Additionally, this demonstrates the validity of the proposed strategy for bearing fault feature extraction.

5.3.2. Advantages of the Proposed Techniques for Ball Bearing Fault Diagnosis

Figure 28c,d shows the results of processing the combination CM 1 2 by the MED. As shown in Figure 28c, despite the noise level reduction, noise interference is still present. Compared to Figure 28a, the noise interference has been successfully minimized. Based on the envelope spectrum in Figure 28d, we can distinguish only the characteristic frequency of the ball race fault f b and five harmonics (2 f b , 3 f b , 4 f b , 6 f b , 7 f b ). Comparing it with Figure 28b, it is clear that the fault frequency with its multiplication components are extracted perfectly. It is evident from the results of the comparison that the enhanced MED is better than the MED for improving fault detection. The wavelet de-noised method is performed on the selected combination, and the results are shown in Figure 28e,f. Although the noise has been reduced to a certain extent in Figure 28e, the envelope spectrum presented in Figure 28f shows that we can distinguish only the characteristic frequency f b and the first harmonic, whereas Figure 28b shows that we can perfectly extract fault information ( f b , 2 f b , 3 f b , 4 f b , 5 f b , 6 f b , 7 f b , 8 f b , and 9 f b ). In this case, the inability of the wavelet de-noising approach to successfully decrease noise prevents the extraction of rich fault information from the combination CM 1 2 . It is evident from the comparison results that the enhanced MED suppresses noise more effectively than the wavelet de-noising technique. As an illustration of the advantages of the proposed CM selection method, we have compared it to the IMF selection method using maximum kurtosis. From Table 4, it can be seen that IMF5 has the highest value, so it is selected as a sensitive IMF. This IMF was processed using the proposed enhanced MED, and the envelope spectrum is shown in Figure 29a. It is clear that no information about the defect can be extracted. This is due to the fact that the use of maximum kurtosis to select the sensitive IMF failed in this case, while the envelope spectrum in Figure 29b illustrated rich fault information. This is because the KMAD indicator proposed here succeeds in selecting the combination of valuable IMFs and proves its superiority for choosing the appropriate combination of useful IMFs.

6. Conclusions

A novel rolling bearing fault feature extraction method is presented here, composed of the following proposed ideas: CMEEMD, the KMAD selection indicator, and an enhanced deconvolution approach. Firstly, the proposed CMEEMD extracts all the CMs from the original bearing vibration signal. A selection indicator named KMAD is proposed to identify the appropriate combination of suitable IMFs. This step aims to directly obtain a signal containing the most characteristic information about the fault, without going through the IMFs selection and reconstruction processes, and guaranteeing that no defect information is lost. Secondly, due to the effect of background noise, it is difficult to obtain rich fault information. Therefore, the proposed enhanced MED is performed on the selected combination. The principle of the enhanced MED is to minimize the noise of the MED output to obtain better analysis results. The selection method used in this paper has been applied to several other bearing vibration signals. From these experimental data, we found that the selected combination is most often CM 1 2 ; however, in rare cases it can also be CM 1 3 and CM 2 3 . On the other hand, several researchers confirm that the bearing defect information is included in the first IMFs. This supports and confirms the validity of the presented method.
The analysis of the simulated signal (presented in Section 4) and experimental rolling bearing cases (inner race, outer race, and ball race presented in Section 5) leads to the following results being concluded:
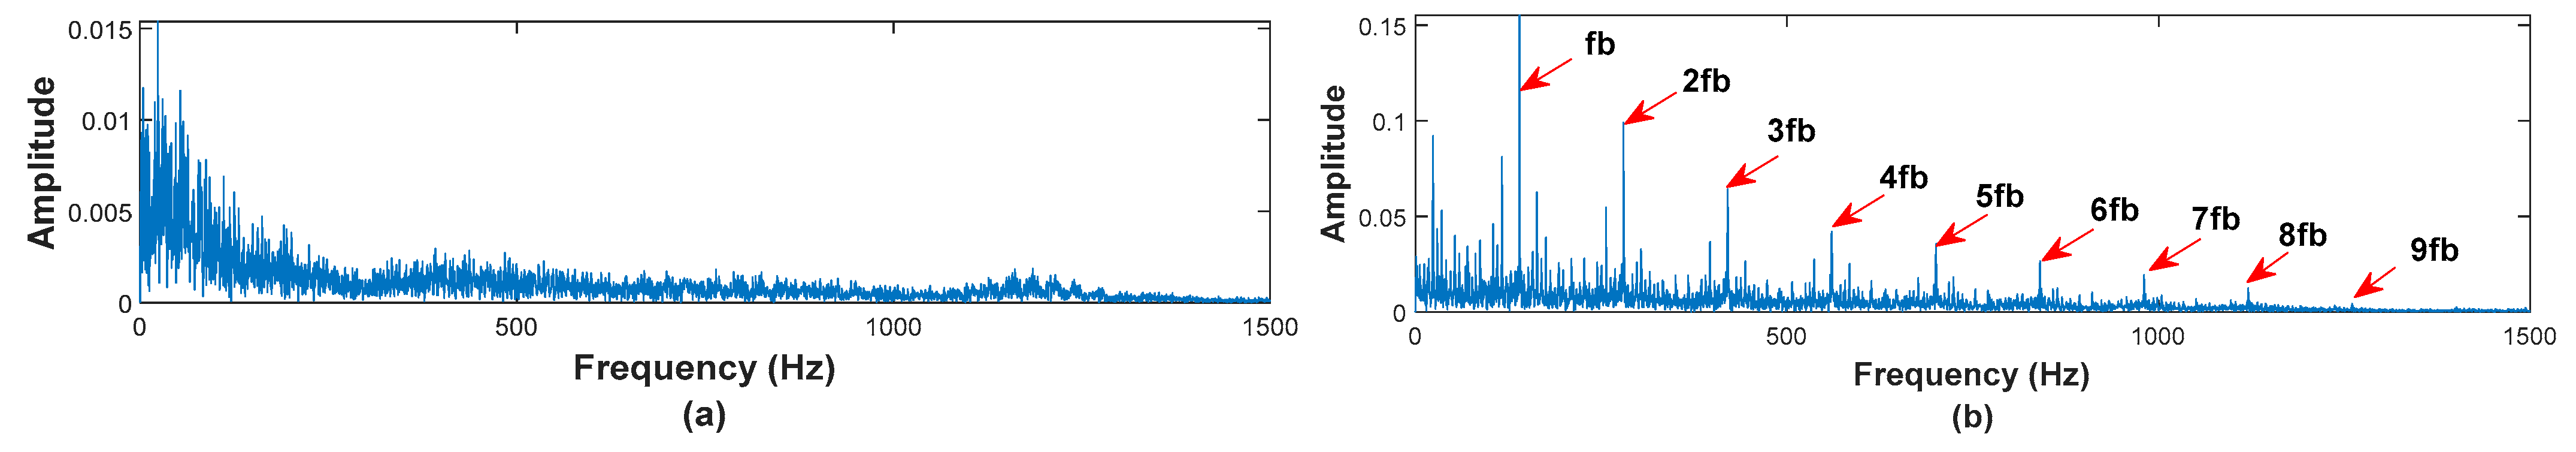
  • Compared to the MED technique, the enhanced MED presented in this paper is more robust in revealing defect pulses (taking Figure 9 as an example).
  • Comparison with the wavelet de-noising method demonstrated that the enhanced MED performs well with noise suppression and is more effective in revealing fault information (taking Figure 28 as an example).
  • Compared results between the sensitive IMF using maximum kurtosis and the sensitive CM using the proposed KMAD indicate that the CM selected contains rich fault feature information (taking Figure 17 as an example).
  • CMEEMD and KMAD proposed herein solves the drawback of the IMF selection method by using the maximum kurtosis value to ensure that no information about the defect is wasted (taking Figure 23 as an example).
  • In contrast to the conventional IMF selection method that failed to identify the appropriate IMF for the ball defect, the KMAD indicator was successful in selecting the appropriate combination of useful IMFs (see Figure 29).
  • The analysis of simulated and experimental rolling bearing signals confirms that the proposed strategy for bearing fault diagnosis can greatly enhance fault detection and effectively extract rich fault information (taking Figure 28 and Figure 9 as examples).

Author Contributions

Conceptualization, Y.D.; methodology, Y.D., N.B., R.P., A.C.M., R.R. and S.S.; validation, Y.D., N.B. and A.C.M.; resources, Y.D., N.B. and A.C.M.; writing—original draft preparation, Y.D., N.B., A.C.M., R.R., R.P. and S.S.; writing—review and editing, Y.D., N.B., R.P., A.C.M., R.R. and S.S; visualization, Y.D., A.C.M., R.R., N.B., R.P. and N.B.; supervision, Y.D., R.R., R.P., N.B., A.C.M. and S.S.; paper submitting, R.P., R.R., N.B. and Y.D. All authors have read and agreed to the published version of the manuscript.

Funding

This research received no external funding.

Data Availability Statement

Not applicable.

Conflicts of Interest

The authors declare no conflict of interest.

References

  1. Deekshit Kompella, K.C.; Venu Gopala Rao, M.; Srinivasa Rao, R. Bearing fault detection in a 3 phase induction motor using stator current frequency spectral subtraction with various wavelet decomposition techniques. Ain Shams Eng. J. 2018, 9, 2427–2439. [Google Scholar] [CrossRef]
  2. Kumar, P.S.; Kumaraswamidhas, L.A.; Laha, S.K. Selecting effective intrinsic mode functions of empirical mode decomposition and variational mode decomposition using dynamic time warping algorithm for Rolling Element Bearing Fault diagnosis. Trans. Inst. Meas. Control 2018, 41, 1923–1932. [Google Scholar] [CrossRef]
  3. Chen, L.; Xu, G.; Zhang, S.; Yan, W.; Wu, Q. Health indicator construction of machinery based on end-to-end trainable convolution recurrent neural networks. J. Manuf. Syst. 2020, 54, 1–11. [Google Scholar] [CrossRef]
  4. Huang, N.E.; Shen, Z.; Long, S.R.; Wu, M.C.; Shih, H.H.; Zheng, Q.; Yen, N.-C.; Tung, C.C.; Liu, H.H. The empirical mode decomposition and the Hilbert spectrum for nonlinear and non-stationary time series analysis. Proc. R. Soc. Lond. Ser. A Math. Phys. Eng. Sci. 1998, 454, 903–995. [Google Scholar] [CrossRef]
  5. Zheng, J.; Huang, S.; Pan, H.; Jiang, K. An improved empirical wavelet transform and refined composite multiscale dispersion entropy-based fault diagnosis method for rolling bearing. IEEE Access 2020, 8, 168732–168742. [Google Scholar] [CrossRef]
  6. Wu, Z.; Huang, N. Ensemble empirical mode decomposition: A noise-assisted data analysis method. Adv. Adapt. Data Anal. 2009, 1, 1–41. [Google Scholar] [CrossRef]
  7. Lei, Y.; Lin, J.; He, Z.; Zuo, M.J. A review on empirical mode decomposition in fault diagnosis of rotating machinery. Mech. Syst. Signal Process. 2013, 35, 108–126. [Google Scholar] [CrossRef]
  8. Wang, H.; Chen, J.; Dong, G. Feature extraction of rolling bearing’s early weak fault based on EEMD and tunable Q-factor wavelet transform. Mech. Syst. Signal Process. 2014, 48, 103–119. [Google Scholar] [CrossRef]
  9. Yang, F.; Kou, Z.; Wu, J.; Li, T. Application of mutual information-sample entropy based Med-ICEEMDAN de-noising scheme for weak fault diagnosis of hoist bearing. Entropy 2018, 20, 667. [Google Scholar] [CrossRef] [Green Version]
  10. Li, J.; Tong, Y.; Guan, L.; Wu, S.; Li, D. A UV-visible absorption spectrum denoising method based on EEMD and an improved universal threshold filter. RSC Adv. 2018, 8, 8558–8568. [Google Scholar] [CrossRef] [Green Version]
  11. Ricci, R.; Pennacchi, P. Diagnostics of gear faults based on EMD and automatic selection of intrinsic mode functions. Mech. Syst. Signal Process. 2011, 25, 821–838. [Google Scholar] [CrossRef] [Green Version]
  12. Li, Z.; Shi, B. Research of fault diagnosis based on sensitive intrinsic mode function selection of EEMD and Adaptive Stochastic Resonance. Shock Vib. 2016, 2016, 2841249. [Google Scholar] [CrossRef] [Green Version]
  13. Ma, J.; Wu, J.; Wang, X. Incipient fault feature extraction of rolling bearings based on the MVMD and teager energy operator. ISA Trans. 2018, 80, 297–311. [Google Scholar] [CrossRef]
  14. Luo, C.; Jia, M.P.; Wen, Y. The Diagnosis Approach for Rolling Bearing Fault Based on Kurtosis Criterion EMD and Hilbert Envelope Spectrum. In Proceedings of the 2017 IEEE 3rd Information Technology and Mechatronics Engineering Conference (ITOEC), Chongqing, China, 3–5 October 2017. [Google Scholar]
  15. Damine, Y.; Megherbi, A.C.; Sbaa, S.; Bessous, N. Study of the IMF Selection Methods Using Kurtosis Parameter for Bearing Fault Diagnosis. In Proceedings of the 2022 IEEE 19th International Multi-Conference on Systems, Signals & Devices (SSD), Setif, Algeria, 6–10 May 2022. [Google Scholar]
  16. Pennacchi, P.; Ricci, R.; Chatterton, S.; Borghesani, P. Effectiveness of med for fault diagnosis in roller bearings. Springer Proc. Phys. 2011, 139, 637–642. [Google Scholar] [CrossRef]
  17. Chatterton, S.; Ricci, R.; Pennacchi, P.; Borghesani, P. Signal Processing Diagnostic Tool for rolling element bearings using EMD and Med. Lect. Notes Mech. Eng. 2013, 379–388. [Google Scholar] [CrossRef]
  18. Ding, J.; Huang, L.; Xiao, D.; Jiang, L. A fault feature extraction method for rolling bearing based on intrinsic time-scale decomposition and AR minimum entropy deconvolution. Shock Vib. 2021, 2021, 1–19. [Google Scholar] [CrossRef]
  19. Zhao, H.; Min, F.; Zhu, W. Test-cost-sensitive attribute reduction of data with normal distribution measurement errors. Math. Probl. Eng. 2013, 2013, 6673965. [Google Scholar] [CrossRef] [Green Version]
  20. Fang, K.; Zhang, H.; Qi, H.; Dai, Y. Comparison of EMD and EEMD in Rolling Bearing Fault Signal Analysis. In Proceedings of the 2018 IEEE International Instrumentation and Measurement Technology Conference (I2MTC), Houston, TX, USA, 14–17 May 2018. [Google Scholar]
  21. Wiggins, R.A. Minimum entropy deconvolution. Geoexploration 1978, 16, 21–35. [Google Scholar] [CrossRef]
  22. González, G.; Badra, R.E.; Medina, R.; Regidor, J. Period estimation using minimum entropy deconvolution (MED). Signal Process. 1995, 41, 91–100. [Google Scholar] [CrossRef]
  23. Sawalhi, N.; Randall, R.B.; Endo, H. The enhancement of fault detection and diagnosis in rolling element bearings using minimum entropy deconvolution combined with spectral kurtosis. Mech. Syst. Signal Process. 2007, 21, 2616–2633. [Google Scholar] [CrossRef]
  24. Shojae Chaeikar, S.; Manaf, A.A.; Alarood, A.A.; Zamani, M. PFW: Polygonal fuzzy weighted—An SVM kernel for the classification of overlapping data groups. Electronics 2020, 9, 615. [Google Scholar] [CrossRef] [Green Version]
  25. Qin, B.; Luo, Q.; Zhang, J.; Li, Z.; Qin, Y. Fault frequency identification of rolling bearing using reinforced ensemble local mean decomposition. J. Control Sci. Eng. 2021, 2021, 2744193. [Google Scholar] [CrossRef]
  26. Wang, H.-D.; Deng, S.-E.; Yang, J.-X.; Liao, H. A fault diagnosis method for rolling element bearing (REB) based on reducing Reb Foundation vibration and noise-assisted vibration signal analysis. Proc. Inst. Mech. Eng. Part C J. Mech. Eng. Sci. 2018, 233, 2574–2587. [Google Scholar] [CrossRef]
  27. Zhen, D.; Guo, J.; Xu, Y.; Zhang, H.; Gu, F. A novel fault detection method for rolling bearings based on non-stationary vibration signature analysis. Sensors 2019, 19, 3994. [Google Scholar] [CrossRef] [PubMed] [Green Version]
  28. Dibaj, A.; Hassannejad, R.; Ettefagh, M.M.; Ehghaghi, M.B. Incipient fault diagnosis of bearings based on parameter-optimized VMD and Envelope Spectrum Weighted Kurtosis index with a new sensitivity assessment threshold. ISA Trans. 2021, 114, 413–433. [Google Scholar] [CrossRef]
  29. Chen, J.; Yu, D.; Yang, Y. The application of energy operator demodulation approach based on EMD in machinery fault diagnosis. Mech. Syst. Signal Process. 2007, 21, 668–677. [Google Scholar] [CrossRef]
  30. Yang, Y.; Yu, D.; Cheng, J. A fault diagnosis approach for roller bearing based on IMF envelope spectrum and SVM. Measurement 2007, 40, 943–950. [Google Scholar] [CrossRef]
  31. Cheng, Y.; Wang, Z.; Chen, B.; Zhang, W.; Huang, G. An improved complementary ensemble empirical mode decomposition with adaptive noise and its application to rolling element bearing fault diagnosis. ISA Trans. 2019, 91, 218–234. [Google Scholar] [CrossRef]
  32. Sun, Y.; Yu, J. Fault detection of rolling bearing using sparse representation-based adjacent signal difference. IEEE Trans. Instrum. Meas. 2021, 70, 1–16. [Google Scholar] [CrossRef]
  33. Liu, T.; Chen, J.; Dong, G.; Xiao, W.; Zhou, X. The fault detection and diagnosis in rolling element bearings using frequency band entropy. Proc. Inst. Mech. Eng. Part C J. Mech. Eng. Sci. 2012, 227, 87–99. [Google Scholar] [CrossRef]
  34. Download a Data File: Case School of Engineering: Case Western Reserve University. Available online: https://engineering.case.edu/bearingdatacenter/download-data-file (accessed on 24 October 2020).
  35. Saruhan, H.; Sandemir, S.; Çiçek, A.; Uygur, I. Vibration analysis of rolling element bearings defects. J. Appl. Res. Technol. 2014, 12, 384–395. [Google Scholar] [CrossRef]
Figure 1. Flow chart of the ensemble empirical mode decomposition (EEMD) algorithm to obtain the intrinsic mode functions (IMFs).
Energies 16 02604 g001
Figure 2. Flow chart of the proposed combined modes ensemble empirical mode decomposition (CMEEMD).
Energies 16 02604 g002
Figure 3. Proposed enhanced deconvolution process flowchart.
Energies 16 02604 g003
Figure 4. Proposed strategy using CMEEMD, kurtosis median absolute deviation (KMAD) and an Enhanced Deconvolution Process for diagnosing bearing faults.
Energies 16 02604 g004
Figure 5. Inner ring fault simulated signal: (a) waveform; (b) envelope spectrum.
Energies 16 02604 g005
Figure 6. Decomposed result of the simulated signal by EEMD.
Energies 16 02604 g006
Figure 7. Extracted Combined modes (CMs) from the adjoining IMFs.
Energies 16 02604 g007
Figure 8. Kurtosis median absolute deviation (KMAD) values of each combination.
Energies 16 02604 g008
Figure 9. Simulated bearing fault diagnosis results for processing the selected CM using: proposed method (a,b); conventional MED (c,d); and wavelet denoising (e,f).
Energies 16 02604 g009
Figure 10. Diagnosis results of the simulated bearing fault using: (a) sensitive IMF-based Kurtosis; (b) sensitive CM-based KMAD.
Energies 16 02604 g010
Figure 11. Experimental test rig from the Case Western Reserve University (CWRW) [34].
Energies 16 02604 g011
Figure 12. Experimental inner race defect: (a) waveform; (b) envelope spectrum.
Energies 16 02604 g012aEnergies 16 02604 g012b
Figure 13. Decomposed result by EEMD.
Energies 16 02604 g013
Figure 14. Extracted CMs result.
Energies 16 02604 g014
Figure 15. Sensitive CM selection using KMAD.
Energies 16 02604 g015
Figure 16. Inner race fault diagnosis results for processing the selected CM using: proposed method (a,b); conventional MED (c,d); and wavelet denoising (e,f).
Energies 16 02604 g016
Figure 17. Diagnosis results using: (a) sensitive IMF-based Kurtosis; (b) sensitive CM-based KMAD.
Energies 16 02604 g017
Figure 18. Experimental outer race defect: (a) waveform; (b) envelope spectrum.
Energies 16 02604 g018
Figure 19. Decomposed result by EEMD.
Energies 16 02604 g019
Figure 20. Extracted CMs result.
Energies 16 02604 g020
Figure 21. Sensitive CM selection using KMAD.
Energies 16 02604 g021
Figure 22. Outer race fault diagnosis results for processing the selected CM using: proposed method (a,b); conventional MED (c,d); and wavelet denoising (e,f).
Energies 16 02604 g022
Figure 23. Diagnosis results using: (a) sensitive IMF-based Kurtosis; (b) sensitive CM-based KMAD.
Energies 16 02604 g023
Figure 24. Experimental ball bearing defect: (a) waveform; (b) envelope spectrum.
Energies 16 02604 g024
Figure 25. Decomposed result by EEMD.
Energies 16 02604 g025
Figure 26. Extracted CMs result.
Energies 16 02604 g026
Figure 27. Effective CM selection based on KMAD.
Energies 16 02604 g027
Figure 28. Ball fault diagnosis results for processing the selected CM using: proposed method (a,b); conventional MED (c,d); and wavelet denoising (e,f).
Energies 16 02604 g028
Figure 29. Diagnosis results using: (a) sensitive IMF-based kurtosis; (b) sensitive CM-based KMAD.
Energies 16 02604 g029
Table 1. Kurtosis values of each intrinsic mode function (IMF).
IMFKurtosis
IMF14.6127
IMF23.2595
IMF33.0748
IMF43.0268
IMF52.9883
IMF62.8621
Table 2. Kurtosis values of each IMF for Inner Race Fault Diagnosis.
IMFKurtosis
IMF14.6903
IMF24.7682
IMF34.3248
IMF43.0268
IMF52.5395
IMF62.6651
Table 3. Kurtosis values of each IMF for Outer Race Fault Diagnosis.
IMFKurtosis
IMF117.7045
IMF225.1902
IMF310.6024
IMF48.8478
IMF510.0602
IMF611.0606
Table 4. Kurtosis values of each IMF.
IMFKurtosis
IMF13.9782
IMF23.6592
IMF34.4182
IMF44.4670
IMF55.0951
IMF63.5202
Disclaimer/Publisher’s Note: The statements, opinions and data contained in all publications are solely those of the individual author(s) and contributor(s) and not of MDPI and/or the editor(s). MDPI and/or the editor(s) disclaim responsibility for any injury to people or property resulting from any ideas, methods, instructions or products referred to in the content.

