Article

Analysis and Evaluation of Photovoltaic Cell Defects and Their Impact on Electricity Generation

1
Department of Electrical Power Engineering, Faculty of Electrical Engineering and Informatics (FEI), Technical University of Kosice, Letna 9, 040 01 Kosice, Slovakia
2
Department of Power Electronics and Power Engineering, Rzeszow University of Technology, 35-959 Rzeszów, Poland
*
Author to whom correspondence should be addressed.
Energies 2023, 16(6), 2576; https://doi.org/10.3390/en16062576
Submission received: 20 November 2022 / Revised: 2 March 2023 / Accepted: 7 March 2023 / Published: 9 March 2023

Abstract

:
Many problems arise in the operation of photovoltaic systems. Each of these problems affects the operation of photovoltaic systems by reducing the power of the entire system. Some problems can be avoided during the design of photovoltaic systems. For example, when designing photovoltaic systems, it is possible to eliminate the shading of photovoltaic panels from surrounding objects. It is also necessary to look at the shading from neighboring photovoltaic panels when designing photovoltaic systems. It is necessary to calculate the inclination of the sunlight based on the position of the sun and calculate the distance between the two panels accordingly. However, some problems appear during the operation of photovoltaic systems. These problems can be partially eliminated. The magnitude of the series resistance can be eliminated by reducing the transition resistance throughout the system. The paper describes these problems and their possible solutions in practice. In the practical part, we focused on simulations and experiments in the field of photovoltaic systems (PV). The simulations focused on both the influence of temperature and the series resistance of photovoltaic panels on the production of electricity. The experiments were focused on the influence of various faults/defects on the power and V-A characteristics of photovoltaic panels connected in strings. The paper also discusses the impact of bypass diodes on the operation of photovoltaic systems and determines the need to use bypass diodes.

1. Introduction

Energy from the sun hits the earth in the form of radiation. We perceive solar energy as heat and light. Energy from sunlight is also stored in fossil fuels such as coal, oil and natural gas. However, these are exhaustible and are therefore considered non-renewable energy sources. Solar radiation is used to produce heat and electricity. A solar collector, a solar oven and a solar cooker are used to convert sunlight into heat. With the help of a solar collector, we prepare hot water, for example, for showering or for heating the house. Solar energy is converted into electrical energy by a photovoltaic cell. This device uses the internal photoelectric effect. After the impact of photons from sunlight on the surface of semiconductor materials, electrons are released. The directed movement of electrons is an electric current. The production of electricity using solar energy is growing rapidly in the world today, and the most important technology here is represented by the so-called photovoltaic cells. To a lesser extent, the process of concentrating solar radiation by means of parabolic mirrors into an absorber with the subsequent production of steam for a generator is also applied. Unlike parabolic mirrors, whose practical application is limited to areas very rich in solar radiation, the use of photovoltaic cells is possible in almost all countries [1,2].
Due to the incident sunlight, an electric voltage is generated on the semiconductor diode (the so-called photoelectric effect), which creates a current. The energy produced in large photovoltaic power plants is intended for immediate sale and consumption in the public grid. The unpredictability of electricity production is the biggest problem of this resource, unlike a nuclear power plant, where it is possible to predict the amount of electricity the power plant will produce. However, this is not possible with a photovoltaic source. Another problem is the fact that electricity production changes rapidly with photovoltaics. This problem causes complications with operation in the distribution network. Other problems also arise during the operation of photovoltaics. Photovoltaic panels are connected to strings-in series, parallel or series-parallel. In the case of photovoltaic panels connected in series, the current in the string is the same. For example, if the current ISC of the panels is 8A, this is the maximum current flowing in the string. Higher current values may appear if the panel temperature is lower than indicated in the datasheet. This is possible in the winter months with the high intensity of sunlight. However, a problem arises if any photovoltaic panel is damaged or shaded. In that case, such a panel affects all panels connected in the same string [2,3,4].

2. Photovoltaic Cell

Semiconductors are used to directly convert light into electricity. They are materials with characteristic properties. In terms of electrical conductivity at T = 0 K, semiconductors are perfect insulators. Pure semiconductors have low conductivity, even at elevated temperatures. At room temperature, their conductivity depends on the concentration of suitable compounds. Conductivity can be affected by increased temperature, light or pressure. Two types of electric charge carriers are involved in conductivity: electrons and holes. The electron energy structure of crystalline semiconductors contains allowed and forbidden energy bands. Semiconductor materials are inorganic—Si, Ge, GaAs, CdTe, or organic—a large number of various organic natural or synthetic substances [1,3,5,6].
The photovoltaic (solar) cell contains a potential barrier. These oppositely oriented electric charges are arranged in opposition to each other on the dividing line, which creates an electric field. The inhomogeneous charge distribution on the dividing line of the P-N junction is caused by the diffusion of the majority of the charge carriers (electrons in the N-type semiconductor, holes in the P-type semiconductor). On the P side, after the diffusion of the major holes to the N side, a negative spatial charge arises; after the diffusion of electrons from N to P; a positive spatial charge arises on the N side. The electrons and holes generated by the light are separated on the barrier by an electric field. This separation causes a potential difference, thus, an electrical voltage that can induce an electric current through an external circuit connected to a semiconductor structure with a potential barrier exposed to light radiation (photovoltaic phenomenon) [1,3,7].
There are several ways to create a potential barrier. One way to prepare a potential barrier is to use a two-layer semiconductor interface. One layer is an N-type semiconductor and the other a P-type semiconductor. The solar cell is not a homogeneous semiconductor, but consists of a part that has electronic conductivity (N-type material, such as phosphorus-doped silicon) and a hole-conducting part (P-type material, for example silicon with an admixture of boron). A voltage is generated at the electrodes of the P-N passage under the influence of light and an electric field, which is in the region of the spatial charge at the interface [1,3,8].
The N side is negatively charged, and the P side is positively charged. The solar cell is thus a semiconductor diode with suitable parameters (i.e., geometric arrangement and conductivity) for the photovoltaic phenomenon. There are other little- or less-used methods of preparing the potential barrier that is needed for a photovoltaic phenomenon (e.g., metal-semiconductor contact). On the P side, after the diffusion of the major holes to the N side, a negative spatial charge is created.
When the N-type and P-type sides of a photovoltaic cell are connected through an external electrical circuit (such as an electrical load), an electric current will flow through the circuit, similar to connecting a standard battery. Electrons from the N-type side will flow into the load and perform useful work, such as lighting up a light bulb. The energy from the absorbed light radiation in the semiconductor structure (P-N junction) is then directly converted into electrical energy, which performs the work in the load. Electrons will continue to flow into the load as long as there is a source (light radiation falling on the solar cell). The amount of electrons, or current, is directly proportional to the intensity of the incident radiation. [1,3,9,10].
The miscibility between donor and acceptor is a crucial factor that affects the morphology and thus the device performance of organic solar cells (OSCs). The third component with lower miscibility and higher lowest unoccupied molecular orbital (LUMO) level into the state-of-the-art PM6: Y6 system can significantly enhance the performance of devices. The double-fibril network morphology strategy minimizes losses and maximizes the power output, offering the possibility of 20% power conversion efficiencies in single-junction organic photovoltaics [11,12].
The photovoltaic device consists of solar cells. Solar cells produce the most electricity in direct sunlight. However, they also work in cloudy skies (due to diffuse radiation), although their power is then significantly lower. In winter, the amount of incident sunlight is smaller than in summer, and the diffuse component of radiation predominates, so the amount of electricity produced is smaller [1,13,14].

3. Photovoltaic Cell Parameters

3.1. Open-Circuit Voltage UOC

Open circuit voltage is the voltage at the output of the PV panel (cell) without a connected load. It is the maximum voltage at the output, given the radiation intensity and temperature [1,15].

3.2. Short Circuit Current ISC

The short-circuit current is the maximum current that the cell can supply at the given radiation intensity to the temperature of the photovoltaic cell. It is thus equal to the current generated by the light ISC = IL, assuming that the resistance RS is zero [1,16].
The open-circuit voltage, as well as the short-circuit current, changes with the temperature of the panel. Temperature affects the position of the operating point of the PV cell. With limited cooling of the PV cell or with prolonged exposure to solar radiation on the cell, the surface temperature of the PV cell can reach up to 80 °C at an air temperature of 40 °C. Such an increase in temperature significantly affects the electrical properties of the PV cell and there is a drop in the terminal voltage of the cell on its load characteristic. A drop in this voltage means a drop in the power supplied to the load. We can express the change in power by the relation:
η e f = d P d ϑ P ϑ = 0.4 % ° C
where ΔP is the change in power at the terminals of the PV cell (W) and Δϑ is the change in temperature of the PV cell (°C). From this relationship, it follows that when the temperature changes by 2.5 °C, the power changes by 1%. The biggest change when the temperature changes can be observed on the value of the open-circuit voltage U0. According to theoretical assumptions, there is a change of 0.4% for every 1 °C temperature change. The change in power in the relationship above is caused by the change in voltage and current of the PV cell. The relationship can therefore also be expressed after substituting these values as:
η e f = d P d ϑ P ϑ = U . I ϑ
where ΔU is the change in PV cell voltage (V) and ΔI is the change in PV cell current (A). From the relations above, it follows that the change in the PV cell power depending on the temperature is most influenced by the change in its voltage, since the change in the current value is almost zero—Figure 1 and Figure 2.

3.3. Maximum Power PMPP

The main unit is Wp (Watt Peak). This is the maximum power that the panel is able to deliver under STC conditions. The value of the maximum power is given by the relation: [6]
P M P P = U M P P I M P P
where the voltage UMPP is at the point of maximum power of the panel and where the jet IMPP is at the point of maximum power of the panel.
We know several algorithms for finding the MPP point. The basic aspects in choosing a suitable algorithm are the ability to detect multiple maxima of the power characteristic and the speed of convergence. The level of solar radiation changes in different places of the panel, or the radiation level may not be the same on all panels at once. Therefore, several local maxima points arise in one system. The efficiency and complexity of the algorithm determines whether the actual point of maximum power is calculated, or only the local maximum of power. The more powerful the MPPT algorithm, the lower the time to find the operating voltage or current. Depending on what the time of this convergence should be, the system requires the required abilities from the algorithm. The following two algorithms are described below:
Perturbation and Observation
Incremental Conductance

3.4. Perturbation and Observation P&O

The concept of this algorithm consists in changing the voltage or current of the photovoltaic panel until the maximum extracted power is obtained from it. As soon as the voltage on the panel is increased, the output of the panel increases, and the system continues to increase the operating voltage until the output power starts to decrease. When this happens, the voltage drops and tries to get back to the point of maximum power. This cycle continues indefinitely. The power value constantly oscillates around the MPP point, but never stabilizes. This is also the main disadvantage of the P&O algorithm. If the irradiance or load change is rapid, the algorithm may track the MPP point in the wrong direction. However, the main advantage of the P&O algorithm is its simplicity and ease of implementation.

3.5. Incremental Conductance

The Incremental Conductance algorithm is based on the observation of the slope of the curve placed on the current observed point of the power curve. If the curve is crossed by the point of maximum power, the slope is zero, if the curve is to the left of the MPP point, the slope is positive, and if to the right of the MPP point, the slope is negative. The MPP point is found by comparing the instantaneous conductance (I/U) to the cumulative conductance (ΔI/ΔU). Once the algorithm finds the MPP, the system maintains that power point except when the voltage or current changes. In this case, the point finds a new MPP point. This technique has the advantage that it can reach and maintain the MPP without losing efficiency, as it does not oscillate around this point as in the case of P&O. Additionally, even under rapidly changing conditions, this algorithm tracks more accurately. The main disadvantage is its longer time taken to stabilize the MPP.
In previous posts [18,19], we observed how the parameters of the photovoltaic cell change with changes in the parameters of series and parallel resistance, which represent various defects in the photovoltaic cell and transition resistances. However, it was not observed how the parameters change if several photovoltaic cells are connected in a string. Finding the MPP point for one photovoltaic panel is not complicated. However, if several photovoltaic panels are connected in series or in parallel, then it is necessary to apply an algorithm for searching the MPP point. Some of them were described earlier in the “Maximum power PMPP” section. Another alternative to finding the MPP point could be the Particle Swarm Optimization method. Some methods are relatively simple but work with great uncertainty. Later, you will see how the change of the MPP point affects the production of electricity. The more accurately the MPP is found, the more electricity production increases, which has a significant impact on the return on investment in photovoltaics. It is necessary to realize that the MPP point changes quite often—from changes in lighting intensity, position of the sun, shading of panels, defects and so on [20,21,22,23,24].
The effectiveness of photovoltaic (PV) cell utilization is impacted by not only the internal characteristics of the PV cells, but also external factors such as irradiance, load, and temperature. To ensure optimal operation of PV cells in complex environments, there are four main categories of maximum power point tracking (MPPT) methods used in PV systems: traditional MPPT, intelligent MPPT, optimized MPPT, and hybrid MPPT [25,26,27,28].
Traditional MPPT methods, such as the perturbation and observation method (P&O) and incremental conductance method (INC), are popular due to their simplicity, but they may lack speed and accuracy, causing local optimization and power loss at the MPP. To address these issues, the literature [6,7] proposes improved adaptive P&O and INC algorithms that more efficiently and quickly track the PV array MPP.
Intelligent MPPT methods, including fuzzy neural control (FNC) and artificial neural network (ANN), are commonly used in changing environments. Literature [8] presents an ANN that takes dynamic irradiance and temperature as input and trains for high speed and accuracy. However, the cost of storing and training large amounts of data may be a concern.
Optimized MPPT methods, such as particle PSO, firefly algorithm (FA), and gray wolf algorithm (GW), can dynamically track the real MPP. Literature [9] introduces GWO, which has a great response speed and stable accuracy when MPPT is performed under partial shading conditions (PSC). However, its search space is large, and calculation time is long.
Hybrid MPPT algorithms combine traditional and intelligent algorithms. They use the traditional MPPT method to estimate the MPP region and then use intelligent optimization to find the accurate MPP. The hybrid algorithm proposed in literature [10,13] can combine the advantages of the algorithms, but it requires high-level mathematical calculations and may have limited applicability.

3.6. Effectiveness η

The maximum theoretically possible efficiency of direct conversion of light-solar radiation into electrical energy through solar cells with a P-N junction is about 30%. The efficiency is given by the formula: [8,29]
η e f = P M P P P r a d = P M P P E A c
where Prad is the power of the incident radiation, E is the light intensity under standardized test conditions; AC is the area of the photovoltaic cell.

3.7. Series Resistance RS

It is an indicator of the quality of a PV cell. It is a parasitic resistance that is derived from the total resistance of the semiconductor material, the resistance of contacts and connections. A good cell should have the lowest RS value, because its high value causes a voltage drop at the panel terminals.

3.8. Parallel Resistance Rp

In most cases, it is caused by extensive defects. Too low an Rp value indicates a poor PV cell that behaves almost in the manner of a short circuit. The resistance value should be as high as possible [6,7,8].

4. Mathematical Model of a Photovoltaic Cell

For a correct understanding of the operation of a photovoltaic cell, it is advisable to create an equivalent model (Figure 3), one which will be composed of elements whose behavior is already known. An alternative scheme of a photovoltaic cell consists of a current source with a diode and a resistor connected in parallel; a resistor connected in series is used to model the transient resistance.
The current supplied by the photovoltaic cell to the load is formulated according to Kirchhoff’s current law: [3,5,16,30,31]
I = I L I D I s h   [ A ]
The complete formulation of the photovoltaic cell current is represented by this equation: [6,7,8,30,31,32]
I = I L I s · exp U + I R s n U T 1 U + I R s R s h   [ A ]
In the equation, current IL represents the current generated by radiation in the photovoltaic cell, ID is the current flowing through the diode, and current Ish is the loss current passing through the parallel resistance Rsh. The parallel resistance is caused by local defects of the PN junction at the edges of the photovoltaic cells; the ideal value of this resistance is infinitely large. In high-quality cells, Rsh = 300–400 kΩ. Resistance RS is a series resistance, and the value of this resistance should be as low as possible; this resistance is caused by imperfections in the connections between individual cells. For high-quality cells, the RS resistance is up to 0.10 Ω. The quantity indicates the ideality factor of the diode, and the value ranges from 1 to 2 [5,9,32,33,34,35].
The single-diode equation assumes a constant value for the ideality factor n. In reality, the ideality factor is a function of voltage across the device. At high voltage, when the recombination in the device is dominated by the surfaces and the bulk regions, the ideality factor is close to one. However, at lower voltages, recombination in the junction dominates and the ideality factor approaches two. The junction recombination is modeled by adding a second diode in parallel with the first and setting the ideality factor typically to two.
However, if we use a two-diode model to describe the behavior of diodes, there will be two unknown diode quality factors, which increases the number of equations and unknown parameters to two (4). This makes the calculations more complex. Despite this, the two-diode model provides much more accurate curve characteristics than does the single diode model at lower irradiance and low temperatures. Therefore, considering all aspects, the single diode model is faster and has less computational errors due to its less complex equation and fewer iterations. On the other hand, the two-diode model provides more precise and accurate characteristics under varying weather conditions with longer iterations and parameter calculations.
I = I L I s 1 · exp U + I R s n 1 . U T 1 I s 2 · exp U + I R s n 2 . U T 1 U + I R s R s h   [ A ]

5. Photovoltaic Cell Analysis and Experiments

As described above, the operation of PV systems is influenced by several parameters, or operating conditions, of PV systems. Most of all, though: [35,36]
Temperature conditions of the photovoltaic panel;
Connecting photovoltaic panels—in series, in parallel;
Various faults on the photovoltaic panels in the string.
(A)
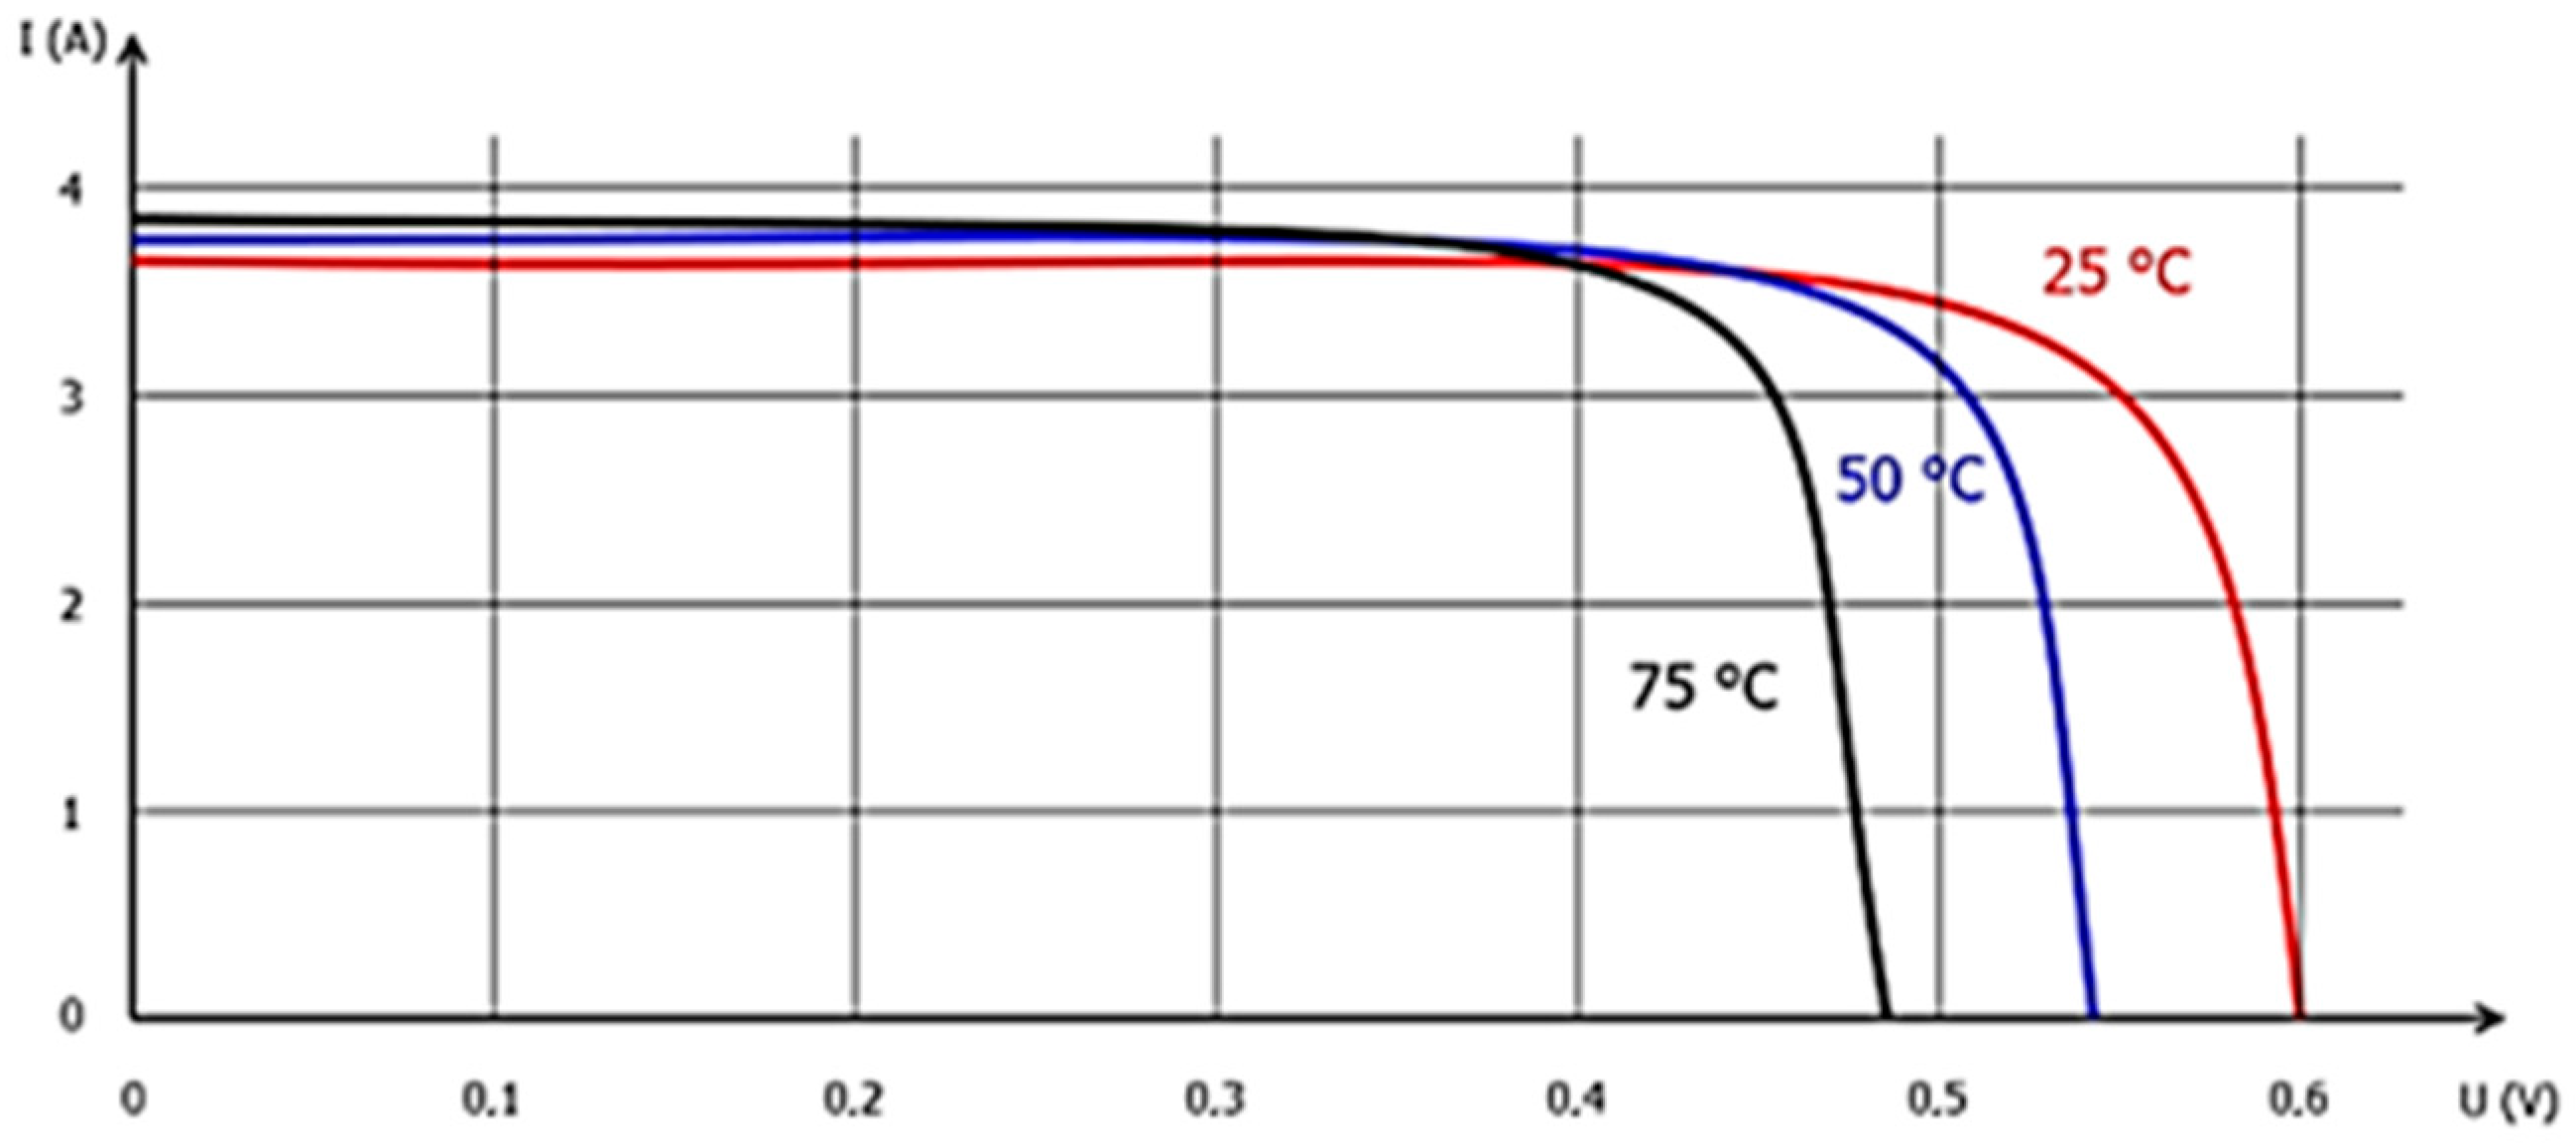
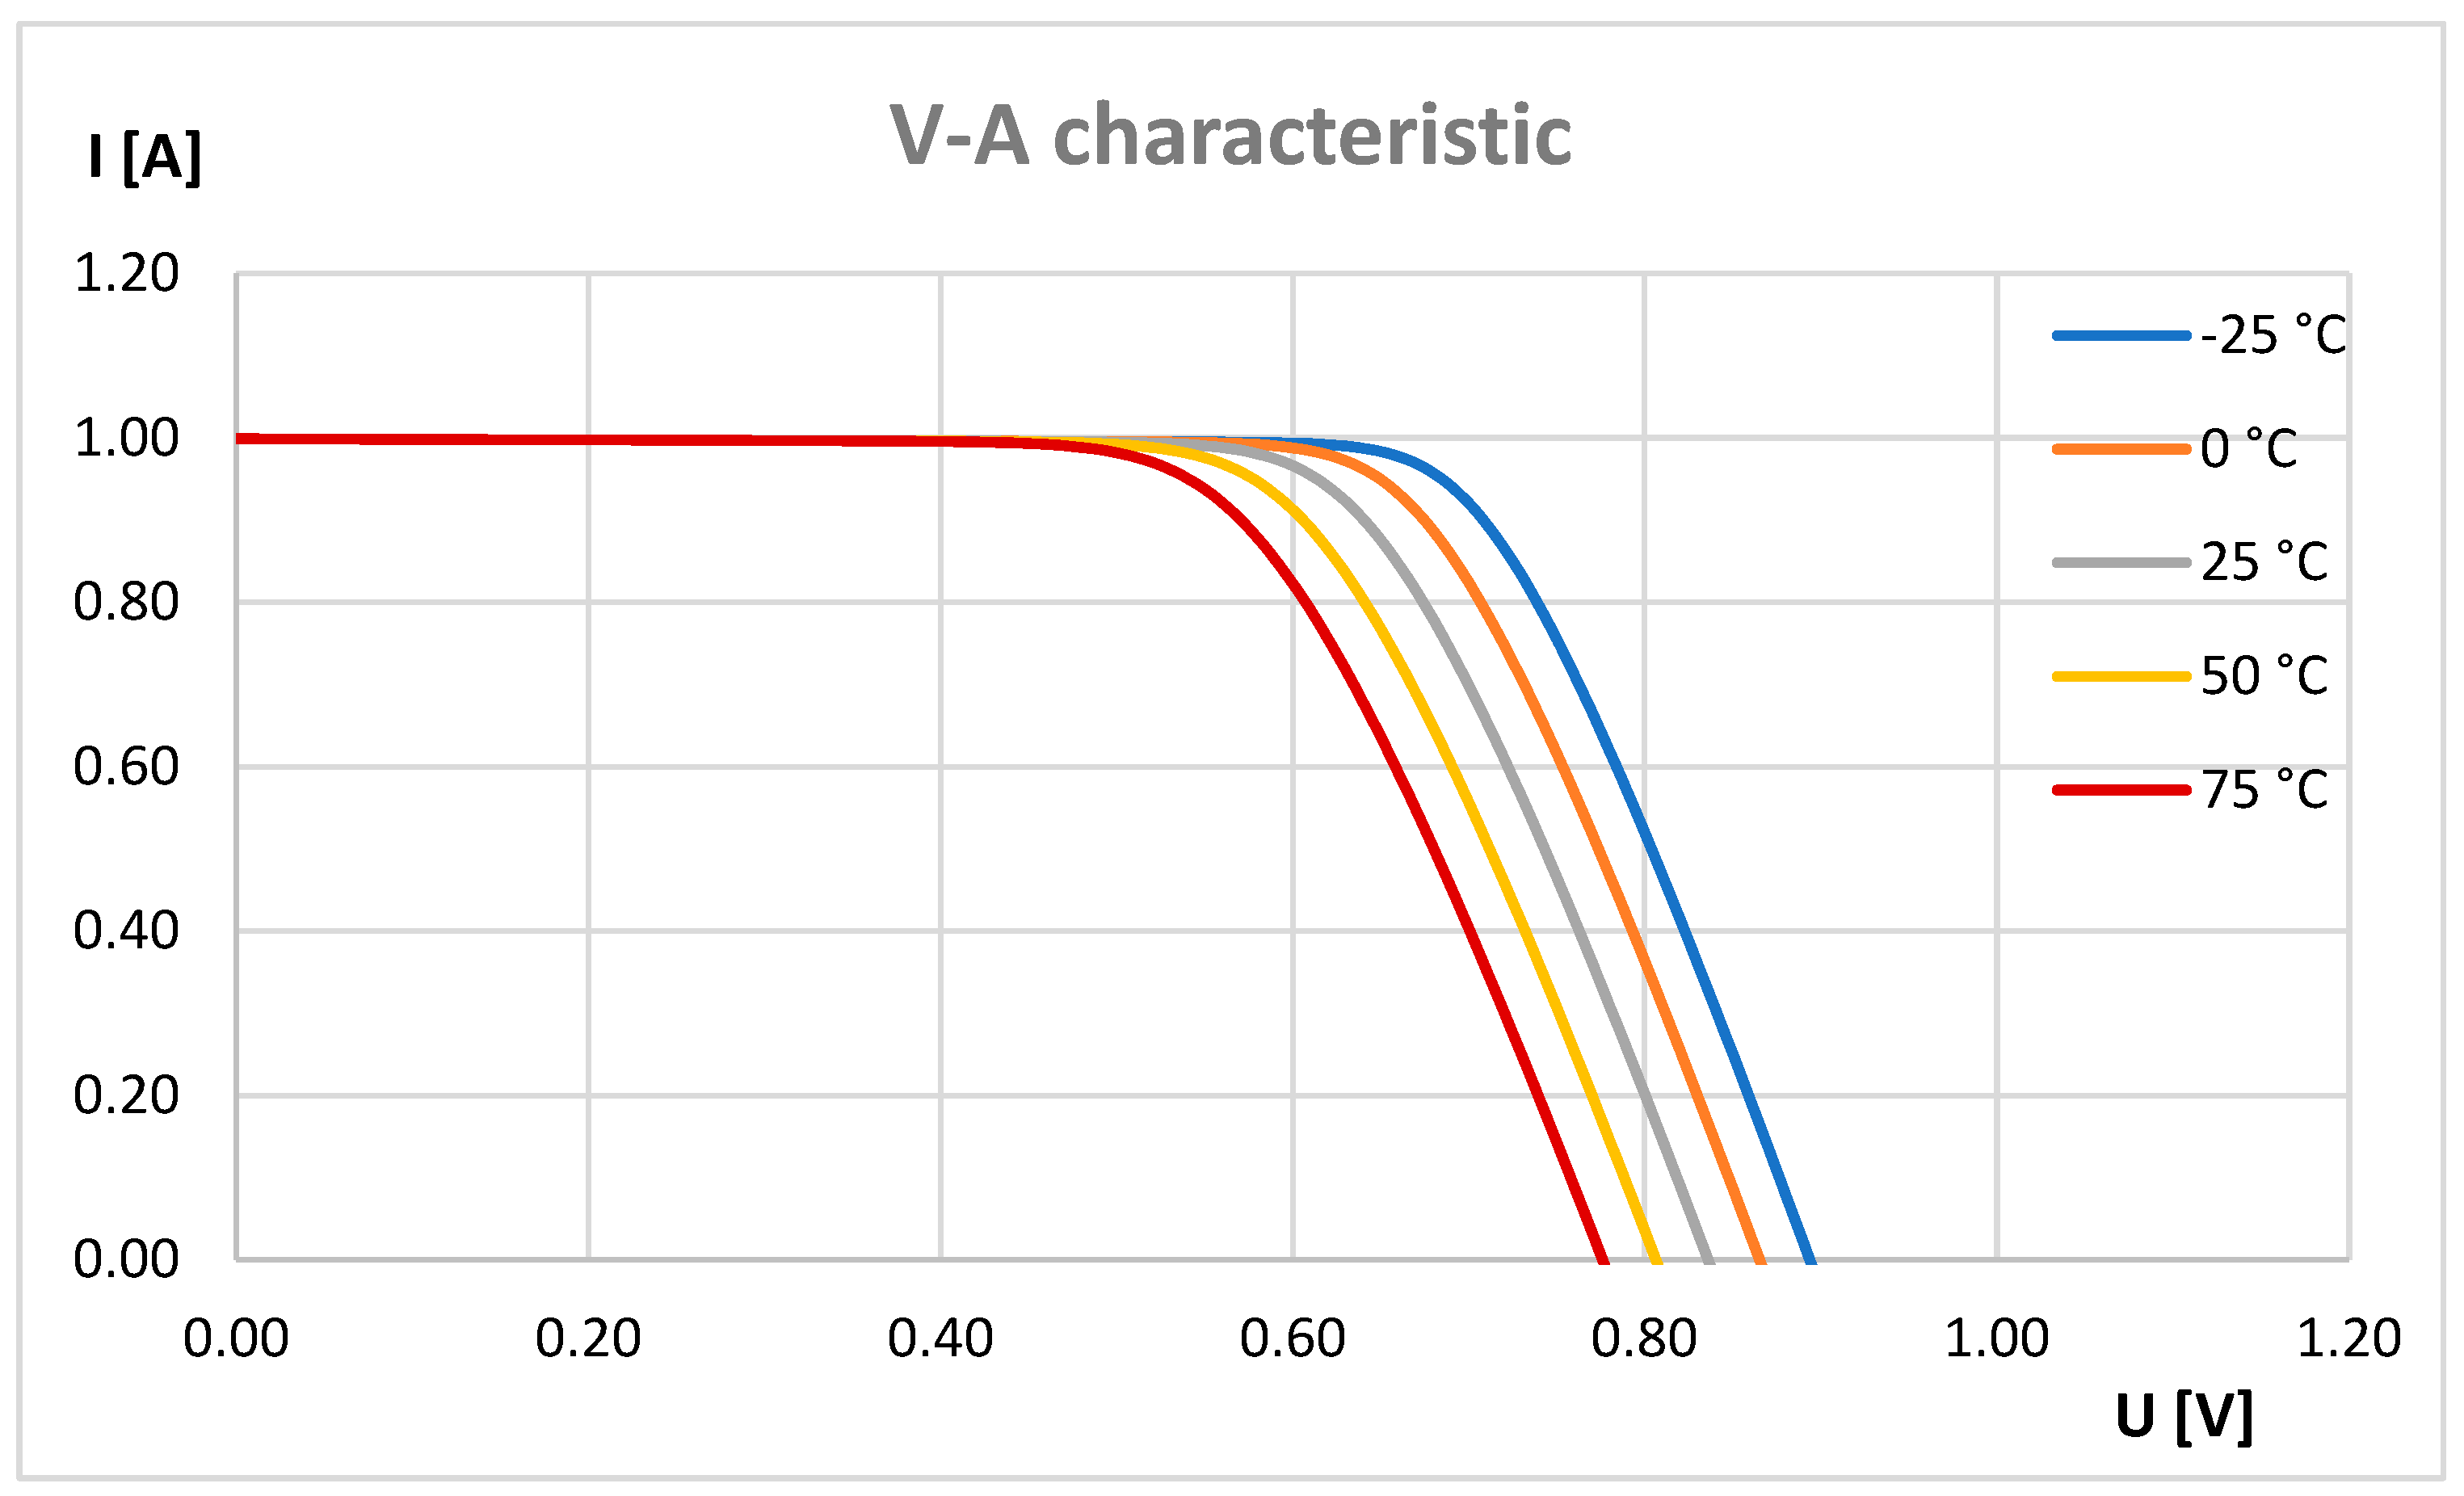
Case study I–Effect of temperature on photovoltaic panel power
We verified the first effect (temperature effect) by simulation in the Proteus program. During prolonged exposure to the increased intensity of solar radiation falling on the panel, it heats up, which results in a change in the electrical properties of the cells, and the change in properties leads to a reduced power of the PV cells. Cells may heat up even in the event of a fault-hot-spots. In the case of a fault on the photovoltaic cell, the photovoltaic cell is damaged; hot-spots are created. These hot-spots are created in places of defects in the crystalline grid of PV cells or can be created when the panel is shaded. In this simulation, the values of the series resistor, the parallel resistor and the intensity of the solar radiation were constant and only the temperature values changed to temperatures of −25 °C, 0 °C, 25 °C, 50 °C and 75 °C [23,24].
The simulation results showed that as the operating temperature of the cell suddenly rises, and the PV cell produces less electricity, which is shown in the curves in Figure 4. This figure again shows five V-A characteristics, representing five different dependences at the temperatures −25 °C, 0 °C, 25 °C, 50 °C and 75 °C. According to the statement mentioned above, the PV cell should produce more energy during the winter months than during the summer months. However, this is not true, because the power of the PV cell is much more dependent on the intensity of solar radiation, and the latter is much higher in the summer months than in the winter. It was found that as the operating temperature of the cell increases, the produced power decreases. An increase in temperature can occur, for example, with long-term exposure to solar radiation on the cell and insufficient cooling (no wind). This decrease in power can be noticed in the change in the shape of the curves, in such a way that the change in temperature is most pronounced when the no-load voltage UOC is reduced. As the temperature increases, the series resistance RS also increases.
(B)
Case study II—Effect of serial resistance on photovoltaic panel power
This resistance represents panel losses and is derived from the total resistance of the semiconductor material, contact resistance and interconnects, with the resistance value rising for imperfect and damaged connections, which means higher contact resistance, leading to the overheating of the panel. The resistance changes immediately after the panel is in operation, which is caused by changes in the temperatures in and around the photovoltaic panel.
From the results of the simulation, it is obvious that if the value of the resistance on the resistor RS increases, the power of the PV cell decreases, which can be seen in the characteristics in Figure 5. In this figure, five different V-A characteristics are shown; each of them represents a different value of resistances RS, specifically, values of 0.1; 0.15; 0.3; 0.6 and 1 Ω. The values of the parallel resistor RS, solar radiation intensity and panel temperature, were unchanged in the simulation. We found that in the ideal case, the PV cell should have the lowest possible resistance value of the resistor RS, then the cell has almost ideal V-A characteristics, which is shown in Figure 5 at a resistance value of 0.1 Ω. It is also possible to notice that when the resistance is increased, the shape of the curve changes—the current and voltage changes significantly with the changing load, while the magnitude of the short-circuit current ISC and the no-load voltage UOC is the same, but this does not apply to the value of the resistance 1 Ω, when the value of the short-circuit current ISC also changes. These curve shapes are not suitable, because they cause a decrease in the power produced.
(C)
Case study III–Effect of solar radiation on the photovoltaic panel power
In our experiment, we focused on finding out how different conditions of the photovoltaic panel affected the overall production of electricity. We chose photovoltaic panels from the same manufacturer. The parameters of the photovoltaic panel are shown in Table 1.
Four photovoltaic panels with the same parameters were used in the experiment. These panels were connected in series. During the experiment, the intensity of solar radiation of one panel was changed by overlapping with the film and the intensity of solar radiation was monitored using a pyrometer. The value was gradually adjusted from the original 1000 W/m2 to 500 W/m2 and 100 W/m2.
The results of the measurements show that when the panels are connected in series, the no-load voltage UOC is added, while the magnitude of the short-circuit current ISC depends on the weakest part of the PV system, which can be seen in the curves in Figure 6. We found that if, for example, one panel is shaded, there is a significant drop in the produced power of the PV system. This drop in power is caused by a PV panel that is either shaded or damaged.
From the results of the measurements, it is clear that the highest output power from the PV system is obtained at a radiation intensity of 1000 W/m2, which is shown in Figure 7. In this case, the maximum power from the PV system is PMPP = 240 W. In the case of 500 W/m2 and 100 W/m2, one of the panels is shaded and, in that case, the PV system produces less electricity. Therefore, if one panel in the string is shaded, this panel will affect the total production of electricity from the entire photovoltaic system. In such a case, a bypass diode is used in practice.
(D)
Case study IV—Operation of photovoltaic panels for different connections
In the next part, we connected four photovoltaic panels (monocrystalline) in series-parallel. We have created five situations of operation of photovoltaic panels—Figure 8. In the first case, all panels were without any defects at a radiation intensity of 1000 W/m2. In the second case, one panel in one string was shaded to a radiation intensity of 500 W/m2. In the third case, we shaded the same panel to the level of 100 W/m2. In the fourth case, we shaded one panel in each parallel string to the level of 500 W/m2, and in the last case, we shaded both panels in one string to the level of 500 W/m2. Figure 8 shows individual cases two to five.
It is possible to see the results from the experiments—Figure 9. In the second case, it is possible to observe a current decrease from the photovoltaic system in compare with case one. This decrease is caused by the shading of one panel in the string. During shading, the current in this branch is decreased. It follows that if one panel is shaded in a series connection, it will affect the production of electricity in the string. Comparing case two and case five, similar V-A characteristics can be seen. In the fifth case, both panels in the string were shaded to the same radiation intensity. However, the current in this string was similar to case two. It follows that the current is the same whether one or both panels are shaded at once. The current in the string will be equal to the smallest current of all the photovoltaic panels connected in this string. In practice, therefore, a problem may arise if any panel in the string is replaced. The new panel in the string must have similar parameters to the other panels in the string.
If one compares cases three and four, several facts can be observed from the measurements. The currents in both cases are approximately the same. In case four, the currents in both strings are half because in each string one panel is shaded at 500 W/m2. Together, these two strings supply the same current as the “healthy” string in case three (1000 W/m2). The difference in the total current is the current supplied from the string, where the shading is at the level of 100 W/m2. This difference will cause a difference in the total current in cases three and four. The first case reaches the highest values of the currents because no shading was created there.
From the results of the simulation, it is obvious that the highest power from the PV system will be obtained in the ideal state of the PV system and STC conditions in situation 1, which is shown in Figure 9. In this case, we will achieve the maximum possible power from the PV system of approximately PMPP = 240 W. It can be seen from the flow in Figure 10 that in situations two and five the power is similar because the panels are shaded in only one branch. In situations three and four, it is possible to see a decrease in the produced power if the panels on both branches are shaded or if one panel in the branch produces almost no electricity.
(E)
Case study V—MPP point Finding
In the last experiment, we will look at the effect of shading and the use of a bypass diode and possible problems in finding the MPP point. Two situations were created. Three photovoltaic panels were connected in series. In the first step, two panels were partially shaded. In the second step, bypass diodes were connected to the photovoltaic panels and the two panels were also shaded.
Two characteristics can be seen in Figure 10. The power of the string is approximately 330 W without shading. On the characteristic (orange—without bypass diode), it is possible to observe the current drop in the string when two panels are shaded. The maximum power with this connection is approximately 40 W. If bypass diodes were used, then the maximum power would be 95 W. The use of bypass diodes will approximately double the production of electricity. The results show that the MPP point changes under different operating conditions. The curves indicate the area of maximum power, which is set by the MPP search algorithm. The use of a bypass diode increases the power from the string. The one photovoltaic panel damaged in a string can affect production from the string. The current and thus the performance from the string drop significantly. The ideal solution is to replace the damaged panel with a new PV panel with the same parameters. If this is not possible, it is more effective to disconnect this panel from the string. In this case, however, it is necessary to monitor the voltage of the string due to the connection to the inverter.
As can be seen, shading (or a defect on the panels) significantly affects the power of the entire string. Even the use of bypass diodes will not solve the shading problem. On the other hand, the power in the string is higher with the use of bypass diodes than without them.

6. Conclusions and Discussion

In this research, we focused on different conditions in the operation of photovoltaic panels. Simulations were created in the Proteus program and experiments were also created that describe problems in the operation of photovoltaic panels. On the created model of the photovoltaic panel, V-A characteristics were determined, depending on the temperature of the photovoltaic panel. In the next part, we focused on the problem of series resistance increasing within the photovoltaic panel. Increasing this value causes a change in the shape of the V-A characteristic. Changing the shape of the V-A characteristic causes problems in determining the MPP point, mainly in the operation of photovoltaic systems. An increase of series resistance indicates an increase in the transient resistance, which can cause thermal stress on this part. Ultimately, a fault may occur on the photovoltaic system. An increase of series resistance causes a decrease in the total production of electricity from photovoltaic systems in practice.
In the last part, we focused on experiments, where we created a workplace consisting of four identical photovoltaic panels and connected them together in series-parallel. Then we used the film to simulate shading and the changes in lighting intensity. Experiments were performed on five different cases. In the first case, all panels were without any defects at a radiation intensity of 1000 W/m2. In the second case, one panel in one string was shaded to a radiation intensity of 500 W/m2. In the third case, we shaded the same panel to the level of 100 W/m2. In the fourth case, we shaded one panel in each parallel string to the level of 500 W/m2, and in the last case, we shaded both panels in one string to the level of 500 W/m2. From the results of the simulation, it is obvious that the highest power from the PV system will be obtained in the ideal state of the PV system and STC conditions in case one, which is shown in Figure 10. In this case, we will achieve the maximum possible power from the PV system of approximately PMPP = 240 W. It can be seen from the flow in Figure 10 that in cases two and five, the power is similar because the panels are shaded in only one branch. In cases three and four, it is possible to see a decrease in the produced power if the panels on both branches are shaded or if one panel in the branch produces almost no electricity.
In the last study, the influence of bypass diodes on the operation of photovoltaic systems is described. The results show that the bypass diodes increase the power of the photovoltaic system in case of shading (or in case of panel defects), but they do not solve the shading problem. The results show that when the panels are shaded, the power string drops by 66%. The power drop depends on the amount of shading.
It is already possible to limit shading during the design of photovoltaic systems. It is necessary to prevent shading from surrounding objects. In this case, the use of bypass diodes is not necessary—or it is uneconomical. If the panel is damaged during operation, there are two options:
(a)
Replacing a damaged photovoltaic panel—which is sometimes problematic in practice, since it is necessary to replace a panel with similar parameters;
(b)
Use of bypass diodes—depending on the extent of panel damage.
With both solutions, this means additional investment costs for the operation of the photovoltaic system. It is therefore necessary to find out which of the variants is economically acceptable.
The research described in the paper points to possible errors in finding the MPP point. This can cause problems in the operation of the photovoltaic system. These problems occur if there is a defect in the photovoltaic system on some of the panels or on several of them. As experiments show, the V-A characteristic is distorted and the search for the MPP point is complicated. The photovoltaic system continues to work (unless the voltage in the string drops below the starting voltage), but the defect significantly affects the production of electricity. We want to focus the further direction of our research on the design of a suitable algorithm for searching the MPP point using various optimization methods. Several publications mention methods based on fuzzy logic control, neural network and so on. We hope to focus on creating a method based on genetic algorithms using tests of robustness and correctness of the MPP point search. However, we anticipate that there may be a problem with the speed of finding the MPP point using these methods.

Author Contributions

Methodology, L.B.; Software, Z.Č.; Resources, M.K.; Data curation, D.M.; Funding acquisition, M.P. All authors have read and agreed to the published version of the manuscript.

Funding

This work was supported by the Slovak Research and Development Agency under the contract No. APVV-19-0576 and the Ministry of Education, Science, Research and Sport of the Slovak Republic and the Slovak Academy of Sciences under the contract no. VEGA 1/0757/21.

Conflicts of Interest

The authors declare no conflict of interest.

References

  1. Pavlík, M. Obnoviteľné Zdroje Energie vo Všeobecnosti, 1st ed.; Technická Univerzita v Košiciach: Košice, Slovakia, 2019; p. 75. ISBN 978-80-553-3317-5. [Google Scholar]
  2. Kolcun, M.; Mešter, M.; Džmura, J.; Pavlík, M. Elektrárne, 1st ed.; Technická Univerzita v Košiciach: Košice, Slovakia, 2017; p. 202. ISBN 978-80-553-3119-5. [Google Scholar]
  3. Pavlík, M. Obnoviteľné Zdroje a iné Netradičné Zdroje Energie, 1st ed.; Technická Univerzita v Košiciach: Košice, Slovakia, 2019; p. 82. ISBN 978-80-553-3341-0. [Google Scholar]
  4. Kalogirou, S.A. Solar Energy Engineering—Processes and Systems, 2nd ed.; Elsevier Science & Technology: Amsterdam, The Netherlands, 2014; pp. 257–321. ISBN 978-0-12-397270-5. [Google Scholar]
  5. Kolcun, M.; Medveď, D.; Petráš, J.; Stolárik, R.; Vaško, Š. Výskum Charakteristík Fotovoltaických Komponentov pre Efektívne Projektovanie Solárnych Systémov, 1st ed.; Technická Univerzita v Košiciach: Košice, Slovakia, 2014; p. 120. ISBN 978-80-553-1961-2. [Google Scholar]
  6. Said, S.; Massoud, A.; Benammar, M.; Ahmed, S. A Matlab/Simulink-Based Photovoltaic Array Model Employing SimPower System Toolbox. J. Energy Power Eng. 2012, 6, 1965–1975. [Google Scholar]
  7. Zielinska, A.; Skowron, M.; Bien, A. Modelling of photovoltaic cells in variable conditions of temperature and intensity of solar insolation as a method of mapping the operation of the installation in real conditions. In Proceedings of the 2018 International Interdisciplinary PhD Workshop (IIPhDW), Świnouście, Poland, 9–12 May 2018; pp. 200–204. [Google Scholar] [CrossRef]
  8. Hasani, A.H.; Abdullah, S.F.; Zuhdi, A.W.M.; Bahrudin, M.S.; Za’Abar, F.; Harif, M.N. Modelling and Simulation of Photovoltaic Solar Cell using Silvaco TCAD and Matlab Software. In Proceedings of the 2018 IEEE International Conference on Semiconductor Electronics (ICSE), Kuala Lumpur, Malaysia, 15–17 August 2018; pp. 214–217. [Google Scholar] [CrossRef]
  9. Zhang, J.; Liu, Y.; Ding, K.; Feng, L.; Hamelmann, F.U.; Chen, X. Model Parameter Analysis of Cracked Photovoltaic Module under Outdoor Conditions. In Proceedings of the 2020 47th IEEE Photovoltaic Specialists Conference (PVSC), Calgary, AB, Canada, 15 June–21 August 2020; pp. 2509–2512. [Google Scholar] [CrossRef]
  10. Yan, C.; Wen, Y.; Jinzhao, L.; Jingjing, B. PROTEUS-based simulation platform to study the photovoltaic cell model under partially shaded conditions. In Proceedings of the 2011 International Conference on Electric Information and Control Engineering, Wuhan, China, 15–17 April 2011; pp. 3446–3449. [Google Scholar] [CrossRef]
  11. Ma, R.; Yan, C.; Yu, J.; Liu, T.; Liu, H.; Li, Y.; Chen, J.; Luo, Z.; Tang, B.; Lu, X.; et al. High-Efficiency Ternary Organic Solar Cells with a Good Figure-of-Merit Enabled by Two Low-Cost Donor Polymers. ACS Energy Lett. 2022, 7, 2547–2556. [Google Scholar] [CrossRef]
  12. Zhu, L.; Zhang, M.; Xu, J.; Li, C.; Yan, J.; Zhou, G.; Zhong, W.; Hao, T.; Song, J.; Xue, X.; et al. Single-junction organic solar cells with over 19% efficiency enabled by a refined double-fibril network morphology. Nat. Mater. 2022, 21, 656–663. [Google Scholar] [CrossRef] [PubMed]
  13. Rodrigues, E.M.G.; Godina, R.; Pouresmaeil, E.; Catalao, J.P.S. Simulation study of a photovoltaic cell with increasing levels of model complexity. In Proceedings of the 2017 IEEE International Conference on Environment and Electrical Engineering and 2017 IEEE Industrial and Commercial Power Systems Europe (EEEIC/I&CPS Europe), Milan, Italy, 6–9 June 2017; pp. 1–5. [Google Scholar] [CrossRef]
  14. Das, N.; Al Ghadeer, A.; Islam, S. Modelling and analysis of multi-junction solar cells to improve the conversion efficiency of photovoltaic systems. In Proceedings of the 2014 Australasian Universities Power Engineering Conference (AUPEC), Perth, WA, Australia, 28 September–1 October 2014; pp. 1–5. [Google Scholar] [CrossRef]
  15. Chtita, S.; Chaibi, Y.; Derouich, A.; Belkadid, J. Modeling and Simulation of a Photovoltaic Panel Based on a Triple Junction Cells for a Nanosatellite. In Proceedings of the 2018 International Symposium on Advanced Electrical and Communication Technologies (ISAECT), Rabat, Morocco, 21–23 November 2018; pp. 1–6. [Google Scholar] [CrossRef]
  16. Maniak, T. Modelovanie Parametrov Fotovoltickýchh Článkov. Bachelor’s Thesis, Technická Univerzita v Košiciach, Košice, Slovakia, 2021; p. 77. [Google Scholar]
  17. Dzúr, D. Sledovanie Parametrov Fotovoltických Článkov. Bachelor’s Thesis, Technická Univerzita v Košiciach, Košice, Slovakia, 2021; p. 67. [Google Scholar]
  18. Pavlík, M. Determination of effect of photovoltaic cells defect on electricity produce by use mathematical model. Prz. Elektrotechniczny 2022, 1, 200–203. [Google Scholar] [CrossRef]
  19. Pavlík, M.; Dzúr, D. Sledovanie Parametrov Fotovoltaických Článkov. In Electrical Engineering and Informatics 13: Proceedings of the Faculty of Electrical Engineering and Informatics of the Technical University of Košice; Technická Univerzita v Košiciach: Košice, Slovensko, 2022; pp. 362–368. ISBN 978-80-553-4120-0. [Google Scholar]
  20. Shi, S.; Hou, Y.; Yang, T.; Huang, C.; Yao, S.; Zhao, C.; Liu, Y.; Zhang, Z.; Liu, T.; Zou, B. Simple Solvent Treatment Enabled Improved PEDOT:PSS Performance toward Highly Efficient Binary Organic Solar Cells. ACS Omega 2022, 7, 41789–41795. [Google Scholar] [CrossRef] [PubMed]
  21. Kim, E.; Warner, M.; Bhattacharya, I. Adaptive Step Size Incremental Conductance Based Maximum Power Point Tracking (MPPT). In Proceedings of the 2020 47th IEEE Photovoltaic Specialists Conference (PVSC), Calgary, AB, Canada, 15 June–21 August 2020; pp. 2335–2339. [Google Scholar] [CrossRef]
  22. Fu, Q.; Tong, N. A New PSO Algorithm Based on Adaptive Grouping for Photovoltaic MPP Prediction. In Proceedings of the 2010 2nd International Workshop on Intelligent Systems and Applications, Wuhan, China, 22–23 May 2010; pp. 1–5. [Google Scholar] [CrossRef]
  23. Saripalli, B.P.; Singh, G.; Singh, S. Cell Modelling and Analysis of Five-Parameter Three Diode model of Photovoltaic Module. In Proceedings of the 2021 IEEE 4th International Conference on Computing, Power and Communication Technologies (GUCON), Kuala Lumpur, Malaysia, 24–26 September 2021; pp. 1–7. [Google Scholar] [CrossRef]
  24. Garcia, A.S.; Kristensen, S.T.; Strandberg, R. Analytical Modeling of the Temperature Sensitivity of the Maximum Power Point of Solar Cells. IEEE J. Photovoltaics 2022, 12, 1237–1242. [Google Scholar] [CrossRef]
  25. Mo, S.; Ye, Q.; Jiang, K.; Mo, X.; Shen, G. An improved MPPT method for photovoltaic systems based on mayfly optimization algorithm. Energy Rep. 2022, 8 (Suppl. S5), 141–150. [Google Scholar] [CrossRef]
  26. Dadkhah, J.; Niroomand, M. Optimization Methods of MPPT Parameters for PV Systems: Review, Classification, and Comparison. J. Mod. Power Syst. Clean Energy 2021, 9, 225–236. [Google Scholar] [CrossRef]
  27. Alanazi, A.; Alanazi, M.; Arabi, S.; Sarker, S. A New Maximum Power Point Tracking Framework for Photovoltaic Energy Systems Based on Remora Optimization Algorithm in Partial Shading Conditions. Appl. Sci. 2022, 12, 3828. [Google Scholar] [CrossRef]
  28. Cherukuri, S.K.; Rayapudi, S.R. A novel global MPP tracking of photovoltaic system based on whale optimization algorithm. Int. J. Renew. Energy Dev. 2016, 5, 225–232. [Google Scholar] [CrossRef]
  29. Belan, A. Model fotovoltického článku. Posterus 2013, 6. Available online: https://www.posterus.sk/?p=16396&output=pdf (accessed on 2 March 2023).
  30. Gupta, D.; Kumari, N.; Samadhiya, A. Photovoltaic Modeling using Single Diode Model in MATLAB. In Proceedings of the 2020 IEEE International Conference on Computing, Power and Communication Technologies (GUCON), Greater Noida, India, 2–4 October 2020; pp. 734–739. [Google Scholar] [CrossRef]
  31. Swain, S.C.; Dash, R.; Ali, S.M.; Mohanta, A.K. Performance evaluation of photovoltaic system based on solar cell modelling. In Proceedings of the 2015 International Conference on Circuits, Power and Computing Technologies [ICCPCT-2015], Nagercoil, India, 19–20 March 2015; pp. 1–6. [Google Scholar] [CrossRef]
  32. Mazur, D.; Gołębiowski, L.; Smoleń, A.; Gołębiowski, M.; Szczerba, Z. Modeling and Analysis of the AFPM Generator in a Small Wind Farm System. In International Workshop on Modeling Social Media; Springer: Cham, Switzerland, 2019; Volume 548, pp. 202–210. [Google Scholar] [CrossRef]
  33. Aljoaba, S.Z.; Cramer, A.M.; Walcott, B.L. Thermo-electrical modeling of light wavelength effects on photovoltaic cell performance. In Proceedings of the 2011 37th IEEE Photovoltaic Specialists Conference, Seattle, WA, USA, 19–24 June 2011; p. 000192. [Google Scholar] [CrossRef]
  34. Hayder, W.; Abid, A.; Ben Hamed, M. Modeling of a photovoltaic cell based on recurrent neural networks. In Proceedings of the 2017 International Conference on Green Energy Conversion Systems (GECS), Hammamet, Tunisia, 23–25 March 2017; pp. 1–5. [Google Scholar] [CrossRef]
  35. Murtinger, K.; Beranovský, J.; Tomeš, M. Fotovoltaika: Elektrická Energie ze Slunce, 1st ed.; EkoWATT: Praha, Czech Republic, 2009; p. 93. ISBN 978-80-87333-01-3. [Google Scholar]
  36. Dec, G.; Drałus, G.; Mazur, D.; Kwiatkowski, B. Forecasting Models of Daily Energy Generation by PV Panels Using Fuzzy Logic. Energies 2021, 14, 1676. [Google Scholar] [CrossRef]
Figure 1. Change in V-A characteristic due to temperature change [17].
Energies 16 02576 g001
Figure 2. Change in power characteristic due to temperature change [17].
Energies 16 02576 g002
Figure 3. The replacement scheme of the photovoltaic cell [17].
Energies 16 02576 g003
Figure 4. V-A characteristic for temperature change.
Energies 16 02576 g004
Figure 5. V-A characteristic for serial resistance change.
Energies 16 02576 g005
Figure 6. V-A characteristic for solar radiation change.
Energies 16 02576 g006
Figure 7. Power characteristic for solar radiation change.
Energies 16 02576 g007
Figure 8. The connection of photovoltaic panels.
Energies 16 02576 g008
Figure 9. V-A characteristic for each of the five cases in the experiments.
Energies 16 02576 g009
Figure 10. V-A characteristic for shaded and unshaded situations.
Energies 16 02576 g010
Table 1. Datasheet of photovoltaic panel.
DatasheetParameters
Total power, P M A X   60   W
Voltage in P M A X , U M P   17.1   V
Current in P M A X , I M P   3.5   A
Short current I S C   3.8   A
Open circuit voltage U O C   21.1   V
Termal coeficient for open circuit voltage  U O C , K v   80   m V / ° C
Termal coeficient for short current I S C , K i   2.4   m A / ° C
Cell number 36
Svetlom generovaný prúd I P H   3.8128   A
Disclaimer/Publisher’s Note: The statements, opinions and data contained in all publications are solely those of the individual author(s) and contributor(s) and not of MDPI and/or the editor(s). MDPI and/or the editor(s) disclaim responsibility for any injury to people or property resulting from any ideas, methods, instructions or products referred to in the content.

