Abstract
Humans have always been searching for new and efficient ways to convert fuels into usable energy. Solid oxide fuel cells, energy conversion devices capable of generating electrical energy, are widely used due to their high thermal energy production. In this research, fuzzy control was used to manage the voltage and current of solid oxide fuel cells. Simulations were conducted in two evaluation modes: checking the voltage, current, and power of the fuel cell, with and without the use of fuzzy control, and analyzing maximum power point tracking (MPPT) using fuzzy control. In the second mode, when connected to the load, the performance of the fuel cell was evaluated in the transient state, and the role of the controller was clearly visible According to the current–power characteristic of the fuel cell, which is a nonlinear curve and has a maximum point, and by using the fuzzy controller and the appropriate selection of input and output functions, this research aimed to make the system work at the maximum power point at all times. To this effect, a printer was used between the fuel cell and the load, and a fuzzy controller was used to set the cycle of activities, whose input was the slope of the current–power curve. The results show that this controller performs well and is faster when compared to the P&O control method. MATLAB software was used to design and analyze the system and, in order to validate the model, the transient behavior of the fuel cell was studied. The results were compared, and an acceptable match was observed.
1. Introduction
1.1. General Perspective
In the last decade, the use of fuel cells to simultaneously supply electricity and heat via the electrochemical method has developed rapidly. Using this method, which can be regarded as reverse electrolysis, the chemical energy stored in fossil fuels is extracted without combustion. These systems are highly efficient when compared to other methods and produce very little pollution. Fuel cells are much better than combustion because they chemically generate electricity. They are not limited by the laws of thermodynamics, which is why they are much more efficient at producing energy. Energy losses can also be inhibited by increasing efficiency in some cells [1,2,3,4]. Fuel cells have found a special place in the electricity industry as suppliers of new power, with ease of use, high reliability, transportability, low pollution, and high efficiency among their features, which has led to growing scientific interest. Electronic power converters play a major role in converting the DC power generated by fuel cells, which also have extensive variations [5,6,7,8]. Under normal operating conditions, a single fuel cell can generate approximately 1.2 volts. For use in power generation systems that require relatively high power, several cells are grouped together to produce more power [9,10]. Fuel cells, such as proton exchange membranes, are a good source of energy. However, they cannot optimally respond to charge changes, which is mainly due to their slow thermodynamic and electrochemical response [11,12]. In this regard, a cell model is needed to evaluate their behavior. The main issue with fuel cells is their slow chemical reactions [13,14]. A fuel cell takes about ten minutes to produce rated power. This time varies depending on the type of fuel cell and its power. Therefore, it is necessary to use fuel cells with an auxiliary energy source, such as a battery or a capacitor cloud. When a fuel cell is connected directly to an external load, its output power depends on the internal electrochemical reaction and the external load impedance [15,16]. The operating point of the system is located at the intersection of the I-P curve of the fuel cell and the load line. Thus, there is only one operating point where the fuel cell produces maximum power. The output power of the fuel cell nonlinearly depends on the current and voltage applied to it, and there is only one maximum power point. The dynamic characteristics of fuel cells can be expressed via an accurate mathematical model. This poses a control challenge.
1.2. Review of Recent Literature
In Ref. [4], the ideal voltage of the fuel cell and its losses are calculated using mathematical calculations that consider temperature, hydrogen, oxygen pressure, and fuel cell current. The dynamical behavior of the fuel cell is also accounted for by a quadratic equation. Another precise mathematical model for the fuel cell is introduced. In [5], fuel cell performance is divided into seven regions, and, for each part, differential equations are written according to time or position. To obtain the model, it is necessary to divide each region into small elements and solve their equations. Because the overall system (including power supplies, DC/DC converters, motors, and controllers) is complex, the use of this model slows down the simulation. In Ref. [6], the orbital model for the proton exchange membrane fuel cell is also presented. This model, which includes chemical reactions in an electrical circuit, has good accuracy, and it is useful for simulations made in . In [7], artificial neural networks are used to control the output voltage of the fuel cell and optimize the system parameters. In Ref. [8], a controller is provided to adjust the output voltage of the fuel cell under small load changes, and the output voltage changes are less than 5%. The authors of [9] propose a neural network predictive controller to control the output voltage of the fuel cell in the presence of fluctuations. The work proposed by [10] uses the fuzzy control technique to keep the fuel cell output voltage constant by controlling the gas pressure. In Ref. [11], to control the output voltage of the fuel cell, a feedback controller based on a quadratic linear regulator is proposed. Studies [12,13,14] investigate the problems regarding proton exchange membrane (PEM) fuel cell control, using a PID controller for applications in complex and nonlinear control problems. In Ref. [15], multivariate robust control strategies are applied to a PEM fuel cell system. In this work, the fuel cell is modeled as a two-input/two-output system, in which the inputs are air and hydrogen, and the outputs are voltage and current. The output voltage of the fuel cell is controlled by keeping the output resistance constant and adjusting the air flow. In Ref. [16], a model based on a second-order algorithm is presented for a polymer electrolyte membrane air cell fuel supply system. The goal of the control strategy is to maximize the net power of the fuel cell and prevent oxygen deprivation by adjusting the excess oxygen ratio to a desired value during rapid load changes. In Ref. [17], the design and implementation of a PEM fuel cell controller is presented. In Refs. [18,19], in light of the lack of electricity networks in remote and hard-to-reach areas due to the high construction costs of transmission lines, a hybrid system independent of the network is a good solution to meet electricity needs. Direct hydrocarbon proton-conducting solid oxide fuel cells are reviewed in [20]. By introducing the basic principles of direct hydrocarbon P-SOFCs and the unique properties of proton-conducting oxides, the authors summarize the achievements and the current challenges of P-SOFCs while proposing strategies to advance the development of direct hydrocarbon SOFCs.
Finally, in Ref. [21], nano-composite catalysts are studied for high performance and durability in intermediate-temperature methane-fueled metal-supported solid oxide fuel cells.
1.3. Motivation and Structure of the Paper
Most of the aforementioned studies use an energy source (sometimes with a resistor and a capacitor) to model the fuel cell, which does not consider the real properties and behavior of the device and is not suitable for simulation in many applications. Therefore, a new strategy is needed, which is why this paper proposes fuzzy control.
Thereupon, it is very important to consider the transient state behavior of the fuel cell. In this research, this transient state is studied using a fuel cell model and a fuzzy controller, which has not been thoroughly addressed in the literature. The goal of this work is to obtain specific values regarding the output voltage and current of a one-in-one fuel cell system in the shortest possible time and with minimal overshoot. The created control signal is, in fact, the duty cycle required for the key used in the boost converter.
2. Materials and Methods
2.1. Solid Oxide Fuel Cell Models and Equations
The operating temperature range of solid oxide fuel cells is between 600–1000 °C. For this reason, a variety of fuels can be used (Figure 1). Each solid oxide fuel cell consists of three main parts: cathode, electrolyte, and anode. In this type of battery, fuel (usually hydrogen) is introduced to the anode and oxidant (oxygen in the air) to the cathode. When hydrogen enters the anode, the hydrogen oxidation reaction occurs and the hydrogen is converted into electrons and protons. Electrons pass through the anode and travel to the cathode through the external circuit, generating an electric current. Then the electrons in the cathode react with oxygen molecules and cause the decomposition of oxygen molecules and the production of oxygen ions. In fact, the oxygen reduction reaction occurs. Oxygen ions move through the electrolyte to the anode, where they react with protons, and water is produced.
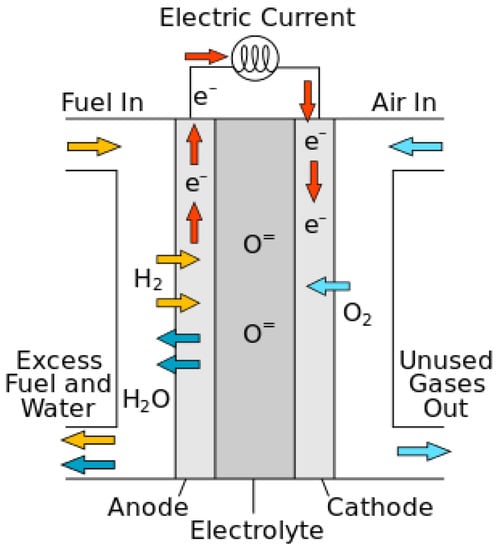
Figure 1.
General scheme of a solid oxide fuel cell.
Considering the high performance of solid oxide fuel cells, this type of fuel cell is regarded as attractive for power plant applications. These fuel cells entail a series of advantages, which include diversity in fuel consumption (gasification of coal, gases from industrial processes, and other sources), the possibility of directly converting hydrocarbon fuels without the need for a high-efficiency fuel converter, and the possibility of being used in power and heat generators (thermal recycling for heating) or a steam turbine to create steam. The need for expensive materials limits the applications of these devices, but, with the increase in performance, it becomes possible to convert the fuel inside the fuel cell. The heat generated by this process can also be utilized. Due to the high operating temperature of solid oxide fuel cells, they are produced in large power plants and used in cycle power plants.
The main process and the processes taking place at the anode and cathode are presented below:
2.2. A Fuel Cell Unit Produces a Voltage of Less Than 1 V
To produce higher voltages, fuel cells are connected in series to form a stack. The number of cells in a stack depends on the desired output power and the individual behavior of each cell. Stacks vary in size (from less than one to several hundred kW).
In fuel cells, the movement of electrons between the outer circuit and the movement of protons between the membranes for a single cell produces a voltage difference between the terminals of the cell. This voltage is expressed by the following equation:
In this equation, there is a decrease in the thermodynamic potential of the cell. In this model, is calculated from the Nernst equation, which expresses a relationship between the standard ideal cell potential E and the ideal equilibrium potential at other temperatures and partial pressures of the reactants (E). Knowing the ideal potential under standard conditions, the ideal voltage at other temperatures and pressures can be determined. According to the Nernst equation, the ideal potential of the cell increases at a given temperature at higher pressures of the reactant, and an improvement in the behavior of the fuel cell is observed at higher pressures. The ideal standard potential of a fuel cell (E) H2/O2 is 1.229 V with a liquid water product and 1.18 V with a gas water product. is calculated from the Nernst equation [22]:
where PH2 and Po2 are the partial pressures of hydrogen and oxygen (), and T is the order of the cell’s temperature value. To facilitate the mathematical calculations, Equation (5) is expressed as follows:
where represents the change in the Gibbs free energy of reaction (j/mol), F is Faraday’s constant (96,485.309 c·mol−1), is the change in the reaction entropy (j/mol), R is the gas constant (R = 8.314472 J K−1 mol−1), and are the temperature of the cell and the reference temperature (k).
The second term of Equation (6), , is the activation potential, which is expressed by the following equation:
where IFC is the static current passing through the cell and and are constants that depend on each cell type. The oxygen concentration (Co2) at the surface between the cathode and the catalyst () is obtained via the following equation:
Because the third term in Equation (7), i.e., , is so small when compared to the others, it can be neglected. Thus, Equation (7) can be rewritten as follows:
The third term in Equation (4) is a significant voltage drop caused by the transfer resistance of electrons between electrodes and the transfer of protons between membranes. This voltage drop is expressed by the following equation:
where represents the electron transfer resistance between the electrodes and it is usually a constant value. The equivalent membrane resistance () is expressed by the following equation:
where is the specific resistance of the membrane (), is the active area of the cell (), and is the thickness of the membrane (). The resistivity is obtained from the following equation (see [22,23] for more details):
with being an adjustable parameter with a maximum value of 23. This parameter depends on the membrane manufacturing process and is a function of the relative humidity and the stoichiometric ratio of the gas at the anode. Under ideal humidity conditions (100%), this parameter is between 14 and 25. For the sake of convenience regarding the mathematical operations, Equations (11) and (12) are substituted into Equation (10), as shown below [24,25]:
The last component in Equation (4) is the concentration drop voltage. This decrease is mainly due to the excess reaction concentration near the catalyst surfaces.
where is a parameter that depends on the type of cell and the density of the current passing through the cell at any given moment (). It is defined as follows:
For information on the details of the equations and dynamic model, refer to [26].
3. Designing a Controller Based on Fuzzy Logic
A knowledge base is a set of rules in which rules use language variables. On the other hand, a fuzzy rule base is a collection of fuzzy if–then rules [27,28]. A fuzzy rule base is the heart of a fuzzy system, in the sense that other components of the fuzzy system use these rules effectively and efficiently to implement it.
The fuzzy inference engine is the core of a fuzzy logic controller. After obtaining the fuzzy rules and forming the knowledge base, an inference engine is needed to create the appropriate fuzzy output by accepting the fuzzy inputs based on the rules of the knowledge base. Usually, there is an overlap in the condition of the fuzzy rules. In other words, the membership function of the input variable has a relative match with two or more membership functions of the linguistic variable expression. As a result, it can be inferred with two or more rules from the knowledge base. There should be a competitive strategy in the inference engine, so that it can create a suitable fuzzy output. In the fuzzy inference engine, the if–then rules of the database are used to map the fuzzy input sets to the fuzzy output ones.
In this section, a fuzzy controller with two inputs (power and voltage) and one output (one output unit) is designed (Figure 2 and Figure 3). The main advantage of the fuzzy controller is that it does not need accurate information about the system. The Mamdani fuzzy model is used in the fuzzy controller, and if–then rules are used for the inference engine. Table 1 and Table 2 show the fuzzy controller designed for the system based on the control law, fuzzy variable language.
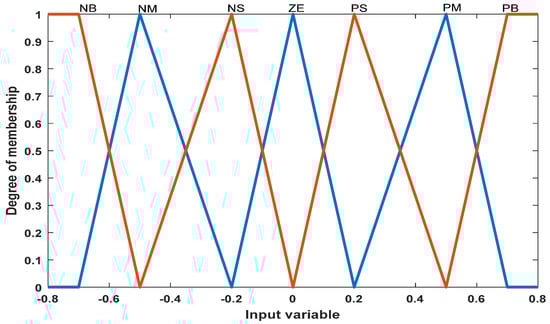
Figure 2.
Input membership function for power.
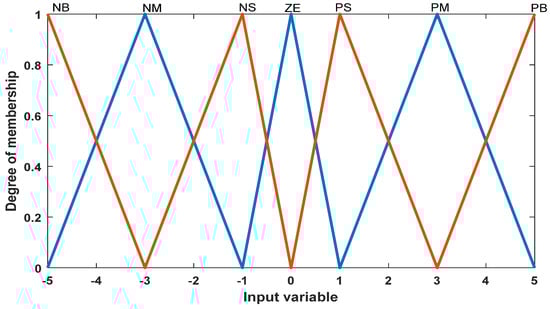
Figure 3.
Input membership function for voltage.

Table 1.
Rule base for fuzzy controller [27,28].
Table 2.
Fuzzy variable language.
The appropriate domain for each period and the number of membership functions can be defined based on experiments and the system’s configuration. Figure 4 shows the output membership function for the controller.
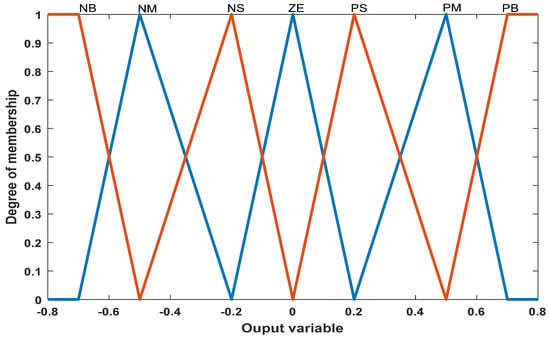
Figure 4.
Output membership function.
When a fuel cell is connected directly to an external load, its output power depends on the internal electrochemical reaction and the external load impedance. The operating point of the system is located at the intersection of the I-P curve of the fuel cell and the load line (Figure 5).
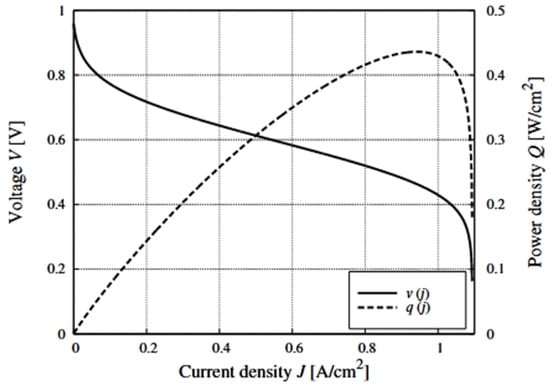
Figure 5.
Voltage v and power density q of a single fuel cell typical element versus its current density j. The voltage varies from about 1 V to about 0.5 V when the power increases from zero to its maximum value.
Thus, there is only one operating point at which the fuel cell produces maximum power. The output power of the fuel cell nonlinearly depends on the current and voltage applied to it, and there is only one maximum power point.
4. Studied System
Figure 6 shows a single simulation of the system under study, which has a fuel cell, a boost converter, and a load. The information from this model is given in Table 3. The aim is to investigate the power of two loads in two scenarios. The main purpose of using a fuel cell is to generate electricity, while a secondary goal could be to utilize the heat generated by the reaction. Therefore, the electrical energy generated by the fuel cell must be easily usable by the consumer, who, in practice, cannot be connected directly to the fuel cell, as its output voltage is DC, and consumers are usually AC. In this sense, to use the electrical energy output of the fuel cell, a power optimization unit must be used to produce the adequate voltage.
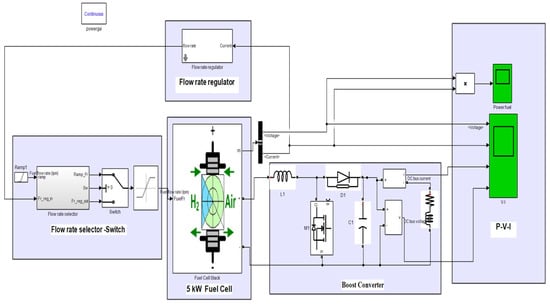
Figure 6.
Study system without controller.
Table 3.
Information of the studied system.
Figure 7 simulates the fuzzy control and control subsystem depicted in Figure 8. This model is designed very simply but functionally. Based on the concept of the previous model that was reviewed, to use the fuel cell, the appropriate control model is applied to obtain the maximum power. In the case of the fuzzy controller, the voltage and current output from the fuel cell is applied to the input of the fuzzy controller, and the output of this controller is the input of the boost converter. With this method, it is possible to track the control of the maximum delivered power to the load, as well as to obtain the operating point of the fuel cell at different voltages and currents. It tests the output power for each sample and determines the power changes in terms of voltage (dp/dv). If dp/dv is positive, it is continued in the same direction until we reach a point where dp/dv is zero. If dp/dv is negative, we must continue in the opposite direction to reach the desired point.
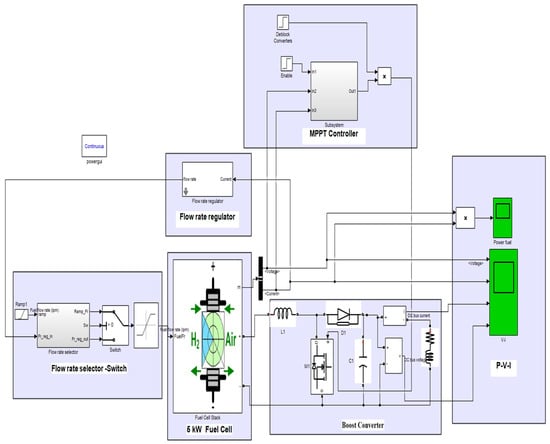
Figure 7.
Study system with controller.
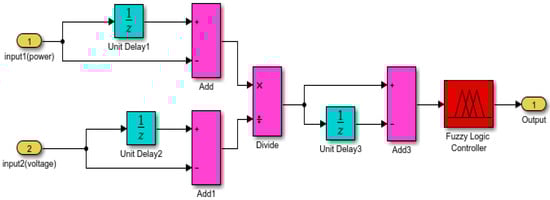
Figure 8.
Proposed fuzzy structure.
Figure 9 shows the amount of error and changes in power and voltage based on the phase controller obtained by the Mamdani method, which works based on the changes in power and voltage of the output source. A total of 49 rules have been extracted for fuzzy inference.
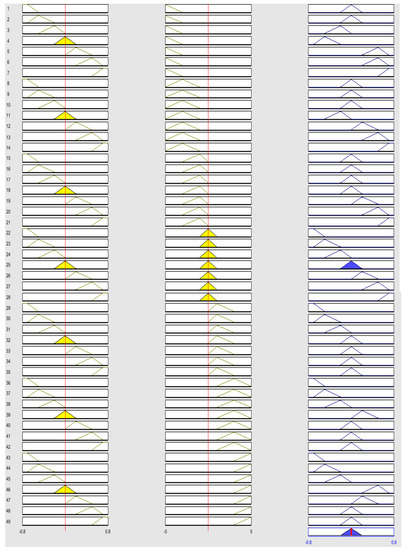
Figure 9.
Amount of error and change of power and voltage based on the fuzzy controller.
5. Analysis of the Results
5.1. Simulation Results in Normal Mode with the Controllers
This section examines the results obtained while using Perturb and Observe (P&O) and the fuzzy controllers. According to the data, the voltage in the normal state is 45 V, which is well depicted in Figure 10. It can be observed that, in the absence of control strategies, this voltage exceeds the limit.
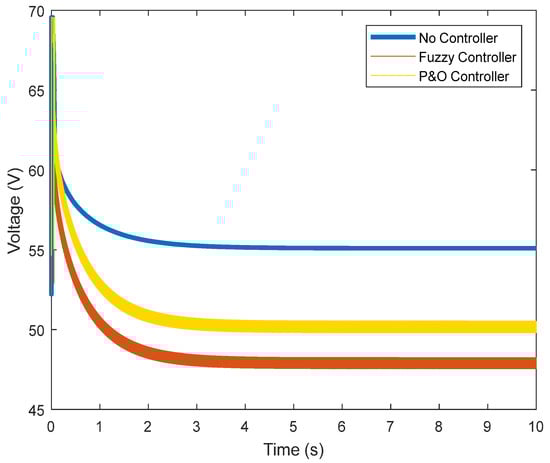
Figure 10.
Output voltage of the fuel cell.
Both voltage controls approximate the current to the nominal value of the fuel cell, which is 111.3 A. Figure 11 shows that, without the controller, the current is very low (60 A). In the presence of the fuzzy controller, the current improves and comes close to the nominal value.
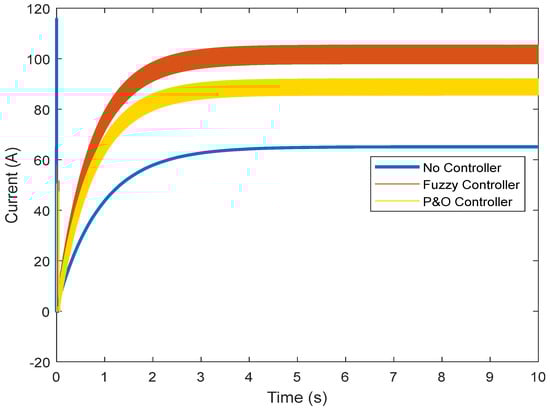
Figure 11.
Output current of the fuel cell.
Figure 12 shows the power of the fuel cell with and without a controller. The voltage and current have been successfully controlled in the previous steps, and the nominal values have been reached. The voltage and current control, through which the rated power of the fuel cell (5000 W) has been reached, is clearly visible.
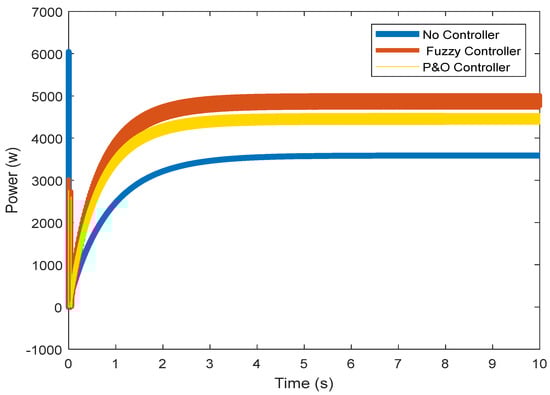
Figure 12.
Output power of the fuel cell.
In Figure 13 and Figure 14, the DC voltage and current of the converter are shown. Despite the controller’s actions, the current and voltage of the boost converter increase, applying more power to the load.
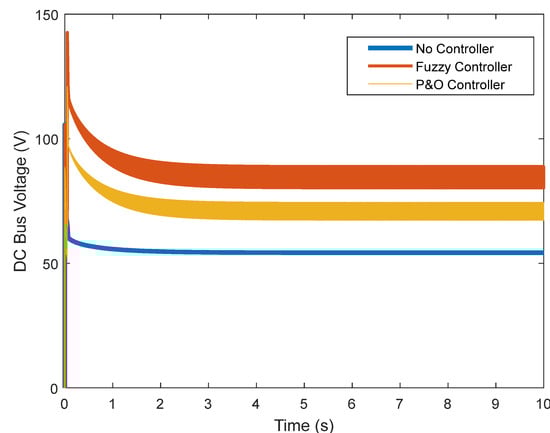
Figure 13.
DC link voltage.
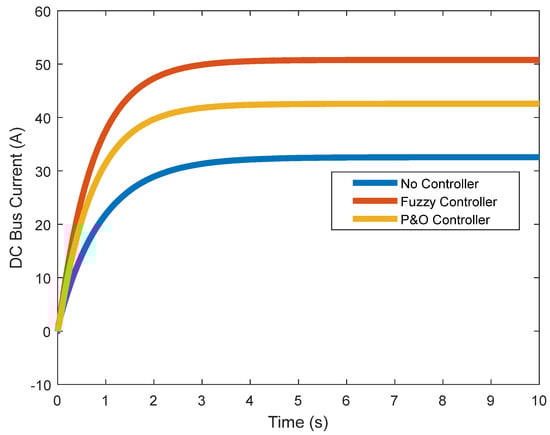
Figure 14.
DC link current.
5.2. Simulation Results in Transient Mode with the Controllers
This section examines the results obtained for the transient state. If a fuel cell is to be connected to the load at some point, it must be able to exit this state with the controller and reach stability state in the face of overcurrent and overvoltage. In this study, the fuel cell was connected to the load for 5 s, and its reaction was observed. In the previous section, it was observed that the battery voltage reached a value of around 45 V. While connected to the load without the controller, this voltage dropped, and this value was not reached after connection (Figure 15).
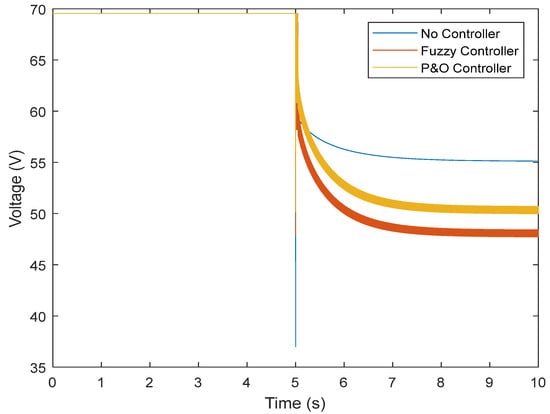
Figure 15.
Output voltage of the fuel cell in the transient state.
However, the fuzzy controller prevented large voltage drops, and the nominal value was reached. Figure 16 shows the results obtained regarding the current. It can be seen that without the controller, there is a high current while connected to the load, which does not reach the normal state after some time. The controller was able to prevent the high current, and the normal state was reached after connection. By controlling the current and voltage, the power was also controlled (Figure 17). Figure 18 and Figure 19 show the current and voltage of the boost converter. It is important to point out that if the current of the converter is not controlled, the converter will be seriously damaged (it might even burn). According to the results, a normal operation of the converter in the transient state was also achieved.
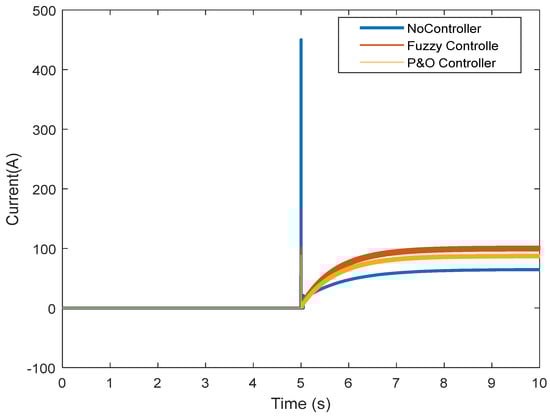
Figure 16.
Output current of the fuel cell in the transient state.
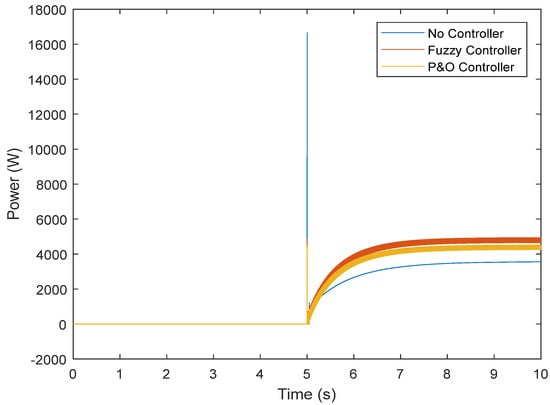
Figure 17.
Output power of the fuel cell in the transient state.
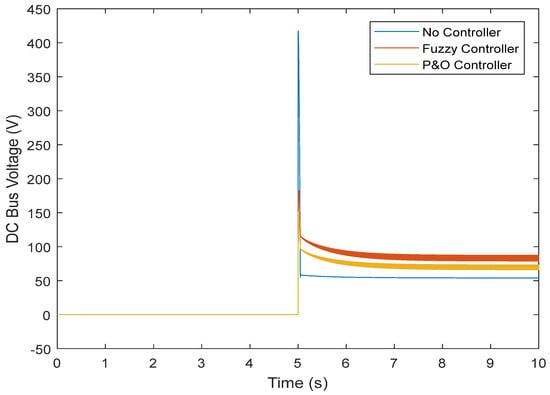
Figure 18.
DC link voltage in the transient state.
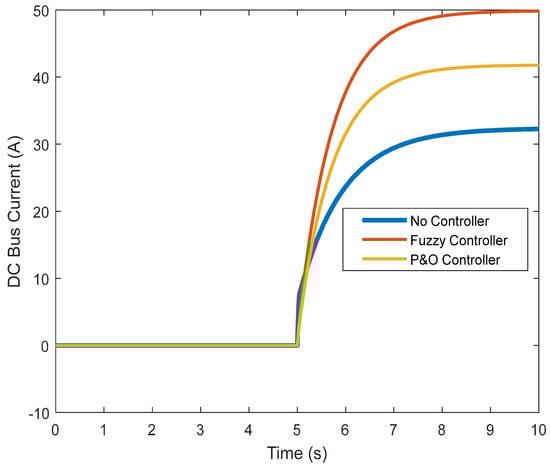
Figure 19.
DC link current in the transient state.
Figure 20 shows the behavior of the fuzzy system for the output regulator mode in terms of inputs.
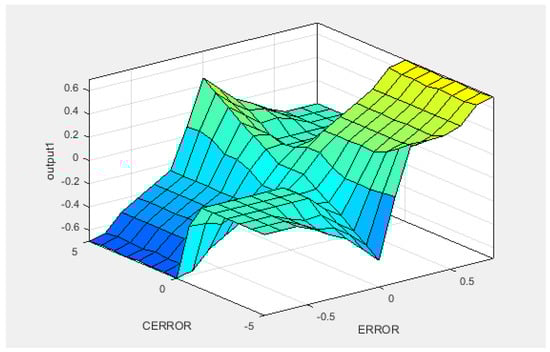
Figure 20.
Fuzzy system behavior for output/input regulator mode.
6. Conclusions
Model fuzzy control is an optimal control strategy in which future inputs and outputs are predicted by explicitly using the system model and optimizing it at repeated intervals relative to a performance measure. This computational method has been widely used to improve control performance in both research and industry. The reason for this increasing use is this controller type’s ability to operate without the intervention of experts for extended periods of time. This research attempted to use fuzzy control to achieve appropriate current and voltage values in a fuel cell. To this effect, different scenarios were presented, and nominal values were determined without the presence of a fuzzy controller. In the first scenario, the output power of the fuel cell was approximately 3 kW. In the second one, i.e., with the fuzzy controller, this value was about 5 kW. The results obtained from studying the voltage flow in the normal and transient states of the fuel cell showed that fuzzy control is a suitable option to achieve ideal operation. Note that fuzzy is not an individual technique, but a set of different methods whose computational formulas are very broad. In comparison with other strategies, model fuzzy controllers have the following features:
- They can be used for wide controls of systems, such as non-minimum phase systems, as well as unstable, delayed, nonlinear, and hybrid systems.
- They can be easily generalized to multivariate systems.
- We can easily determine the vote control process.
The following can be stated about these control assets:
- If the exact model is not selected for the actual process, then the difference between the model and the system can cause uncertainty in the output response and even its instability.
- If the system dynamics change during the control algorithm, the computational volume will increase.
In the future works, we can use the structure of this model on solar systems and hybrid systems and compare it with other methods. We can also combine this model with algorithmic methods.
Author Contributions
Conceptualization, methodology, software, and writing (review and editing), F.Z., O.D.M. and D.A.G.-R. All authors have read and agreed to the published version of the manuscript.
Funding
This research received no external funding.
Data Availability Statement
The data used in this study are reported in the paper’s figures and tables.
Conflicts of Interest
The authors declare no conflict of interest.
References
- Yang, X.; Sun, J.; Sun, S.; Shao, Z. An efficient cold start strategy for proton exchange membrane fuel cell stacks. J. Power Source 2022, 542, 231492. [Google Scholar] [CrossRef]
- Koller, M.; Borsche, T.; Ulbig, A.; Andersson, G. Review of grid applications with the Zurich 1MW battery energy storage system. Electr. Power Syst. Res. 2015, 120, 128–135. [Google Scholar] [CrossRef]
- Cigolotti, V.; Genovese, M.; Fragiacomo, P. Comprehensive Review on Fuel Cell Technology for Stationary Applications as Sustainable and Efficient Poly-Generation Energy Systems. Energies 2021, 14, 4963. [Google Scholar] [CrossRef]
- Zishan, F.; Akbari, E.; Montoya, O.D.; Giral-Ramírez, D.A.; Molina-Cabrera, A. Efficient PID Control Design for Frequency Regulation in an Independent Microgrid Based on the Hybrid PSO-GSA Algorithm. Electronics 2022, 11, 3886. [Google Scholar] [CrossRef]
- Penga, Z.; Radica, G.; Tolj, I.; Barbir, F. Experimental investigation of dynamic performance of PEM fuel cell using a segmented single-cell. In Proceedings of the 2019 4th International Conference on Smart and Sustainable Technologies (SpliTech), Split, Croatia, 18–21 June 2019. [Google Scholar] [CrossRef]
- Schmid, W.; Wildfeuer, L.; Kreibich, J.; Buechl, R.; Schuller, M.; Lienkamp, M. A Longitudinal Simulation Model for a Fuel Cell Hybrid Vehicle: Experimental Parameterization and Validation with a Production Car. In Proceedings of the 2019 Fourteenth International Conference on Ecological Vehicles and Renewable Energies (EVER), Monte-Carlo, Monaco, 8–10 May 2019; pp. 1–13. [Google Scholar] [CrossRef]
- Akbari, E.; Sheikholeslami, A.R.; Zishan, F. Participation of Renewable Energy in Providing Demand Response in the Presence of Energy Storage. Renew. Energy Res. Appl. 2022. [Google Scholar] [CrossRef]
- Hammoudi, M.Y.; Saadi, R.; Cardoso, A.J.M.; Benbouzid, M.E.H.; Sahraoui, M. Practical implementation of H-infinity control for fuel cell-interleaved boost converter. Int. J. Model. Simul. 2020, 40, 44–61. [Google Scholar] [CrossRef]
- Pereira, D.F.; Lopes, F.D.C.; Watanabe, E.H. Neural Generalized Predictive Control for Tracking Maximum Efficiency and Maximum Power Points of PEM Fuel Cell Stacks. In Proceedings of the IECON 2018—44th Annual Conference of the IEEE Industrial Electronics Society, Washington, DC, USA, 21–23 October 2018; pp. 1878–1883. [Google Scholar] [CrossRef]
- Fan, Z.; Yu, X.; Yan, M.; Hong, C. Oxygen Excess Ratio Control of PEM Fuel Cell Based on Self-adaptive Fuzzy PID. IFAC-PapersOnLine 2018, 51, 15–20. [Google Scholar] [CrossRef]
- Morán-Durán, A.; Martínez-Sibaja, A.; Rodríguez-Jarquin, J.P.; Posada-Gómez, R.; González, O.S. PEM Fuel Cell Voltage Neural Control Based on Hydrogen Pressure Regulation. Processes 2019, 7, 434. [Google Scholar] [CrossRef]
- Renjini, G.; Devi, V. Artificial neural network controller based cleaner battery-less fuel cell vehicle with EF2 resonant DC-DC converter. Sustain. Comput. Inform. Syst. 2022, 35, 100667. [Google Scholar] [CrossRef]
- Aliasghary, M. Control of PEM Fuel Cell Systems Using Interval Type-2 Fuzzy PID Approach. Fuel Cells 2018, 18, 449–456. [Google Scholar] [CrossRef]
- Kanani, H.; Gorji, J.G.; Abbaszadeh, K. Modeling and Control of Solid Oxide Fuel cell With Predictive Power Control Method. In Proceedings of the 2020 11th Power Electronics, Drive Systems, and Technologies Conference (PEDSTC), Tehran, Iran, 4–6 February 2020; pp. 1–6. [Google Scholar] [CrossRef]
- Wang, Y.; Wang, Y.; Chen, G. Robust composite adaptive neural network control for air management system of PEM fuel cell based on high-gain observer. Neural Comput. Appl. 2020, 32, 10229–10243. [Google Scholar] [CrossRef]
- Liu, J.; Gao, Y.; Su, X.; Wack, M.; Wu, L. Disturbance-Observer-Based Control for Air Management of PEM Fuel Cell Systems via Sliding Mode Technique. IEEE Trans. Control. Syst. Technol. 2018, 27, 1129–1138. [Google Scholar] [CrossRef]
- Zilouchian, A.; Saengrung, A. Design and implementation of Neuro-Fuzzy controllers for PEM fuel cells. In Proceedings of the 2017 IEEE 30th Canadian Conference on Electrical and Computer Engineering (CCECE), Windsor, ON, Canada, 30 April–3 May 2017; pp. 1–4. [Google Scholar] [CrossRef]
- Rezk, H.; Alghassab, M.; Ziedan, H.A. An Optimal Sizing of Stand-Alone Hybrid PV-Fuel Cell-Battery to Desalinate Seawater at Saudi NEOM City. Processes 2020, 8, 382. [Google Scholar] [CrossRef]
- Alayi, R.; Zishan, F.; Mohkam, M.; Hoseinzadeh, S.; Memon, S.; Garcia, D. A Sustainable Energy Distribution Configuration for Microgrids Integrated to the National Grid Using Back-to-Back Converters in a Renewable Power System. Electronics 2021, 10, 1826. [Google Scholar] [CrossRef]
- Liu, F.; Duan, C. Direct-Hydrocarbon Proton-Conducting Solid Oxide Fuel Cells. Sustainability 2021, 13, 4736. [Google Scholar] [CrossRef]
- Liu, F.; Diercks, D.; Hussain, A.M.; Dale, N.; Furuya, Y.; Miura, Y.; Fukuyama, Y.; Duan, C. Nanocomposite Catalyst for High-Performance and Durable Intermediate-Temperature Methane-Fueled Metal-Supported Solid Oxide Fuel Cells. ACS Appl. Mater. Interfaces 2022, 14, 53840–53849. [Google Scholar] [CrossRef]
- Amphlett, J.C.; Baumert, R.M.; Mann, R.F.; Peppley, B.A.; Roberge, P.R.; Harris, T.J. Performance Modeling of the Ballard Mark IV Solid Polymer Electrolyte Fuel Cell: I. Mechanistic Model Development. J. Electrochem. Soc. 1995, 142, 1. [Google Scholar] [CrossRef]
- Narasimharaju, B.; Dubey, S.; Singh, S. Design and analysis of coupled inductor bidirectional DC–DC convertor for high-voltage diversity applications. IET Power Electron. 2012, 5, 998–1007. [Google Scholar] [CrossRef]
- Ohenoja, M.; Leiviskä, K. Observations on the Parameter Estimation Problem of Polymer Electrolyte Membrane Fuel Cell Polarization Curves. Fuel Cells 2020, 20, 516–526. [Google Scholar] [CrossRef]
- Li, Y.; Yang, F.; Chen, D.; Hu, S.; Xu, X. Thermal-physical modeling and parameter identification method for dynamic model with unmeasurable state in 10-kW scale proton exchange membrane fuel cell system. Energy Convers. Manag. 2023, 276, 116580. [Google Scholar] [CrossRef]
- Souleman, N.M.; Tremblay, O.; Dessaint, L.A. A generic fuel cell model for the simulation of fuel cell power systems. In Proceedings of the 2009 IEEE Power & Energy Society General Meeting, Calgary, AB, Canada, 26–30 July 2009. [Google Scholar]
- Santos, W.S.; Torres, P.F.; Brito, A.U.; Galhardo, M.A.B.; Macêdo, W.N. A novel fuzzy controller for photovoltaic pumping systems driven by general-purpose frequency converters. Sustain. Energy Technol. Assess. 2020, 40, 100758. [Google Scholar] [CrossRef]
- Abd Ali, J.; Hannan, M.A.; Mohamed, A.; Abdolrasol, M.G. Fuzzy logic speed controller optimization approach for induction motor drive using backtracking search algorithm. Measurement 2016, 78, 49–62. [Google Scholar] [CrossRef]
Disclaimer/Publisher’s Note: The statements, opinions and data contained in all publications are solely those of the individual author(s) and contributor(s) and not of MDPI and/or the editor(s). MDPI and/or the editor(s) disclaim responsibility for any injury to people or property resulting from any ideas, methods, instructions or products referred to in the content. |
© 2023 by the authors. Licensee MDPI, Basel, Switzerland. This article is an open access article distributed under the terms and conditions of the Creative Commons Attribution (CC BY) license (https://creativecommons.org/licenses/by/4.0/).