Article

An Effective Power Dispatch of Photovoltaic Generators in DC Networks via the Antlion Optimizer

by
Luis Fernando Grisales-Noreña
1,*,
Andrés Alfonso Rosales-Muñoz
2 and
Oscar Danilo Montoya
3,4
1
Department of Electrical Engineering, Faculty of Engineering, Universidad de Talca, Curicó 3340000, Chile
2
Departamento de Mecatrónica y Electromecánica, Facultad de Ingeniería, Instituto Tecnológico Metropolitano, Medellín 050036, Colombia
3
Grupo de Compatibilidad e Interferencia Electromagnética (GCEM), Facultad de Ingeniería, Universidad Distrital Francisco José de Caldas, Bogotá 110231, Colombia
4
Laboratorio Inteligente de Energía, Facultad de Ingeniería, Universidad Tecnológica de Bolívar, Cartagena 131001, Colombia
*
Author to whom correspondence should be addressed.
Energies 2023, 16(3), 1350; https://doi.org/10.3390/en16031350
Submission received: 22 December 2022 / Revised: 12 January 2023 / Accepted: 20 January 2023 / Published: 27 January 2023
(This article belongs to the Special Issue Emerging Topics in Power Electronic Converters of Microgrids)

Abstract

:
This paper studies the problem regarding the optimal power dispatch of photovoltaic (PV) distributed generators (DGs) in Direct Current (DC) grid-connected and standalone networks. The mathematical model employed considers the reduction of operating costs, energy losses, and C O 2 emissions as objective functions, and it integrates all technical and operating constraints implied by DC grids in a scenario of variable PV generation and power demand. As a solution methodology, a master–slave strategy was proposed, whose master stage employs Antlion Optimizer (ALO) for identifying the values of power to be dispatched by each PV-DG installed in the grid, whereas the slave stage uses a matrix hourly power flow method based on successive approximations to evaluate the objective functions and constraints associated with each solution proposed within the iterative process of the ALO. Two test scenarios were considered: a grid-connected network that considers the operating characteristics of the city of Medellín, Antioquia, and a standalone network that uses data from the municipality of Capurganá, Chocó, both of them located in Colombia. As comparison methods, five continuous optimization methods were used which were proposed in the specialized literature to solve optimal power flow problems in DC grids: the crow search algorithm, the particle swarm optimization algorithm, the multiverse optimization algorithm, the salp swarm algorithm, and the vortex search algorithm. The effectiveness of the proposed method was evaluated in terms of the solution, its repeatability, and its processing times, and it obtained the best results with respect to the comparison methods for both grid types. The simulation results obtained for both test systems evidenced that the proposed methodology obtained the best results with regard to the solution, with short processing times for all of the objective functions analyzed.

1. Introduction

1.1. General Context

In recent decades, the advances made in electronic devices and renewable energies have generated a high inclusion of renewable energy resources within conventional electrical networks, which has also been encouraged by governments around the world through laws and regulations [1,2]. PV generation has been the most widely used and installed distributed generation technology in recent years, given the fact that it operates with solar radiation, the most common renewable energy source around the world. Thereupon, PV distributed generation (DG) has been widely studied, explored, and utilized in residential, commercial, and industrial applications [3,4].
The feasibility of including PV generation in a country depends on its location and weather conditions [5], due to the fact that the power generated by a PV generation system is a function of the solar radiation received in the region where the electrical system is located, as well as of the environmental temperature and the total hours of sun per day of operation. With this in mind, some countries are highly attractive, while others are not [6]. With the aim to present a graphic example, Figure 1 illustrates the PV energetic potential of Colombia, which is considered an excellent candidate for the development of PV solar generation projects, given its excellent radiation conditions in its different regions. This figure presents regions with low daily solar radiation (blue), with values near to 2.6 kWh, and areas with high solar radiation values (red), i.e., 5 kWh per day. This figure was adapted from [7].
Recognizing the importance of PV DG as a source of power, governments around the world have issued policies that encourage the integration of PV generation within the energy matrix [8], with the aim to reduce environmental impacts and dependence on fossil fuels. In Colombia, the government has developed different regulations aimed at including renewable resources into the energy matrix, as is the case of the CREG 030 and 038, which contain the electrical regulations for including DGs in grid-connected and standalone networks [9,10]. Based on these energetic polices and roadmap, multiple industries and distribution companies have set out to implement different PV generation projects that allow taking advantage of the high level of solar radiation in the different regions of the country, mainly focusing on two important locations: the Caribbean coast and the department of Antioquia.
Given the importance of solar generation in Colombia and other countries of the world, multiple PV-DGs have been located in standalone and grid-connected electrical distribution systems, and there is currently a need to develop power dispatch strategies that allow users and owners of the electrical network to benefit from a technical, economical, and environmental perspective, which is limited by several technical and operating constraints associated with the devices that make up the electrical network with regard to the use of PV-DG.

1.2. Motivation

The high number of PV-DGs installed within conventional electrical networks has generated the need to change the mode in which these systems are operated. In most cases, PV-DGs are operated while considering their maximum power point (MPP), with the aim to obtain the maximum possible power from PV systems [11,12]. This operation scenario is only feasible when the power generated is less than that demanded by the electrical system. In other cases, it is necessary to control the PV power in order to ensure power balance in the electrical grid. This control must operate each time that the power generation and demand change, as well as in scenarios of low power demand. Otherwise, it is necessary for PV systems to return to MPP operation [13]. A high proportion of the works reported in the literature and the control strategies used in industrial applications focuses only on ensuring the MPP at in PV-DGs all times, neglecting the possibility of controlling PV power generation under conditions of low power demand. This is attributed to the classical operation of electrical power systems, which require more and more power every time. However, due to the change in power consumption and the full loadability of some electrical lines due to the increase in the power demanded and generated (as is the case of Chilean power systems), sometimes it is necessary to consider the total control of the PV generation in power dispatch strategies. This aims to obtain the most out of this renewable resource. Furthermore, in the literature, the energy management strategies proposed for PV generation in grid-connected and standalone networks have been mostly evaluated for one kind of electrical grid, so it is necessary to propose power dispatch strategies that ensure excellent results in both grid-connected (GCN) and standalone (SN) networks. Based on the above, this paper analyzes the most important works regarding the optimal operation of PV-DGs in GCN and SN, in order to identify the most important solution strategies; the most employed technical, economical, and environmental objective functions; and the current needs. This aims to propose an energy management system for DC GCN and SN networks that allows for improving their technical, economical, and environmental indices while considering all constraints that constitute the problem under study.

1.3. State of the Art

In recent decades, the use of solar energy has become a very relevant issue, which is why several researchers have conducted different studies regarding the implementation of PV generation systems in order to optimize the rational use of energy in DC grids while minimizing objective functions such as energy losses, operating costs and energy purchases from the grid, and  C O 2 emissions, among others [14,15,16,17], while taking advantage of artificial intelligence, which allows solving complex problems in short periods of time, obtaining solutions of excellent quality [18,19]. The most relevant works addressing the problem under study are discussed below.
The authors of [14] employ a genetic algorithm to solve the power dispatch problem in a distributed generator located within a DC grid, considering the minimization of the network operating costs as the objective function. The authors consider the load demand requirements and the costs associated with renewable and conventional generators while using a test system composed of 6 buses for validating the proposed methodology. Within the set of constraints involved in the employed mathematical model, this document takes into account the voltage profile limits and the maximum current limits in the lines that compose the electrical grid, which allows adequate representation of the operation of the DC grids from a mathematical point of view. However, the author does not consider the average processing time, the standard deviation of the proposed solution, or any other comparison methods, which is all important elements when it comes to validating the effectiveness of an energy management system [13]. In [15], the authors propose solving the economic power dispatch problem in microgrids while employing metaheuristic optimization methods. The authors use a test system composed of 37 buses and consider PV and diesel generators to supply electric power to the network. This document uses the memory-based gravitational search algorithm (MBGSA) for solving the aforementioned problem while considering some comparison methods such as particle swarm optimization (PSO), genetic algorithms (GA), the gravitational search algorithm (GSA), and the artificial bee colony (ABC). It is worth noting that this document does not analyze the average solution, standard deviation, and average processing times of each methodology. However, the results show that the proposed algorithm is the best method regarding the solution to the problem under study in comparison with the other solution strategies. In [16], the authors propose an energy power dispatch that considers a DC grid located in Tianzhong-Xinjiang, China. This network is composed of PV, wind, and thermal DGs. The minimization of the generation costs and emission gasses related to thermal generation is used as the objective function, and the results show the feasibility of said reductions. The authors of [17] study the technical-economic feasibility of PV-DG within a mixed AC-DC distribution grid. The authors employ a master–slave methodology that involves the non-dominant sorting genetic algorithm-II and the sequential quadratic method. This strategy was tested in a radial 33-bus system, and its objective function was the minimization of operating costs and energy losses, obtaining excellent results. This paper considers the minimum solution obtained by the proposed methodology and comparison methods used, but it does not consider the average solution, the average processing times, or the standard deviation. In the study carried out by [20], the authors employ the crow search algorithm (CSA) to solve the economic and emissions dispatch problem. To carry out the simulations, the authors consider the combination of traditional and renewable power generators. They use different comparison methods, but they do not consider the analysis of the average solution, the average processing time, or the standard deviation.
In [21], the authors propose the implementation of the multiverse optimizer (MVO) in the master stage and successive approximations (SA) method in the slave stage in order to minimize the power losses in DC networks through a strategy that allows obtaining the optimal power dispatch of DGs in DC networks. This paper considers some comparison methods, the average solution, and the standard deviation, but it does not specify the processing time required by the optimization algorithms. The results obtained show the superiority of the MVO with regard to the comparison algorithms in reducing the power losses of the test systems used. The work by [22] proposes the implementation of the black hole algorithm (BH) to solve the problem regarding DG power dispatch in DC grids, aiming for the reduction of power losses in the 21- and 69- bus test systems as the objective function. This paper compares the proposed algorithm with a solver of the General Algebraic Model System (GAMS), and the results obtained demonstrate its excellent performance. This study analyzes the minimum solution, but it disregards the average solution, the average processing times, and the standard deviation of the results. The work published by [23] suggests the use of the salp swarm algorithm and the successive approximations power flow method to solve the optimal power dispatch problem for DGs in DC grids. This document analyzes the minimum and average solutions reported by the optimization algorithm, as well as the average processing times and the standard deviation after 100 executions. The proposed methodology was compared with MVO, BH, and PSO, demonstrating the superiority of the studied algorithm in terms of the minimum and average solution, the standard deviation, and the processing times required with respect to the algorithms employed for the sake of comparison.
Multiple works have been proposed for solving the optimal power dispatch in DC grids in order to improve the technical, economical, and environmental conditions of these networks [13,24,25]. These studies are based on master and smart control strategies that use sequential programming optimization techniques, with the purpose of avoiding the implementation of specialized tools, which increases the complexity and costs of any solution methodology. The average solution, standard deviation, and processing times required by these solution strategies are analyzed with the aim to propose energy management systems for DC grids that are fast and have high performance and repeatability. The main weakness of some of these works it is that they consider PV generators to operate in MPP, i.e., the generators always produce their maximum rated power. However, the PV generators must be operated in different power ranges when there are changes in load conditions, in order to offer the best technical, economical, and environmental conditions to the owners, operators, and users of the DC grid. That is to say, when there is lower demand in comparison with the PV power generation, it must be controlled by seeking the power point that entails the maximum benefits in terms of the objective function used; otherwise, it must be disconnected. In this way, different researchers have set out to ensure the control of the power generation in PV generators for improving the grid conditions. This is the case of the work reported in [26], where the authors propose a control strategy for operating a PV-distributed generator in operation points different from MPP. This aims to guarantee all technical and operating constraints of a DC microgrid operating in standalone mode. This work demonstrated that it is possible to seamlessly control the power generation in a PV generator. In light of this, some works have been published in recent years regarding the optimal dispatch of PV generators in grid-connected and standalone networks. An example of this is the work reported in [27], where a mathematical formulation was proposed for the optimal operation of PV generators in a DC grid with the purpose of reducing the energy costs, using the CPLEX software (IBM ILOG CPLEX Optimization Studio,2004) as a solution method. In [28], linear models are proposed to establish the power scheduling of PV generators located in a grid-connected system, which are implemented in GAMS while using the reduction of the operating costs as an objective function. The authors of [29] obtained the optimal operation of PV-DGs in a DC grid by using a semi-definite programming model with the aim to reduce the operation costs and satisfy all constraints that represent the problem addressed. The high implementation of specialized software is associated with the high complexity of the problem studied, but, as mentioned before, the implementation of this kind of solution strategy increases the cost and complexity of the solution. To address this issue, optimization methodologies based on sequential programming have been proposed [30], which analyze the economical, technical, and environmental impact of an adequate operation schematic of PV-DGS. However, this still requires exploration. Finally, with the aim to summarize the different optimization methodologies, objective functions, and pros and cons of the previously reported solution methodologies, as well as to show the references of said works, Table 1 is presented below.
As shown in Table 1, the solution methodologies proposed for the problem regarding the optimal power dispatch of PV-DGs in DC grids must consider the technical, economical, and environmental conditions of the grid to satisfy the needs of the users and the owners. All energy management systems (EMS) have to be evaluated in terms of their average solution, standard deviation, and processing times, aiming to ensure that all solution methodologies exhibit adequate performance and ensure a solution of good quality every time they are implemented. Moreover, the mathematical models that constitute the problem studied herein must observe all technical and operating constraints that represent the operation of DC grids under a PV generation environment, including the voltage profile and branch current limits, which is neglected in many studies, taking variable power generation and demand into account.
In light of the above, it is currently necessary to develop EMS for solving the optimal power dispatch of PV-DGs in DC grids, considering the most commonly used technical, economical, and environmental indices as objective functions, i.e., the reduction of energy losses, operating costs, and greenhouse gas emissions. It is important for these energy management systems to employ real an variable power generation and demand data from grid-connected and standalone DC networks, as well as sequential programming techniques that can be replicated in any free software and ensure excellent results in terms of the solution, repeatability, and processing times. This uses solution optimization methodologies with high performance that take advantage of the multiple benefits of artificial intelligence [31,32]. Given these needs, this article proposes a master–slave methodology that involves the antlion optimizer (ALO) and the matrix hourly power flow method based on successive approximations while considering three objective functions: the reduction of energy losses, operating costs, and  C O 2 emissions. To determine the effectiveness of the proposed methodology, two test systems were used. The first one corresponds to a standalone network, particularly considering the energy costs, emissions factor, PV generation, and power demand of Capurganá, Chocó, a little town located on the Caribbean coast of Colombia. The second one is a grid-connected DC network in Medellín, a city located in the Colombian department of Antioquia. To obtain the aforementioned parameters, data reported by NASA [33], Empresas Publicas de Medellín (EPM), and Instituto de Planificación y Promoción de Soluciones Energéticas para Zonas No Interconectadas (IPSE) [34,35]) were used. Finally, CSA [36], PSO [37], MVO [38], SSA [39], and VSA [40] were used as comparison methods. These techniques were selected because of their excellent performance regarding the studied problem. All solution methodologies were analyzed in terms of their average solution, standard deviation, and processing times, in order to identify the best-performing optimization methodology with regard to the optimal PV-DG power dispatch problem in DC grid-connected (GCN) and standalone (SN) networks.

1.4. Scope and Main Contributions

This paper deals with implementing a master–slave methodology that involves the ALO and a matrix hourly power flow based on successive approximations for solving the problem regarding the optimal power dispatch of PV distributed generators in DC GCN and SN with the purpose of improving their economical, technical, and environmental conditions while considering all constraints under a scenario of distributed generation, as well as the variable renewable power generation and power demand associated with the municipality of Capurganá (SN) and the city of Medellín (GCN). This paper’s contributions are listed below in order of relevance:
  • The implementation of a mathematical formulation that observes all technical and operating constraints that constitute the operation of DC grids under a scenario of PV distributed generation.
  • A new master–slave methodology to solve the optimal power dispatch in DC grids which employs the ALO and a matrix hourly power flow method and yields the best results with regard to solution quality (best solution and standard deviation).
  • The implementation of two DC grids (GCN and SN) that represent the average PV power generation and demand reported in Colombia.
  • A methodology that allows identifying the optimization method that optimally balances solution quality and processing times for solving the problem of optimal power dispatch in DC grids.
  • The identification of the current economic needs associated with operating GCN and SN in Colombia.

1.5. Paper Structure

The first section of this paper presented the problem under study, reviewed the specialized literature to identify current needs, and proposed a solution methodology. The second section presents the mathematical formulation used for improving the economical, technical, and environmental conditions of the DC grids used. The third section explains the codification and the master–slave strategy proposed as a solution. Afterward, the fourth section describes the test systems, the generation and demand curves, and the main considerations used in this work. The fifth section evaluates and discusses the simulation results for the GCN and SN, and the last section draws the main conclusions and outlines future works related to this research.

2. Mathematical Formulation

This section describes the mathematical formulation used to improve the economical, technical, and environmental conditions of the DC grid by integrating a series of technical and operating constraints associated with DC grids under a variable PV power generation and demand scenario. This mathematical model considers an average operation day for a DC grid using the power data, energy costs, and  C O 2 emissions typical of grid-connected and standalone DC grids.

2.1. Objective Functions

The first objective function corresponds to the reduction of operating costs ( E c o s t ), which is expressed in Equation (1). This objective function concerns the reduction of the energy costs related to energy purchasing from the convectional generators in the DC grid ( f 1 ), as well as the reduction of the maintenance costs of the PV-DGs, in terms of the power generated by the devices ( f 2 ).
min E c o s t = f 1 + f 2
Equation (2) allows calculating the total energy purchases from conventional generators for a day of operation. Here, C k W h denotes the energy purchasing cost in conventional generators. This value is associated with the grid energy cost in grid-connected networks and the diesel generation costs in standalone grids. Furthermore, p i , h s is the power supplied by the conventional generator located at bus i at time h, and  Δ h denotes the time interval analyzed in this research (1 h). Finally, the sets H and N contain all hours considered within the time horizon and all the buses that constitute the DC grid, respectively.
f 1 = C k W h h H i N p i , h s Δ h
Equation (3) is used to calculate the costs of maintenance associated with the operation of the PV-DGs. here, C O & M represents the per-kW maintenance costs generated by the PV generator, and  p i , h p v is the power generated in the period h by the PV distributed generator installed at bus i.
f 2 = C O & M h H i N p i , h p v Δ h
The second objective function involves a reduction in the energy losses associated with energy transport in the DC grid ( E l o s s ), which is presented in Equation (4). In this equation, R l and I l represent the resistance and current at the electrical line l, with  L being the set containing all the electrical lines that make up the DC network.
min E l o s s = h H l L R l I l 2 Δ h
Finally, Equation (5) denotes the third objective function used in this paper, which corresponds to the reduction of C O 2 emissions ( E C O 2 ), which are associated with the emissions caused by diesel generators in standalone grids and the per-kW emissions factor of interconnected networks. In this equation, C E s denotes the emissions factor of the conventional generators installed in the DC grid.
min E C O 2 = C E s h H i N p i , h s Δ h

2.2. Set of Constraints

This subsection describes all of the constraints that represent the technical and operating limitations of DC grids operating under a scenario of PV-DG.
p i , h s + p i , h p v P i , h d = v i , h j N G i j v j , h
Equation (6) expresses the most important constraint for a correct operation of the DC grid. This equation ensures the global power balance in the different periods of operation considered within the time horizon (24 h), taking into account the power supplied by the conventional generator ( p i , h s ) and the PV-DGs ( p i , h p v ), the power demanded by the load connected at bus i in the hour h ( P i , h d ), the power losses as a function of the conductance of the line connecting the buses i and j ( G i j ), and the voltage of the bus i ( v i , h ) and j ( v j , h ) at time h.
P i s , min p i , h s P i s , max
The technical constraints of the conventional generators installed in the electrical grid are expressed in Equation (7). Here, P i s , min and P i s , max represent the minimum and maximum power supplied by the conventional generator located at bus i.
P i p v , min p i , h p v P i p v , max
P i p v , max P i p v C h p v
The maximum ( P i p v , max ) and minimum ( P i p v , min ) limits of the PV distributed generator located at bus i are described in Equation (8), which enables the definition of the operation range of the PV-DGs. To calculate P i p v , max , Equation (9) is used, where C h p v is a function of the solar radiance and environmental temperature in the region where the DC grid is located and the PV technology is considered. Note that P i p v , min takes a value of zero in all DGs. A complete description of the PV power limits is presented in Section 4 of this manuscript.
V i min v i , h V i max
Equation (10) ensures that the voltage profile limits are met in all buses of the DC grid, with  V i min and V i max being the minimum and maximum voltages allowed at bus i. It important to note that this work considered ± 10 % of the DC grid’s nominal voltage as voltage bounds [21].
I l max I l , h I l max
Finally, Equation ensures that the current is within the technical limits set in accordance with the kind of lines installed in the DC network. Here, I l , h is the current that flows through branch l branch at time h, while I l max denotes the maximum current allowed in both directions of the line. Note that this work considers telescopic electrical networks (i.e., a real scenario), for which the maximum current is established for each line in the DC grid.

2.3. Fitness Function

With the aim to guarantee that all constraints associated with the DC grid are observed and that non-feasible regions are explored, as well as to reduce the processing times and enhance the exploration of the ALO [13], this article uses the fitness function described in Equation  (12).
F F = O F + α max 0 , V i , h V i max min 0 , V i , h V i min min 0 , real ( p i , h s P i s , min ) + min 0 , real ( p i , h s P i s , min ) + max 0 , I l , h I l max
Here, O F denotes the objective functions selected (one of the three proposed in this paper), while α is a constant that allows normalizing the violations of some of the constraints involved in the problem. α takes a value of 1000 in this work, being this obtained in a heuristic way. Finally, in this equation, the expressions min and max select the minimum and maximum values between the limit and the variable analyzed, with the aim to penalize the objective function when any of the constraints that make up the problem is violated.

3. Codification and Optimization Methodology

To solve the problem regarding the optimal power dispatch of PV-DGs in DC grids, this paper proposes a master–slave methodology. In the master stage, the ALO is entrusted with solving the optimal power flow problem by establishing the power to be generated in each hour of operation by the PV-DGs in the DC grid. To this effect, the codification depicted in Figure 2 is used.
This codification proposes, for each generator in the DC grid, a power value to be injected in the different hours of solar radiation. This value is fixed between 0 kW and the maximum power that can be supplied in each period of time under analysis. It is calculated by considering the PV technology installed, the solar radiance, and the environmental temperature in the region where the DC grid is located (see Section 4). As shown in Figure 2, the location of three PV distributed generators is considered, along with different power values between 6:00 and 19:00, which corresponds to the hours of solar radiation in the Colombian regions studied in this research.
In the analyzed methodology, the slave stage is entrusted with evaluating the fitness function for each solution generated by the master stage. To this effect, a matrix hourly power flow method was used which allows evaluating all time periods at the same time, thus reducing the processing times in comparison with other hourly power flow methodologies. The master and slave stages used in this study are detailed below.

3.1. Antlion Optimizer

The Antlion Optimizer (ALO) is a bio-inspired method used to solve optimization problems with continuous variables. This methodology works on the basis of the antlion’s food hunting method. This species creates a cone-shaped trap on the ground to hunt its food. When the antlion creates the trap, it buries itself deep inside the cone and waits for insects to fall into it (it preferably hunts other types of ants), trapping and taking them as food. The ants stochastically move through the solution space while searching for their food, which is known by the algorithm as random walks. This behavior is modeled mathematically in order to represent the behavior of the ants within the optimization method ([41,42]), as well as to obtain the best solution possible to continuous problems. The iterative process used by the ALO is presented below.

3.1.1. Generating the Initial Population

The initial population of ants is randomly created (here, the ants represent the possible solutions to the problem addressed). This is done by considering all constraints involved in the problem. Within this population, each individual corresponds to an ant, which comprises the particular values assigned to the variables of the problem. To generate a value for each ant in the initial population, Equation (13) is used.
A n t s t = Y m i n · o n e s ( N i , N v ) + ( Y m a x Y m i n ) · r a n d ( N i , N v )
Note that Y m i n and Y m a x are vectors of size 1 x N v which contain the lower and upper bounds of the solution variables related to PV generator operation, as shown in (14) and (15), where N v is the number of values that make up each individual, i.e., the number of variables that represent the continuous problem under study. Furthermore, o n e s ( N i , N v ) and r a n d ( N i , N v ) are a matrix filled by ones and random values of size N i x N v , where N i represents the number of individuals that compose the initial population. Equation (13) allows the creation of a population of ants that explore larger regions of the solution space. Finally, t is the current iteration of the algorithm ( t = 0 in this particular case).
Y m i n = [ Y 1 m i n , Y 2 m i n , , Y N v m i n ]
Y m a x = [ Y 1 m a x , Y 2 m a x , , Y N v m a x ]
In order to understand the population of ants, Equation (16) is used, where each individual (i.e., a solution for the problem under analysis) corresponds to the variables in each row. In this equation, it can be noted that the population corresponds to a matrix of size N i x N v , which is updated in each iteration of the algorithm in order to find the individual with the best possible solution, where N i is the number of rows, this value represents the total of ants or individual consider within the population, while N v the number of columns in this matrix, this represents the total of variables that integration the problem (the power schematic for all PV-DGs located in the DC grid in an operation day).
A n t s t = A n t s ( 1 , 1 ) t A n t s ( 1 , 2 ) t A n t s ( 1 , N v ) t A n t s ( 2 , 1 ) t A n t s ( 2 , 2 ) t A n t s ( 2 , N v ) t A n t s ( N i , 1 ) t A n t s ( N i , 2 ) t A n t s ( N i , N v ) t

3.1.2. Evaluating the Fitness Function and Selecting the Incumbent

After generating the initial population, it becomes necessary to evaluate the effect of each individual on the fitness function proposed in Section 2. Then, each value of the fitness function is stored in a vector of size N i x 1 ( F F A n t s t ) (see Equation (17)).   
F F A n t s t = F F ( A n t s ( 1 , N v ) t ) F F ( A n t s ( 2 , N v ) t ) F F ( A n t s ( N i , N v ) t )
After evaluating the objective function in the initial population, the ant or individual of the population with the best adaptation function is selected as the incumbent of the problem (antlion), i.e., the ant that represents the best solution (see Equation (18)). The antlion affects the movements of all the other ants during the iterative process, as the new position of the ants is a function of the antlion and their current position.
A n t i l i o n t = b e s t ( A n t s t )

3.1.3. Algorithm Advancement Method

After selecting the incumbent of the problem, the iterative process of ALO starts with a random walk based on random values, the information of A n t l i o n and each individual within the population, by allowing the generation of new populations based on this information [43]. To generate these populations ( A n t s t + 1 ), the information associated with the A n t s t and ω t is used, the latter being in charge of the ants’ movement through in the solution space as a function of the best solution, the random values, and the particular solution of each ant in the current population (see Equation (19)). The matrix explanation of ω t is presented in Equation (20). Note that this matrix has the same size as A n t s t .
A n t s ( N i , N v ) t + 1 = A n t s ( N i , N v ) t + ω ( N i , N v ) t
ω t = ω ( 1 , 1 ) t ω ( 1 , 2 ) t ω ( 1 , N v ) t ω ( 2 , 1 ) t ω ( 2 , 2 ) t ω ( 2 , N v ) t ω ( N i , 1 ) t ω ( N i , 2 ) t ω ( N i , N v ) t
To calculate ω t , Equation (21) is used. Here, each ( i , j ) component of ω t is calculated by using the same components of the A n t l i o n t and A n t t . To this effect, two parameters ( α and β ) are employed, which are in charge of regulating the progress towards the best local and global solution, controlling the convergence of ALO, in addition to a random value ( r a n d ) that can take a positive or negative value as a function of a random value between 0 and 1, which ensures diversity in the exploration of the solution space, as described in (22).
ω ( i , j ) = α r a n d A n t l i o n ( i , j ) β A n t s ( i , j ) t
r a n d = + i f r a n d > 0.5 i f r a n d < 0.5
Once the A n t s ( N i , N v ) t + 1 positions have been updated in each iteration, it must be confirmed whether all the ants comply with the technical limits established for the problem (i.e., the set of constraints). Subsequently, the  F F A n t s t is updated for the new ant population, as well as the antlion. This process is repeated until the stopping criteria established for the algorithm are met.
As stopping criteria for the ALO, this paper used a maximum number of iterations and a maximum number of non-improving iterations. This had the aim of avoiding unnecessary iterations during the process.
Algorithm 1 outlines the iterative process proposed for the ALO in order to solve the problem regarding the optimal power dispatch of PV-distributed generators in DC grids:
Algorithm 1: Iterative process proposed for the ALO.
Energies 16 01350 i001
The iterative process of the ALO starts by processing the electrical system data and the optimization parameters of the ALO. Then, it generates the initial population of ants by evaluating the fitness function of each one of the individuals that make up the initial population. Subsequently, the ant with the best fitness function is selected as the A n t l i o n t with t = 0 (initial values), i.e., with the lowest objective function value in this particular case.
After generating the initial values of the ALO, the iterative process starts generating the new ant population ( A n t s t + 1 ) based on the information of the A n t l i o n t and the information of each individual (see Equation (19)). Then, it evaluates the fitness function of the population, and it updates the incumbent ( A n t l i o n t + 1 ). In each iteration, the previous and current value of the antlion is compared. If the value it is not improved, the counter of non-improving iterations ( t N I ) increases by 1; otherwise, it remains at 0. If  t N I achieves the maximum number of non-improving iterations ( t m a x N I ), the iteration process ends and prints the A n t l i o n t as a solution to the problem; otherwise, the iterative process evaluates if the maximum number of iterations t m a x has been met. If this is true, the algorithm ends and returns the A n t l i o n t + 1 as a solution.

3.2. Matrix Hourly Power Flow

This study uses a matrix hourly power flow method (MHPF) based on successive approximations to evaluate the fitness function of each solution provided by the master stage, considering the variation in PV generation and power demand for an average operation day. The MHPF solves a matrix equation via an iterative process that ends when a set convergence value or a maximum number of iterations is reached. This equation takes advantage of the Hadamard product (∘) and division (⊘) to solve the hourly power flow problem in only one mathematical process, which requires an iterative process to improve convergence and accuracy. The matrix equation that describes the MHPF is presented in (23).
V d h t + 1 = G d d 1 ( o n e s V d h t ) ( P d h P p v h ) + G d s V s h
In this equation, V d h t + 1 denotes a matrix of size | d | x | H | , where | d | represents the number of demand buses and | H | the period of time analyzed within the time horizon. t + 1 is the current iteration and t the last one. o n e s is a matrix of ones which presents in this equation a Hadamard division operation with the matrix voltage from the last iteration ( V d h t ). A Hadamard product is applied to the product of this operation with the difference between P d h and P p v h , which represents the matrix containing the power demand and PV generation for the different time periods considered. These matrices and o n e s have the same size as the voltage demand matrix ( | d | x | H | ). Finally, the results obtained after executing the matrix operation are added to the results obtained after multiplying the conductance matrix generated between the demand and slack buses ( G d s ), as well as the matrix containing the voltage in the slack buses in all periods analyzed ( V s h ), with these values being constant. Note that G d d corresponds to the conductance matrix related to the demand buses of the electrical grid.
Equation (23) requires an iterative process for solving the hourly power flow problem, which is presented in Algorithm 2.
Algorithm 2: Iterative process for matrix hourly power flow based on successive approximations.
Energies 16 01350 i002
The iterative process proposed to solve the hourly power flow problem via the MHPF starts by entering the electrical system’s information, i.e., the branch parameters, buses, hourly power demand, demand, and slack bus locations, among others. Then, it enters the power to be supplied by the PV-DGs in the electrical grid for each hour of operation. These values are provided by the solution provided by the master stage. Subsequently, the iterative process enters the initial voltage matrix ( t = 0 ), which is a matrix of ones because the planar voltage is considered for all hours as an initial condition (1 p.u). Afterwards, a convergence error ( ϵ ) of 1 × 10 10 and a maximum number of iteration ( t m a x ) of 1000 are heuristically established.
After entering the initial parameters and values, the iterative process calculates the voltage for all hours of operation, using these data and the MHPF. Then, it verifies whether the convergence error has been achieved. In this case, the algorithm ends, returning the voltage profiles generated by the power generation and demand. These values are used to calculate the fitness function associated with the solution provided by the master stage, returning this value to the ALO in order to continue with the iteration process. Otherwise, the iterative process of the MHPF continues until the maximum number of iterations is met.

4. Test Systems, Generation and Demand Curves, and Additional Considerations

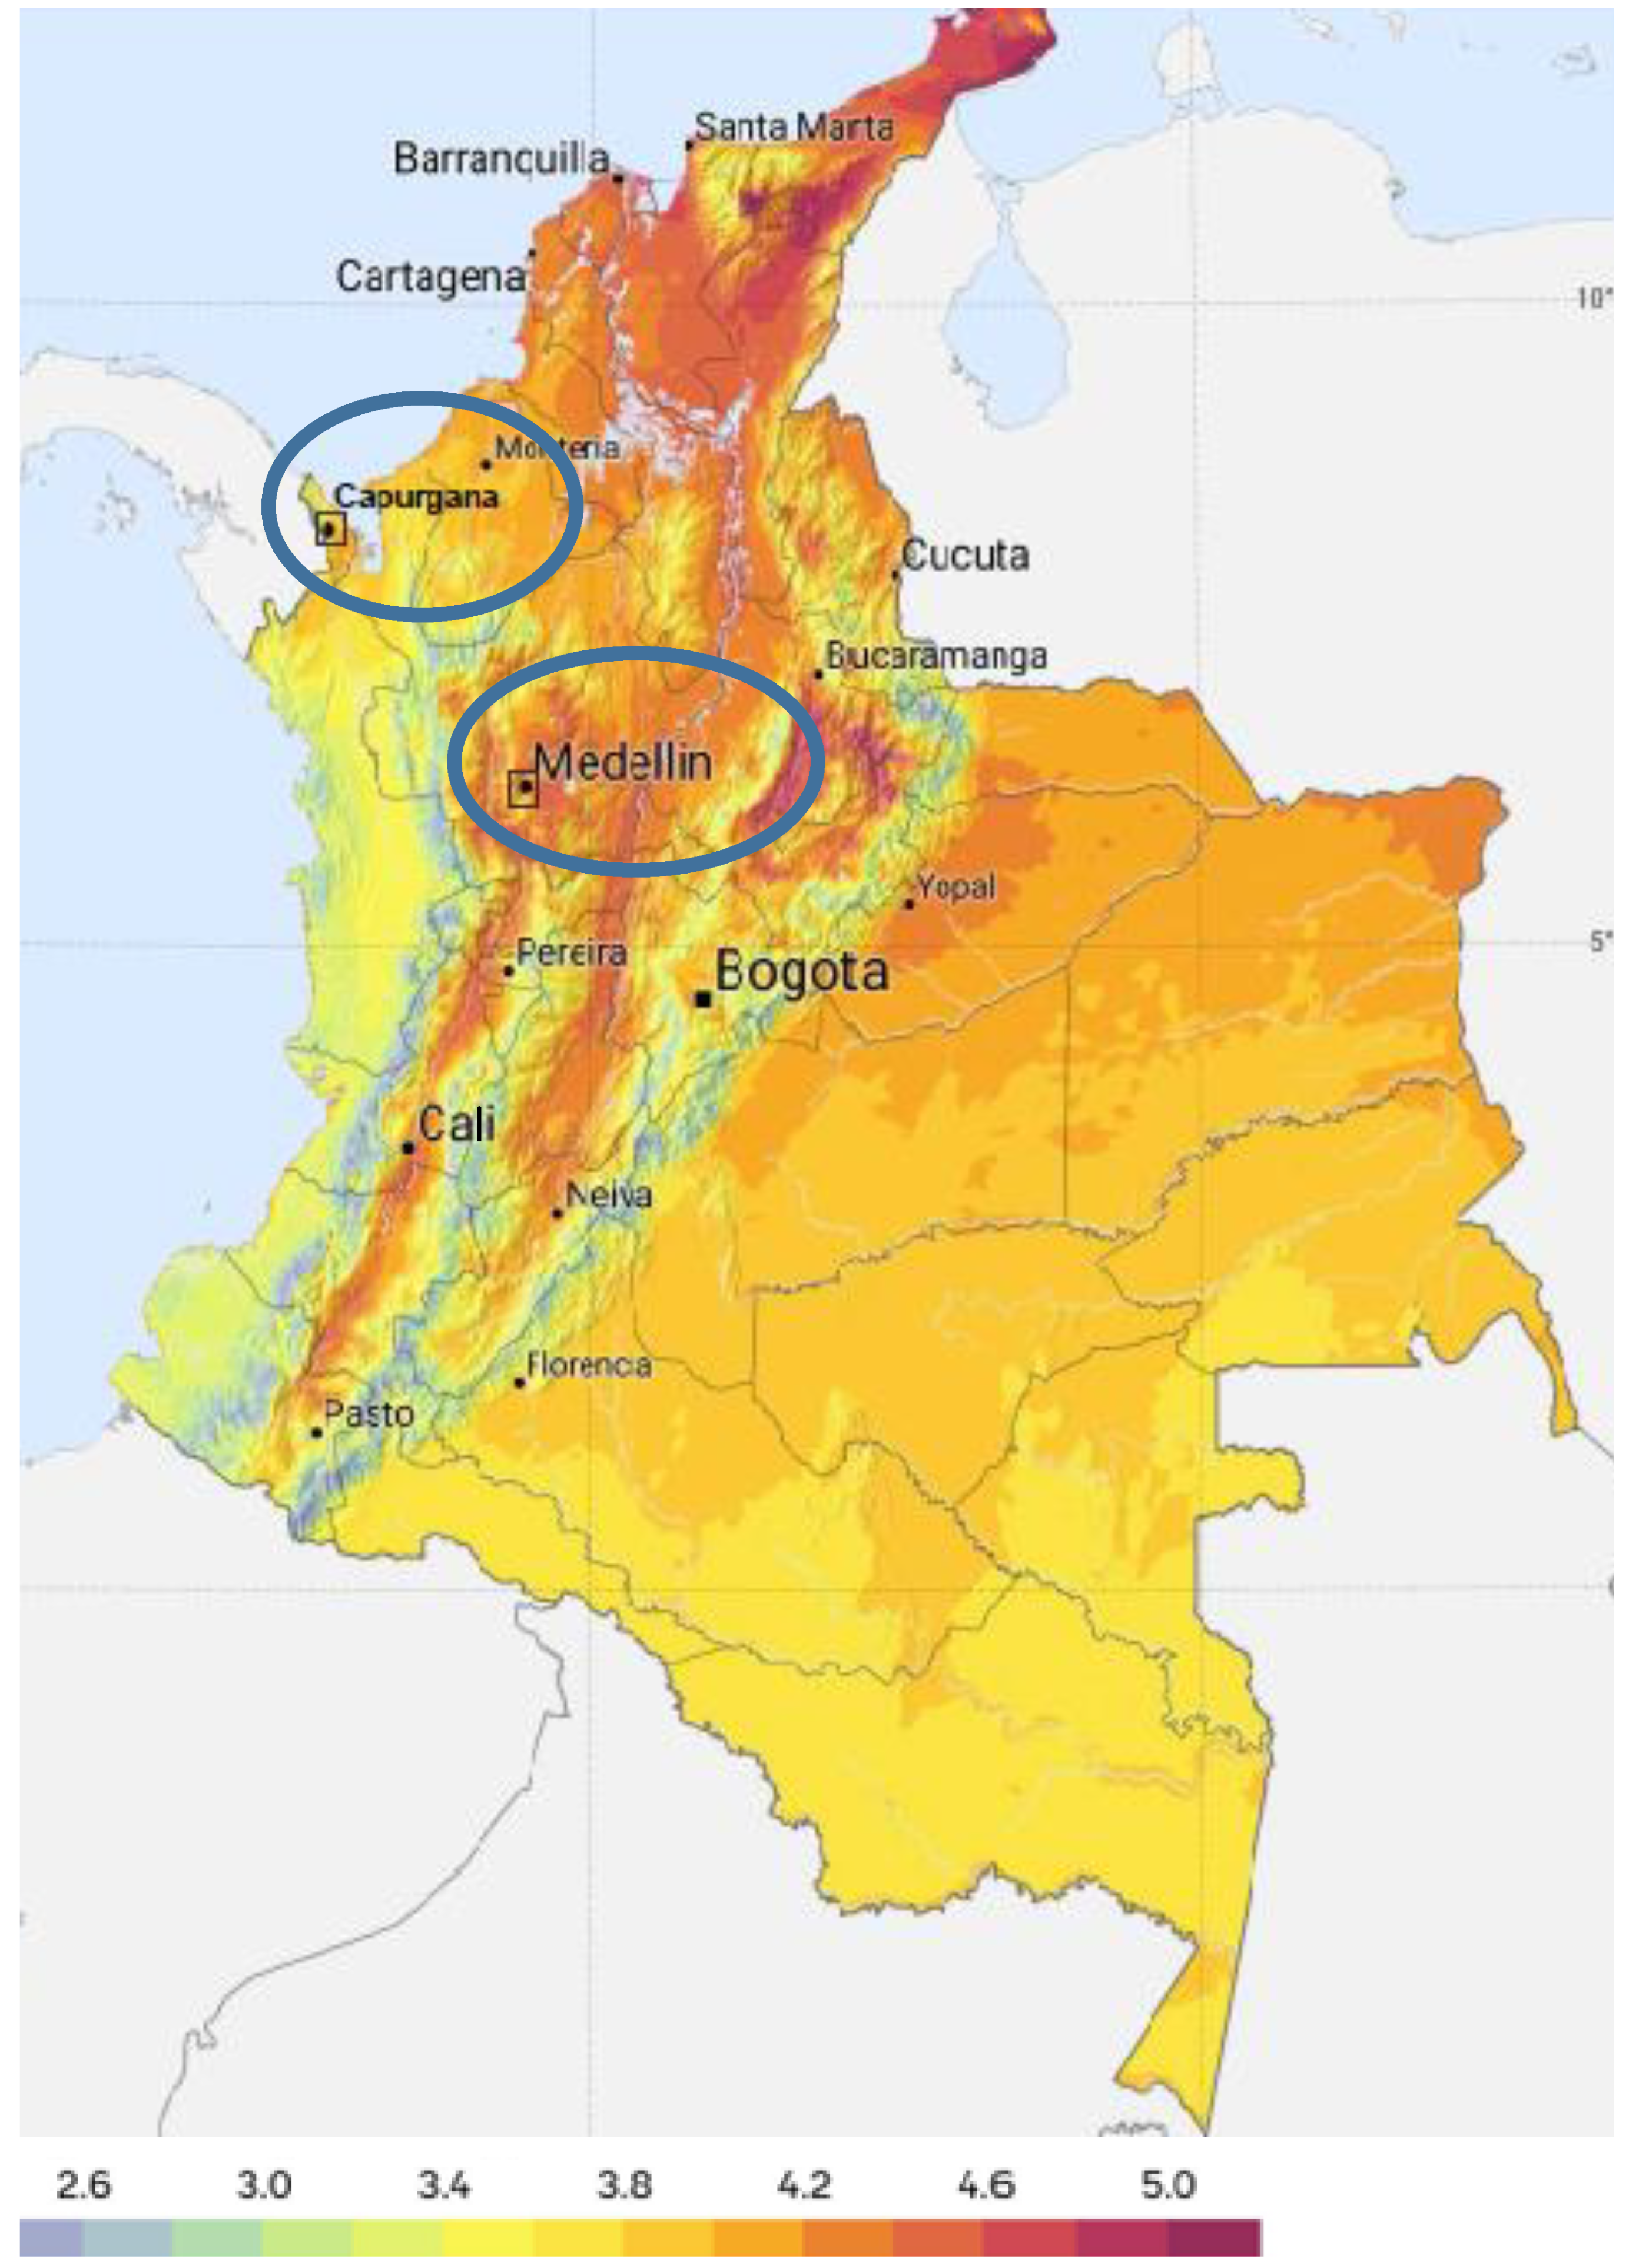
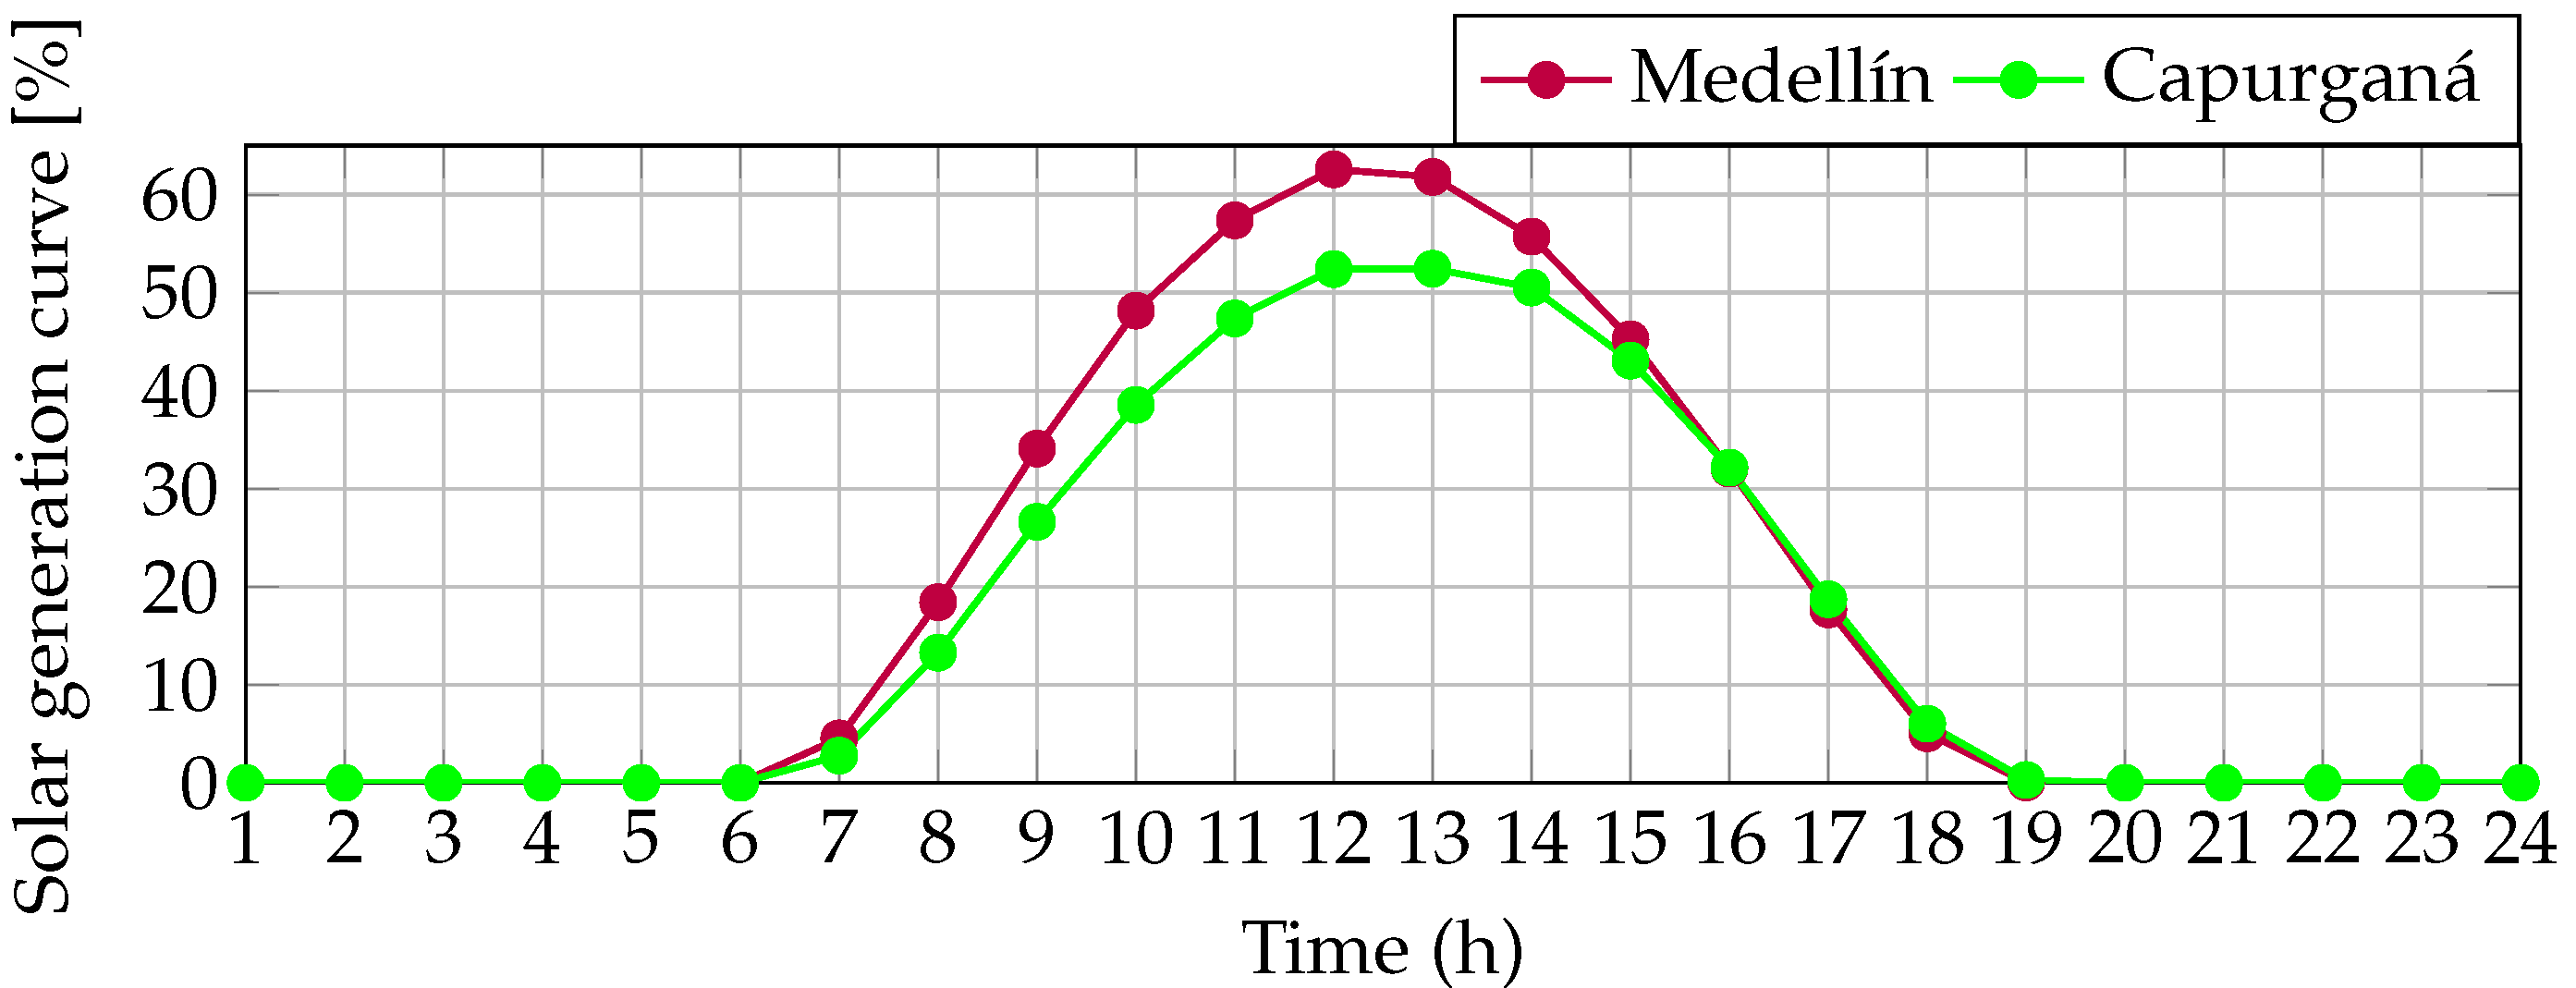
4.1. PV Generation Curves

Considering the solar irradiation and environmental temperature reported for the city of Medellín and the municipality of Capurganá in 2019, as well as the parameters of the polycrystalline PV modules, which is the most widely used PV technology at a global level, the work by [25] determined the percent PV power generation values for the regions under study during an average day of operation (see Figure 3). In this research, these data were used to fix the maximum and minimum PV power generation values for the PV-distributed generators located in the GCN and SN.

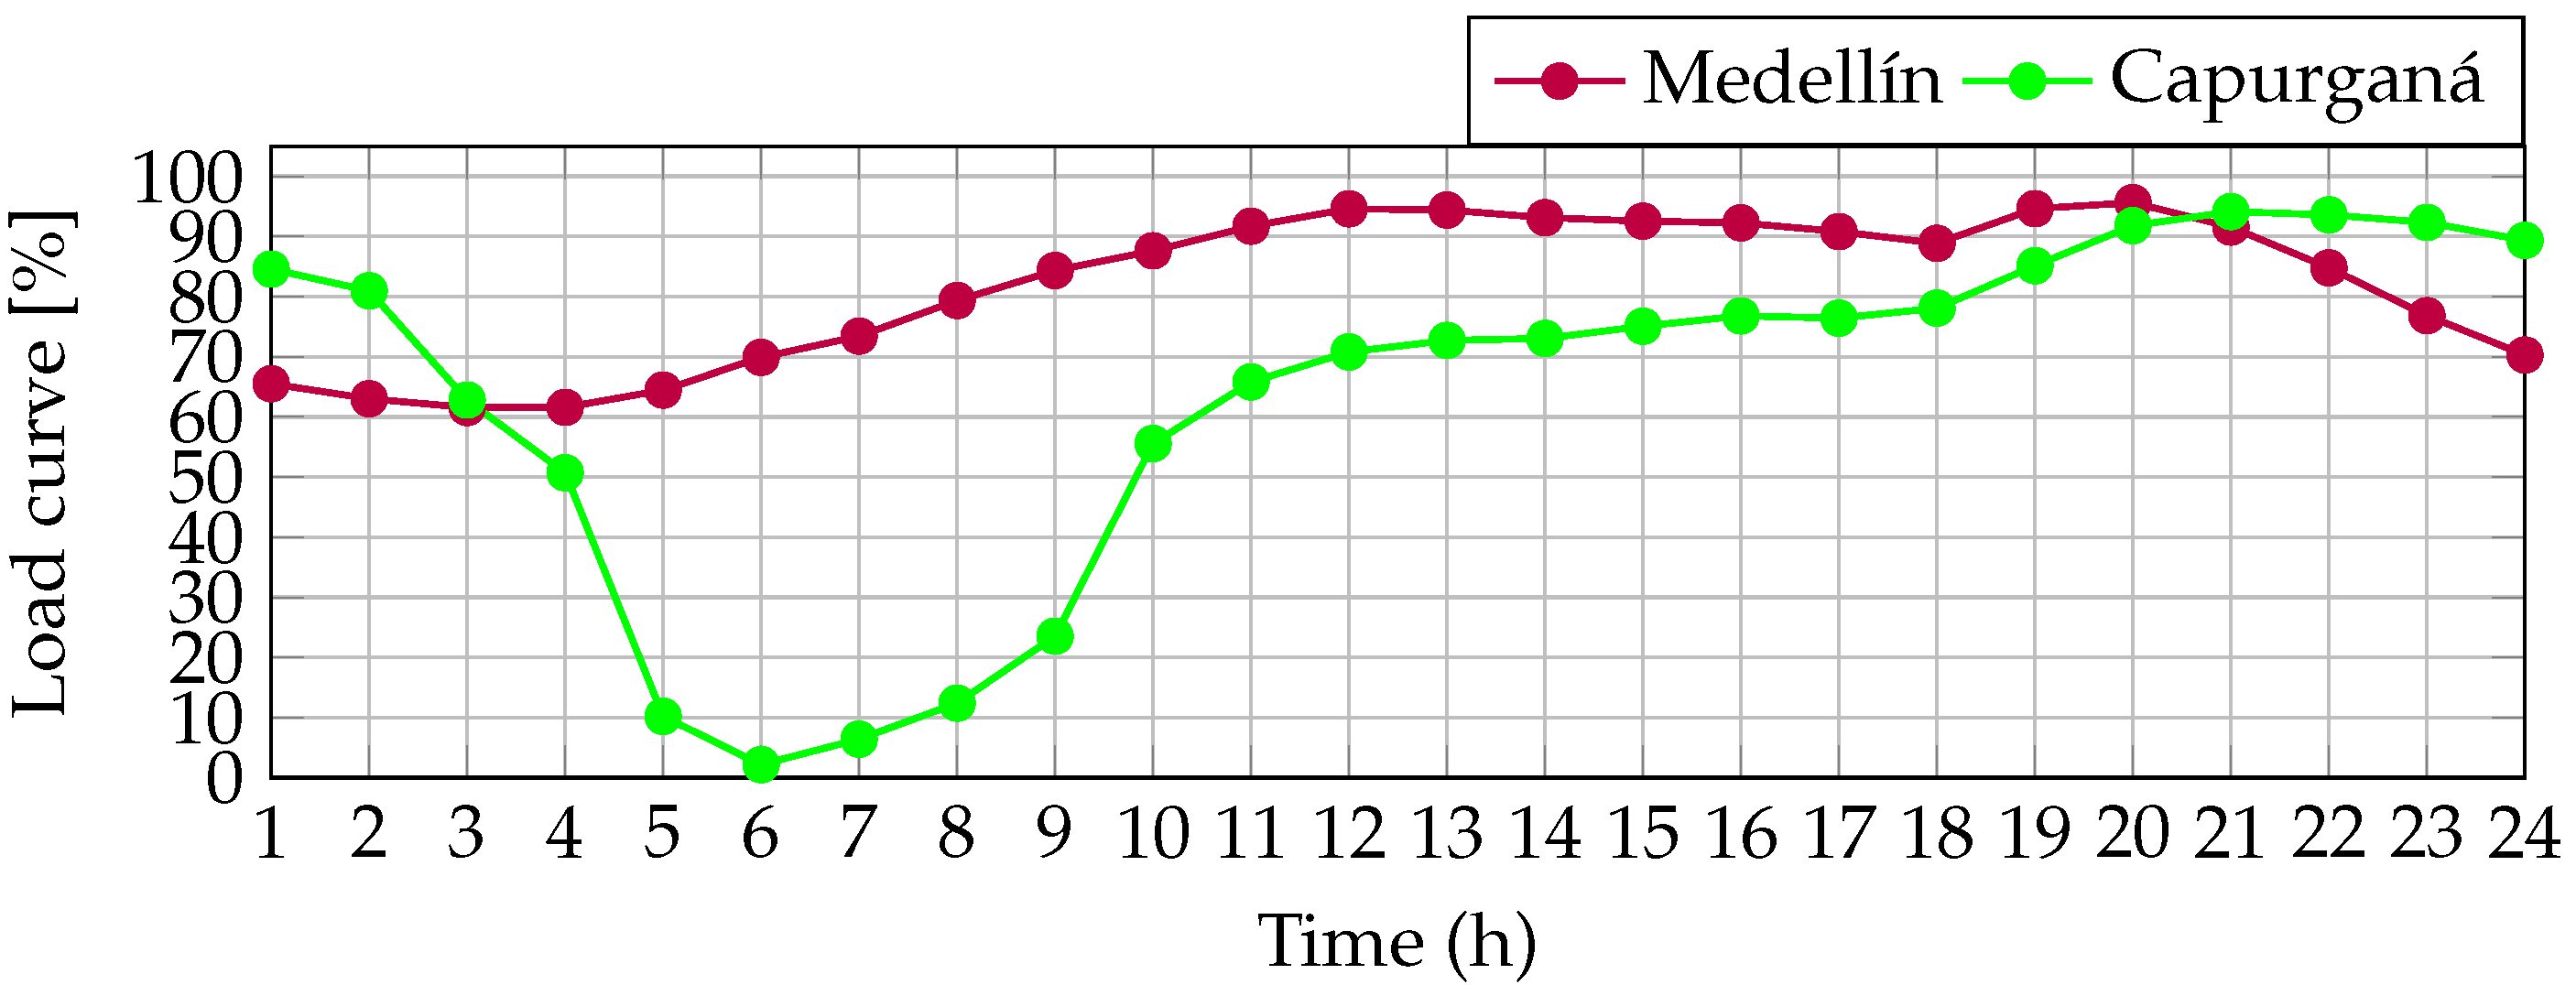
4.2. Power Demand Curves

This subsection presents the demand curves for both test systems used. In both cases, the authors of [25] used the data for 2019, as reported by EPM [34] for the GCN and by IPSE [35] for the SN. The power demand values for an average operation day in the studied regions are illustrated in Figure 4. It becomes important to highlight that the 2019 PV generation and demand data were obtained with the aim to eliminate the effect of the COVID-19 pandemic on the results.

4.3. Test Systems

To evaluate the performance of the ALO, this paper employs two DC test systems: a grid-connected (GCN) and a standalone network (SN). The first one corresponds to the PV generation and demand reported for Medellín, Antioquia, an urban network located in Colombia, and includes the energy costs and grid C O 2 emissions factor of this region, as reported by Empresas Publicas of Medellín (EPS), which is responsible for operating this GCN. The second one corresponds to Capurganám Chocó, a rural network operated with diesel. Both electrical systems are reported in [25].

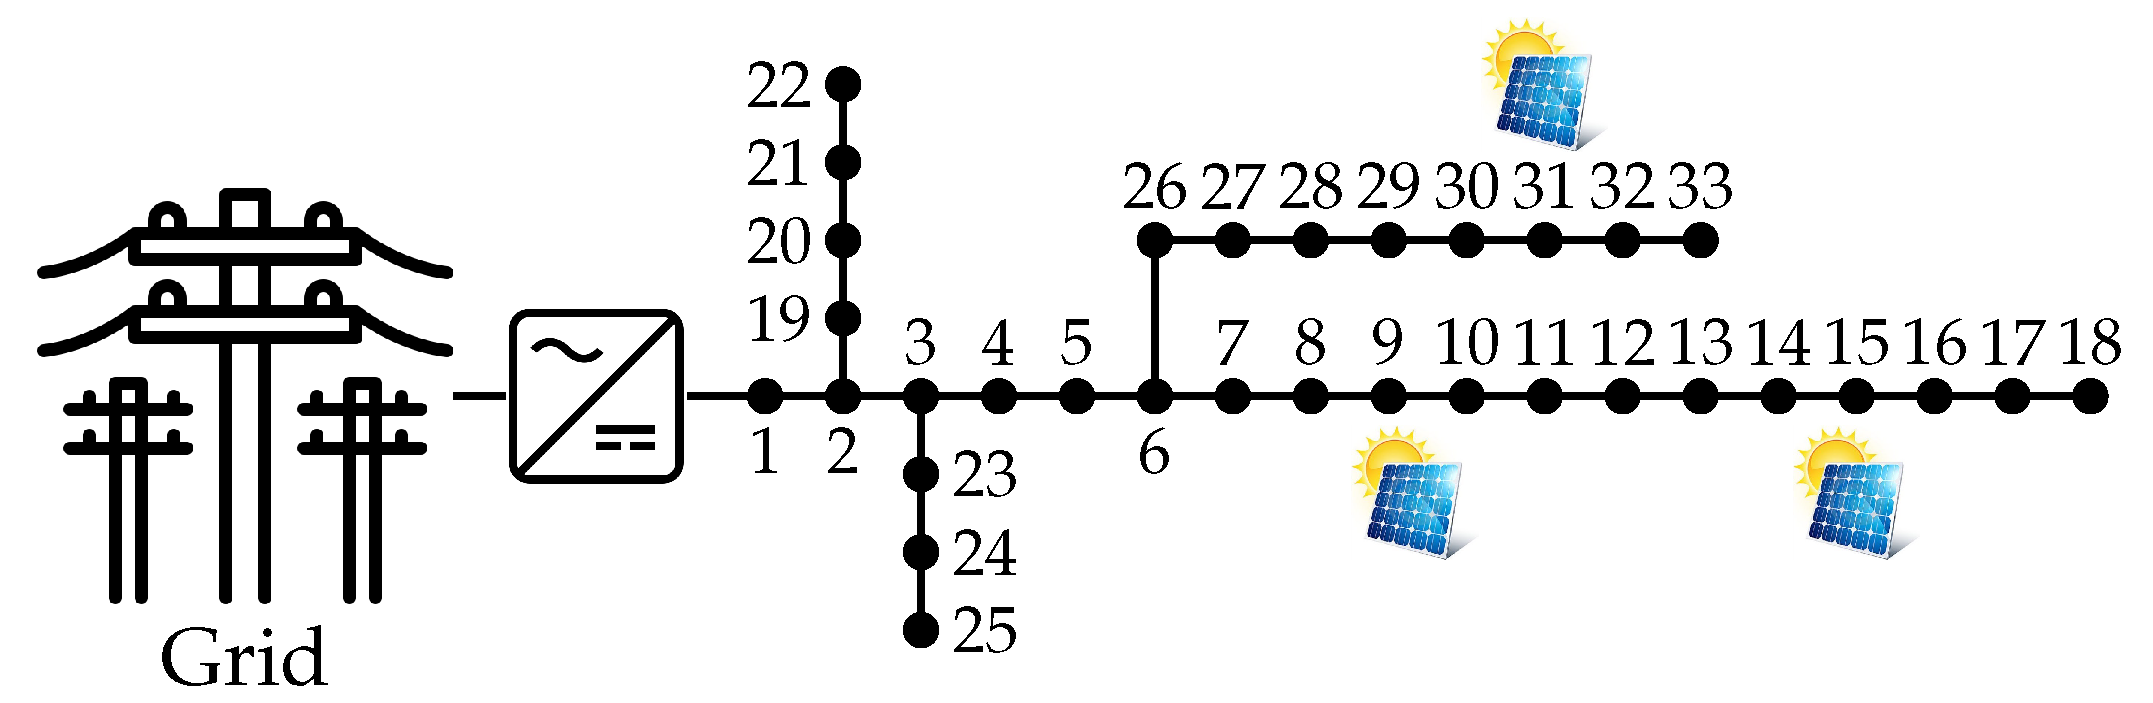
4.4. Grid-Connected Test Feeder

This 33-node test system is presented in Figure 5 and was reported in [21]. It is a DC adaptation of an AC grid. This system has been widely used to solve the optimal power flow problem in both AC and DC networks. It comprises 33 buses and 32 lines, and it has a base voltage of 12.66 kV and a base power of 100 kW. Considering the PV generation and demand of Medellín, this network exhibits losses of 2186.2803 kWh, energy costs of 9776.3892 USD, and greenhouse gas emissions of 12,345.1497 kg C O 2 regarding the base case (without considering PV-DG). The PV-DGs have been installed at nodes 12, 15, and 31, with nominal rates of 2400 kW. The information of this test system is presented in Table 2 as follows: the first column describes the line number; the second and third columns show the output and arrival nodes, respectively; and the fourth, fifth, and sixth columns show the line resistance in O h m s , the power demanded in kW, and the maximum current that supports the conductor in A m p e r s for each line. Is important to highlight that the maximum current values were calculated for the base case according to the NTC 2050 (Colombian Technical Standard), under the assumption that the conductors are able to support a nominal temperature of 60 °C and a telescopic grid.

4.5. Standalone Test Feeder

This test system is depicted in Figure 6. This network has 27 nodes and 26 lines, and it is reported in [44]. Table 3 organizes the information in the same way as Table 2. The values of this system without PV-DGs are a base voltage with a magnitude of 12.66 kV and a base power of 100 kW. The PV-DGs are located at nodes 5, 9, and 19, and each one has a nominal rate of 2400 kW. Considering the PV generation and demand data of Capurganá, Chocó, this network exhibits energy losses of 489.3042 kWh, operational costs of 18,485.0507 USD, and greenhouse gas emissions of 16,951.2974 k g C O 2 regarding the base case (without PV-DG). The maximum current for the lines that make up the electric systems was calculated in the same was as those of the GCN. The electrical data for the SN are presented in Table 3.
Finally, Table 4 describes the parameters used for calculating the economic, technical, and environmental objective functions for the GCN and SN.

4.6. Comparison Methods

In order to validate the effectiveness of the methodology under study, this work used five comparison methodologies published in the literature for the problem addressed herein. They were selected due to their excellent performance in terms of solution quality, repeatability, and processing times. Furthermore, all of these optimization methodologies were tuned using a methodology based on the particle swarm optimization algorithm [45], allowing each of them to offer the best performance. The comparison method Was the crow search algorithm (CSA). This metaheuristic strategy uses the hunting strategy employed by crows with the purpose of solving continuous optimization problems [46]. The second method was another bio-inspired optimization algorithm that takes advantage of the hunting strategies used by birds and fish, i.e., the particle swarm optimization (PSO) algorithm [13]. The third technique was the multiverse optimization algorithm (MVO) [21], which is based on the natural behavior of the universe to solve continuous nonlinear and non-convex problems. The fourth method was the salp swarm algorithm (SSA), which is inspired by the hunting behavior of salps and is used to solve continuous problems [47]. The last optimization method was the vortex search algorithm (VSA), a method that uses the behavior of vortices that form in fluids for exploring the solution space and finding good-quality solutions. Detailed descriptions of each one of the comparison methods used herein are presented in the previously mentioned references.
Table 5 shows the optimization parameters used for the comparison methods.

5. Simulation Results and Discussions

This section contemplates the results obtained by each optimization method for the optimal operation of PV-DGs in the studied GCN and SN, with regard to the energy losses related to the transport of energy through the lines, the operational costs associated with energy purchasing from conventional generators and the maintenance costs of the PV-DGs installed in the DC grid, and the C O 2 emissions generated by the conventional generators. To solve this problem, the proposed ALO and five other optimization methods were used. To make a fair comparison, the same MHPF was used in all solution strategies. Furthermore, these techniques underwent 100 executions in order to evaluate their average solution, standard deviation, and average processing times. Note that all the simulations were conducted using Matlab 2022a on a Dell Precision 3450 workstation with an Intel(R) Core(TM) i9-11900 [email protected] and 64.0 GB RAM running Windows 10 Pro 64-bit.
Table 6 and Table 7 describe the results reported by all solution methods in the grid-connected and standalone DC in terms of the solution, standard deviation, and processing times. Given that the power dispatch of PV systems in DC networks is a multivariable problem with a number of 39 variables (power supplied) for three generators and each objective function analyzed, and due to the solar radiance of Colombia (13 solar hours a day) (Figure 2), in this work, it was not possible to illustrate and explain all solutions obtained by the methodologies used. Because of this, the authors of this paper decided to illustrate the improvements obtained by the proposed solution with regard to the comparison methods by means of Figure 7 and Figure 9. These figures describe, as percentages, the average reduction in objective functions and standard deviation obtained by the ALO. Figure 8 and Figure 10 present the power supplied by the PV distributed generators regarding the best solutions obtained by the ALO in both test scenarios for all objective functions under analysis.

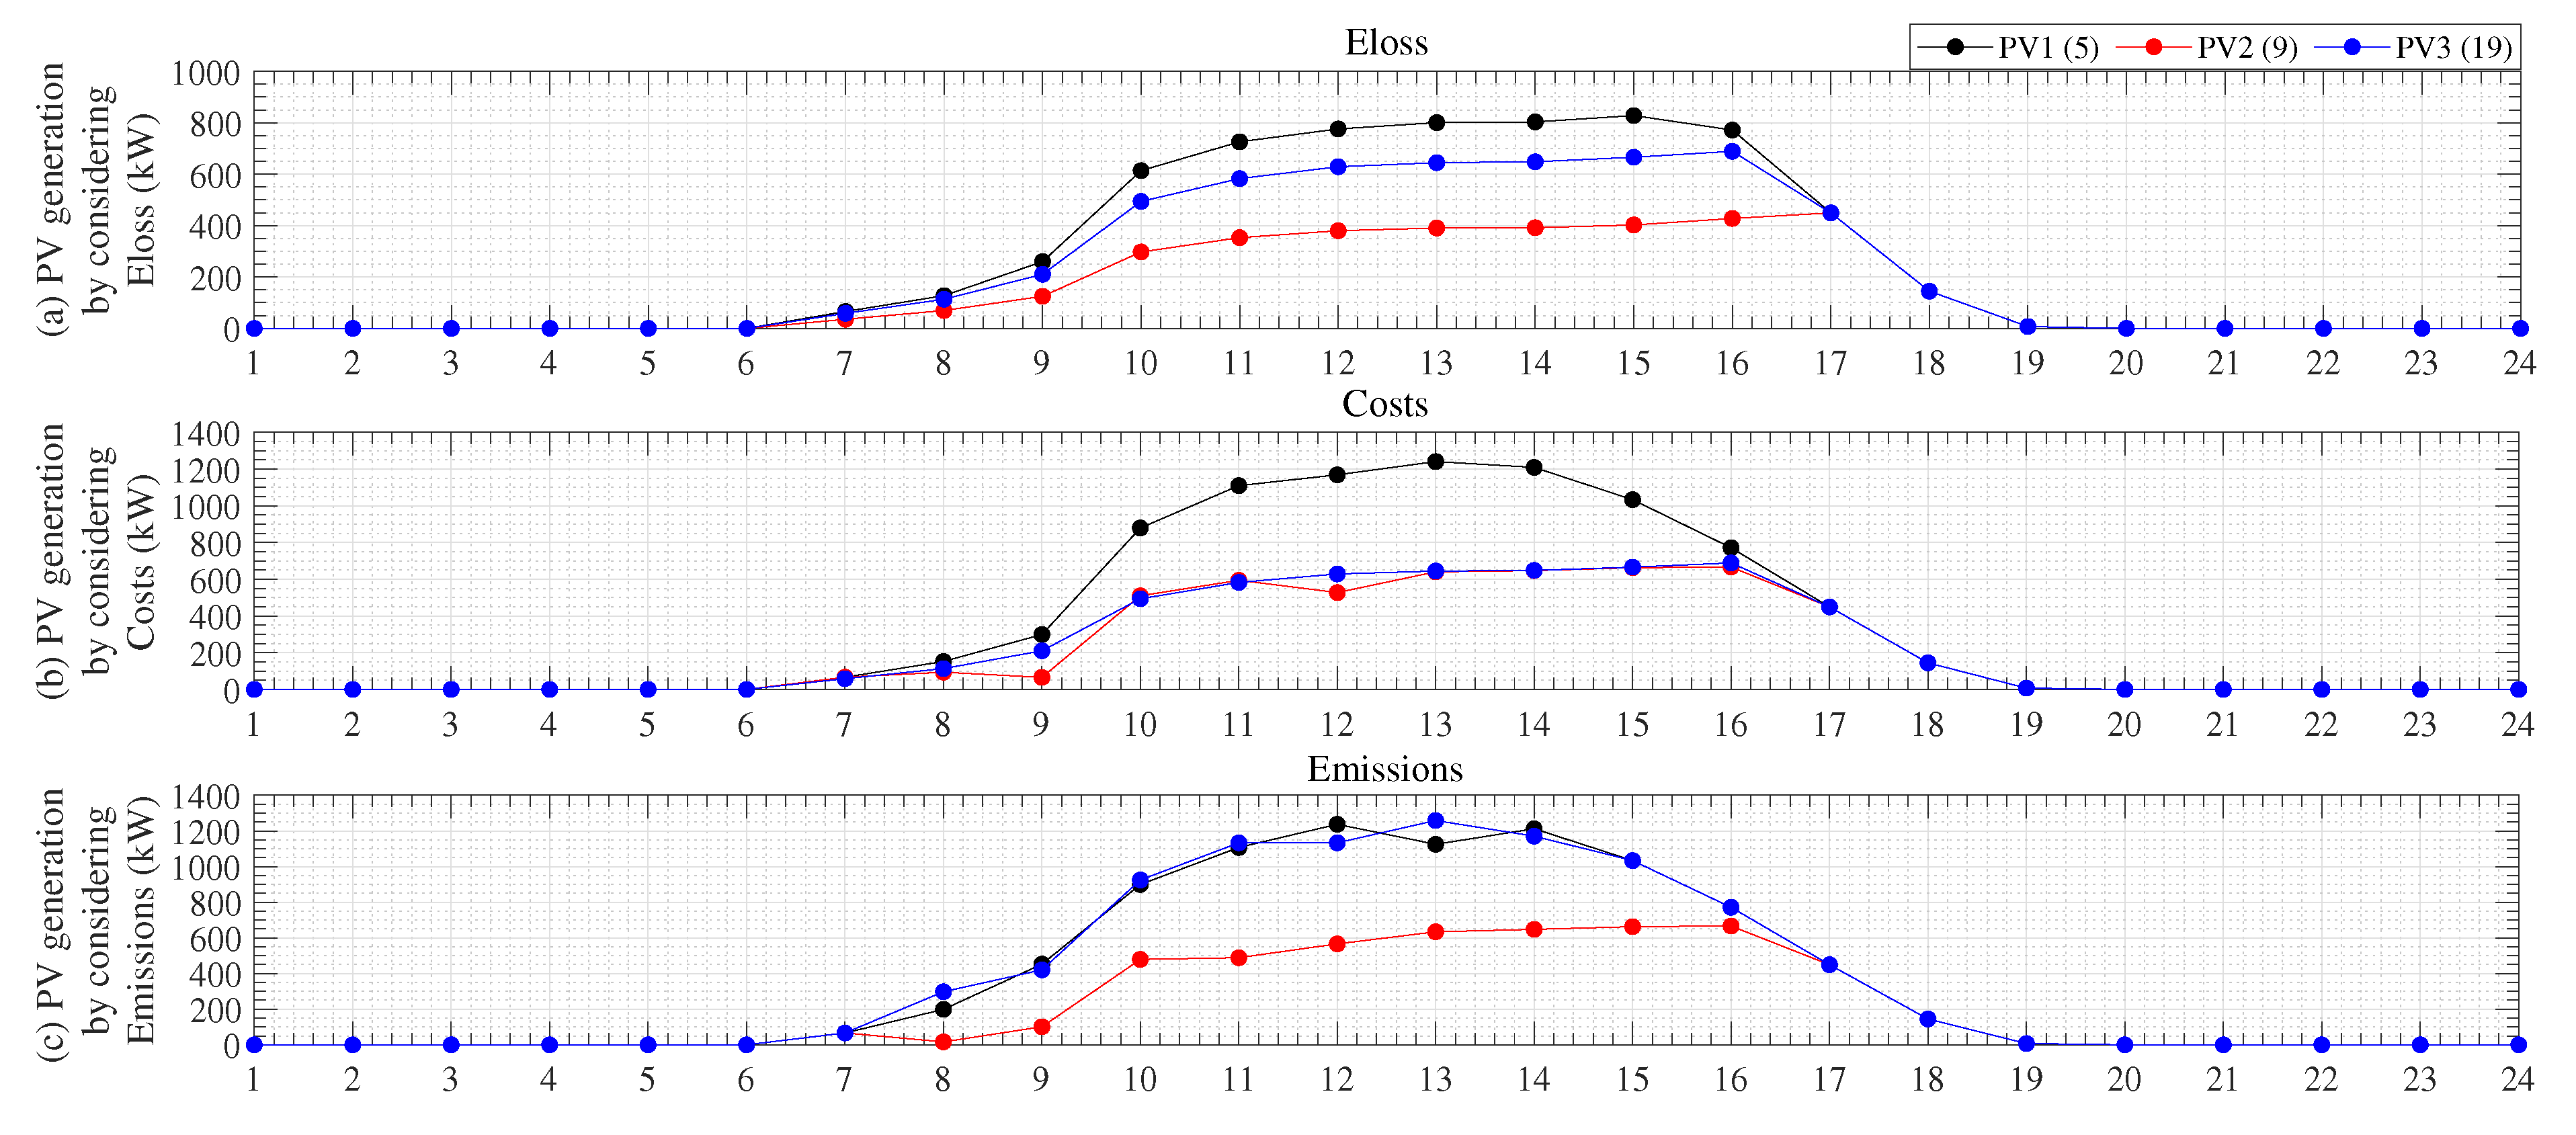
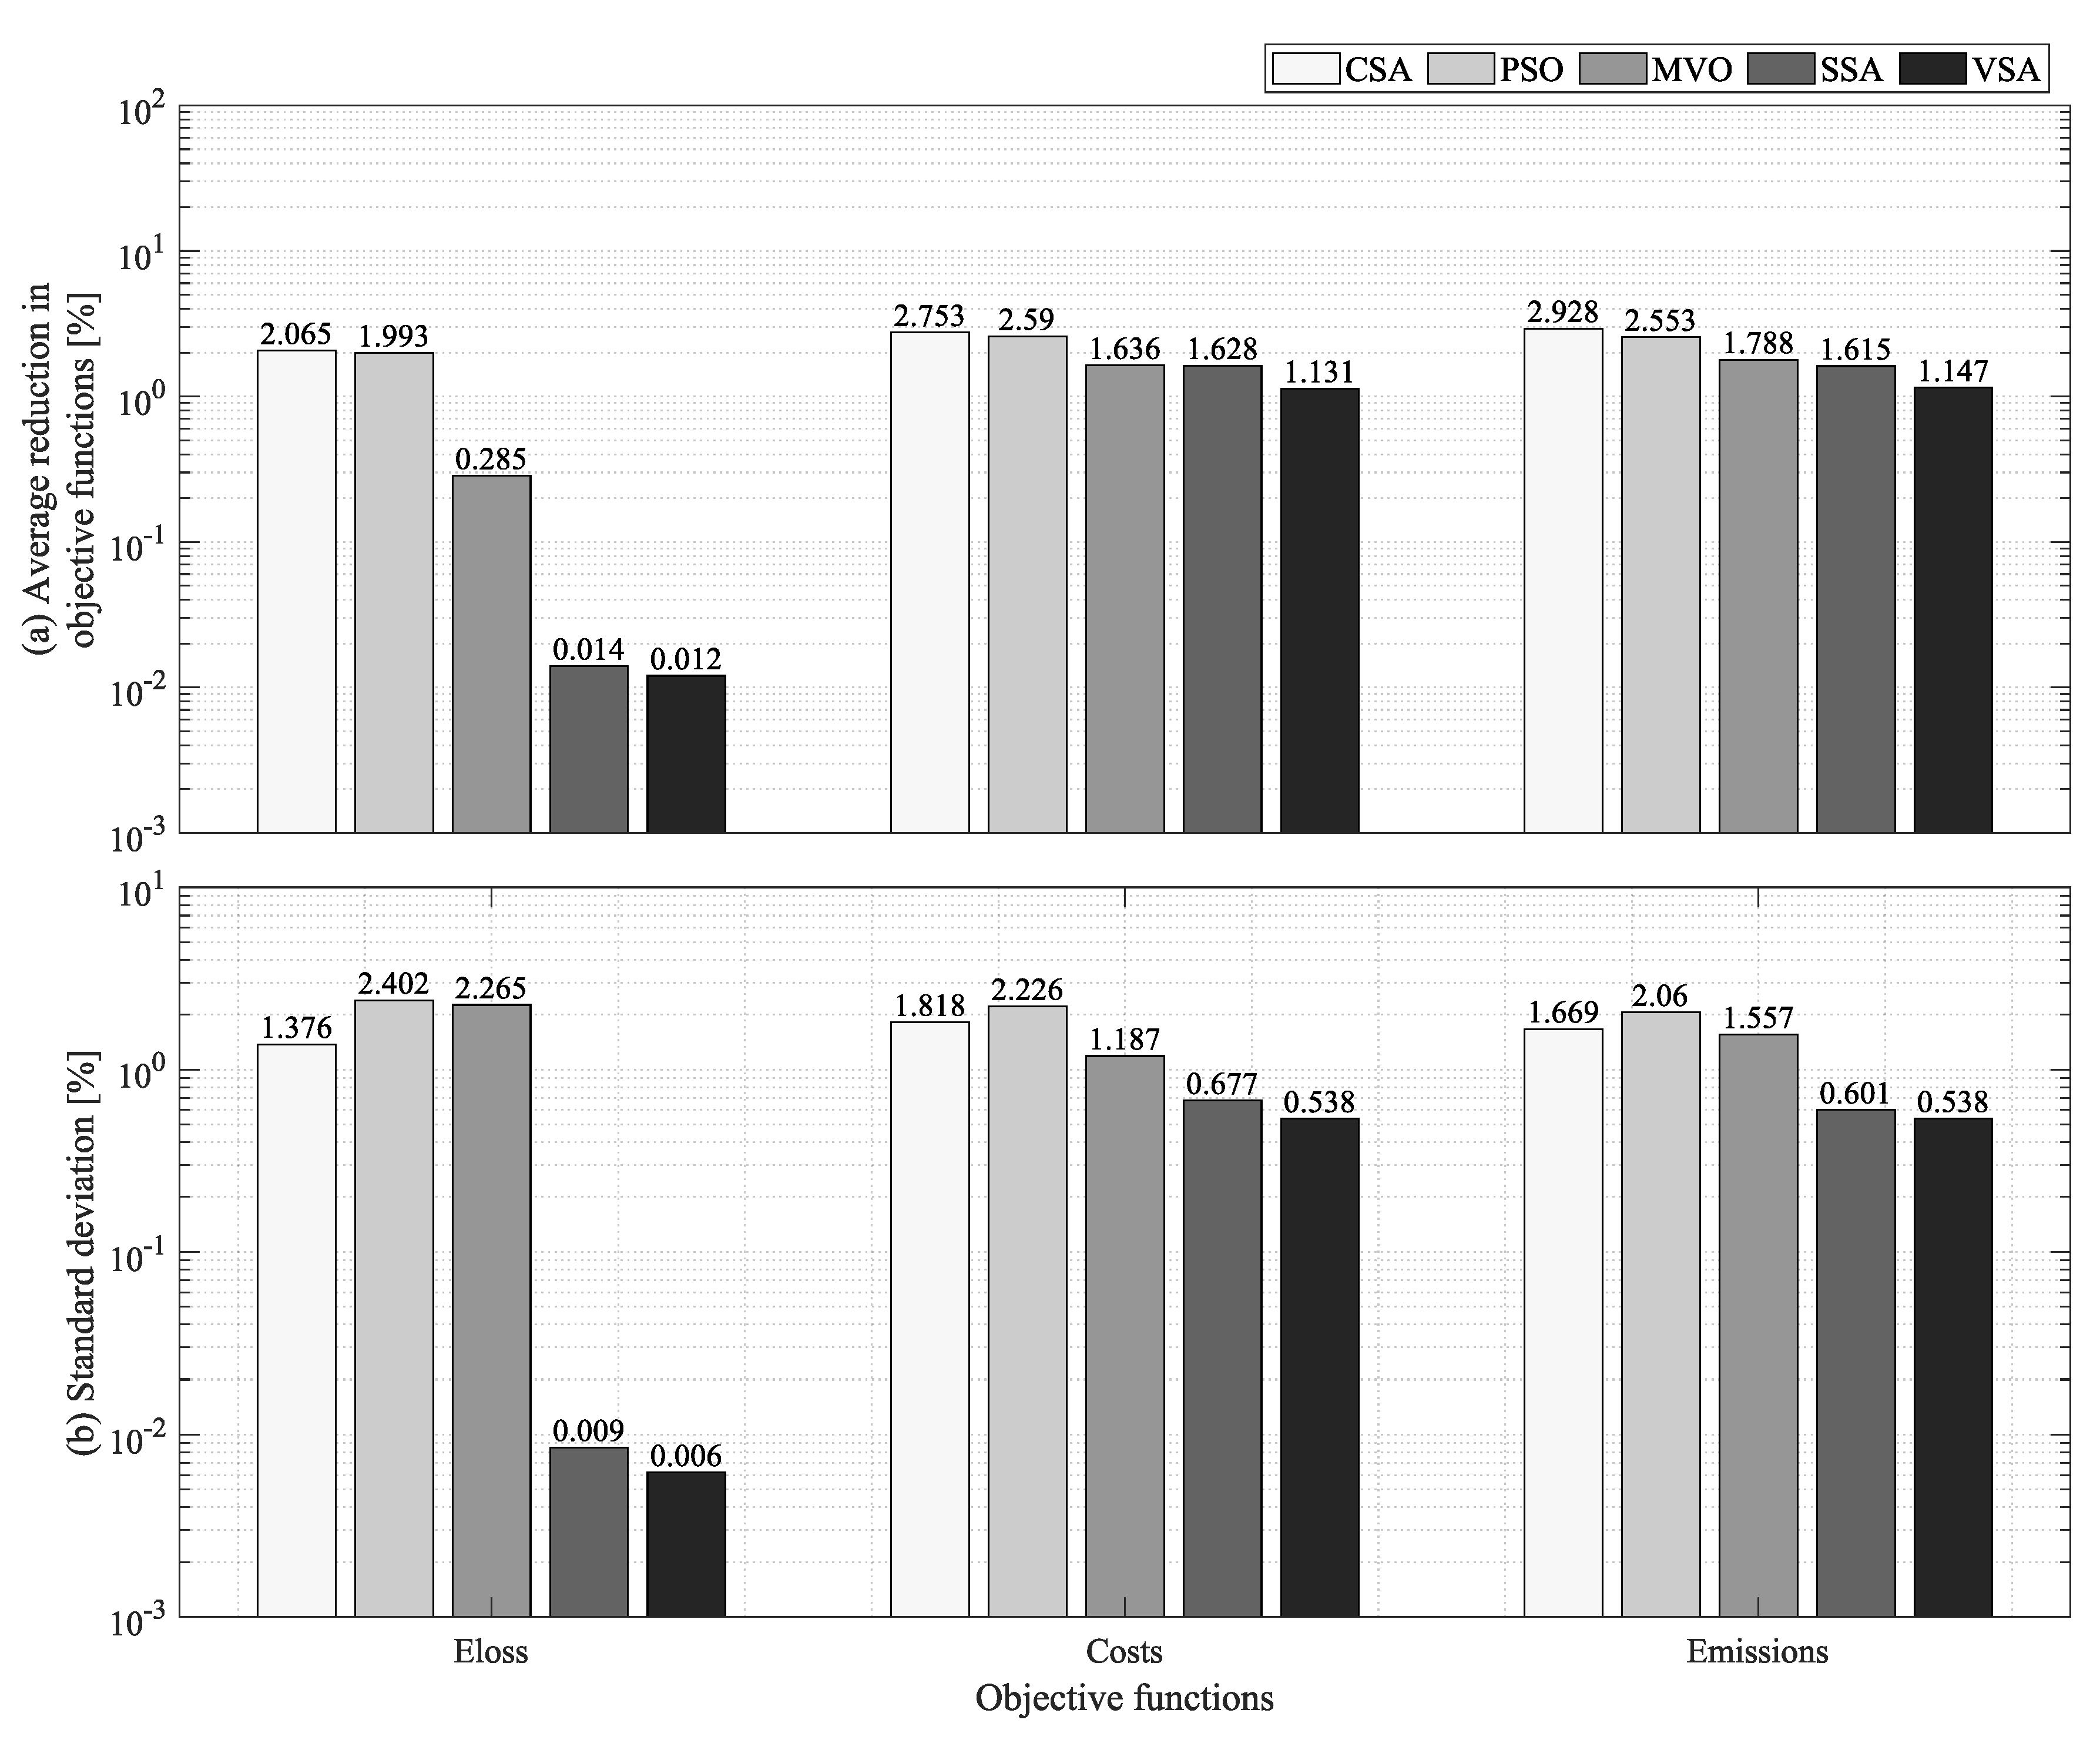
5.1. Standalone Test Feeder

Table 6 presents the results provided by the optimization algorithms regarding the problem under study. This table is organized as follows: the first column shows the optimization algorithms; the second one presents the results obtained in terms of energy losses in kWh ( E l o s s ); the third column shows the results obtained regarding the operating costs in USD ( C o s t s ); and the fourth column presents the C O 2 emitted into the atmosphere in kg of ( E C O 2 ). The first row shows the base case, where E l o s s , C o s t s , and E C O 2 were calculated without considering PV-DG. Then, the analyzed conditions are presented, where the first and second test scenarios correspond to the average solution achieved by the methods regarding the base case, as well as their percent reductions. Finally, the standard deviation obtained by each algorithm after 100 executions is presented, as well as the average processing times required by the methodologies to reach a solution. Using the data presented in Table 6, it is possible to obtain Figure 7, which illustrates the percent reduction obtained by the ALO with respect to the comparison methods, along with the standard deviation reduction for the SN.
Figure 7 is divided in two: Figure 7a and Figure 7b. The former plots the difference in the average solution between the ALO algorithm and the comparison methods. The latter plots the differences between the ALO and the other algorithms with regard to the standard deviation for each objective function employed. In Figure 7a, in terms of energy losses, the ALO obtains the best average solution, with a value of 359.6843 kWh, i.e., a reduction of 26.4907%, surpassing the VSA, the SSA, MVO, PSO, and the CSA by 0.0301, 0.0346, 0.0705, 0.4834, and 1.9436%, respectively. As for the operating costs, the algorithm presented herein obtains a value of 11,962.6688 USD, achieving a reduction of 35.2846% regarding the base case and surpassing the other optimization algorithms by 2.7610% on average. Regarding the C O 2 emissions, the ALO obtains the best average solution, with a value of 10,930.9273 k g C O 2 , which implies a reduction of 35.5157%, surpassing the results obtained by the comparison methods by 2.7551% on average.
As for Figure 7b, for E l o s s , the ALO ranks first, with a standard deviation of 0.0010 , surpassing the VSA, the SSA, MVO, PSO, and the CSA by 0.0203 , 0.0221 , 0.2347 , 0.4086 , and 1.7538 % , respectively. With regard to the operating costs, the proposed algorithm exhibits a standard deviation of 0.0059 % , outperforming the VSA by 0.2983 % , the SSA by 0.4305 % , PSO by 1.7652 % , the CSA by 2.3019 % , and MVO by 2.4242 % . As for the reduction of C O 2 emissions, the ALO obtains the lowest standard deviation, with a value of 0.0032 % , surpassing the VSA, with 0.2886 % ; the SSA, with 0.4329 % ; PSO, with 1.6491 % ; MVO, with 2.0192 % ; and the CSA, with 2.1093 % . The discussion and results presented above demonstrate that the ALO is superior when it comes to solving the problem regarding the optimal operation of PV-DGs in standalone DC networks for the three objective functions employed in terms of its average solution and standard deviation. Therefore, it is possible to state that the proposed algorithm is the best methodology to solve the problem addressed in terms of solution quality, as it guarantees high-quality solutions every time that the algorithm is executed.
Finally, it must be highlighted that, in light of the implementation of the proposed fitness function, all solutions obtained by the different solution methods guarantee that the set of constraints representing the problem is observed. The ALO reported longer processing times, with an average of 56.78 s, when the three different objective functions were evaluated. However, it is important to note that this time is low when it comes to obtaining the schematic for a whole day of operation. Furthermore, the time spent by the ALO ensures the best results in terms of solution quality, demonstrating that this optimization method best explores the solution space with regard to the technical, economical, and environmental aspects evaluated for SN in this paper.
Finally, with the aim to demonstrate the PV power behavior of the PV-DGs in the standalone system by using the proposed methodology, Figure 8 is presented, where it is possible to identify that, for each objective function, the power level supplied by each PV-DG is different for each period of time analyzed. Furthermore, in all scenarios analyzed by this figure, the PV-DGs operate at different power levels to the MPP, thus demonstrating that MPP operation is not always good for standalone networks and validating the hypothesis of this study.

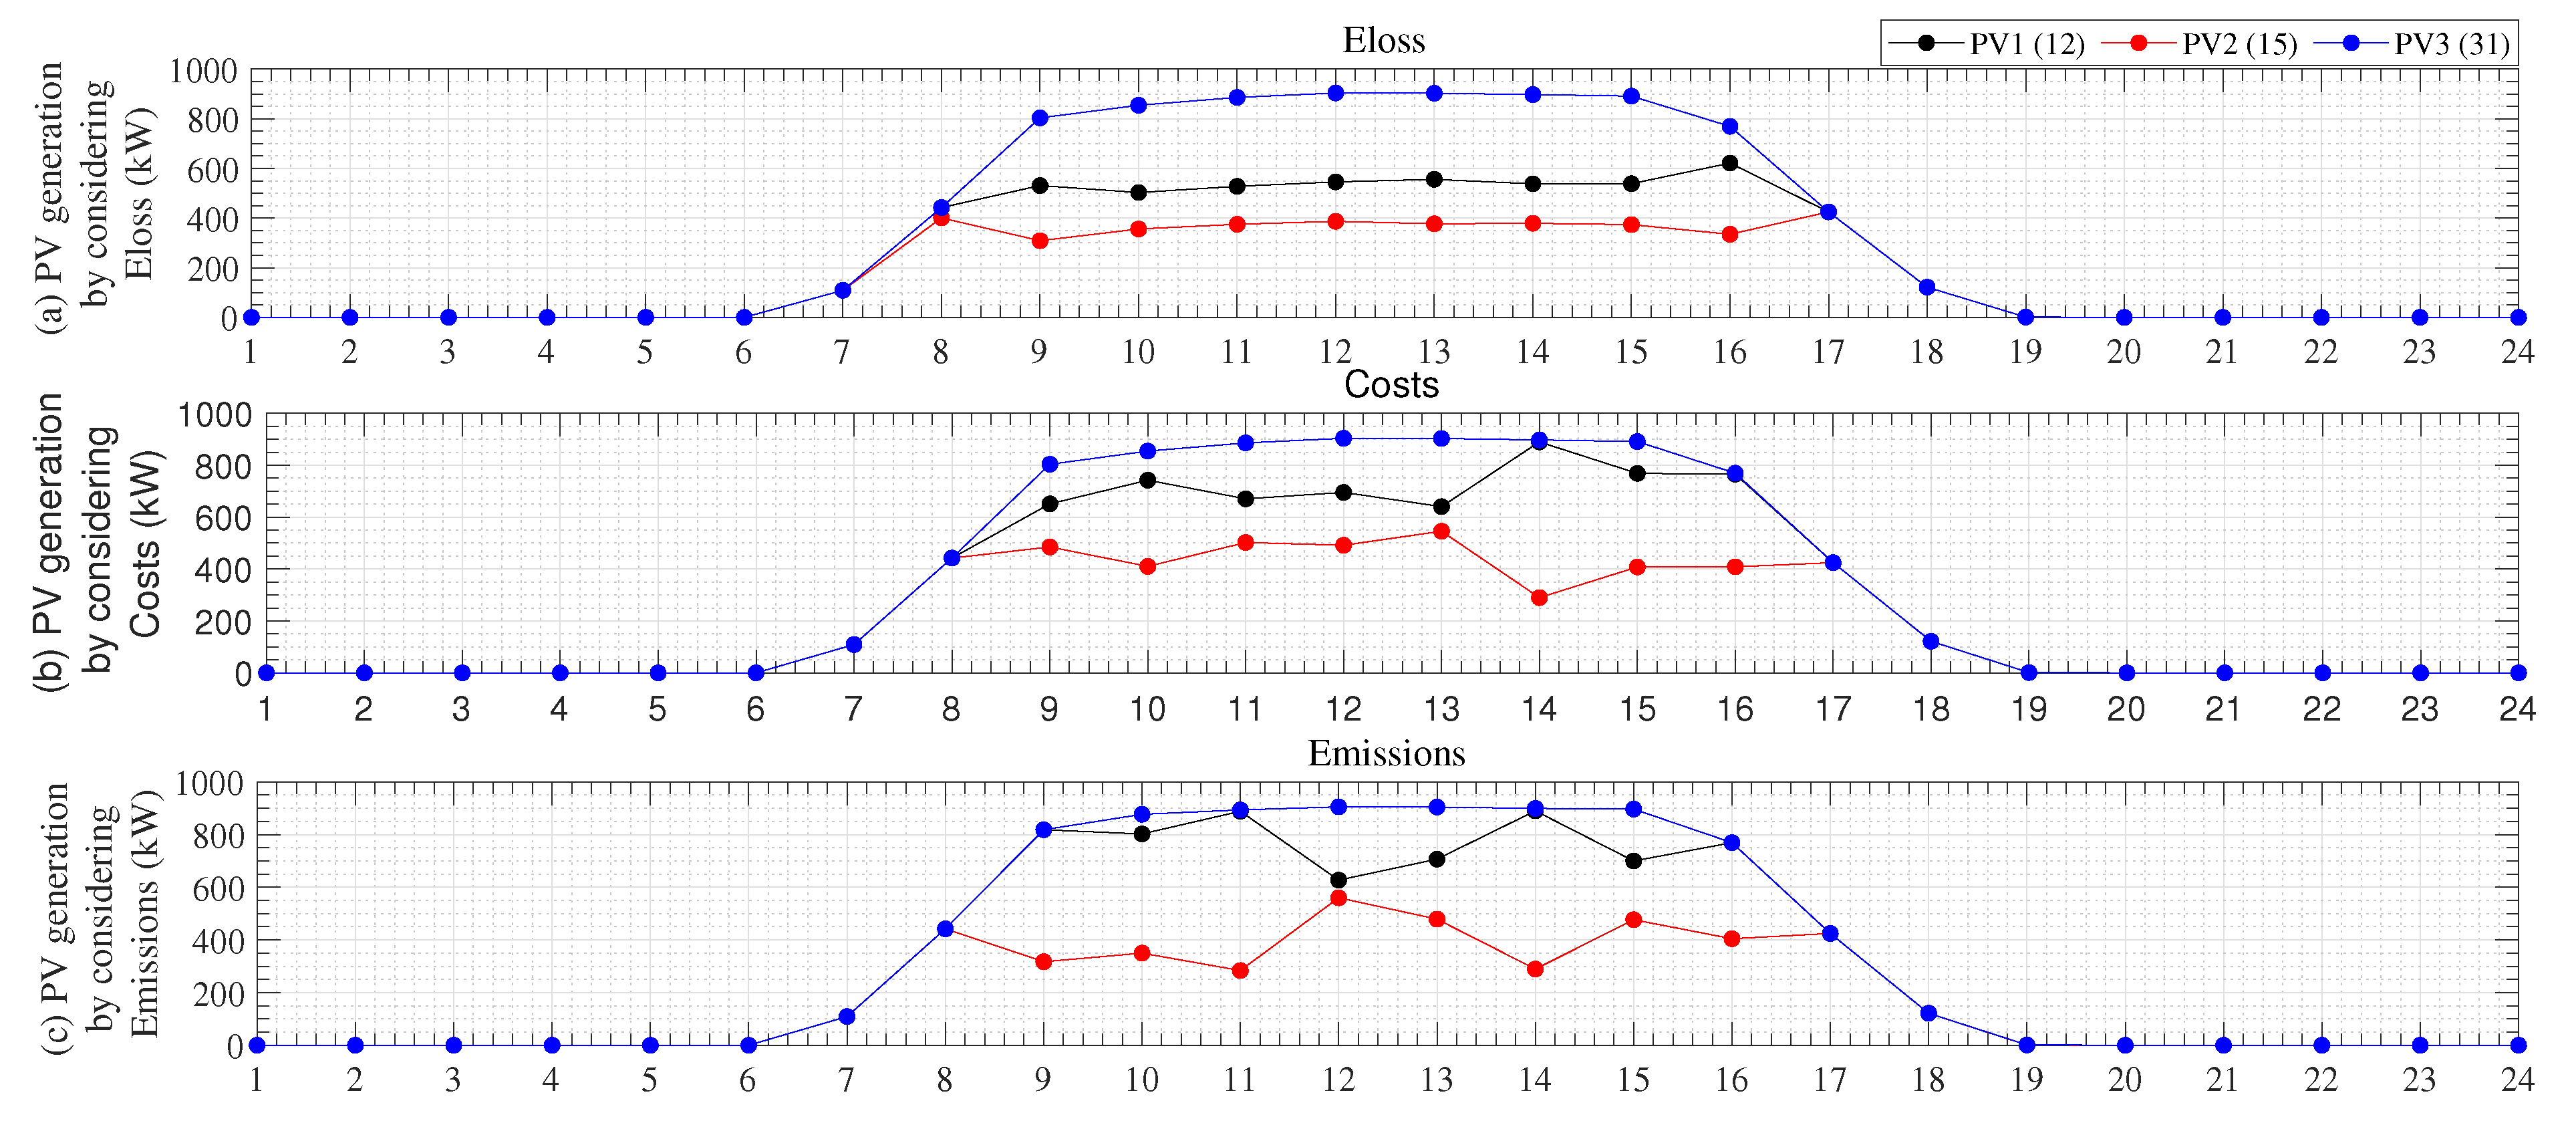
5.2. Grid-Connected Test Feeder

Table 7 compares the results provided by the optimization algorithms regarding the studied problem in the GCN. Note that Table 7 is organized as Table 6. Using the data presented in said table, Figure 9 can be obtained, which plots the results obtained by the comparison methods vs. those of the ALO for each objective function in terms of percent reduction and standard deviation regarding the base case.
By analyzing Figure 9a, it is possible to state the superiority of the ALO against the comparison methods in terms of its average solution. Regarding E l o s s , the ALO exhibits total energy losses 1225.0193 kWh, achieving a reduction of 43.9679 with regard to the base case and surpassing the VSA by 0.0124 % , the SSA by 0.0143 % , MVO by 0.2851 % , PSO by 1.9932 % , and the CSA by 2.0646 % . As for the costs, the proposed algorithm reaches a value of 7138.8122 USD, i.e., a reduction of 26.9791 regarding the base case, outperforming the VSA by 1.1310 % , the SSA by 1.6280 % , MVO by 1.6356 % , PSO by 2.5902 % , and the CSA by 2.7525 % . In the case of E C O 2 , the ALO obtains a reduction of 27.3621 % with regard to the base case, which makes it the best solution strategy, with an average reduction of 2.0064 % in comparison with the other optimization methodologies.
Figure 9b analyzes the standard deviation reported by all optimization methodologies after 100 executions. Regarding E l o s s , the proposed algorithm shows a percentage of 0.0046 , ranking first and outperforming the VSA, the SSA, the CSA, MVO, and PSO, with values of 0.0108 % , 0.0131 % , 1.3806 % , 2.2694 % , and 2.4065 % , respectively. As for the costs, the ALO obtains a standard deviation value of 0.0319 % , surpassing the comparison algorithms by 1.2892 % on average. In the case of E C O 2 , the ALO exhibits a standard deviation of 0.0296 % , outperforming the VSA, the SSA, MVO, the CSA, and PSO by 0.5380 , 0.6009 , 1.5571 , 1.6691 , and 2.0595 % , respectively. Through an analysis of the results discussed above, it can be noted that the ALO is the methodology that yields the best average solution with regard to all objective functions. Moreover, the algorithm achieved the lowest standard deviation for the analyzed GCN, which allows it to obtain excellent solutions for each objective function every time it is executed. It is important to highlight, as with the SN, all solutions satisfy the set of constraints that constitute the DC GCN.
Similar to Figure 8 for the standalone grid, Figure 8 illustrates the power supplied by the different PV-DGs located in the grid-connected network regarding the different technical, economical, and environmental objective functions used. It can be observed that all PV-DGs operate under power conditions different to MPP. This is done with the aim to obtain the best possible solution and satisfy the technical and operative constraints that constitute the problem. Furthermore, in this figure, it can be noted that, in this test system, the dynamics of the PV power vary more than in the standalone grid, given the variation in demand and constraints associated with the region where the electrical network is operated.

5.3. Average Processing Times

This subsection discusses the average processing time required by each optimization algorithm to solve the problem regarding the optimal operation of PV-DGs in standalone and grid-connected DC systems (Table 6 and Table 7). In the SN, the ALO exhibits an average processing time of 56.78 s, ranking sixth with regard to the comparison algorithms. The fastest methodologies are MVO and PSO, but their high speed entails low-quality solutions, as that they are trapped in local optima.
Regarding the GCN (Table 7), it can be observed that the studied algorithm obtains an average processing time of 60.4 s. In this case, the ALO also ranks sixth with respect to the other methodologies. The fastest algorithms are MVO and PSO, but this short processing time also entails an inadequate exploration of the solution space, so their efficiency is lower in comparison with the ALO for all objective functions analyzed.
Note that the ALO takes longer to find the solution, but this additional time is used to escape from local optima, allowing this algorithm to find the best average solution in each one of the scenarios analyzed. It is also important to keep in mind that the time spent by the ALO is low when it comes to obtaining a scheme for a whole operation day (24 h).

6. Conclusions and Future Work

This paper delved into the problem regarding the optimal power dispatch of PV-DGs in DC standalone and grid-connected networks while considering the PV distributed generation, power demand, energy costs, and emissions factor of Capurganá and Medellín (Colombia). Three objective functions were considered: the energy losses related to the transport of energy across the system, the operating costs associated with the maintenance of PV-DGs and energy purchasing, and the C O 2 emissions generates by the conventional generators. These objective functions were modeled within a mathematical formulation that describes the problem by considering all the technical and operating constraints associated with DC networks. To solve this problem, a master–slave methodology was used, whose master stage corresponds to an optimization algorithm based on sequential programming (the antlion optimizer), while the slave stage involves the matrix hourly power flow method based on successive approximations. This document used five optimization algorithms (CSA, PSO, MVO, SSA, and VSA) for comparison, which were selected from the literature due to their high-quality results in solving optimal power flow problems. Each algorithm was tuned via PSO so that they could offer the best solutions for each objective function.
The results obtained for the GCN and SN demonstrate that the ALO achieved the best solutions for each objective function evaluated in terms of their average solution and standard deviation (repeatability). In the SN, the ALO obtained the best average solutions, surpassing the comparison methods regarding E l o s s , costs, and emissions by 0.5124 , 2.7610 , and 2.7551 % , respectively. As for the standard deviation, the proposed methodology obtained average reductions of 0.4879 , 1.4440 , and 1.2976 % regarding the other solution methodologies. In the GCN, the ALO obtained average reductions of 0.8739 , 1.9475 , and 2.0064 % regarding E l o s s , costs, and emissions, respectively. The proposed method achieved a standard deviation value of 0.0221 % in the three objective functions, outperforming the comparison methodologies by 1.2115 % ( E l o s s ), 1.2892 % (costs), and 1.2849 % (emissions) on average. Note that the ALO is the best-performing solution methodology for improving the technical, economical, and environmental conditions of DC grid-connected and standalone networks. Moreover, the excellent standard deviation reported by the ALO allows it to find high-quality solutions each time it is executed.
Finally, the ALO required longer processing times, with an average time of 58.62 s for both test systems. However, the time spent by the ALO guarantees the best results in terms of solution quality (maximum reduction of objective function and repeatability), demonstrating an excellent exploration of the solution space. Furthermore, because this optimization method requires a processing time lower than 1 min for a whole day of operation, this value is still considered to be low for energy management systems. Therefore, this master–slave strategy generated (ALO and MHPF) can be regarded as the most effective methodology reported so far for solving the problem of optimal power dispatch of PV-distributed generators in DC grids. It is important to obtain a methodology with excellent performance regarding the solution, repeatability, and processing times which allows the operator or electrical owner to evaluate multiple scenarios of generation and demand in short processing times and identify the most suitable operation points for the electrical grid.
As future work, new effective methodologies could be proposed for solving the problem addressed in this research, considering the implementation of parallel processing tools to reduce processing times. Furthermore, distributed wind and photovoltaic generators could be implemented which interact with energy storage elements for connected and isolated grids, with the purpose of improving the technical, economical, and environmental conditions of these systems. Here, energy storage systems would be entrusted with mitigating the variability associated with renewable energy resources. In addition, multi-objective optimization algorithms could be proposed in order to analyze several conflicting objective functions, such as the investment costs related to distributed energy resources and the reduction of operating costs, in addition to economical and environmental indices. Finally, by using the proposed methodology, multiple scenarios of generation and demand could be executed with the aim to obtain data for studying and applying machine learning models. This is a smart way to achieve resilient and autonomous DC grids by enhancing their technical, economical, and environmental conditions.

Author Contributions

Conceptualization, methodology, software, and writing (review and editing), L.F.G.-N., A.A.R.-M. and O.D.M. All authors have read and agreed to the published version of the manuscript.

Funding

This research received no external funding.

Institutional Review Board Statement

Not applicable.

Informed Consent Statement

Not applicable.

Data Availability Statement

No new data were created or analyzed in this study. Data sharing is not applicable to this article.

Conflicts of Interest

The authors declare no conflict of interest.

References

  1. Hernandez, J.; Velasco, D.; Trujillo, C. Analysis of the effect of the implementation of photovoltaic systems like option of distributed generation in Colombia. Renew. Sustain. Energy Rev. 2011, 15, 2290–2298. [Google Scholar] [CrossRef]
  2. Dong, J.; Feng, T.T.; Sun, H.X.; Cai, H.X.; Li, R.; Yang, Y. Clean distributed generation in China: Policy options and international experience. Renew. Sustain. Energy Rev. 2016, 57, 753–764. [Google Scholar] [CrossRef]
  3. Boumaiza, A.; Sanfilippo, A.; Mohandes, N. Modeling multi-criteria decision analysis in residential PV adoption. Energy Strategy Rev. 2022, 39, 100789. [Google Scholar] [CrossRef]
  4. Zhao, Z.Y.; Zhang, S.Y.; Hubbard, B.; Yao, X. The emergence of the solar photovoltaic power industry in China. Renew. Sustain. Energy Rev. 2013, 21, 229–236. [Google Scholar] [CrossRef]
  5. Chang, G.W.; Chinh, N.C. Coyote optimization algorithm-based approach for strategic planning of photovoltaic distributed generation. IEEE Access 2020, 8, 36180–36190. [Google Scholar] [CrossRef]
  6. Singh, G.K. Solar power generation by PV (photovoltaic) technology: A review. Energy 2013, 53, 1–13. [Google Scholar] [CrossRef]
  7. Solargis Solar Resource Maps of Colombia. Available online: https://solargis.com/maps-and-gis-data/download/colombia (accessed on 22 November 2022).
  8. Rakhshani, E.; Rouzbehi, K.J.; Sánchez, A.; Tobar, A.C.; Pouresmaeil, E. Integration of large scale PV-based generation into power systems: A survey. Energies 2019, 12, 1425. [Google Scholar] [CrossRef] [Green Version]
  9. Díaz González, J.J. Viabilidad Regulatoria para Implementar Sistemas de Micro Redes Con Fuentes No Convencionales de Energía Renovable–FNCER–por Intercolombia SAESP. 2018. Available online: http://bibliotecavirtualoducal.uc.cl/vufind/Record/oai:localhost:10185-28863 (accessed on 24 January 2023).
  10. Moreno, C.; Milanes, C.B.; Arguello, W.; Fontalvo, A.; Alvarez, R.N. Challenges and perspectives of the use of photovoltaic solar energy in Colombia. Int. J. Electr. Comput. Eng. 2022, 12, 4521–4528. [Google Scholar] [CrossRef]
  11. De Brito, M.A.G.; Galotto, L.; Sampaio, L.P.; e Melo, G.d.A.; Canesin, C.A. Evaluation of the main MPPT techniques for photovoltaic applications. IEEE Trans. Ind. Electron. 2012, 60, 1156–1167. [Google Scholar] [CrossRef]
  12. Mishra, V.L.; Chauhan, Y.K.; Verma, K. A critical review on advanced reconfigured models and metaheuristics-based MPPT to address complex shadings of solar array. Energy Convers. Manag. 2022, 269, 116099. [Google Scholar] [CrossRef]
  13. Grisales-Noreña, L.F.; Montoya, O.D.; Ramos-Paja, C.A. An energy management system for optimal operation of BSS in DC distributed generation environments based on a parallel PSO algorithm. J. Energy Storage 2020, 29, 101488. [Google Scholar] [CrossRef]
  14. Li, C.; De Bosio, F.; Chen, F.; Chaudhary, S.K.; Vasquez, J.C.; Guerrero, J.M. Economic dispatch for operating cost minimization under real-time pricing in droop-controlled DC microgrid. IEEE J. Emerg. Sel. Top. Power Electron. 2016, 5, 587–595. [Google Scholar] [CrossRef] [Green Version]
  15. Younes, Z.; Alhamrouni, I.; Mekhilef, S.; Reyasudin, M. A memory-based gravitational search algorithm for solving economic dispatch problem in micro-grid. Ain Shams Eng. J. 2021, 12, 1985–1994. [Google Scholar] [CrossRef]
  16. Tan, Q.; Ding, Y.; Ye, Q.; Mei, S.; Zhang, Y.; Wei, Y. Optimization and evaluation of a dispatch model for an integrated wind-photovoltaic-thermal power system based on dynamic carbon emissions trading. Appl. Energy 2019, 253, 113598. [Google Scholar] [CrossRef]
  17. Gao, S.; Jia, H.; Marnay, C. Techno-economic evaluation of mixed AC and DC power distribution network for integrating large-scale photovoltaic power generation. IEEE Access 2019, 7, 105019–105029. [Google Scholar] [CrossRef]
  18. Lin, J.C.W.; Liu, Q.; Fournier-Viger, P.; Hong, T.P.; Voznak, M.; Zhan, J. A sanitization approach for hiding sensitive itemsets based on particle swarm optimization. Eng. Appl. Artif. Intell. 2016, 53, 1–18. [Google Scholar] [CrossRef]
  19. Lin, J.C.W.; Yang, L.; Fournier-Viger, P.; Wu, J.M.T.; Hong, T.P.; Wang, L.S.L.; Zhan, J. Mining high-utility itemsets based on particle swarm optimization. Eng. Appl. Artif. Intell. 2016, 55, 320–330. [Google Scholar] [CrossRef]
  20. Spea, S.R. Combined economic emission dispatch solution of an isolated renewable integrated micro-grid using crow search algorithm. In Proceedings of the 2019 21st International Middle East Power Systems Conference (MEPCON), Cairo, Egypt, 17–19 December 2019; pp. 47–52. [Google Scholar]
  21. Rosales-Muñoz, A.A.; Grisales-Noreña, L.F.; Montano, J.; Montoya, O.D.; Perea-Moreno, A.J. Application of the multiverse optimization method to solve the optimal power flow problem in direct current electrical networks. Sustainability 2021, 13, 8703. [Google Scholar] [CrossRef]
  22. Velasquez, O.S.; Montoya Giraldo, O.D.; Garrido Arevalo, V.M.; Grisales Norena, L.F. Optimal power flow in direct-current power grids via black hole optimization. Adv. Electr. Electron. Eng. 2019, 17, 24–32. [Google Scholar] [CrossRef]
  23. Rosales Muñoz, A.A.; Grisales-Noreña, L.F.; Montano, J.; Montoya, O.D.; Giral-Ramírez, D.A. Optimal Power Dispatch of Distributed Generators in Direct Current Networks Using a Master–Slave Methodology That Combines the Salp Swarm Algorithm and the Successive Approximation Method. Electronics 2021, 10, 2837. [Google Scholar] [CrossRef]
  24. Garzon-Rivera, O.; Ocampo, J.; Grisales-Noreña, L.; Montoya, O.; Rojas-Montano, J. Optimal power flow in Direct Current Networks using the antlion optimizer. Stat. Optim. Inf. Comput. 2020, 8, 846–857. [Google Scholar] [CrossRef]
  25. Grisales-Noreña, L.F.; Ocampo-Toro, J.A.; Rosales-Muñoz, A.A.; Cortes-Caicedo, B.; Montoya, O.D. An Energy Management System for PV Sources in Standalone and Connected DC Networks Considering Economic, Technical, and Environmental Indices. Sustainability 2022, 14, 16429. [Google Scholar] [CrossRef]
  26. Grisales-Noreña, L.F.; Ramos-Paja, C.A.; Gonzalez-Montoya, D.; Alcalá, G.; Hernandez-Escobedo, Q. Energy management in PV based microgrids designed for the Universidad Nacional de Colombia. Sustainability 2020, 12, 1219. [Google Scholar] [CrossRef] [Green Version]
  27. Gbadamosi, S.L.; Nwulu, N.I. Optimal power dispatch and reliability analysis of hybrid CHP-PV-wind systems in farming applications. Sustainability 2020, 12, 8199. [Google Scholar] [CrossRef]
  28. Luna, A.C.; Diaz, N.L.; Andrade, F.; Graells, M.; Guerrero, J.M.; Vasquez, J.C. Economic power dispatch of distributed generators in a grid-connected microgrid. In Proceedings of the 2015 9th International Conference on Power Electronics and ECCE Asia (ICPE-ECCE Asia), Seoul, Korea, 1–5 June 2015; pp. 1161–1168. [Google Scholar]
  29. Gil-González, W.; Montoya, O.D.; Holguín, E.; Garces, A.; Grisales-Noreña, L.F. Economic dispatch of energy storage systems in dc microgrids employing a semidefinite programming model. J. Energy Storage 2019, 21, 1–8. [Google Scholar] [CrossRef]
  30. Grisales-Noreña, L.F.; Rosales-Muñoz, A.A.; Cortés-Caicedo, B.; Montoya, O.D.; Andrade, F. Optimal Operation of PV Sources in DC Grids for Improving Technical, Economical, and Environmental Conditions by Using Vortex Search Algorithm and a Matrix Hourly Power Flow. Mathematics 2023, 11, 93. [Google Scholar] [CrossRef]
  31. Lin, C.W.; Hong, T.P.; Yang, K.T.; Wang, S.L. The GA-based algorithms for optimizing hiding sensitive itemsets through transaction deletion. Appl. Intell. 2015, 42, 210–230. [Google Scholar] [CrossRef]
  32. Lin, J.C.W.; Zhang, Y.; Zhang, B.; Fournier-Viger, P.; Djenouri, Y. Hiding sensitive itemsets with multiple objective optimization. Soft Comput. 2019, 23, 12779–12797. [Google Scholar] [CrossRef]
  33. NASA. NASA Prediction of Worldwide Energy Resources, Washington, DC, United States. Available online: https://power.larc.nasa.gov/ (accessed on 21 September 2022).
  34. XM SA ESP. Sinergox Database, Colombia. Available online: https://sinergox.xm.com.co/Paginas/Home.aspx (accessed on 21 September 2022).
  35. Instituto de Planificación y Promoción de Soluciones Energéticas para Zonas No Interconectadas. Informes Mensuales de Telimetría, Colombia. Available online: https://ipse.gov.co/cnm/informe-mensuales-telemetria/ (accessed on 21 September 2022).
  36. Zolghadr-Asli, B.; Bozorg-Haddad, O.; Chu, X. Crow search algorithm (CSA). In Advanced Optimization by Nature-Inspired Algorithms; Springer: Berlin/Heidelberg, Germany, 2018; pp. 143–149. [Google Scholar]
  37. Kennedy, J.; Eberhart, R. Particle swarm optimization. In Proceedings of the ICNN’95-International Conference on Neural Networks, Perth, WA, Australia, 27 November–1 December 1995; Volume 4, pp. 1942–1948. [Google Scholar]
  38. Mirjalili, S.; Mirjalili, S.M.; Hatamlou, A. Multi-verse optimizer: A nature-inspired algorithm for global optimization. Neural Comput. Appl. 2016, 27, 495–513. [Google Scholar] [CrossRef]
  39. Mirjalili, S.; Gandomi, A.H.; Mirjalili, S.Z.; Saremi, S.; Faris, H.; Mirjalili, S.M. Salp Swarm Algorithm: A bio-inspired optimizer for engineering design problems. Adv. Eng. Softw. 2017, 114, 163–191. [Google Scholar] [CrossRef]
  40. Doğan, B.; Ölmez, T. A new metaheuristic for numerical function optimization: Vortex Search algorithm. Inf. Sci. 2015, 293, 125–145. [Google Scholar] [CrossRef]
  41. Mirjalili, S. The ant lion optimizer. Adv. Eng. Softw. 2015, 83, 80–98. [Google Scholar] [CrossRef]
  42. Mirjalili, S.; Jangir, P.; Saremi, S. Multi-objective ant lion optimizer: A multi-objective optimization algorithm for solving engineering problems. Appl. Intell. 2017, 46, 79–95. [Google Scholar] [CrossRef]
  43. Yang, X.S. Nature-Inspired Metaheuristic Algorithms; Luniver Press: Beckington, UK, 2010. [Google Scholar]
  44. Falaghi, H.; Ramezani, M.; Haghifam, M.R.; Milani, K.R. Optimal selection of conductors in radial distribution systems with time varying load. In Proceedings of the CIRED 2005-18th International Conference and Exhibition on Electricity Distribution, Turin, Italy, 6–9 June 2005; pp. 1–4. [Google Scholar]
  45. Grisales-Noreña, L.; Montoya-Giraldo, O.; Gil-González, W. Optimal Integration of Distributed Generators into DC Microgrids Using a Hybrid Methodology: Genetic and Vortex Search Algorithms. Arab. J. Sci. Eng. 2022, 47, 14657–14672. [Google Scholar] [CrossRef]
  46. Abou El Ela, A.; El-Sehiemy, R.A.; Shaheen, A.; Shalaby, A. Application of the crow search algorithm for economic environmental dispatch. In Proceedings of the 2017 nineteenth international Middle East power systems conference (MEPCON), Cairo, Egypt, 19–21 December 2017; pp. 78–83. [Google Scholar]
  47. Verma, S.; Shiva, C.K. A novel salp swarm algorithm for expansion planning with security constraints. Iran. J. Sci. Technol. Trans. Electr. Eng. 2020, 44, 1335–1344. [Google Scholar] [CrossRef]
Figure 1. Daily solar radiation in Colombia.
Energies 16 01350 g001
Figure 2. Codification used for the optimal operation of PV-DGs in DC grids.
Energies 16 01350 g002
Figure 3. Average PV generation for an operation day: GCN (Medellín) and SN (Capurganá).
Energies 16 01350 g003
Figure 4. Expected average demand curves of Medellín and Capurganá, Colombia.
Energies 16 01350 g004
Figure 5. Electrical configuration of the grid-connected DC network.
Energies 16 01350 g005
Figure 6. Electrical configuration of the standalone DC network.
Energies 16 01350 g006
Figure 7. Average reductions (a) and standard deviation (b) obtained by the optimization methods with respect to the ALO regarding the economic, technical, and environmental objective functions in the standalone system.
Energies 16 01350 g007
Figure 8. Power supplied by the distributed generators located in the standalone network for the three objective functions considered.
Energies 16 01350 g008
Figure 9. Average reductions (a) and standard deviation (b) obtained by the optimization methods with respect to the ALO regarding economic, technical, and environmental objective functions in the grid-connected network.
Energies 16 01350 g009
Figure 10. Power supplied by the distributed generators located in the grid-connected network for the three objective functions considered.
Energies 16 01350 g010
Table 1. Pros and cons of the works analyzed in the state of art.
MethodYearObjective FunctionConsideredNot ConsideredReference
Genetic
algorithm
2016Minimization of
operating costs
Variable power
demand and generation
Costs associated with renewable and
conventional generators
voltage profile limits
Average solution analysis
Average processing
time analysis

Standard deviation analysis

Comparison methods
Maximum current line
[14]
Non-dominant
sorting genetic
algorithm-II
2019Minimization of
operating costs and
energy losses
Best solution analysis
Comparison methods
Average solution
analysis
Average processing time
analysis
Standard deviation analysis
Maximum current line
[17]
Crow search
algorithm
2019Minimization of
operating costs and
C O 2 emissions
Best solution analysis
Comparison methods
Average solution analysis
Average processing time
analysis
Standard deviation analysis
Maximum current line
[20]
Black hole
optimization
2019Minimization of
power losses
Best solution analysis
Comparison methods
Average solution analysis
Average processing time
analysis
Standard deviation analysis
Maximum current line
[22]
Parallel particle
swarm optimizer
2020Minimization of the
energy purchasing
costs
Best solution analysis
Average processing time
analysis
Average solution analysis
Standard deviation analysis
Comparison methods
voltage profile limits
Maximum current line
[13]
Antlion
optimizer
2020Minimization of
power losses
Best solution analysis
Average processing time
analysis
Comparison methods
Average solution analysis
Standard deviation analysis
Maximum current line
[24]
Salp swarm
algorithm
2021Minimization of
power losses
Best solution anylisis
Average processing
time analysis
Average solution analysis
Standard deviation analysis
Comparison methods
Maximum current line
variable power generation
and demand
[23]
Memory-based
gravitational
search algorithm
2021Minimization of
operating costs
Best solution analysis
Comparison methods
Average processing time
analysis
Average solution analysis
Standard deviation analysis
Maximum current line
[15]
Multiverse
optimizer
2021Minimization of
power losses
Best solution analysis
Average solution analysis
Standard deviation analysis
Comparison methods
Average processing time
analysis
Maximum current line
[21]
Salp swarm
algorithm
2022Minimization of
energy losses,
operating costs, and 
C O 2 emissions
Average solution analysis
Average processing time
analysis
Standard deviation analysis
Comparison methods
Maximum current line
[30]
Table 2. Parametric information of the grid-connected network.
Line lNode iNode j R ij ( Ω ) P j (kW) I l max (A)
1120.0922100320
2230.493090280
3340.3660120195
4450.381160195
5560.819060195
6670.187220095
7781.711420085
8891.03006070
99101.04006055
1010110.19664555
1111120.37446055
1212131.46806040
1313140.541612040
1414150.59106025
1515160.74636020
1616171.28906020
1717180.73209020
182190.16409030
1919201.50429025
2020210.40959020
2121220.70899020
223230.45129085
2323240.898042070
2424250.890042040
256260.20306085
2626270.28426085
2727281.05906070
2828290.804212070
2929300.507520055
3030310.974415040
3131320.310521025
3232330.34106020
Table 3. Parametric information of the standalone network.
Line lNode iNode j R ij ( Ω ) P j (kW) I l max (A)
1120.01400195
2230.74630145
3340.4052297.585
4451.1524070
5560.526125570
6670.7127055
7781.6628212.555
8895.3434020
99102.1522266.0520
102110.40528570
1111121.152434055
1212130.5261297.540
1313141.23581912525
1414152.8835106.2520
1515165.343425520
163171.294225555
1717180.7027127.540
1818193.3234297.540
1919201.517234020
2020210.71278520
214228.2528106.2520
225239.196155.2520
236240.746369.720
248252.011225520
258263.323463.7520
2626270.526117020
Table 4. Parameters used to calculate the economic, technical, and environmental objective functions.
ParameterValueUnitParameterValueUnit
C k W h U r b a n 0.1302USD/kWh C E s U r b a n 0.1644kg/kWh
C k W h R u r a l 0.2913USD/kWh C E s R u r a l 0.2671kg/kWh
C O & M p v 0.0019USD/kWh Δ V ±10%
Table 5. Optimization parameters.
MethodOptimization ParameterValue
ALONumber of particles95
Maximum iterations972
Non-improving iterations292
CSANumber of particles177
Maximum iterations471
Non-improving iterations295
Awareness probability ( A p )0.65826
Flight length ( f l )3.25058
PSONumber of particles159
Maximum iterations492
Non-improving iterations229
Maximum inertia ( W m a x )0.99456
Minimum inertia ( W m i n )0.32458
Cognitive component ( C 1 )0.061368
Social component ( C 2 )1.5456
MVONumber of particles41
Maximum iterations1326
Non-improving iterations188
Wep-min0.68125
Wep-max0.51768
P parameter3
SSANumber of particles141
Maximum iterations1577
Non-improving iterations547
VSANumber of particles163
Maximum iterations762
Non-improving iterations762
x parameter0.08
Table 6. Simulation results obtained by the optimization algorithms in the standalone test feeder.
Standalone Test Feeder
Objective
function
E l o s s
(kWh)
C o s t s
(USD)
E m i s s i o n s
( k g C O 2 )
Whitout PV-DGs489.304218,485.050716,951.2974
Average solution
Objective function/
Method
E l o s s
(kWh)
C o s t s
(USD)
E m i s s i o n s
( k g C O 2 )
ALO359.684311,962.668810,930.9273
CSA369.194413,663.832812,534.4183
PSO362.049612,340.290811,267.5734
MVO360.029112,231.169111,131.5617
SSA359.853712,074.554311,039.5781
VSA359.831712,055.341011,016.6177
Percent average reduction (%)
Objective function/
Method
E l o s s C o s t s E m i s s i o n s
ALO26.490735.284635.5157
CSA24.547126.081726.0563
PSO26.007333.241833.5297
MVO26.420233.832134.3321
SSA26.456034.679434.8747
VSA26.460534.783335.0102
Standard deviation (%)
Objective function/
Method
E l o s s C o s t s E m i s s i o n s
ALO0.00100.00590.0032
CSA1.75482.30772.1093
PSO0.40951.77111.6491
MVO0.23562.43012.0192
SSA0.02300.43630.4329
VSA0.02120.30420.2886
Average processing time (s)
Objective function/
Method
E l o s s C o s t s E m i s s i o n s
ALO56.5156.8756.96
CSA6.546.766.74
PSO4.214.434.44
MVO2.021.801.90
SSA12.5912.9013.12
VSA7.697.847.78
Table 7. Simulations results obtained by the optimization algorithms in the grid-connected test feeder.
Grid-Connected Test Feeder
Objective
function
E l o s s
(kWh)
C o s t s
(USD)
E m i s s i o n s
( k g C O 2 )
Whitout PV-DGs2186.28039776.389212345.1497
Average solution
Objective function/
Method
E l o s s
(kWh)
C o s t s
(USD)
E m i s s i o n s
( k g C O 2 )
ALO1225.01937138.81228967.2586
CSA1270.15627407.90469328.7685
PSO1268.59737392.04329282.4081
MVO1231.25317298.71579187.9682
SSA1225.33237297.97129166.6746
VSA1225.29097249.38259108.9096
Percent average reduction (%)
Objective function/
Method
E l o s s C o s t s E m i s s i o n s
ALO43.967926.979127.3621
CSA41.903324.226624.4337
PSO41.974624.388824.8093
MVO43.682725.343425.5743
SSA43.953625.351125.7468
VSA43.955525.848126.2147
Standard deviation (%)
Objective function/
Method
E l o s s C o s t s E m i s s i o n s
ALO0.00460.03190.0296
CSA1.38061.85001.6987
PSO2.40652.25792.0891
MVO2.26941.21901.5868
SSA0.01310.70890.6306
VSA0.01080.56970.5676
Average processing time (s)
Objective function/
Method
E l o s s C o s t s E m i s s i o n s
ALO60.6761.1159.65
CSA36.3736.4536.87
PSO5.966.476.60
MVO2.452.472.48
SSA20.8521.4721.29
VSA9.9310.3710.45
Disclaimer/Publisher’s Note: The statements, opinions and data contained in all publications are solely those of the individual author(s) and contributor(s) and not of MDPI and/or the editor(s). MDPI and/or the editor(s) disclaim responsibility for any injury to people or property resulting from any ideas, methods, instructions or products referred to in the content.

