1. Introduction
Conventional oil–water separation techniques have limitations, especially for separating dispersed and emulsified oily wastewater [
1,
2,
3,
4]. The emulsion stability is affected by the oil droplet size and challenges the treatment of emulsified oily wastewater; the high emulsion stability for oil-in-water (O/W) nanoemulsions decreases the efficiency of adsorbents for removing the oil contamination [
5,
6]. Using magnetic nanoparticle (MNP) as a nanoadsorbent is proven successful for demulsifying such nanoemulsions with small oil droplet sizes [
7]. Iron oxide (Fe
3O
4) is a common MNP with promising applications in oil adsorption due to its superparamagnetic properties, biocompatibility, high adsorption capacity, and recyclability [
6]. However, large-scale applications of MNPs are limited by the intrinsic instability and agglomeration of Fe
3O
4, resulting from high chemical activity [
8].
The surface modification of MNPs using organic and inorganic materials is proposed as an effective process to improve the MNP stability, dispersivity in the emulsion, and oil removal effectiveness [
9]. Functionalizing MNPs using amphiphilic compounds has attracted a great interest for demulsification because of featuring simultaneously hydrophilic and hydrophobic properties. Therefore, these amphiphilic particles can be easily dispersed in the aqueous phase (as the continuous emulsion phase for O/W) to adsorb onto the emulsified oil droplets effectively [
10]. For instance, Hammouda et al. [
11] developed oleophilic magnetic activated carbon nanoparticles decorated by soybean oil and stearic acid for oil spill removal. The water and oil contact angle measurements indicated super-amphiphilicity, causing rapid and effective oil droplet adsorption following their coalescence in a magnetic field. Amphipathic magnetically diatomite demulsifier was developed by Xu et al. [
12] to remove oil from an O/W. Their grafted Fe
3O
4 particles showed a great demulsification performance. Song et al. [
13] fabricated hydrophilic/oleophilic Janus magnetic particles for oil adsorption. They confirmed the effectiveness of these amphiphilic Janus particles for oil removal (from O/W) due to their high interfacial activity, which enabled them to adsorb onto the oil–water interfaces quickly.
To obtain a better understanding of the adsorption mechanisms, equilibrium adsorbate adsorption behavior is crucial, which can be studied through the adsorption isotherm and kinetics [
14,
15,
16]. The adsorption isotherm behavior can effectively describe the interactions between the adsorbent (MNPs) and adsorbate (oil droplets), using empirical mathematical equations. Different isotherm models are developed, of which some important ones are Langmuir, Freundlich, Temkin, Sips, Dubinin–Radushkevich, and Brunauer–Emmett–Teller [
17,
18]. In all the isotherm models, the oil adsorption capacity is estimated using batch studies conducted at a fixed temperature, using different initial oil concentration levels and under equilibrium. Adsorption kinetics can help to identify the adsorption mechanisms, such as diffusion and chemical reactions, which quantifies the adsorption dynamics for an adsorbate-adsorbent system [
19,
20]. The rate of adsorption depends on the physical and chemical properties of the adsorbent [
21,
22] and the operating conditions [
23,
24]. There are several kinetic models in the literature, such as pseudo-first-order (PFO), pseudo-second-order (PSO), intra-particle diffusion (IPD), and Elovich kinetic models, which quantify the dynamics of adsorption. In the literature, linear regression analysis has been widely applied to investigate the adsorption kinetics and isotherms to assess the equilibrium adsorption behavior [
19,
25]. However, due to non-linear behaviors of systems , the non-linear regression analysis is proposed as a more rigorous mathematical method to calculate the adsorption kinetics and isotherms [
15]. For instance, Nanta et al. [
26] investigated isotherm and kinetic modeling of superparamagnetic nanoparticles for polysaccharide adsorption using Langmuir, Freundlich, and Sips isotherm models, and non-linear PFO and PSO kinetic models. Based on their findings, the non-linear analysis was more accurate than the linear method to predict the optimum adsorption isotherm. Their results revealed that the Freundlich and PFO models are more accurate in estimating the adsorption isotherm and kinetic behavior, respectively, compared to the other tested models. Mirzaee and Sartaj [
27] developed an activated carbon-based magnetic composite for polycyclic aromatic hydrocarbons (PAH) adsorption. They then studied the isotherm and kinetic models using a non-linear regression method. It was found that PAH adsorption from aqueous solution fitted well to the Langmuir isotherm and PSO kinetic models. Jaafari et al. [
20] studied equilibrium data for removing dye using magnetic chitosan and observed a better fit to the Freundlich isotherm and PFO kinetic models.
Based on the literature, several materials are employed to functionalize MNPs, while most of them are only dispersible in organic solvents. However, excellent dispersivity of MNPs is crucial in attaining an effective demulsification. We use surfactant as amphiphilic compound with both hydrophilic and oleophilic properties to provide a greater dispersivity of MNPs in the emulsion, to prevent their aggregation, and to achieve higher oil adsorption capacity. Moreover, previous research studies have focused on the separation of micrometer oil contaminations, while, in this research, we aim to separate more challenging nanometer oil droplets from the emulsion. We apply cetyltrimethylammonium bromide (CTAB) as a cationic surfactant to synthesize amphiphilic MNPs for oil removal from dodecane oil-in-water (O/W) nanoemulsion. The prepared MNP@CTAB particles are characterized using transmission electron microscopy (TEM), water and oil contact angle (CA) measurements, and zeta potential analysis. The adsorption isotherm and kinetic models are investigated to interpret the adsorption mechanisms for improving the demulsification process. Furthermore, this research provides a valuable insight into the adsorption behavior in terms of electrostatic interaction between adsorbate and adsorbents, which has not been thoroughly investigated in previous studies to the best of our knowledge. We employ three adsorption isotherms, including Langmuir, Freundlich, Temkin, and three kinetic models: PFO, PSO, and IPD. The oil adsorption equilibrium data is calculated by oil adsorption capacity measurements using gas chromatography with flame ionization detector (GC-FID).
2. Material and Methods
2.1. Materials
Iron oxide nano particles (Fe3O4, >99.5% with size of 15–20 nm) was supplied by US Research Nanomaterials, Houston, TX, USA. Cetyltrimethylammonium bromide (CTAB) was purchased from MilliporeSigma, Burlington, NV, USA; chloroform (HPLC grade, >99.5%) and n-dodecane ≥ 99% were obtained from Thermo Scientific, Mississauga, ON, Canada; On/Off magnetic welding square was purchased from Master Magnetics, Inc., Castle Rock, CO, USA. Ethanol absolute was purchased locally; deionized water (18.2 MΩ) was obtained using a water purification system (SYBRON/Barnstead, East Lyme, CT, USA).
2.2. Preparation of Functionalized Magnetic Nanoparticles
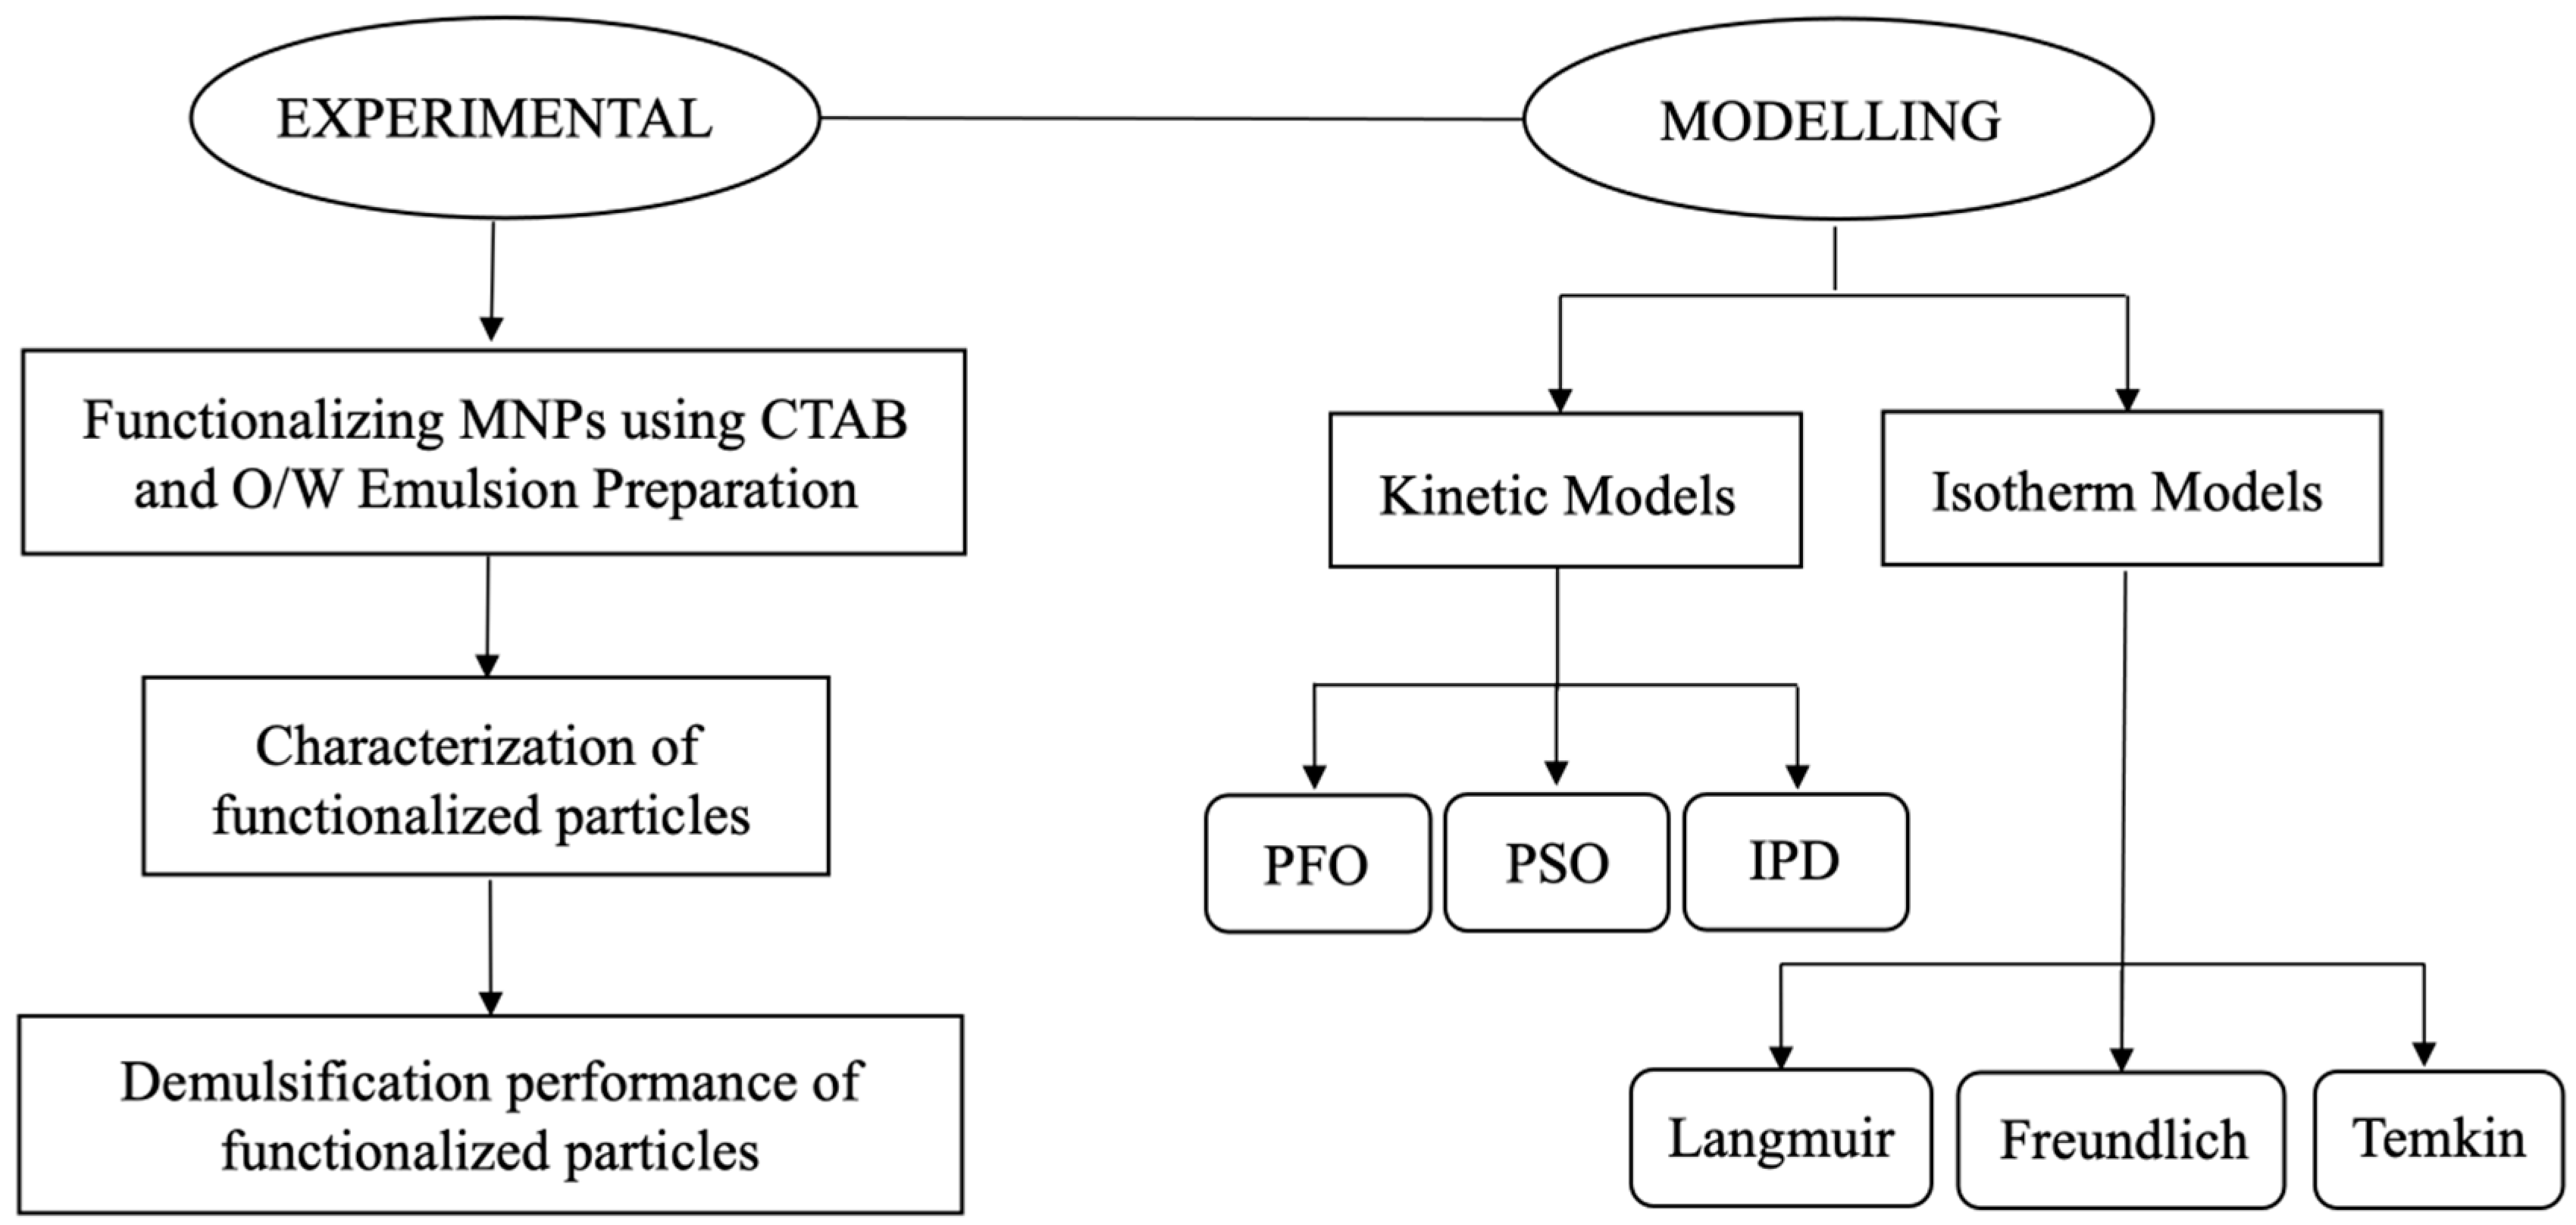
Figure 1 presents a summary of the main steps conducted in this research. Initially in the experiment, 500 mg Fe
3O
4 nanoparticles (magnetite) are dispersed in 25 mL ethanol–water (4:1) solution for 15 min in a sonication bath at 25 °C. Then, 200 mg CTAB is dispersed into ethanol solution (25 mL) for 15 min in a sonication bath at 25 °C to make a 2.5:1 mass ratio of CTAB/magnetite. The prepared CTAB solution is added to the MNP solution in a round volumetric flask, which is sealed under N
2 environment to avoid MNP oxidation. Then, the mixture is heated to 80 °C for 2 h in an oil bath. A magnet is placed next to the round flask to separate the coated MNPs from the liquid. The coated nanoparticles are washed with deionized (DI) water and ethanol several times and placed in a vacuum oven at 60 °C to be dried for 24 h. More details of the experimental procedure for synthesizing the MNPs particles can be found in our previous study [
7].
2.3. Characterization of Functionalized Magnetic Nanoparticles
MNP morphology and surface charge are important factors affecting the effectiveness of demulsification process [
28]. In this study, the morphology of the MNPs is assessed using Secnai
TM Spirit TEM (FEI, Hillsboro, OR, USA) with 4 Megapixel AMG digital camera and 80 kV field emission electron gun. We also measure zeta potential to estimate the effective charge on functionalized MNPs using the Zetasizer Nano ZS90 instrument (Malvern Instruments Ltd., Malvern, UK). CA measurements for water and oil cased are conducted to assess the wettability of the prepared particles through sessile drop method using DSA25S drop shape analyzer (KRÜSS, Hamburg, Germany). Details of the TEM, zeta potential, and CA measurements and sample preparation can be seen in our previous research study [
7].
2.4. Adsorption Experiment
The
n-dodecane-in-water nanoemulsion is prepared via a probe sonicator, running at a power of 70 watts (10% amplitude) for 5 min. The adsorption isotherm study for the synthesized MNPs is conducted by adding the same amount of functionalized MNP@CTAB (0.5 g/L) to a freshly prepared nanoemulsion under vigorous mixing at 2000 rpm [
7]. The adsorption isotherm analysis is conducted at constant room temperature of 25 °C using different initial oil concentration levels 2500–20,000 mg/L in the emulsion.
The equilibrium oil concentration after demulsification is determined using Agilent 7890B gas chromatography equipped with a flame ionization detector (GC-FID). The GC characterization is described with details in our previous study [
7]. The equilibrium oil adsorption capacity (
) is the oil concentration adsorbed per unit mass of the adsorbent (MNP@CTAB) under equilibrium (mg/g), which is estimated by the following equation:
where
and
refer to the initial and residual oil concentration after separation (mg/L), respectively;
introduces the total volume of emulsion (L); and
stands for the weight of the adsorbent (g).
The oil adsorption capacity at time
t,
(mg/g), is calculated from the following expression:
where
represents the aqueous-phase oil concentration at time
t (mg/L). Moreover, the percentage of oil removal by MNP@CTAB (separation efficiency, SE%) is calculated as follows:
Experiments are repeated three times, and their mean values are used to evaluate the data.
The goodness-of-fit test of the non-linear isotherm and kinetic models with the experimental data is evaluated using the coefficient of determination (
) as defined below:
where
and
are the experimental and estimated values for the oil adsorption capacity (mg/g) at time
, respectively; and
n represents the number of observations. A higher value of
close to one is favored.
2.5. Adsorption Isotherms
The adsorption isotherm analysis for the emulsified oil droplets adsorbing onto the MNPs is conducted at a constant room temperature of 25 °C using three isotherm models: Langmuir, Freundlich, and Temkin. These isotherm models were developed based on different assumptions and limitations [
29].
2.5.1. Langmuir Isotherm
This isotherm is based on the assumption that a fixed number of adsorption sites are homogenously distributed on the adsorbent surface. These adsorption sites have the same affinity for the adsorbate molecules (with the same energies) and are independent of the site occupancy, resulting in a single monolayer adsorption, in which there is no interaction between the adsorbed molecules [
17,
20]. Moreover, the Langmuir isotherm considers the surface coverage by maintaining a balance between the rates of adsorption and desorption, representing a dynamic equilibrium. Adsorption is related to the proportion of the adsorbent surface that is available, while desorption is related to the proportion of the adsorbent surface that is already covered. The following equation describes the Langmuir model [
15]:
where
denotes the Langmuir equilibrium constant (L/g adsorbent) and
is the maximum adsorption quantity, corresponding to the formation of monolayer (mg/g adsorbent).
The Langmuir constants can be determined from linearized equation, upon mathematical manipulation/rearrangement:
The following equation represents the separation factor (
), as a dimensionless constant, which can be calculated using the Langmuir model parameters [
16]:
where
stands for the maximum initial oil concentration (mg/L). The separation factor value is in the range of 0–1, indicating the favorability of the adsorption process. When
, it implies the adsorption isotherm is linear, which occurs when
when
, it signifies that the adsorption isotherm is irreversible, and the reason being is that
should be infinite, implying that the adsorption is very strong;
and
indicate unfavorable and favorable adsorption processes, respectively [
17,
30].
2.5.2. Freundlich Isotherm
This isotherm model is applicable for heterogeneous adsorption surfaces having various potential adsorption capacities at the active sites, for which the stronger binding sites are occupied first. The potential adsorption (strength binding) of active sites decreases by increasing the fraction of adsorption site occupied. These exponential reductions in binding energy of adsorption sites support the hypothesis of multilayer adsorption. Freundlich equation is given by the following expression [
17,
19]:
where
is the Freundlich constant, showing the adsorbent capacity (mg/g adsorbent), and
is the surface heterogeneity parameter related to the adsorption intensity. The non-linear form of the Freundlich model can be linearized as follows:
2.5.3. Temkin Isotherm
This isotherm describes indirect interactions between the adsorbate and adsorbent by considering the adsorption heat to quantify the interaction strength. This isotherm assumes that the adsorption heat for all adsorbate molecules linearly decreases with increasing the surface coverage, leading to a uniform distribution of the binding energies. The following equilibrium equation explains the Temkin isotherm [
15,
31]:
where
is an indicator of the adsorption heat (J/mol);
is the universal gas constant (8.314 J/mol/K);
refers to the absolute temperature (K);
is the Temkin isotherm constant that relates to the heat of adsorption; and
introduces the equilibrium binding constant (L/g). The linear Temkin isotherm is given as follows:
2.6. Adsorption Kinetics
The adsorption kinetic studies for the emulsified oil droplets adsorbing onto the functionalized MNPs is performed using PFO, PSO, and IPD kinetic models. We only apply the non-linear regression technique to describe the adsorption kinetics with a need for linearization.
2.6.1. Pseudo-First-Order Model
This adsorption kinetic model is commonly used to describe adsorption in solid–liquid systems using Lagergren’s equation [
27]. Based on the PFO model, the adsorption process is considered as physisorption without electron transfer upon occurring. Physisorption is commonly a reversible process involving van der Waals and physical binding between the adsorbate molecules and the adsorptive sites. The PFO equation of Lagergren is given as follows [
32]:
where
and
represent the amounts of oil adsorbed at time
and equilibrium (mg/g), respectively; and
is the PSO rate constant for the adsorption process (min
−1).
2.6.2. Pseudo-Second-Order Model
This adsorption kinetic model assumes that the adsorption process involves chemisorption, forming a chemical bond between the adsorbate molecules and the adsorptive sites through sharing or exchanging electrons to form
–
and H–
interactions. The following equation describes the PSO model [
17,
27]:
where
is the equilibrium rate constant in the PSO equation.
2.6.3. Intra-Particle Diffusion Model
This adsorption kinetic model describes the transport and diffusion of the adsorbate (oil droplets) from the aqueous phase to the surface of adsorbents (MNPs) during the adsorption process [
17]. The IPD model provides information about the rate-controlling step, controlling the kinetics of the adsorption process [
19]. The IPD model is affected by different factors, such as the adsorbents’ physical properties, adsorbate concentration, temperature, and mixing/rotation speed [
22]. The following equation is suggested by Weber and Morris [
33] and explains the IPD model:
where
is the IPD rate constant; and
represents the boundary layer thickness. A higher value of
implies a more significant impact of the boundary layer on the adsorption process [
34].
2.7. Limitations of the Research
When interpreting the results of the study and applying them to practical applications or future research, it is important to consider the identified limitations of the study. These limitations highlight the importance of caution in extrapolating the findings beyond the specific experimental conditions and material used. Understanding the potential variability in other types of MNPs, different coatings, various types of oil, and real-world conditions is crucial. Factors such as temperature, pH, and the presence of other substances in the oil–water system could impact the adsorption process differently than in the controlled laboratory environment. The feasibility and challenges of scaling up the process for practical implementations need to be evaluated considering effective variables such as the cost, availability, and scalability of the materials and methods. Additionally, alternative kinetic and isotherm models could potentially provide a better fit to the experimental data, and the suitability of all the available models can be assessed, but it would be challenging.
3. Results and Discussion
This section discusses characterization results for the functionalized particles with TEM, zeta potential, and CA measurements, and oil adsorption capacity of the functionalized particles using GC-FID analysis. Then, the performance of fabricated particles for oil capturing from dodecane-in-water nanoemulsion as well as the results of adsorption isotherm and kinetic model investigations are given.
3.1. Functionalized MNP Characterization
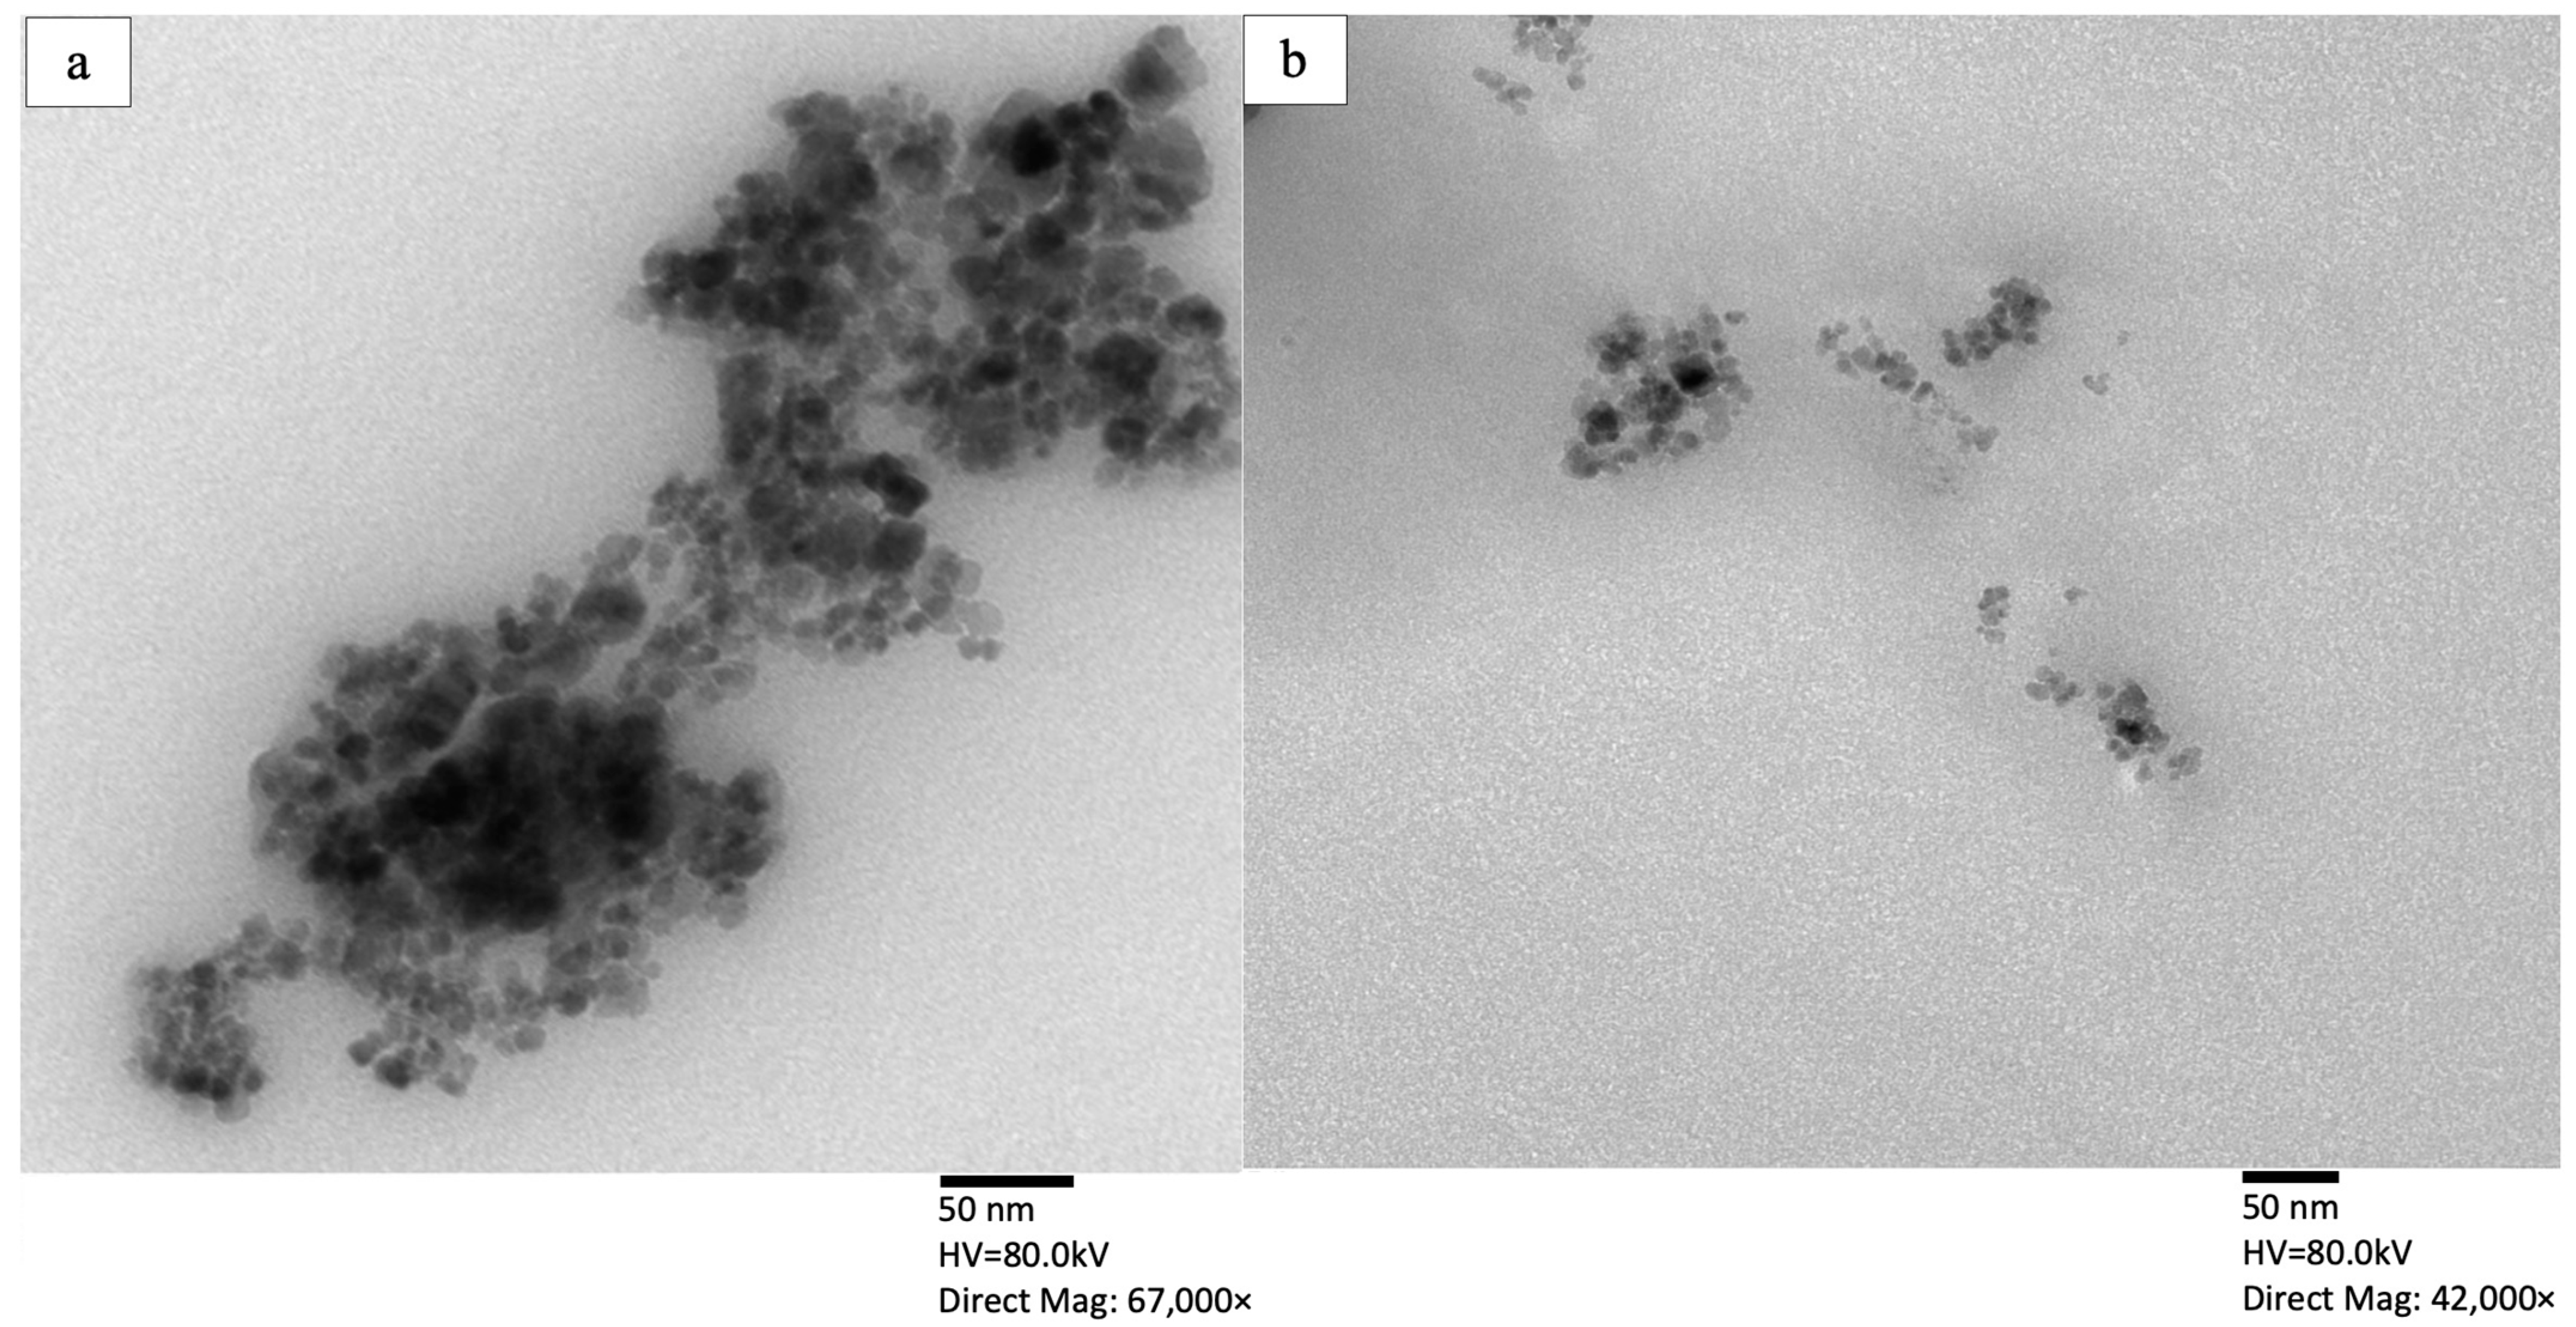
TEM images of bare and functionalized MNPs are illustrated in panels (a) and (b) of
Figure 2, respectively. As depicted in
Figure 2, the bare MNPs appear as a denser aggregate compared to the functionalized MNP@CTAB. Less aggregation of the functionalized MNPs is attributed to the surface modification using a cationic surfactant that results in steric repulsion for the solid phase while improving their dispersivity in the aqueous phase. The spherical structure of the particles is an advantage because it provides a higher external surface area, leading to a higher adsorption capacity.
The effective surface charge of the functionalized particles is analyzed using zeta potential measurements. The results indicate a zeta potential of +4.24 mV for the bare MNPs at pH 5.0, which verifies a positive charge on bare MNPs. The magnitude of 4.24 mV shows a low stability for the bare particles and predicts their tendency to agglomerate, which is also verified by the TEM images (see
Figure 2a). The measured zeta potential values for the functionalized MNPs increases significantly to +35.8 (±0.34) mV. We also measure a negative zeta potential for the prepared nanoemulsion (−55.9 ± 2.44 mV), indicating that the negatively charged droplets can potentially bind to the positively charged functionalized MNP@CTAB.
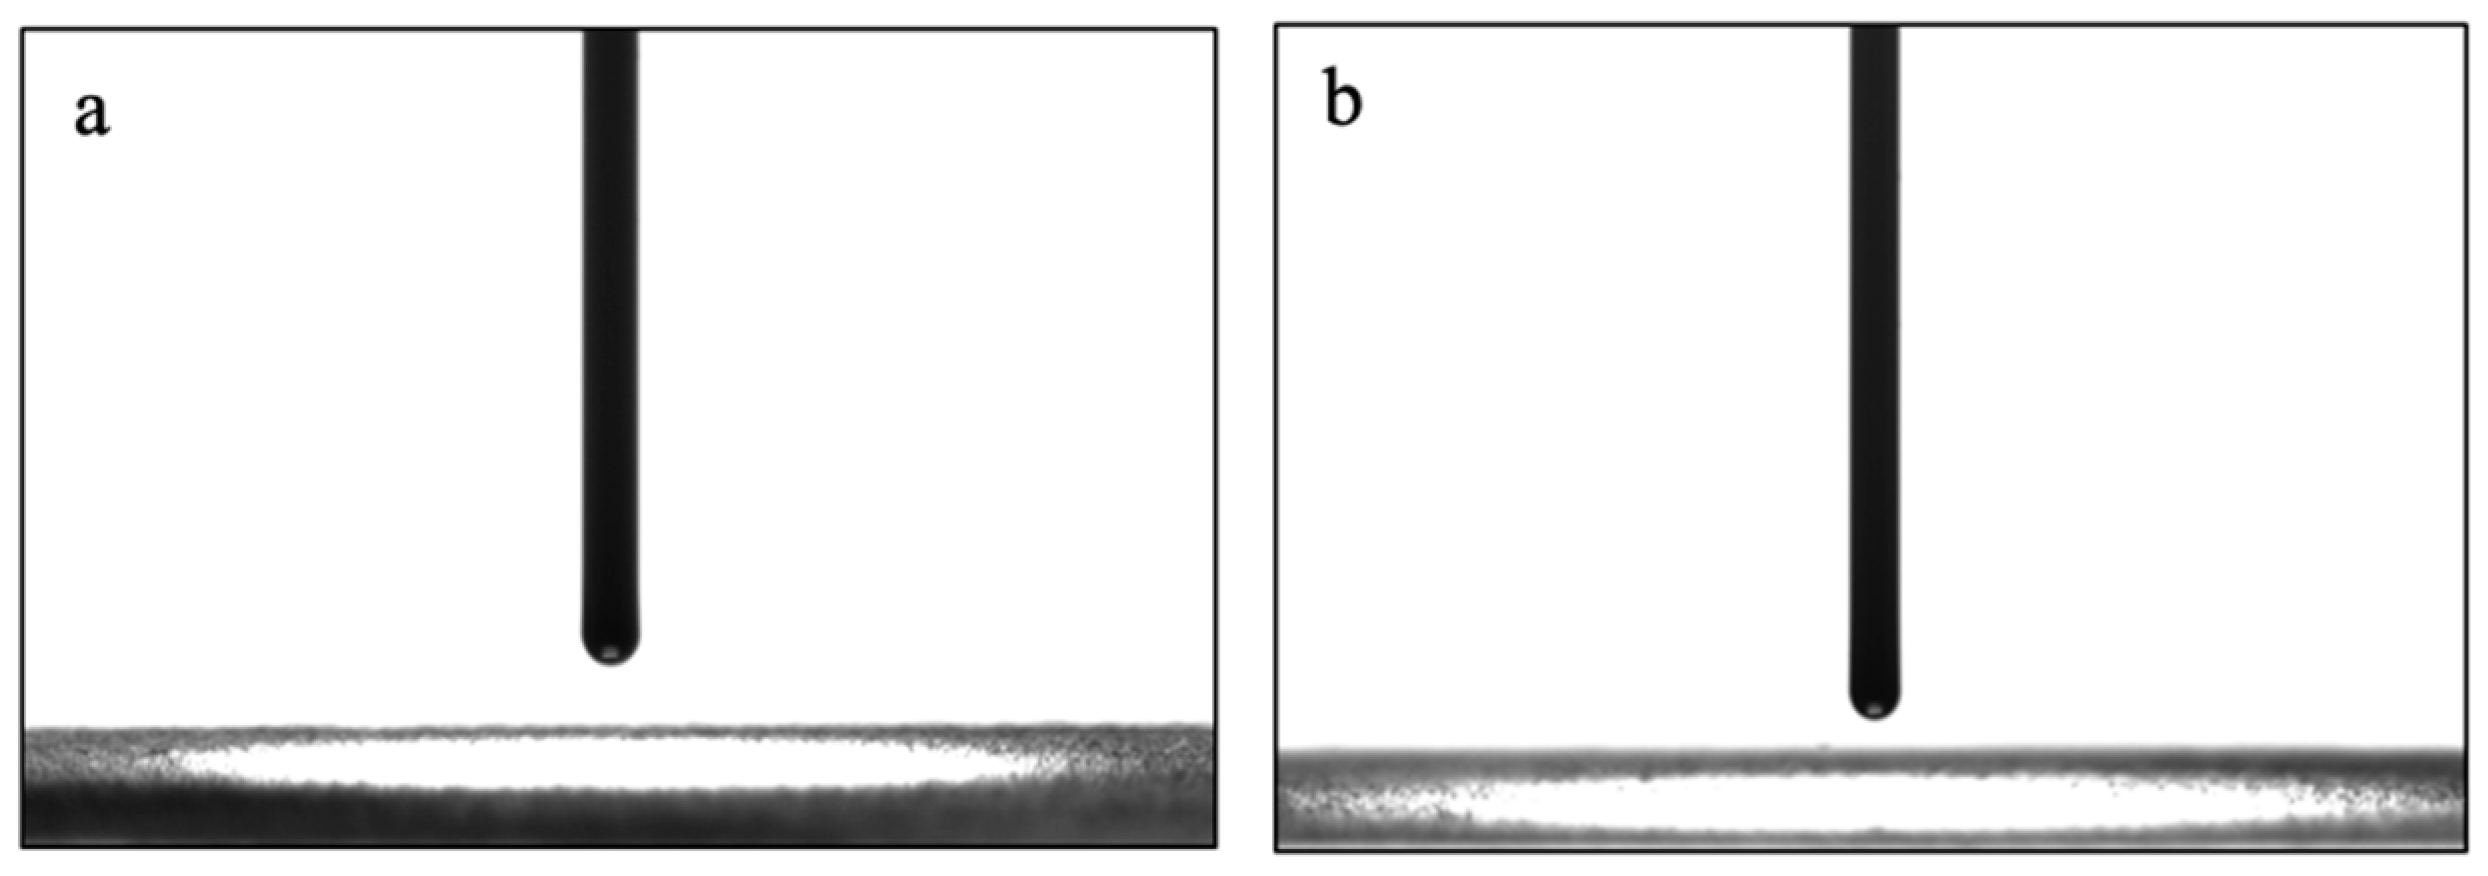
The wettability of prepared particles is examined using CA measurements, as shown in
Figure 3. Both water and oil droplets spread immediately on the MNP@CTAB surfaces, giving a very small water contact angle (WCA) (
Figure 3a) and a very small oil contact angle (OCA) (
Figure 3b). These results confirm the amphiphilicity of the particles, which provide better demulsification performance.
3.2. Oil Adsorption Results
The oil adsorption performance for the functionalized particles is examined by estimating the oil separation efficiency (SE) from nanoemulsion (O/W) using GC-FID analysis. The SE is determined by adding 0.5 g/L MNP@CTAB to the freshly prepared 1000 ppm dodecane-in-water nanoemulsion. Particles are mixed at 2000 rpm for 20 min to ensure their dispersivity in the emulsion. The SE analysis indicates that the prepared MNP@CTAB provides a better performance with SE = 99.80%, compared to the bare MNP with SE = 57.46%. As indicated in
Figure 4, such improvement in the oil separation efficiency is mainly due to the more positive surface charge on MNP@CTAB that leads to a stronger electrostatic attraction to negatively charged oil droplets, as verified by the zeta potential analysis. Generally, in the oil adsorption process, the behavior of the surfactant with the particles and the water is crucial for the effectiveness of demulsification. After introducing surfactant into the emulsion, they are adsorbed onto the surface of MNPs at their hydrophobic tails, while extending their hydrophilic heads into the surrounding water phase, forming a monolayer around the MNPs (
Figure 4). This stable coating on the MNPs makes the particles hydrophilic and prevents their aggregation. Therefore, surfactant coating on the MNPs helps to stabilize the nanoparticles in the emulsion, which is essential for ensuring their effective contact with the oil phase. Moreover, oil adsorption occurs through hydrophobic tails of CTAB and the amphiphilicity of MNP@CTAB, confirmed by CA measurements, provides a better dispersivity of the functionalized MNPs, resulting in a higher oil separation efficiency.
Surfactants, in general, can be effective for emulsifying the oil and water phases as their hydrophilic heads are oriented in the water, while the hydrophobic tails are oriented towards the oil phase. They can help to prevent demulsification or phase separation by forming a stable interfacial layer between the oil and water, thereby reducing the interfacial tension between them. However, the behavior of surfactants with the water phase of emulsion depends on the type of surfactant. In this research, CTAB as cationic surfactant with positively charged head groups tends to interact primarily with the negatively charged oil droplets. Emphasize that the surfactant’s positive charge cannot be effective in creating a stable interfacial layer as it cannot interact with water molecules directly. Moreover, CTAB surfactant with a high value of hydrophilic–lipophilic balance (HLB) of around 15.8, cannot effectively reduce the interfacial tension between oil and water, which is a key factor in preventing demulsification.
3.3. Adsorption Isotherms Results
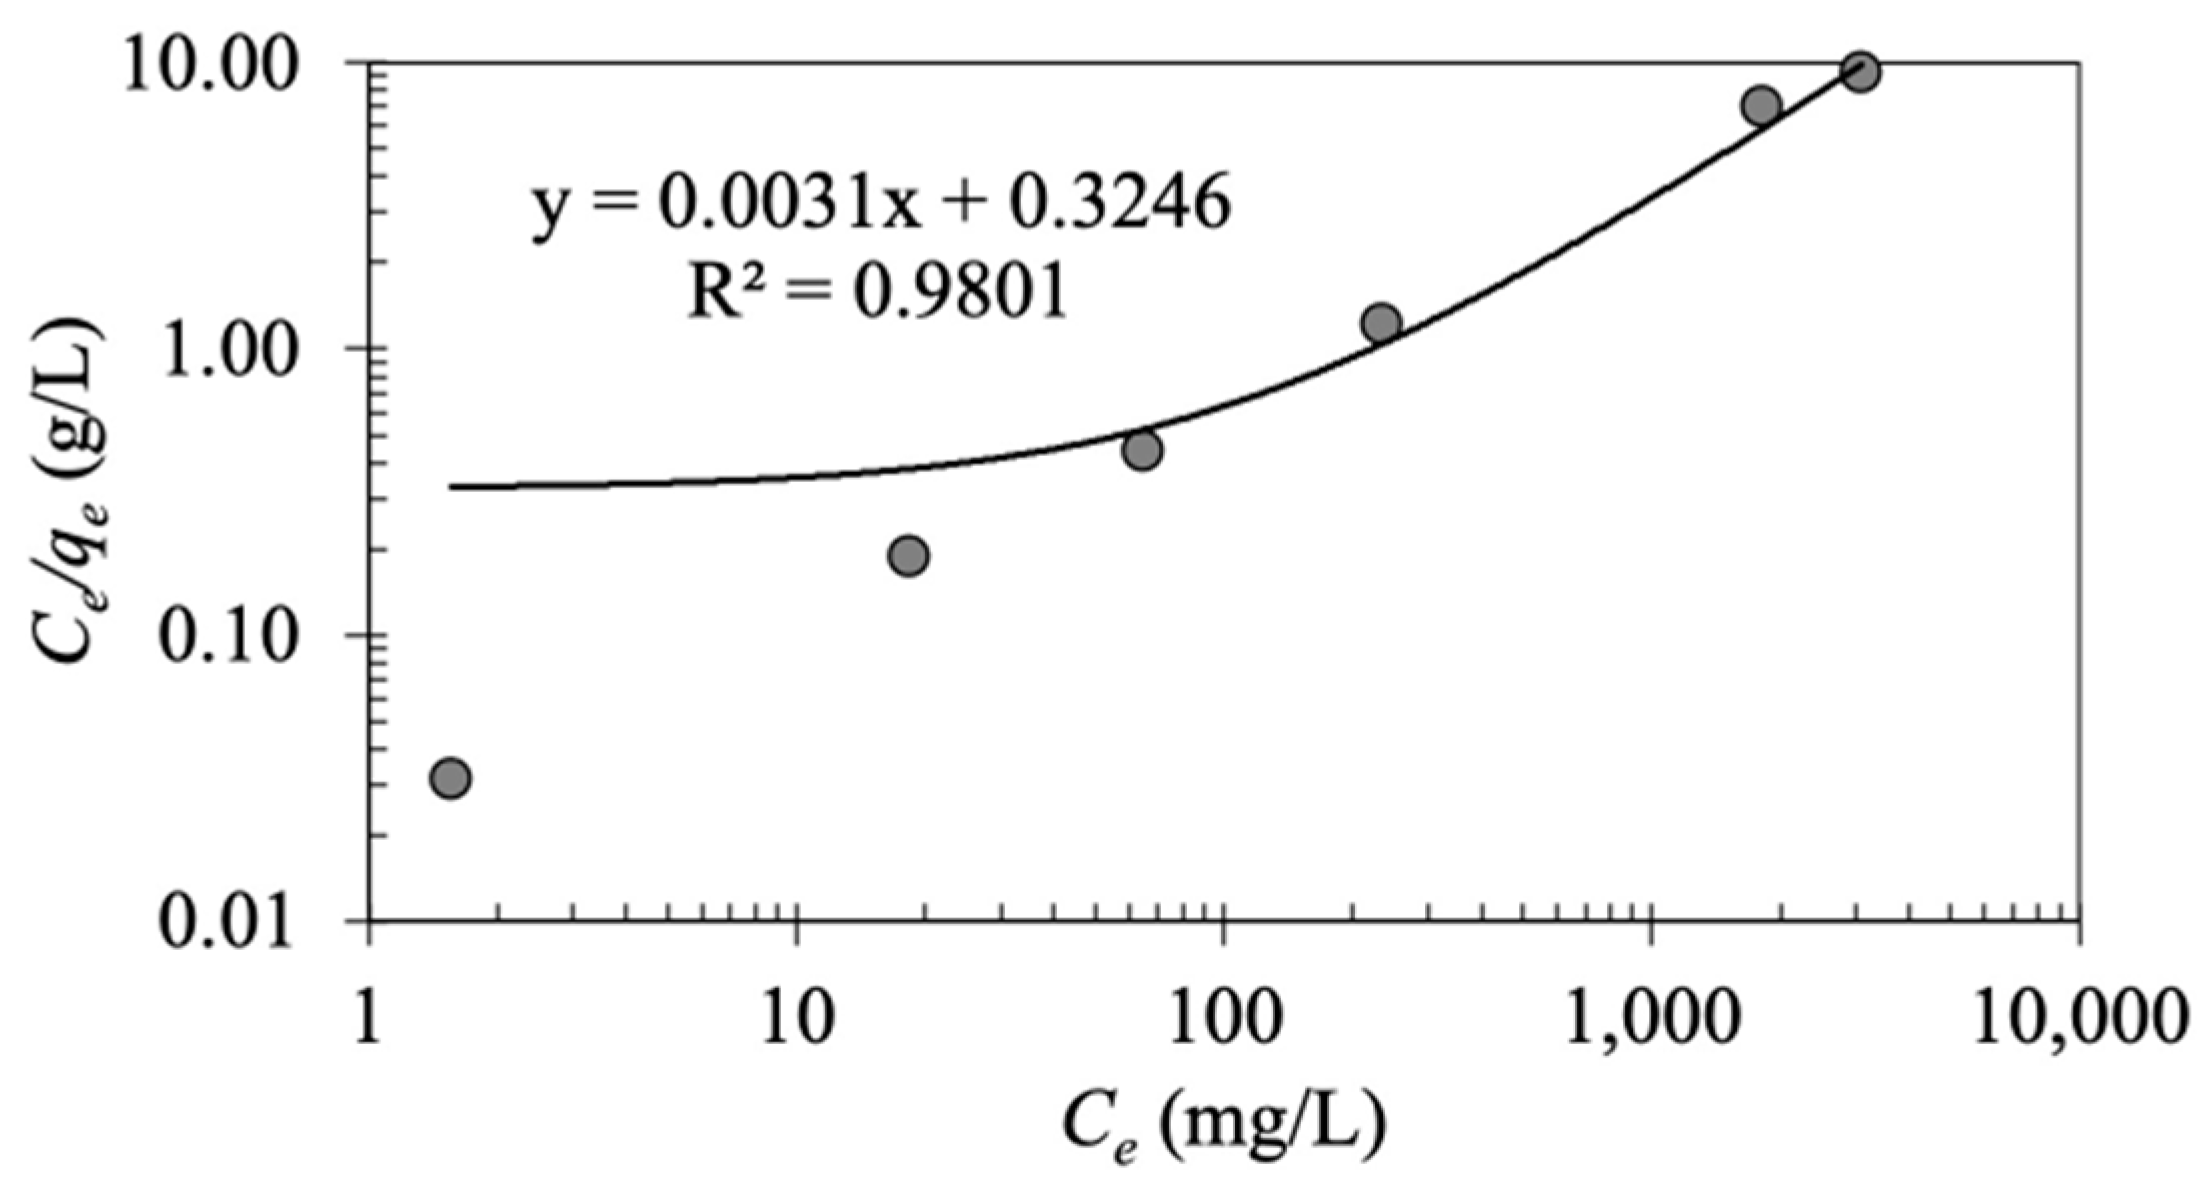
As displayed in
Figure 5, the Langmuir constants
and
are estimated, respectively, from the slope and intercept of the linear plot of
versus
.
The linear regression indicates
R2 = 0.902 for the Langmuir model with estimated values of
and
at 327.647 mg/g and 0.009 L/g, respectively (
Table 1). Based on the Langmuir model,
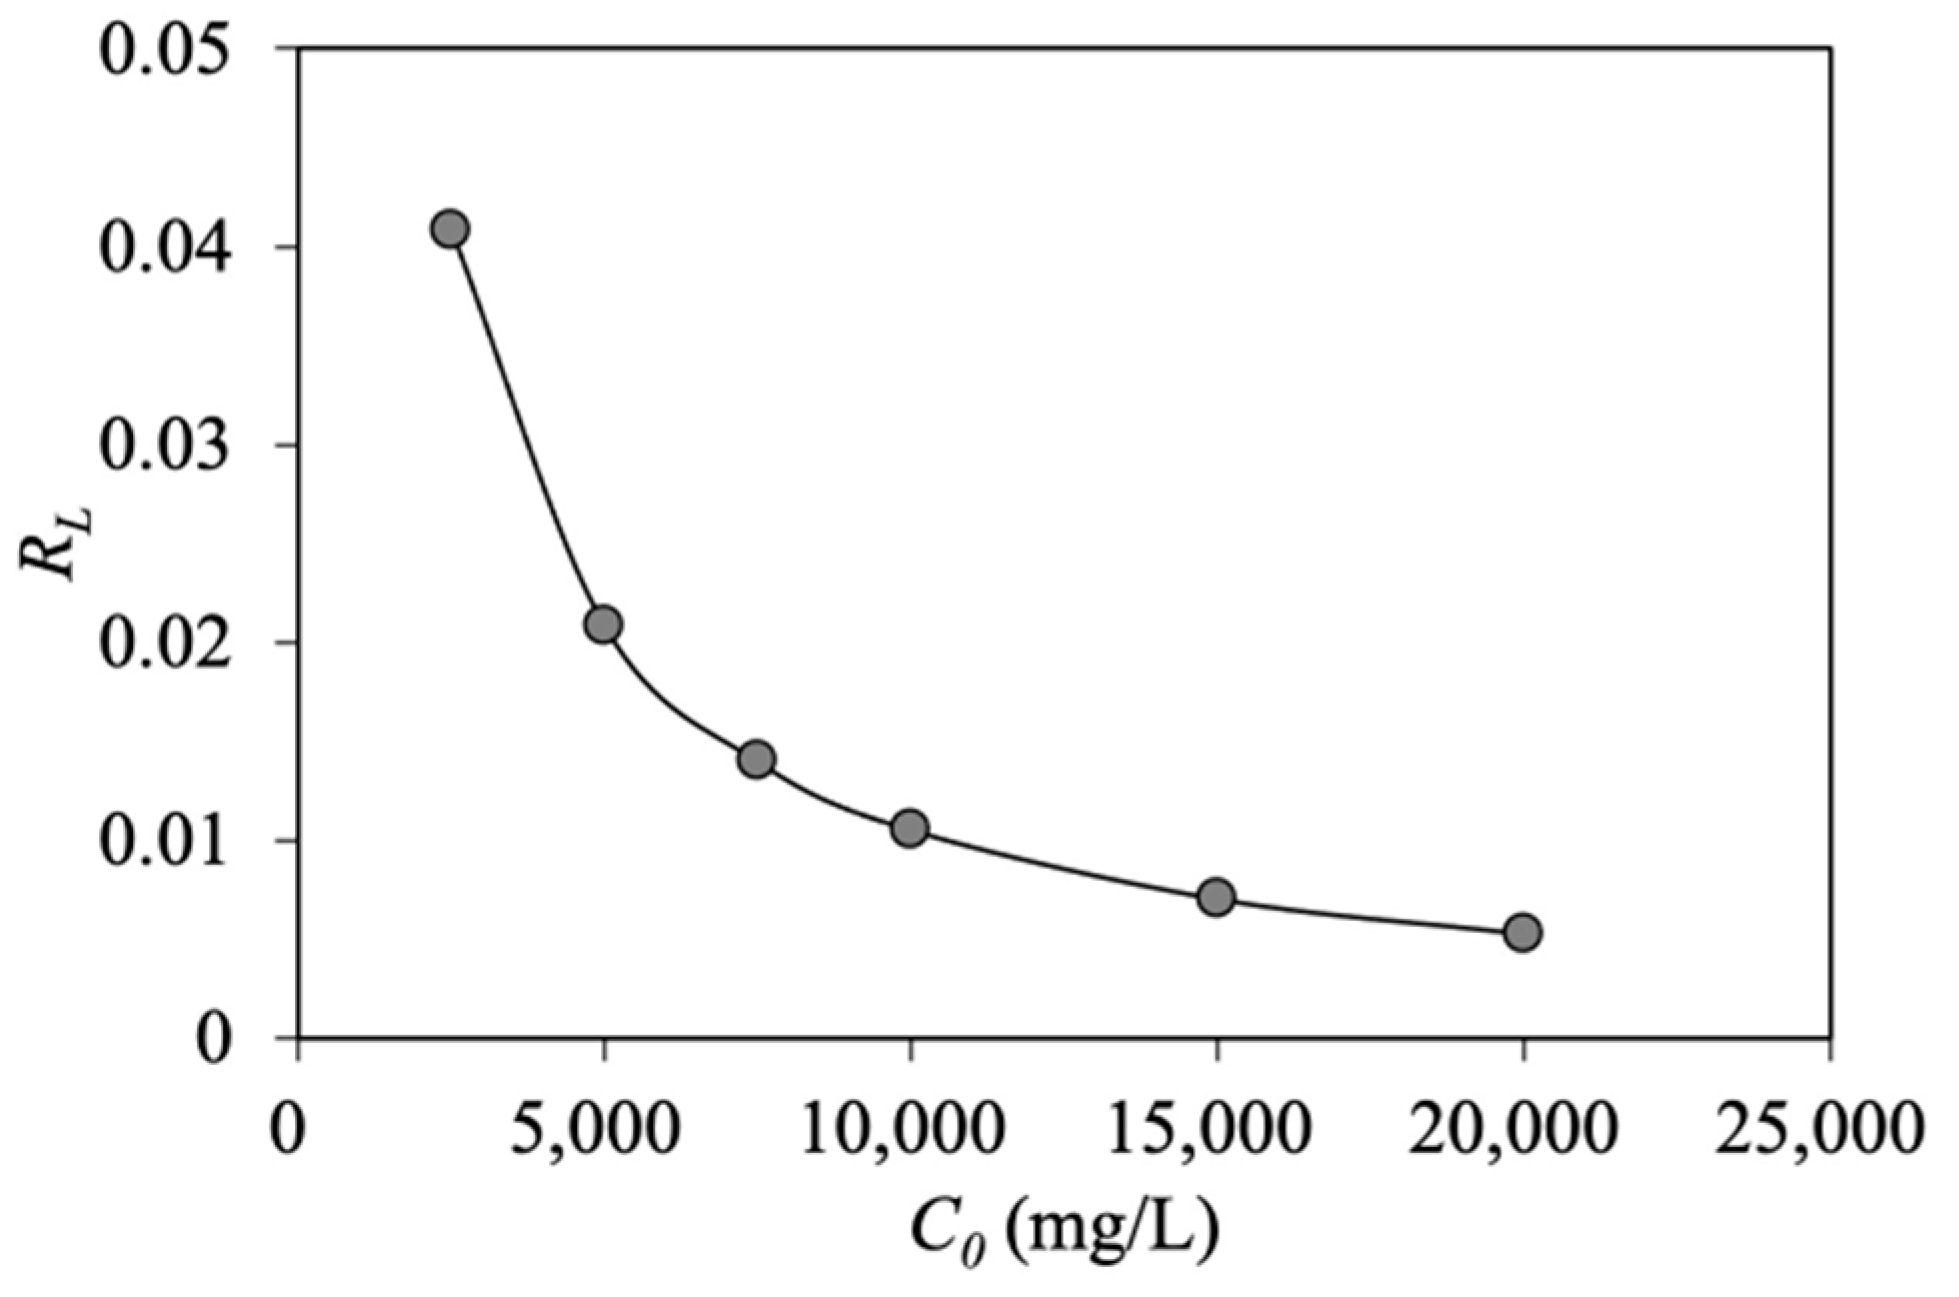
value is in the range of 0.005–0.04, implying that the oil adsorption process using MNP@CTAB is favorable (
). As illustrated in
Figure 6, increasing the initial oil concentration results in less favorable oil adsorption.
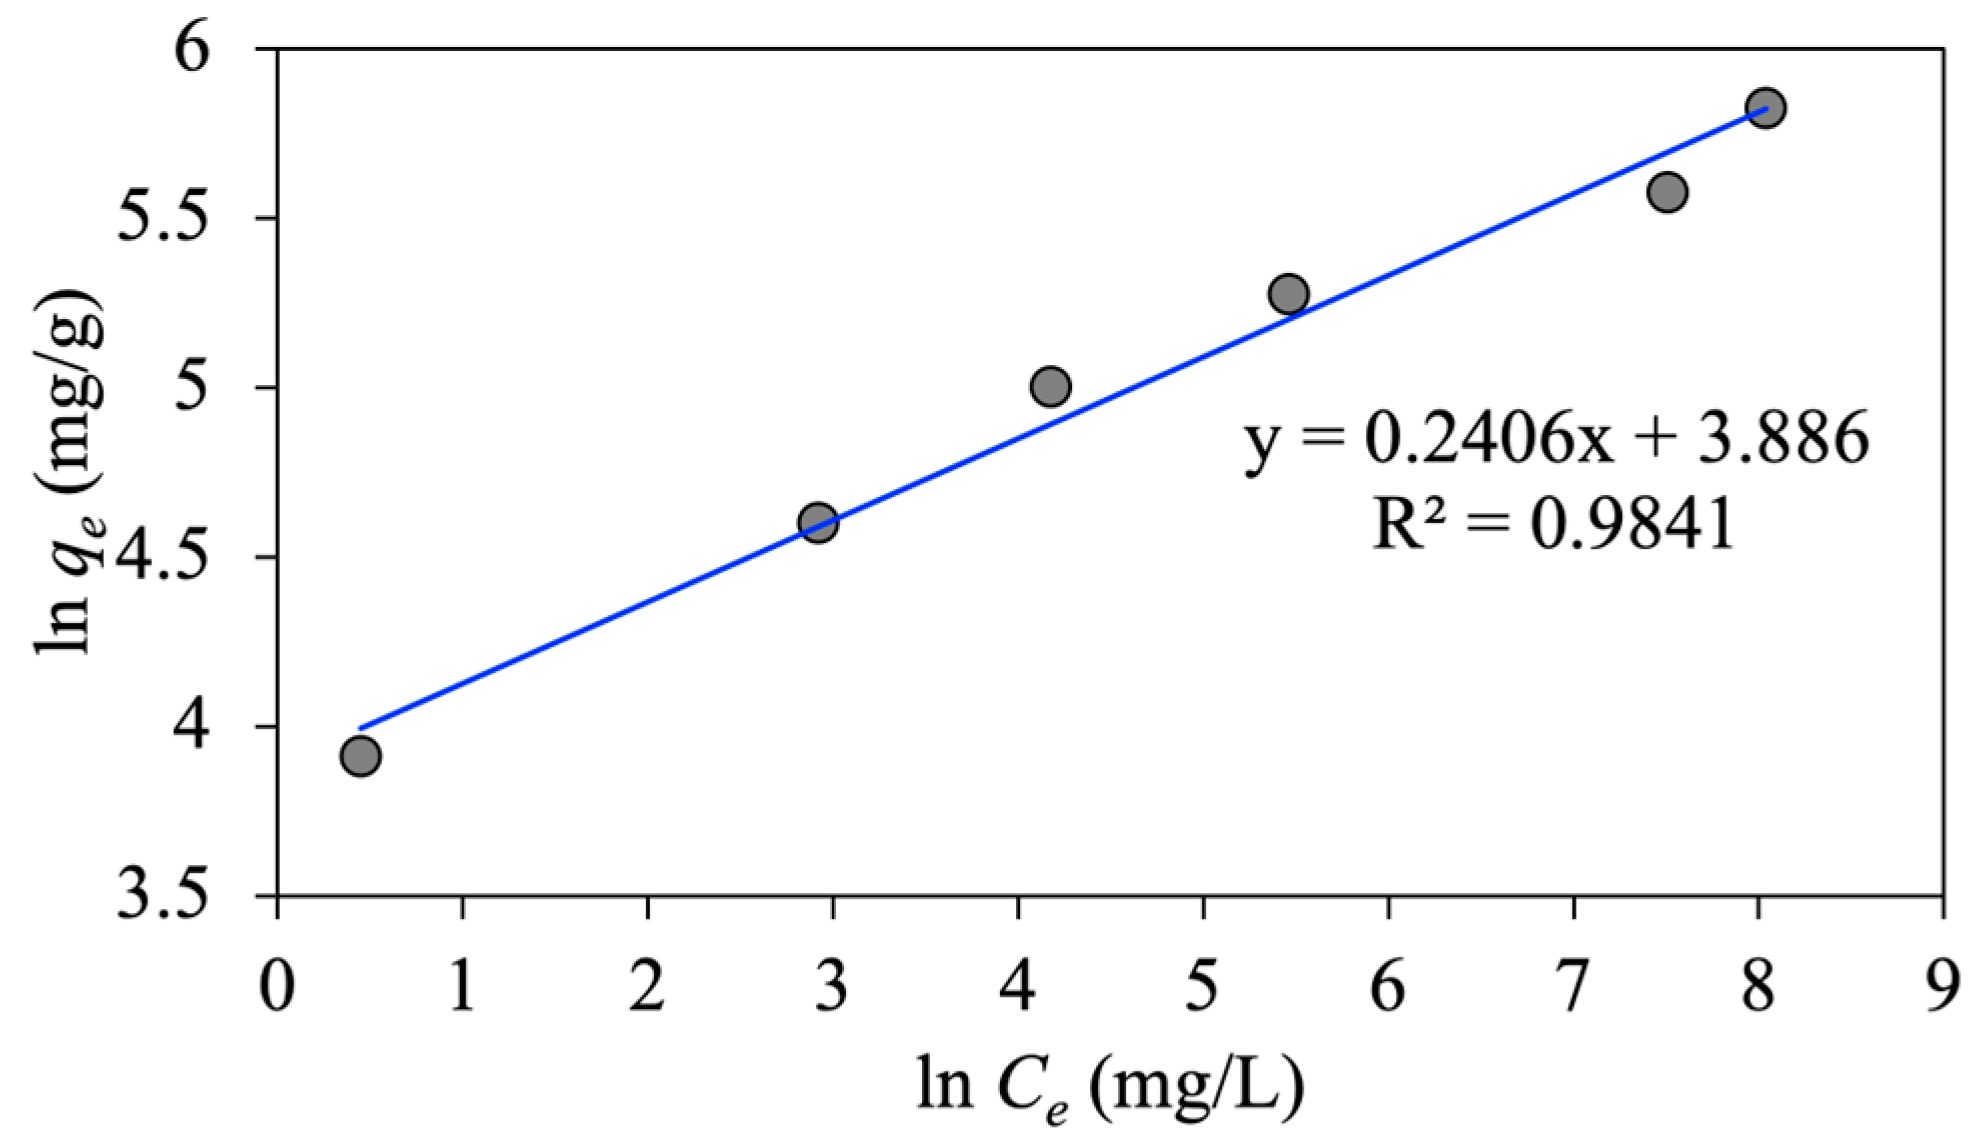
As shown in
Figure 7, the intercept and slope of
versus
give the values of Freundlich constants of
and
, respectively. The value of
in the literature is in the range of 0.1–1;
implies a favorable adsorption process with a stronger adsorbate-adsorbent interaction [
35]. Moreover, this value indicates the shape of
vs.
plot as follows: when
1, the plot is linear;
1 yields a non-linear plot; and
1 and
1 correspond to physisorption and chemisorption, respectively [
31]. As listed in
Table 1, the estimated value of
in our research is 0.24 (
4.156), which reveals a favorable physical adsorption with a strong interaction between the emulsified oil droplets and MNP@CTAB particles. Moreover, the obtained oil adsorption capacity in the linearized regression analysis of the Freundlich model is 48.716 mg/g (
Table 1).
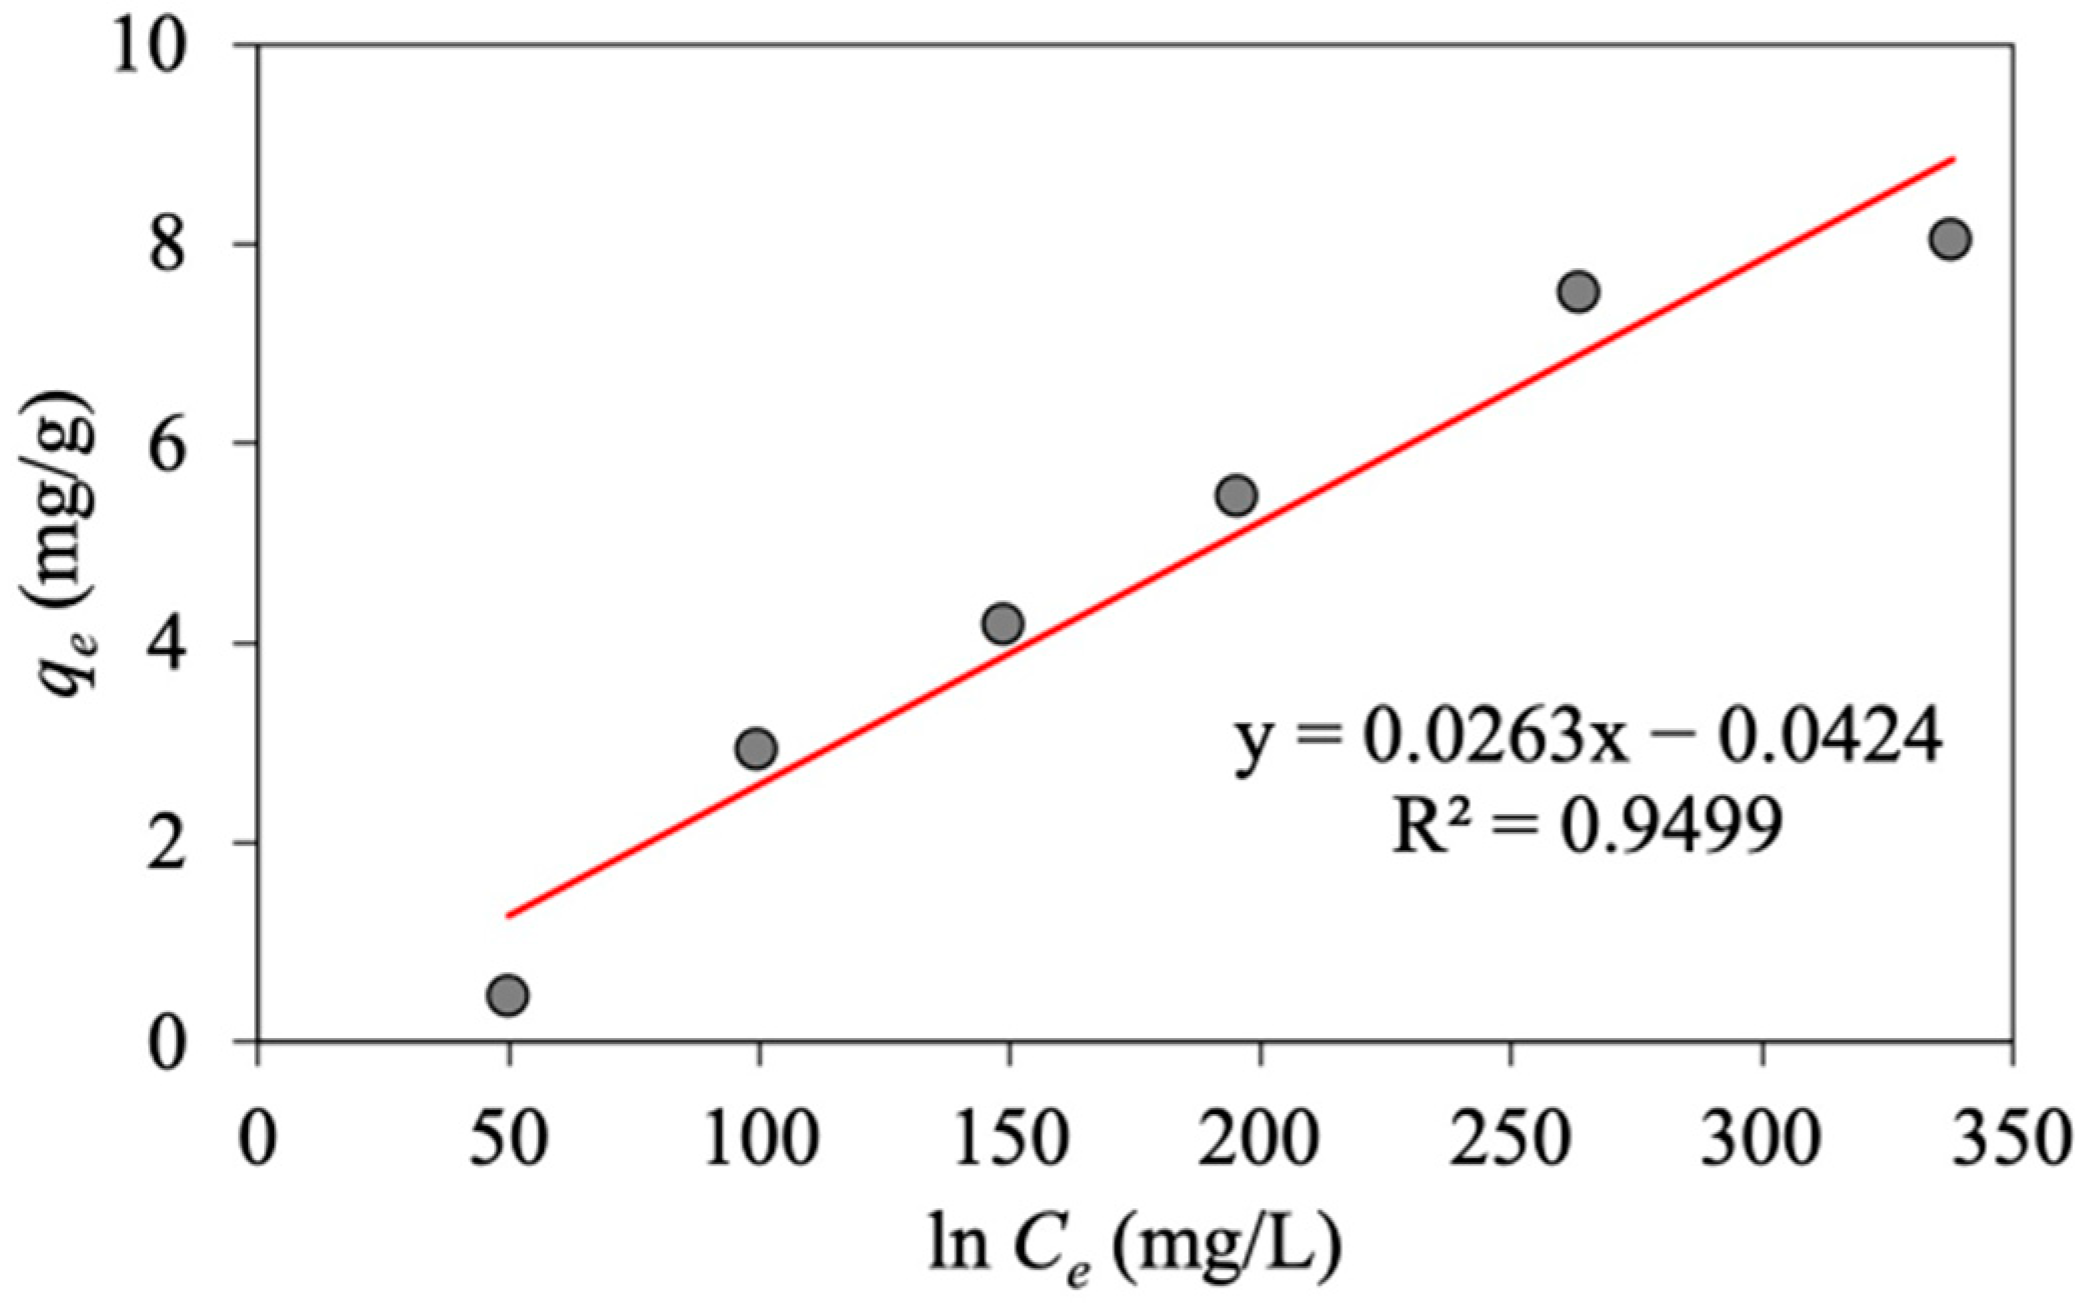
To investigate the Temkin isotherm, the constant values of
and
are determined, respectively, from the slope and intercept, respectively, and based on the linear plot of
versus
, as shown in
Figure 8.
As seen in
Table 1, linearized regression analyses show a relatively greater
R2 value for the Freundlich isotherm (0.975) compared to the two other models. Hence, this model is selected as the best fit for the equilibrium data in the oil adsorption process.
To estimate the non-linear isotherm parameters, the obtained isotherm constant values from linear analytical methods are used as an initial guess. Using a trial-and-error procedure, we apply the solver add-in with Microsoft Excel version 16.72.9 to minimize the calculated regression coefficient (
R2) between experimental data and isotherm models.
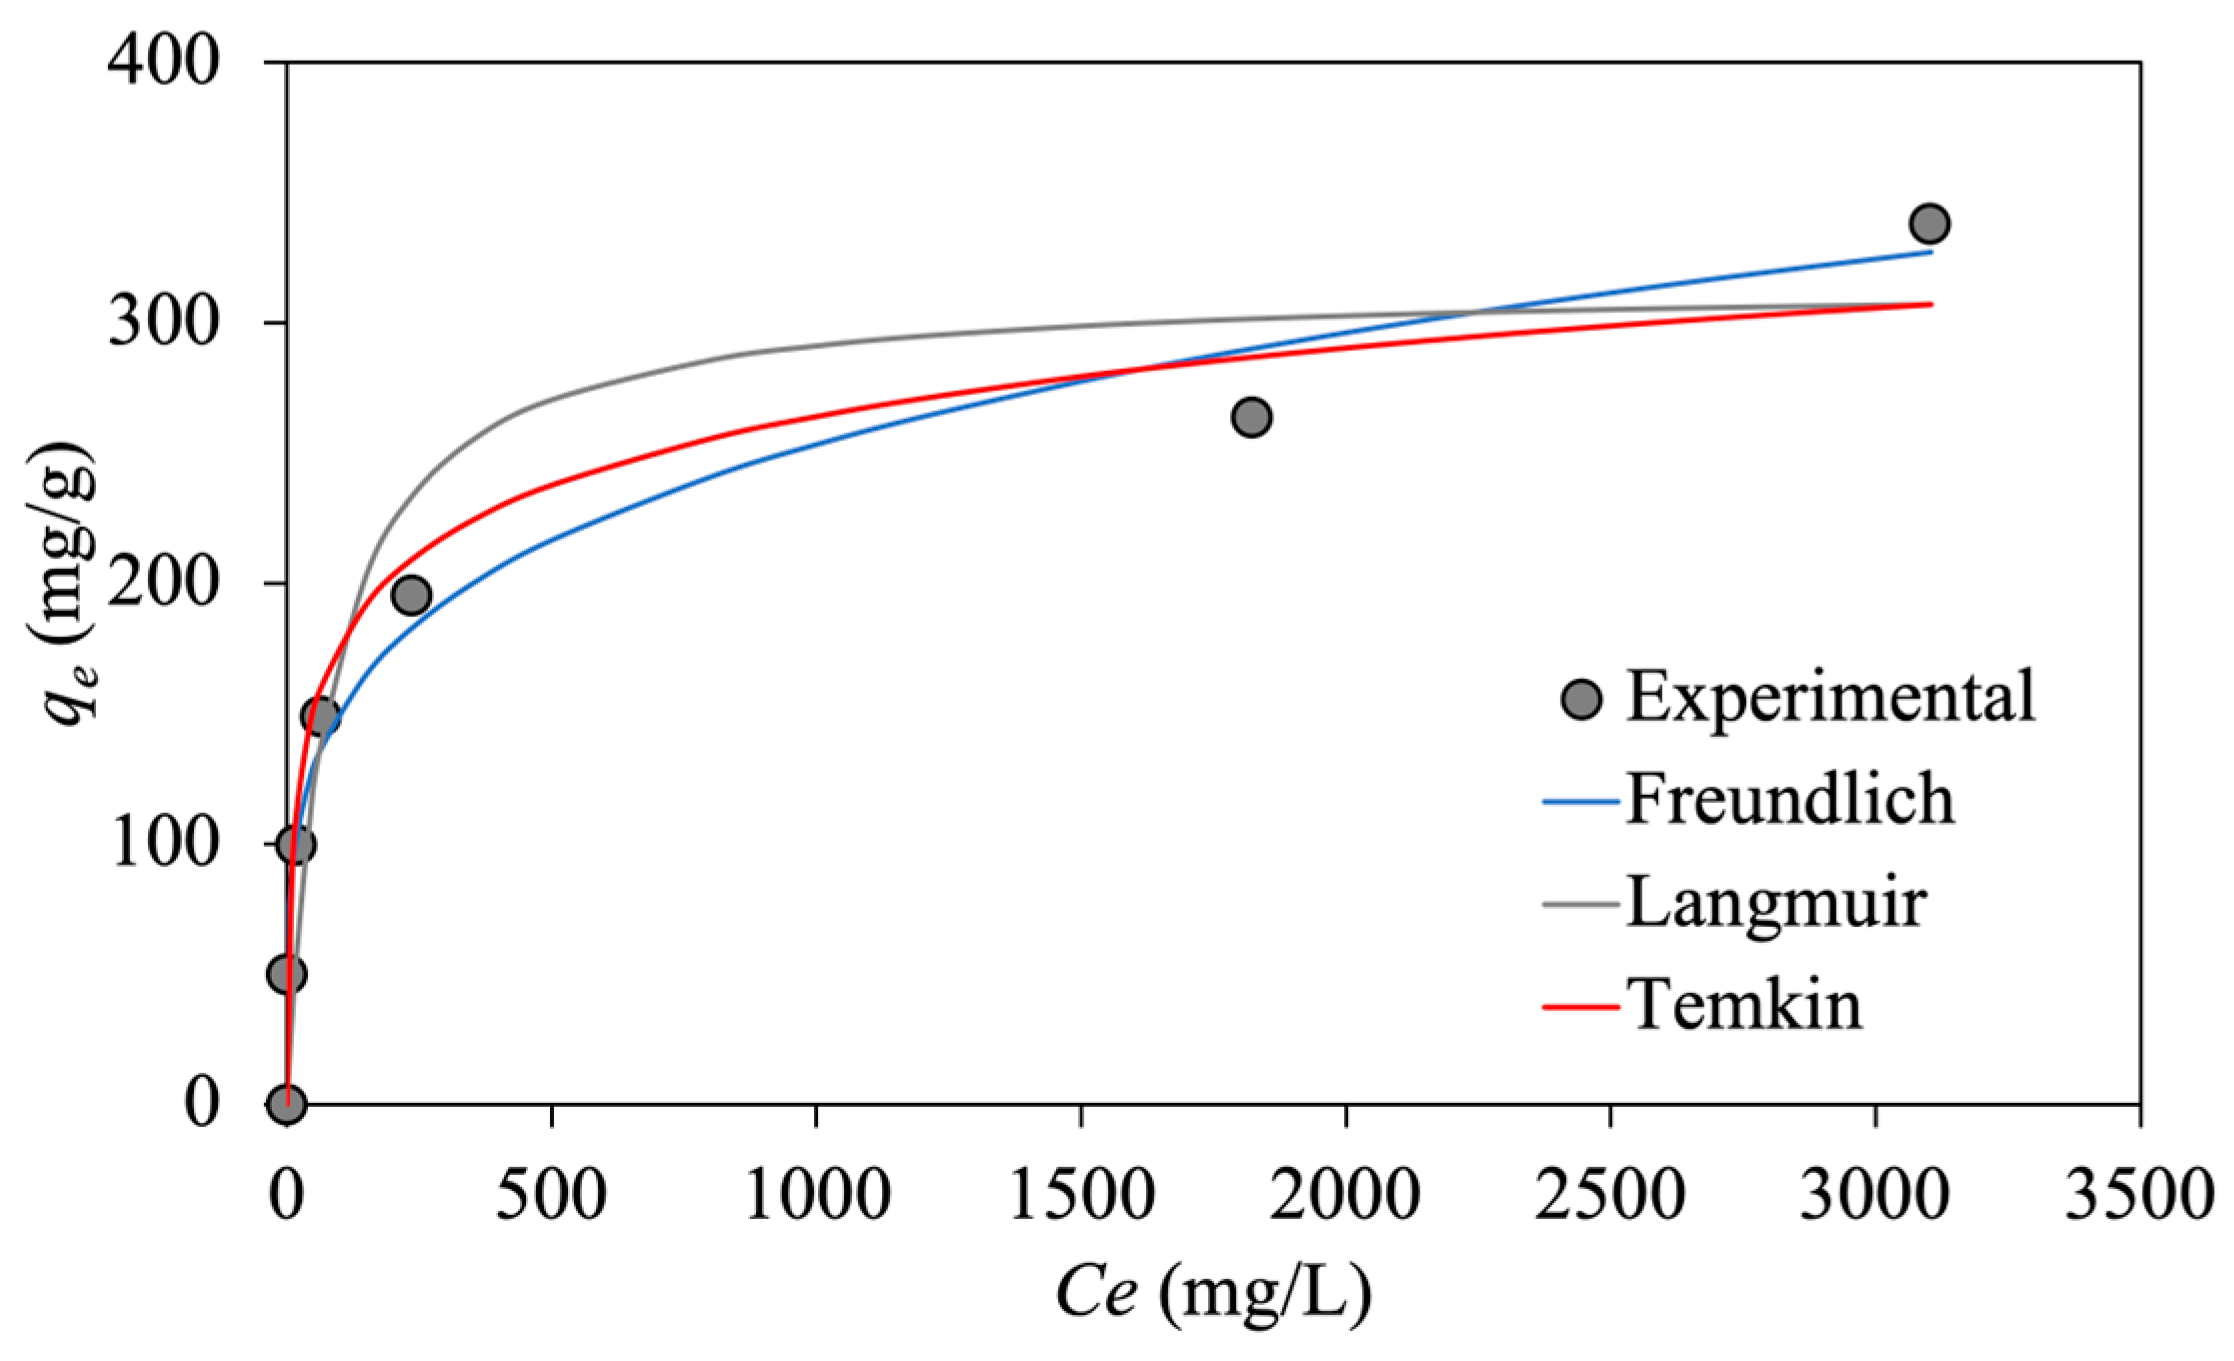
Figure 9 depicts the non-linear plots of different isotherm models versus experimental data for emulsified oil adsorption onto synthesized MNP@CTAB.
The isotherm parameters are optimized using non-linear regression analysis for Langmuir, Freundlich, and Temkin models based on the experimental data, as summarized in
Table 1. As it can be seen, the linear and non-linear regression analyses give similar results, based on the estimated
R2. Therefore, the adsorption equilibrium data fit well to the isotherm models with the order of Freundlich > Temkin > Langmuir. The greater
R2 value in the Freundlich isotherm model (~0.98) in comparison with the other two models confirms reversible physical adsorption of emulsified oil droplets onto the functionalized MNP@CTABs.
3.4. Adsorption Kinetic Results
The estimated adsorption kinetic parameters and the corresponding
R2 values are provided in
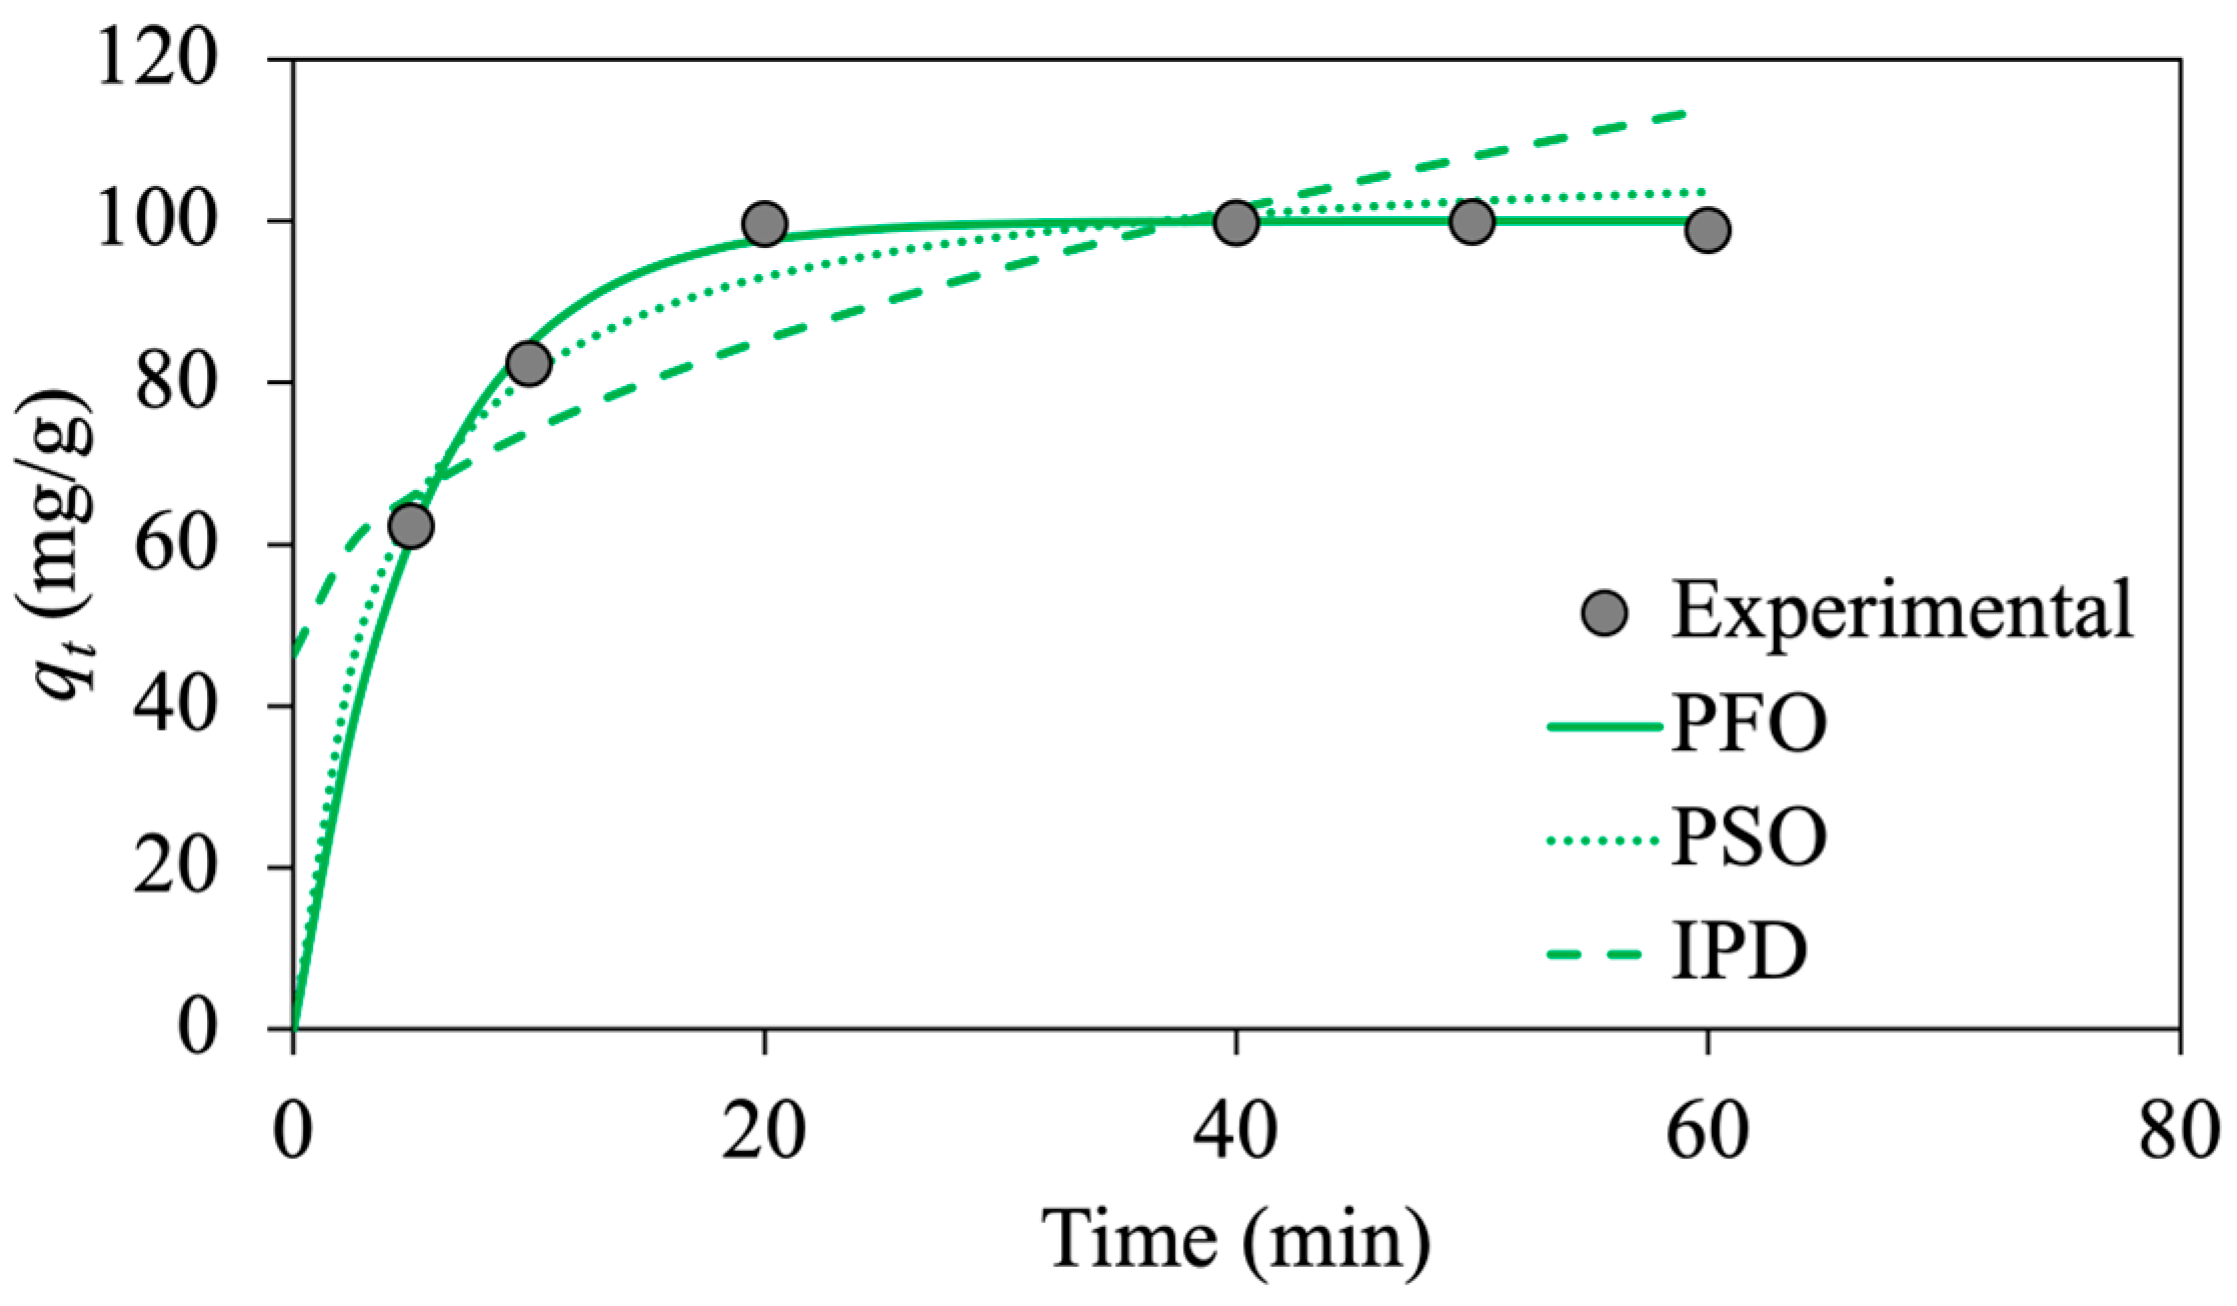
Table 2. According to the non-linear regression analysis, the PFO kinetic model with a higher
R2 value (0.99), is the best model to describe the oil adsorption process using functionalized MNPs, verifying the physical adsorption of emulsified oil droplets onto the prepared MNP@CTABs. Moreover, the estimated value of
from the PFO model is 99.99 mg/g, which is close to the experimental value of 99.90 mg/g, reflecting an excellent fit to experimental data.
The lower R2 value of the IPD kinetic model (0.67) indicates that this model is not applicable for predicting the oil adsorption kinetics/dynamic behavior. This means that the adsorption rate is not limited by the mass transfer of oil droplets from emulsion to the external surfaces of MNPs.
Figure 8 demonstrates the amount of oil adsorption capacity (
) as a function of time. The higher initial slope in the adsorption kinetic plots shows a higher rate of oil adsorption at initial contact times until the system reaches equilibrium (quantified by plateau) after 30 min. Most of the adsorption occurs within 20 min, indicating a high oil adsorption rate using functionalized MNP@CTABs. As depicted in
Figure 10, the PFO model kinetic model describes the adsorption kinetic the best as there is a better agreement between the experimental and calculated oil adsorption capacities from this model.
Similar observations are reported in the literature for polysaccharide adsorption using superparamagnetic nanoparticles [
26] and dye removal using magnetic chitosan nanoparticles [
20]. Therefore, the PFO and Freundlich models are successful in describing the kinetic and isotherm of the adsorption process in our study, respectively. As mentioned, kinetic and isotherm adsorption models are essential to understand adsorption behaviors and provide valuable insights for scale-up and optimization purposes. A kinetic investigation focuses on the rate and mechanism of adsorption, while an isotherm study determines the maximum amount of adsorption capacity. This information is valuable for designing efficient adsorption systems through optimizing the adsorption process, selecting the most suitable adsorbents, and predicting adsorption behavior under different conditions.
