Article

AI-Based Computational Model in Sustainable Transformation of Energy Markets

1
Faculty of Computer Science, Kazimierz Wielki University, Chodkiewicza 30, 85-064 Bydgoszcz, Poland
2
Faculty of Mechanical Engineering, Bydgoszcz University of Science and Technology, Kaliskiego 7, 85-796 Bydgoszcz, Poland
3
Faculty of Mechatronics, Kazimierz Wielki University, Chodkiewicza 30, 85-064 Bydgoszcz, Poland
*
Author to whom correspondence should be addressed.
Energies 2023, 16(24), 8059; https://doi.org/10.3390/en16248059
Submission received: 13 November 2023 / Revised: 10 December 2023 / Accepted: 12 December 2023 / Published: 14 December 2023

Abstract

:
The ability of artificial intelligence (AI) to process large amounts of data, analyze complex patterns, and make predictions is driving innovation in the energy sector and transformation of energy markets. It helps optimize operations, improve efficiency, reduce costs, and accelerate the transition to cleaner and more sustainable energy sources. AI is playing an increasingly important role in transforming energy markets in various aspects of the industry in different ways, including smart grids and energy management, renewable energy integration, energy forecasting and trading, demand response and load management, energy efficiency and conservation, maintenance and asset management, energy storage optimization, carbon emission reduction, market analytics and risk management, exploration and production, regulatory compliance, and safety. The aim of this article is to discuss our own AI-based computational model in sustainable transformation of energy markets and to lay the foundations for further harmonious development based on a computational (AI/ML-based) models, with particular reference to current limitations and priority directions for further research. Such an approach may encourage new research for the practical application of AI algorithms in critical domains of the energy sector.

1. Introduction

The ability of artificial intelligence (AI) to process large amounts of data, analyze complex patterns, and make predictions is driving innovation in the energy sector and the transformation of energy markets. Machine learning (ML), which is part of AI, as a data-driven approach allows the extraction of rules and mechanisms from datasets, both large (big data) and small (small data sets). This helps to optimize operations, improve efficiency, reduce costs, and accelerate the transition to cleaner and more sustainable energy sources, both from the viewpoint of the entire electricity system and the individual household [1].
AI is playing an increasingly important role in transforming energy markets across various aspects of the industry in a variety of ways, including smart grids and energy management, renewable energy integration, energy forecasting and trading, demand response and load management, energy efficiency and conservation, conservation and asset management, energy storage optimization, carbon reduction, market analysis and risk management, exploration and production, compliance, and security. The importance of this research stems from the fact that energy accelerates the development of all modern sectors of the economy (especially energy, heating, cooling, and transport), therefore its supply, price fluctuations, and difficulties in accessibility are of great economic, social, and business importance, and any ways of optimizing its consumption are valuable. At the same time, sustainability at every level (from global down to the individual household) is a compromise between the state of the environment, social, and economic needs [2]. Digitization and the implementation of AI/ML even address issues such as the transformation of the mining sector in order to improve sustainability indicators [3].
The climate crisis is causing an increased emphasis on the use of renewable energy sources, energy storage systems, and AI/ML-based smart load control in so-called virtual power plants that integrate distributed energy resources to balance energy supply and demand. Such solutions, as part of the energy market, allow independent planning, energy trading and sharing, and easier and faster control regarding energy demand, thereby increasing system stability [4]. This will make it easier to counteract energy poverty which occurs when consumers are unable to buy enough energy to meet their needs at a socially acceptable level. The energy transformation must be properly managed, because of the inappropriate and ill-considered restriction of the energy market (also within the European Union (EU), where countries have different resources, needs, and climates, e.g., different lengths of the winter heating period may lead to escalation.
Various scenarios, methods, and tools are needed here: from expert research and mathematical and statistical approaches to the extensive use of analytical, management, and prediction tools based on AI. Interestingly, the level of gross domestic product (GDP) per capita affects the level of energy consumption from renewable sources and solving the problem of energy poverty [5].
Moreover, investments in research and development alongside external cooperation directly affect the scope of green technologies (GTI) of Energy Internet (EI) enterprises, while environmental protection regulations, enterprise development strategies, market competition, and business models remain key here [6]. A sustainable circular energy economy (CE) is based on the digital sufficiency framework, where information technology and digital manufacturing technologies support the above-mentioned trends, as well as the development of research and access to subsidies at national and international levels. Their cumulative positive effect may encounter obstacles in the form of administrative barriers. Building social awareness alone without financial incentives may not be enough, as it requires effort and costs, largely from entrepreneurs [7].
The energy transformation implemented within so-called prosumer capitalism is a developing adaptive socio-economic process, the complexity of which depends on spontaneously emerging, unpredictable phenomena on energy markets. The impact on the above-mentioned speed of development depends not only on legislation, energy distribution, the degree of democratization, or the sense of civil freedom, but also, for example, the degree of cybersecurity. Therefore, the concept of the so-called complexity catastrophe (i.e., exceeding the upper limit of the complexity of such a system related to the breakdown of its adaptive capabilities), the analysis, prediction and prevention of which are all dealt with via AI systems [8].
This changes the ways of describing and modeling contemporary energy relations and energy market development strategies, making it possible to move from the analysis of its effectiveness and focus more on the analysis of survival/stability/energy security under the influence of external environmental factors. Energy independence and the development of “prosumer cooperatives” contribute to the identified effective energy strategy and the achievement of a better ecological situation by reducing CO2 emissions and striving for climate neutrality [9]. Today, companies are taking a proactive rather than reactive approach to environmental, social, and governmental issues related to transformation [10]. Key motivation and factors are shown in Table 1 and Table 2.
It is worth developing our understanding of AI in the broader context of energy transition as a component of globalization, energy transition, green competitiveness processes, and sustainable development. The functionality of the renewable energy sector in context of the energy transition of the national economy significantly influences the creation and use of modern technologies and enhances the country’s competitiveness and innovation. Legal (lack of or inadequacies in legal acts), physical (solar, wind and biomass as the most promising), and mental (the need to educate the public, but also to create a pool of RES specialists) conditions and their impact on the RE sector and the low-carbon economy are crucial here. This will contribute to both the continued creation of new jobs (in planning, design, generation, and operation) and the reduction of harmful emissions to the environment. Undoubtedly, the energy transition is multidimensional—involving technical/technological, economic, social, institutional, and legal dimensions. Furthermore, the dynamics of the global energy transition have been accelerating over the past decade, somewhat due to the inclusion of AI. Increasingly, the analysis, imaging, and management of the above-mentioned processes exceeds the capacity of human teams and needs to be supported by advanced inference and predictive models.
Panel data from 27 EU member states in 2011–2020 confirm that favorable geographical location, economic development, and high employment in the high-tech production sector, active participation in political life, and economic freedom support the development of the renewable energy sector, and the increase in unemployment negatively affects their implementation. Interestingly, the level of corruption and democracy, as well as the abundance of natural resources do not have a statistically significant impact on this, and the promotion of renewable energy sources includes economic deregulation, open market development, and education transformation [11].
The decarbonization strategy for the oil and gas market sets out directions for improving the strategic planning systems of oil and gas companies to ensure sustainable development as part of the global energy transformation. This allows for a broad understanding of the transformation of the energy system and its role in the new market [12]. Legislative efforts depend on the involvement of parties with often conflicting positions in facilitating/hindering the spread of innovation and system-wide changes in sustainability. Market entry conditions, exchange rules, remuneration levels, pricing systems, etc. can be shaped through legal means and market-shaping strategies, mainly in order to increase/maintain market shares, much to the detriment of competing entities [13].
Costly and restructuring changes as part of the energy transformation process concern coal mining companies in Poland, but this restructuring, neither effective nor efficient, has contributed to accelerating changes in the energy mix [14]. The share of the energy sector in global CO2 emissions is approximately 80%, implying a need for the following:
  • transition to low-emission energy production and a decentralized system for more efficient energy distribution;
  • energy exchange modeling;
  • creating algorithms for the local energy market;
  • development of energy exchange models with flexible data entry or deterministic price patterns;
  • achieving competitiveness of combined heat and power plants and energy feedback devices;
  • qualitative and quantitative comparison of different models [15].
Synergies between knowledge transfer and economic impact (income, jobs, etc.) of the renewable energy sector have different profiles in individual EU countries, so outside of the EU/Europe, these profiles may be even more diverse [16]. The change in the energy mix raises challenges regarding the management of unused energy resources in conditions of security and the reliability of the power system, with competitive electricity prices [17]. The increased interest of domestic banks in the ecological financing of investments in the energy market causes changes in the level and structure of bank loans. The increase in financing green investments with bank loans on the energy market (including in Poland) requires strengthening the synergy of responsible financing of sustainable economic development. Increasing the pro-ecological awareness of the financial sector is an insufficient preliminary condition for further energy transformation [18]. The study of the progress in the integration of the energy markets of the EU Member States (EU-27) showed that the energy transformation process of the above-mentioned groups of countries is complex and heterogeneous, and has led to the emergence of new, independent, and unique clusters [19].
Smart sustainable cities should effectively address energy management issues, including through energy managers. The combination of descriptive statistics, computational models, and large data sets of an intelligent city somehow forces the use of AI in commercial and non-commercial enterprises, as well as in educational programs and training [20]. A problem may arise when renewable energy plants receiving a variable market premium engage in market pricing. The high share of renewable energy achieved as part of the energy transformation is often (to support investments) associated with the existence of feed-in tariffs. The uncontrolled combination of variable premiums and the high share of hours in which renewable energy sets prices could lead to a downward price spiral [21].
Greater use of AI could make it easier to achieve the difficult trade-off between economic growth and ecological improvement, especially in developing countries. It allows for the reconciliation of long-term economic growth with the diversified regionalization of resources (including energy and raw materials) and growing consumption of renewable energy. This allows for a more effective promotion of energy transformation that can ensure sustainable development in real conditions. A panel study in 30 regions of China (2009–2016) showed low efficiency of energy allocation in China and a non-linear (with a double threshold) relationship between renewable energy consumption and the green transformation of the industry [22].
The aim of this article is to discuss our own AI-based computational model in the sustainable transformation of energy markets and to lay the foundations for further harmonious development based on computational (AI/ML-based) models, with a focus on current limitations and priority directions for further research. This approach can open up research paths for the practical application of AI algorithms in critical domains of the energy sector.
The development of energy cooperatives was chosen as an example to analyze the application of artificial intelligence in the sustainable transformation of energy markets in Poland. Energy cooperatives can become an opportunity for Poland to make a profound transformation towards a sustainable, low-carbon economy and revitalize civic life. They are also an alternative to an energy sector based on large corporations and coal-fired power plants. Issues of distributed generation and energy cooperatives are gaining an increasing role, both in the scientific literature and in the construction of EU scenarios and strategies up to 2030. The most important trend in this respect is the creation of plans for the direct management of their energy systems by local communities. These local initiatives are heralded as precursors to a potential distributed generation network, in which large central power plants are replaced by multiple distributed and smaller generation sources (Figure 1) [23,24,25].
A key advantage of such a community operating, for example, as a cooperative or an organization with another legal form is the possibility of exchanging energy between the members of said community. In Directive EU 2018/2001, Europeans are explicitly granted the right to share the renewable energy produced by the production units owned by this energy community. At the same time, it is irrelevant whether the necessary generation and storage facilities are privately owned by individual members of the community or owned by the community as a whole, as long as the managers of the facilities operate under the definition of a renewable energy prosumer. There are already around 3400 citizen-owned energy cooperatives in the EU. The countries with the highest number of energy cooperatives are Germany with around 1800 cooperatives, Denmark with 700, and the Netherlands with 500. The EU’s plans are very ambitious. SEs are one of the key elements of the EU’s energy transition. By 2050, half of Europe’s citizens could produce up to half of the EU’s renewable energy [23,27].
The Polish energy sector requires intensive decentralization. The diversification of energy sources will not only increase the chance of meeting national RES targets but will also enhance local energy security. The emphasis on the national energy strategy should be on supporting and motivating local communities to engage in RES projects. The Polish Energy Policy, in place until 2040, recognizes this need and signals the desire to develop energy cooperatives and energy clusters. Their task is to use local potential in the form of energy sources, raw materials, and people-to-people contacts in order to stimulate local economic development and, in the long term, also to make individual areas independent of energy supplies from the national grid [23,24,28].
Within the scope of its legislation, Poland is promoting the idea of energy cooperatives located in rural and urban-rural municipalities. In this way, the legislator is following in the tradition of cooperation in rural areas throughout Europe and enabling us all to be active in the local production of clean energy for the benefit of the region.
The solution enshrined in the RES Act provides new development opportunities and supports civil society. The prerequisite for taking advantage of the preferences stipulated in the Act is the openness and willingness of residents, farmers, and entrepreneurs, as well as the municipal government, to cooperate. According to, inter alia, Article 38 of the RES Act, the energy cooperative (EC) must meet the following requirements [1,29,30]:
  • It must operate on the territory of a rural or urban-rural municipality as defined by the law on public statistics or on the territory of no more than three directly neighboring municipalities of this type;
  • If the object of its activity is the production of electricity, the total capacity of all RES installations, e.g., PV or wind power, must be able to cover at least 70% of the annual demand of the energy cooperative and its members and must not exceed 10 MW (the last amendment to the RES Act reduced this value to 40%);
  • If the object of its activity is the production of heat, the total thermal power output does not exceed 30 MW;
  • If its object is the production of bio-gas, the annual production capacity of all installations does not exceed 40 million m3;
  • An energy cooperative, like prosumers, cannot dispose of energy today, but only feeds it into the grid;
  • Surpluses can only be stored (surrendered) in the grid and the operator will deduct 40% of the volume from this (1:0.6).
More important, however, besides the limitations, are of course the pluses of EC operation. Under Polish conditions, the EC gains a number of benefits from trading energy exclusively for its members. Some of these benefits result directly from the RES Act and some depend on the business model adopted by its members. Starting from the RES Act, the EC does not pay the obliged seller the fees for its settlement and distribution service fees, the amount of which depends on the amount of electricity consumed by all generators and consumers of the SE. Distribution service fees are paid by the obliged seller to the operator of the SDE to whose grid the RES installations and the installations of all customers of the EC are connected.
With regard to the amount of electricity generated in all RES installations of the EC and subsequently consumed by all electricity consumers of the cooperative, including the amount of electricity billed with a coefficient of 0.6, no RES fee, no power fee, and no cogeneration fee are charged or collected.
Moreover, the obligations to obtain and present a certificate of origin and pay a substitute fee to the ERO President, as well as the obligation to implement an energy efficiency improvement project or obtain and present an energy efficiency certificate to the ERO President for cancellation, do not apply.
In addition, the electricity generated in all of the SE’s RES installations and subsequently consumed by all of the cooperative’s electricity consumers is deemed to be the consumption of electricity produced by the entity and is therefore exempt from excise duty, provided that the total installed electrical capacity of all of the energy cooperative’s renewable energy installations does not exceed 1 MW.
In turn, the benefits of the potentially adopted business model consist of the following:
  • Lower energy price—EC members themselves determine the price at which they will settle based on the adopted EC statute;
  • Contracts for the sale and purchase of energy are multi-annual, ensuring stability and predictability of both revenues and costs over the long term;
  • By using local fuel resources and the local grid, security of supply is increased;
  • Environmental pollution is reduced due to the use of mainly RES;
  • The attractiveness of the EC area for investors is increased due to the availability of cheaper and environmentally friendly energy.
Benefits for the EC do not automatically mean the same benefits for individual members. For an individual EC member, they may differ from the size for the EC as a whole. This is due to several reasons. First of all, each consumer has different energy consumption characteristics over the course of a day and also over the course of individual months. The more energy that is consumed during the operation of the source, the greater the benefits will be.

1.1. The Problem of Analyzing a Dataset on the Billing of Energy Cooperatives

The currently operating power system in Poland was planned and built on the assumption that energy is transmitted unidirectionally—from large system power plants, through the transmission system and distribution network, to the final consumer. Such an arrangement has so far guaranteed a security of energy supply at reasonable generation costs. However, it is not optimal in the context of changes associated with the development of distributed generation and energy cooperatives.
The electricity grid needs to “smartly” stimulate and integrate the actions of generators, consumers, or other energy market players to ensure a reliable, economically viable, and sustainable electricity supply. One of the directions in which solutions are being sought is the reconstruction of the model for the operation of electricity grids and the creation of local systems functioning as dedicated balancing areas.
The basis for building such areas is the development of technologies related to the intelligent grid and energy storage, as well as energy management systems, including settlement between participants in local balancing within an energy community, such as an energy cluster or energy cooperative. This will make it possible to increase the reliability of energy supplies and improve the security of the operation of distribution and transmission networks.
As part of the establishment of energy cooperatives, it is necessary to carry out a detailed simulation of intra-cooperative energy trading between its members, including the identification of tax and formal issues that need to be clarified and the provisions of the cooperative’s statutes made more precise. Currently, the profitability of the cooperative as a whole has been simulated in Poland, indicating its profitability and formal feasibility using, for example, the Renaldo calculator (Figure 2) [28,31]. This type of tool makes it possible to perform a comparative analysis for the different types of hourly characteristics of facility consumption and generation from selected RES technologies, and to determine the degree of coverage of the aggregate balance for the energy cooperative, as well as any deviations. The tool also makes it possible to determine the economic efficiency of the energy cooperative, and to find the optimal model is to develop a tool that makes it possible to model profiles and to select the optimal sources of RES generation in order to meet the needs of the members of the cooperative. In conclusion, it is possible to determine the economic efficiency of the energy cooperative and to find the optimal model [27,30].
Why is it so important to properly select distributed generation units to meet the consumption needs of members of an energy cooperative? An energy cooperative should aim to balance itself hourly. The degree to which the hourly energy consumption profile of the members of the cooperative is covered by the energy production profile is crucial in terms of the profitability of the energy cooperative’s operation. The energy cooperative’s generation source profiles need to be selected so that the best possible balancing effect is achieved while still being economically viable.
A detailed verification of investment needs (technical simulations of the size of RES installations and their cost) and identification of funding opportunities are also needed in order to prepare the relevant applications (Figure 3).
As a result of imbalancing and leaving 40% of the energy with the seller, the energy cooperative has to purchase this energy for consumers at market prices. If the rebalancing were complete, the EC would only use its own energy and would not incur distribution service costs. This can be achieved by selecting energy consumers/generators with regulatory capacity. Another way is to install energy storage either centrally (with RES installations) or at the consumer level. Such storage can include central water boilers or gas tanks at biogas plants. Storage can also take place by forcing heat pumps to switch on, which store energy in buffer tanks or hot water tanks. Battery storage is another solution. A very developing aspect for the future is the use of electric cars in energy balancing. The batteries in the cars using V2G (Vehicle to Grid) chargers will become home energy stores. The more the amount of energy produced is balanced with the amount of energy received at any given time, the greater the economic effects for the SE. When fully balanced, the distribution grid will only provide continuity of energy supply and secure the internal energy economy.
The cheapest method ultimately appears to be one based on an appropriate selection of members of the energy cooperative. The energy cooperative should select members in such a way as to ensure maximum balancing at all hours. Proper selection of EC members, ensuring a high level of ongoing balancing of energy generation and consumption, can thus bring tangible benefits.

1.2. Tools for Designing Energy Cooperatives—The Need to Use Artificial Intelligence

The implementation of a local balancing model, managed by energy cooperatives, requires the introduction of new technical solutions in the area of smart grids, mainly to improve the monitoring of medium- and low-voltage networks. One of these is the use of smart meters. A smart meter, understood as a set of devices used to measure electricity and to transmit metering information by means of an ICT system, can become an important element of the network through which balancing activities for a given area can be carried out. A local balancing area can behave like an active consumer and take energy when it gets the right price signal. It can also reduce energy consumption or even supply energy to the electricity system, in which case it behaves like a virtual power plant [23,28,31]:
  • Modelling of daily/hourly balance and aggregated to month and year level;
  • Setting self-consumption levels;
  • Use of different types of generation sources;
  • Mapping of actual, different generation profiles;
  • Mapping of the actual different consumption profiles;
  • Illustration and visualization of results.
Identifying the electricity deficit within the analyzed energy cooperative community is the input for the investment analysis. Based on preset economic and pricing parameters, this tool allows analyses to be carried out for the selection of the most economically rational energy generation source (both from the perspective of the source’s capacity, the type of primary energy used and the generation profile) to cover the identified energy community’s balancing needs.
This type of tool allows for the export of information about the optimally selected generation sources and profiles, which can, in a feedback loop, be imported into the balance calculator. Investment analysis is also used to assess the return on investment, as well as visualizing and calculating key investment ratios, taking into account the following:
  • Current and projected costs (levelized cost of electricity—LCOE);
  • Current and projected market price levels for energy;
  • Parameters determining the productivity and efficiency of generation sources;
  • Generic structure of investment and operating costs.
The target challenge, however, will be to eventually automate the billing processes within the energy cooperative, allowing for the turnover, balancing, and energy billing processes within the cooperative to be streamlined:
  • Forecasting of energy supply, demand, and prices, continuous energy balancing for members of the energy cooperative;
  • Integration in a distributed block register of energy flows read from meters, sub-metering devices or from DSO databases for evidence, billing, and balancing control purposes;
  • 1 min monitoring of the state of selected elements of the power grid at set time intervals and alerting on threats or situations requiring human intervention;
  • Analysis of the operation of electricity and heat storage facilities as a tool for optimal energy balancing in energy communities.

2. Material and Methods

2.1. Data Set

So far, for energy cooperatives, an RES share of 70% has been indicated for the annual consumption of individual connection points on an annual basis. For the time being, there are about a dozen energy cooperatives in Poland at the notification stage, so actual data (e.g., per minute) for the aforementioned cooperatives will be available from the operator after contracts are signed and metering is carried out. For the aforementioned reasons, the paper develops a model showing the possibility of optimizing variable data with prediction of RES production and balancing using storage and predictable energy consumption parameters of the cooperative members. The objective of the above model is to provide such advanced balancing through AI that the operator gets nothing, i.e., the energy cooperative, due to the balanced production from RES and the consumption of individual members (they can be selected according to the criterion of energy consumption per day), even though it settles with the cooperative with a 0.4 discount system. This is possible but will require advanced billing systems in the energy cooperative. According to Polish law, ensuring adequate hourly balancing at the cooperative will result in the operator not having the right to refuse to connect new RES sources from the cooperative, which has been a huge problem so far due to the limited capacity of the electricity grid.
The choice of input signals for all three modules was based on their availability, i.e., the possibility of simultaneous simple extraction from the PV system interface, followed by the possibility of their use in algorithms/systems based on solutions from the area of AI (including ML).
A dataset from the Polish home PV networks (Figure 4), downloaded minutely for one day (1440 records) in September 2023, was analyzed. The data were read from the system, stored and analyzed with full accuracy, and were rounded only for the purposes of presentation.
Data were collected in an .xls spreadsheet (Microsoft Excel 2023, Microsoft, Redmond, WA, USA). Via this process, 1440 data records were obtained, stored, and prepared for AI processing, i.e., checked for gaps, errors, and outliers and then normalized. Resultant data were randomly divided into two sets: teaching set (70%, i.e., 1008 samples/records) and a testing set (30%, i.e., 432 samples/records).The normalization and scaling of the input and output signals resulted in an equal interpretation of the values of all signals processed by the AI algorithms/systems used for this purpose.
Fourteen following data for each prosumer in the model were analyzed as inputs of three various AI solutions described in the next subsection:
  • Current weather (air temperature (°C), wind speed (m/s), cloudiness (five classes represented by numbers));
  • Weather forecast (air temperature (°C), wind speed (m/s), cloudiness (five classes, e.g., cloudy represented by numbers));
  • Power (Watts);
  • Current power direction (four classes represented by numbers);
  • PV use (Watts);
  • Power network use (Watts);
  • Energy storage status (%);
  • Energy consumption by receivers (Watts);
  • Standardized power (%);
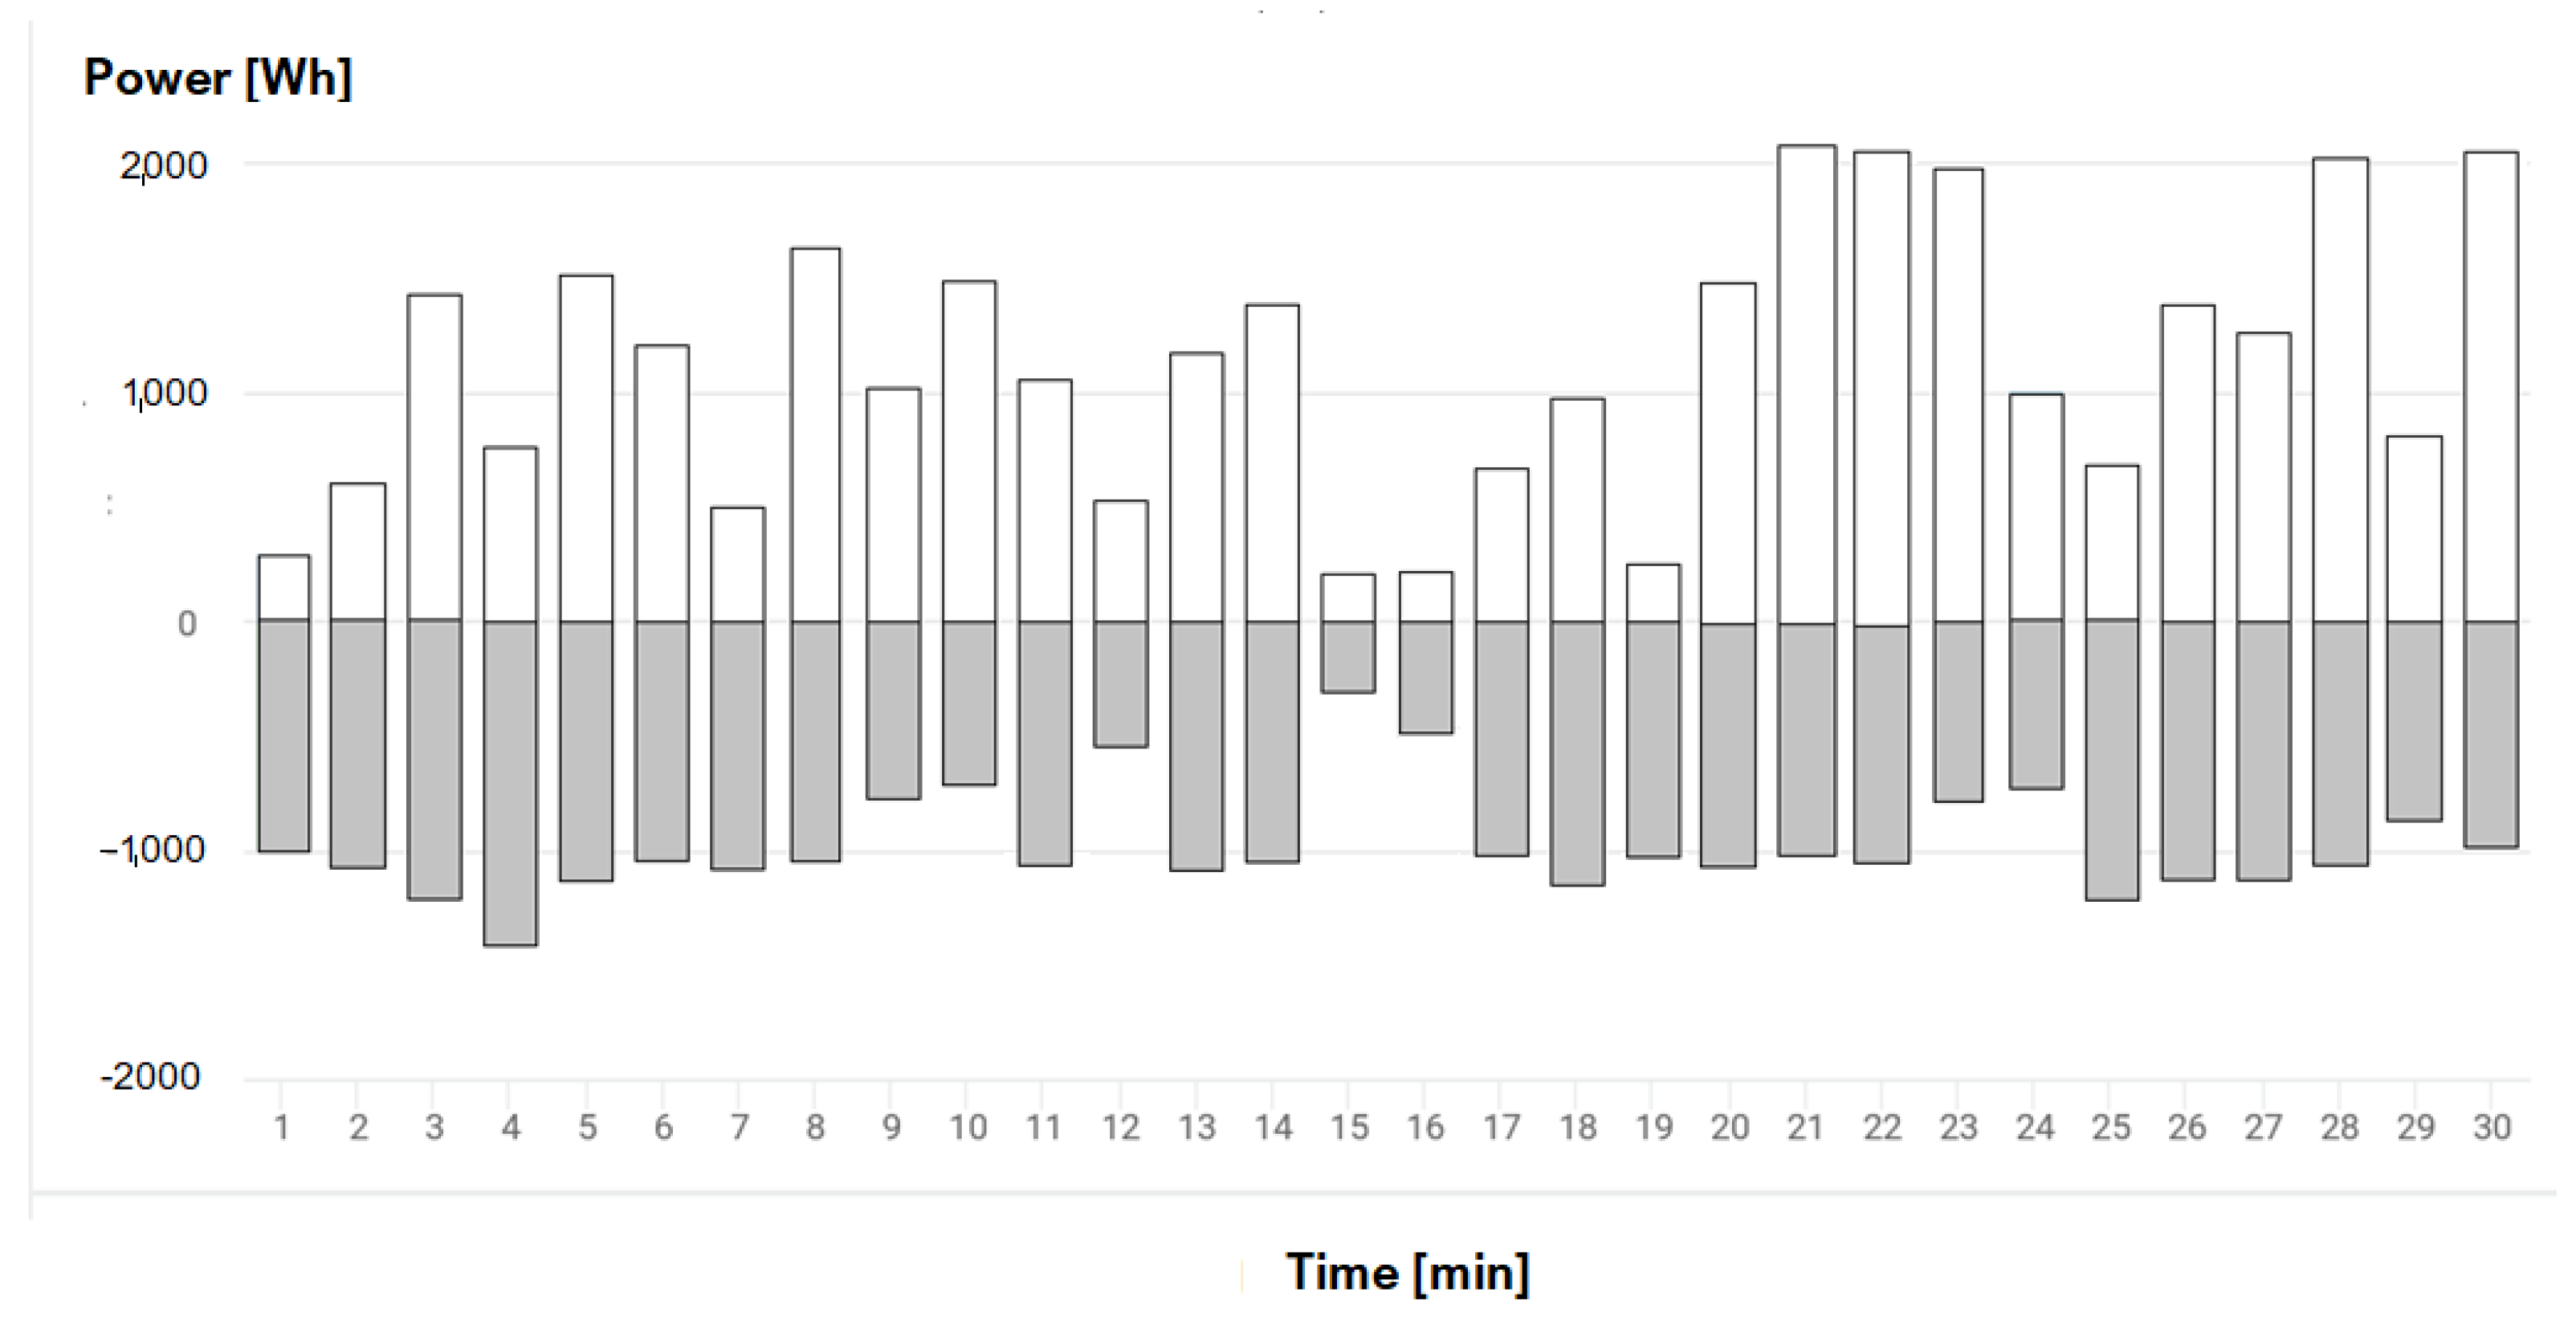
  • Energy balance (Watt/hour);
  • Income (PLN) (daily, monthly, yearly, total);
  • Total CO2 reduction (tons), including equivalent number of trees or car use (km).
The dataset is characterized in Table 3 and Figure 5.

2.2. Computational Tools

The palette of AI methods and tools (including ML) that are, or potentially could be, used in energy transformation is wide (Figure 6, Table 4).
Multilayer perceptron (MLP) and convolutional neural network (CNN) were both used in this study (Figure 7 and Figure 8).
In the article, four approaches were selected to solve the problem of modeling an energy cooperative due to their simplicity, ease, and common use:
  • Linear regression;
  • Non-linear polynomial regression;
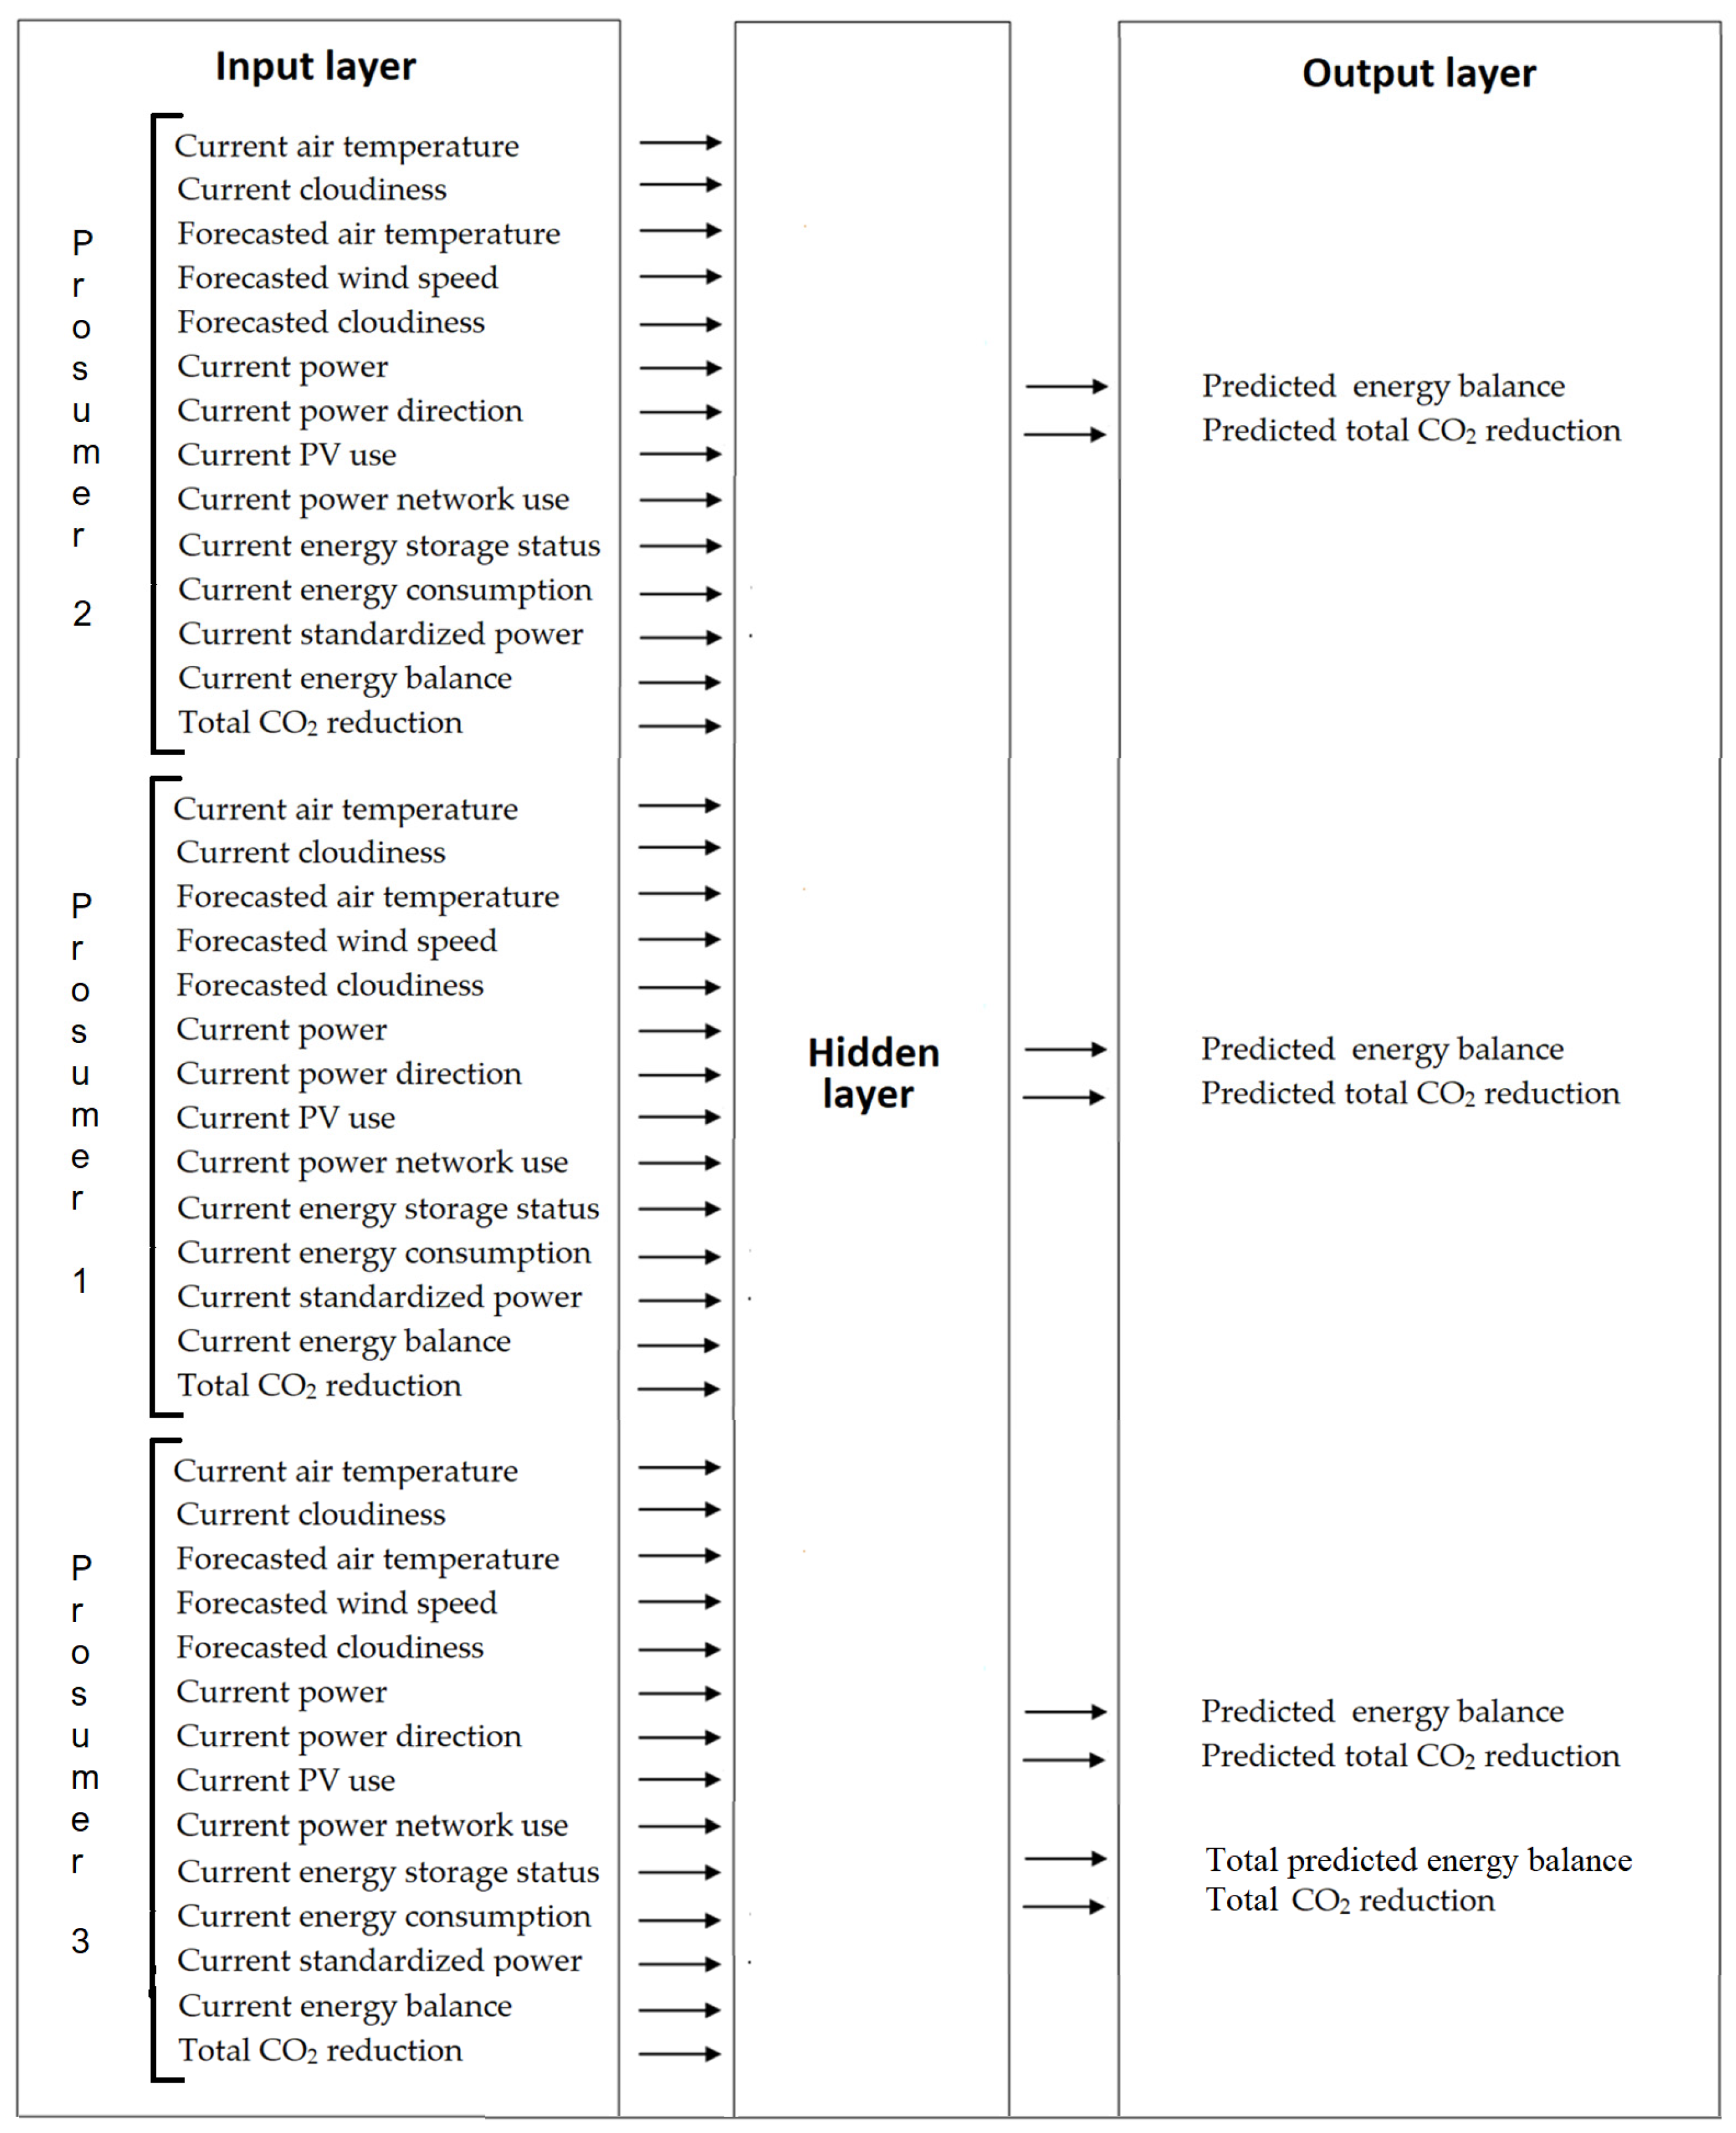
  • Traditional neural networks: multilayer perceptron (MLP);
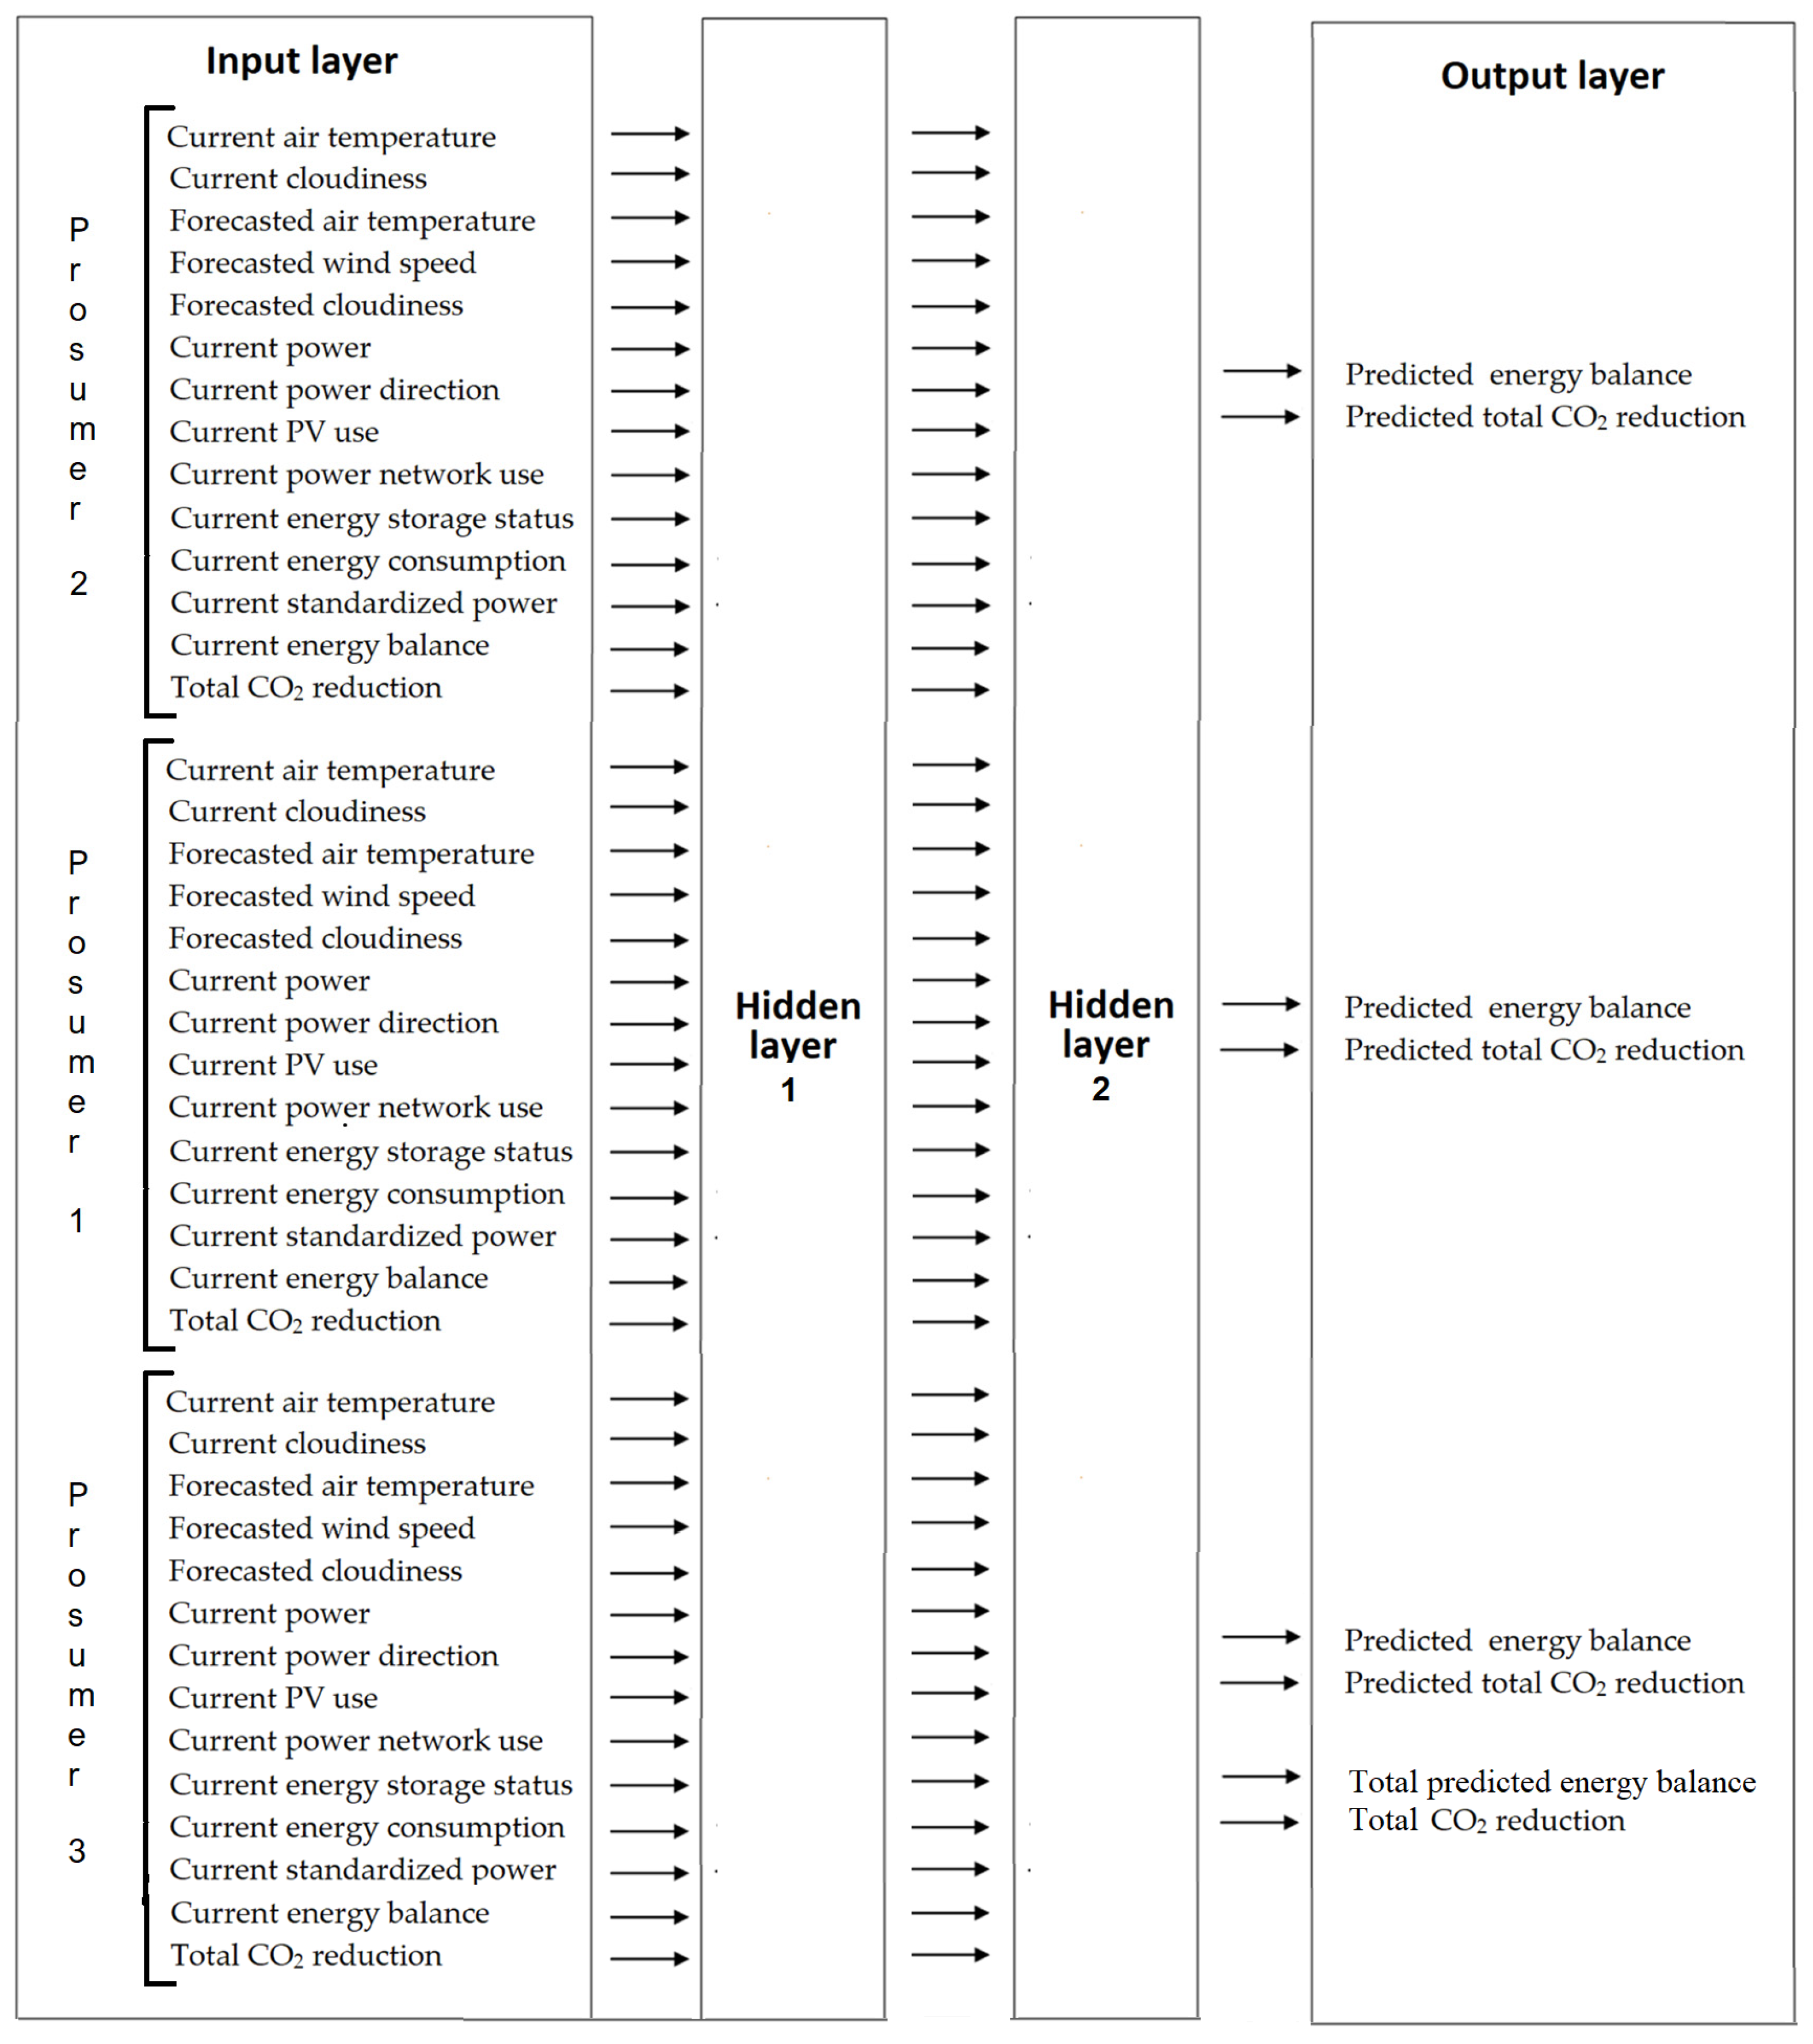
  • Deep neural networks: convolutional neural network (CNN).
The choice between the above approaches depend on factors such as:
  • Task complexity;
  • Time constraints;
  • Available resources;
  • Desired level of customization;
  • Desired accuracy.
Linear regression assumes that there is a linear relationship between the dependent (output) variables and the vector of independent (input) variables, which can be modeled taking into account the random component (error), e.g., using the least squares method. The method is the easiest to apply, although it has low resistance to outliers.
Polynomial regression assumes that the higher the degree of the polynomial, the better the model fits to the nonlinearity of the samples, but the greater the computational complexity. In the case currently under study, it was assumed that the correlation coefficient should be at least 0.8, but it is difficult to estimate what complexity of functions should be expected.
The study also used a data-driven (ML) approach: the study compared two different approaches to solving the same problem, which were MLP and CNN based on Matlab R2023a software with Neural Networks and Deep Learning toolkits (MathWorks, Tulsa, OK, USA). The basic criteria for assessing the effectiveness of the solutions were the RMSE value and accuracy (separately for teaching and testing).
Often, the best results with the simplest structure are provided by a three-layer neural network (multi-layer perceptron (MLP)) with minimum root mean square error (RMSE) optimization, a backpropagation (BP) algorithm, and a naive initialization technique. This provides ease of implementation, rapid convergence, efficiency, and no prior knowledge is required. The operation of MLP is described by the following equations:
y = f(x,Ѳ)
where
  • f—activation function,
  • x—network inputs,
  • y—network outputs,
  • Ѳ—set of parameters mapping input x to an output class y,
where network with three layers is described:
f(x) = f3(f2(f1(x)))
  • f(x)—output of network,
  • f1(x)—output of 1st layer,
  • f2(x)—output of 2nd layer,
  • f3(x)—output of 3rd layer.
Each layer of MLP is described:
y = f(Wx + b)
where:
  • y—output,
  • W—weights,
  • x—inputs,
  • b—bias.
The use of a sigmoidal transfer function described
y = 1   1 e x
In MLP because the choice of a steep transfer function provides better transfer of differences with a larger number of categories, which is important for the examined data.
The CNN used in the study is a four-layer feedforward neural network with two hidden layers with typical normalization for average data sets (the larger the data set, the better, which is important in our case). After passing through the convolutional layer, the input vector is extracted into a feature map (activation map). Convolutional layers convolve the input data and pass the result to the next layer. It is worth noting that in CNN, fully connected layers connect every neuron in one layer to every neuron in another layer, which would give the same effect as MLP. Therefore, the selection of hyperparameters in CNN, thanks to two hidden layers, can give better results than in MLP, especially for more complex input patterns.
The number of neurons in the input layer is determined by the number of inputs, and the number of neurons in the output layer is determined by the number of outputs. The number of neurons in the hidden layer is selected experimentally, initially based on the authors’ experience, and then using the method of successive approximations to the global optimum. This approach requires the examination of, on average, approximately 100 neural networks.
The accuracy of network training in the study was determined as the fraction of predictions for which the model makes correct predictions in the set of normalized training data. An accuracy of 0.8000 (80.00%), means 80 correct predictions for every 100 test examples.
Training the network consisted of repeating the learning patterns and modifying the network weights accordingly until the target RMSE was achieved after a maximum of 1000 epochs.
Data from existing SEs in Poland (there is one operating) and simulation data were used. We have used cross validation based on commonly used performance measures: accuracy, precision, recall, and F1.

3. Results

As shown in this article, the application of artificial intelligence (AI) in the energy cooperative sector is inevitable today. The huge amounts of data that pass through this growth sector create the need to implement AI solutions and the potential to develop these technologies especially in the aspect of energy cooperatives.
What specific AI solutions can be implemented in the Polish energy sector today based on the development of energy cooperatives? Here are some examples [34,35]:
  • Digital Twin—the digital equivalent of a real process and/or device. AI makes it possible to analyze a theoretically infinite number of parameters simultaneously, thereby significantly improving the quality and safety of decision-making processes in the planned energy cooperative;
  • Production optimization—the use of AI algorithms (dedicated machine learning models) to optimize the electricity production process taking into account the entire supply chain. It is also possible to coordinate in-house production and energy purchases to cover shortfalls. This measure is particularly important in the case of biogas plants, where the stability of the substrate supply guarantees the profitability of the entire operations;
  • Vision AI—In practice, this involves analyzing camera images and monitoring the quality of operation of the RES equipment belonging to the energy cooperative—detecting specific situations in the operation of photovoltaic, biogas, or wind power plants. It will be of particular importance in the supervision of distributed installations on municipal sites without access to qualified personnel. Responding quickly to failures means reducing costs and increasing operational efficiency;
  • Smart health and safety—AI helps to detect security breaches and incidents such as unauthorized access or mishandling of RES installations or RES-powered electric vehicles (electric chargers, hydrogen chargers);
  • Behavioral analyses—using AI to predict the behavior of energy consumers (members of the energy cooperative) and reaching out to the mass market with personalized offers (promotion of self-consumption, promotion of energy consumption at specific times when energy is cheap—there is too much energy);
  • Personalized offers—on the basis of data from behavioural analyses, it is possible, using artificial intelligence and, more specifically, advanced recommendation engines, to personalize offers for specific customers of energy cooperatives (different for a farmer, different for a municipality employee, different for companies). The offers can be for tariff products, but especially combined (bundles) with non-tariff products and services;
  • Marketing automation—on the basis of intelligent customer segmentation, it becomes possible to more precisely prepare and enforce marketing campaigns to specific groups (members of the energy cooperative (municipal facilities, farms, companies) and to predict sales effects for new energy cooperative members.
The use of AI systems will allow the application of a distributed energy model based on, among other things, energy cooperatives, which assumes:
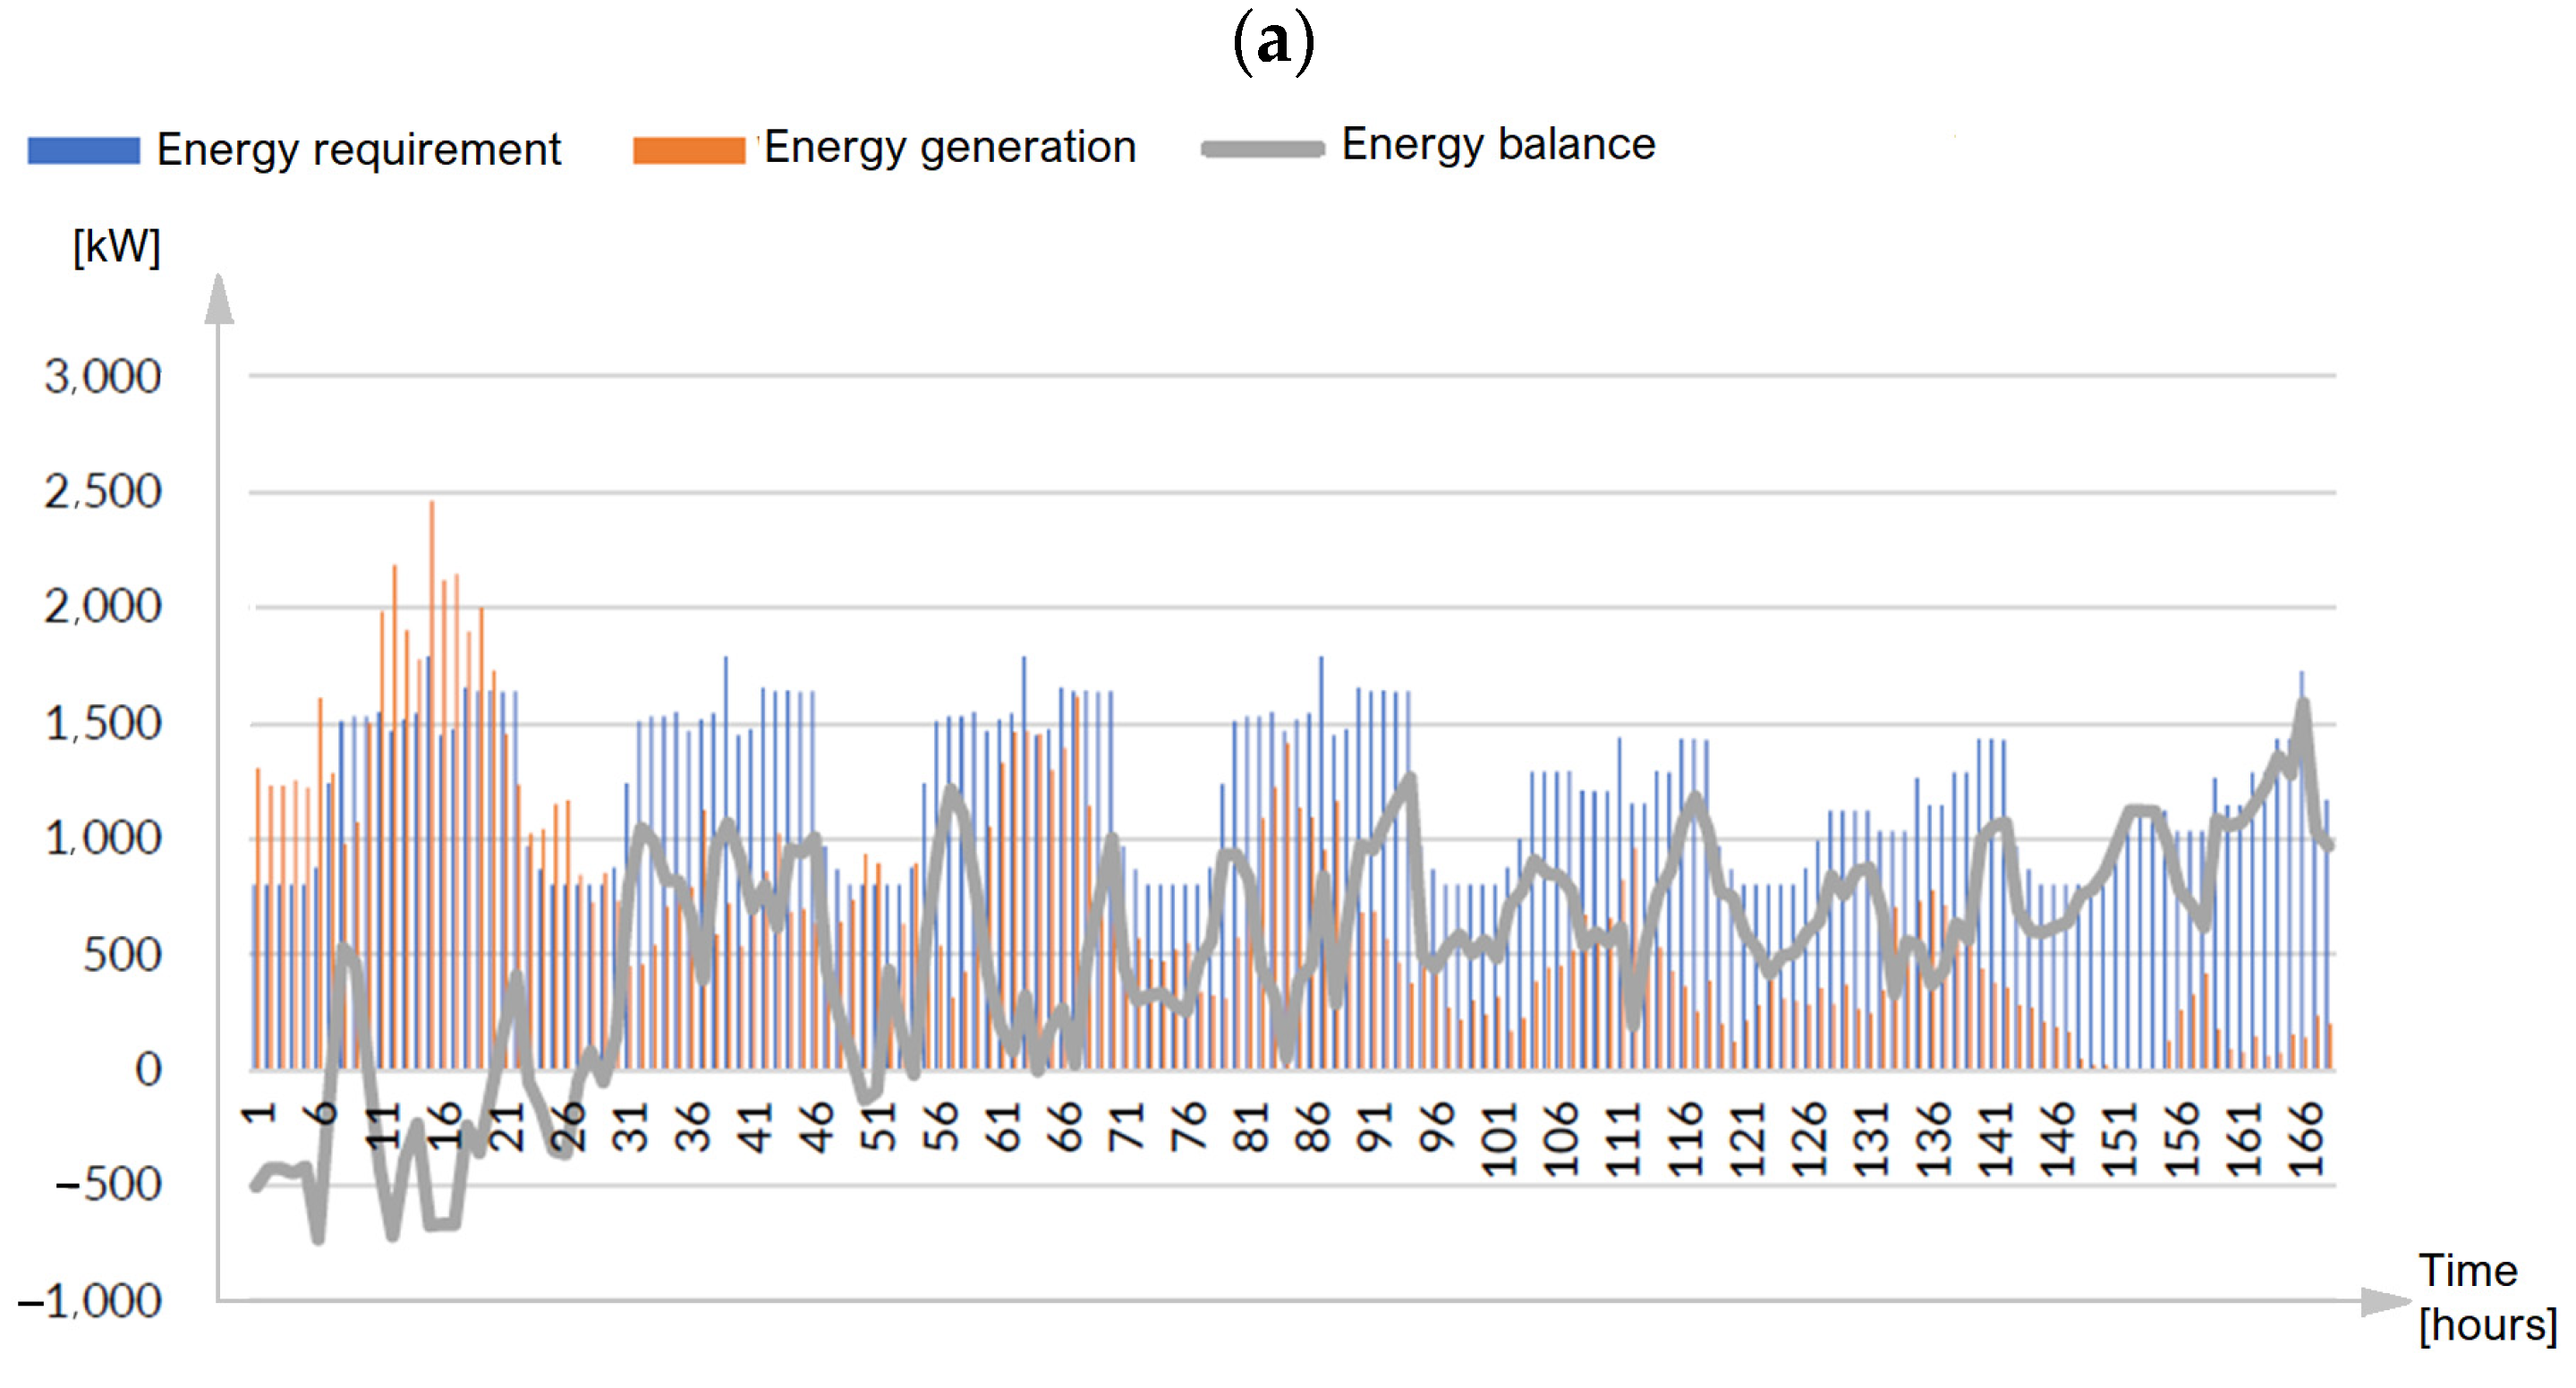
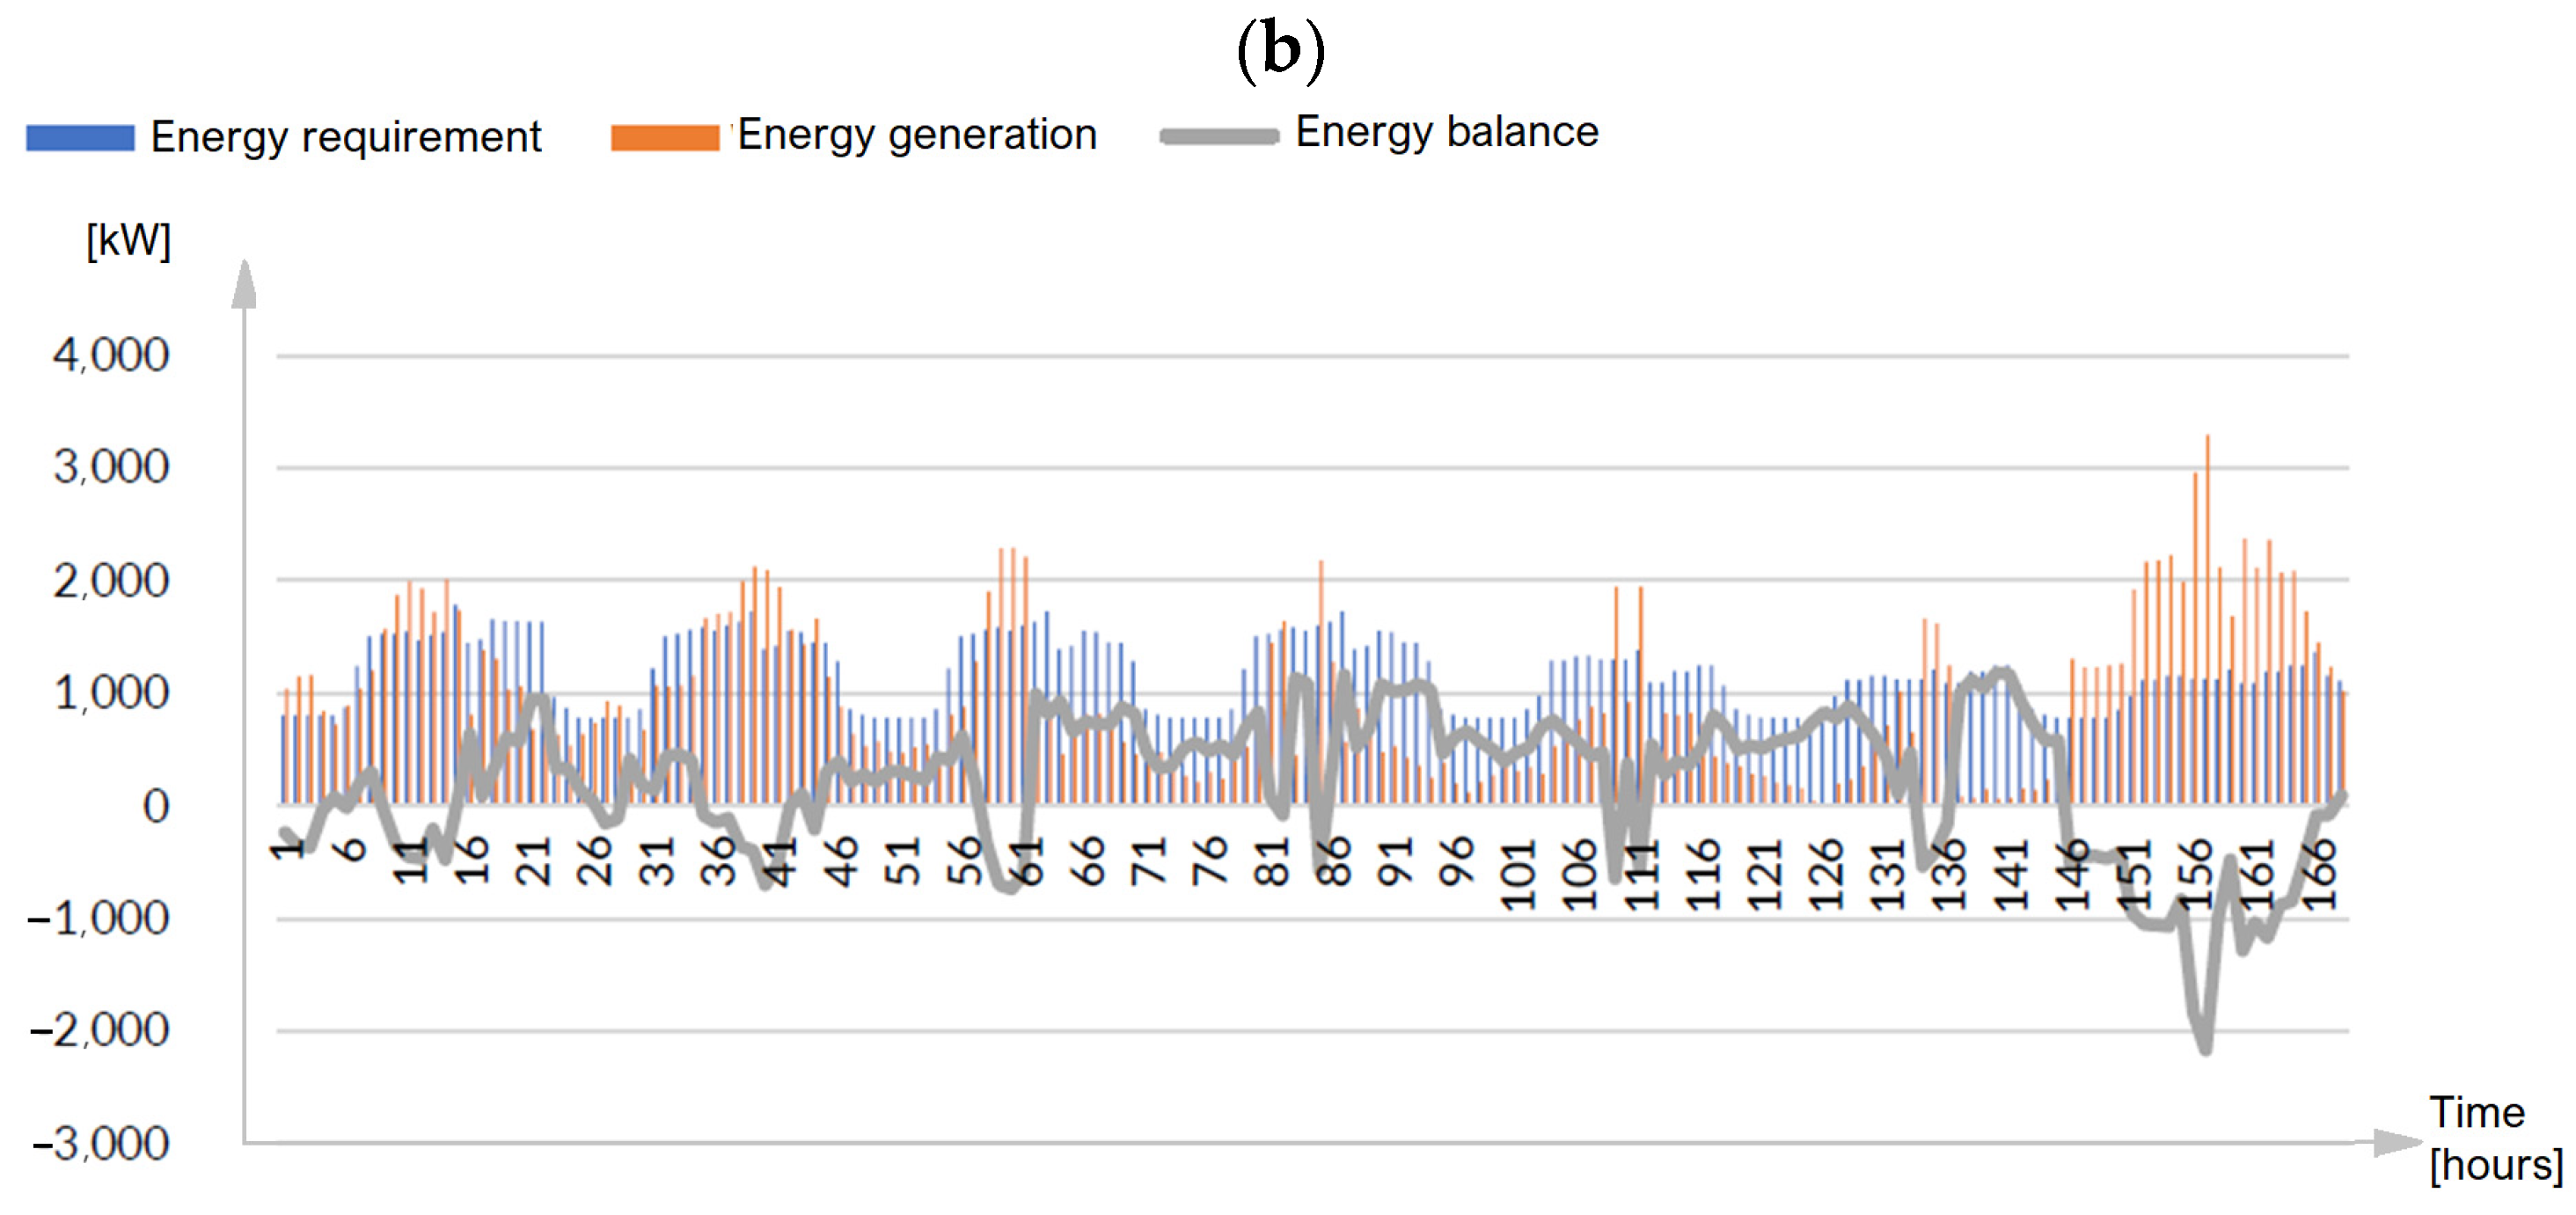
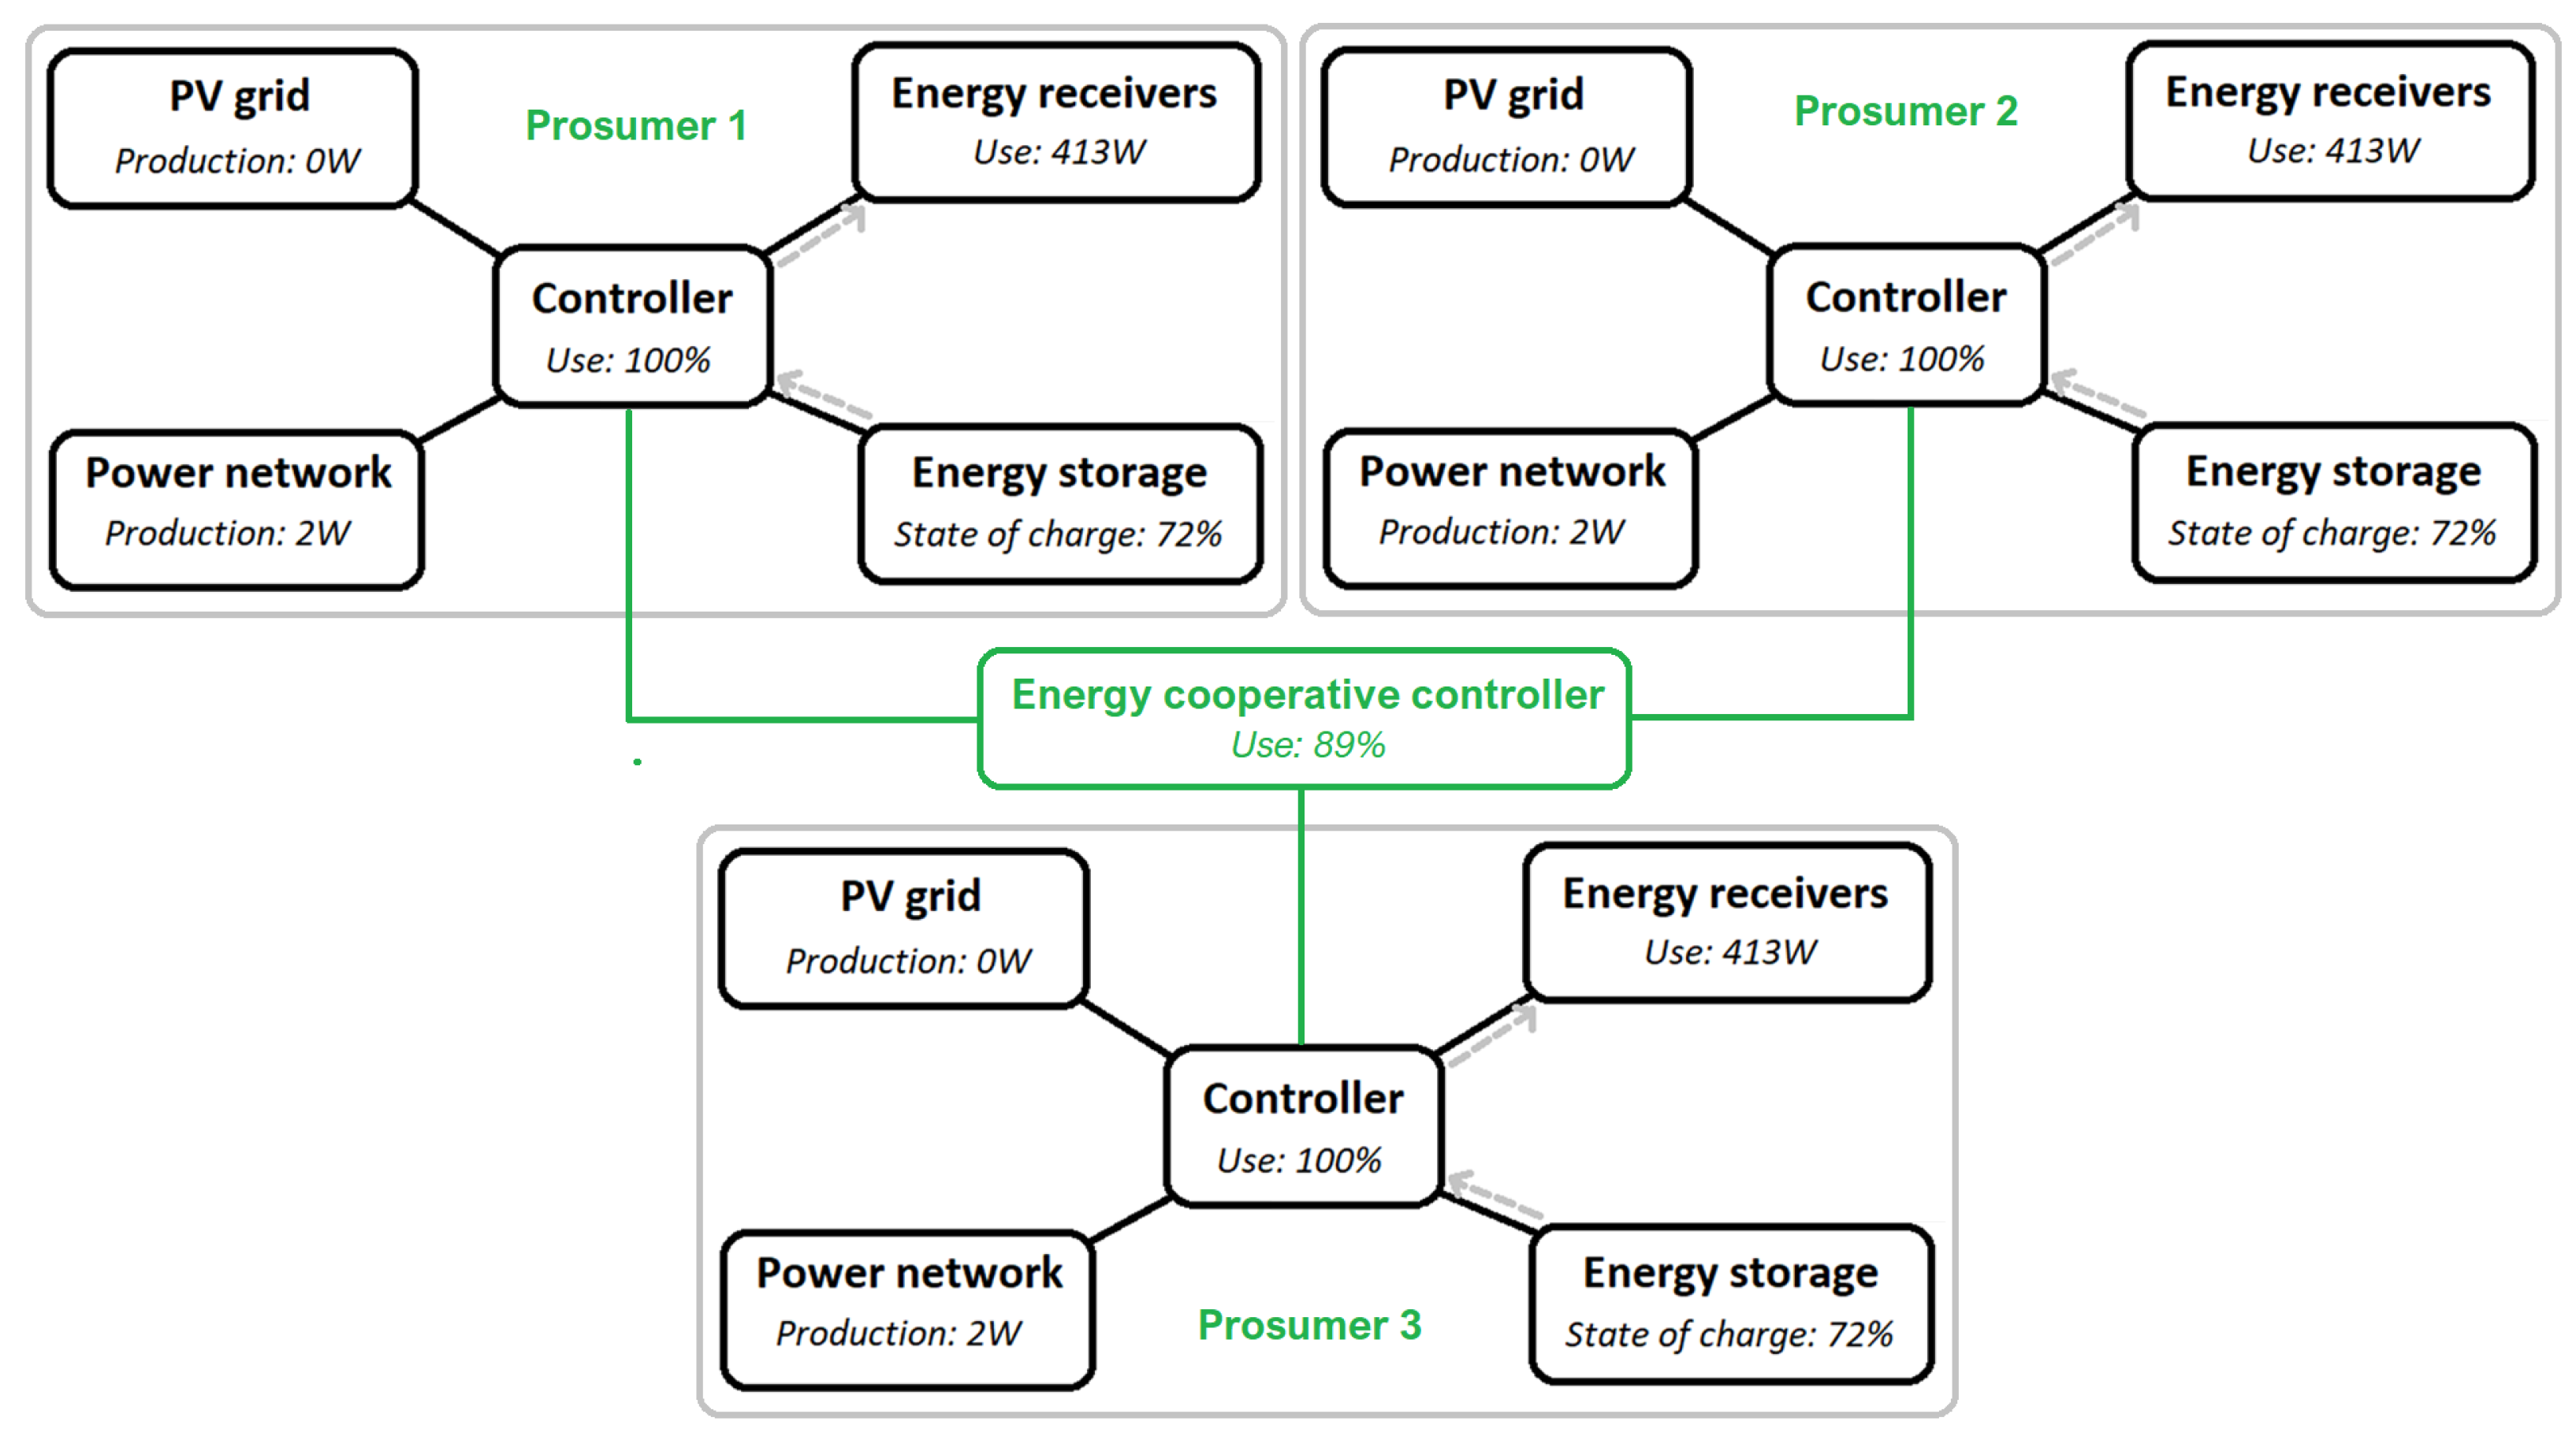
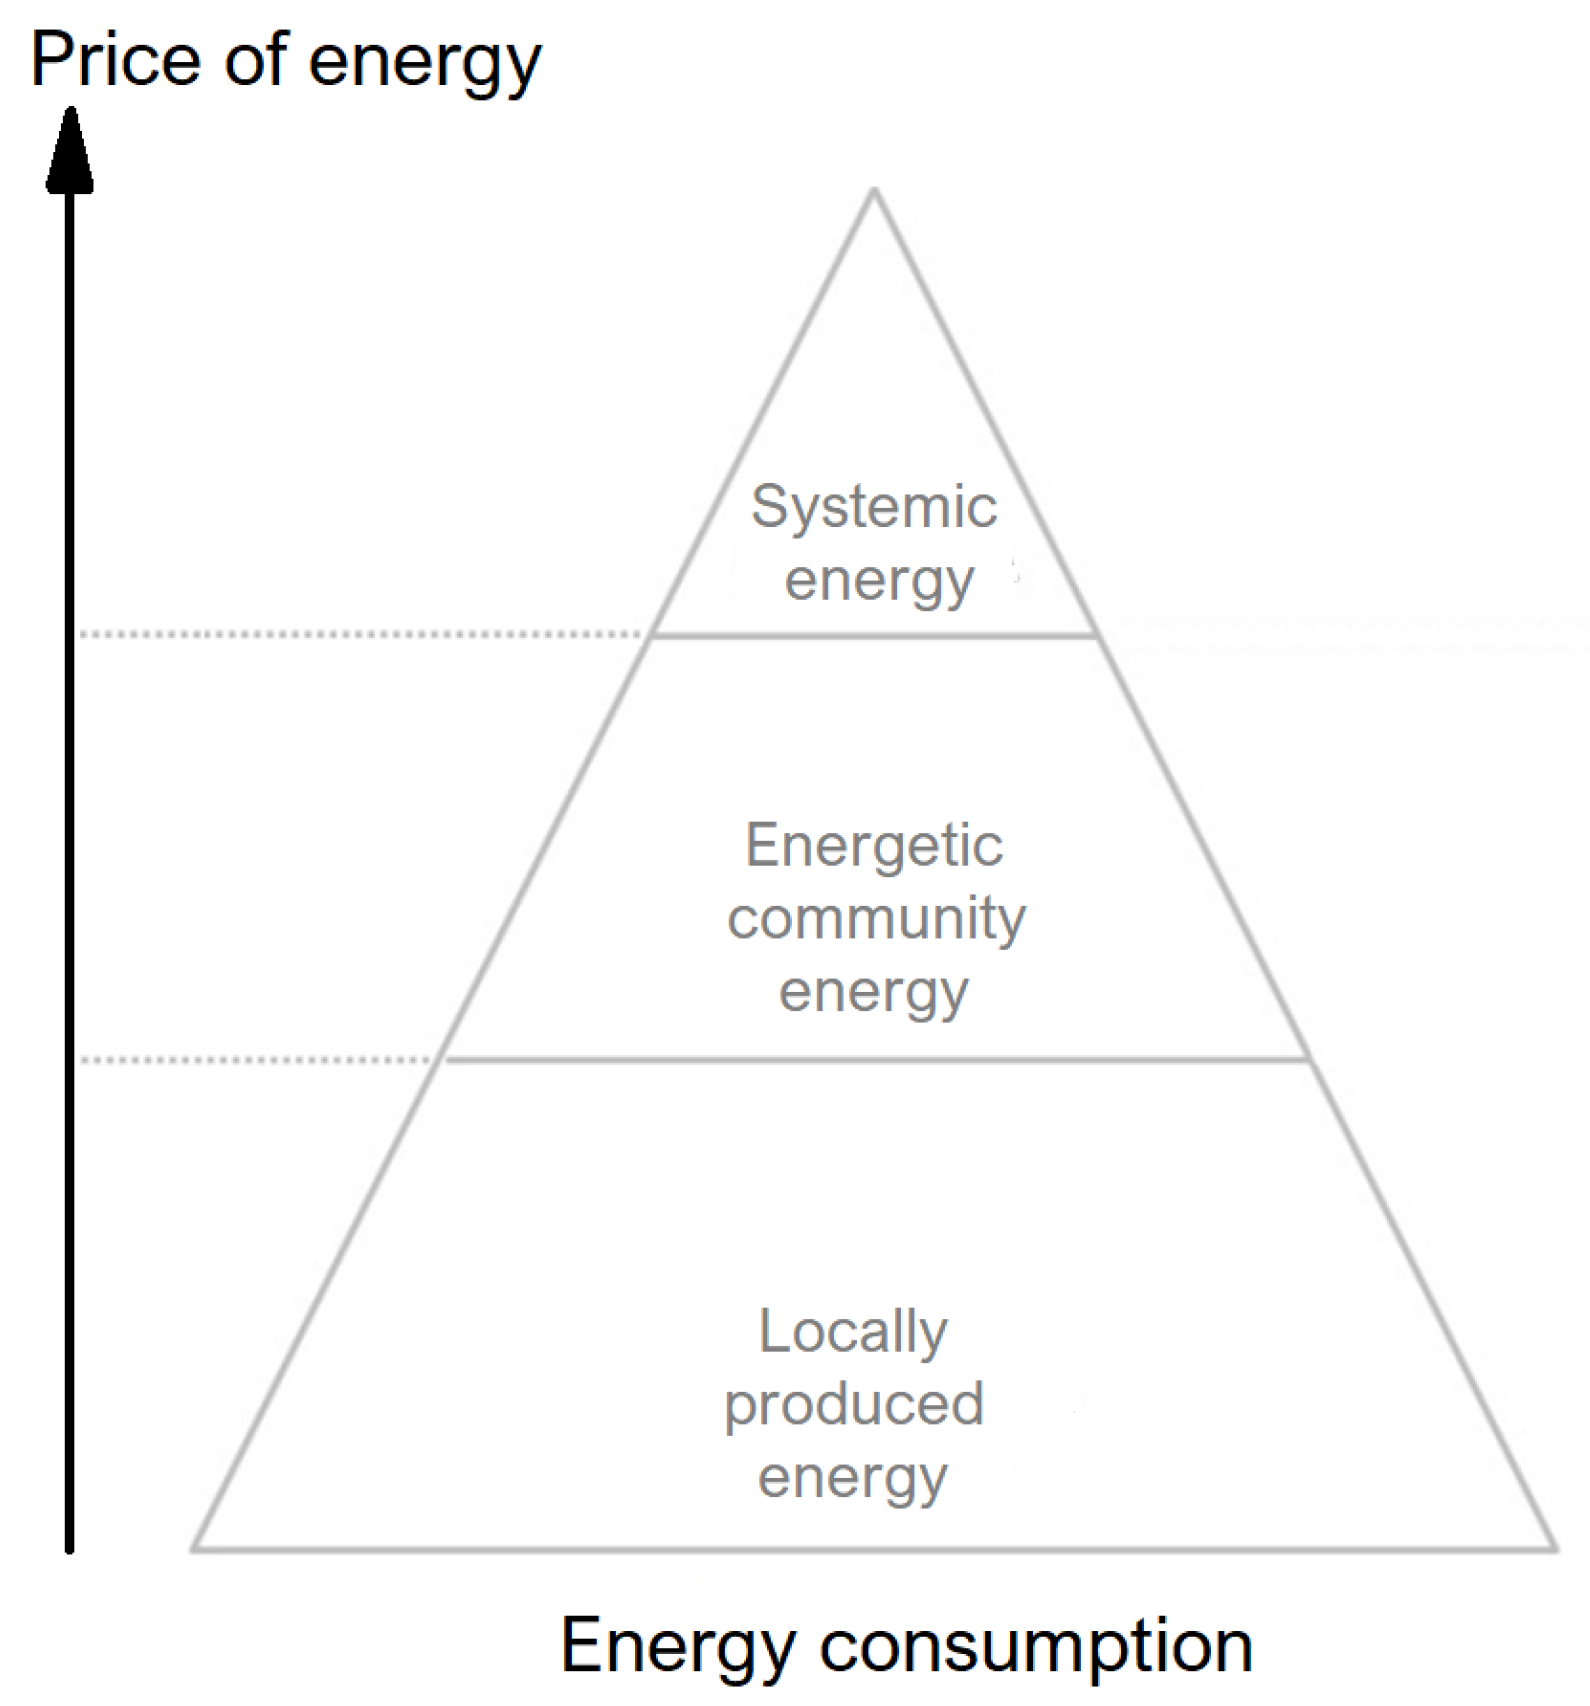
  • Three levels of energy production and consumption (Figure 9);
  • Priority of own energy consumption;
  • Minimisation of energy consumption.

3.1. Hyperparameters Tuning and Input Function Selection

Tuning hyperparameters means selecting settings that are not learned during training, but are set according to knowledge, experience, or as part of experimental selection, determining how the model learns. This improves the selection of the best parameter configuration, optimizing the learning process and finding a balance between accurate exploration of the hyperparameter space and efficient use of computational resources. It is an iterative process and there is no one-size-fits-all solution (Table 5).
Stages of neural network model tuning procedure is shown in Table 6.
The hyperparameters of our MLP models included:
  • Number of hidden layers;
  • Number of neurons in the hidden layer;
  • Activation functions (sigmoid, tanh, rectified linear unit (ReLu));
  • Speed of learning;
  • Number of training examples in each iteration;
  • Number of iterations of the entire training data set;
  • Regularization (L2 or L1) used to prevent overfitting;
  • Dropout rate (percentage of neurons randomly removed during learning to prevent overfitting);
  • Optimization algorithm for updating model weights (Adam, RMSProp, etc.);
  • Initialization of network weights (He, Xavier, etc.);
  • How learning rates change over time for faster convergence;
  • Architecture modifications (e.g., adding omitted connections).
In our case, Bayesian optimization proved to be more effective than grid/random search and faster than genetic algorithms.

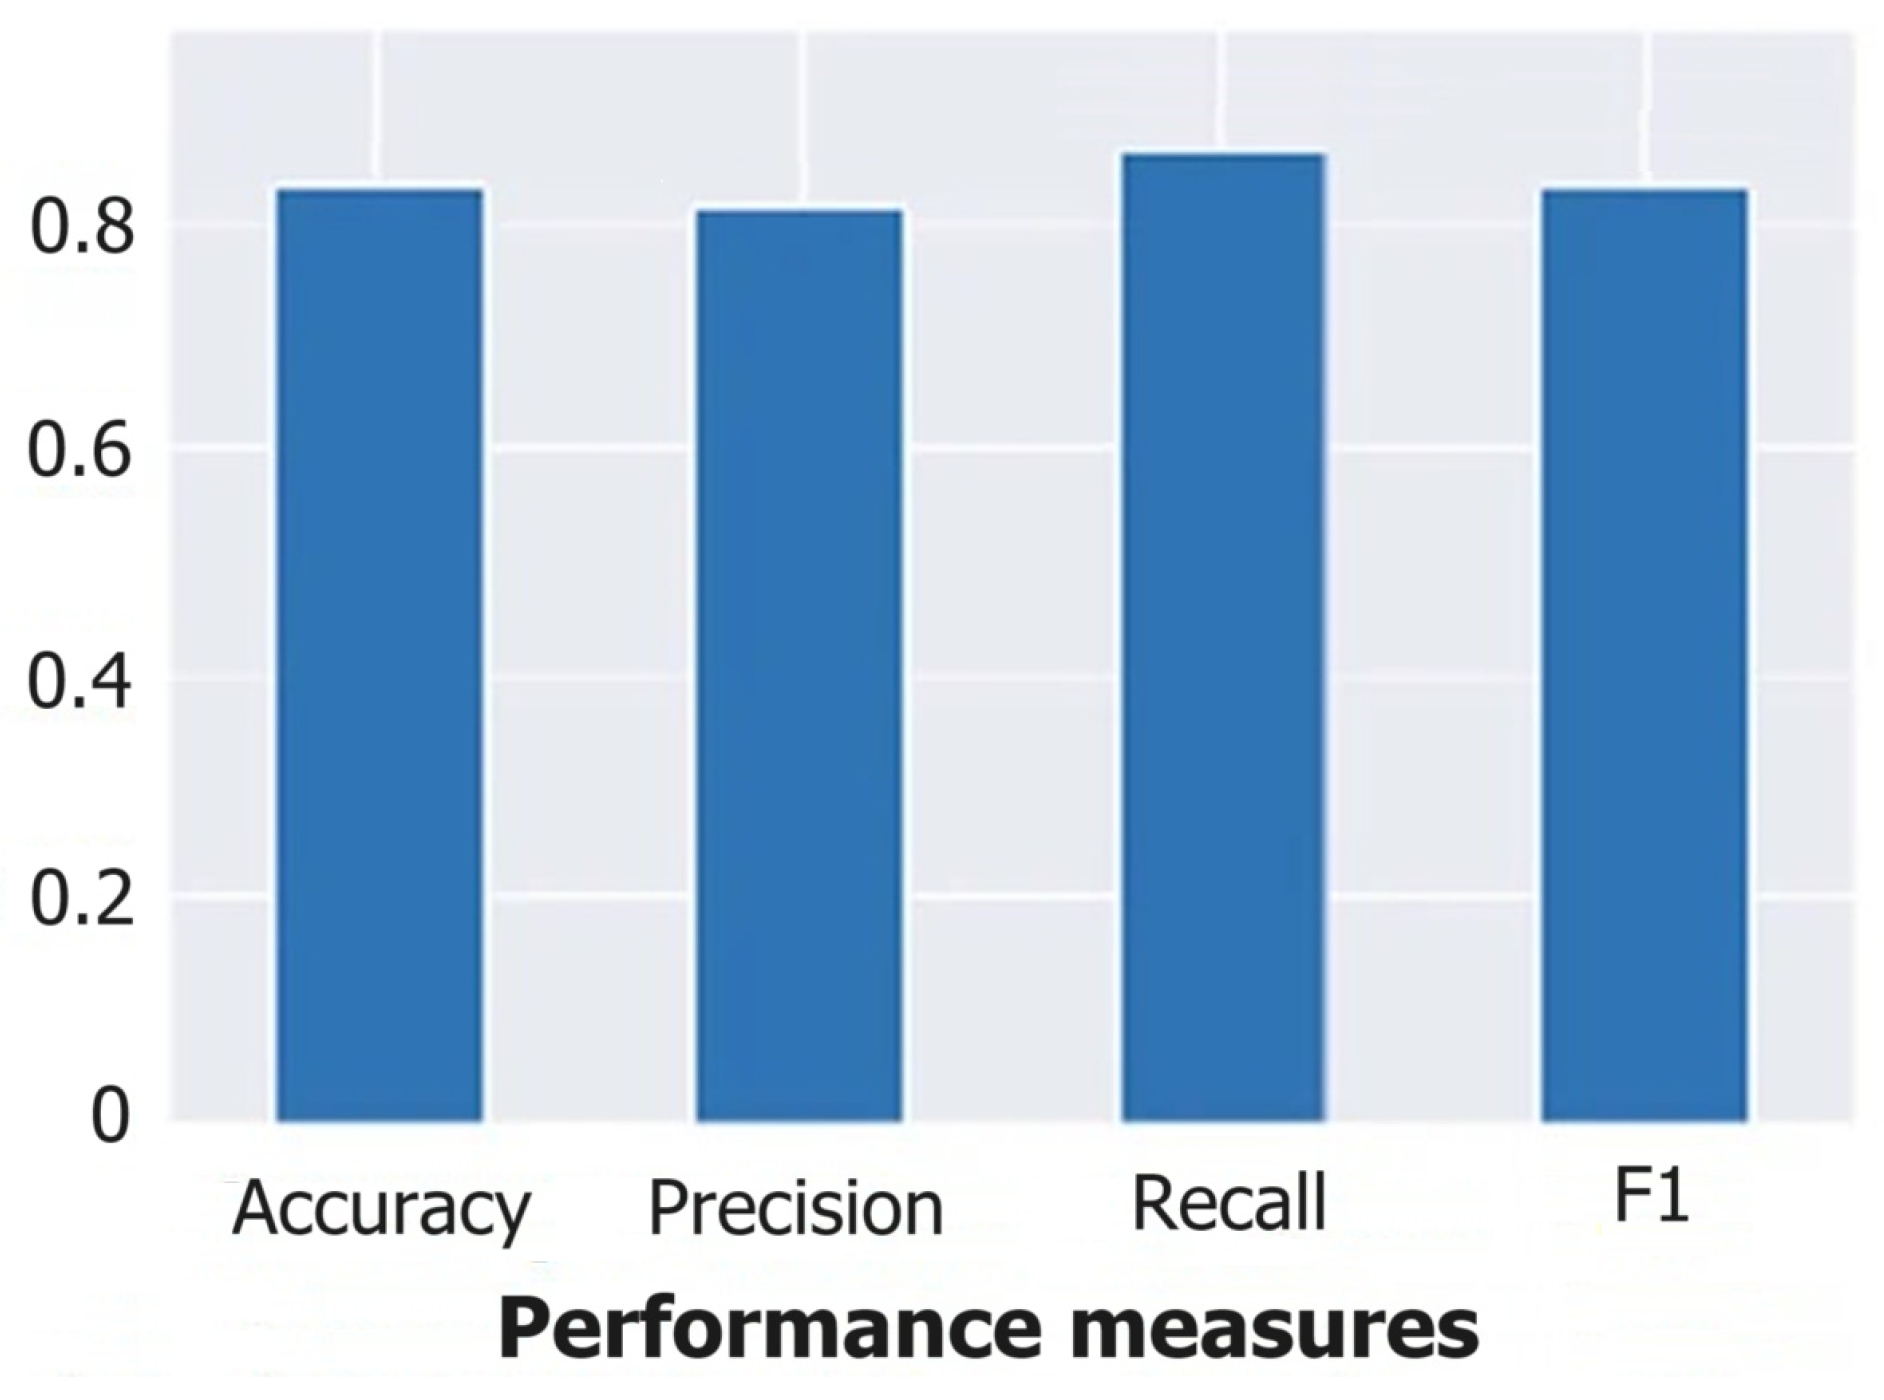
3.2. Best Results and Cross-Validation

Computational modeling, such as the one presented in this article, is useful and cost-effective when traditional statistical methods fail or are insufficient (e.g., when the relationships between inputs and outputs are highly non-linear). However, their full use requires experience and confirmed experimental results, so in order to find one good solution, we created about 100 models, and only the best results are presented in this article.
A comparison of a selection of different models used to solve this problem is presented in Table 7. Only ‘pure’ approaches were used for the above comparison, while hybrid approaches, combining different methods and techniques, etc., were not used. Evaluation and comparisons were based on RMSE, Accuracy (learning), and Accuracy (training) values.
The comparison showed that the MLP-based optimization was the most accurate, giving a simple, fast, and accurate solution to the problem based on appropriately selected input and output data, without full knowledge of the rules/mechanisms binding the input and output data. With this approach, it is possible to quickly adapt the solution to further/other data, including another PV system. This is important due to the high variability of weather in Poland (four seasons with different temperatures, day length, type of precipitation and insolation, and wind variability). In the case of significantly different data, a simple training of the MLP network is sufficient, which can be automated (e.g., ensuring automatic training of the network during a technical break). However, a change in the number of input or output data will mean that the structure of the network will have to be changed (respectively: the number of neurons in the input or output layer). Similarly, incorporating new devices into the model (e.g., with different variability characteristics of the data fed) requires initial testing of the network to check the accuracy of the prediction, and perhaps the network will learn during normal operation. However, as part of the maintenance of the ML system, the RMSE value and prediction accuracy should be monitored. For the purposes of this work, an accuracy threshold of 80% was considered sufficient, but higher values can be achieved as part of the refinement and adaptation of the solution.
For linear regression, no linear approximation was found for the hypothesis that a forecast can be made one day in advance based on the set of input data—this is due to the lack of normal distribution of the data and the linear relationship between the input and output values.
In the case of polynomial regression (using Spline Smoothing, Moving Average and Weighted Average), correlation values were too low at a threshold value of 0.8.
Different activation functions were tested for MLP and CNN, but the best results were achieved for the sigmoid activation function due to the greater flexibility of such networks. This confirms that the research problem itself is not simple, and the modeling, prediction, and optimization of energy cooperatives will be a computational challenge and requires further research (Table 8, Figure 10).
Scikit-learn 1.3.2 was used for cross-validation. In the Python environment (Figure 9), cross-validation as a statistical method is commonly used in ML to compare and select a model for a given prediction problem because it is easy to use and produces estimates with lower variance than other methods.
Simple, useful artificial intelligence algorithms, currently implemented and tuned manually, are more accessible, easier, and more transparent in operation than complex, labor-intensive, and expensive AI solution systems.

4. Discussion

Utilizing AI-supported transformation of energy markets can enhance the analysis by leveraging data-driven insights and predictive capabilities (Table 9).
Integrating AI-based solutions into the transformation of energy markets increases the potential for improved efficiency, sustainability, and reliability. However, addressing the challenges of data privacy, bias, cyber-security, and regulatory frameworks is critical to ensure AI-supported transformations are successful and beneficial to all stakeholders (especially in the face of large energy companies and geopolitical players). Continuous monitoring and adaptation is essential as the energy sector evolves in response to technological advances [36,37,38].
Energy companies in Poland already know that artificial intelligence could increase the efficiency of their business, most even have their first AI implementations already in place, but this is not yet the level already reached by modern energy companies operating in the global economy. Energy sector companies in Poland have for many years been collecting large amounts of data that could be used to implement new tools and develop new processes; these data are not widely used. Meanwhile, the use and processing of these data could significantly improve energy production and transmission in Poland. Further transformation of the sector, changing the energy mix, and improving the management of the energy system is critically dependent on the effectiveness of digitization in the sector, including the application of solutions based on artificial intelligence.
Data protection is a problem both for the operator (its IT system) and for the management of the cooperative which will use the application based on the model proposed in the article. At this stage, it is important to be aware that in order to manage the system, it is necessary to have a lot of data from the individual prosumers (and within them also at the level of storage and distribution of energy consumption characteristics) and generation facilities. The systems will need to have safeguards in place in accordance with current legislation as to sensitive data protection.
As we mentioned in the introduction, it is necessary to relate the applicability of artificial intelligence tools to socio-economic processes: globalization, energy transition, green competitiveness processes, and sustainable development. The key issues here relate to combined impacts:
  • AI [39,40,41,42];
  • Energy transition [43,44,45,46,47];
  • Circular economy;
  • Digital transformation;
  • Green competitiveness;
  • Sustainable development.
The circular economy plays a key role in ensuring that manufactured products are reused at the end of their life cycle which reduces the waste of scarce resources. Properly designed and implemented, the circular economy is an effective tool to support sustainable development. In this area, gross domestic expenditure on research and development, renewable energy, the number of passenger cars in use and internet-enabled households are positively affected, while unemployment rates, poverty rates, exposure to air pollution, and CO2 emissions per capita are negatively affected [48]. The study of technological development covers three main dimensions: the digitalization of society, the capacity of the economy to meet the challenges of technological development, and the use of ICT in businesses [49,50,51,52,53,54,55].

4.1. Limitations of the Current Studies

The characterization of the proposed model is a universal proposal for the Polish reality, which needs to be developed from the point of view of many blind people on the basis of the changing legislation in Poland—the last very important amendment to the RES Act including provisions on SEs was in August 2023. Polish law describes EC quite differently from German or Danish law, e.g., an energy cooperative in Poland cannot sell energy outside. The profits from setting up an EC come from the discounts for consumers and producers in the SE: no transmission fee, RES fee, distribution fees, etc. These are profits of 20–30% of charges and prices per MWh of energy. The assumption is that the EC acts like a prosumer in net-metering with a discount of 40%. Demand–supply balancing will count. So whoever does it better will earn/balance CE better—more than the discount settlement. The operator will theoretically earn nothing. The legislator has taken care of the operator in such cases—meaning that in such cases he can settle the incurred “losses” on the other participants in the energy market.
It is important to approach the transformation of AI-enabled energy markets with caution and a full analysis of the challenges involved. Collaboration between governments, legislators, technology providers, industry experts, and communities is crucial to ensure AI solutions are successfully integrated into the energy sector while minimizing risks and maximizing benefits. A number of constraints and challenges were observed as shown in Table 10.
Collaboration between researchers, technology providers, policymakers, industry experts, and communities is key to ensuring AI-based solutions are successfully integrated into the energy sector while minimizing risks and maximizing benefits.

4.2. Directions for Further Research

Directions for further research in AI-supported transformation of energy markets include key areas of technological and legal development (Table 11).
This AI-assisted research approach to transforming energy markets will help drive innovation, address existing challenges and contribute to building a more sustainable and efficient energy ecosystem over time. This will make energy markets more sustainable, resilient and responsive to the challenges of climate change and increasing energy demand. However, this requires closer collaboration between academia, industry, and government ensuring that research results are translated more quickly into practical solutions for a cleaner and more efficient energy future. The implementation and evaluation of AI solutions in real energy markets should be carried out gradually to assess their scalability, effectiveness, security, and economic feasibility [62,63,64,65,66].

5. Conclusions

The example of energy cooperatives was chosen to analyze the potential for using artificial intelligence in the sustainable transformation of energy markets, because the authors of this article are convinced that they could be the dark horse of the Polish transformation. In Poland, energy cooperatives have the greatest potential primarily in rural areas, which cover about 90% of the country’s area and are home to about 30 of all energy consumers. On the one hand, this is where the greatest potential for RES development exists. On the other hand, it is rural areas that have the greatest problems with energy poverty and ensuring stability of energy supply, which hinders their sustainable development.
Energy cooperatives also solve a number of crises that we have to face today. Last winter showed very big problems with the availability of energy sources, coal shortages, and very high energy prices. Cooperatives are the answer to these challenges. They also provide greater energy security, as small distributed systems are much more resilient to potential terrorist attacks, which proves important when considering the current affairs with the war in Ukraine.
Energy cooperatives are a model that has a long list of advantages. As well as reducing energy poverty, these include lower electricity bills, the development of distributed and renewable energy, greater independence, and energy security in rural areas, as energy is consumed and balanced locally in a small area. Cooperatives also contribute to a sustainable transformation and increased entrepreneurship in such regions.
Poland’s power sector is outdated, and we also have outdated transmission networks. Worn-out power blocks require constant monitoring and overhaul. And this is where huge potential is created by AI technology, which makes it possible to use practically unlimited amounts of data from various sources to optimize the production and consumption of electricity and heat, and to increase the safety and reliability of all these processes.
Currently, AI applications in the energy sector cover many areas, including forecasting, optimization of resources, grid operations and activities, predictive maintenance (PdM), as well as process automation in post-metering, billing, and overall distribution.
As activities in this sector are scattered across many objectives and areas, steps are needed towards setting general standards, systematizing current knowledge and objectives, and creating proposals for principles of cooperation between the actors involved.
The group’s activities will focus on the following:
  • Creation of recommendations and best practices on the use and implementation of AI solutions in the energy sector (including within energy cooperatives);
  • Analysis of state-of-the-art AI algorithms and models in the energy-processing sector;
  • Developing the competences of those involved—energy engineering and AI specialists;
  • Sharing and exploitation of sensitive data;
  • Computing power requirements and infrastructure needed to collect, share, and process data;
  • Regulation: identification of legal barriers to the development of artificial intelligence in the energy sector, directions for legislative changes, analysis of legislative proposals.

Author Contributions

Conceptualization, I.R., P.K., A.M., M.M. and D.M.; methodology, I.R., A.M., M.M. and D.M.; software, I.R., A.M. and D.M.; validation, I.R., A.M., M.M. and D.M.; formal analysis, I.R., A.M., M.M. and D.M.; investigation, I.R., A.M., M.M. and D.M.; resources, I.R., A.M., M.M. and D.M.; data curation, I.R., P.K., A.M., M.M. and D.M.; writing—original draft preparation, I.R., P.K., A.M., M.M. and D.M.; writing—review and editing, I.R., P.K., A.M., M.M. and D.M.; visualization, I.R., P.K., A.M., M.M. and D.M.; supervision, I.R., A.M., M.M. and D.M.; project administration, I.R., A.M., M.M. and D.M.; funding acquisition, I.R., A.M. and M.M. All authors have read and agreed to the published version of the manuscript.

Funding

The work presented in the paper has been financed under a grant to maintain the research potential of Kazimierz Wielki University and Bydgoszcz University of Science and Technology.

Data Availability Statement

The data presented in this study are available on request from the corresponding author. The data are not publicly available due to cybersecurity issues.

Conflicts of Interest

The authors declare no conflict of interest.

References

  1. Rojek, I.; Mikołajewski, D.; Mroziński, A.; Macko, M. Machine Learning- and Artificial Intelligence-Derived Prediction for Home Smart Energy Systems with PV Installation and Battery Energy Storage. Energies 2023, 16, 6613. [Google Scholar] [CrossRef]
  2. Güney, T. Renewable energy, non-renewable energy and sustainable development. Int. J. Sustain. Dev. World Ecol. 2019, 26, 389–397. [Google Scholar] [CrossRef]
  3. Cahyadi, A.; Magda, R. Digital Leadership in the Economies of the G20 Countries: A Secondary Research. Economies 2021, 9, 32. [Google Scholar] [CrossRef]
  4. Baños, R.; Manzano-Agugliaro, F.; Montoya, F.G.; Gil, C.; Alcayde, A.; Gómez, J. Optimization methods applied to renewable and sustainable energy: A review. Renew. Sustain. Energy Rev. 2011, 15, 1753–1766. [Google Scholar] [CrossRef]
  5. Recalde, M.; Peralta, A.; Oliveras, L.; Tirado-Herrero, S.; Borrell, C.; Palència, L.; Gotsens, M.; Artazcoz, L.; Marí-Dell’Olmo, M. Structural energy poverty vulnerability and excess winter mortality in the European Union: Exploring the association between structural determinants and health. Energy Policy 2019, 133, 110869. [Google Scholar] [CrossRef]
  6. Usman, M.; Hammar, N. Dynamic relationship between technological innovations, financial development, renewable energy, and ecological footprint: Fresh insights based on the STIRPAT model for Asia Pacific Economic Cooperation countries. Environ. Sci. Pollut. Res. 2021, 28, 15519–15536. [Google Scholar] [CrossRef] [PubMed]
  7. Ibn-Mohammed, T.; Mustapha, K.B.; Godsell, J.; Adamu, Z.; Babatunde, K.A.; Akintade, D.D.; Koh, S.C.L. A critical analysis of the impacts of COVID-19 on the global economy and ecosystems and opportunities for circular economy strategies. Resour. Conserv. Recycl. 2021, 164, 105169. [Google Scholar] [CrossRef]
  8. Lang, B.; Dolan, R.; Kemper, J.; Northey, G. Prosumers in times of crisis: Definition, archetypes and implications. J. Serv. Manag. 2021, 32, 176–189. [Google Scholar] [CrossRef]
  9. Golovenchik, G.G.; He, Y. Ten drivers of the Chinese digital miracle [Desyat’ drajverov kitajskogo cifrovogo chuda]. Digit. Transform. 2021, 3, 11–25. [Google Scholar]
  10. Shivakumar, A.; Dobbins, A.; Fahl, U.; Singh, A. Drivers of renewable energy deployment in the EU: An analysis of past trends and projections. Energy Strategy Rev. 2019, 26, 100402. [Google Scholar] [CrossRef]
  11. Gielen, D.; Boshell, F.; Saygin, D.; Bazilian, M.D.; Wagner, N.; Gorini, R. The Role of Renewable Energy in the Global Energy Transformation. Energy Strategy Rev. 2019, 24, 38–50. [Google Scholar] [CrossRef]
  12. Hosseini, S.E. An outlook on the global development of renewable and sustainable energy at the time of COVID-19. Energy Res. Soc. Sci. 2020, 68, 101633. [Google Scholar] [CrossRef]
  13. Avelino, F.; Wittmayer, J.M. Shifting Power Relations in Sustainability Transitions: A Multi-Actor Perspective. J. Environ. Policy Plan. 2016, 18, 628–649. [Google Scholar] [CrossRef]
  14. Rodrigues, J.F.D.; Wang, J.; Behrens, P.; de Boer, P. Drivers of CO2 emissions from electricity generation in the European Union 2000–2015. Renew. Sustain. Energy Rev. 2020, 133, 110104. [Google Scholar] [CrossRef]
  15. Abrishambaf, O.; Lezama, F.; Faria, P.; Vale, Z. Towards transactive energy systems: An analysis on current trends. Energy Strategy Rev. 2019, 26, 100418. [Google Scholar] [CrossRef]
  16. Qian, X.; Liu, X.; Pu, R. Evaluation of knowledge transfer efficiency based on the synergy of innovative clusters. RJCM 2020, 1, 1–25. [Google Scholar]
  17. Tushar, W.; Saha, T.K.; Yuen, C.; Smith, D.; Poor, H.V. Peer-to-Peer Trading in Electricity Networks: An Overview. IEEE Trans. Smart Grid 2020, 11, 3185–3200. [Google Scholar] [CrossRef]
  18. Ma, Z.; Cheng, M.; Wang, M. Strategic research on the sustainable development cost of manufacturing industry under the background of carbon allowance and trade policy. AIP Conf. Proc. 2017, 1864, 020197. [Google Scholar]
  19. Turkson, C.; Acquaye, A.; Liu, W.; Papadopoulos, T. Sustainability assessment of energy production: A critical review of methods, measures, and issues. J. Environ. Manag. 2020, 264, 110464. [Google Scholar] [CrossRef]
  20. Dogaru, V.; Brandas, C.; Cristescu, M. An Urban System Optimization Model Based on CO2 Sequestration Index: A Big Data Analytics Approach. Sustainability 2019, 11, 4821. [Google Scholar] [CrossRef]
  21. Frey, U.J.; Klein, M.; Nienhaus, K.; Schimeczek, C. Self-Reinforcing Electricity Price Dynamics under the Variable Market Premium Scheme. Energies 2020, 13, 5350. [Google Scholar] [CrossRef]
  22. Han, D.; Li, T.; Feng, S.; Shi, Z. Does Renewable Energy Consumption Successfully Promote the Green Transformation of China’s Industry? Energies 2020, 13, 229. [Google Scholar] [CrossRef]
  23. Mroziński, A.; Walichnowska, P. Analysis of the feasibility of energy cooperatives under Polish environmental and legal conditions. Przegląd Elektrotechniczny 2023, 99, 286–288. [Google Scholar] [CrossRef]
  24. Jasiński, J.; Kozakiewicz, M.; Sołtysik, M. Determinants of energy cooperatives’ development in rural areas—Evidence from Poland. Energies 2021, 14, 319. [Google Scholar] [CrossRef]
  25. Wagemans, D.; Scholl, C.; Vasseur, V. Facilitating the Energy Transition—The Governance Role of Local Renewable Energy Cooperatives. Energies 2019, 12, 4171. [Google Scholar] [CrossRef]
  26. A Modern Energy Management Platform for Energy Communities, The Besmart.Energy Project Implemented under European Funds, Project Number POIR.01.02.00-00-0340/16-00. Available online: https://besmart.energy/ (accessed on 15 November 2023).
  27. Directive (EU) 2018/2001 of the European Parliament and of the Council of 11 December 2018 on the promotion of the use of energy from renewable sources. Off. J. Eur. Union 2018, 328, 82–209.
  28. Energy Cooperative Calculator. Available online: https://nieruchomoscikowr.gov.pl/renaldo/ (accessed on 16 September 2023).
  29. Act of 19 July 2019 Amending the Act on Renewable Energy Sources and Certain Other Acts (DZ.U. z 2019 r. Poz. 1524). Available online: http://isap.sejm.gov.pl/isap.nsf/DocDetails.xsp?id=WDU20190001524 (accessed on 14 September 2019).
  30. Act of 17 August 2023 July 2019 Amending the Act on Renewable Energy Sources and Certain Other Acts (Dz.U. 2023 poz. 1762). Available online: https://isap.sejm.gov.pl/isap.nsf/DocDetails.xsp?id=WDU20230001762 (accessed on 31 August 2023).
  31. RENALDO Manual—How to Set Up and Run an Energy Cooperative? Available online: https://www.gov.pl/attachment/0b9c4f00-4963-4885-b621-ffe4cb6d4f59 (accessed on 16 September 2023).
  32. Wrocławski, M. Energy cooperative in an energy cluster—A case study. Energetyka Rozproszona 2022, 7, 77–83. [Google Scholar] [CrossRef]
  33. Zhang, L.; Ling, J.; Lin, M. Artificial intelligence in renevable energy: A comprhensive bibliometric analysis. Energy Rep. 2022, 8, 14072–14088. [Google Scholar] [CrossRef]
  34. List of Energy Cooperatives in Poland. Available online: http://www.kowr.gov.pl/odnawialnezrodla-energii/spoldzielnie-energetyczne/wykaz-spoldzielni-energetycznych (accessed on 16 September 2023).
  35. How Artificial Intelligence can Accelerate the Transformation of the Energy Sector—Report of the THINKTANK Digital Transformation Observatory. Available online: https://think-tank.pl/wp-content/uploads/2023/02/raport-energetyczny.pdf (accessed on 16 September 2023).
  36. Zhao, X.; Zhao, Y.; Hu, S.; Wang, H.; Zhang, Y.; Ming, W. Progress in Active Infrared Imaging for Defect Detection in the Renewable and Electronic Industries. Sensors 2023, 23, 8780. [Google Scholar] [CrossRef]
  37. Cardinale-Villalobos, L.; Jimenez-Delgado, E.; García-Ramírez, Y.; Araya-Solano, L.; Solís-García, L.A.; Méndez-Porras, A.; Alfaro-Velasco, J. IoT System Based on Artificial Intelligence for Hot Spot Detection in Photovoltaic Modules for a Wide Range of Irradiances. Sensors 2023, 23, 6749. [Google Scholar] [CrossRef]
  38. Utama, I.B.K.Y.; Pamungkas, R.F.; Faridh, M.M.; Jang, Y.M. Intelligent IoT Platform for Multiple PV Plant Monitoring. Sensors 2023, 23, 6674. [Google Scholar] [CrossRef]
  39. Lazaroiu, G.; Rogalska, E. How generative artificial intelligence technologies shape partial job displacement and labor productivity growth. Oeconomia Copernic. 2023, 14, 703–706. [Google Scholar] [CrossRef]
  40. Andronie, M.; Iatagan, M.; Uță, C.; Hurloiu, I.; Dijmărescu, A.; Dijmărescu, I. Big data management algorithms in artificial Internet of Things-based fintech. Oeconomia Copernic. 2023, 14, 769–793. [Google Scholar] [CrossRef]
  41. Lăzăroiu, G.; Bogdan, M.; Geamănu, M.; Hurloiu, L.; Luminița, L.; Ștefănescu, R. Artificial intelligence algorithms and cloud computing technologies in blockchain-based fintech management. Oeconomia Copernic. 2023, 14, 707–730. [Google Scholar] [CrossRef]
  42. Dávid, L.D.; Dadkhah, M. Artificial intelligence in the tourism sector: Its sustainability and innovation potential. Equilib. Q. J. Econ. Econ. Policy 2023, 18, 609–613. [Google Scholar] [CrossRef]
  43. Fraser, T.; Chapman, A.J.; Shigetomi, Y. Leapfrogging or lagging? Drivers of social equity from renewable energy transitions globally. Energy Res. Soc. Sci. 2023, 98, 103006. [Google Scholar] [CrossRef]
  44. Iglinski, B.; Kielkowska, U.; Pietrzak, M.B.; Skrzatek, M.; Kumar, G.; Piechota, G. The regional energy transformation in the context of renewable energy sources potential. Renew. Energy 2023, 218, 15. [Google Scholar] [CrossRef]
  45. Liu, H.Y.; Khan, I.; Zakari, A.; Alharthi, M. Roles of trilemma in the world energy sector and transition towards sustainable energy: A study of economic growth and the environment. Energy Policy 2022, 170, 113238. [Google Scholar] [CrossRef]
  46. Pietrzak, M.B.; Iglinski, B.; Kujawski, W.; Iwanski, P. Energy Transition in Poland-Assessment of the Renewable Energy Sector. Energies 2021, 14, 23. [Google Scholar] [CrossRef]
  47. Balcerzak, A.; Uddin, G.S.; Igliński, B.; Pietrzak, M.B. Global energy transition: From the main determinants to economic challenges. Equilibrium. Q. J. Econ. Econ. Policy 2023, 18, 597–608. [Google Scholar] [CrossRef]
  48. Skvarciany, V.; Lapinskaite, I.; Volskyte, G. Circular economy as assistance for sustainable development in OECD countries. Oeconomia Copernic. 2021, 12, 11–34. [Google Scholar] [CrossRef]
  49. Ramzan, M.; Razi, U.; Quddoos, M.U.; Adebayo, T.S. Do green innovation and financial globalization contribute to the ecological sustainability and energy transition in the United Kingdom? Policy insights from a bootstrap rolling window approach. Sustain. Dev. 2022, 31, 393–414. [Google Scholar] [CrossRef]
  50. Małkowska, A.; Urbaniec, M.; Kosała, M. The impact of digital transformation on European countries: Insights from a comparative analysis. Equilibrium. Q. J. Econ. Econ. Policy 2021, 16, 325–355. [Google Scholar] [CrossRef]
  51. Shuguang, W.; Luang, S.; Sajid, I. Green financing role on renewable energy dependence and energy transition in E7 economies. Renew. Energy 2022, 200, 1561–1572. [Google Scholar]
  52. Nowak, A.; Kasztelan, A. Economic competitiveness vs. green competitiveness of agriculture in the European Union countries. Oeconomia Copernic. 2022, 13, 379–405. [Google Scholar] [CrossRef]
  53. Brodny, J.; Tutak, M. The level of implementing sustainable development goal “Industry, innovation and infrastructure” of Agenda 2030 in the European Union countries: Application of MCDM methods. Oeconomia Copernic. 2023, 14, 47–102. [Google Scholar] [CrossRef]
  54. Fu, Q.; Zhao, X.; Chang, C.-P. Does ESG performance bring to enterprises’ green innovation? Yes, evidence from 118 countries. Oeconomia Copernic. 2023, 14, 795–832. [Google Scholar] [CrossRef]
  55. Gyimah, J.; Yao, X.L.; Tachega, M.A.; Hayford, I.S.; Opoku-Mensah, E. Renewable energy consumption and economic growth: New evidence from Ghana. Energy 2023, 248, 123559. [Google Scholar] [CrossRef]
  56. Wang, Y.; Qi, Y.; Li, J.; Huan, L.; Li, Y.; Xie, B.; Wang, Y. The Wind and Photovoltaic Power Forecasting Method Based on Digital Twins. Appl. Sci. 2023, 13, 8374. [Google Scholar] [CrossRef]
  57. Mateo Romero, H.F.; González Rebollo, M.Á.; Cardeñoso-Payo, V.; Alonso Gómez, V.; Redondo Plaza, A.; Moyo, R.T.; Hernández-Callejo, L. Applications of Artificial Intelligence to Photovoltaic Systems: A Review. Appl. Sci. 2022, 12, 10056. [Google Scholar] [CrossRef]
  58. Tina, G.M.; Ventura, C.; Ferlito, S.; De Vito, S. A State-of-Art-Review on Machine-Learning Based Methods for PV. Appl. Sci. 2021, 11, 7550. [Google Scholar] [CrossRef]
  59. Mellit, A.; Massi Pavan, A.; Ogliari, E.; Leva, S.; Lughi, V. Advanced Methods for Photovoltaic Output Power Forecasting: A Review. Appl. Sci. 2020, 10, 487. [Google Scholar] [CrossRef]
  60. Rojek, I.; Mikołajewski, D.; Macko, M.; Szczepanski, Z.; Dostatni, E. Optimization of extrusion-based 3d printing process using neural networks for sustainable development. Materials 2021, 14, 2737. [Google Scholar] [CrossRef] [PubMed]
  61. Rojek, I.; Mikołajewski, D.; Kotlarz, P.; Macko, M.; Kopowski, J. Intelligent system supporting technological process planning for machining and 3D printing. Bull. Pol. Acad. Sci. Tech. Sci. 2021, 69, e136722. [Google Scholar]
  62. Xu, Y.; Ahokangas, P.; Louis, J.-N.; Pongrácz, E. Electricity Market Empowered by Artificial Intelligence: A Platform Approach. Energies 2019, 12, 4128. [Google Scholar] [CrossRef]
  63. Liu, Z.; Xu, Y.; Zhong, C.; Elahi, H.; Zhou, X. A blockchain-based trustworthy collaborative power trading scheme for 5G-enabled social internet of vehicles. Digit. Commun. Netw. 2022, 8, 976–983. [Google Scholar] [CrossRef]
  64. Cantillo-Luna, S.; Moreno-Chuquen, R.; Chamorro, H.R.; Riquelme-Dominguez, J.M.; Gonzalez-Longatt, F. Locational Marginal Price Forecasting Using SVR-Based Multi-Output Regression in Electricity Markets. Energies 2022, 15, 293. [Google Scholar] [CrossRef]
  65. Li, Y.; Yu, N.; Weng, W. Machine learning-driven virtual bidding with electricity market efficiency analysis. IEEE Trans. Power Syst. 2022, 37, 354–364. [Google Scholar] [CrossRef]
  66. Liu, Z.; Huang, B.; Hu, X.; Du, P.; Sun, Q. Blockchain-Based Renewable Energy Trading Using Information Entropy Theory. IEEE Trans. Netw. Sci. Eng. 2023, 1–12. [Google Scholar] [CrossRef]
Figure 1. Energy systems: (a) Centralized system—power generation concentrated in a small number of locations in the country: Extensive transmission and distribution network—large energy losses. Failure of source or grid affects a significant area of the network. Rising system maintenance costs = increasingly higher bills, (b) Distributed model—collection of microgrids based on energy cooperatives: Energy consumers can also be energy producers (prosumers). Energy generated locally is consumed locally. Failure of a single microgrid does not disrupt the system [26].
Energies 16 08059 g001
Figure 2. Example of simulation implementation in the calculator developed in the Renaldo project [28,31].
Energies 16 08059 g002
Figure 3. Example hourly balance of an energy cooperative in one week in winter (a) and summer (b) [32].
Energies 16 08059 g003aEnergies 16 08059 g003b
Figure 4. Model of the energy cooperatives used in the article.
Energies 16 08059 g004
Figure 5. Example parameter values (Prosumer 1, 30 min).
Energies 16 08059 g005
Figure 6. Development of AI in computational modeling of sustainable transformation of energy markets [33].
Energies 16 08059 g006
Figure 7. The structure of the artificial neural network used in this study as multilayer perceptron (MLP) along with the input and output parameters.
Energies 16 08059 g007
Figure 8. The structure of the artificial neural network used in this study as convolutional neural network (CNN) along with the input and output parameters.
Energies 16 08059 g008
Figure 9. Intelligent energy management, ensuring optimum use of different sources of electricity.
Energies 16 08059 g009
Figure 10. Outcomes of cross-validation and performance measures.
Energies 16 08059 g010
Table 1. Strengths, weaknesses, opportunities, and threats (SWOT) analysis of transformation of energy markets [10].
PositiveNegative
I
n
t
e
r
n
e
l
Strengths
Increasing adoption of renewable energy sources
Technological advancements
Reducing energy waste
Decentralization
Shared consciousness and responsibility
Weaknesses
Required collaboration among governments, industries, and communities
High initial costs (e.g., infrastructure)
Intermittency
Market fragmentation, hard to manage
Regulatory problems hindering integration
E
x
t
e
r
n
a
l
Opportunities
Supporting innovations
Lowering energy cost for consumers
Carbon neutrality
New jobs
Threats
Economic challenges
Vulnerabilities
Geopolitical factors
Table 2. Main factors influencing transformation of energy markets [10].
Political
Drivers
Economic
Drivers
Geographical
Drivers
Technological
Drivers
Social
Drivers
National and EU long-term strategies
Milestones and targets concerning share of renewable energy in the total energy supply
Agreement on indicators
Country/regional capacity and development
Costs of renewable energy related to energy from traditional sources
Subsidies, grants, etc.
Solar energy potential
Wind speed
Access to river/sea
Level of renewable technologies development
R&D capacities
Technical condition of grids
Knowledge of experts
Awareness of energy prosumers and consumers
Acceptance of possible higher cost of energy from renewable resources
Table 3. Presentation of dataset (selected parameters).
ParameterMeanSDMinQ1MedianQ3Max
Prosumer 1
Current air temperature (°C)14.314.76711141721
Current wind speed (m/s)4.871.0102.254.505.246.32
Forecasted air temperature (°C)15.215.11712161825
Forecasted wind speed (m/s)4.670.8412.115.007.3311.11
Power (Watt)18.425.2311.3713.9117.2619.1121.45
Total CO2 reduction (tons)10.43
Prosumer 2
Current air temperature (°C)15.275.32711141722
Current wind speed (m/s)4.391.0702.5055.256.79
Forecasted air temperature (°C)15.985.44712162025
Forecasted wind speed (m/s)5.081.1312.125.137.6712.89
Power (Watt)16.974.6112.5214.1616.4318.5621.22
Total CO2 reduction (tons)10.38
Prosumer 3
Current air temperature (°C)16.075.38711141722
Current wind speed (m/s)4.961.1102.254.505.246.32
Forecasted air temperature (°C)16.115.34813172124
Forecasted wind speed (m/s)5.071.2402.135.086.2210.87
Power (Watt)18.494.5611.4013.9917.3520.0722.41
Total CO2 reduction (tons)10.32
Table 4. Applications of AI in computational modeling of sustainable transformation of energy markets.
Traditional Artificial Intelligence
(Decision Trees,
Random Forests, etc.)
Traditionalmachine
Learning
Deep
Learning
Fuzzy
Logic
Fractal
Analysis
ClassificationClassification
Prediction
Classification
Prediction
Trend analysis
Direction of changes analysis
Smoothness
analysis
Analysis
of the possibility of changing the trend
Table 5. Selected hyperparameters taken into account during MLP model tuning.
HyperparameterDescription
Number
of hidden layers
Searching for the best performing architecture
Activation function(s)Selection of activation functions for each layer in a way that maximizes model performance
Weight initializationExperiments with different weight initialization methods, which may affect network learning
Learning rate valueFinding an appropriate learning rate to ensure learning converges without overshooting or getting stuck in local minima
Learning rate scheduleAdjusting the learning rate of the network using its schedules
Batch sizeBatch size controls the number of training samples used in each update of the model weights (too small batches result in greater spread, and large batches result in slower convergence)
Number of epochsAfter how many epochs to stop training to prevent overfitting
Regularization
techniques
Tuning the strength of regularization prevents over-tuning
OptimizationExperimental adjustment of the optimizer that best suits the problem at hand, positively affecting the learning speed and convergence of the network
Table 6. Stages of neural network model tuning procedure.
Stage of the ProcedureDescription
Feature analysisUnderstanding the nature of the data set and the extent to which it influences the final result
Feature engineeringTransforming existing features or creating new features to improve the model’s ability to capture patterns in the data
Feature selectionDimensionality reduction through selection or elimination
Cross-validationCompartment of the performance of different feature sets and hyperparameter configurations to prevent overfitting
Iterative tuningContinuous repetition of procedures until the most effective model is found in the analysis of validation data
Table 7. Comparison of the results of the different models used to solve the problem presented in the article.
ModelAccurracy
(Learning) [%]
Accurracy
(Testing) [%]
RMSE
MLP 42-60-885.3386.810.001
CNN 42-50-50-883.2285.370.002
Support Vector Regression (SVR) *81.1182.780.01
eXtreme Gradient Boosting (XGBoost)77.2278.960.02
Polynomial regressionSpearmann’s Rho 0.699 (p < 0.05)
* Hyperparameters, i.e., penalty factor, insensitive loss function, and kernel function were selected experimentally.
Table 8. The five best MLP network models (the best one is bolded).
ANN StructureActivation Function
in the Hidden Layer
Activation Function
in the Output Layer
Accuracy
(Learning)
[%]
Accuracy
(Testing)
[%]
RMSE
MLP 42-46-8SigmoidSigmoid81.1382.430.02
MLP 42-52-8SigmoidSigmoid83.4684.260.01
MLP 42-60-8SigmoidSigmoid85.3386.810.001
MLP 42-66-8SigmoidSigmoid83.3684.120.01
MLP 42-72-8SigmoidSigmoid80.9582.210.02
Table 9. Strengths, weaknesses, opportunities and threats (SWOT) analysis of AI-supported transformation of energy markets [10].
PositiveNegative
I
n
t
e
r
n
e
l
Strengths
Increased data analytics
Energy forecasting
Optimization of energy generation, distribution, and consumption
Predictive maintenance
Weaknesses
Integration challenges
AI complexity
Algorithm bias
Data privacy
E
x
t
e
r
n
a
l
Opportunities
Carbon emissions reduction
Improved energy trading
Integration of renewable energy sources into the grids
Advanced mart grids technologies
Threats
Regulatory challenges
Cybersecurity risks
AI reliability during critical energy decisions
Low societal awareness
Table 10. Limitations of AI-supported transformation of energy markets [10,36,37,38].
LimitationDetailed Description
Data quality
and availability
The energy sector can have limitations in terms of data quality, consistency and availability, and inaccurate or incomplete data can lead to unreliable AI-based decisions.
High complexity of energy systems (especially distributed renewable energy systems)Complex systems with different stakeholders, regulatory constraints, and dynamic interactions can be reflected by AI models with oversimplifications, leading to inaccurate predictions.
Uncertainty of the energy transition in an environment of evolving policies, new technologies and high energy market dynamicsRapid changes in areas of government policy and regulation can disrupt AI-based strategies, require too frequent model updates and make it difficult to select the best models.
High upfront costsImplementing AI solutions in the energy sector can be costly, requiring investment in technology, workforce preparation and infrastructure, and smaller organizations and regions may face barriers to entry here.
Challenges related to the required upgrade or replacement of energy infrastructureTransforming energy markets may require significant changes to infrastructure, but their AI-based optimization may be hampered by physical and logistical challenges.
Threats in the area of cyber securityMalicious actors can attack AI systems to disrupt energy supplies or gain unauthorized access to sensitive data.
Resistance to change, including the threat of job loss/changeImplementing AI-based transformations can face resistance from stakeholders who are used to traditional approaches or skeptical of new technologies.
Table 11. Directions for further research of AI-supported transformation of energy markets [10,56,57,58,59,60,61].
Direction of Further ResearchDetailed Tasks and Activities
Integration of renewable energy sources into the gridDevelop AI models and algorithms to facilitate the seamless integration of renewable energy sources (e.g., solar, wind) into the grid and to predict and manage intermittency, optimize energy storage, and demand management.
AI-based optimization of the energy market structuresOptimization of energy market structures should include pricing mechanisms, trading platforms and capacity markets to encourage the use of renewable energy and ensure grid stability.
Resilience of energy grids against physical and cyber threatsThese activities include the development of predictive maintenance models, real-time monitoring, and adaptive network control.
Improving energy efficiency in various sectorsSectors such as manufacturing, transport, and buildings should be subject to examining and optimizing the impact of energy efficiency on reducing emissions and energy costs.
Role of AI in managing decentralized energy systemsMicrogrids and DER should enable energy production and consumption to be as local as possible.
Forecasting of energy use and carbon emission reductionImproving AI-based energy forecasting models to more accurately predict energy demand and supply, taking into account weather patterns, consumer behavior, and new technologies.
Exploring AI strategies to optimize energy consumption patterns to reduce carbon emissions: demand response, predictive analysis to reduce emissions, and carbon footprint tracking.
AI explainability and accountabilityEnsuring that stakeholders can understand and trust AI-based decisions.
Disclaimer/Publisher’s Note: The statements, opinions and data contained in all publications are solely those of the individual author(s) and contributor(s) and not of MDPI and/or the editor(s). MDPI and/or the editor(s) disclaim responsibility for any injury to people or property resulting from any ideas, methods, instructions or products referred to in the content.

