Article

The Energy Retrofit Impact in Public Buildings: A Numerical Cross-Check Supported by Real Consumption Data

by
Vincenzo Ballerini
1,
Bernadetta Lubowicka
2,
Paolo Valdiserri
1,*,
Dorota Anna Krawczyk
2,
Beata Sadowska
2,
Maciej Kłopotowski
2 and
Eugenia Rossi di Schio
1
1
Department of Industrial Engineering DIN, Alma Mater Studiorum—University of Bologna, Viale Risorgimento 2, 40136 Bologna, Italy
2
Faculty of Civil Engineering and Environmental Sciences, Bialystok University of Technology, Wiejska Street 45E, 15-351 Bialystok, Poland
*
Author to whom correspondence should be addressed.
Energies 2023, 16(23), 7748; https://doi.org/10.3390/en16237748
Submission received: 11 October 2023 / Revised: 21 November 2023 / Accepted: 22 November 2023 / Published: 24 November 2023

Abstract

:
In the framework of reducing carbon dioxide emissions and energy consumption, the energy retrofit of existing buildings plays a significant role and is often supported by numerical analyses of the planned activities and expected results. This study analyses a public building (a kindergarten) located in Bialystok (Poland) and aims to determine the building’s energy performance prior to and after thermal modernization. The building was examined by employing two different software packages, Audytor OZC 7.0 Pro and Trnsys 18. The thermal efficiency improvement applied to the renovated building in Bialystok was also analyzed by virtually locating the building in Bologna (Italy). Moreover, a comfort analysis focused on the classrooms of the kindergarten was carried out employing Trnsys. As a novelty, in the analysis, particular attention is paid to ventilation losses and to the influence of envelope elements properties on the building energy demand. The results arising from analyses were compared to real consumption data for the heating season. The results obtained from the two software programs display excellent agreement, and they also match the real consumption data if the heating demand is considered, while some differences arise when the cooling demand is considered.

1. Introduction

In Europe, the building energy demand share was 30% (21% due to the residential sector and 9% due to non-residential buildings) of global final energy consumption in 2021, as stated by IEA (International Energy Agency) [1] and United Nations Environment Program reports [2]. To achieve the recent ambitious and challenging greenhouse gas emissions reduction targets by 2030, recently updated in “Fit for 55” package [3], energy consumption reduction at the building level is essential. To fulfill the ambitious emission reduction targets by 2030, it is crucial to focus on energy consumption reduction at the building level due to the significant role they play, and one potential solution is to enhance energy efficiency by reducing the thermal demand of buildings through effective insulation practices. Additionally, adopting innovative systems and technologies, such as heat pumps, can further contribute to achieving energy savings and reducing carbon footprint in the building sector as well as carbon dioxide emissions [4].
When broadening the field to the transition to green and renewable energies also from an economic point of view, many recent papers should be cited [5,6,7,8].
Dynamic analysis plays a crucial role in building energy efficiency and reducing thermal demand [9,10,11]. By accurately modeling the building and its interaction with the HVAC (Heating, Ventilation and Air Conditioning) system, dynamic analysis can capture the influence of transient phenomena on energy balances and on the overall system performance. This approach enables a comprehensive understanding of the building’s behavior, allowing for more precise optimization and control strategies to enhance energy efficiency and thermal comfort. However, diverse types of professional software are used nationally in HVAC systems design that support engineers and decision makers. There are various assumptions and approaches that simplify calculations and design processes while leading to higher or lower accuracy.
Public buildings contribute significantly to emissions in Europe, as indicated in various reports and studies. For instance, according to a 2019 report by the European Commission, public buildings account for approximately 10% of the total CO2 emissions in the European Union and the Council and European Parliament promulgated Directive 2010/31/EU which prescribes that all the new public buildings built after 31 December 2018 must be nZEBs (near-zero energy buildings) [12].
Together with Universities [13] and Schools [14], Kindergartens, which constitute a significant percentage of public buildings, have been repeatedly analyzed by researchers.
Causone et al. [15] describes the study that supported the design for the zero-energy retrofit of a kindergarten as part of a renovated smart district. To reduce the energy demand for heating and cooling, prefabricated modules were proposed, including mechanical ventilation and solar shading. The building performance simulation tool EnergyPlus (version 1.8.0) was used to perform the energy simulation of the building. The results of the energy simulation showed a reduction of primary energy by 85% compared to the pre-retrofit conditions.
Gajić et al. [16] analyzed the influence of parameters derived from architecture, building physics, building materials, technology, and the measured thermal performance of the envelope on the energy performance indicators of two representative kindergartens. The researchers recommended that measurements of the thermal efficiency of the partitions of old buildings should become a mandatory element of energy audit. Based on the conducted analysis, they concluded that kindergartens must be introduced as a specific type of building in policies related to the minimum requirements for energy performance of buildings, rational use of energy, and the certification of buildings and energy audit.
Krawczyk et al. [17] carried out the research which aims was to show the advisability of using selected renewable energy sources for domestic hot water (DHW) installations in kindergartens located in Poland and Spain. The analysis was carried out for a typical kindergarten, an example of buildings with a high density of people and a stable occupancy profile. Total cost of installation with air source heat pumps in Poland was found to be 18% higher than in Spain, while, in the case of solar collectors, the cost was 1.4 times higher.
In this paper, an analysis of a public building located in Poland (Bialystok) has been conducted employing two different software programs. Moreover, as a novelty, an analysis of the same building virtually located in another Italian town (Bologna) has been performed, and the results have been compared to determine the influence of distinct locations and different local regulations on the overall energy efficiency indexes, prior to and after renovation. Particular attention is paid to the effect of the air change rate and to how the choice of this value, prior to and after the building’s retrofit, affects the numerically obtained results.
More specifically, the article begins with an introduction to the characteristics of the analyzed building and the meteorological data used for the analyses. Then, the analysis setup is presented for two software programs, Audytor OZC 7.0 Pro [18] and Trnsys v.18 [19]. Following this, the software-generated analysis results are presented. Moreover, a comparison between the building located in Bialystok and the same building virtually situated in Bologna is discussed as well. Finally, the software results are validated with the monitored monthly thermal energy data on-site, and a dynamic analysis of the comfort achieved within the building after the retrofit will be presented.

2. Materials and Methods

Let us consider the kindergarten reported in Figure 1. To perform analyses on the public building, two different software have been employed. The dynamic simulations have been performed employing Trnsys v.18 [19] coupled with type 56 (multizone building) and Tess libraries [20,21], and with some additional types to simulate the terminal emitters [22]. The building analyzed in Trnsys has been modelized employing Google Sketchup v. 15 [23] and then the Trnsys 3d Plugin for Google Sketchup [24] has been used to prepare the geometry input for Trnsys deck.
The other software program used to perform the calculations is Audytor OZC 7.0 Pro. This software employes calculation methods in accordance with Polish and European guidelines. PN-EN ISO 6946 [25] standard was used to calculate the heat transfer coefficients of multi-layer partitions. To calculate the design, the heat load of the building PN-EN 12831:2006 [26] was used, and PN-EN ISO 13790 [27] was applied to calculate thermal energy demand.
Figure 1. Photo of the building located in Bialystok (a) and location (red dot) in Bialystok municipality [28] (b) (photo: D. Krawczyk).
Energies 16 07748 g001aEnergies 16 07748 g001b

3. Building Description

The building analyzed is a public building located in a residential area in Białystok (53°07′27.8″ N, 23°08′12.8″ E) intended for use as a kindergarten (Figure 1b). In detail, public kindergarten No. 7 in Białystok was founded in 1967. Originally, it functioned in a wooden building, and in 1972 it was relocated to a building located at Bydgoska Street. The new investment was carried out on a large, separate plot with an area of over 4300 m2. A typical two-story building was located on the plot, with a recreation terrace adjacent to it from the south. A dozen chestnut trees were planted on the plot, which contributed to giving it the name “Chestnut Corner”. Currently, 15 trees, several decades old, separate the area from the surroundings and form the housing of the recreational space, the central part of which is a playground for children, equipped with numerous play equipment, including two roofed sandpits and a toboggan hill. The kindergarten building is located in the northern part of the plot. It is a compact, rectangular, two-story building. The entrance to the building is located on the north side. Individual facades of the building have a varied number and area of window openings. The majority of them—illuminating the didactic rooms—are facing south. These rooms are located in the corners of the building, which allows for optimal lighting and sunlight. There are five branches in the facility. In 2021, the building underwent a thorough modernization. Its results, apart from the replacement of window and door carpentry and thermal modernization, included the roofing of a recreational terrace with an area of 150 m2 and the reconstruction of the entrance area, including the construction of a ramp for wheelchairs to adapt the facility to the needs of people with disabilities.
In Figure 2, the two floors’ layout is shown (total floor area of about 600 m2, 3 m height of the main rooms and a total volume of 1800 m3). As it can be seen from Figure 2, on the ground floor, there are two classrooms, different offices, a dressing room, and the hall, while on the second floor, there are three classrooms, other offices, and a cooking area. Both the first floor and the ground floor present corridors and bathrooms, and the floors are connected with a lift and stairwells; in Table 1, the total floor area of the zones are reported.
In Figure 3, the 3D view of the building modelized employing Google Sketchup is shown: the purple parallelepipeds are the other building and vegetation which cast shadows on the considered kindergarten. From Figure 3, it can also be observed that beneath the ground floor there is a cellar that has a height of 2.55 m, and there is a non-heated zone.
The public building considered here has been subject to thermal modernization during the years 2019–2021 [29]; the thermal modernization consists of insulation of the vertical external walls and the roof, together with the replacement of the windows and of the doors.
In Table 2, the transmittances prior and after thermal modernization for opaque and transparent enclosures are reported. It can be noticed that some enclosures (internal walls, inter-floors and the ground floor) have not been subjected to thermal modernization activities. All the vertical walls are made of bricks, the ground floor and the roof are made of concrete, and the modernization consists of insulating panels (conductivity ranging from 0.032 to 0.042 W/(mK)) applied to the external side of the walls and of the roof.

4. Weather Data

In this section, meteorological data employed for analysis with both software, Trnsys and Audytor OZC 7.0 Pro, are presented.

4.1. Trnsys Weather Data

Weather data employed for Trnsys simulations are taken from PVGIS (Photovoltaic Geographical Information System) [30,31], a free accessible tool provided by the European Union. The tool provides hourly data of air temperature, humidity ratio, wind speed and direction, global and diffuse radiation on the horizontal, beam radiation on a normal surface, and atmospheric pressure all over Europe, Africa, and a lot of places in Asia and America. The tool provides also a typical meteorological year (TMY) which can be employed to perform dynamic simulations. The typical meteorological year has been downloaded from [31] for the two towns considered, Bialystok and Bologna. In Figure 4, the daily and monthly mean outdoor temperatures are reported together with the monthly horizontal global radiation for the two towns. Figure 4a shows that Bologna presents higher daily temperatures in comparison to Bialystok for almost the whole year. Moreover, Bialystok presents the minimum daily temperature (−18.2 °C) at the end of January, while the minimum daily temperature of −1 °C in Bologna occurs on the first of January; the maximum daily temperature is 25.0 °C and 29.2 °C for Bialystok and Bologna, respectively. From Figure 4b, it can be noticed that Bialystok presents a minimum monthly temperature of −5.2 °C in January, while the minimum monthly temperature for Bologna is 4.5 °C in February. The annual mean temperature for Bialystok and Bologna is 9.3 °C and 13.9 °C, respectively. The determination of the heating degree days (HDD) and cooling degree days (CDD), as reported in Equations (1) and (2), where tair,i (°C) represents the daily outdoor temperature and index i the i-th day of the year, gives the values presented in Table 3.
H D D = i H D D i , H D D i = 20 t a i r , i , i f   t a i r , i 15 0 i f   t a i r , i > 15
C D D = i C D D i , C D D i = t a i r , i 20 , i f   t a i r , i 24 0 i f   t a i r , i < 24
As predictable, the HDDs are higher in Białystok than in Bologna and the CDDs in Białystok are close to zero.
Focusing on solar irradiance, Bologna presents an annual irradiance of 1100 kWh/(m2y), while Białystok, 1557 kWh/(m2y) and the relative sunshine duration (RSD) expressed as the percentage of the hours in which the sun is visible respect to the total possible sunshine hours results 69.0% for Białystok and 85.5% for Bologna; for Białystok, during winter months (November–February), the monthly irradiance is less than half compared to Bologna as shown in Figure 4c.
The two municipalities exhibit two continental climates, with some significant differences. Bologna is characterized by a Mediterranean continental climate (classified as Cfa, humid subtropical climate according to the Köppen–Geiger classification [32]), with cold and humid winters and hot summers (average winter temperatures ranging from 0–5 °C and summer temperatures exceeding 30 °C in the hottest months). In contrast, Białystok features a humid continental climate (classified as Dfb, also according to [32]), with cold and snowy winters and warm summers (winter temperatures typically dropping below −10 °C, while summer averages hover around 20–25 °C). Furthermore, data obtained from [30,31] (it is important to note that these data represent typical meteorological years, i.e., hourly values derived from historical series, covering a period of at least 10 years) reveal adherence to the expected climate classifications for both locations, in terms of temperature (Figure 4a,b) and relative humidity. The annual mean values of the relative humidity are consistently high, exceeding 70% (71% for Bologna and 78% for Białystok, respectively). Additionally, Białystok experiences higher wind speeds compared to Bologna (annual average wind speed of 3.0 m/s for Białystok and 1.8 m/s for Bologna, with a prevailing southwesterly direction for both).

4.2. Audytor OZC 7.0 Pro Weather Data

Weather data used for calculations in the case of Białystok come from the weather database in the Sankom Audytor OZC 7.0 Pro software. Typical meteorological year and statistical climatic data for energy calculations of buildings in the Audytor OZC 7.0 Pro software come from the official website of the Polish Ministry of Infrastructure (PMI). Datasets necessary to determine typical meteorological year and aggregated climate data for the purposes of energy analysis and simulations of buildings were generated from the database of the Institute of Meteorology and Water Management. The generated sets contained source data from a period of thirty years, starting from 1971 and ending in 2000, for meteorological stations in Poland with sequences of at least 3 h forward data for a period of at least 10 years. However, the meteorological data contained in the Audytor OZC 7.0 Pro software include some corrections in relation to the data available on the website of the PMI. According to data available on the PMI website, the average temperature in the month of the heating season for May and September was calculated for the entire month. In the Audytor software, average temperatures for May and September were calculated based on hourly data only for a few days of the heating season in these months.
Audytor software has weather data only for meteorological stations located in Poland. Therefore, weather data for Bologna was used in accordance with [30,31]. Figure 5 shows the average monthly dry bulb temperature. The design outdoor temperature and the average annual temperature in Poland depend on climatic zone in which the analyzed building is located. According to Polish law [20], in the winter period Poland was divided into five climatic zones. Bialystok (53° N, 23.25° E) is in the IV climatic zone where the design outdoor temperature is −22 °C and the average annual temperature is 6.9 °C. For Bologna (44.29° N, 11.20° E), the design outdoor temperature and the average annual temperature was assumed −5 °C and 13.9 °C, respectively.

4.3. Comparison between Trnsys and Audytor OZC 7.0 Pro Weather Data

Considering weather data related to Bialystok and presented in Section 4.1 and Section 4.2, we can see that there are some differences between the weather data employed in the two software. For example, the monthly dry bulb temperature results below zero for three months (December, January, and February) if the data employed in Audytor OZC is considered, while the monthly temperature is below zero only in January if data retrieved from [31] is considered. Moreover, in general, the monthly dry bulb temperature results higher in [31] with respect to Audytor weather data; this aspect has an influence on the mean annual temperature, which is 9.3 °C according to [31] data, and 6.9 °C according to Audytor weather data.

5. Setting of the Analyses

In this section, the assumptions and setting of the analyses performed with both software, Trnsys and Audytor OZC 7.0 Pro are presented.

5.1. Trnsys

The building thermal zones have been imported in Trnsys after being with Google Sketchup; the external enclosure characteristics have been implemented considering the ones reported in Table 2. Weather data employed in simulations for Białystok and Bologna have been described in Section 4.1, while the ground temperature has been determined employing Trnsys type 77, which calculates the temperature according to the Kusuda model [33]. The ground temperature at 1.30 m and 2.55 m was determined, and the first is the boundary condition for the vertical walls, while the latter is the boundary condition for the cellar’s ground floor. The parameters employed in type 77 are reported in Table 4 and have been retrieved from [34] for dynamic simulations performed in Białystok and from [35] for the ones performed in Bologna. The internal gains due to equipment and lights have been considered according to the value proposed by UNI TS 11400-1 norm [36] for kindergartens and kitchens, while the gain due to people is considered as reported in IEA Task 44 [37], which considers 60 W for each person (divided in 20 W in convective gain and 40 W in radiative gain) and, in addition, a latent gain of 0.059 kg/h for each person. In Table 5, the gains considered in analyses are reported, together with the hours in which these gains are present in the building; in fact, it can be observed that on nights and Sundays the gains are not considered, because, in these moments, there should be no people and no equipment switched on in the kindergarten.
The air change rate in all the thermal zones is set to 0.5 h−1 and the set-point temperature for the heating system is set to 20 °C for offices, kitchen, classrooms, and bathrooms, while it is set to 16 °C for all the other heated zones (the only non-heated zones are the lift, the cellar, and the stairwells to the cellar). For cooling, a set-point of 26 °C has been prescribed, but corridors, entrances, bathrooms, and stairwells are considered not cooled (surface floor area of cooled thermal zones is 480 m2).
The public building is connected to local district heating in Białystok, and the terminal emitters are aluminum radiators. The values reported in Table 6 have been assumed for the calculation regarding the radiators and they have been sized to maintain the set-point temperature with an outdoor temperature of −22 °C, i.e., the winter design temperature in Białystok.
The radiators are modelized using type 362 and each controlling thermostatic valve using a five-stage thermostat (type 1502).
The weather data downloaded from PVGIS database are included in Trnsys by means of a data reader (type 9e), a solar radiation calculator (type 16k), and a sky temperature calculator (type 69b). Type 16k and 69b have, as input, the following data: air dry bulb temperature, humidity ratio, wind speed and direction, diffuse radiation on horizontal, and the beam radiation on a normal surface to sun rays. The layout of the heating system is reported in Figure 6a, while in Figure 6b, a focus on the weather data processor is shown, as built in Trnsys. Indeed, Trnsys is a commercial dynamic simulation software based on ‘blocks’ (referred to as ‘types’) that encapsulate the behavior of a component or a physical phenomenon (such as a building, a boiler, or a water pump) through models generally based on differential equations. Within these types (which can be interconnected through links, as shown in Figure 6a, where the building is linked to the heating system), equations representing physical quantities’ balances are defined. The software then computes the numerical solution iteratively for the entire set of balance equations for all types. This iterative approach is often necessary due to the complexity of the analyzed system, as obtaining an analytical solution is often impractical.
The main balance equations of type 56 (multizone building) and type 362, which models radiators, will now be briefly discussed. Regarding type 56, it provides the determination of a single air temperature for each k-th thermal zone modelized (or technically, for each k-th “airnode”), solving the following heat balance Equation (3):
Q ˙ k = Q ˙ v e n t , k + Q ˙ i n f , k + Q ˙ s u r f , k + Q i n t , k w
where Q ˙ k is the gain of the airnode, Q ˙ v e n t , k is the airnode gain for ventilation, Q ˙ i n f , k is the gain due to infiltration, Q ˙ s u r f , k is the gain from surfaces (i.e., external walls, partitions, ceiling and roof), and Q i n t , k represents the internal gains.
Type 362, which simulates the radiators, is based on a first-order radiator model, described by the following balance Equation (4):
m ˙ w c w t w , i n t w , o u t = C t τ t w , o u t + U A t w , o u t t a i r ,
where m ˙ w is the water mass flow rate through the radiator, cw is the specific heat capacity of the water, tw,in, tw,out and tair are the water inlet, outlet and air temperature, respectively, Ct is the thermal capacity of the water, and UA is the heat transfer coefficient of the radiator. For the other types used in the Trnsys deck, the guide [19,20,21,22] provides detailed information on the models and the equations that compose them.
Five dynamic simulations have been performed, considering the building in Białystok for case S1 and S2, and in Bologna for S3, S4, S5, as reported in Table 7.
The building in case S1 and S3 is the “non renovated building” (i.e., the building presenting thermal characteristics and transmittances reported in Table 2 prior the renovation), while the building considered in case S2 and S4 is the building presenting the characteristics and transmittance values after renovation. Moreover, another dynamic simulation has been performed for the building virtually located in Bologna, considering the typical transmittance and characteristics that public buildings subject to renovation should have in Bologna, according to Decree DRG 967/2015 [38]. The transmittances of the building in case S5 are reported in Table 8. The simulations S1–S4 provide the possibility to compare the difference in thermal demand of buildings in the two cities, Bologna and Białystok, and evaluate the influence of energy retrofit on building performance.
Specifically, the analysis of the data related to the thermal demand of buildings before and after the energy retrofit intervention enables assessing the effectiveness of the measures taken in reducing energy consumption and improving thermal performance of the buildings.
In the last simulation, the effect of the actual renovation carried out in Bialystok has been examined, comparing it with the provisions established in Italy for public buildings in 2019. This comparison allows one to evaluate whether the energy retrofit measures adopted in Bialystok are aligned with or exceed the prevailing regulations in Italy. Concerning case S5, in this analysis, only the performance and regulation of the building during the heating season have been investigated; indeed, the Regional Decree [38] prescribes to compare the thermal energy demand related to building reference floor area (EP,H) of the real building to the value of a similar parameter (EP,ref), specifically of a reference building presenting the same characteristics of the real building in terms of boundary conditions and geometry (location, external shadings, internal gains, etc.) but different transmittance of the building envelope components, as reported in Table 8. The public building subjected to thermal renovation in Italy (specifically, in the Emilia-Romagna region, to which Bologna belongs), must have, after renovation, an EP,HEPH,ref. The last simulation (S5) considers the reference building and then an analysis of cases S4 and S5 will be shown in the next chapter, in order to assess the respect of Italian regulation for the building as renovated in Poland and to assess if the renovation complies with the current energy efficiency regulations in Italy, and if any differences in efficiency are achieved in the two scenarios.
It is important to emphasize that the boundary conditions and the building usage remained constant across the five scenarios analyzed. The only variables that differed were the weather conditions for the two locations and the building envelope; all the simulations have been performed considering a simulation timestep of 15 s. Lastly, it is important to highlight that an assumption was made regarding the EPH,ref calculation in accordance with the Decree. The Decree suggests that EPH,ref should be calculated under “standard” conditions, considering the specifications outlined in UNI TS 11300 [36]. However, in the conducted dynamic simulations, the influence of both the building and its systems was taken into account, considering the actual operating conditions of the building.

5.2. Audytor OZC 7.0 Pro

For the calculations, it was assumed that the ground on which the building is founded is sand or gravel. The following physical parameters of the ground were assumed: heat capacity, 2000 MJ/(m3K); depth of periodic heat penetration, 3.167 m; and thermal conductivity, 2.0 W/(mK).
In accordance with Polish guidelines [39], the building type was defined as a public utility building. The building structure was determined as medium, assuming the default internal unit heat capacity of the building referred to the temperature-controlled surface is 165 kJ/(m2K). The class of building shielding, based on which the flows of air infiltrating the rooms were calculated, was defined as high. In the software, highly shielded buildings include, among others, medium-high buildings in city centers. The shading coefficient of the building was assumed to be 0.9.
In the case of heat transfer calculations through external building partitions, thermal bridges were considered. Thermal bridges were calculated using a simplified method using correction factors.
Internal heat gains were calculated based on the simplified method. According to the Polish guidelines [40], the average unit power of internal heat gains (without gains from heating and hot water installations) is 3.1 W/m2 for schools. It is related to the temperature-controlled surface.

6. Results

In this section, the results obtained from analyses are reported, employing both software; moreover, the validation of the comfort analysis with the experimental data obtained collected during the measurements campaign is reported as well.

6.1. Trnsys

In Table 9, the results of dynamic simulations performed for the five cases are reported. The energy performance indicators related to the reference floor area (EPH and EPC) have been determined considering the actual floor area of the zones: heated (615 m2) and cooled (480 m2), respectively. In Figure 7, the monthly energy demand is reported for the heating season, considering cases S1–S4. Obviously, the monthly energy demand is always higher for Bialystok than Bologna, and the important reduction in thermal energy demand for cases S2 respect to S1 and for S4 respect to S3 can be observed.

6.2. Audytor OZC 7.0 Pro

First, calculations of total design heat load for the kindergarten before and after renovation were performed for two locations: Bialystok and Bologna. The results are presented in Figure 8.
Then, calculations of the annual thermal energy demand for heating (ET) and the annual thermal energy demand for cooling (EC) were made. Table 10 shows a summary of the results obtained, considering the energy demand for heating and cooling related to reference floor area. Figure 9 shows a comparison of monthly thermal energy demand for heating considering cases S1–S4.
During the analysis, special attention was paid to energy losses for ventilation, as their significant impact on the obtained results was noticed. Figure 10 shows the ratio of loss of thermal energy for ventilation to total loss of thermal energy.

6.3. Real Energy Consumption

Based on the data received from the energy supplier servicing the kindergarten building, the real energy consumption for 2022 was calculated. The results are presented in Table 11. The energy consumption in the building is measured using heat meters. Readings are recorded once a month. Note that the results in Table 11 present the final energy consumption of the building and refer only to the heating system (i.e., the demand for domestic hot water is not included in these data). In some months (March, December), the average monthly temperature in 2022 was in fact equal to the average monthly temperature for a typical year taken into account for simulations in Audytor. April and May were slightly colder than in a typical year, while the rest of the months were slightly warmer. Calculations in Audytor OZC 7.0 Pro software did not consider the summer period (July–August) for heating, while in real conditions there were a few days with low outdoor temperature and heating was required. The average yearly temperature in Bialystok in 2022 was 8.3 °C, while the value of a typical year is set at 6.9 °C [41]. Despite this fact, real energy consumption for heating in 2022 (76,031 kWh) was higher than simulated using Audytor OZC 7.0 Pro software (70,810 kWh) and Trnsys (68,108 kWh). However, it is important to note that the data obtained in both software are useful energy, not considering such parameters as transmission efficiency or losses in installations and devices.
In 2022, the real energy consumption for a theoretical heating season (September–May) was equal to 73,746 kWh, while theoretical estimations after considering the real efficiency of HVAC system of 0.93 (including generation, distribution, and regulation of the system) were found as were very well-fitted to reality (a difference of less than 4%). Results obtained for the kindergarten are in accordance with the research of Krawczyk [42] that was conducted on a Polish school. In detail, the research [42] highlighed that the difference between the real energy for heating use and the theoretical one was in a range of 14.2–32.0%, since many factors, like outdoor conditions, a real profile of occupancy, changeable indoor heat gains, number of children, regulation of HVAC system, or time of windows opening, etc., influence actual energy consumption for heating.

6.4. Influence of the Material Density of External Walls on Energy Consumption

Additionally, in Audytor OZC 7.0 Pro software, an experimental analysis was carried out to determine the impact of the density of the inner layer of external walls on energy consumption. Material density has been increased from 1300 kg/m3 to 2500 kg/m3. The results of the analysis are reported in Table 12. Results show consistency with findings of Jezierski and Sadowska [43], indicating a non-significant influence of materials’ density and accumulation in barriers for energy consumption.

6.5. Comfort Analysis

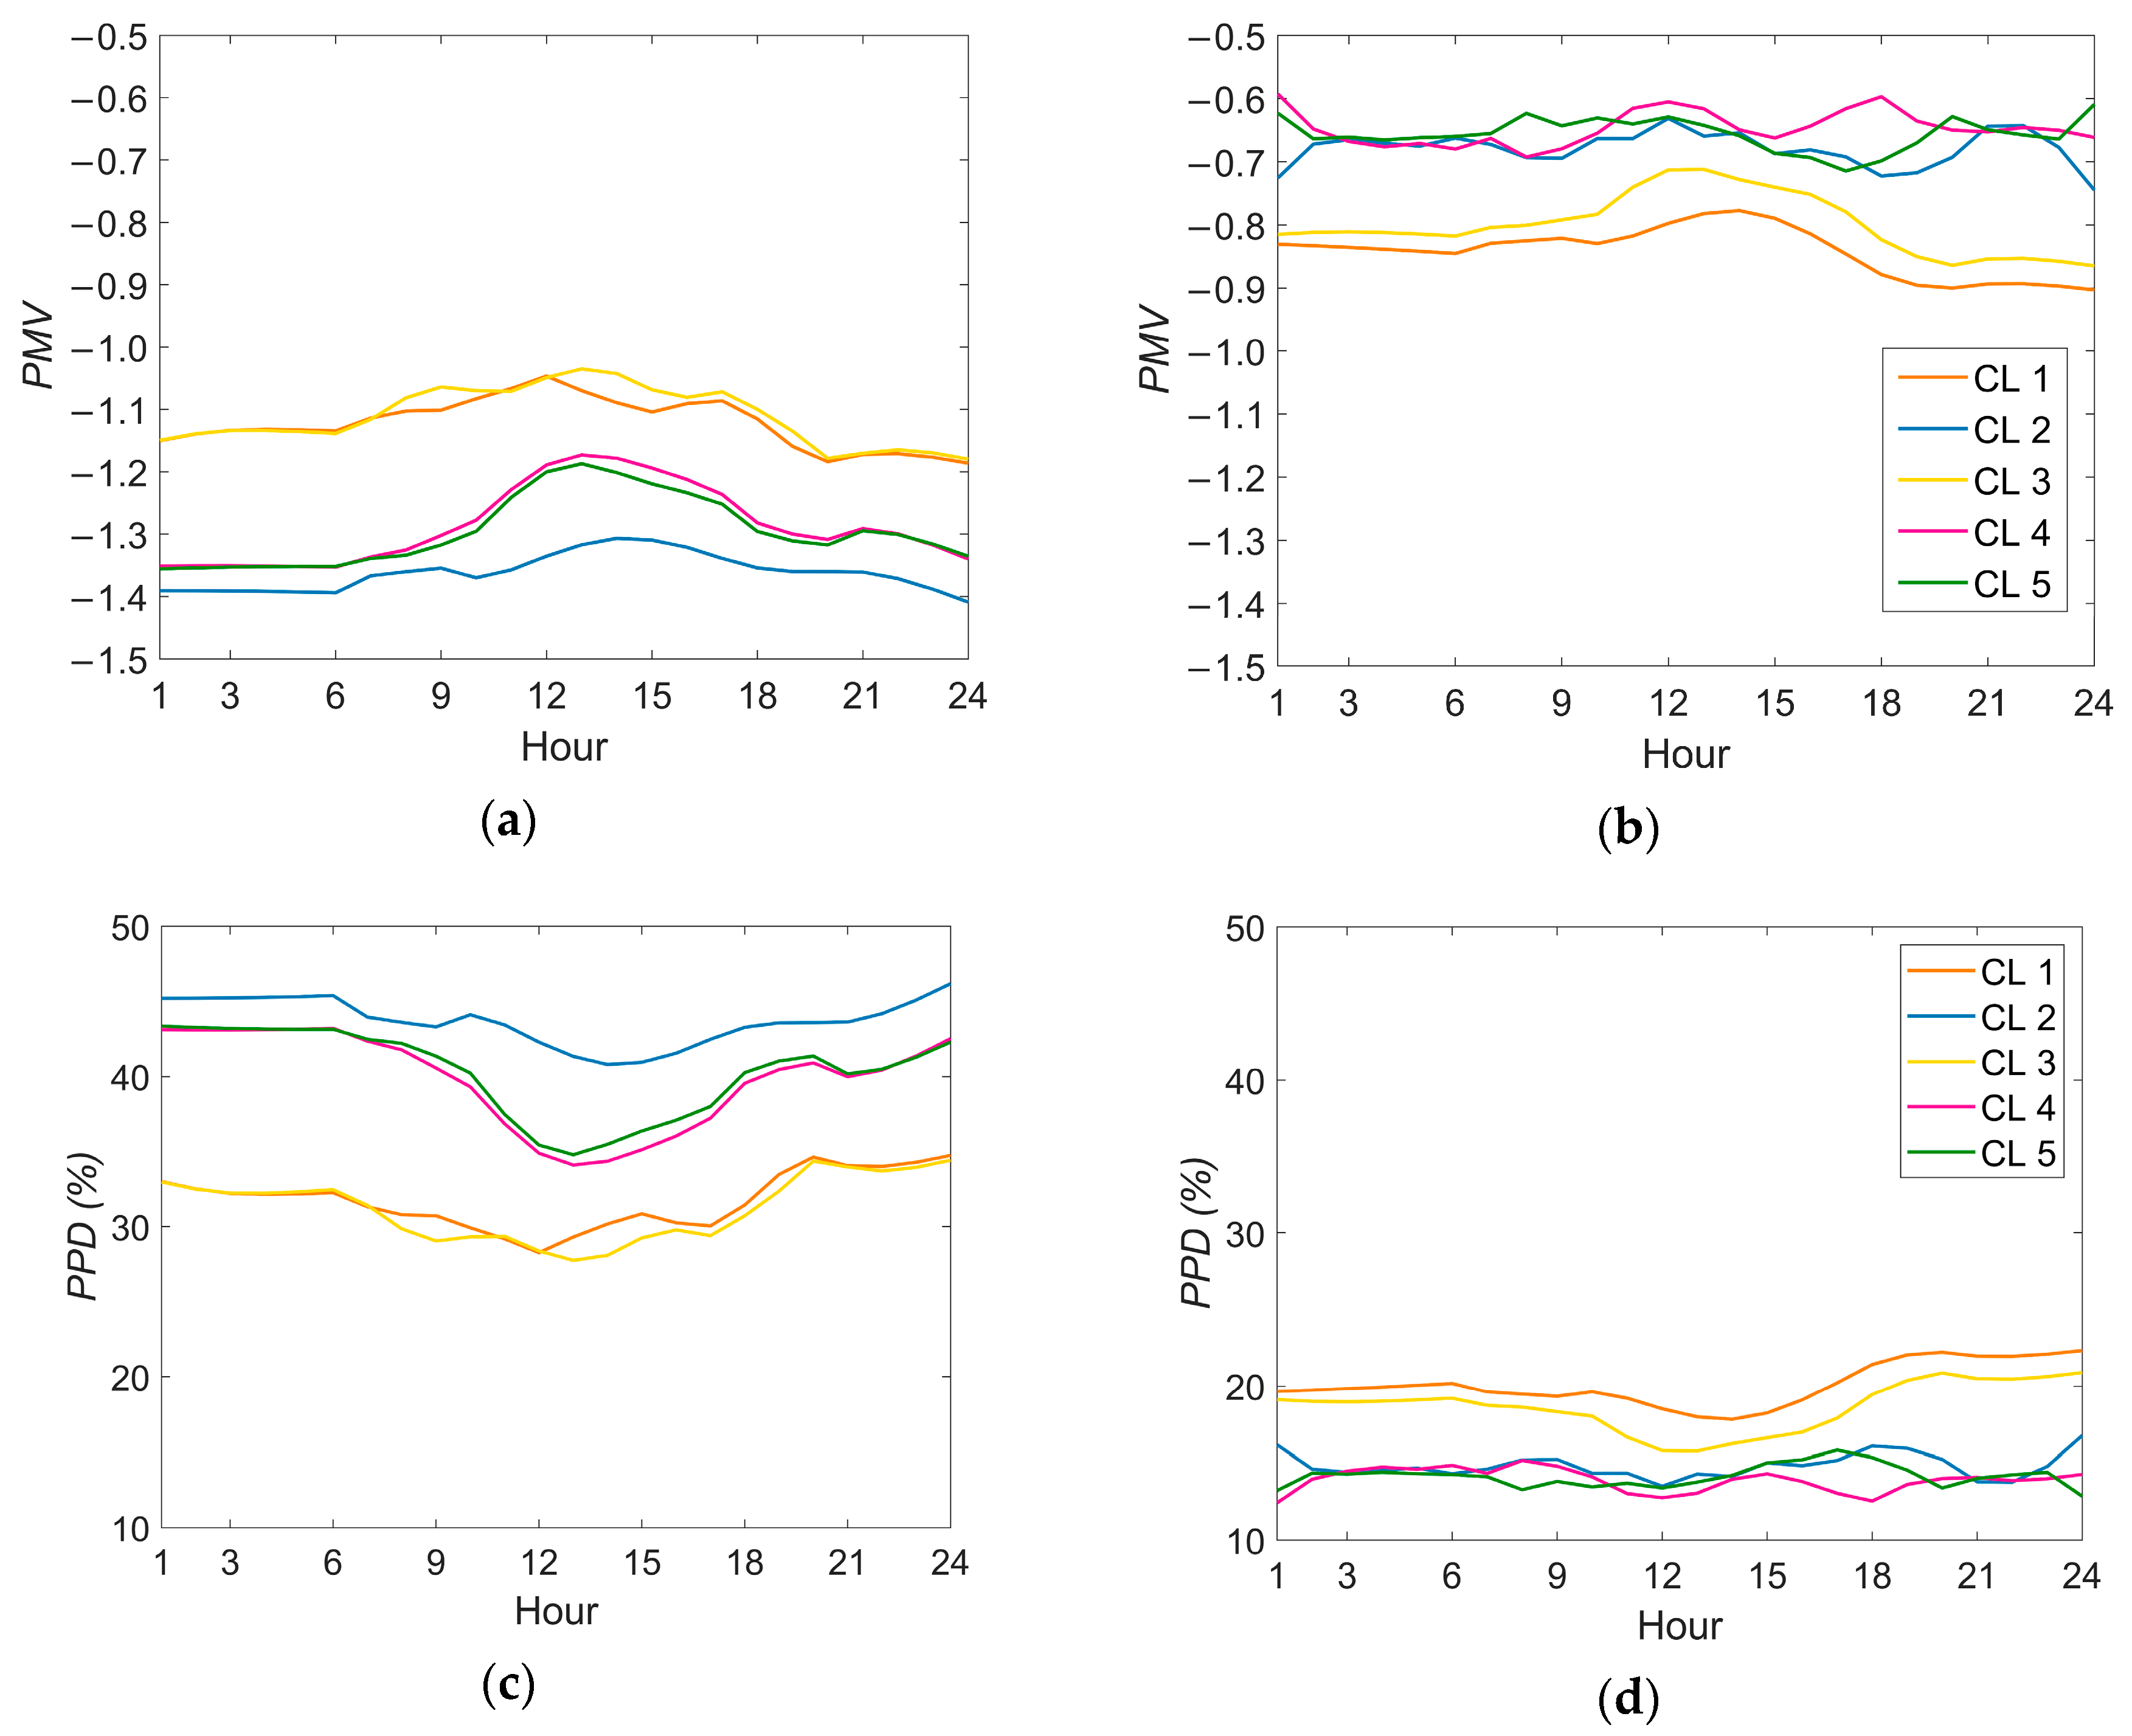
Employing Trnsys software, a comfort analysis has been performed on the classrooms, prior to and after building renovation. The hourly value of PMV and PPD [44,45] for the five classrooms have been determined and the results are reported in Figure 11, for cases S1 and S2, and for the coldest day of the year. The PMV has been calculated considering a fixed air velocity of 0.1 m/s, a metabolic rate of 1 Met, a clothing factor of 1 clo, and a percentage relative humidity of 50%. The air temperature and the mean radiant temperature have been considered as calculated by dynamic simulation software.

7. Discussion

Trnsys analysis shows that, considering the heating season and the data reported in Table 9, the percentage energy reduction after renovation is similar in Bologna and Bialystok (72.7% reduction in S4 compared to S3 for Bologna, and 67.8% reduction in S2 compared to S1 for Bialystok). The reduction in annual thermal energy demand for buildings in Bialystok and Bologna is 143,161 kWh and 89,122 kWh, respectively. Shifting focus to the cooling season, Trnsys results show that the renovated buildings in Bialystok experience an increase in energy demand for cooling (+836 kWh), while the building virtually located in Bologna needs less energy for cooling (−5151 kWh after renovation).
Analysis performed in the second software shows that energy reduction after renovation for both locations is also similar and is 70.2% reduction in S2 compared to S1 for Bialystok, and 71.4% reduction in S4 compared to S3 for Bologna. The reduction in annual thermal energy demand for buildings in Bialystok is 166,926 kWh and, in Bologna, is 89,139 kWh. The results obtained for cooling show that the energy demand for cooling increases for buildings after renovation. For the building located in Bialystok, the increase was 3063 kWh (37.5% increase in S2 compared to S1), and for the building located in Bologna, the increase was 4824 kWh (31.8% increase in S4 compared to S3). Based on the calculations performed in the Auditor OZC 7.0 Pro, both for Bialystok and Bologna, the heat for ventilation is the same for the building before and after thermal renovation. This happens because for all analyzed cases the air change rate is assumed constant. Moreover, the simulations are conducted with the assumption of constant indoor temperatures and equal design temperature in all cases. As shown in Figure 10, energy losses for ventilation have a significant impact on the total loss of thermal energy, especially for the buildings after thermal renovation. In both cases (S2 and S4), the ventilation loss of thermal energy is about 70% of the total loss of thermal energy.
In Table 13, the energy losses for ventilation obtained from Trnsys and Audytor OZC 7.0 Pro are reported. From Trnsys simulations, it can be observed that in case S2 with respect to case S1 and in case S4 with respect to case S3, the thermal energy losses for ventilation increases, i.e., in the renovated building the energy dissipated through infiltration increases. Focusing on cases S1 and S2, the dynamic analysis conducted with Trnsys allows us to observe that, despite the same set-point temperature and the same air change rate in both cases, the temperature inside the building is higher in the insulated building (S2). Consequently, ventilation losses (infiltration) are higher in S2 compared to S1; this aspect is clearly shown in Figure 12, where the monthly energy losses for ventilation are reported together with the mean monthly temperature of the classrooms located in the kindergarten. A similar aspect of ventilation losses can be applied to cases S3 and S4, where the energy required for ventilation is higher for S4 than for S3.
The results of the experimental analysis (Table 12) show that increasing the density of material of the inner layer of external walls has a small impact on the result of annual thermal energy demand for heating and cooling for all analyzed cases. Analysis performed in Audytor OZC 7.0 Pro software shows that the energy demand for heating increased slightly, while the energy demand for cooling decreased. For heating, the increase was 3.7% for Bialystok before renovation, 1.55% for Bialystok after renovation, 3.8% for Bologna before renovation, and 1.66% for Bologna after renovation. For cooling, the decrease was 0.96%, 0.76%, 0.64%, and 0.51%, respectively. In the literature, a [38] similar analysis using another software (Design Builder) and changing the density of material of the inner layer of external walls from 900 kg/m3 to 1600 kg/m3 has been presented, showing the small impact of these parameters on energy consumption.
Considering the results obtained from the two software, it can be stated that thermal energy demand for heating is similar (Table 9 and Table 10), the largest difference is observed for case S1 (−11.1% comparing Trnsys analysis results, to Audytor OZC 7.0 Pro results). However, this discrepancy can be attributed to the different climatic data used for the analyses, as previously indicated. Important differences between the two software can be observed in the energy demand for cooling: the cooling request related to the reference floor area, considering Trnsys respect to Audytor analysis, is lower for cases S1 and S2, and higher for cases referring to the building virtually located in Bologna (cases S3 and S4).
Focusing on results obtained from Trnsys software regarding cases S4 and S5 (the latter is the case that considers the reference building in Bologna), there are slight changes in thermal energy demand for heating (33,471 kWh for case S4 and 29,960 kWh for case S5), while there are important differences in terms of cooling demand (13,600 kWh for case S4, while 25,606 kWh for case S5), therefore the building retrofit is advantageous with respect to Italian prescriptions for the reference building.
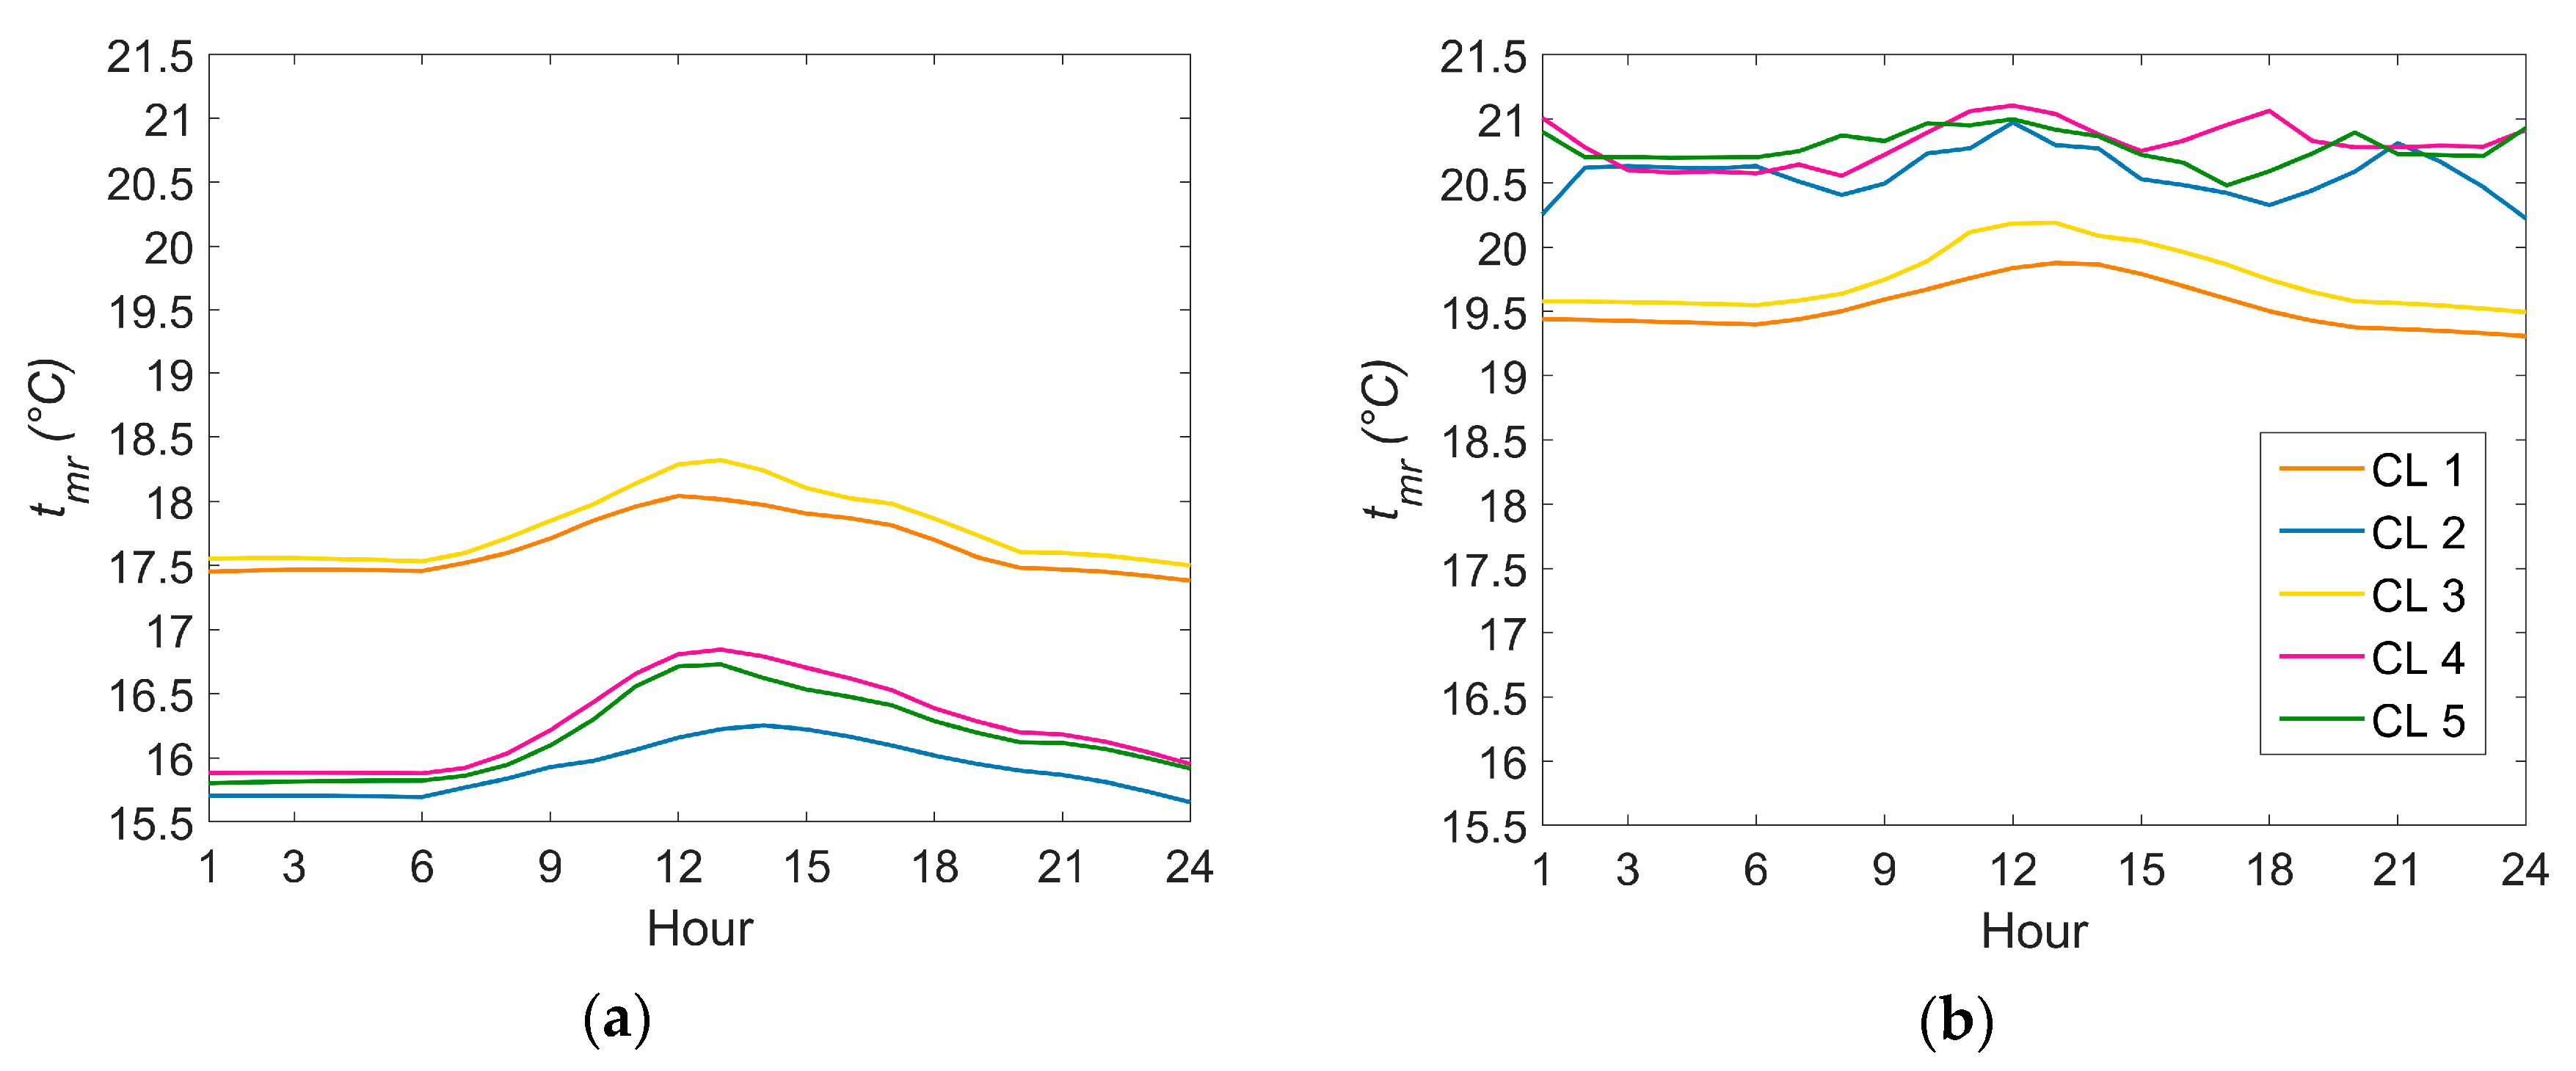
Regarding comfort analysis, from Figure 11, an increase of PMV in case S2 with respect to case S1 and consequently a reduction in people dissatisfied (PPD) can be observed, from values from 27–46% to values of 12–23%, depending on the hour of the day and the classroom considered. The decrease in the percentage of dissatisfied people, considering the assumption made for the calculation of comfort indexes (reported in Section 6.3) and considering that the air temperature is similar in cases S1 and S2, it depends only on the increase of the mean radiant temperature inside the classrooms due to the insulation of the building (Figure 13).

8. Conclusions

In this work, an energy analysis of a public building in Bialystok is presented. The analysis has been performed prior to and after a thermal modernization of the building envelope, employing two software packages (Trnsys and Audytor OZC 7.0 Pro) and the results obtained have been cross-checked with real consumption data related to the heating system. The effect of thermal modernization has also been analyzed considering the same building but virtually located in Bologna (Italy), to investigate the effect of climate conditions. Moreover, as a novelty, attention has been paid to the effect of the air change rate and to how the choice of this value, prior to and after the buildings retrofit, affects the numerically obtained results. Moreover, a comfort analysis has been performed. The main findings of this work are as follows:
-
Results obtained from the two software are comparable in term of thermal energy demand for heating (the major difference arises for case S1, where Trnsys results are 11% lower than Audytor OZC 7.0 Pro results).
-
The annual heating demand obtained from the analyses shows a slight deviation from the consumption obtained from actual measurements (4% after considering the efficiency of HVAC system); these discrepancies are nevertheless consistent with other results found in the literature, i.e., within 14.2–32% [42].
-
Losses for ventilation are important, especially for the renovated building, both in Bialystok and Bologna; moreover, the losses for ventilation obtained from Trnsys analyses are higher after renovation, if the same air change rate is considered (Table 13).
-
Analyses related to different envelope materials show that the density of the inner layer of external walls has a small impact on the result of annual thermal energy demand for heating and cooling in the four cases analyzed (S1–S4).
-
The thermal comfort inside the kindergarten increases after thermal modernization and this aspect can be attributed principally to the increase of mean radiant temperature inside the thermal zones.
-
The comparison between Poland and Italy highlights the dependence of the climate conditions, showing that for winter conditions, analogous energy savings arise, while for summer climatization, the energy consumption prior and after retrofit behaves differently.
Further developments of this work will deepen the cross-check with experimental data. In detail, we aim to conduct a measurement campaign inside the considered kindergarten, to determine the actual conditions of building usage (such as the temperatures employed as set points in the rooms and the presence of people inside the thermal zones). In fact, retrofit activities, also in public buildings, often happen while experimental measure opportunities are not that frequent. Additionally, further comparisons and optimizations of the models implemented in the two software will be conducted, in accordance with data obtained from the measurement campaign.

Author Contributions

Conceptualization, V.B., E.R.d.S., P.V., D.A.K., B.L., B.S. and M.K.; methodology, V.B., E.R.d.S., P.V., D.A.K., B.L., B.S. and M.K.; software, V.B., P.V., D.A.K. and B.L.; validation, V.B., E.R.d.S., P.V., B.L. and D.A.K.; formal analysis, V.B., E.R.d.S., P.V., D.A.K., B.L., B.S. and M.K.; investigation, V.B., E.R.d.S., P.V., D.A.K. and B.L.; resources, D.A.K., B.S. and E.R.d.S.; data curation, V.B., E.R.d.S., P.V., D.A.K. and B.L.; writing—original draft preparation, V.B., E.R.d.S., D.A.K., B.L. and M.K.; writing—review and editing, V.B., E.R.d.S., P.V., D.A.K. and B.L.; visualization, V.B., E.R.d.S., P.V., D.A.K. and B.L.; supervision, E.R.d.S., P.V. and D.A.K.; project administration, E.R.d.S., P.V. and D.A.K.; funding acquisition, E.R.d.S. and D.A.K. All authors have read and agreed to the published version of the manuscript.

Funding

This research was funded by the commissioned task entitled VIA CARPATIA Universities of Technology Network named after the President of the Republic of Poland Lech Kaczyński contract no. MEiN/2022/DPI/2577 action entitled ISKRA—building inter-university research teams VC/WB-IIL/4/2023 and it was conducted under W/WB-IIL/2/2023 grant. Moreover, the research leading to these results has received funding from Italy: PNRR—Missione 4-Componente 2, Investimento 1.5 Creazione e rafforzamento di Ecosistemi dell’innovazione, costruzione di leader territoriali di R&S D.D. 3277 del 30/12/2021, under the research project ECOSISTER-Ecosystem for Sustainable Transition in Emilia-Romagna, Code ECS00000033, CUP J33C22001240001.

Data Availability Statement

Data will be available upon request.

Conflicts of Interest

The authors declare no conflict of interest.

References

  1. IEA. Buildings; IEA: Paris, France, 2022. [Google Scholar]
  2. United Nations Environment Programme. 2022 Global Status Report for Buildings and Construction: Towards a Zero emission, Efficient and Resilient Buildings and Construction Sector; United Nations Environment Programme: Nairobi, Kenya, 2022. [Google Scholar]
  3. European Commission. National Energy and Climate Plans EU Countries’ 10-Year National Energy and Climate Plans for 2021–2030; European Commission: Brussels, Belgium, 2023. [Google Scholar]
  4. Valdiserri, P.; Ballerini, V.; Rossi di Schio, E. Interpolating functions for CO2 emission factors in dynamic simulations: The special case of a heat pump. Sustain. Energy Technol. Assess. 2022, 53 Pt C, 102725. [Google Scholar] [CrossRef]
  5. Chovancová, J.; Tej, J. Decoupling economic growth from greenhouse gas emissions: The case of the energy sector in V4 countries. Equilibrium. Quarterl. J. Econom. Econom. Pol. 2020, 15, 235–251. [Google Scholar] [CrossRef]
  6. Cheba, K.; Bak, I.; Pietrzak, M. Conditions of the green transformation. The case of the european union. Technol. Econ. Dev. Econ. 2023, 29, 438–467. [Google Scholar] [CrossRef]
  7. Balcerzak, A.P.; Uddin, G.S.; Igliński, B.; Pietrzak, M.B. Global energy transition: From the main determinants to economic challenges. Equilibrium. Q. J. Econ. Econ. Policy 2023, 18, 597–608. [Google Scholar] [CrossRef]
  8. García, J.S.; Gómez, E.G. What drives the preferences for cleaner energy? Parametrizing the elasticities of environmental quality demand for greenhouse gases. Oeconomia Copernic. 2023, 14, 449–482. [Google Scholar] [CrossRef]
  9. Bianco, V.; De Rosa, M.; Scarpa, F.; Tagliafico, L.A. Analysis of Energy Demand in Residential Buildings for Different Climates by Means of Dynamic Simulation. Int. J. Ambient. Energy 2016, 37, 108–120. [Google Scholar] [CrossRef]
  10. Pisello, A.L.; Goretti, M.; Cotana, F. A Method for Assessing Buildings’ Energy Efficiency by Dynamic Simulation and Experimental Activity. Appl. Energy 2012, 97, 419–429. [Google Scholar] [CrossRef]
  11. Giama, E.; Chantzis, G.; Kontos, S.; Keppas, S.; Poupkou, A.; Liora, N.; Melas, D. Building Energy Simulations Based on Weather Forecast Meteorological Model: The Case of an Institutional Building in Greece. Energies 2023, 16, 191. [Google Scholar] [CrossRef]
  12. European Parliament and Council of the European Union. Directive 2010/31/EU on the Energy Performance of Buildings; European Parliament and Council of the European Union: Brussels, Belgium, 2019. [Google Scholar]
  13. Rey-Hernández, J.M.; Rey-Martínez, F.J.; Yousif, C.; Krawczyk, D. Assessing the performance of a renewable District Heating System to achieve nearly zero-energy status in renovated university campuses: A case study for Spain. Energy Convers. Manag. 2023, 292, 117439. [Google Scholar] [CrossRef]
  14. Ballerini, V.; Rossi di Schio, E.; Valdiserri, P.; Naldi, C.; Dongellini, M. A Long-Term Dynamic Analysis of Heat Pumps Coupled to Ground Heated by Solar Collectors. Appl. Sci. 2023, 13, 7651. [Google Scholar] [CrossRef]
  15. Causone, F.; Carlucci, S.; Moazami, A.; Cattarin, G.; Pagliano, L. Retrofit of a kindergarten targeting zero energy balance. Energy Procedia 2015, 78, 991–996. [Google Scholar] [CrossRef]
  16. Gajić, D.; Stupar, D.; Antunović, B.; Janković, A. Determination of the energy performance indicator of kindergartens through design, measured and recommended parameters. Energy Build. 2019, 204, 109511. [Google Scholar] [CrossRef]
  17. Krawczyk, D.A.; Rodero, A.; Witkowska, A.; Wądołowska, B. The Advisability of Employment of Renewable Energy Sources in DHW Systems in the Kindergarten. Proceedings 2019, 16, 41. [Google Scholar] [CrossRef]
  18. SANKOM Sp. z o. o. Audytor OZC 7.0 Pro—Building 3D Modelling and Heat Load Calculations; Sankom Sp. z o. o.: Warsaw, Poland, 2023. [Google Scholar]
  19. Klein, S.A.; Beckman, W.A.; Mitchell, J.W.; Duffie, J.A.; Duffie, N.A.; Freeman, T.L.; Mitchell, J.C.; Braun, J.E.; Evans, B.L. TRNSYS Version 18: A Transient System Simulation Program; Scientific Research: Atlanta, GA, USA, 2018. [Google Scholar]
  20. Thornton, J.W.; Bradley, D.E.; McDowell, T.P.; Blair, N.J.; Duffy, M.J.; LaHam, N.D.; Naik, A.V. TessLibs 17—Applications Library Mathematical Reference; Thermal Energy Systems Specialists (TESS): Madison, WI, USA, 2013. [Google Scholar]
  21. Klein, S.A.; Duffie, A.J.; Mitchell, J.C.; Kummer, J.P.; Thornton, J.W.; Bradley, D.E.; Arias, D.A.; Beckman, W.A. TRNSYS 17—A TRaNsient SYstem Simulation Program, User Manual. Multizone Building Modeling with Type 56 and TRNBuild, Version 17.1; Massachusetts Institute of Technology: Cambridge, MA, USA, 2010. [Google Scholar]
  22. Holst, S. TRNSYS-Models for Radiator Heating Systems. 2023. Available online: https://trnsys.de/static/641c965bac4f593c3b4cc569839a51c2/Type_361_362_320_en.pdf (accessed on 4 September 2023).
  23. Trimble Inc. Google SketchUp Make 2015. 2023. Available online: https://www.sketchup.com (accessed on 4 September 2023).
  24. Hiller, M.; Kendel, C. TRNSYS3D—Plugin for SketchUp. 2023. Available online: https://trnsys.de/static/deb3060a15c25a7ad170db124507ef37/T3d_Manual.pdf (accessed on 4 September 2023).
  25. PN-EN ISO 6946:2017; Building Components and Building Elements: Thermal Resistance and Thermal Transmittance—Calculation Methods. ISO: Geneva, Switzerland, 2017.
  26. PN-EN 12831:2006; Heating Systems in Buildings—Method for Calculation of the Design Heat Load. ISO: Geneva, Switzerland, 2006.
  27. PN-EN ISO 13790:2008; Energy Performance of Buildings—Calculation of Energy Use for Space Heating and Cooling. ISO: Geneva, Switzerland, 2008.
  28. OpenStreetMap. Available online: https://www.openstreetmap.org/ (accessed on 8 November 2023).
  29. Municipality of Białystok. Improvement of Energy Efficiency of PS No. 7, PS No. 52, PS No. 73, PS No. 42 and PS No. 71. 2023. Available online: https://www.Białystok.pl/pl/dla_mieszkancow/fundusze_unijne/realizowane/okresprogramowania20142020/poprawa-efektywnosci-energetycznej-ps-nr-7-ps-nr-52-ps-nr-73-ps-nr-42-i-ps-nr-71.html?vid=27822 (accessed on 4 September 2023).
  30. Huld, T.; Müller, R.; Gambardella, A. A New Solar Radiation Database for Estimating PV Performance in Europe and Africa. Solar Energy 2012, 86, 1803–1815. [Google Scholar] [CrossRef]
  31. JRC. Photovoltaic Geographical Information System (PVGIS)—European Commission. 2023. Available online: https://re.jrc.ec.europa.eu/pvg_tools/en/ (accessed on 4 September 2023).
  32. Kottek, M.; Grieser, J.; Beck, C.; Rudolf, B.; Rubel, F. World Map of the Köppen-Geiger Climate Classification Updated. Meteorologische Zeitschrift 2006, 15, 259–263. [Google Scholar] [CrossRef] [PubMed]
  33. Kusuda, T.; Achenbach, P.R. Earth Temperature and Thermal Diffusivity at Selected Stations in the United States. ASHRAE Trans. 1965, 1714, 61–75. [Google Scholar]
  34. Biernacka, B. Półempiryczne Równanie Opisujące Naturalne Pole Temperatury Gruntu W Rejonie Białegostoku. Bud. I Inżynieria Sr. 2010, 1, 5–9. [Google Scholar]
  35. Natale, C.; Naldi, C.; Dongellini, M.; Morini, G.L. Dynamic Modelling of a Dual-Source Heat Pump System through a Simulink Tool. J. Phys. Conf. Ser. 2022, 2385, 012090. [Google Scholar] [CrossRef]
  36. UNI/TS 11300-Part1:2014; Energy Performance of Buildings—Part 1: Evaluation of Energy Need for Space Heating and Cooling. National Institution of Standardization: Rome, Italy, 2014.
  37. Dott, R.; Haller, M.; Ruschenburg, J.; Ochs, F.; Bony, J. IEA-SHC Task 44 Subtask C Technical Report: The Reference Framework for System Simulations of the IEA SHC Task 44/HPP Annex 38: Part B: Buildings and Space Heat Load; IEA-SHC: Gleisdorf, Austria, 2013. [Google Scholar]
  38. Decree 967/2015; Definition of Minimum Energy Performance Requirements for Buildings. Official Journal of Emilia-Romagna Region: Bologna, Italy, 2015.
  39. Regulation of the Polish Minister of Infrastructure. On Technical Conditions, Which Should Correspond to the Buildings and Their Location; Polish Minister of Infrastructure: Warsaw, Poland, 2002.
  40. Regulation of the Polish Minister of Infrastructure and Development. On the Methodology for Determining the Energy Performance of a Building or Part of a Building and Energy Performance Certificates; Polish Minister of Infrastructure: Warsaw, Poland, 2015.
  41. Roczniki. Available online: https://dane.imgw.pl/data/dane_pomiarowo_obserwacyjne/Roczniki (accessed on 20 October 2023).
  42. Krawczyk, D.A. Theoretical and real effect of the school’s thermal modernization—A case study. Energy Build. 2014, 81, 30–37. [Google Scholar] [CrossRef]
  43. Jezierski, W.; Sadowska, B. Optimization of the Selected Parameters of Single-Family House Components with the Estimation of Their Contribution to Energy Saving. Energies 2022, 15, 8810. [Google Scholar] [CrossRef]
  44. Fanger, O. Thermal Comfort; Danish Technical Press: Copenhagen, Denmark, 1970. [Google Scholar]
  45. ISO 7730:2005; Ergonomics of the Thermal Environment. ISO: Geneva, Switzerland, 2005.
Figure 2. Layout of the building: ground floor (a) and first floor (b).
Energies 16 07748 g002
Figure 3. 3D view of the modeled building using Google SketchUp (v.15) software.
Energies 16 07748 g003
Figure 4. Hourly (a) and monthly mean (b) dry bulb temperature and monthly irradiance on the horizontal (c) obtained from PVGIS database [31].
Energies 16 07748 g004
Figure 5. Average monthly dry bulb temperature.
Energies 16 07748 g005
Figure 6. Layout of the heating system (a) and focus on the weather data processor (b) as built in Trnsys.
Energies 16 07748 g006
Figure 7. Monthly thermal energy demand comparison, cases S1–S2 (a) and S3–S4 (b) employing Trnsys.
Energies 16 07748 g007
Figure 8. Total design heat load, cases S1–S4.
Energies 16 07748 g008
Figure 9. Monthly thermal energy demand comparison, cases S1–S2 (a) and S3–S4 (b) employing Audytor OZC 7.0 Pro.
Energies 16 07748 g009
Figure 10. Total loss of thermal energy and ventilation for all analyzed cases (S1–S4) employing Audytor OZC 7.0 Pro.
Energies 16 07748 g010
Figure 11. PMV (in (a,b)), and PPD (in (c,d)) for cases S1 (left) and S2 (right) respectively, for five classrooms (CL 1–5).
Energies 16 07748 g011
Figure 12. Monthly energy losses for ventilation and monthly mean temperature inside the classrooms (cases S1 and S2).
Energies 16 07748 g012
Figure 13. Mean radiant temperature (tmr) in classrooms during the coldest day of the year, in cases (a) S1 and (b) S2.
Energies 16 07748 g013
Table 1. Floor area of the zones.
ZoneFloor Area (m2)
Classrooms322
Offices73
Kitchen30
Dressing room49
Corridors, lift, stairwells, hall78
Toilets70
Table 2. Transmittance U of the enclosures, prior to and after the thermal modernization.
ZoneU (W/(m2K)) PriorU (W/(m2K)) after
Vertical walls1.1780.196
Vertical walls on the cellar1.4530.186
Ground floor2.6042.604
Inter-floor (ground floor–cellar)1.5871.587
Inter-floor (ground–first floor)2.0412.041
Roof3.1650.166
Internal walls2.1102.110
External doors2.5001.300
Windows1.7000.900
Table 3. HDD and CDD calculated according to Equations (1) and (2).
BiałystokBologna
HDD37632440
CDD5284
Table 4. Parameters used in type 77 for Bologna e Białystok. The day shift represents the day of the year in which there is the lower air temperature.
BiałystokBologna
Mean annual temperature (°C)9.313.9
Temperature amplitude on soil surface (°C)12.110.3
Day shift (day)301
Soil conductivity (W/(mK))1.61.8
Soil density (kg/m3)20002800
Soil specific heat (kJ/(kgK))10.85
Table 5. Internal gains of the building considered, subdivided into latent, convective (Conv.) and radiative (Rad.).
ZoneLights and EquipmentPeoplePeriod
Conv.
(W/m2)
Rad.
(W/m2)
Latent (kg/h)Nr.
Classrooms2.52.5-20Mon–Sat, 6:30–17:00
Offices2.52.5-1Mon–Sat, 6:00–18:00
Kitchen101011Mon–Sat, 6:00–18:00
Corridors, hall, dressing room2.52.5-0Mon–Sat, 6:00–18:00
Table 6. Parameters assumed for radiators.
ParameterValue
Radiator exponent, n (-)1.339
Water mass flow rate per kW of emitted power (kg/h kW) 30
Thermal capacitance per kW of emitted power (kJ/(K kW))41.8
Table 7. Dynamic simulations performed; BR means “before renovation”, AR “after renovation” and RB “reference building in Bologna”.
CaseLocationBuilding
S1BiałystokBR
S2BiałystokAR
S3BolognaBR
S4BolognaAR
S5BolognaRB
Table 8. Transmittance value of the reference building (the values have been applied only to the structures that separate the heated zones from the exterior of the building).
Envelope ComponentU (W/(m2K))
Vertical wall0.28
Ground wall0.29
Roof0.24
Windows1.40
Table 9. Results of dynamic simulation performed for the five cases analyzed. ET is the annual thermal energy demand for heating, EC, the annual energy demand for cooling, and EPH and EPC, the energy demand related to the reference floor area, for heating and cooling, respectively.
CaseLocationBuildingET (kWh/y)EPH (kWh/m2y)EC (kWh/y)EPc (kWh/m2y)
S1BialystokBR211,269343.514343.0
S2BialystokAR68,108110.722704.7
S3BolognaBR122,593199.318,75139.1
S4BolognaAR33,47154.413,60028.3
S5BolognaRB29,96048.725,60653.3
Table 10. Results of calculations performed employing Audytor OZC 7.0 Pro.
CaseLocationBuildingET (kWh/y)EPH (kWh/m2y)EC (kWh/y)EPc (kWh/m2y)
S1BialystokBR237,736400.051048.6
S2BialystokAR70,810119.1816713.7
S3BolognaBR124,817210.010,35717.4
S4BolognaAR35,67860.015,18125.5
Table 11. Real energy consumption for 2022 and average monthly temperature in Bialystok [41].
Energy Consumption 2022
(kWh)
Average Monthly Temperature in 2022 Average Monthly Temperature
in a Typical Year
Jan14,243−0.3−4.9
Feb10,9142.0−2.0
Mar11,4161.71.7
Apr82485.67.3
May302411.813.2
Jun166418.315.9
Jul39418.017.3
Aug22720.114.5
Sep255010.412.1
Oct57769.87.1
Nov76092.41.6
Dec9967−1.2−1.3
Total76,031--
Average-8.36.9
Table 12. Results of experimental analysis performed in Audytor OZC software for the four cases analyzed.
CaseLocationBuildingET (kWh/y)EC (kWh/y)
S1BialystokBR246,9365055
S2BialystokAR71,9278105
S3BolognaBR129,75710,290
S4BolognaAR36,27915,103
Table 13. Ventilation losses for ventilation obtained from Trnsys and Audytor OZC 7.0 Pro.
CaseAudytor OZC 7.0 Pro (kWh)Trnsys (kWh)
S148,02031,596
S248,02033,460
S325,73122,533
S425,73124,338
Disclaimer/Publisher’s Note: The statements, opinions and data contained in all publications are solely those of the individual author(s) and contributor(s) and not of MDPI and/or the editor(s). MDPI and/or the editor(s) disclaim responsibility for any injury to people or property resulting from any ideas, methods, instructions or products referred to in the content.